
matRadiomics: A Novel and Complete Radiomics Framework, from Image Visualization to Predictive Model

 ,
,  ,
,  ,
,  ,
, 

Abstract
:1. Introduction
2. Platform
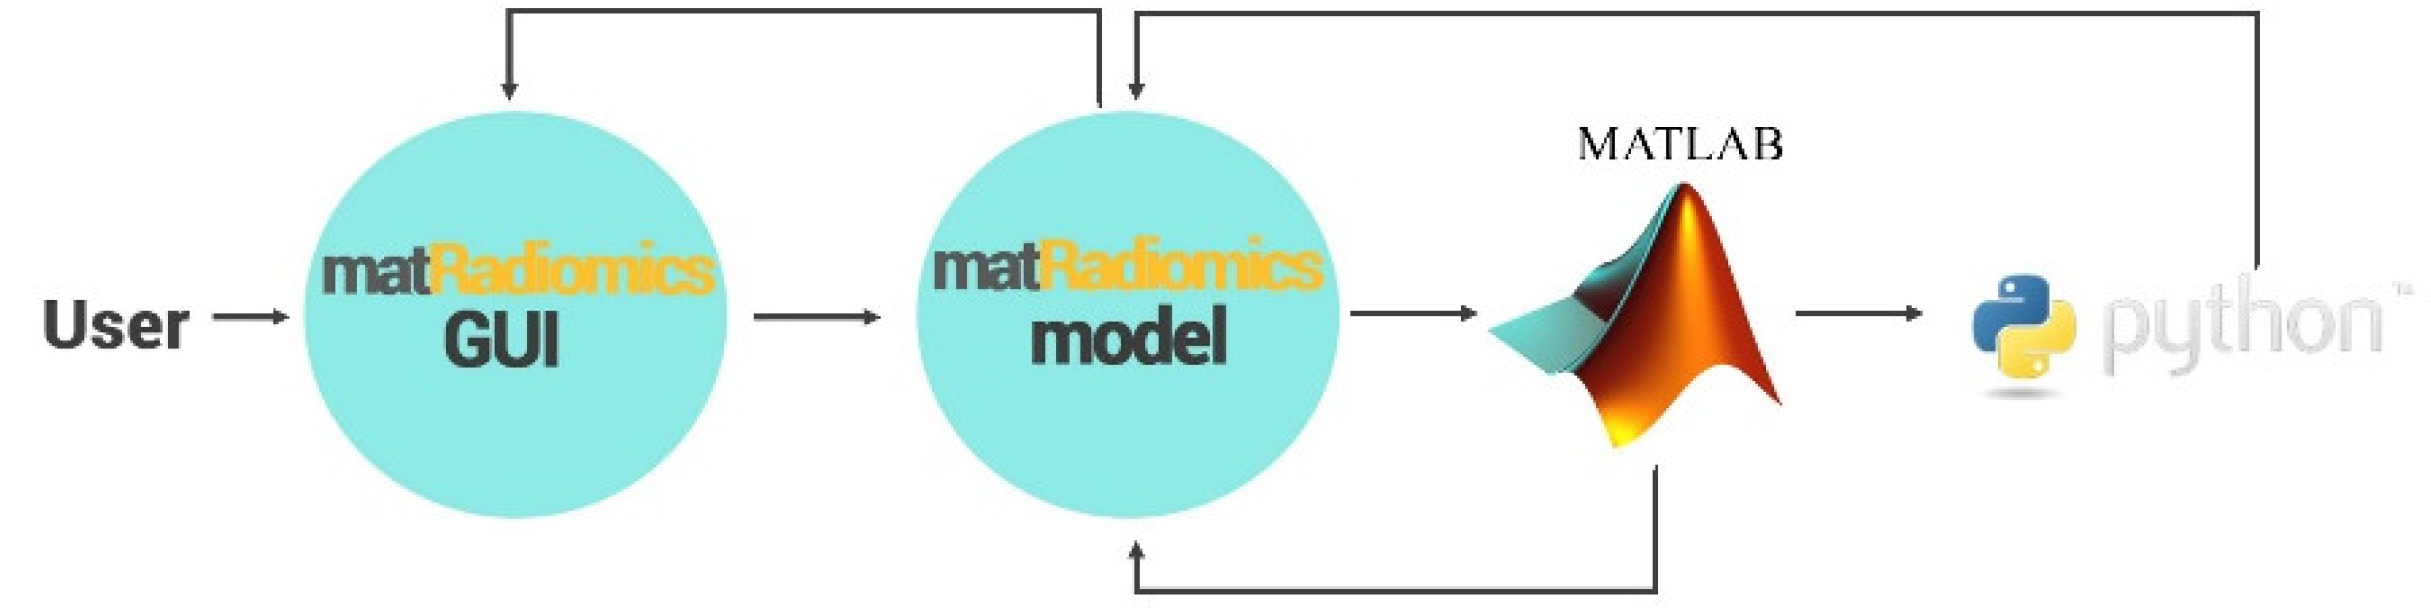
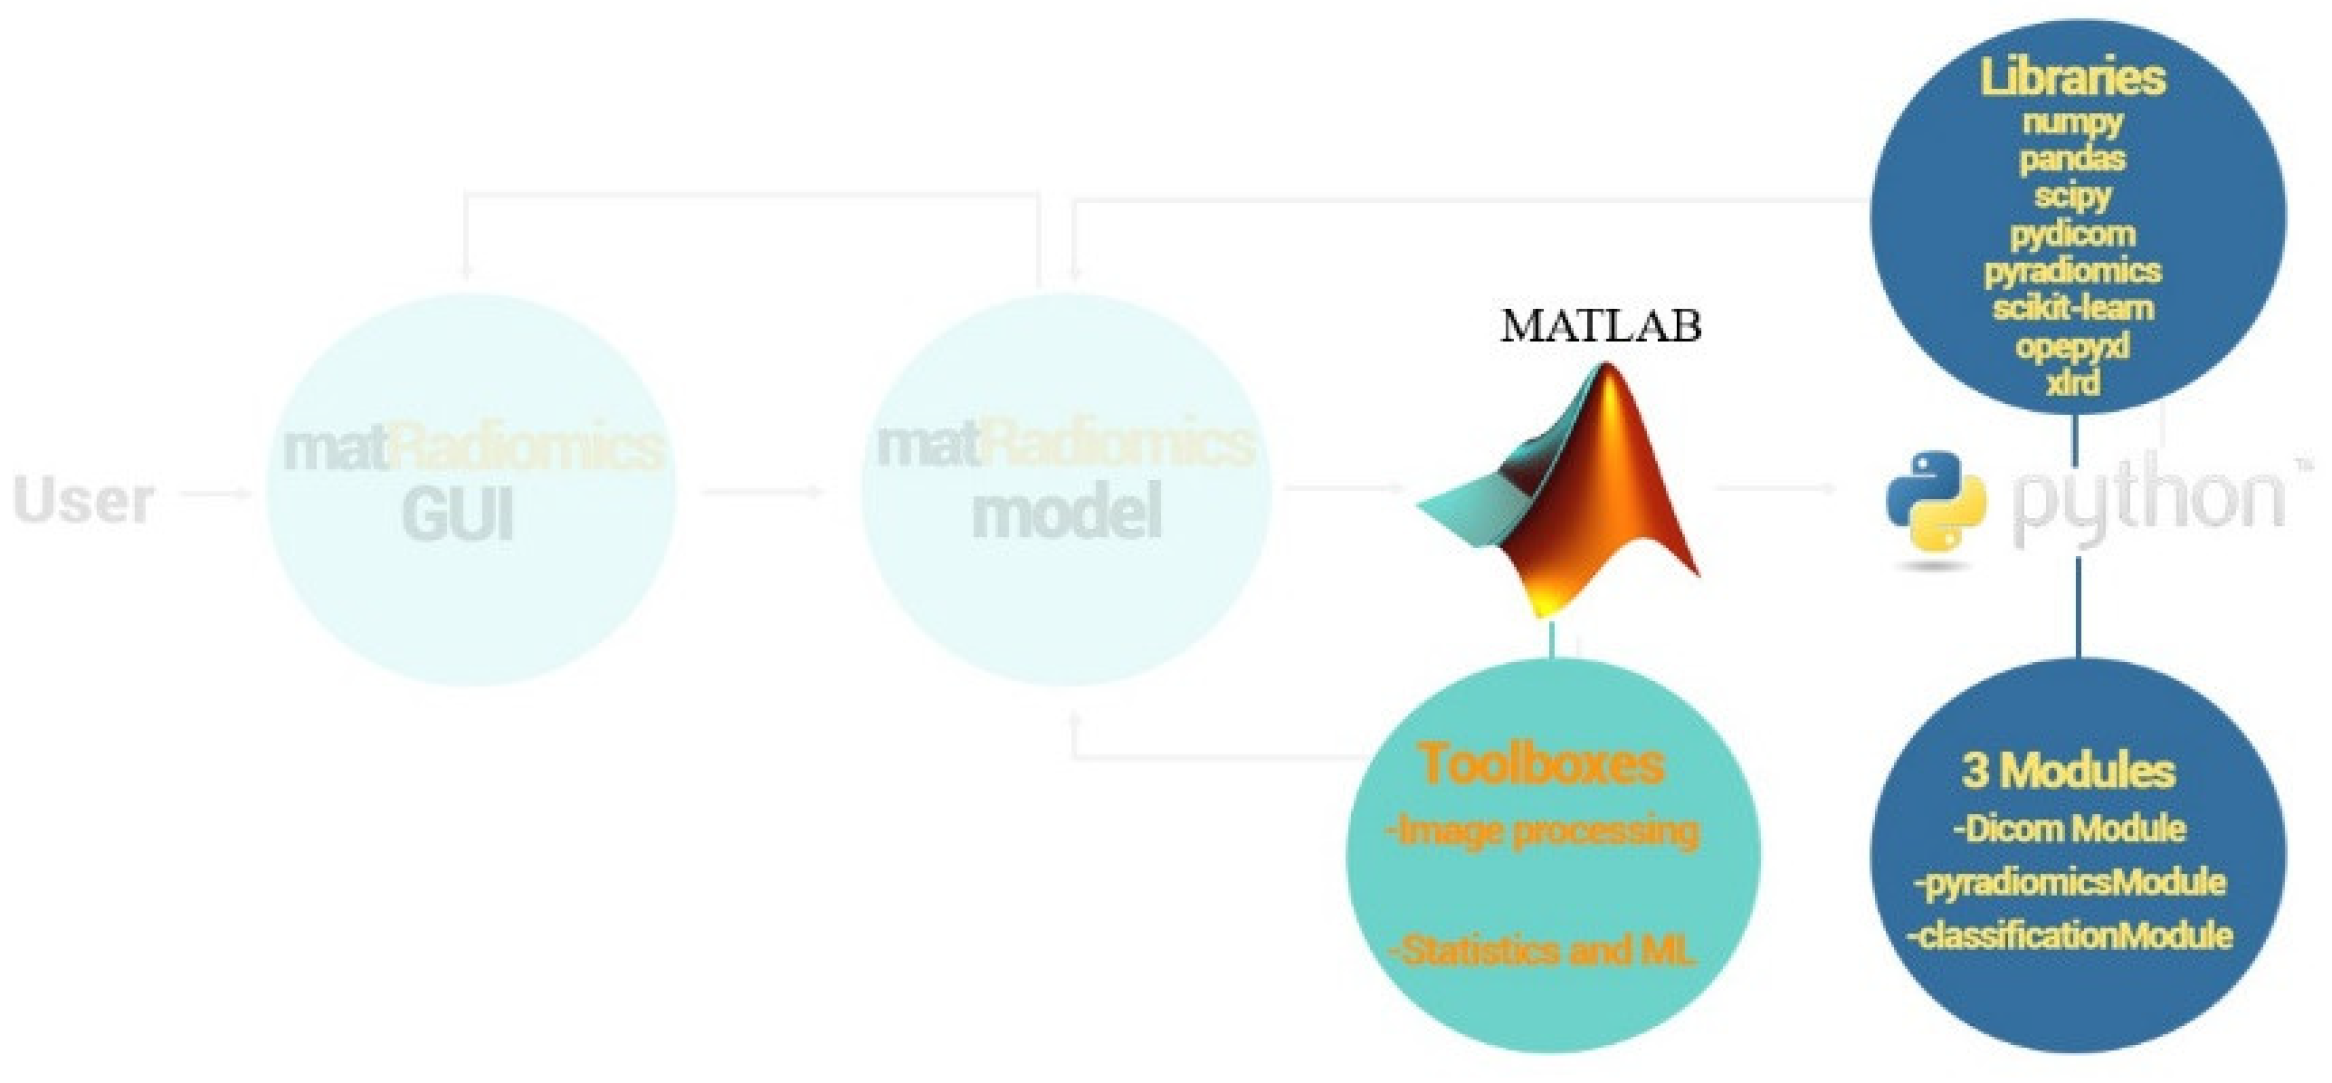
2.1. Architecture
2.2. Image Visualizazion
2.3. Segmentation of the Target
2.4. Radiomics Feature Extraction, Hamonization and Selection
2.5. Machine Learning
2.6. Import an External Radiomics Study
3. Case Study
3.1. The Dataset
3.2. Feature Extraction
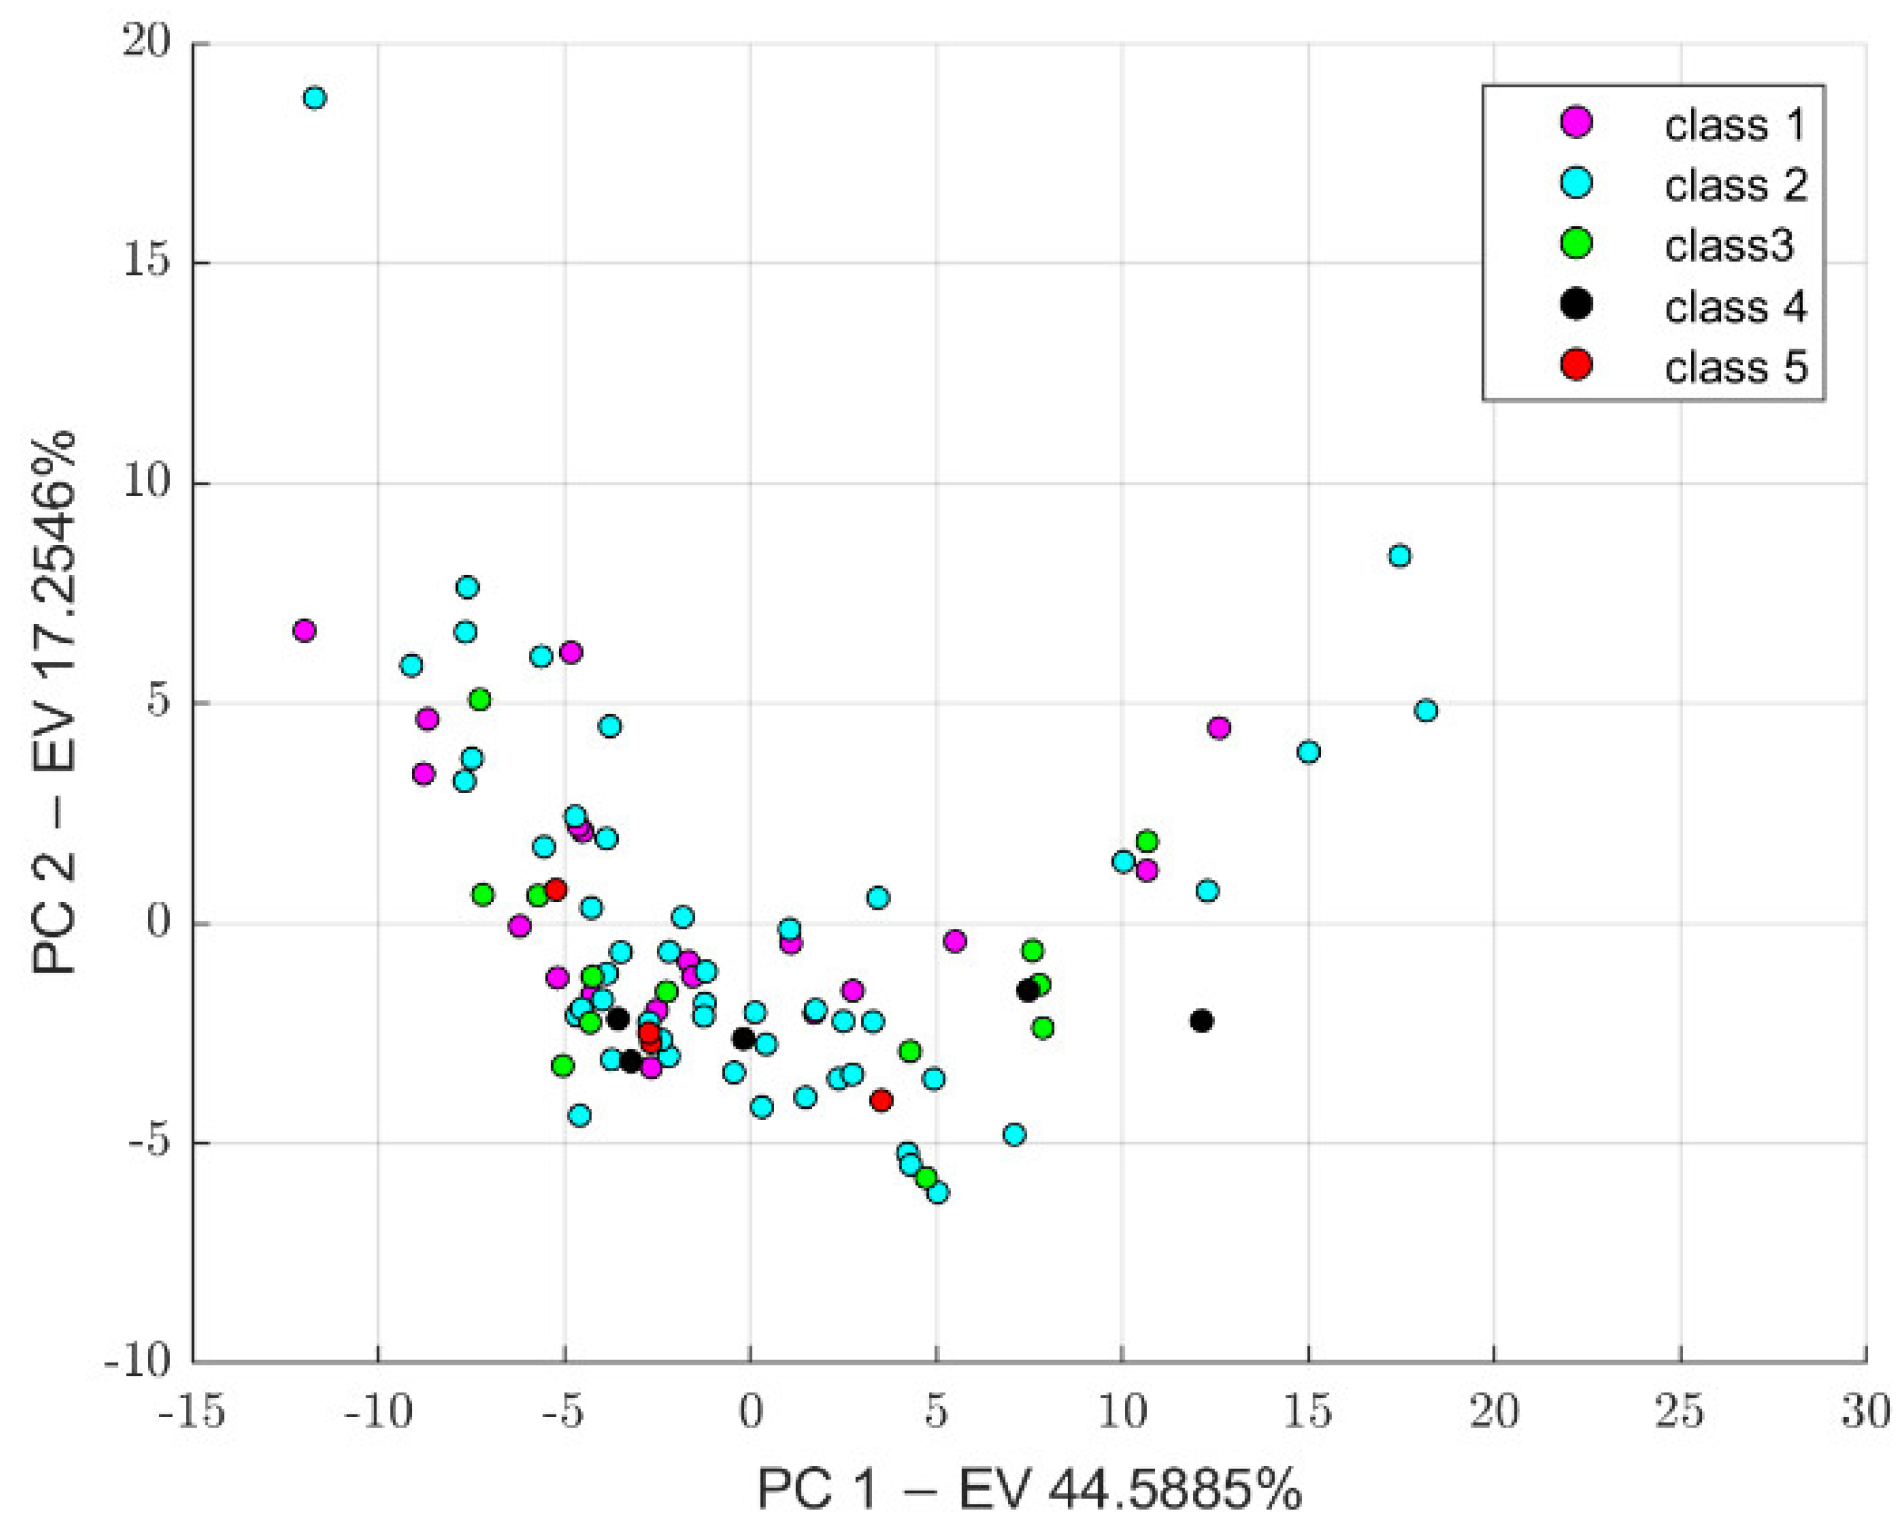
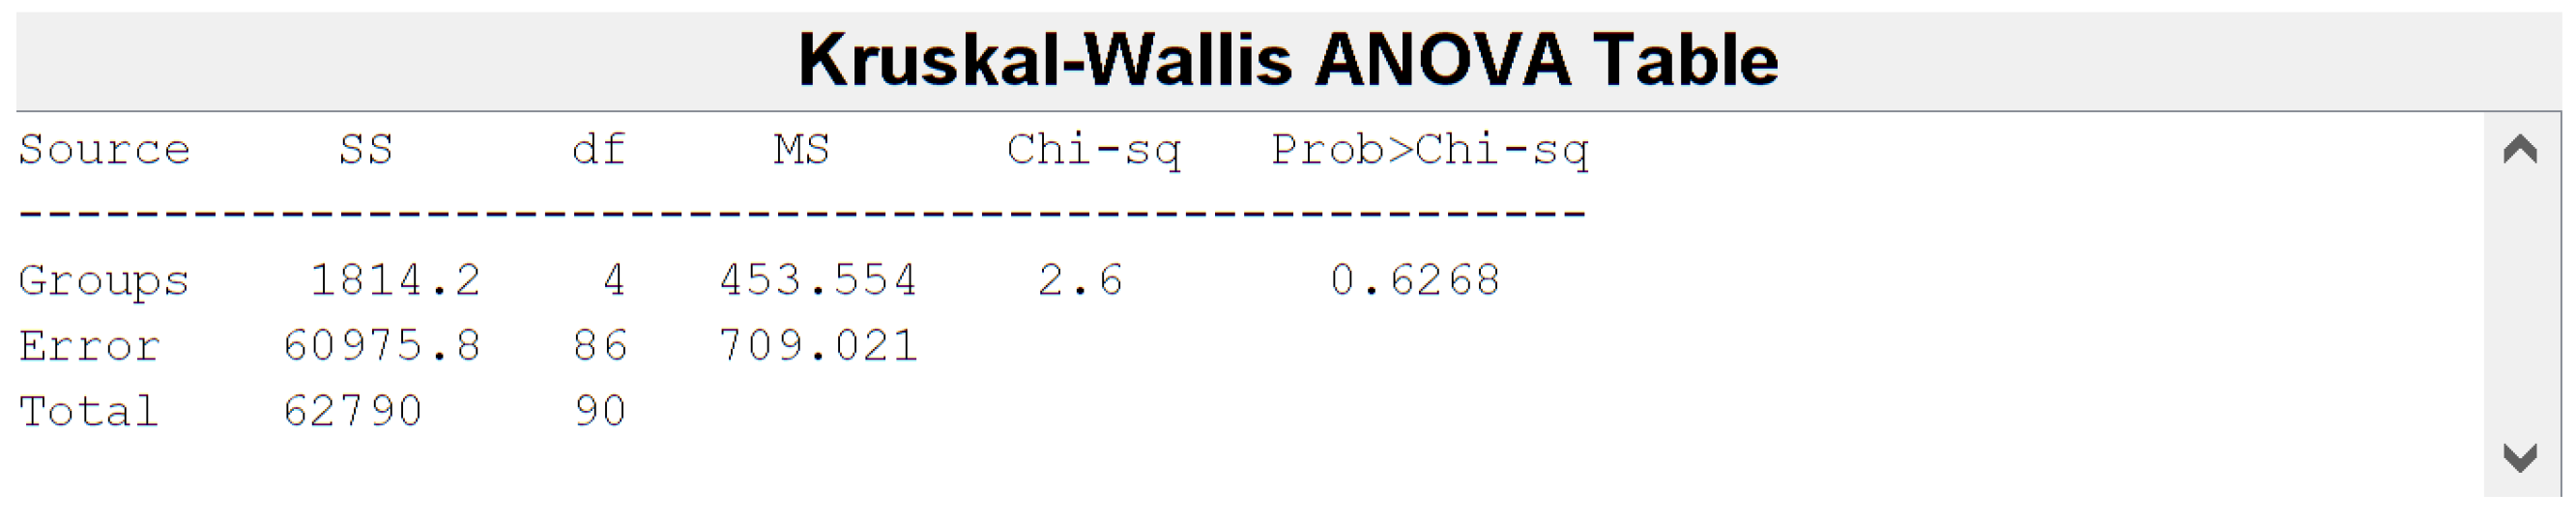
3.3. Feature Harmonization
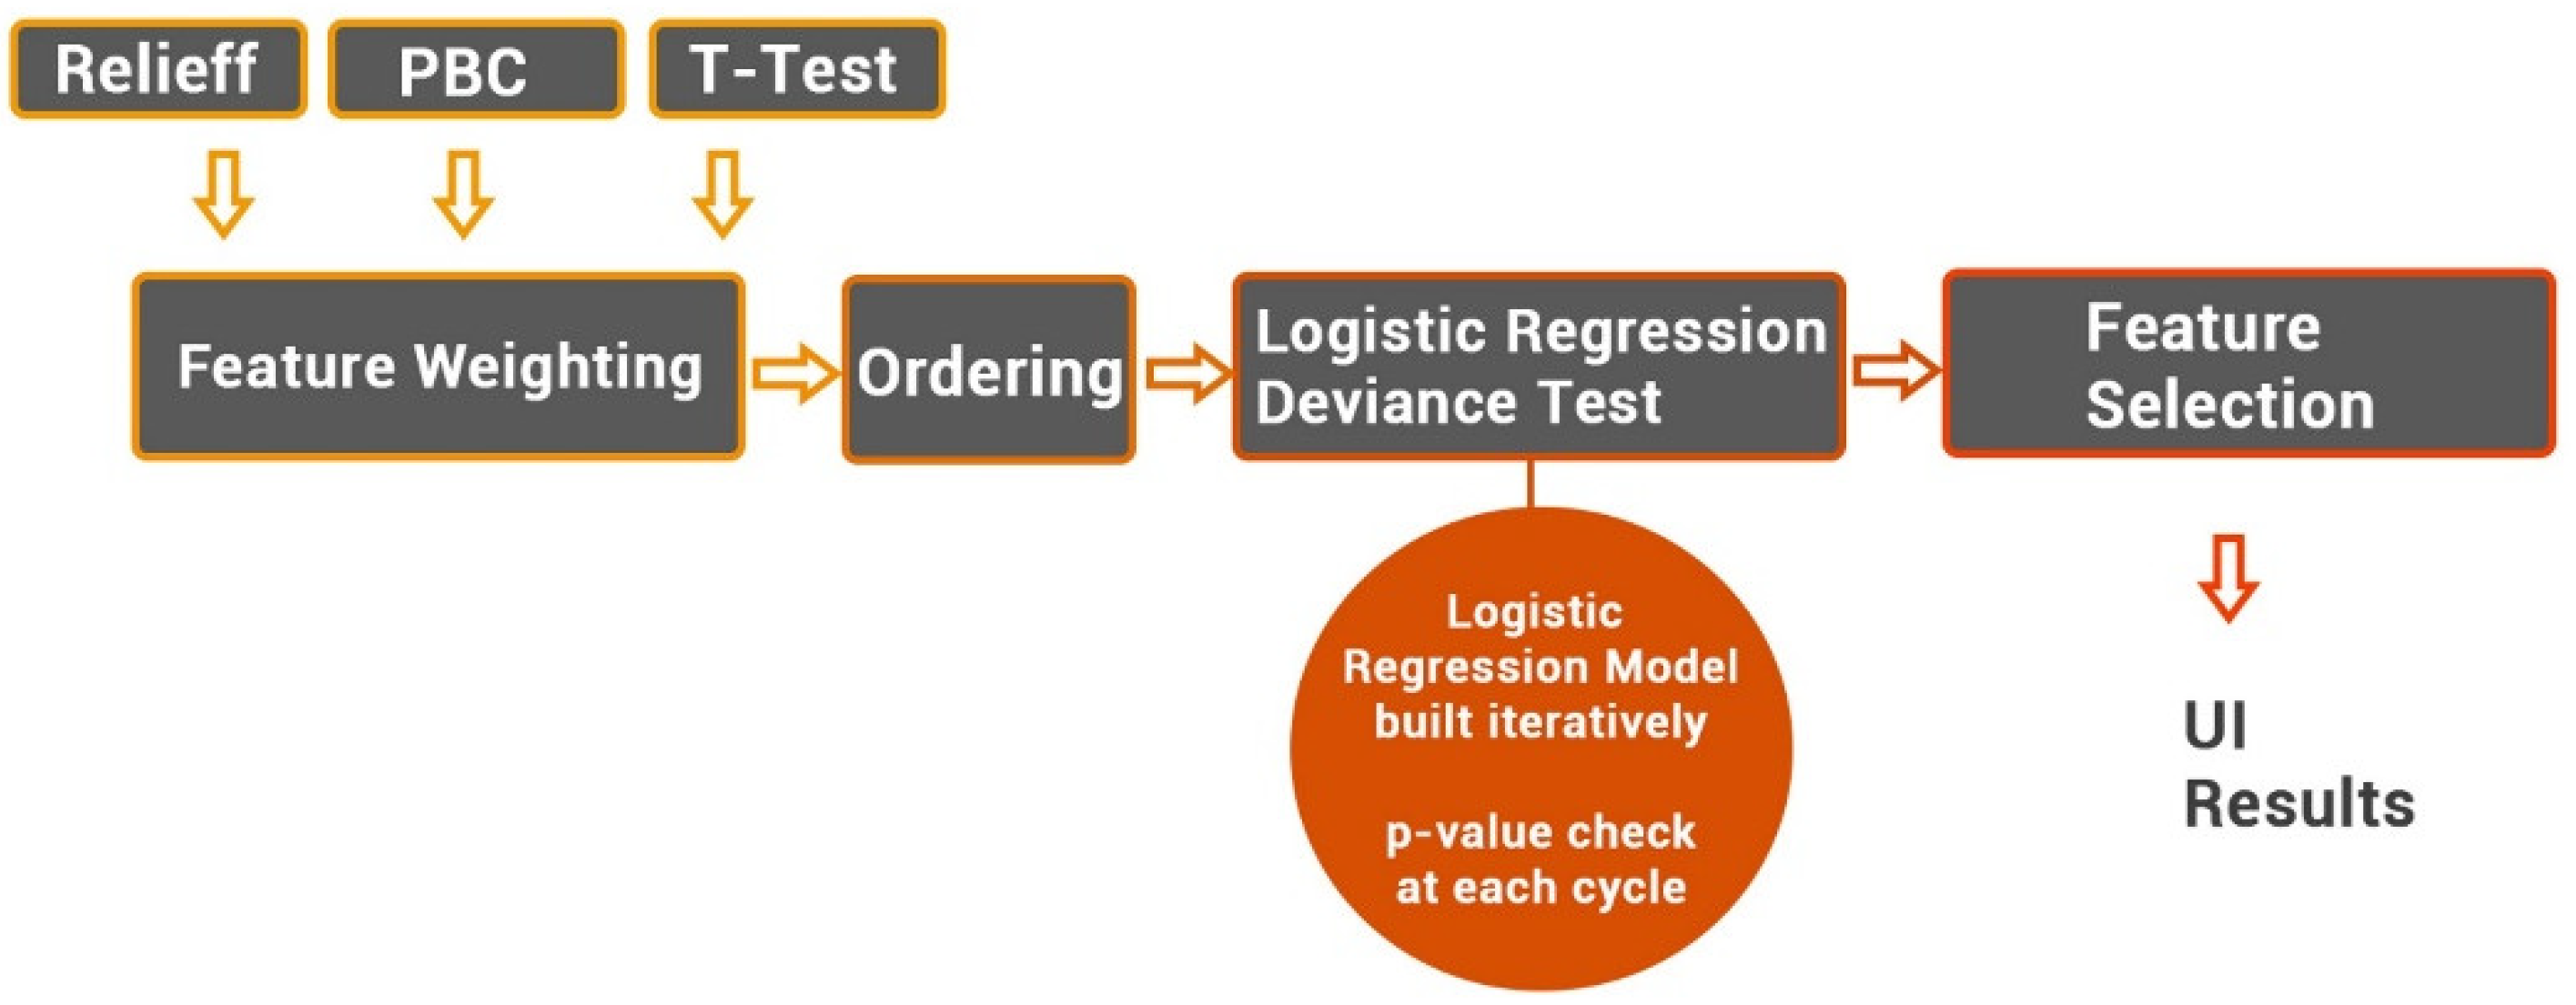
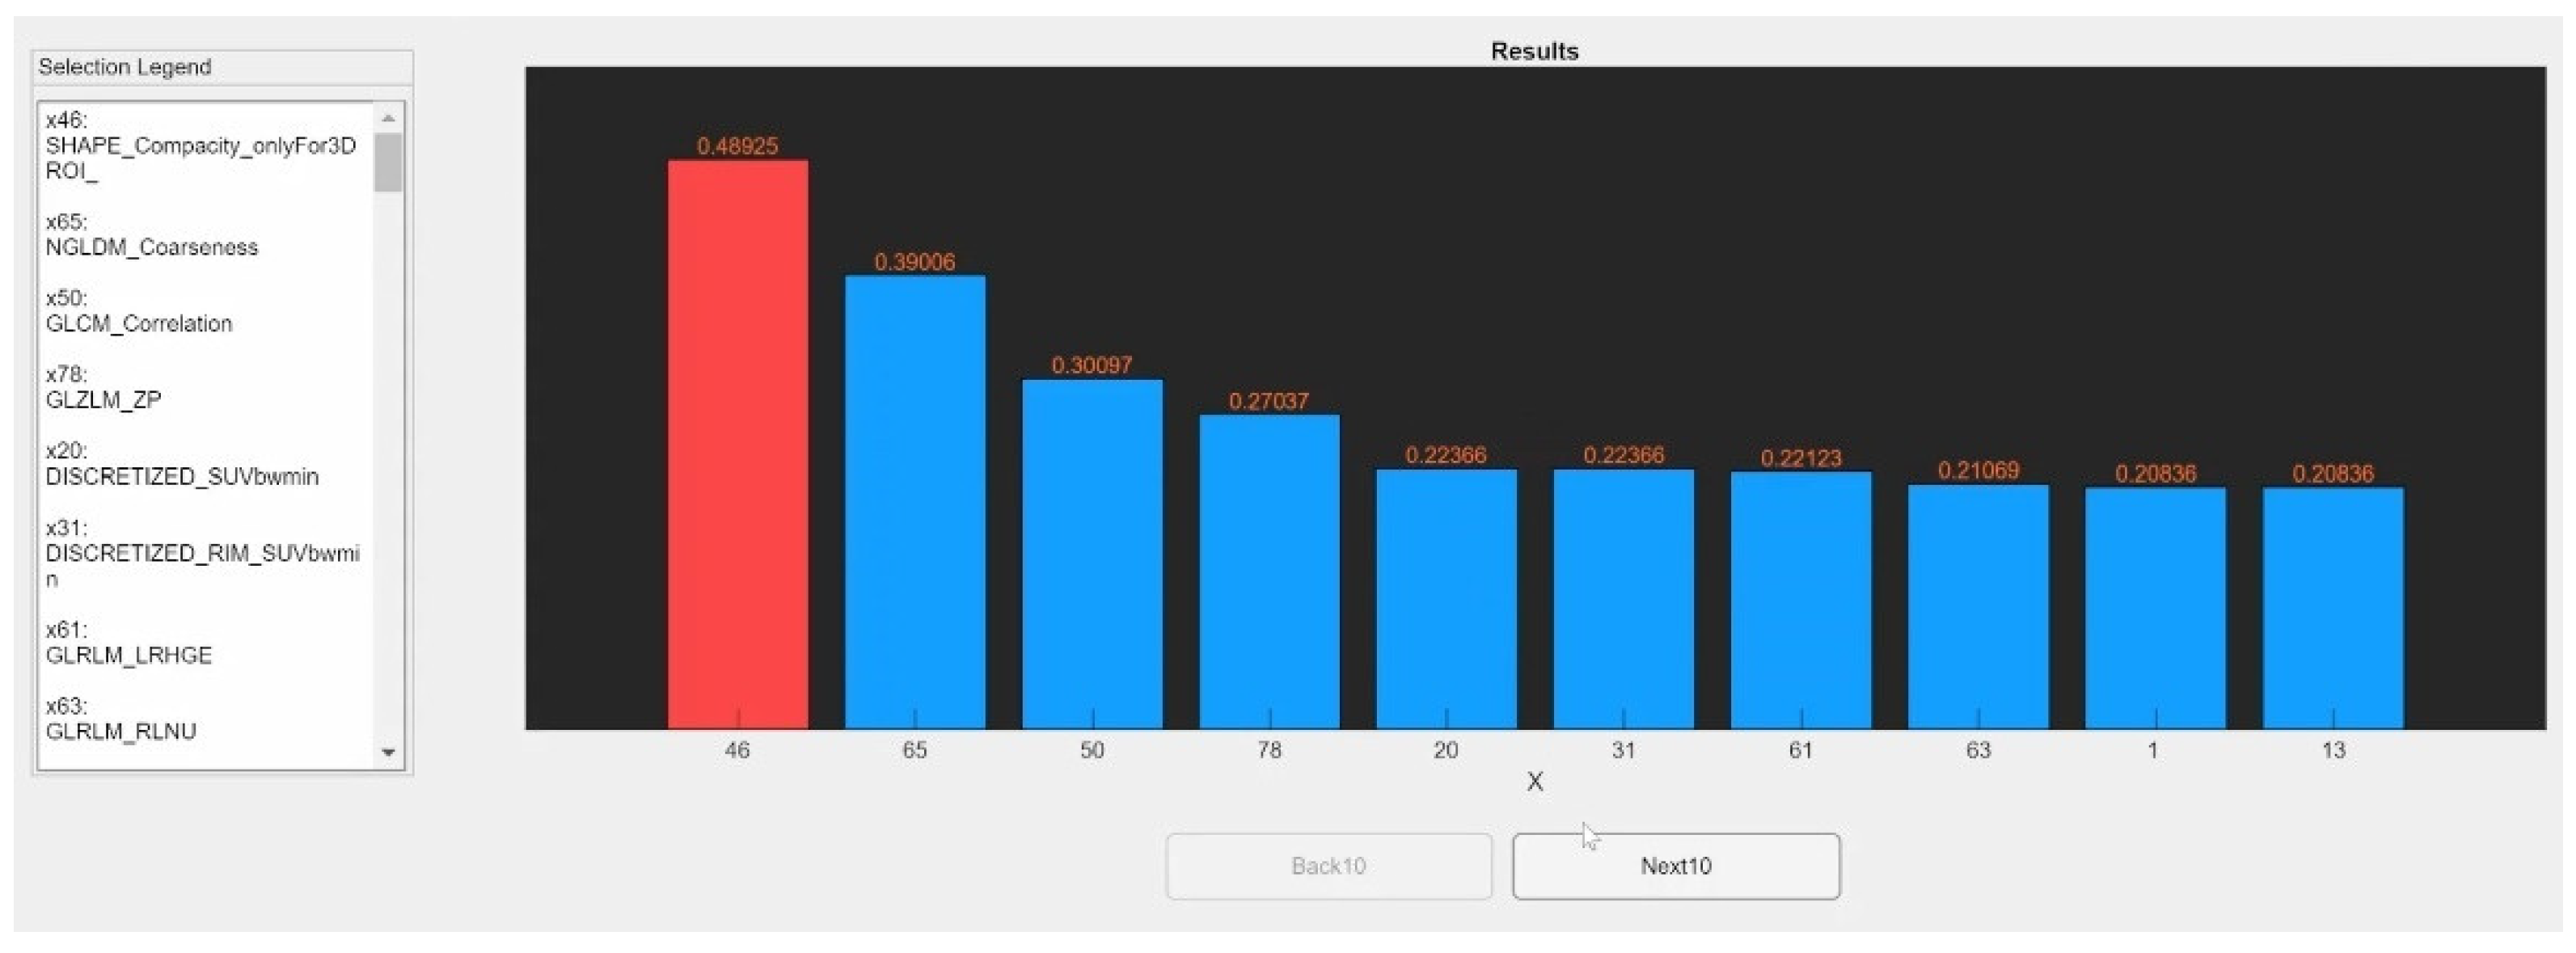
3.4. Feature Selection
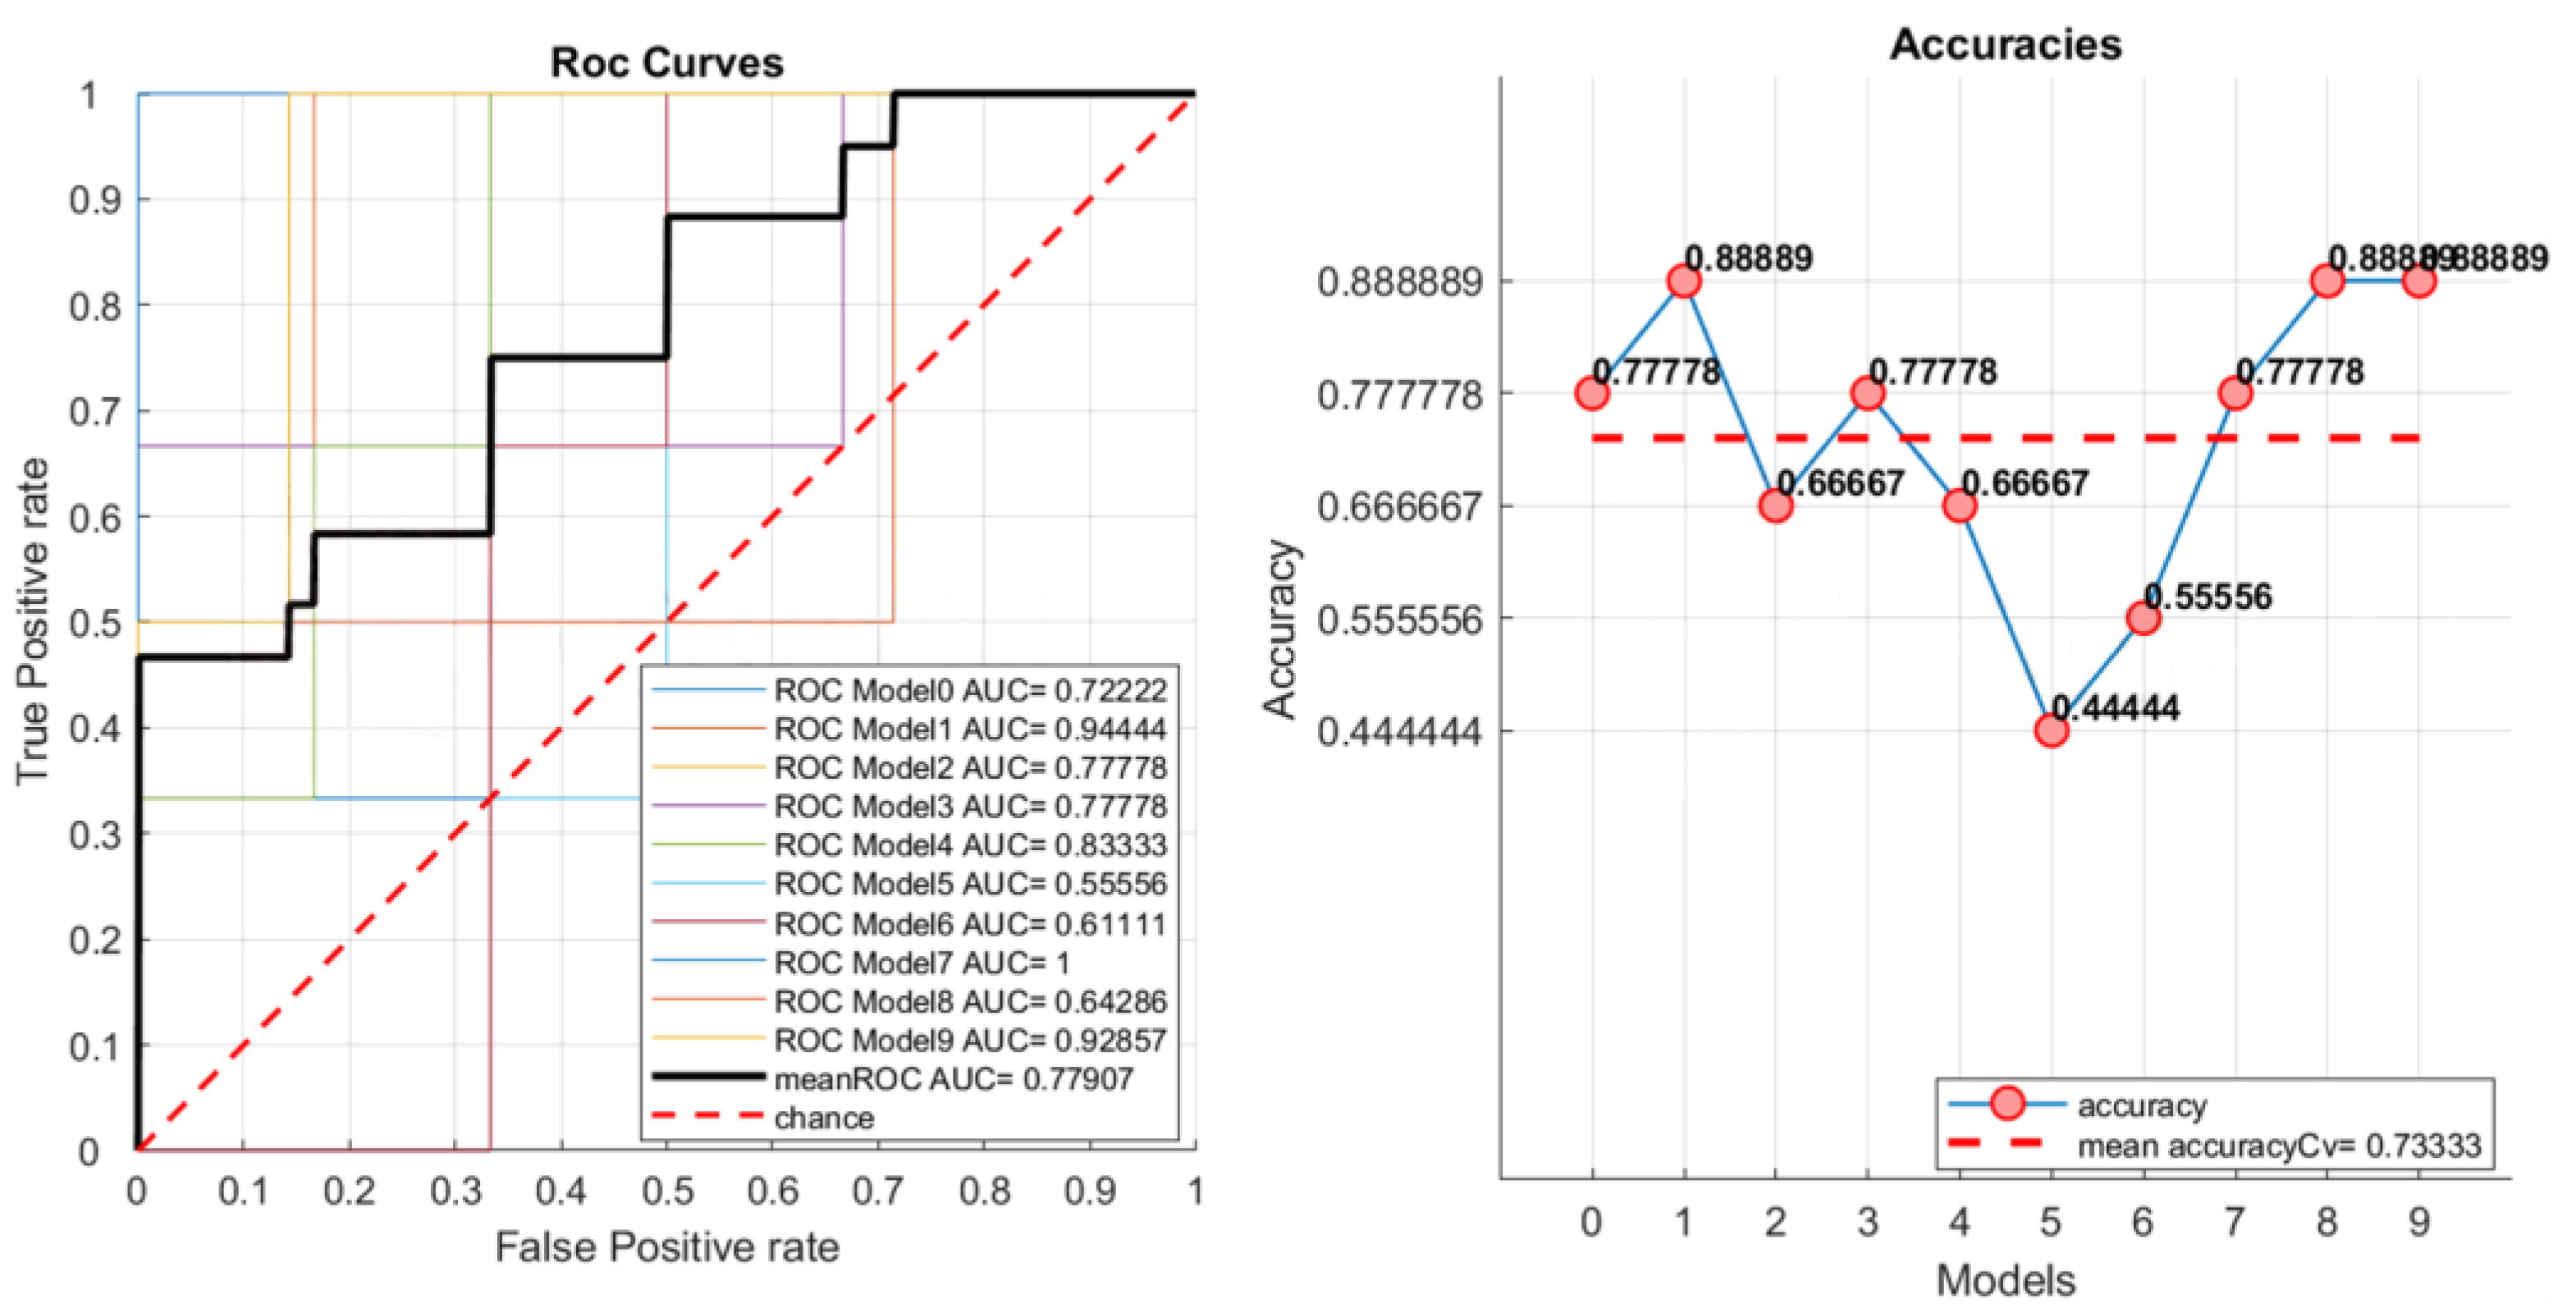
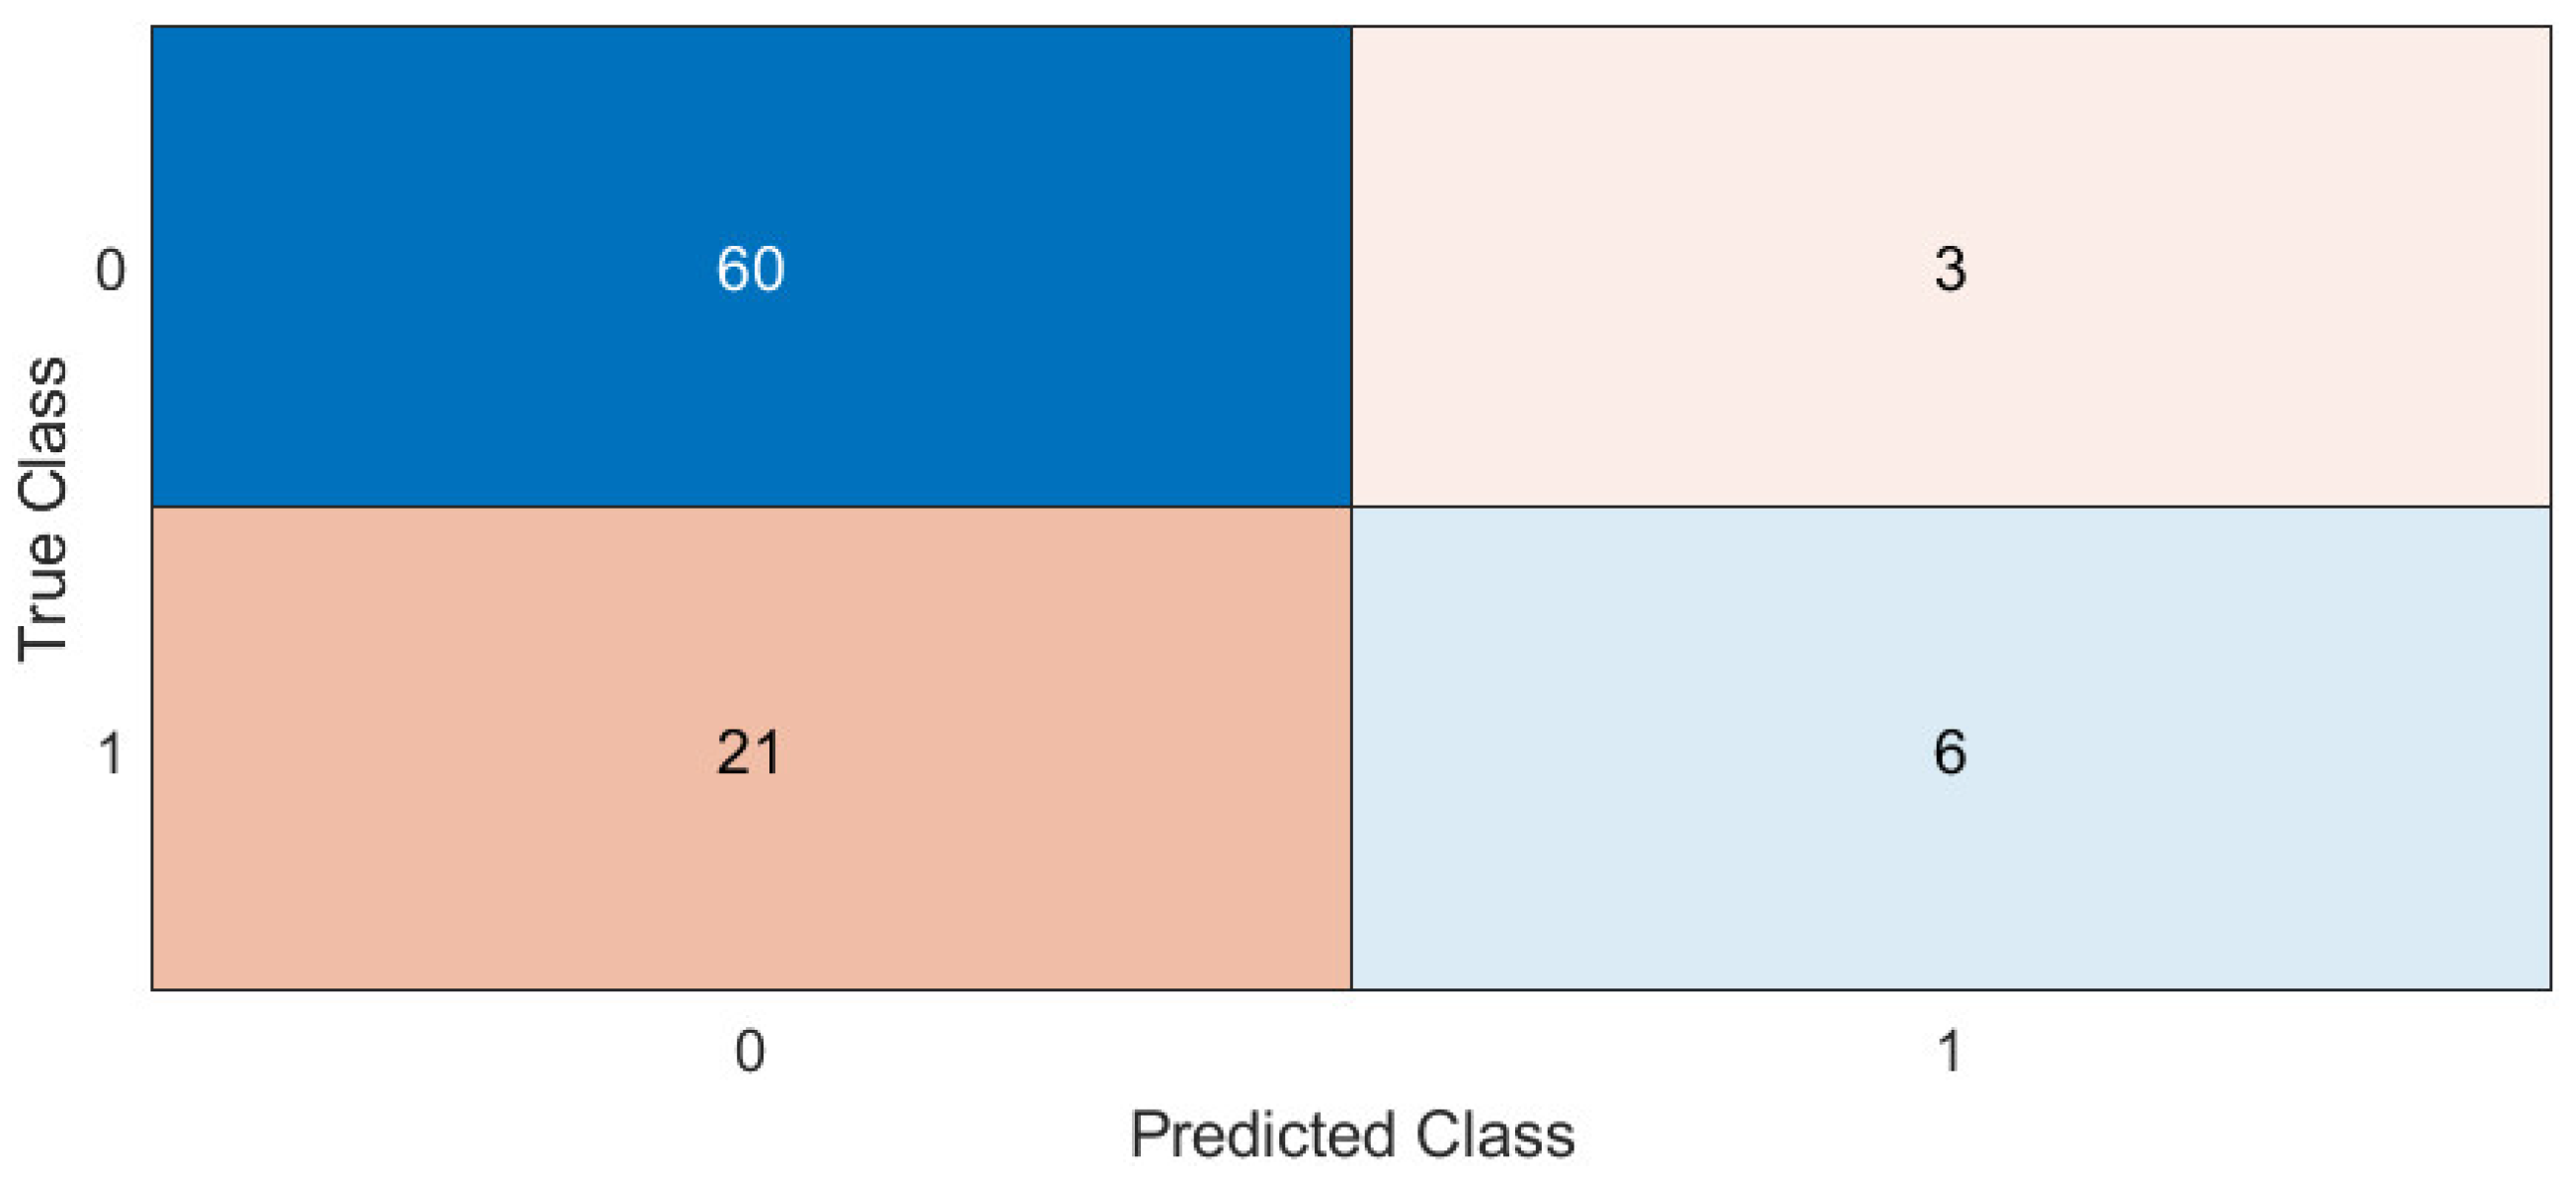
3.5. Machine Learning
4. Discussion and Conclusions
Author Contributions
Funding
Institutional Review Board Statement
Informed Consent Statement
Data Availability Statement
Conflicts of Interest
References
- Cuocolo, R.; Cipullo, M.B.; Stanzione, A.; Ugga, L.; Romeo, V.; Radice, L.; Brunetti, A.; Imbriaco, M. Machine learning applications in prostate cancer magnetic resonance imaging. Eur. Radiol. Exp. 2019, 3, 35. [Google Scholar] [CrossRef] [PubMed]
- Mayerhoefer, M.E.; Materka, A.; Langs, G.; Häggström, I.; Szczypiński, P.; Gibbs, P.; Cook, G. Introduction to radiomics. J. Nucl. Med. 2020, 61, 488–495. [Google Scholar] [CrossRef] [PubMed]
- van Timmeren, J.E.; Cester, D.; Tanadini-Lang, S.; Alkadhi, H.; Baessler, B. Radiomics in medical imaging—“How-to” guide and critical reflection. Insights Imaging 2020, 11, 91. [Google Scholar] [CrossRef]
- Comelli, A.; Stefano, A.; Coronnello, C.; Russo, G.; Vernuccio, F.; Cannella, R.; Salvaggio, G.; Lagalla, R.; Barone, S. Radiomics: A New Biomedical Workflow to Create a Predictive Model. In Communications in Computer and Information Science, Proceedings of the Medical Image Understanding and Analysis, Oxford, UK, 15–17 July 2020; Springer: Cham, Switzerland, 2020; Volume 1248, pp. 280–293. ISBN 9783030527907. [Google Scholar]
- Laudicella, R.; Comelli, A.; Liberini, V.; Vento, A.; Stefano, A.; Spataro, A.; Crocè, L.; Baldari, S.; Bambaci, M.; Deandreis, D.; et al. [68 Ga]DOTATOC PET/CT Radiomics to Predict the Response in GEP-NETs Undergoing [177 Lu]DOTATOC PRRT: The “Theragnomics” Concept. Cancers 2022, 14, 984. [Google Scholar] [CrossRef]
- Cutaia, G.; La Tona, G.; Comelli, A.; Vernuccio, F.; Agnello, F.; Gagliardo, C.; Salvaggio, L.; Quartuccio, N.; Sturiale, L.; Stefano, A.; et al. Radiomics and Prostate MRI: Current Role and Future Applications. J. Imaging 2021, 7, 34. [Google Scholar] [CrossRef]
- Nioche, C.; Orlhac, F.; Boughdad, S.; Reuze, S.; Goya-Outi, J.; Robert, C.; Pellot-Barakat, C.; Soussan, M.; Frouin, F.; Buvat, I. Lifex: A freeware for radiomic feature calculation in multimodality imaging to accelerate advances in the characterization of tumor heterogeneity. Cancer Res. 2018, 78, 4786–4789. [Google Scholar] [CrossRef] [PubMed]
- Van Griethuysen, J.J.M.; Fedorov, A.; Parmar, C.; Hosny, A.; Aucoin, N.; Narayan, V.; Beets-Tan, R.G.H.; Fillion-Robin, J.C.; Pieper, S.; Aerts, H.J.W.L. Computational radiomics system to decode the radiographic phenotype. Cancer Res. 2017, 77, e104–e107. [Google Scholar] [CrossRef]
- Zwanenburg, A.; Vallières, M.; Abdalah, M.A.; Aerts, H.J.W.L.; Andrearczyk, V.; Apte, A.; Ashrafinia, S.; Bakas, S.; Beukinga, R.J.; Boellaard, R.; et al. The image biomarker standardization initiative: Standardized quantitative radiomics for high-throughput image-based phenotyping. Radiology 2020, 295, 328–338. [Google Scholar] [CrossRef]
- Fedorov, A.; Beichel, R.; Kalpathy-Cramer, J.; Finet, J.; Fillion-Robin, J.C.; Pujol, S.; Bauer, C.; Jennings, D.; Fennessy, F.; Sonka, M.; et al. 3D Slicer as an image computing platform for the Quantitative Imaging Network. Magn. Reson. Imaging 2012, 30, 1323–1341. [Google Scholar] [CrossRef]
- Szczypiński, P.M.; Strzelecki, M.; Materka, A.; Klepaczko, A. MaZda-A software package for image texture analysis. Comput. Methods Programs Biomed. 2009, 94, 66–76. [Google Scholar] [CrossRef]
- Song, Y.; Zhang, J.; Zhang, Y.D.; Hou, Y.; Yan, X.; Wang, Y.; Zhou, M.; Yao, Y.F.; Yang, G. FeAture Explorer (FAE): A tool for developing and comparing radiomics models. PLoS ONE 2020, 15, e0237587. [Google Scholar] [CrossRef] [PubMed]
- Johnson, W.E.; Li, C.; Rabinovic, A. Adjusting batch effects in microarray expression data using empirical Bayes methods. Biostatistics 2007, 8, 118–127. [Google Scholar] [CrossRef] [PubMed]
- Fortin, J.P.; Cullen, N.; Sheline, Y.I.; Taylor, W.D.; Aselcioglu, I.; Cook, P.A.; Adams, P.; Cooper, C.; Fava, M.; McGrath, P.J.; et al. Harmonization of cortical thickness measurements across scanners and sites. Neuroimage 2018, 167, 104–120. [Google Scholar] [CrossRef] [PubMed]
- Fortin, J.P.; Parker, D.; Tunç, B.; Watanabe, T.; Elliott, M.A.; Ruparel, K.; Roalf, D.R.; Satterthwaite, T.D.; Gur, R.C.; Gur, R.E.; et al. Harmonization of multi-site diffusion tensor imaging data. Neuroimage 2017, 161, 149–170. [Google Scholar] [CrossRef]
- Sharma, G.; Martin, J. MATLAB®: A language for parallel computing. Int. J. Parallel Program. 2009, 37, 3–36. [Google Scholar] [CrossRef]
- Welcome to Python.org. Available online: https://www.python.org/ (accessed on 15 June 2022).
- Armato, S.G.; McLennan, G.; Bidaut, L.; McNitt-Gray, M.F.; Meyer, C.R.; Reeves, A.P.; Zhao, B.; Aberle, D.R.; Henschke, C.I.; Hoffman, E.A.; et al. The Lung Image Database Consortium (LIDC) and Image Database Resource Initiative (IDRI): A Completed Reference Database of Lung Nodules on CT Scans. Med. Phys. 2011, 38, 915. [Google Scholar] [CrossRef]
- Barone, S.; Cannella, R.; Comelli, A.; Pellegrino, A.; Salvaggio, G.; Stefano, A.; Vernuccio, F. Hybrid descriptive-inferential method for key feature selection in prostate cancer radiomics. Appl. Stoch. Model. Bus. Ind. 2021, 37, 961–972. [Google Scholar] [CrossRef]
- Student. The Probable Error of a Mean. Biometrika 1908, 6, 1–25. [Google Scholar] [CrossRef]
- Robnik-Šikonja, M.; Kononenko, I. Theoretical and Empirical Analysis of ReliefF and RReliefF. Mach. Learn. 2003, 53, 23–69. [Google Scholar] [CrossRef]
- Sauerbrei, W.; Royston, P.; Binder, H. Selection of important variables and determination of functional form for continuous predictors in multivariable model building. Stat. Med. 2007, 26, 5512–5528. [Google Scholar] [CrossRef]
- Comelli, A.; Stefano, A.; Bignardi, S.; Russo, G.; Sabini, M.G.; Ippolito, M.; Barone, S.; Yezzi, A. Active contour algorithm with discriminant analysis for delineating tumors in positron emission tomography. Artif. Intell. Med. 2019, 94, 67–78. [Google Scholar] [CrossRef] [PubMed]
- Comelli, A.; Stefano, A.; Russo, G.; Bignardi, S.; Sabini, M.G.; Petrucci, G.; Ippolito, M.; Yezzi, A. K-nearest neighbor driving active contours to delineate biological tumor volumes. Eng. Appl. Artif. Intell. 2019, 81, 133–144. [Google Scholar] [CrossRef]
- Licari, L.; Salamone, G.; Campanella, S.; Carfì, F.; Fontana, T.; Falco, N.; Tutino, R.; de Marco, P.; Comelli, A.; Cerniglia, D.; et al. Use of the KSVM-based system for the definition, validation and identification of the incisional hernia recurrence risk factors. G. Chir. 2019, 40, 32–38. [Google Scholar]
- Alongi, P.; Stefano, A.; Comelli, A.; Laudicella, R.; Scalisi, S.; Arnone, G.; Barone, S.; Spada, M.; Purpura, P.; Bartolotta, T.V.; et al. Radiomics analysis of 18F-Choline PET/CT in the prediction of disease outcome in high-risk prostate cancer: An explorative study on machine learning feature classification in 94 patients. Eur. Radiol. 2021, 31, 4595–4605. [Google Scholar] [CrossRef]
- Stefano, A.; Leal, A.; Richiusa, S.; Trang, P.; Comelli, A.; Benfante, V.; Cosentino, S.; Sabini, M.G.; Tuttolomondo, A.; Altieri, R.; et al. Robustness of pet radiomics features: Impact of co-registration with mri. Appl. Sci. 2021, 11, 10170. [Google Scholar] [CrossRef]
- Bianconi, F.; Fravolini, M.L.; Palumbo, I.; Pascoletti, G.; Nuvoli, S.; Rondini, M.; Spanu, A.; Palumbo, B. Impact of Lesion Delineation and Intensity Quantisation on the Stability of Texture Features from Lung Nodules on CT: A Reproducible Study. Diagnostics 2021, 11, 1224. [Google Scholar] [CrossRef]
- Comelli, A.; Stefano, A.; Bignardi, S.; Coronnello, C.; Russo, G.; Sabini, M.G.; Ippolito, M.; Yezzi, A. Tissue Classification to Support Local Active Delineation of Brain Tumors. In Communications in Computer and Information Science; Annual Conference on Medical Image Understanding and Analysis; Springer: Cham, Switzerland, 2020; Volume 1065, pp. 3–14. ISBN 9783030393427. [Google Scholar]
- Stefano, A.; Vitabile, S.; Russo, G.; Ippolito, M.; Sardina, D.; Sabini, M.G.; Gallivanone, F.; Castiglioni, I.; Gilardi, M.C. A graph-based method for PET image segmentation in radiotherapy planning: A pilot study. In Lecture Notes in Computer Science (Including Subseries Lecture Notes in Artificial Intelligence and Lecture Notes in Bioinformatics); Petrosino, A., Ed.; Lecture Notes in Computer Science; Springer: Berlin/Heidelberg, Germany, 2013; Volume 8157, pp. 711–720. ISBN 9783642411830. [Google Scholar]
- Stefano, A.; Vitabile, S.; Russo, G.; Ippolito, M.; Marletta, F.; D’arrigo, C.; D’urso, D.; Gambino, O.; Pirrone, R.; Ardizzone, E.; et al. A fully automatic method for biological target volume segmentation of brain metastases. Int. J. Imaging Syst. Technol. 2016, 26, 29–37. [Google Scholar] [CrossRef]
- Stefano, A.; Vitabile, S.; Russo, G.; Ippolito, M.; Marletta, F.; D’Arrigo, C.; D’Urso, D.; Sabini, M.G.; Gambino, O.; Pirrone, R.; et al. An automatic method for metabolic evaluation of gamma knife treatments. In Image Analysis and Processing—ICIAP 2015; Lecture Notes in Computer Science; Springer: Cham, Switzerland, 2015; Volume 9279, pp. 579–589. [Google Scholar]
- Stefano, A.; Vitabile, S.; Russo, G.; Ippolito, M.; Sabini, M.G.; Sardina, D.; Gambino, O.; Pirrone, R.; Ardizzone, E.; Gilardi, M.C. An enhanced random walk algorithm for delineation of head and neck cancers in PET studies. Med. Biol. Eng. Comput. 2017, 55, 897–908. [Google Scholar] [CrossRef]
- Comelli, A.; Bignardi, S.; Stefano, A.; Russo, G.; Sabini, M.G.; Ippolito, M.; Yezzi, A. Development of a new fully three-dimensional methodology for tumours delineation in functional images. Comput. Biol. Med. 2020, 120, 103701. [Google Scholar] [CrossRef]
- Comelli, A.; Stefano, A. A Fully Automated Segmentation System of Positron Emission Tomography Studies. In Proceedings of the Annual Conference on Medical Image Understanding and Analysis, Liverpool, UK, 24–26 July 2019; Volume 1065, pp. 353–363, ISBN 9783030393427. [Google Scholar]
- Bergstra, J.; Ca, J.B.; Ca, Y.B. Random Search for Hyper-Parameter Optimization Yoshua Bengio. J. Mach. Learn. Res. 2012, 13, 281–305. [Google Scholar]
- Stefano, A.; Comelli, A. Customized efficient neural network for covid-19 infected region identification in ct images. J. Imaging 2021, 7, 131. [Google Scholar] [CrossRef] [PubMed]
- NIfTI Background. Available online: https://nifti.nimh.nih.gov/ (accessed on 11 April 2022).
- Horng, H.; Singh, A.; Yousefi, B.; Cohen, E.A.; Haghighi, B.; Katz, S.; Noël, P.B.; Shinohara, R.T.; Kontos, D. Generalized ComBat harmonization methods for radiomic features with multi-modal distributions and multiple batch effects. Sci. Rep. 2022, 12, 4493. [Google Scholar] [CrossRef] [PubMed]
- Bol, G.H.; Kotte, A.N.T.J.; van der Heide, U.A.; Lagendijk, J.J.W. Simultaneous multi-modality ROI delineation in clinical practice. Comput. Methods Programs Biomed. 2009, 96, 133–140. [Google Scholar] [CrossRef] [PubMed]


| Scanner Model | Total | #Benign | #Malignant | Batch ID |
|---|---|---|---|---|
| LightSpeed VCT (GE) | 19 | 5 | 14 | 1 |
| LightSpeed16 (GE) | 50 | 19 | 31 | 2 |
| LightSpeed Plus (GE) | 13 | 4 | 9 | 3 |
| LightSpeed Pro 16 (GE) | 5 | 0 | 5 | 4 |
| LightSpeed Ultra (GE) | 4 | 0 | 4 | 5 |
| LightSpeed Power (GE) | 1 | 0 | 1 | 6 |
| Pixel Spacing [x, y] mm | Total | #Benign | #Malignant |
|---|---|---|---|
| [0.585938, 0.585938] | 2 | 0 | 2 |
| [0.605469, 0.605469] | 1 | 0 | 1 |
| [0.625000, 0.625000] | 4 | 1 | 3 |
| [0.644531, 0.644531] | 3 | 0 | 3 |
| [0.664062, 0.664062] | 5 | 2 | 3 |
| [0.683594, 0.683594] | 1 | 0 | 1 |
| [0.703125, 0.703125] | 27 | 7 | 20 |
| [0.722656, 0.722656] | 3 | 2 | 1 |
| [0.732422, 0.732422] | 1 | 1 | 0 |
| [0.742188, 0.742188] | 5 | 3 | 2 |
| [0.781250, 0.781250] | 22 | 7 | 15 |
| [0.820312, 0.820312] | 7 | 2 | 5 |
| [0.859375, 0.859375] | 8 | 2 | 6 |
| [0.878906, 0.878906] | 1 | 0 | 1 |
| [0.898438, 0.898438] | 2 | 1 | 1 |
| Slice Thickness [z] mm | Total | #Benign | #Malignant |
|---|---|---|---|
| 1.25 | 24 | 4 | 20 |
| 2 | 68 | 24 | 44 |
| Group | Selection Algorithm | Selected Feature | Score |
|---|---|---|---|
| Non-harmonized | PBC-HID | original_gldm_ SmallDependenceHighGrayLevelEmphasis | 0.38363 |
| harmonized | PBC-HID | original_gldm_ SmallDependenceHighGrayLevelEmphasis | 0.38669 |
| Group | Selection Algorithm | Selected Features | Score |
|---|---|---|---|
| non-harmonized | LASSO | original_shape_Flatness original_gldm_ DependenceNonUniformityNormalized original_gldm_ SmallDependenceHighGrayLevelEmphasis original_glszm_ SizeZoneNonUniformity | / |
| Group | AUC | Accuracy | Sensitivity | Specificity |
|---|---|---|---|---|
| non-harmonized | 0.76 ± 0.0218 | 0.73 ± 0.0085 | 0.22 ± 0.0135 | 0.94 ± 0.0068 |
| harmonized | 0.75 ± 0.0177 | 0.72 ± 0.0030 | 0.22 ± 0.0135 | 0.94 ± 0.0045 |
| Group | AUC | Accuracy | Sensitivity | Specificity |
|---|---|---|---|---|
| non-harmonized | 0.75 ± 0.02 | 0.73 ± 0.0039 | 0.22 ± 0.000 | 0.94 ± 0.037 |
| harmonized | 0.75 ± 0.0131 | 0.72 ± 0.0058 | 0.22 ± 0.090 | 0.94 ± 0.0068 |
| Group | AUC | Accuracy | Sensitivity | Specificity |
|---|---|---|---|---|
| non-harmonized | 0.74 ± 0.0162 | 0.73 ± 0.0069 | 0.28 ± 0.0202 | 0.92 ± 0.060 |
Publisher’s Note: MDPI stays neutral with regard to jurisdictional claims in published maps and institutional affiliations. |
© 2022 by the authors. Licensee MDPI, Basel, Switzerland. This article is an open access article distributed under the terms and conditions of the Creative Commons Attribution (CC BY) license (https://creativecommons.org/licenses/by/4.0/).
Share and Cite
Pasini, G.; Bini, F.; Russo, G.; Comelli, A.; Marinozzi, F.; Stefano, A. matRadiomics: A Novel and Complete Radiomics Framework, from Image Visualization to Predictive Model. J. Imaging 2022, 8, 221. https://doi.org/10.3390/jimaging8080221
Pasini G, Bini F, Russo G, Comelli A, Marinozzi F, Stefano A. matRadiomics: A Novel and Complete Radiomics Framework, from Image Visualization to Predictive Model. Journal of Imaging. 2022; 8(8):221. https://doi.org/10.3390/jimaging8080221
Chicago/Turabian StylePasini, Giovanni, Fabiano Bini, Giorgio Russo, Albert Comelli, Franco Marinozzi, and Alessandro Stefano. 2022. "matRadiomics: A Novel and Complete Radiomics Framework, from Image Visualization to Predictive Model" Journal of Imaging 8, no. 8: 221. https://doi.org/10.3390/jimaging8080221
APA StylePasini, G., Bini, F., Russo, G., Comelli, A., Marinozzi, F., & Stefano, A. (2022). matRadiomics: A Novel and Complete Radiomics Framework, from Image Visualization to Predictive Model. Journal of Imaging, 8(8), 221. https://doi.org/10.3390/jimaging8080221