Article

Receive Beam-Steering and Clutter Reduction for Imaging the Speed-of-Sound Inside the Carotid Artery

1
Institute of Applied Physics, University of Bern, Sidlerstrasse 5, 3012 Bern, Switzerland
2
Department of Biomedical Engineering, Eindhoven University of Technology, PO box 513, 5600 MB Eindhoven, The Netherlands
*
Author to whom correspondence should be addressed.
J. Imaging 2018, 4(12), 145; https://doi.org/10.3390/jimaging4120145
Submission received: 13 November 2018 / Revised: 30 November 2018 / Accepted: 5 December 2018 / Published: 7 December 2018
(This article belongs to the Special Issue Biomedical Photoacoustic Imaging: Technologies and Methods)

Abstract

:
Handheld imaging of the tissue’s speed-of-sound (SoS) is a promising multimodal addition to diagnostic ultrasonography for the examination of tissue composition. Computed ultrasound tomography in echo mode (CUTE) probes the spatial distribution of SoS, conventionally via scanning the tissue under a varying angle of ultrasound transmission, and quantifying—in a spatially resolved way—phase variations of the beamformed echoes. So far, this technique is not applicable to imaging the lumen of vessels, where blood flow and tissue clutter inhibit phase tracking of the blood echoes. With the goal to enable the assessment of atherosclerotic plaque composition inside the carotid artery, we propose two modifications to CUTE: (a) use receive (Rx) beam-steering as opposed to transmit (Tx) beam-steering to increase acquisition speed and to reduce flow-related phase decorrelation, and (b) conduct pairwise subtraction of data obtained from repetitions of the scan sequence, to highlight blood echoes relative to static echo clutter and thus enable the phase tracking of blood echoes. These modifications were tested in a phantom study, where the echogenicity of the vessel lumen was chosen to be similar to the one of the background medium, which allows a direct comparison of SoS images obtained with the different techniques. Our results demonstrate that the combination of Rx-steering with the subtraction technique results in an SoS image of the same quality as obtained with conventional Tx-steering. Together with the improved acquisition speed, this makes the proposed technique a key step towards successful imaging of the SoS inside the carotid artery.

1. Introduction

Reliable imaging techniques for non-invasive tissue characterisation are important in clinical practice for the accurate assessment of pathological and physiological abnormalities. For this purpose, multimodal imaging is often preferred over single-mode imaging because it provides complementary information on a variety of different tissue parameters. On the downside, multimodal imaging can be expensive, time-consuming, tedious for patients, and can suffer from image registration problems that limit the diagnostic accuracy. A promising way to overcome such drawbacks is by using a single imaging device and extract complementary multimodal information via different ways of data acquisition/processing. Echo ultrasound (US) is already used as quick, simple, and cost-effective imaging technique in many areas. To improve the diagnostic accuracy in a multimodal approach, it has recently been combined with US elastography, which allows analysing the tissue’s elastic properties [1,2,3,4]. Optoacoustic imaging, which shows blood oxygen saturation [5,6,7], lipid pools [8,9], or exogenous molecular probes [10], has been implemented as an addition to conventional US [11,12,13], with promise, as an example, for cancer diagnosis [14,15].
In a similar multimodal approach, our goal is to complement the classical B-mode display of echo intensity with an image of the spatial distribution of the tissue’s speed of sound (SoS), both derived from pulse–echo data. The SoS fundamentally depends on the tissue’s compressibility and density, and thus a spatially resolved quantification of this parameter will help identifying abnormalities in tissue compositions [16,17].
The diagnostic potential of imaging SoS has been thoroughly demonstrated in through-transmission ultrasound tomography [18,19,20,21,22,23,24,25]. In addition, various reflection-mode techniques have been investigated [26,27,28]. We recently developed a reflection-mode technique, named computed ultrasound tomography in echo-mode (CUTE) [29,30], which allows determination of the SoS with high spatial and contrast resolution in real time. The data acquisition and reconstruction scheme of CUTE involves the following steps: (1) Transmit (Tx) US plane waves over a range of angles (by beam steering) to a region of interest and receive (Rx) the echoes from acoustic scatterers. (2) Assuming an average SoS, reconstruct (beamform) the echoes back to the hypothetical locations of the ultrasound scatterers, using, for example, delay-and-sum (DAS) beamforming. (3) Detect the local echo phase shift from the beamformed echoes in between successive Tx angles. (4) Finally, reconstruct the SoS image from the phase shift maps. This technique is based on the following rationale: if the actual SoS inside the tissue agrees with the assumed value, the round-trip times in the DAS beamforming are correctly anticipated. Then, the phase of the reconstructed echoes does not depend on the Tx angle, and the phase shift is zero, independent of the location and angle pair. If, however, the spatial distribution of SoS deviates from the assumed value, it produces a corresponding phase shift due to the nonanticipated round-trip time delay of the Tx transients. Using the relation between the SoS and phase shift, the spatial distribution of the SoS can then be reconstructed by solving the corresponding inverse problem either in the Fourier [29] or spatial domain [31].
A classic use of US sonography is for diagnosing atherosclerosis [32,33] in the carotid arteries. Plaques in their advanced stage may contain cellular or acellular fibrous tissues, lymphocytic inflammatory infiltrate, foam cells, pultaceous debris (lipid-rich core), and calcific deposits. US sonography is used for assessing plaque neovascularisation, the thickening of inner lining of vessel walls, and plaque formation. Future cardiovascular events or mortality risks can be predicted by quantifying the total number of plaques [34] and plaque area or volume [35]. In addition, echogenicity is used to categorise plaques into echo-lucent, predominantly echo-lucent, predominantly echogenic, and echogenic: Pathomorphologic studies in relation to US echogenicity suggest that low-risk “stable” plaques mainly consist of fibrous or calcified tissues, which appear as echogenic, while high-risk plaques appear as heterogeneous or translucent [36,37]. Nevertheless, the accuracy of the B-mode US is still not satisfactory, and thus it is nowadays combined with US elastography to improve the diagnostic accuracy. These imaging techniques provide, however, only limited morphological information for assessing plaque rupture risks.
CUTE is promising to aid the assessment of atherosclerotic plaque rupture risk: Lipids and fibrous and calcified tissue have different SoS, thus quantifying SoS will provide complementary information on plaque composition. The conventional way that CUTE is performed, however, inhibits its application to the carotid artery for two reasons:
  • Blood motion: In conventional CUTE, Tx plane waves are sent forth to scan the full angular aperture that is possible within the limits of the transducer design, e.g., from −25° to 25°. For maintaining low clutter levels, synthetic Tx focusing is used, based on the coherent plane wave compounding [38] of acquisitions with finely spaced (e.g., 0.5°) Tx angles. Therefore, conventional CUTE typically requires more than 100 acquisitions. During the time required for this number of acquisitions, arterial blood flow leads to the decorrelation of blood echoes, resulting in phase noise and SoS artefacts.
  • Tissue clutter: Higher order echoes from the tissue surrounding the carotid are interpreted as originating from inside the carotid, cluttering the blood echoes. Clutter has a higher intensity level than the blood echoes, leading to wrong echo phase shifts and thus falsified SoS reconstruction.
Here, we propose two modifications to the CUTE methodology that solve these problems and will be an important step towards enabling imaging the SoS inside the carotid artery:
  • Using Rx instead of Tx beam-steering for echo phase tracking, in order to reduce acquisition time and thus avoid/reduce blood flow-related artefacts. This approach is inspired by the commonly accepted principle of the reciprocity of sender and receiver, suggesting the equivalence of Tx- and Rx-steering.
  • Taking advantage of the benefit of blood motion to reduce clutter: Pairwise subtraction of consecutive repetitions of the signal acquisition, spaced by small (on the order of a ms) time intervals, cancels static tissue clutter and thereby highlights the decorrelating weak blood echoes.
The present phantom study demonstrates that the proposed modifications do not substantially alter the phase shift maps nor the final SoS image, compared to the conventional Tx-steering approach, making them a promising step towards SoS imaging inside the carotid artery.

2. Materials and Methods

This chapter starts with a description of conventional CUTE and of the proposed novel modifications. Although this description uses the exact acquisition parameters used in this study, it is, however, intended to be interpreted in a more general way, and different parameters may be found to be suitable for other specific applications (depending on hardware/sample properties). The acquisition parameters employed in this study are summarised in Table 1.

2.1. Conventional Tx CUTE

For conventional Tx-steering CUTE, US images were acquired for Tx steering angles ranging from −25° to 25° with a 2.5° angle step (Φ = −25°:2.5°:25°). The choice of the angle range corresponds to the desired tracking angle range. The angle limits are defined by the directional response of the transducer elements and by the element pitch. The angle step is chosen small enough to avoid phase aliasing caused by SoS variations.
For Rx beamforming, an angular aperture with radius Ψrad = 5° was used, centred on the Rx angle Ψ = 0°. To generate images with a clutter level enabling robust phase tracking, focusing is required in Tx. One way to achieve Tx focusing is to scan the sample with an actually focused beam (line-by-line scan), which, however, results in an unnecessarily large number of acquisitions, especially as multiple focal depths are required. A far more efficient way to achieve Tx focusing is coherent plane-wave compounding. This was done for each tracking angle, from a group of plane-wave acquisitions centred on the respective tracking angle, with a Tx aperture radius Φrad = 2.5° and a 0.5° step size. This resulted in a total plane wave Tx angle range of [−27.5°:0.5°:27.5°], i.e., 111 acquisitions. The coherently compounded images, 11 in total, were then used for phase tracking.

2.2. Full-Rx CUTE

Rx tracking can be implemented in a very similar way to the conventional Tx tracking, by interchanging the Tx and Rx parameters. The Rx angular aperture of the conventional approach was thus replaced by an identical Tx angular aperture in the Rx approach. For this purpose, plane-wave acquisitions were performed with Tx angles ranging within an aperture radius Φrad = 5° and centred around Φ = 0° at 0.5° step size, resulting in 21 acquisitions. This already provides a 5-fold reduction in acquisition time, reducing blood-flow- and tissue-motion-related phase tracking errors. For each Tx angle, a set of 21 Rx-steered images was reconstructed, using steering angles (Ψ = −25°:2.5°:25°) with an Rx angular aperture radius Ψrad = 2.5°, resulting in 21 by 21 plane-wave images. Then, synthetic Tx focusing was achieved for each Rx-steering angle separately, by coherently compounding over the 21 different Tx angles, resulting in the desired 21 Rx-steered (and Tx-focused) images for phase tracking.
This approach, where the Rx aperture of conventional CUTE is replaced with a quasi-continuous Tx aperture in the Rx-steering approach, is hereafter termed as ‘full-Rx CUTE’.

2.3. Fast-Rx Subtraction Technique

Preliminary in vivo results of carotid imaging indicate that the total time needed for all acquisitions in full-Rx CUTE is still too long, resulting in substantial flow-related echo decorrelation during scanning the Tx angle range and thus to phase noise in the coherently compounded images. Such flow-related decorrelation can be reduced by a further reduction of the number of Tx angles. Reducing the number of Tx angles, on the other hand, increases phase noise, caused by clutter stemming from tissue surrounding the artery, which obscures the comparably weak blood echoes.
To solve this problem, we propose to make use of the blood flow: multiple data sets (each containing the same Tx angle range) are acquired, with a long enough time delay between consecutive repetitions, allowing the blood echoes to decorrelate while echoes from surrounding tissue remain static. By subtracting successive data sets, the stationary tissue clutter is reduced (ideally to zero), whereas the decorrelating blood echoes remain visible. The important point here is that blood echo decorrelation occurs in between data sets, but not substantially within each data set. Preliminary in vivo results indicated that a number of 5 acquisitions per data set is sufficiently small to reduce blood echo decorrelation to an acceptable level. For our phantom study, we therefore used a Tx angle step of 2.5°, resulting in a total of 5 angles distributed over the desired Tx angle range from −5° to 5°.
The subtraction technique can only provide echoes from inside the vessel, not from the surrounding static tissue. To allow phase shift tracking over the whole image area, the segmented echoes from inside the blood vessel, obtained with the fast-Rx subtraction approach, were therefore combined with the echoes from the surrounding tissue, obtained with the full-Rx approach.

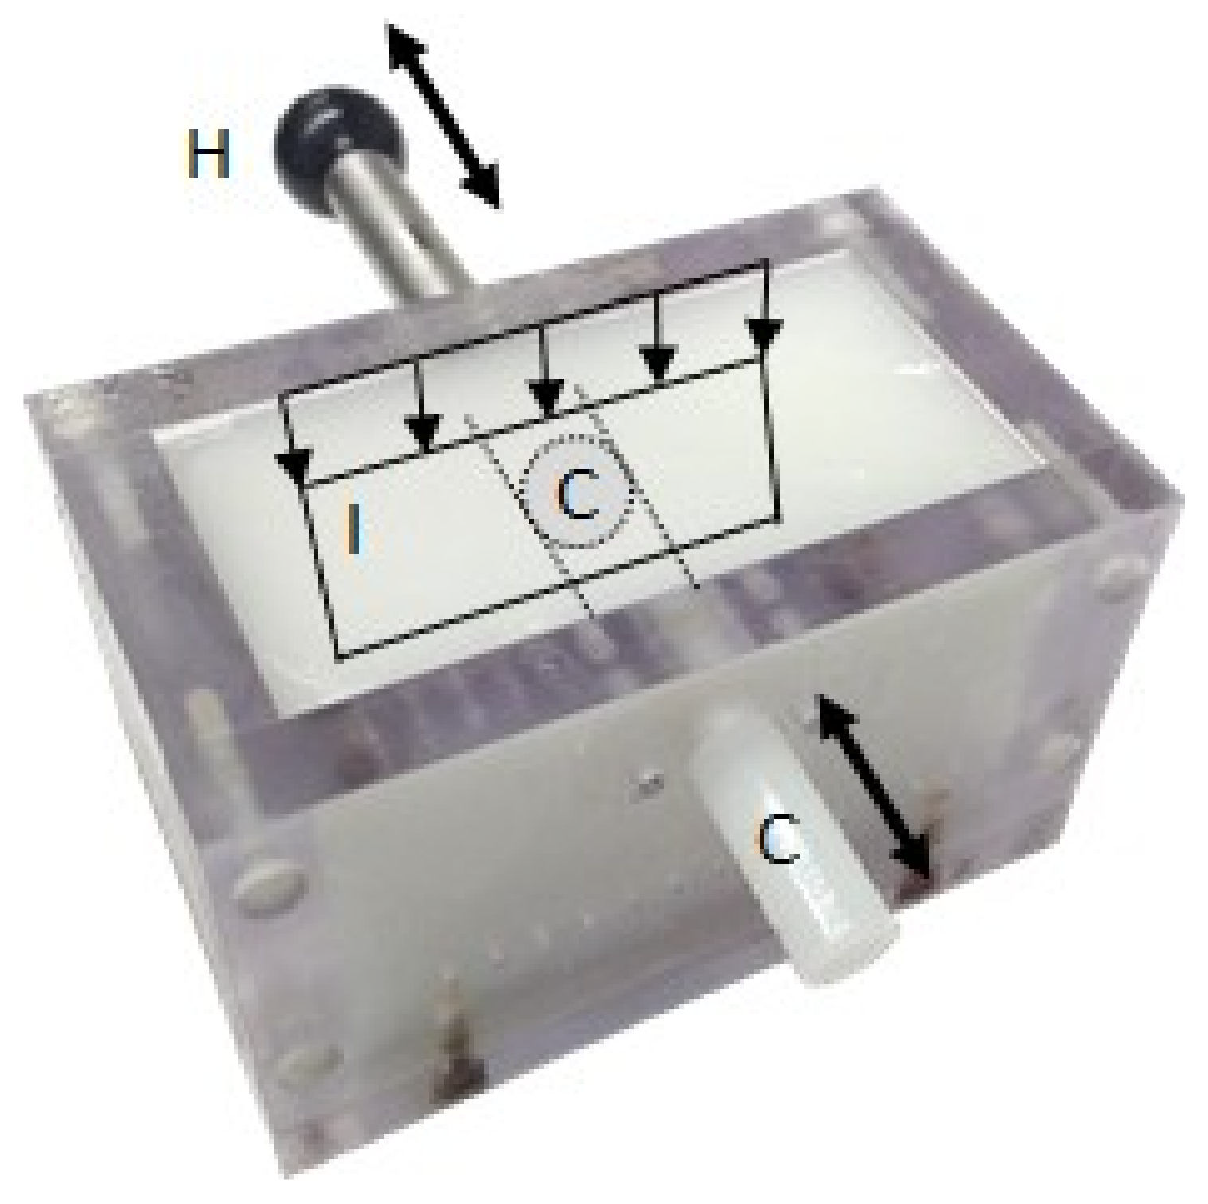
2.4. Phantom Description

The experiments were conducted using an agar–cellulose phantom, where agar formed the gel network and cellulose provided echogenicity for US. This phantom consisted of a background with uniform SoS, into which a movable cylindrical inclusion was inserted, having a positive SoS contrast compared to the background. The inclusion had a diameter of 7 mm and was placed at 10 mm depth below the phantom surface (Figure 1) to imitate a carotid artery. Blood flow was simulated by manually moving the inclusion.
The phantom was prepared by slowly adding 2 wt % of agar powder (Sigma–Aldrich, Darmstadt, Germany) and 2 wt % of cellulose powder (20-micrometre, Sigma–Aldrich, Darmstadt, Germany) into continually stirred deionised water at room temperature to avoid forming lumps. The solution was heated above 80 °C (the melting temperature of agar) and degassed by exposing it to a vacuum level of about 0.1 atm for about 5 min. After cooling down to about 40 °C, ethanol (1 vol %) was added to adjust the SoS of the background to the desired value of 1490 m/s. This final solution was poured (while still at 40 °C) into a precooled mould, which contained a removable steel rod with 7 mm diameter at the location where the cylindrical inclusion was to be inserted later on. The mould was then quickly cooled down below the gelation temperature (30 °C) to minimise the sedimentation of cellulose during gelation. All experiments were performed at ambient temperature (22 °C). In a different mould, a cylindrical inclusion with 7 mm diameter was prepared with 2% cellulose following the same procedure and by adding 5 vol % of ethanol to generate a positive SoS contrast (SoS = 1540 m/s). The cylindrical inclusion was inserted into the background sample only for the time of the experiment to avoid the diffusion of ethanol between the inclusion and the background, which would else level off the SoS contrast.

2.5. Acquisition System

The experiments were performed using a Vantage 64 LE ultrasound system (Verasonics, Redmond, WA, USA). The ultrasound probe was a Philips L12-5 linear array probe (ATL, Bothell, WA, USA) with a 0.19 mm element pitch. Matlab (The MathWorks, Natick, MA, USA) software was used to program the acquisition and the offline image reconstruction. The probe was placed on the top surface of the phantom with the imaging plane aligned perpendicular to the cylindrical inclusion (Figure 1). The transducer was driven at 9 MHz transmit centre frequency. Raw radiofrequency (rf) data were collected with a fourfold sampling frequency of 36 MHz.

2.6. US Image Reconstruction and Phase Tracking

The signal processing starts with the conversion of the rf data into reconstructed complex rf (crf) mode images by applying the Hilbert transformation, followed by DAS beamforming.
An important prerequisite for proving the experimental equivalence between Tx- and Rx-steering is the mathematical equivalence of the implementation of the DAS algorithms. In both the Tx- and the Rx-CUTE approaches, Tx beamforming was achieved via the coherent compounding of plane-wave transmission data. Conventionally, Rx-beamforming is implemented via summation over subsets of transducer elements. This approach is, however, not mathematically equivalent to plane-wave compounding, as the elements have spherical/cylindrical receiving fields, as opposed to the plane-transmitted fields. To achieve mathematical equivalence, we therefore implemented an adapted way of DAS beamforming, consisting of two stages: In a first stage, the element-wise rf data was converted to receive angle-wise rf data, using a DAS algorithm with linear delay profiles (as opposed to focused delay profiles) and summation over the full array aperture, as done in a classical phased-array sector scan. This was done for delay profiles corresponding to Rx angles ranging from −27.5° to 27.5° in 0.5° steps, resulting in receiving fields that were identical with the transmitting fields used for synthetic Tx beamforming. In a second stage, the angle-wise rf data was coherently compounded over the desired Rx angular apertures.
Echo phase shift maps were obtained using Loupas-type phase correlation [39]: The crf image at the nth tracking angle was point-wise multiplied with the complex conjugate of the crf mode image at the adjacent (n+1)-th angle. The complex product was convolved with a spatial low-pass filter kernel with dimensions of 1 mm by 1 mm. The phase angle of the filtered complex product was regarded as proportional to the spatially resolved, nonanticipated time-of-flight (ToF) differences along the different tracking angles (phase shift map). Any deviation of the medium’s SoS from the assumed value, c0, would result in nonzero phase shift values.

2.7. SoS Image Reconstruction
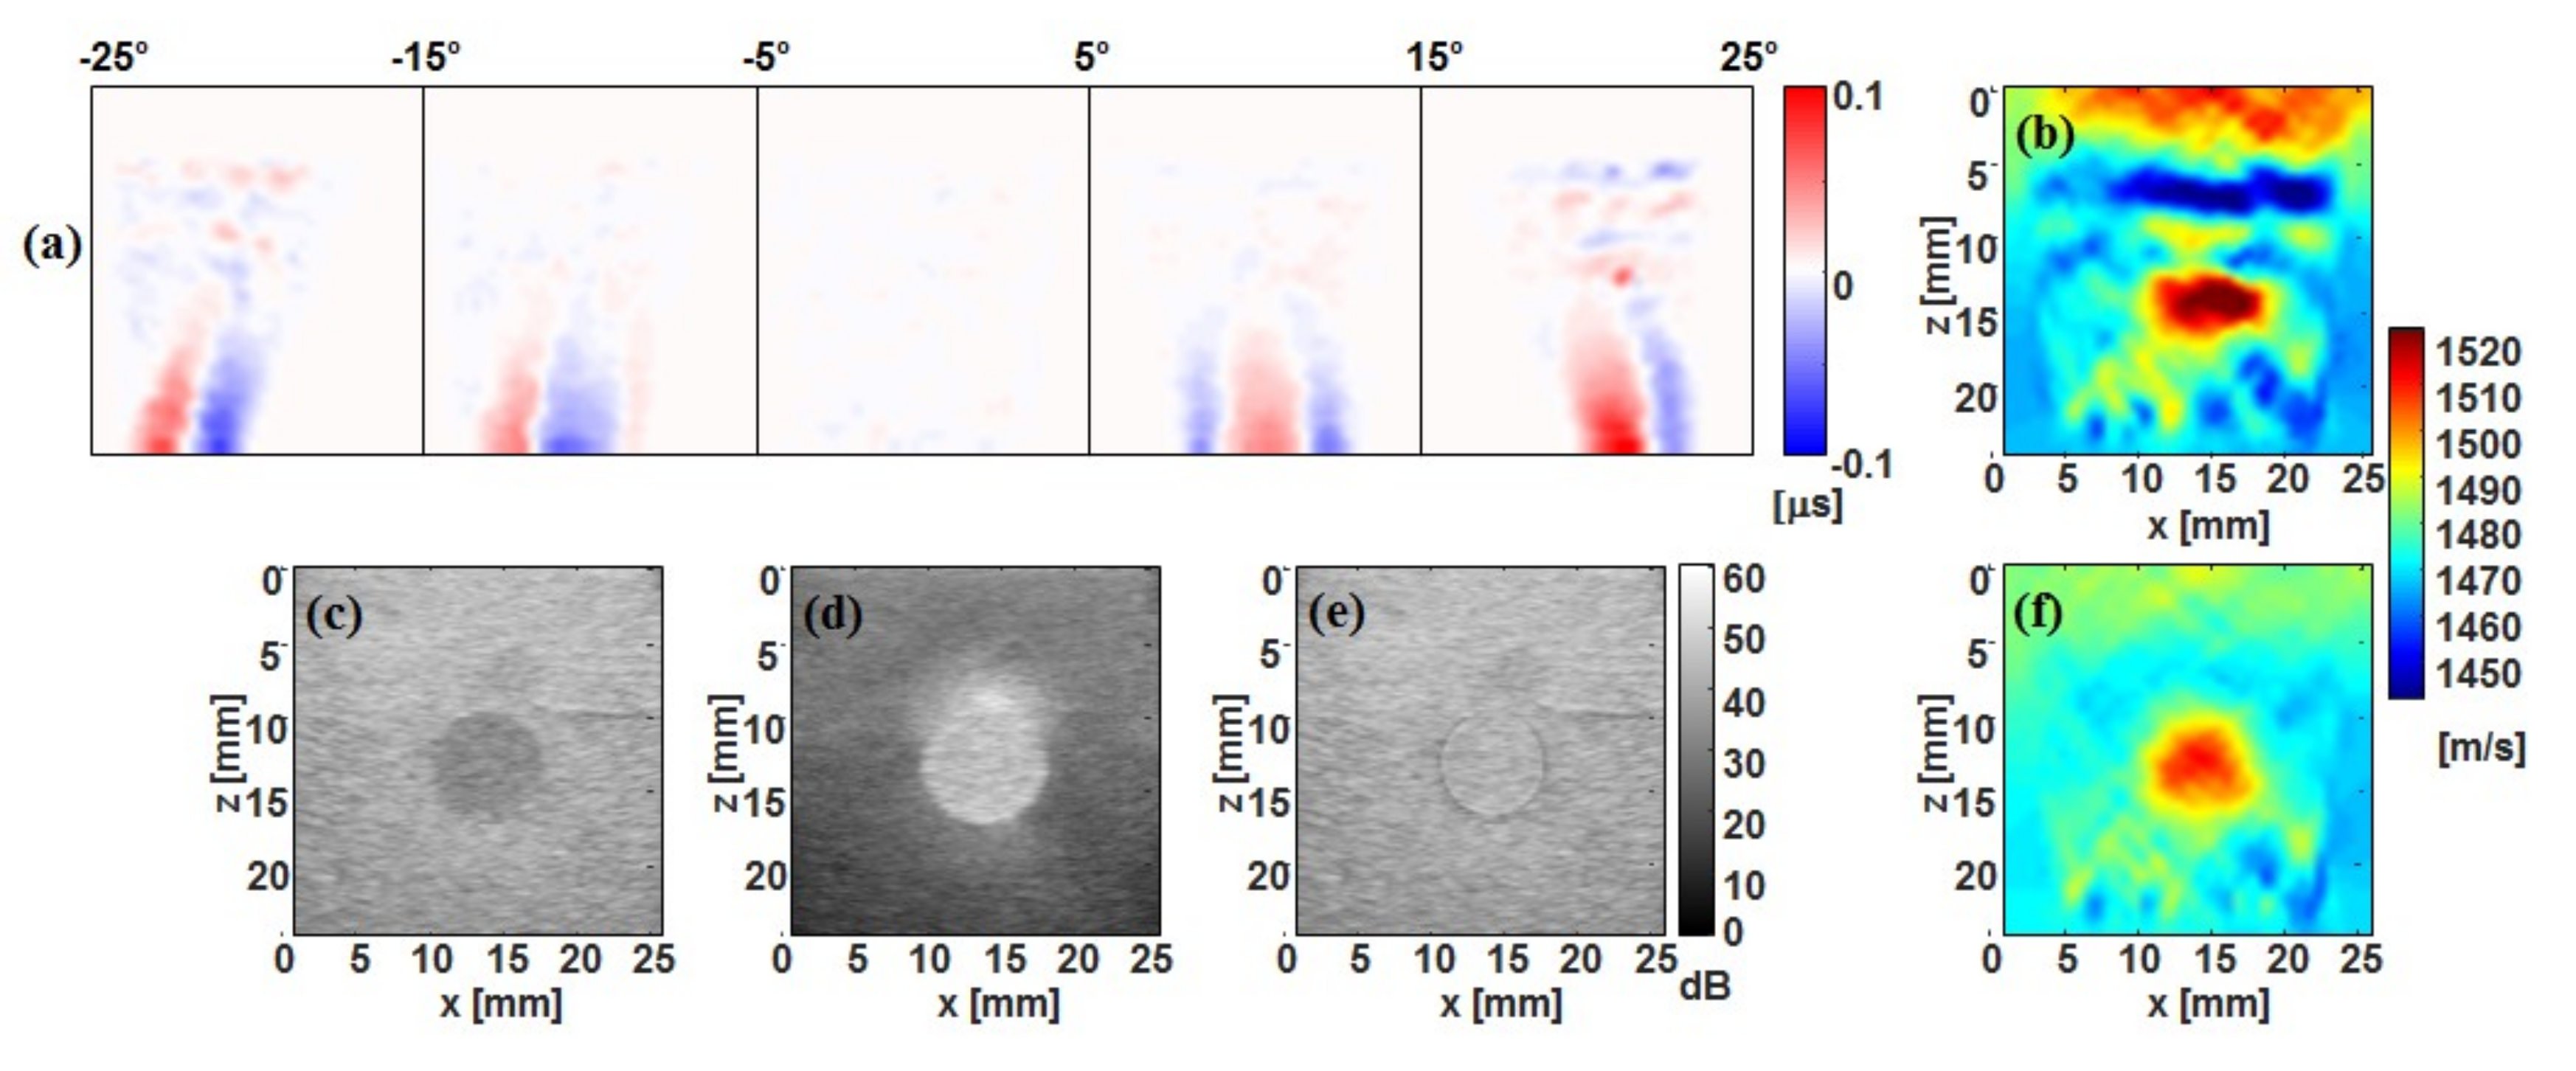
For SoS reconstruction, groups of two adjacent phase shift maps were summed to obtain phase shift maps for a reduced number of final tracking angles, i.e., [−25°:10°:25°]. The step size of 10° was a compromise between artefact level and numerical efficiency of SoS reconstruction: In our experience, SoS artefacts typically decrease with increasing number of angles, but converge below a 10° angle step. A linear space domain algorithm was used for SoS image reconstruction, assuming straight-ray US propagation: In the forward model, the echo phase shift values were expressed as a function of line integrals of slowness deviation (i.e., the difference between actual slowness and assumed slowness, where the slowness is defined as inverse of SoS) in a system matrix. A Tikhonov pseudoinverse of the system matrix was calculated, with L2 norm regularisation of the slowness gradient, to reconstruct the slowness deviation from the measured phase shift data.

3. Results

3.1. Tx Versus Full-Rx CUTE

The first goal of this study was to demonstrate the experimental equivalence between the Tx- and the full Rx-steering approach. Figure 2a,b show the echo phase shift maps obtained with the two approaches. The images show visually very similar results. A comparison of the root-mean-square value of the difference between the phase shifts of the two approaches, with the rms value of the phase shifts of the Tx-steering approach, yields a ratio of 0.05, quantitatively supporting the close similarity of both results. Figure 2c,d show the SoS images resulting from the Tx- and the full Rx-steering approaches, respectively. Note that the color maps account for an offset of −8 m/s of the full-Rx compared to the Tx result. Apart from this offset, the reconstructed spatial distribution of the SoS looks very similar: Both images reveal the positive SoS contrast at the location of the cylindrical inclusion. Below the inclusion, both techniques show comparable artefacts. These artefacts originate from phase noise due to aberrations (refraction) of US propagating through the inclusion. The disagreement towards the upper edge of the image near the transducer aperture can be attributed to phase noise due to element cross-talk, when transmitting on different transducer elements with different time delays. This phase noise plays a different role in the two approaches because of the different Tx angle ranges.

3.2. Fast-Rx Subtraction Technique

Preliminary volunteer results of full-Rx echo phase tracking using 21 Tx angles indicated that even the reduced acquisition time is long enough that blood echo decorrelation still occurs. To further reduce the acquisition time, the fast-Rx approach reduces the quasi-continuous Tx aperture to only 5 Tx angles. However, while reducing echo decorrelation, this results in reduced synthetic Tx focus quality and thus increased clutter level. This effect is visible in the phantom study, where the angle number reduction led to increased phase noise in the echo phase shift maps (Figure 3a), compared to the full-Rx approach (Figure 2b). As a result, the SoS image shows a high level of artefacts and an inaccurate spatial distribution of SoS inside the inclusion (Figure 3b).
Most of the clutter found inside the inclusion area consists of stationary higher-order echoes originating from outside the inclusion. The subtraction technique aims at reducing this stationary clutter via pairwise subtracting consecutively repeated fast-Rx acquisitions. At the same time, blood flow between the sequence repetitions avoids cancellation of blood echoes, thus highlighting the blood echo intensity compared to stationary echoes. This is illustrated by B-mode US images: Whereas the echogenicity inside the inclusion was slightly lower than in the background in the nonsubtracted data (Figure 3c), the subtraction data highlights the echoes from inside the inclusion (Figure 3d). The reduced intensity level of the stationary echoes outside the inclusion results in a reduced relative level of clutter inside the inclusion. The difference data thus allows robust phase tracking inside the inclusion in spite of the reduced number of angles. Outside the inclusion, however, the relative clutter level stays unchanged.
To enable echo phase tracking both in and outside the inclusion, the fast-Rx subtraction data from inside the inclusion is combined with full-Rx data from outside the inclusion. The second goal of this study was to demonstrate that this combination allows reconstructing the SoS in a similar way to when high-quality (full-Rx) echoes would be available inside the inclusion as well. The segmentation was achieved by manual selection of the centre point and radius of the inclusion area. The fast-Rx subtraction data was scaled with a factor 10 before combination to account for intensity differences. For illustration, Figure 3e shows a B-mode US image resulting from this combination, where an equal echogenicity both in and outside the lumen area was achieved. Figure 3f shows the SoS image that was reconstructed from the resulting echo phase shift maps. Only minor differences are seen between the spatial distribution of reconstructed SoS in this image, compared to the one obtained with full-Rx CUTE alone (Figure 2d).

4. Discussion and conclusion

The first part of this study shows that the conventional Tx-steering approach can be substituted by the less time-consuming full-Rx approach (see Figure 2). Consequently, the spatial distribution of SoS in and around the lumen-mimicking inclusion shows only minor differences between the two approaches. These differences, as well as the small SoS offset of −8 m/s of the full-Rx compared to the Tx approach, can be attributed to remaining experimental differences, for example, due to the different way that the transducer’s piezoelectric elements couple to the acoustic lens upon reception compared to upon transmission.
To avoid echo decorrelation due to blood flow, an in vivo scenario requires a short acquisition time and thus a low number of Tx angles. A low number of Tx angles, however, increases tissue clutter, which obscures blood echoes. The second part of the study (see Figure 3) demonstrates that a reduction of acquisition time is possible with simultaneously reduced clutter if using the fast-Rx subtraction approach: Echo phase tracking inside the lumen becomes possible using only 5 Tx angles. The combination of this data with full-Rx data from outside the lumen results in a correct SoS image, in the sense that it agrees with the one obtained with full-Rx CUTE alone.
A clinical situation, however, differs from the presented phantom study in several aspects, which require attention when aiming at an in vivo implementation of the proposed technique:
  • In the phantom, the simulated flow speed was identical across the lumen cross section. In an in vivo scenario, blood in the centre of the lumen moves faster than blood near the periphery. So, a simple subtraction would lead to nonuniform echo strength, converging to zero towards the vessel wall. The subtraction corresponds to a linear ramp filter in the frequency domain of the “slow” time axis (repetitions of acquisitions). To achieve a more uniform echo level, one may make use of wall filters, similar to what is used in Doppler flow imaging.
  • In an in vivo scenario, the background tissue is not perfectly stationary due to the pulsating blood flow, which will lead to residual “stationary” clutter inside the vessel lumen even after subtraction. One strategy to minimise motion is by choosing an optimum timing of the fast-Rx acquisitions in between successive heart beats. This can be achieved by synchronising the acquisition with a motion-detection algorithm or an electrocardiogram. A different and complementary strategy is motion tracking and motion compensation before subtraction or wall filtering.
  • The low signal-to-noise ratio (SNR) of blood echoes can produce phase noise and thus artefacts in the SoS reconstruction. SNR can be improved by repeating the fast-Rx acquisition multiple times, similar to what is done in Doppler flow imaging, and averaging the phase correlation maps before determining the echo phase shift.
  • In our present study, lumen motion occurred only in between repetitions, but not during a single acquisition sequence. In an in vivo situation, blood flow occurs during the few plane wave transmissions of each single fast-Rx acquisition sequence. Even though the number of Tx angles is short enough that echo decorrelation does not occur, the blood motion will add a phase shift bias. One strategy to reduce this influence is to invert the Tx angle sequence in successive fast-Rx acquisitions, so that the phase shift due to blood flow cancels out in the final average phase shift.
The spatial resolution to be expected is limited by the bandwidth of the probe (7–12 MHz, corresponding to ~0.15 mm) and element pitch (0.19 mm). It is, however, further reduced by the averaging kernel size for the phase tracking, in a trade-off between spatial resolution and contrast resolution. In this study, the kernel size used was 1 mm × 1 mm. Even if the lipid pool size is below the spatial resolution, it might still be visualised by the SoS measurement due to its contrast. More experiences with realistic phantoms/volunteers are, however, needed to assess the final resolution in the abovementioned trade-off.
In summary, the developed technique is a key step towards imaging the SoS inside arteries, in spite of blood flow and tissue clutter that obscure the hypoechoic blood echoes. This becomes possible via shortening the length of the acquisition sequence and via reducing stationary clutter using the subtraction approach. Whereas the envisaged goal of this study was to enable imaging the SoS inside the carotid artery, the developed technique may have further importance, for example, for the assessment of iliac artery stenosis or in liver imaging for reducing SoS artefacts that occur around the hepatic veins, vena cava, portal vein, and the hepatic artery.

Author Contributions

Conceptualisation, M.J; methodology, M.K., P.S. and J.-W.M.; software, M.K. and M.J.; validation, M.K.; formal analysis, M.J.; investigation, M.K., P.S. and J.-W.M.; resources, P.S. and M.F.; data curation, M.J.; writing—original draft preparation, M.K.; writing—review and editing, M.J., M.F., J.-W.M.; visualisation, M.K.; supervision, M.J.; project administration, M.F.; funding acquisition, M.F.

Funding

This research has received funding in part from the Swiss National Science Foundation (No. 205320_179038/1), from the European Union’s Horizon 2020 research and innovation programme under grant agreement No 731771, and from the Photonics Private Public Partnership, and is supported by the Swiss State Secretariat for Education, Research and Innovation (SERI) under contract number 16.0160.

Acknowledgments

The authors like to thank Matthew O’Donnell (University of Washington, Seattle, WA, USA) for fruitful discussions.

Conflicts of Interest

The authors declare no conflict of interest. The funders had no role in the design of the study; in the collection, analyses, or interpretation of data; in the writing of the manuscript; or in the decision to publish the results.

References

  1. Kato, K.; Sugimoto, H.; Kanazumi, N.; Nomoto, S.; Takeda, S.; Nakao, A. Intra-operative application of real-time tissue elastography for the diagnosis of liver tumours. Liver Int. 2008, 28, 1264–1271. [Google Scholar] [CrossRef] [PubMed]
  2. Bercoff, J.; Tanter, M.; Fink, M. Supersonic shear imaging: A new technique for soft tissue elasticity mapping. IEEE Trans. Ultrason. Ferroelectr. Freq. Control 2004, 51, 396–409. [Google Scholar] [CrossRef] [PubMed]
  3. Hall, T.J.; Zhu, Y.; Spalding, C.S. In vivo real-time freehand palpation imaging. Ultrasound Med. Biol. 2003, 29, 427–435. [Google Scholar] [CrossRef]
  4. Shiina, T.; Nitta, N.; Ueno, E.I.; Bamber, J.C. Real time tissue elasticity imaging using the combined autocorrelation method. J. Med. Ultrason. 2002, 26, 57–66. [Google Scholar] [CrossRef] [PubMed]
  5. Laufer, J.; Delpy, C.; Elwell, P.; Beard, P. Quantitative spatially resolved measurement of tissue chromophore concentrations using photoacoustic spectroscopy: Application to the measurement of blood oxygenation and haemoglobin concentration. Phys. Med. Biol. 2007, 52, 141–168. [Google Scholar] [CrossRef] [PubMed]
  6. Held, K.G.; Jaeger, M.; Ricka, J.; Frenz, M.; Akarcay, H.G. Multiple irradiation sensing of the optical effective attenuation coefficient for spectral correction in handheld OA imaging. Photoacoustics 2016, 4, 70–80. [Google Scholar] [CrossRef] [PubMed] [Green Version]
  7. Cox, B.; Laufer, J.G.; Arridge, S.R.; Beard, P.C. Quantitative spectroscopic photoacoustic imaging: A review. J. Biomed. Opt. 2012, 17, 0612021–06120222. [Google Scholar] [CrossRef]
  8. Jansen, K.; van Soest, G.; van der Steen, A.F.W. Intravascular photoacoustic imaging: A new tool for vulnerable plaque identification. Ultrasound Med. Biol. 2014, 40, 1037–1048. [Google Scholar] [CrossRef]
  9. Wu, M.; Jansen, K.; van der Steen, A.F.W.; van Soest, G. Specific imaging of atherosclerotic plaque lipids with two-wavelength intravascular photoacoustics. Biomed. Opt. Exp. 2015, 6, 3276–3286. [Google Scholar] [CrossRef] [Green Version]
  10. Weber, J.; Beard, P.C.; Bohndiek, S.E. Contrast agents for molecular photoacoustic imaging. Nat. Methods 2016, 13, 639–650. [Google Scholar] [CrossRef] [Green Version]
  11. Niederhauser, J.J.; Jaeger, M.; Lemor, R.; Weber, P.; Frenz, M. Combined ultrasound and optoacoustic system for real-time high-contrast vascular imaging in vivo. IEEE Trans. Med. Imaging 2005, 24, 436–440. [Google Scholar] [CrossRef] [PubMed]
  12. Daoudi, K.; van den Berg, P.J.; Rabot, O.; Kohl, A.; Tisserand, S.; Brands, P.; Steenbergen, W. Handheld probe integrating laser diode and ultrasound transducer array for ultrasound/photoacoustic dual modality imaging. Opt. Express 2014, 22, 26365–26374. [Google Scholar] [CrossRef] [PubMed]
  13. Singh, M.K.A.; Steenbergen, W.; Manohar, S. Handheld probe-based dual mode ultrasound/photoacoustics for biomedical imaging. In Frontiers in Biophotonics for Translational Medicine; Springer: Singapore, 2016; pp. 209–247. [Google Scholar]
  14. Laufer, J.; Johnson, P.; Zhang, E.; Treeby, B.; Cox, B.; Pedley, B.; Beard, P. In vivo preclinical photoacoustic imaging of tumor vasculature development and therapy. J. Biomed. Opt. 2012, 17, 0560161–0560168. [Google Scholar] [CrossRef] [PubMed]
  15. Toi, M.; Asao, Y.; Matsumoto, Y.; Sekiguchi, H.; Yoshikawa, A.; Takada, M.; Kataoka, M.; Endo, T.; Kawaguchi-Sakita, N.; Kawashima, M.; et al. Visualization of tumor-related blood vessels in human breast by photoacoustic imaging system with a hemispherical detector array. Sci. Rep. 2017, 7, 41970. [Google Scholar] [CrossRef] [PubMed] [Green Version]
  16. Sarvazyan, A.P.; Urban, M.W.; Greenleaf, J.F. Acoustic waves in medical imaging and diagnostics. Ultrasound Med. Biol. 2013, 39, 1133–1146. [Google Scholar] [CrossRef]
  17. Bamber, J.C.; Hill, C.R.; King, J.A. Acoustic properties of normal and cancerous human liver-II Dependence on tissue structure. Ultrasound Med. Biol. 1981, 7, 135–144. [Google Scholar] [CrossRef]
  18. Greenleaf, J.F.; Bahn, R.C. Clinical imaging with transmissive ultrasonic computerized tomography. IEEE Trans. Biomed. Eng. 1981, 28, 177–185. [Google Scholar] [CrossRef]
  19. Carson, P.; Meyer, C.; Scherzinger, A.; Oughton, T. Breast imaging in coronal planes with simultaneous pulse-echo and transmission ultrasound. Science 1981, 214, 1141–1143. [Google Scholar] [CrossRef]
  20. Scherzinger, A.; Belgam, R.; Carson, P.; Meyer, C.; Sutherland, J.; Bookstein, F.; Silver, T. Assessment of ultrasonic computed tomography in symptomatic breast patints by discriminant analysis. Ultrasound Med. Biol. 1989, 15, 21–28. [Google Scholar] [CrossRef]
  21. Duric, N.; Littrup, P.; Poulo, L.; Babkin, A.; Pevzner, R.; Holsapple, E.; Rama, O.; Glide, C. Detection of breast cancer with ultrasound tomography: First results with the computed ultrasound risk evaluation (CURE) prototype. Med. Phys. 2007, 34, 773–785. [Google Scholar] [CrossRef]
  22. Wiskin, J.; Borup, D.; Johnson, S.; Berggren, M. Non-linear inverse scattering: High resolution quantitative breast tissue tomography. J. Acoust. Soc. Am. 2012, 131, 3802–3813. [Google Scholar] [CrossRef] [PubMed]
  23. Nebeker, J.; Nelson, T.R. Imaging of sound speed using reflection ultrasound tomography. J. Ultrasound Med. 2012, 31, 1389–1404. [Google Scholar] [CrossRef] [PubMed]
  24. Ruiter, N.V.; Zapf, M.; Dapp, R.; Hopp, T.; Kaiser, W.A.; Gemmeke, H. First results of a clinical study with 3D ultrasound computer tomography. In Proceedings of the 2013 IEEE International Ultrasonics Symposium (IUS), Prague, Czech Republic, 21–25 July 2013. [Google Scholar]
  25. Zografos, G.; Liakou, P.; Koulocheri, D.; Liovarou, I.; Sofras, M.; Hadjiagapis, S.; Orme, M.; Marmarelis, V. Differentiation of BIRADS-4 small breast lesions via multimodal ultrasound tomography. Eur. Radiol. 2015, 25, 410–418. [Google Scholar] [CrossRef] [PubMed]
  26. Robinson, D.E.; Ophir, J.; Wilson, L.S.; Chen, C.F. Pulse-echo ultrasound speed measurements: Progress and prospects. Ultrasound Med. Biol. 1991, 17, 633–646. [Google Scholar] [CrossRef]
  27. Shin, H.-C.; Prager, R.; Gomersall, H.; Kingsbury, N.; Treece, G.; Gee, A. Estimation of average speed of sound using deconvolution of medical ultrasound data. Ultrasound Med. Biol. 2010, 36, 623–636. [Google Scholar] [CrossRef] [PubMed]
  28. Anderson, M.E.; Trahey, G.E. The direct estimation of sound speed using pulse-echo ultrasound. J. Acoust. Soc. Am. 1998, 104, 3099–3106. [Google Scholar] [CrossRef] [PubMed]
  29. Jaeger, M.; Held, G.; Peeters, S.; Preisser, S.; Grünig, M.; Frenz, M. Computed ultrasound tomography in echo mode for imaging speed of sound using pulse-echo sonography: Proof of principle. Ultrasound Med. Biol. 2015, 41, 235–250. [Google Scholar] [CrossRef]
  30. Jaeger, M.; Robinson, E.; Akarçay, H.; Frenz, M. Full correction for spatially distributed speed-of-sound in echo ultrasound based on measuring aberration delays via transmit beam steering. Phys. Med. Biol. 2015, 60, 4497–4515. [Google Scholar] [CrossRef] [Green Version]
  31. Jaeger, M.; Frenz, M. Quantitative imaging of speed of sound in echo ultrasonography. In Proceedings of the IEEE International Ultrasound Symposium 2015, Taipei, Taiwan, 23 October 2015. [Google Scholar]
  32. Lukanova, D.; Nikolov, N.; Genova, K.; Stankev, M.; Georgieva, E. The accuracy of noninvasive imaging techniques in diagnosis of carotid plaque morphology. Maced. J. Med. Sci. 2015, 3, 224–230. [Google Scholar] [CrossRef] [Green Version]
  33. Park, T. Evaluation of carotid plaque using ultrasound imaging. J. Cardiovasc. Ultrasound 2016, 24, 91–95. [Google Scholar] [CrossRef]
  34. Störk, S.; Feelders, R.A.; van den Beld, A.W.; Steyerberg, E.W.; Savelkoul, H.F.J.; Lamberts, S.W.J.; Grobbee, D.E.; Bots, M.L. Prediction of mortality risk in the elderly. Am. J. Med. 2006, 119, 519–525. [Google Scholar] [CrossRef] [PubMed]
  35. Steinl, D.C.; Kaufman, B.A. Ultrasound imaging for risk assessment in atherosclerosis. Int. J. Mol. Sci. 2015, 16. [Google Scholar] [CrossRef] [PubMed]
  36. Schulte-Altedorneburg, G.; Droste, D.; Haas, N.; Kemény, V.; Nabavi, D.; Füzesi, L.; Ringelstein, E. Preoperative B-mode ultrasound plaque appearance compared with carotid endarterectomy specimen histology. Acta Neurol. Scand. 2000, 101, 188–194. [Google Scholar] [CrossRef] [PubMed]
  37. Reiter, M.; Horvat, R.; Puchner, S.; Rinner, W.; Polterauer, P.; Lammer, J.; Minar, E.; Bucek, R.A. Plaque imaging of the internal carotid artery—Correlation of B-flow imaging with histopathology. AJNR 2007, 28, 122–126. [Google Scholar] [PubMed]
  38. Tanter, M.; Fink, M. Ultrafast imaging in biomedical ultrasound. IEEE Trans. Ultrason. Ferroelectr. Freq. Control 2014, 61, 102–119. [Google Scholar] [CrossRef] [PubMed]
  39. Loupas, T.; Powers, J.T.; Gill, R.W. An axial velocity estimator for ultrasound blood flow imaging, based on a full evaluation of the Doppler equation by means of a two-dimensional autocorrelation approach. IEEE Trans. Ultrason. Ferroelectr. Freq. Control 1995, 42, 672–688. [Google Scholar] [CrossRef]
Figure 1. Photograph of the phantom, indicating the location of the imaging plane, I (cross section of the phantom). The artery-mimicking cylindrical inclusion, C, could be manually moved by moving the handle, H.
Jimaging 04 00145 g001
Figure 2. Comparison of conventional Tx and full-Rx steering. (a) Phase shift maps from Tx steering; (b) Phase shift maps from full-Rx steering; (c) speed-of-sound (SoS) image (cross section) from Tx steering; (d) SoS image (cross section) from full-Rx steering. Note the −8 m/s difference between the color scales in (c) and (d).
Jimaging 04 00145 g002
Figure 3. (a) Phase shift maps from the fast-Rx approach alone; (b) SoS image obtained from the fast-Rx approach without subtraction. The strong clutter artefacts lead to erroneous spatial SoS reconstruction; (c) B-mode US image from full-Rx data; (d) B-mode US image from subtracted fast-Rx data; (e) Combined B-mode US image; (f) SoS image from combined data. Note that in (c) to (e), the dB scale is normalised to the maximum intensity level in each image.
Jimaging 04 00145 g003
Table 1. Experimental parameters used for transmit (Tx) and receive (Rx) beam-steering.
Tx SteeringFull Rx Fast Rx
Tx anglesΦ = −25°:2.5°:25°Φ = 0°Φ = 0°
Tx apertureΦrad = 2.5°, 0.5° stepsΦrad = 5°, 0.5° stepsΦrad = 5°, 2.5° steps
Rx anglesΨ = 0°Ψ = −25°:2.5°:25°Ψ = −25°:2.5°:25°
Rx apertureΨrad = 5°Ψrad = 2.5°Ψrad = 2.5°
CUTE anglesΦcute = −25°:10°:25°Ψcute = −25°:10°:25°Ψcute = −25°:10°:25°
Total acquisition time3.5 ms0.7 ms0.2 ms

