1. Introduction
Ultrasound images are known to have poor signal-to-noise ratio, yet they are low cost non-invasive techniques in diagnostic radiology and hence extensively used in clinical applications. Several new ultrasound image analysis algorithms are currently being researched for noise reduction [
1,
2,
3], segmentation [
4], registration and volume reconstruction [
5]. Online ultrasound image databases are now becoming increasingly available and this has greatly benefitted researchers in obtaining reference images for testing and evaluating algorithms [
5,
6,
7].
The speckle noise in ultrasound images degrades the fine details and edge definitions, and limits the contrast resolution by making it difficult to detect small and low contrast lesions in the body. Therefore, algorithms for ultrasound image filtering and analysis primarily focus on the characteristics of speckle noise and try to minimize its effects on image interpretation [
8]. To analyse the effectiveness or accuracy of speckle reduction techniques, it is necessary to add controlled noise to ideal noiseless images [
2]. In the absence of such noiseless ground truth images, the evaluation of despeckling algorithms is usually done by generating highly artificial gray tone patterns (stripes, rings etc.), or by using standard image sets (Lena, Mandrill etc.) that bear no resemblance with ultrasound image characteristics. This paper addresses the need for generating accurate synthetic models of ultrasound image formation for applications in speckle noise analysis. A synthetic ultrasound image can be sampled using a configuration of points that correspond to either linear or sector scan modes of ultrasound imaging, and interpolated later after generating speckle noise at the sampled points to obtain visually realistic effects. Synthetic images can therefore be used to generate simulated ultrasound images with a wide range of image and noise characteristics useful for filtering methods and noise analysis.
Statistical and empirical methods of generating speckle lack realism since several important characteristics of the image acquisition models are often ignored. There are only very limited algorithms reported in literature for speckle simulation based on image acquisition modeling. Perreault and Auclair-Fortier [
9] proposed an efficient simulation model of ultrasound images based on a radial-polar configuration of sampling points and a speckle noise simulation algorithm. We extend their work by considering different types of sampling and interpolation schemes and by performing detailed experimental analysis to compare their effectiveness in producing realistic speckle simulation. Their work used images of Lena and Barbara as the basis for generating sectoral images with speckle noise to demonstrate the outputs of their algorithm. However, for generating highly realistic synthetic models, we require images that have texture features and intensity characteristics that closely match the features of real ultrasound images. We would like to emphasize here that the goal of the research work presented in the paper is not to develop an image synthesis system for generating images that could be used in place of real ultrasound images. The proposed system is designed as a versatile framework allowing several parameter variations that could be beneficial for researchers in generating images with texture and noise characteristics closely matching the features of real ultrasound images. Therefore, a very important aspect of synthetic image modeling algorithms is quality assessment. In the proposed method, the base synthetic image is modified as outlined above using the acquisition model, speckle noise simulation and interpolation of the sampled points. Second order texture feature analysis using Gray level co-occurrence matrix (GLCM) has been already performed in our recently proposed work [
10], where we felt the need for more robust texture descriptors that would show consistent behavior with variation of image quality induced by changes in the modeling parameters. This paper addresses this problem by considering local binary patterns (LBP) for representing the texture content in the images. To the authors’ knowledge, no prior work has been reported on image texture feature based quality assessment of realistic synthetic ultrasound images using local binary patterns. In this paper, the quality of the generated synthetic image texture features are analyzed using LBP [
11,
12], and correlated with subjective evaluation scores assigned by clinicians. Our paper address this main gap in the area of performance evaluation of denoising algorithms where methods for generating ground truth data having the important texture and noise characteristics of real ultrasound images are not currently available. This proposed framework also allows noise to be added in a controlled way which is essential for evaluation using quality metrics.
The paper presents the complete framework for the development of synthetic ultrasound images including the set of processes in both simulation and evaluation stages. It also presents the results of an exhaustive experimental analysis of texture features using LBP for each of the three sampling methods. The presented results clearly show the usefulness of LBP in accurately characterizing the texture features and therefore the overall quality of modelled synthetic images. This paper is organized as follows: The next section gives a brief outline of the images used and the methods in the processing pipeline.
Section 3 describes the simulation model in detail.
Section 4 presents the synthetic ultrasound images with variations of modeling parameters.
Section 5 gives an overview of local binary patterns.
Section 6 presents experimental results and their evaluations using LBP.
Section 7 gives a summary of the work presented in the paper and outlines future directions.
2. Materials and Methods
For experimental work presented in the paper, the reference images of real ultrasound images were sourced from the online ultrasound image gallery [
7]. These are ultrasound scans of the liver, and have very similar image features, intensity distribution and noise content.
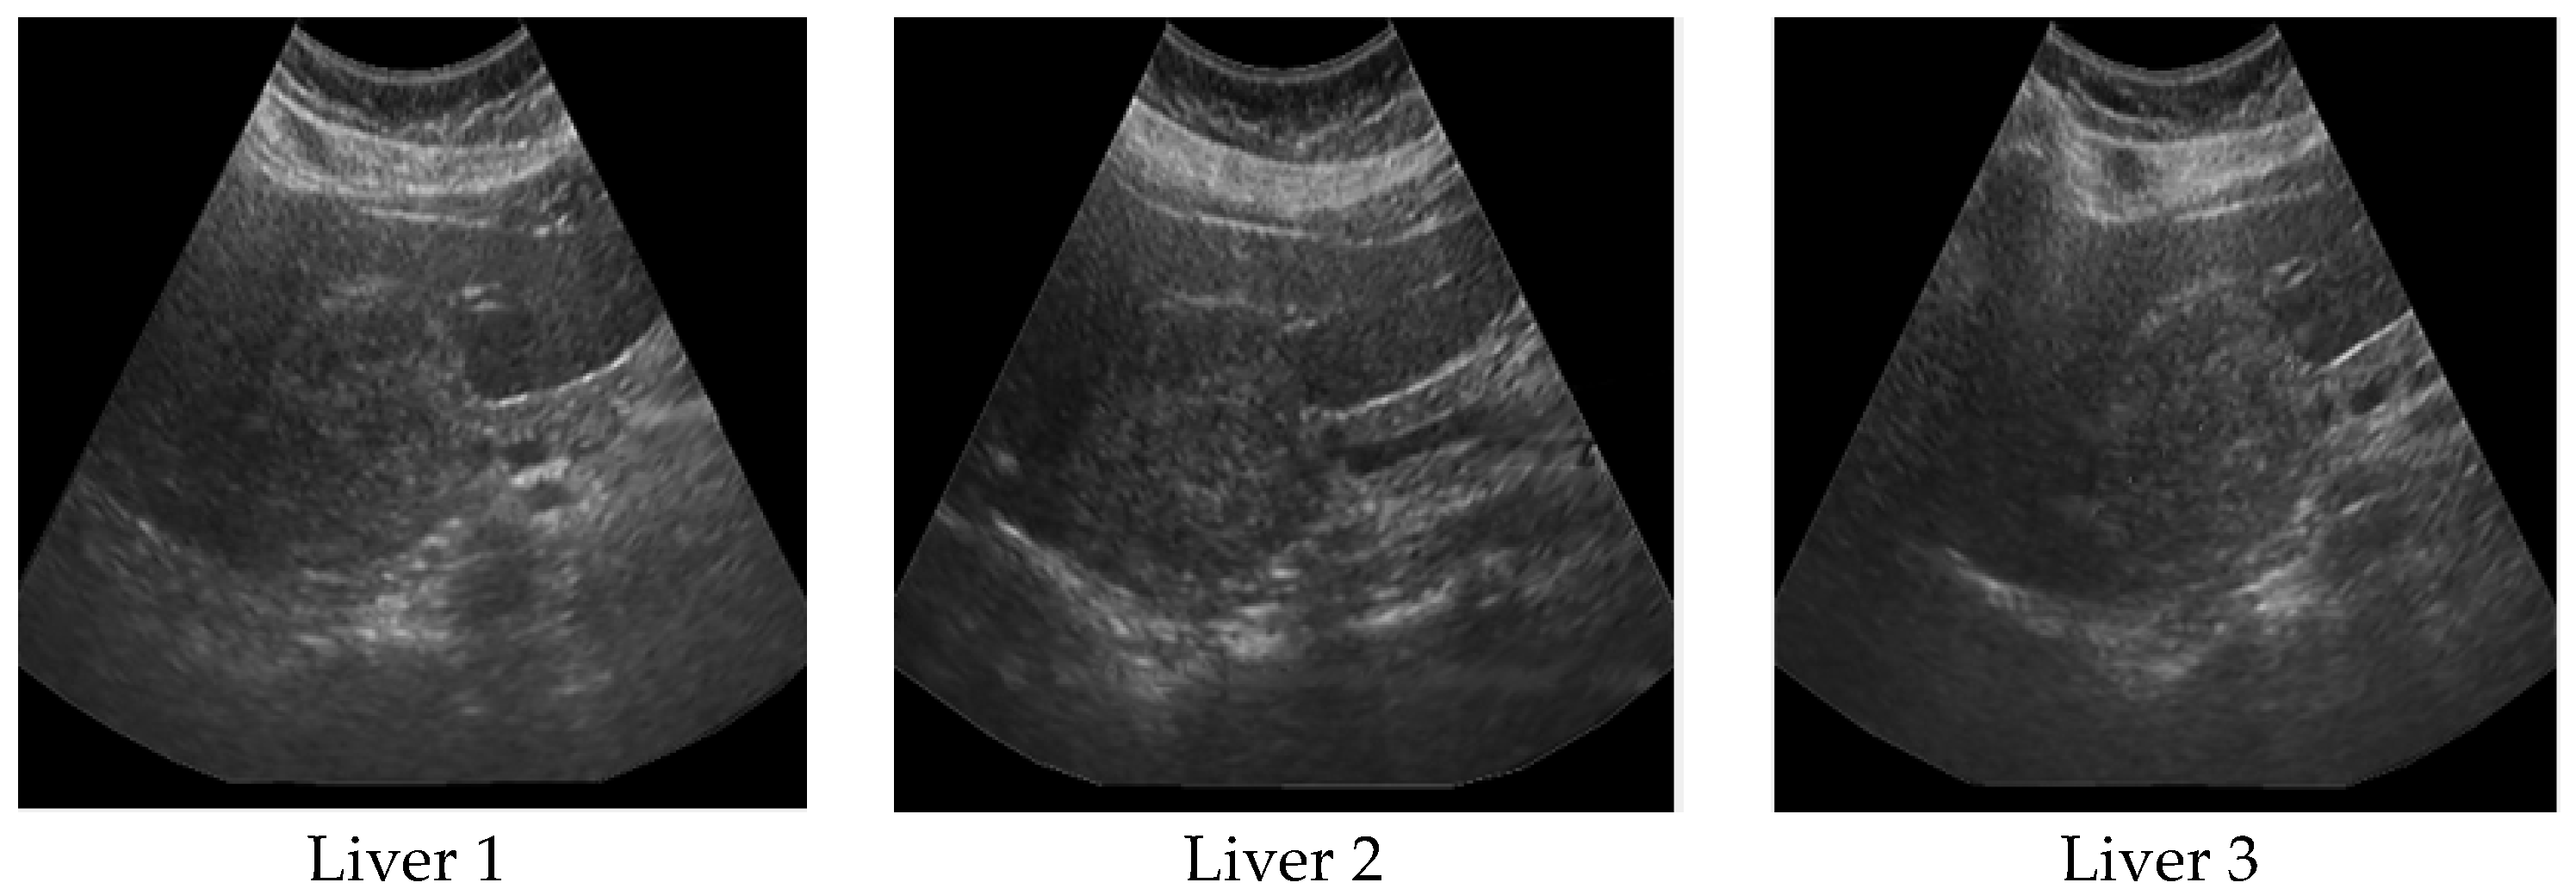
Figure 1 shows three such reference images. The texture features extracted from these images will be compared in later sections with those of the generated synthetic images.
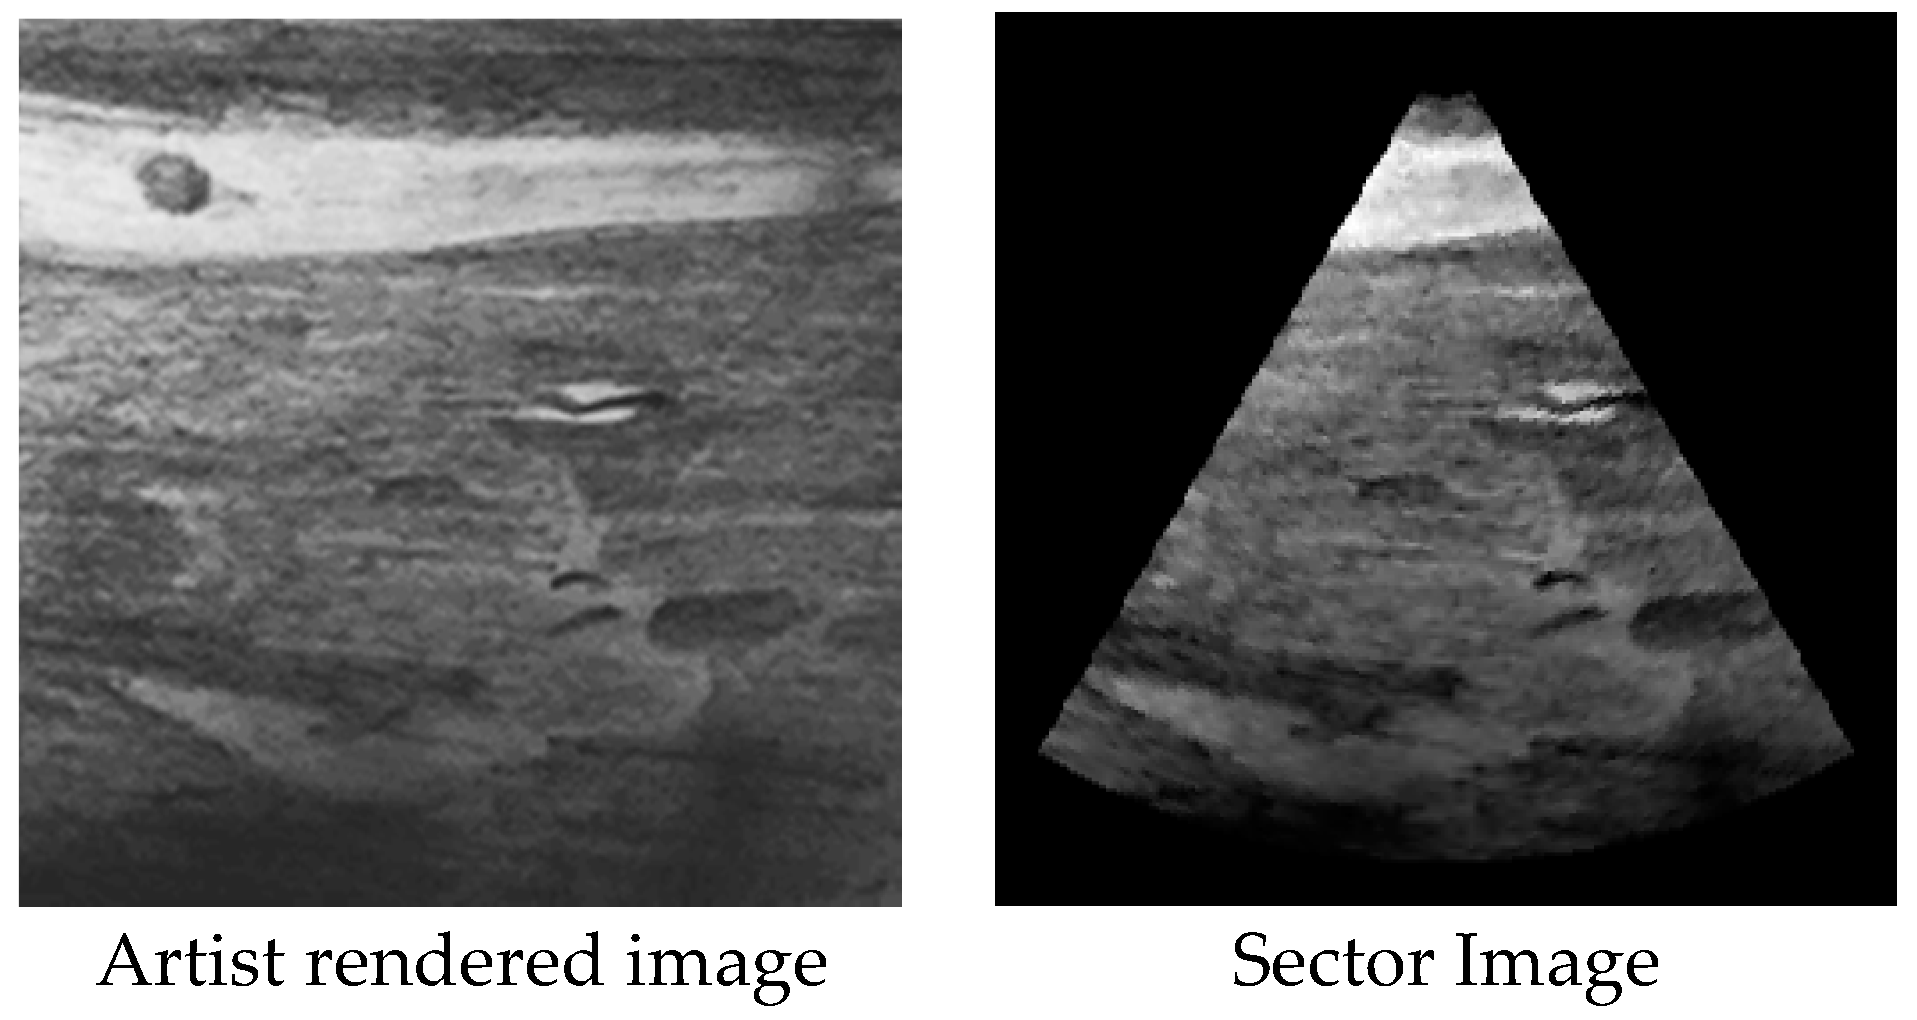
The important visual features of the three reference images in
Figure 1 were considered by an artist to render a base image as shown in
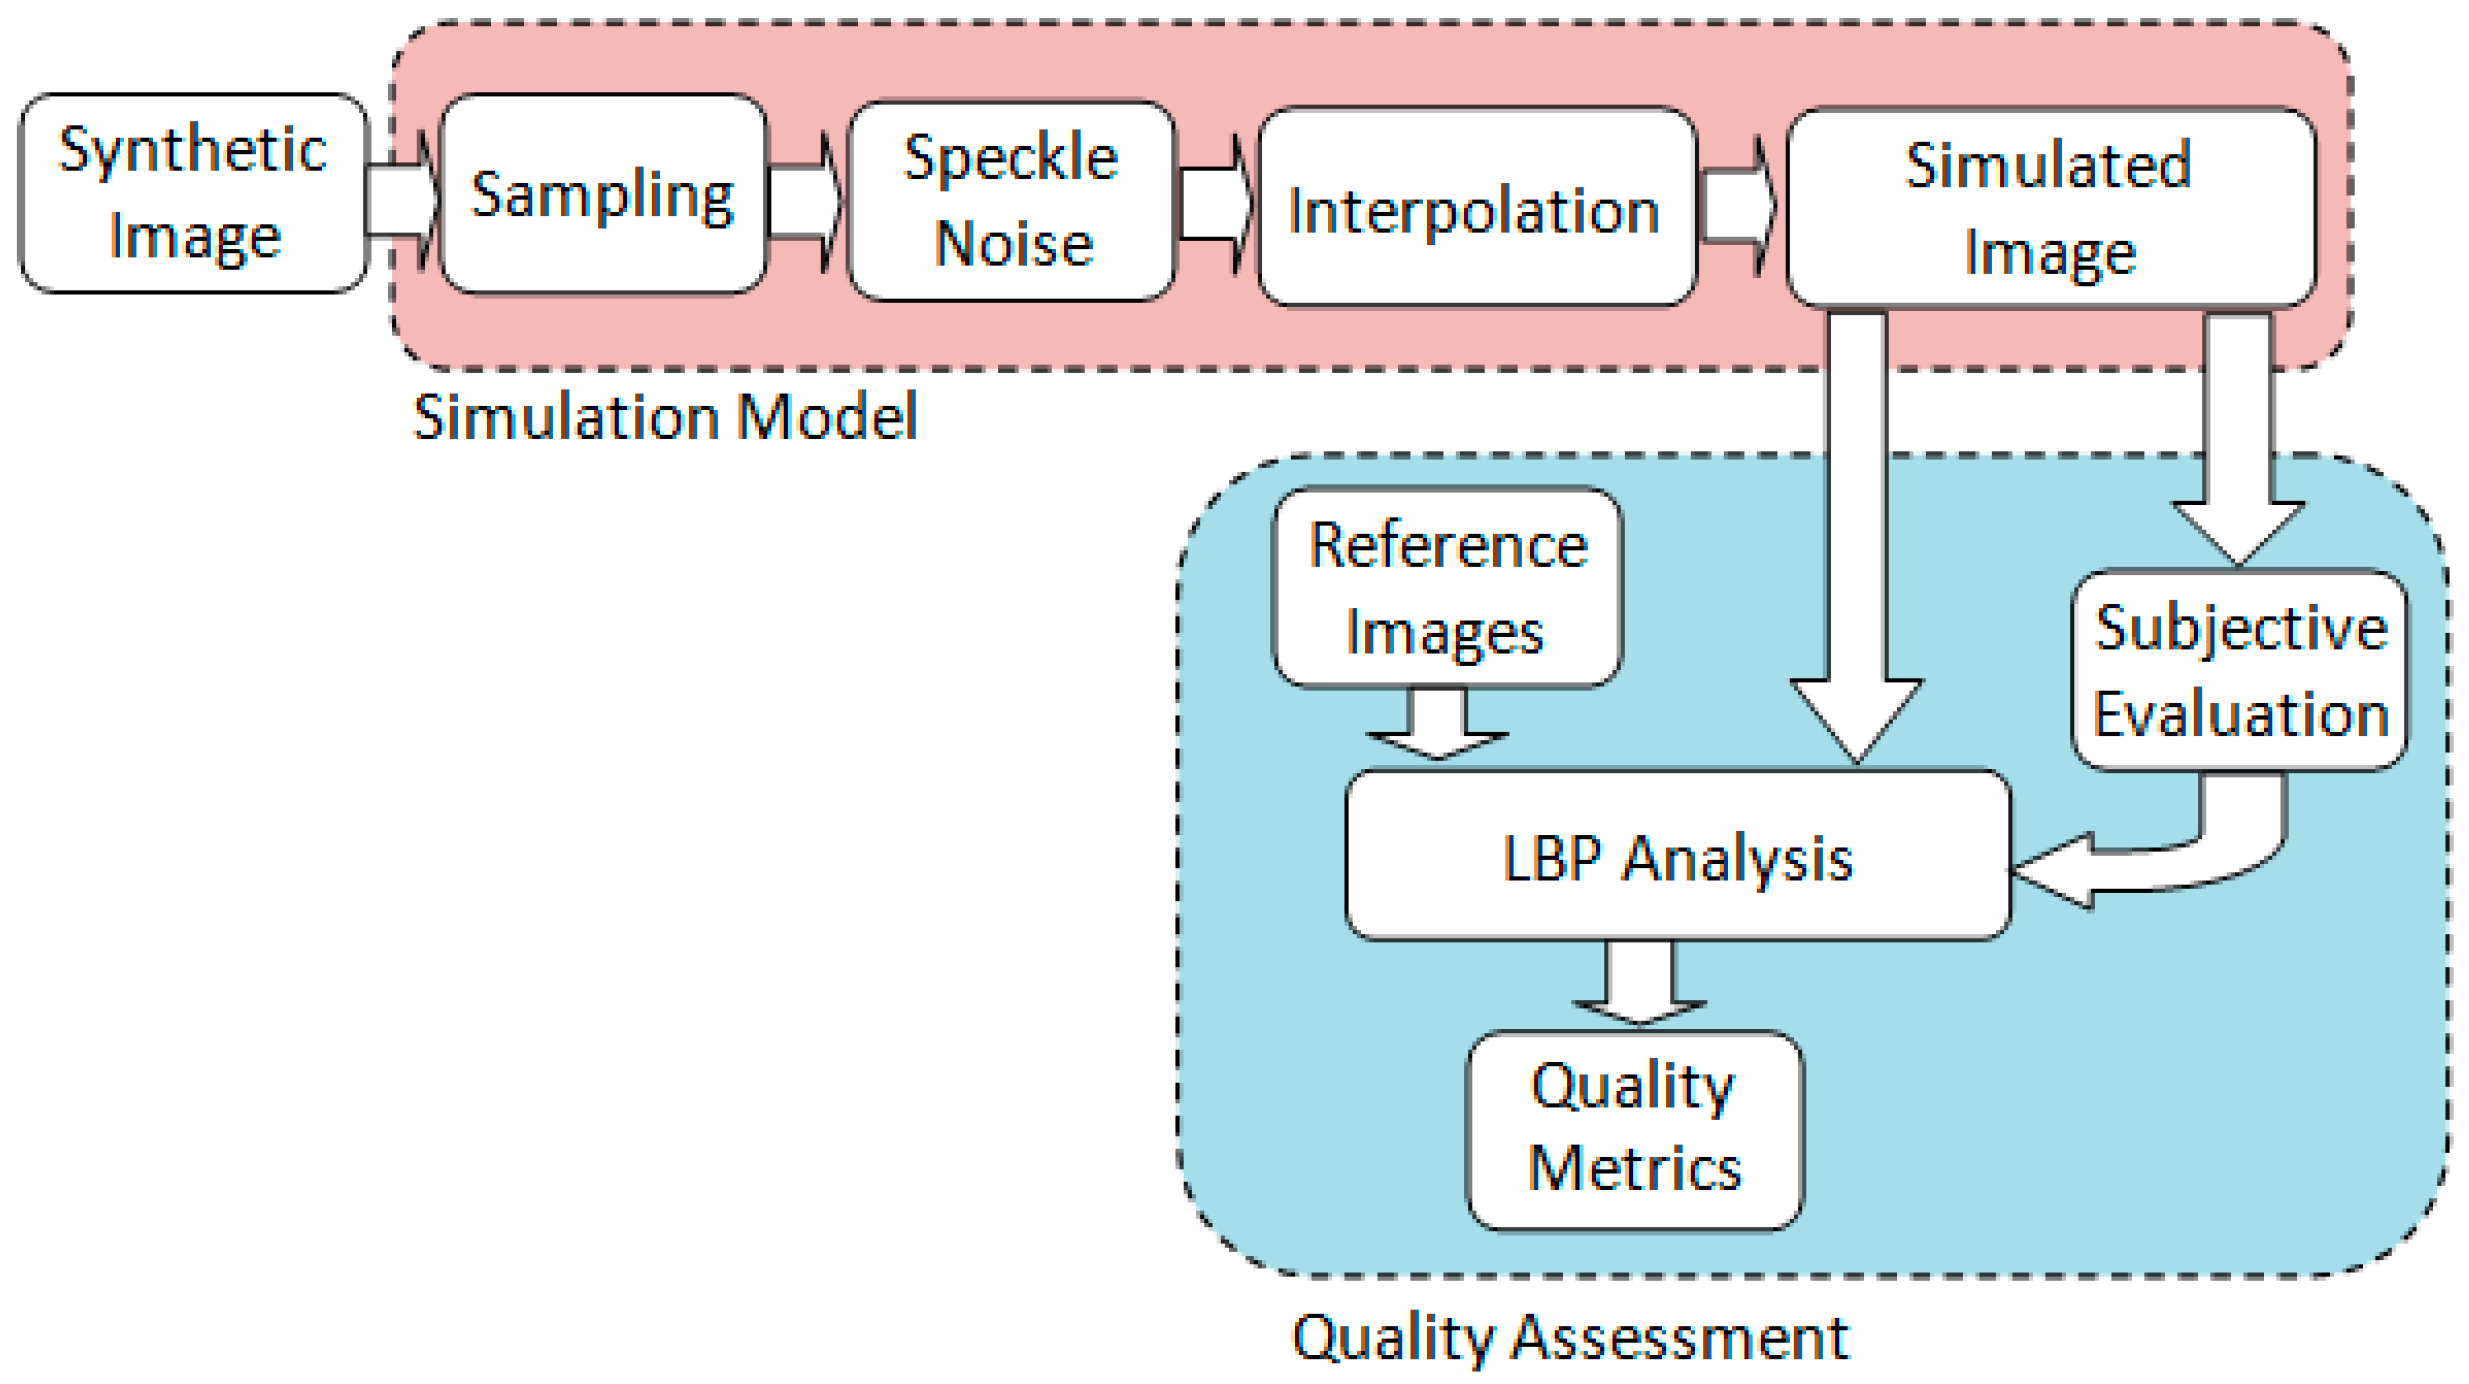
Figure 2. This image is used as the input to the simulation pipeline shown in
Figure 3.
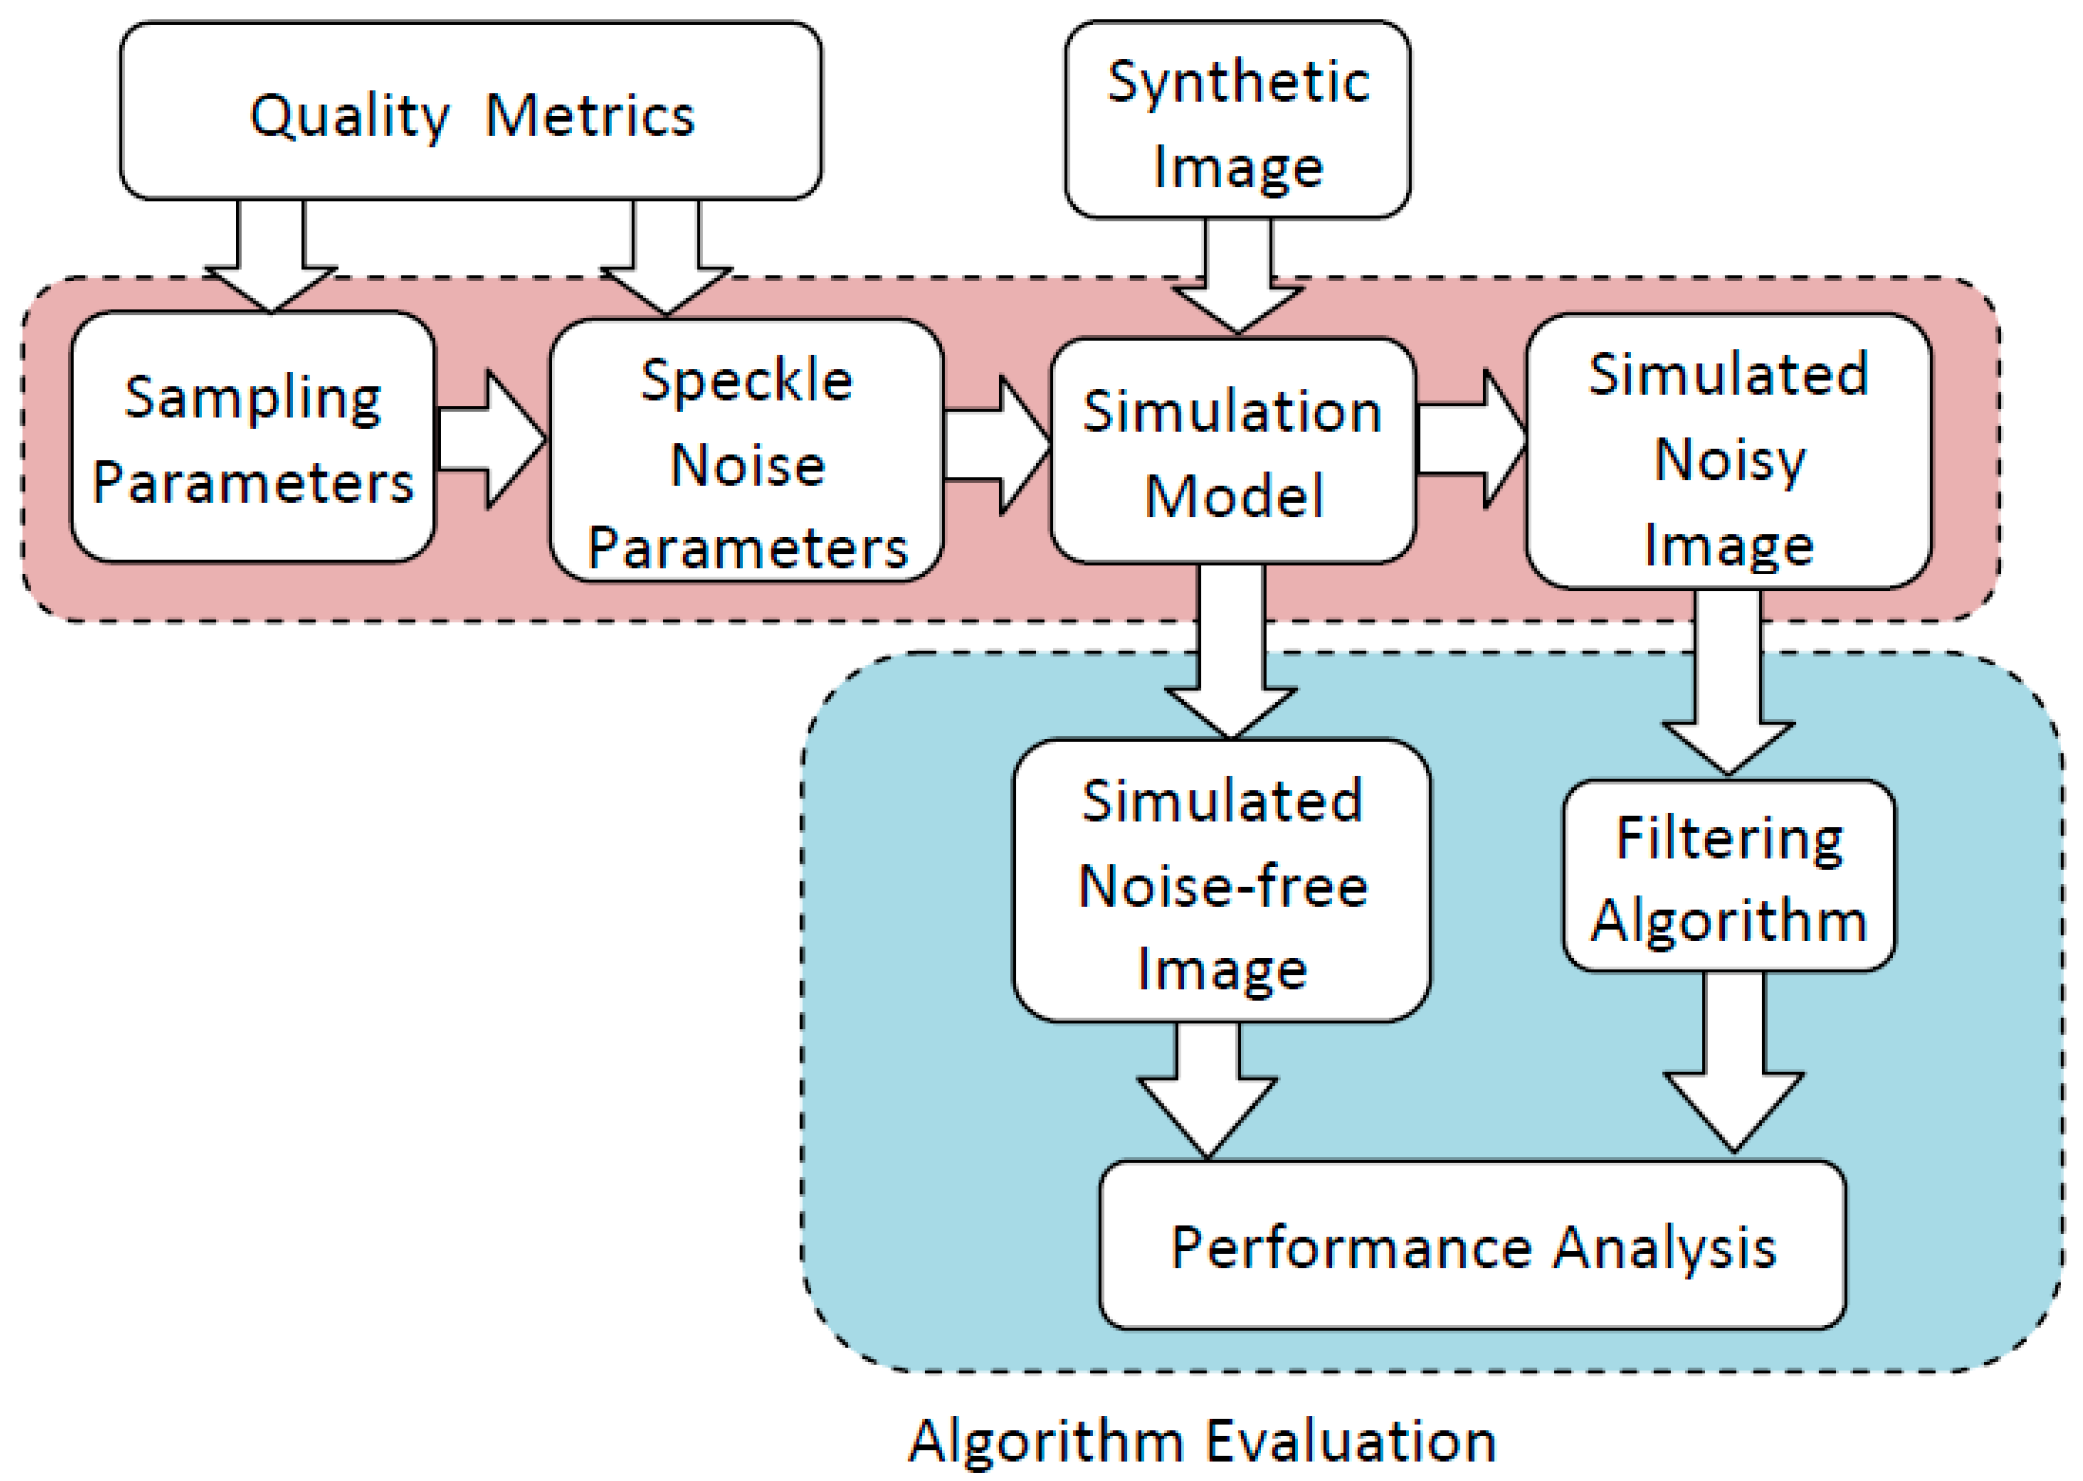
The main methods used in the speckle simulation modeling and evaluation pipeline are depicted in
Figure 3. Within the simulation model, the synthetic image is first sampled based on an acquisition model, speckle noise is then generated at the sampled points, and an interpolation algorithm used to fill the sector scan region. The evaluation model uses image quality metrics computed for the output are then compared with those of the reference ultrasound images for a quantitative assessment of the quality of the final synthetic images. A subjective evaluation is also performed using expert sonographers. In consideration of subjective evaluation, texture feature analysis is performed using local binary patterns in order to validate subjective assessment and equate results to human perception of texture.
The processing stages within the simulation model are further elaborated in the next section.
3. The Modeling and Speckle Simulation
The first stage of the sampling model is the method that generates a set of points at a coarse spatial resolution. The configuration of points models the loss of resolution of the ultrasound image due to pulse length, and also the scanning mode (sector or linear). One of the original contributions in this field is the paper by Perreault and Auclair-Fortier [
9], where a radial-polar sampling model was introduced. We extend their work and propose three types of sampling methods called radial-polar, radial-uniform, and uniform grid. The first two are closely related to sector scan, while the third corresponds to a sampling in linear orthogonal directions (
Figure 4).
In
Figure 4, the sector angle is denoted by Φ, and the extent of the sector is given by radial distances
dmin and
dmax. The image width is denoted by
w. We also denote the total number of divisions along each radial line (axial resolution) by
m, and the number of division of the sector angle (lateral resolution) by
n. The Cartesian coordinates of the sampled points for radial-polar sampling are given by
The non-uniform spacing of points in the radial-polar sampling method causes the density of points to increase towards the sector’s apex. The radial-uniform sampling method uses a constant arc length Δ between points along each arc to generate a uniform spacing between points. The equations for this sampling model are same as in Equation (1) except that the polar angle
θ will now depend on both
i and
j as shown below.
In the radial uniform sampling scheme, the parameter equivalent to the lateral resolution
n is the number of sampling points
nu along an arc at distance
di given by
The uniform grid is the simplest sampling model corresponding to a rectangular arrangement of uniformly spaced points with a constant distance
δ between points. Even though the distribution of points does not correspond to a sectoral model, the uniform grid represents the scan geometry of a linear scan system, where the axial beams are parallel to each other. If a sector scan region is required, the points outside the region are clipped using the line equations of the two bounding edges. Using Equation (3), if
f(
x,
y,
θmin) > 0 or
f(
x,
y,
θmax) < 0, the point (
x,
y) is outside the sector region.
More details and implementation aspects of the above three models are given in [
14]. For speckle simulation, we use the method given in [
7]. Their model is based on a complex distribution of incoherent phasors (
u,
v) given by a two-dimensional Gaussian function
gσ. The complex amplitude of each pixel is initialized with the square-root of the sampled intensity value. The number of incoherent phasors
M(
x,
y) at each pixel (
x,
y) is set as the value of a random number under a uniform distribution within a pre-specified range [
a,
b]. The incoherent phasors are generated and added
M times to both the real and imaginary components of the complex value at each pixel. The noisy intensity value is then given by the amplitude of the complex number.
After generating speckle noise at the sampled points, we use an interpolation method to fill the empty space left by the sampling step. In general, the interpolated value at a specified coordinate (
x,
y) of an image
I is computed by grouping the sample values at neighboring pixels (
l,
m) using the following formula [
15]:
where,
φ() denotes a two-dimensional interpolation/synthesis function that provides the weights of the linear combination of sampled intensity values. Commonly used interpolation methods are B-Spline and cubic Hermite [
16,
17]. In [
9], the authors used an interpolation scheme using the Lanczos-3 kernel [
15,
18,
19,
20,
21].
4. Synthetic Ultrasound Images
The framework detailed above provides several options and parametric variations in each stage of the pipeline. As seen in
Section 3, the three sampling methods and three interpolation schemes themselves give nine possible combinations. Each sampling scheme has its own set of parameters that can be varied over a wide range of values. The speckle noise generation algorithm also has a set of statistical parameters governing the noise distribution.
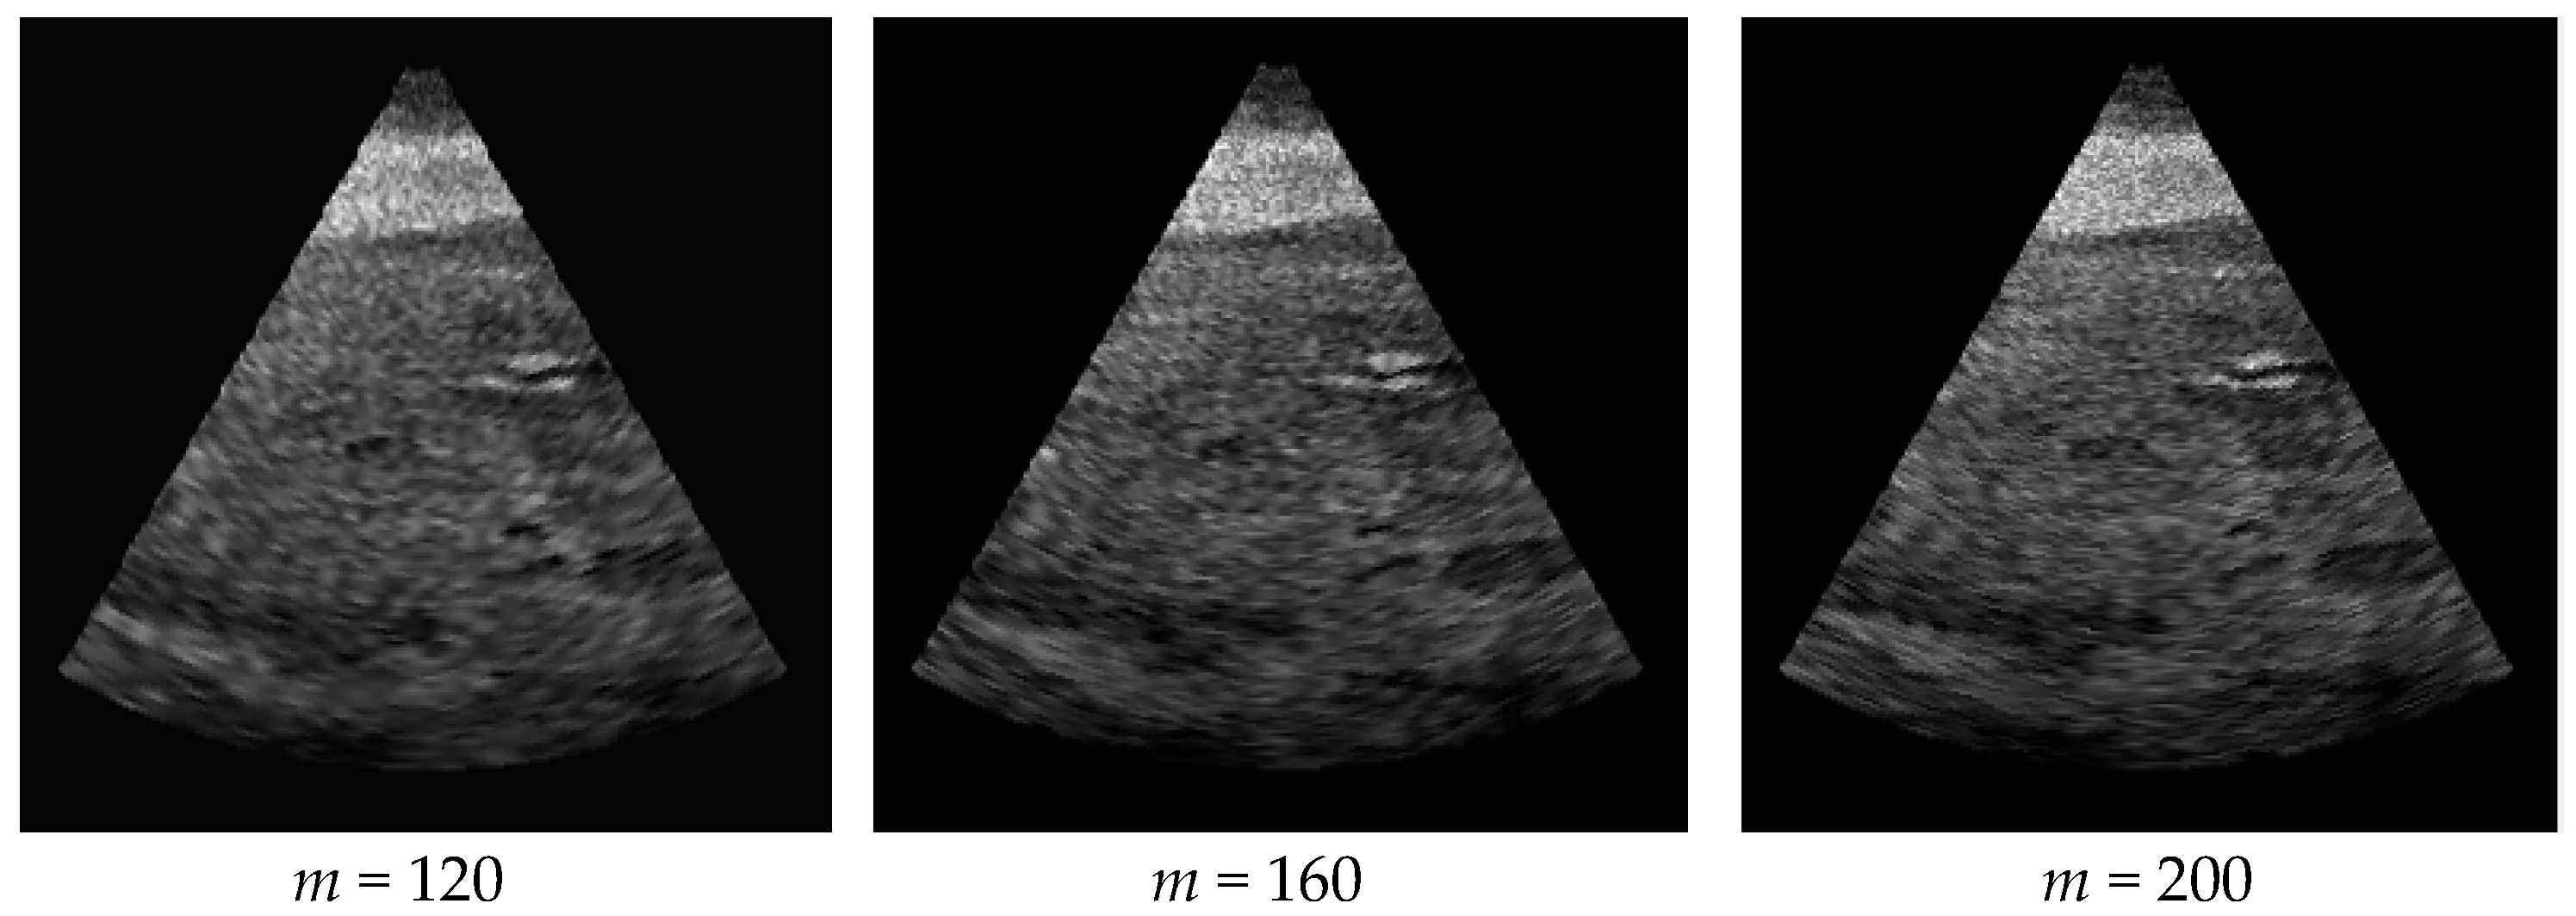
Figure 5 shows the variations when the axial resolution
m is increased in radial-polar sampling, keeping the lateral resolution fixed at
n = 40. The interpolation used was Lanczos-3 [
19]. As the number of sampling points along axial beams is increased, we observe that the sector image becomes smoother and less grainy. When the value of
m is kept increasing with a fixed value for
n, the overall clarity of features diminish because of close proximity of sampling points. Therefore, we need to carefully select the values of
m and
n to obtain the quality of real ultrasound images.
Similar results for radial uniform sampling are shown in
Figure 6.
Some of the commonly found artifacts in simulated images when values of certain parameters become large are shown in
Figure 7. In
Figure 7a, a large value for
m results in a dense, overlapping set of points along beam directions resulting in smoothing/merging of pixels. A similar effect is seen when both
n and
m are large (
Figure 7b). When the
σ value is large in the speckle generation function, the image becomes too grainy with loss of fine details, as in
Figure 7c.
5. Analysis of Texture Features
One of the key requirements in the analysis of image modelling and simulation algorithms that use synthetic data is image quality assessment. Quality measures such as spatial frequency measure (SFM) and spectral activity measures (SAM) are commonly used in the assessment of image quality in the evaluation of compression and noise filtering algorithms [
18]. In our prior work [
13], we used entropy, SFM and SAM to compare the quality of the synthetic images with that of real ultrasound images. From that analysis, it became evident that we need to use higher order texture features to accurately characterize the desirable image properties, and to arrive at a robust set of quality metrics that conform to the subjective evaluations performed by expert clinicians. This paper presents a quality evaluation model using local binary patterns (LBP) and proposes a set of quality metrics (LBP feature values) that can provide consistent results on both synthetic and real ultrasound images. It has also been shown that synthetic images that give minimum feature deviation from real images are the ones that were given the highest subjective evaluation scores by experts, and therefore the proposed feature set contain sufficient information about the required texture features in the input synthetic images. In other words, these quality metrics determine the optimal set of sampling and noise parameters that would produce simulated ultrasound images closely matching the texture features of real ultrasound images. The images generated in this manner could be used to evaluate algorithms for speckle noise filtering (
Figure 8).
5.1. Local Binary Patterns (LBP)
The irregularity and heterogeneity of texture features form the primary characteristics of ultrasound images and therefore play an important role in the assessment of their quality. A powerful texture descriptor that has been successfully applied in the field of medical image analysis is called the Local Binary Pattern (LBP) [
22,
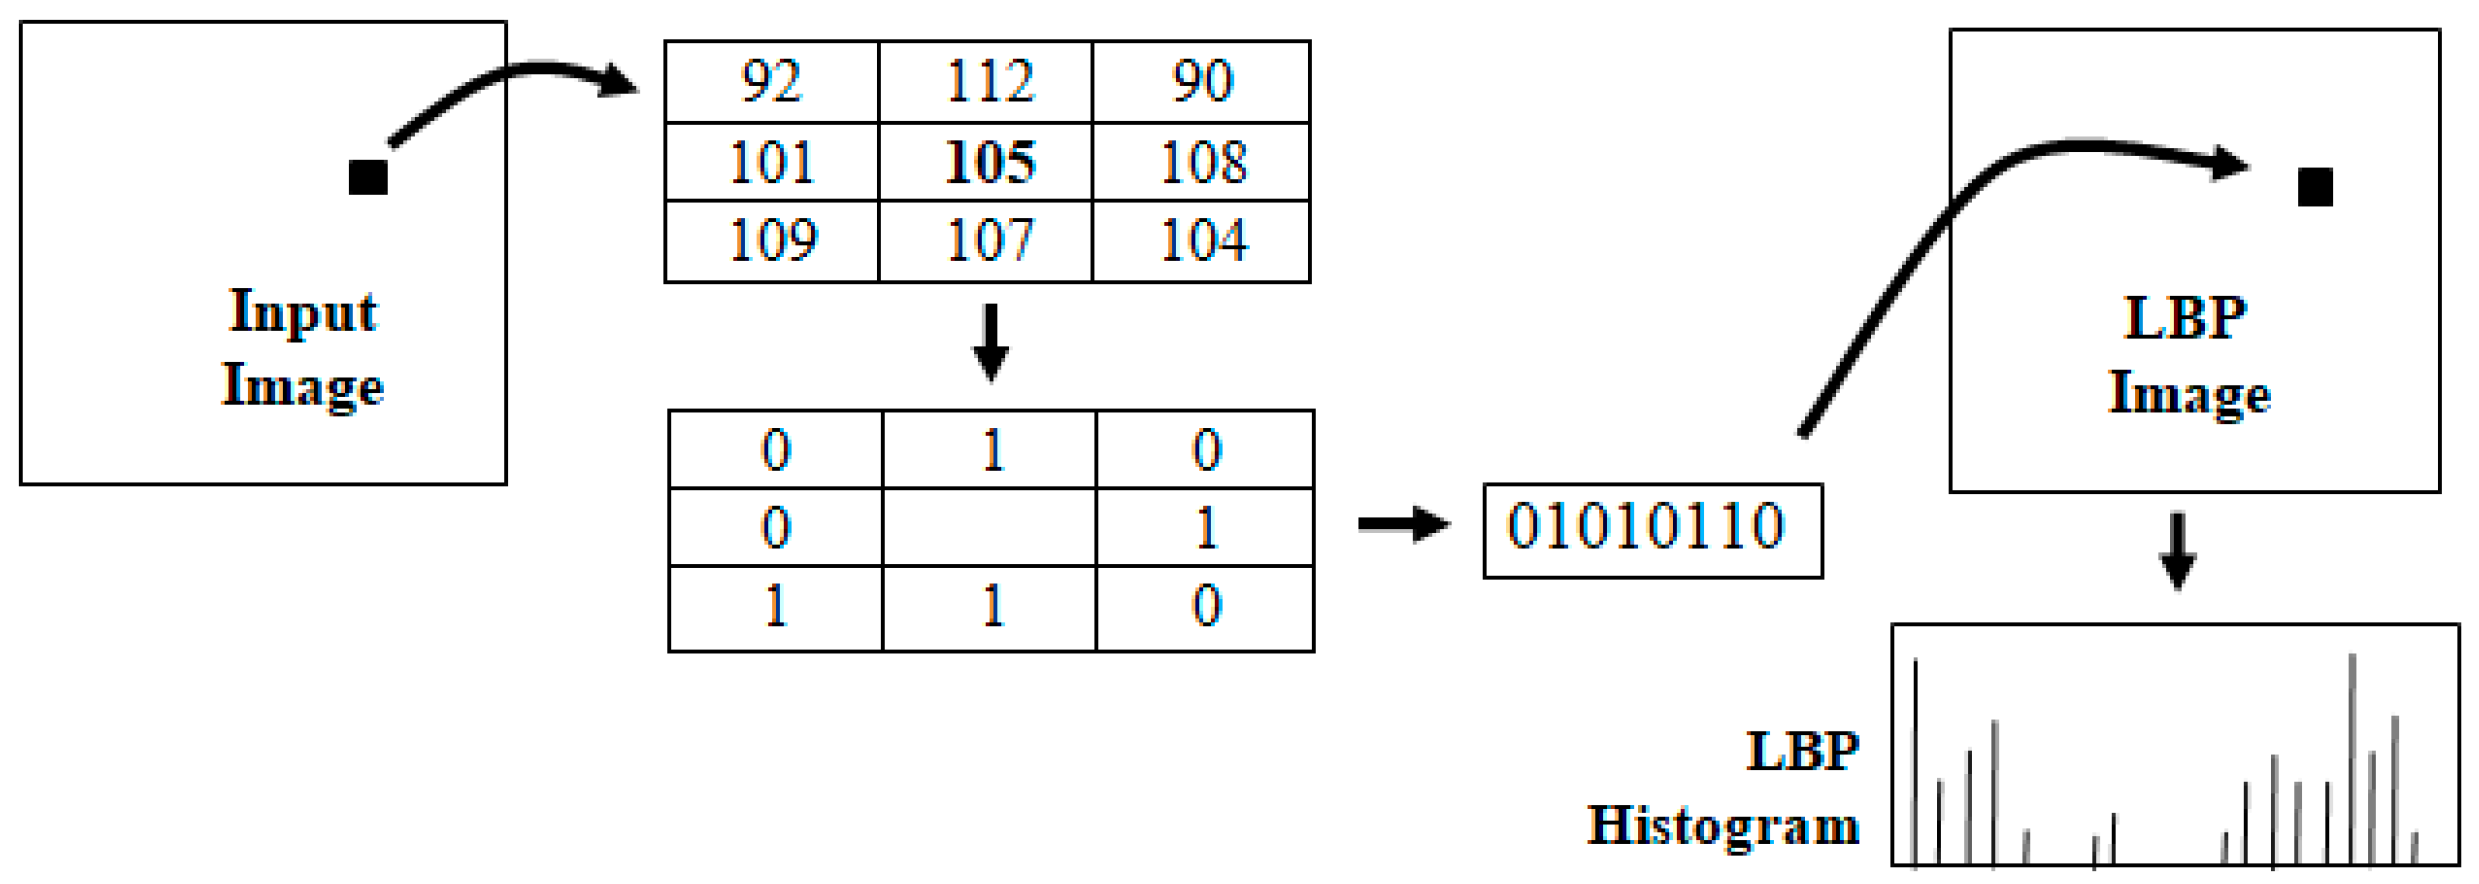
23]. This feature is derived by comparing the intensity at each pixel with its eight neighbors and encoding the information in an 8-bit integer value. This encoding can be viewed as a transformation of the input image into an LBP image as shown in
Figure 9.
The histogram of the LBP image is generally used for texture classification [
11]. In the area of medical image analysis, LBP methods have been successfully used in characterizing disease patterns [
23]. There has also been a limited number of applications of local binary patterns in image quality assessment [
10]. In this paper, we propose a novel approach for objective quality evaluation of synthetic ultrasound images using features derived from the LBP histogram. It is not necessary to use the entire range of the LBP histogram to characterize the texture attributes. The LBP histogram contains a few predominantly large and separable values that could be used as the primary features for texture analysis.
5.2. LBP Features of Synthetic Ultrasound Images
The LBP histogram of ultrasound images contains predominant features that represent texture characteristics in the image. As an example, a synthetic ultrasound image of size 256 × 256 pixels, the corresponding LBP image and the LBP histogram are shown in
Figure 10.
In
Figure 10c, we have highlighted the important LBP features based on their magnitudes. The LBP histogram contains 256 values
Li,
i = 0…255. We propose the following feature vector consisting of eight LBP features for quality assessment:
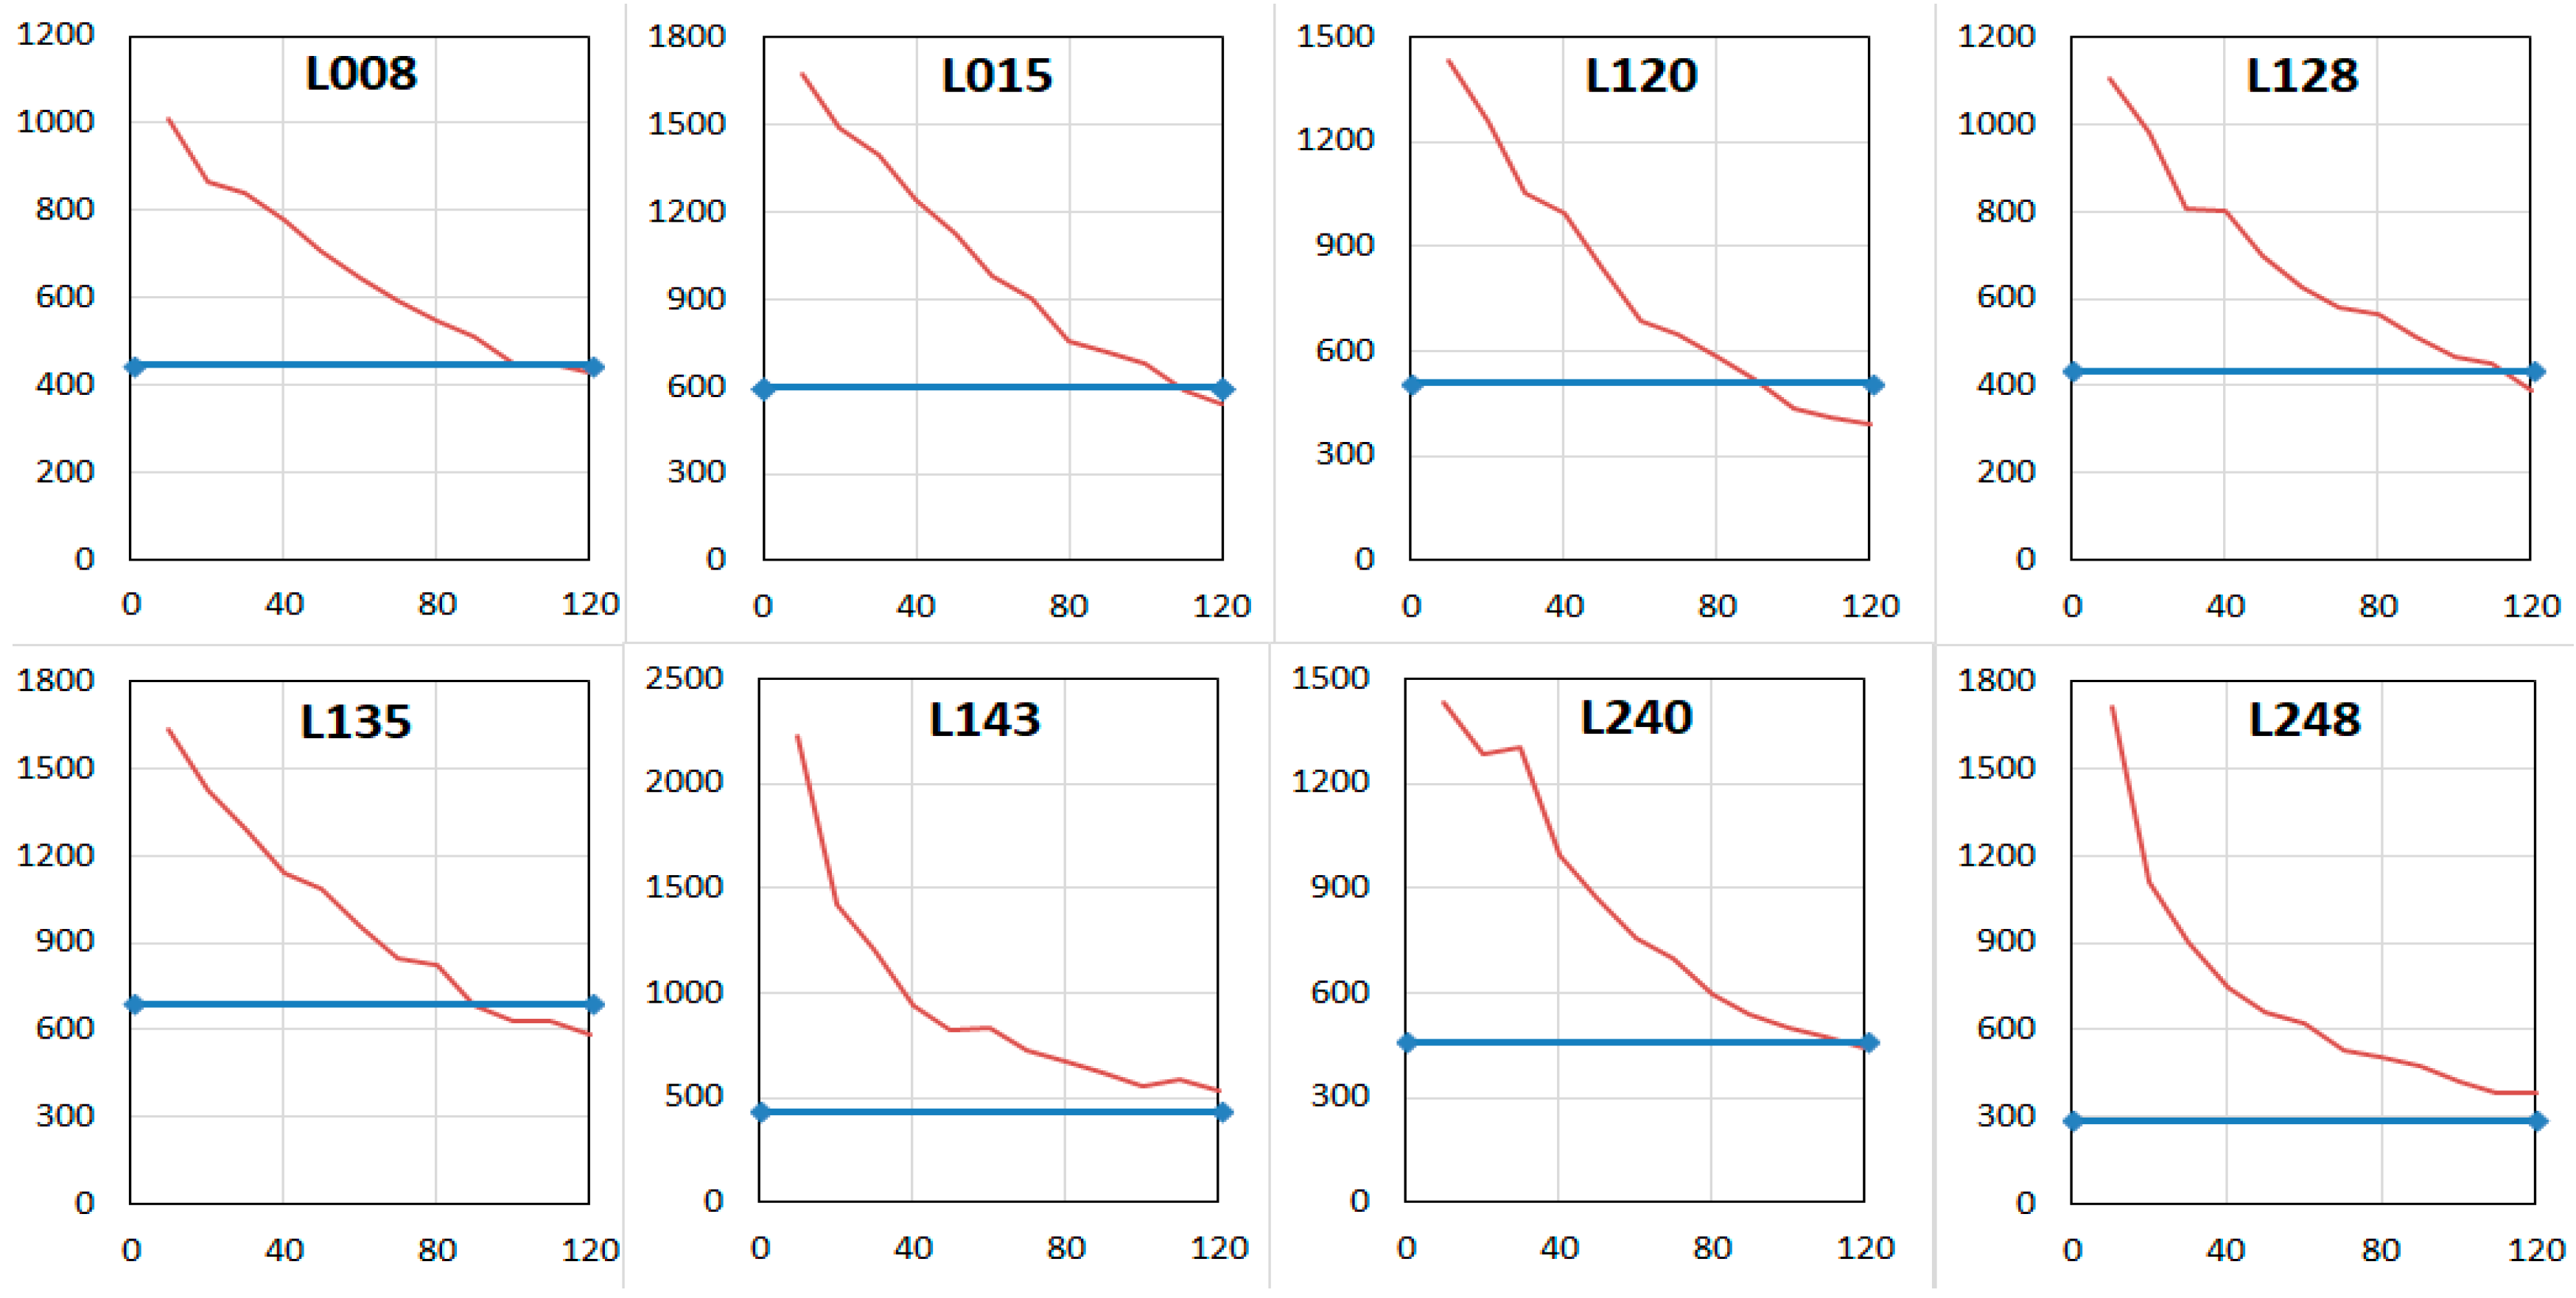
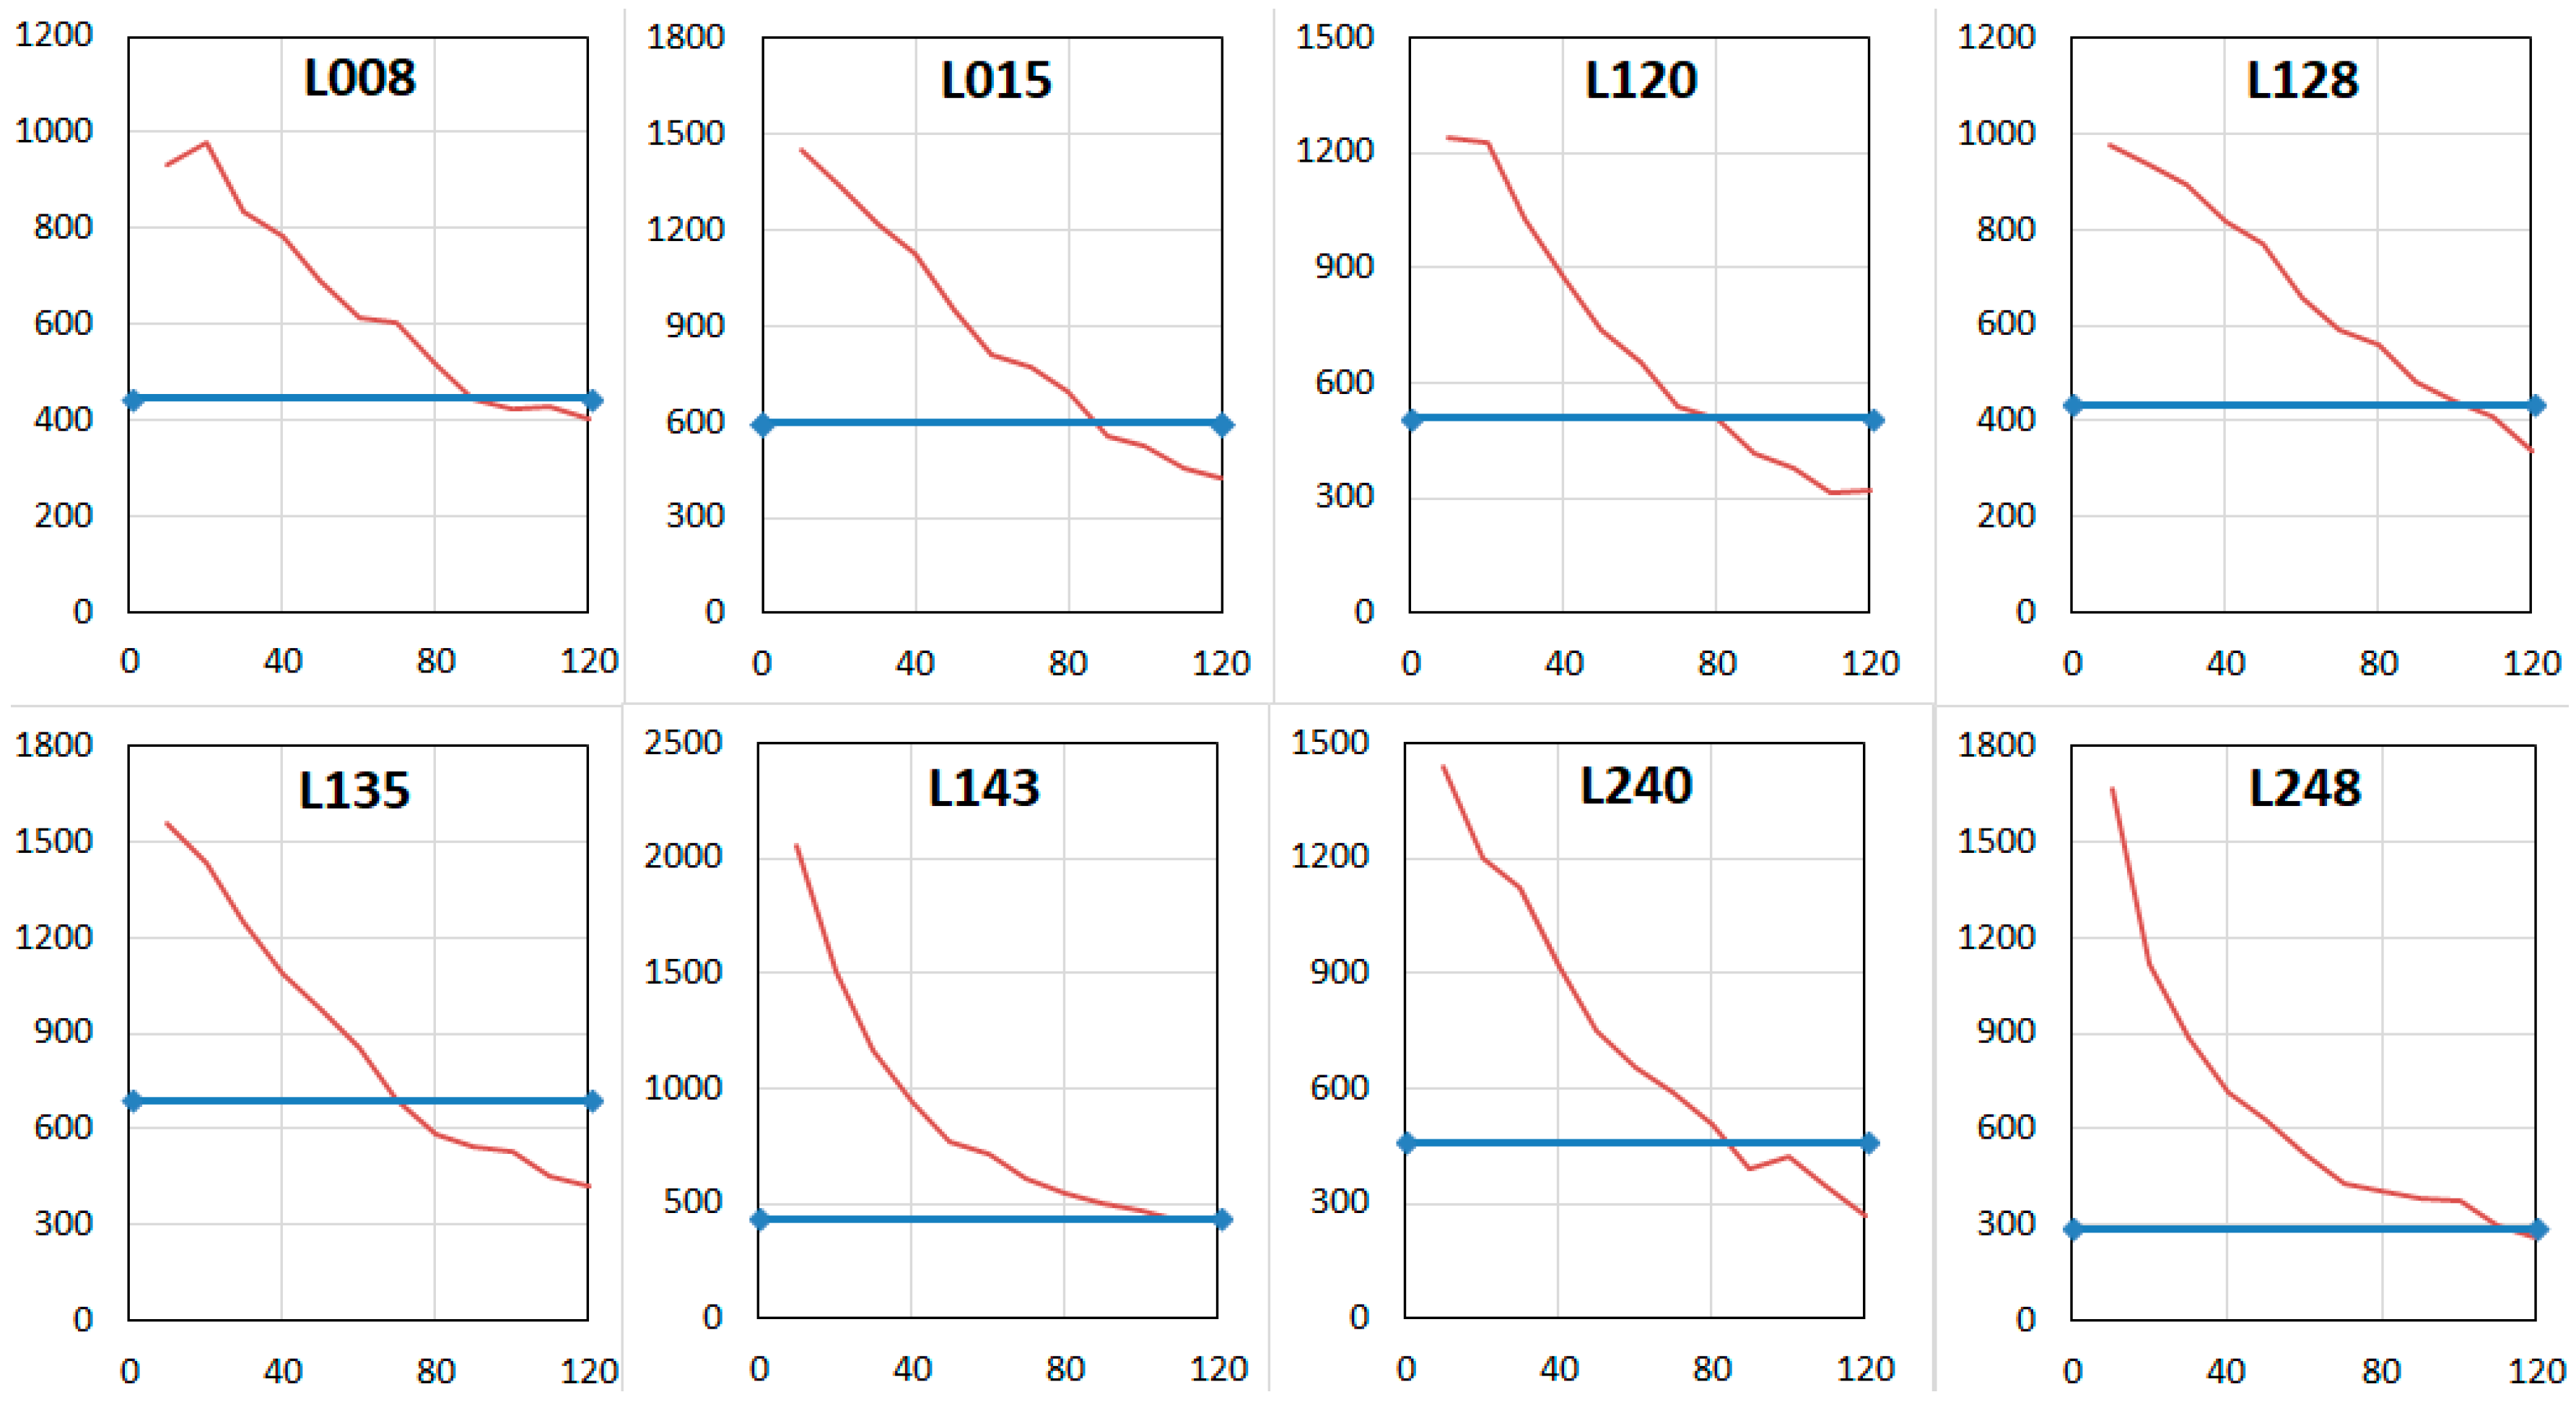
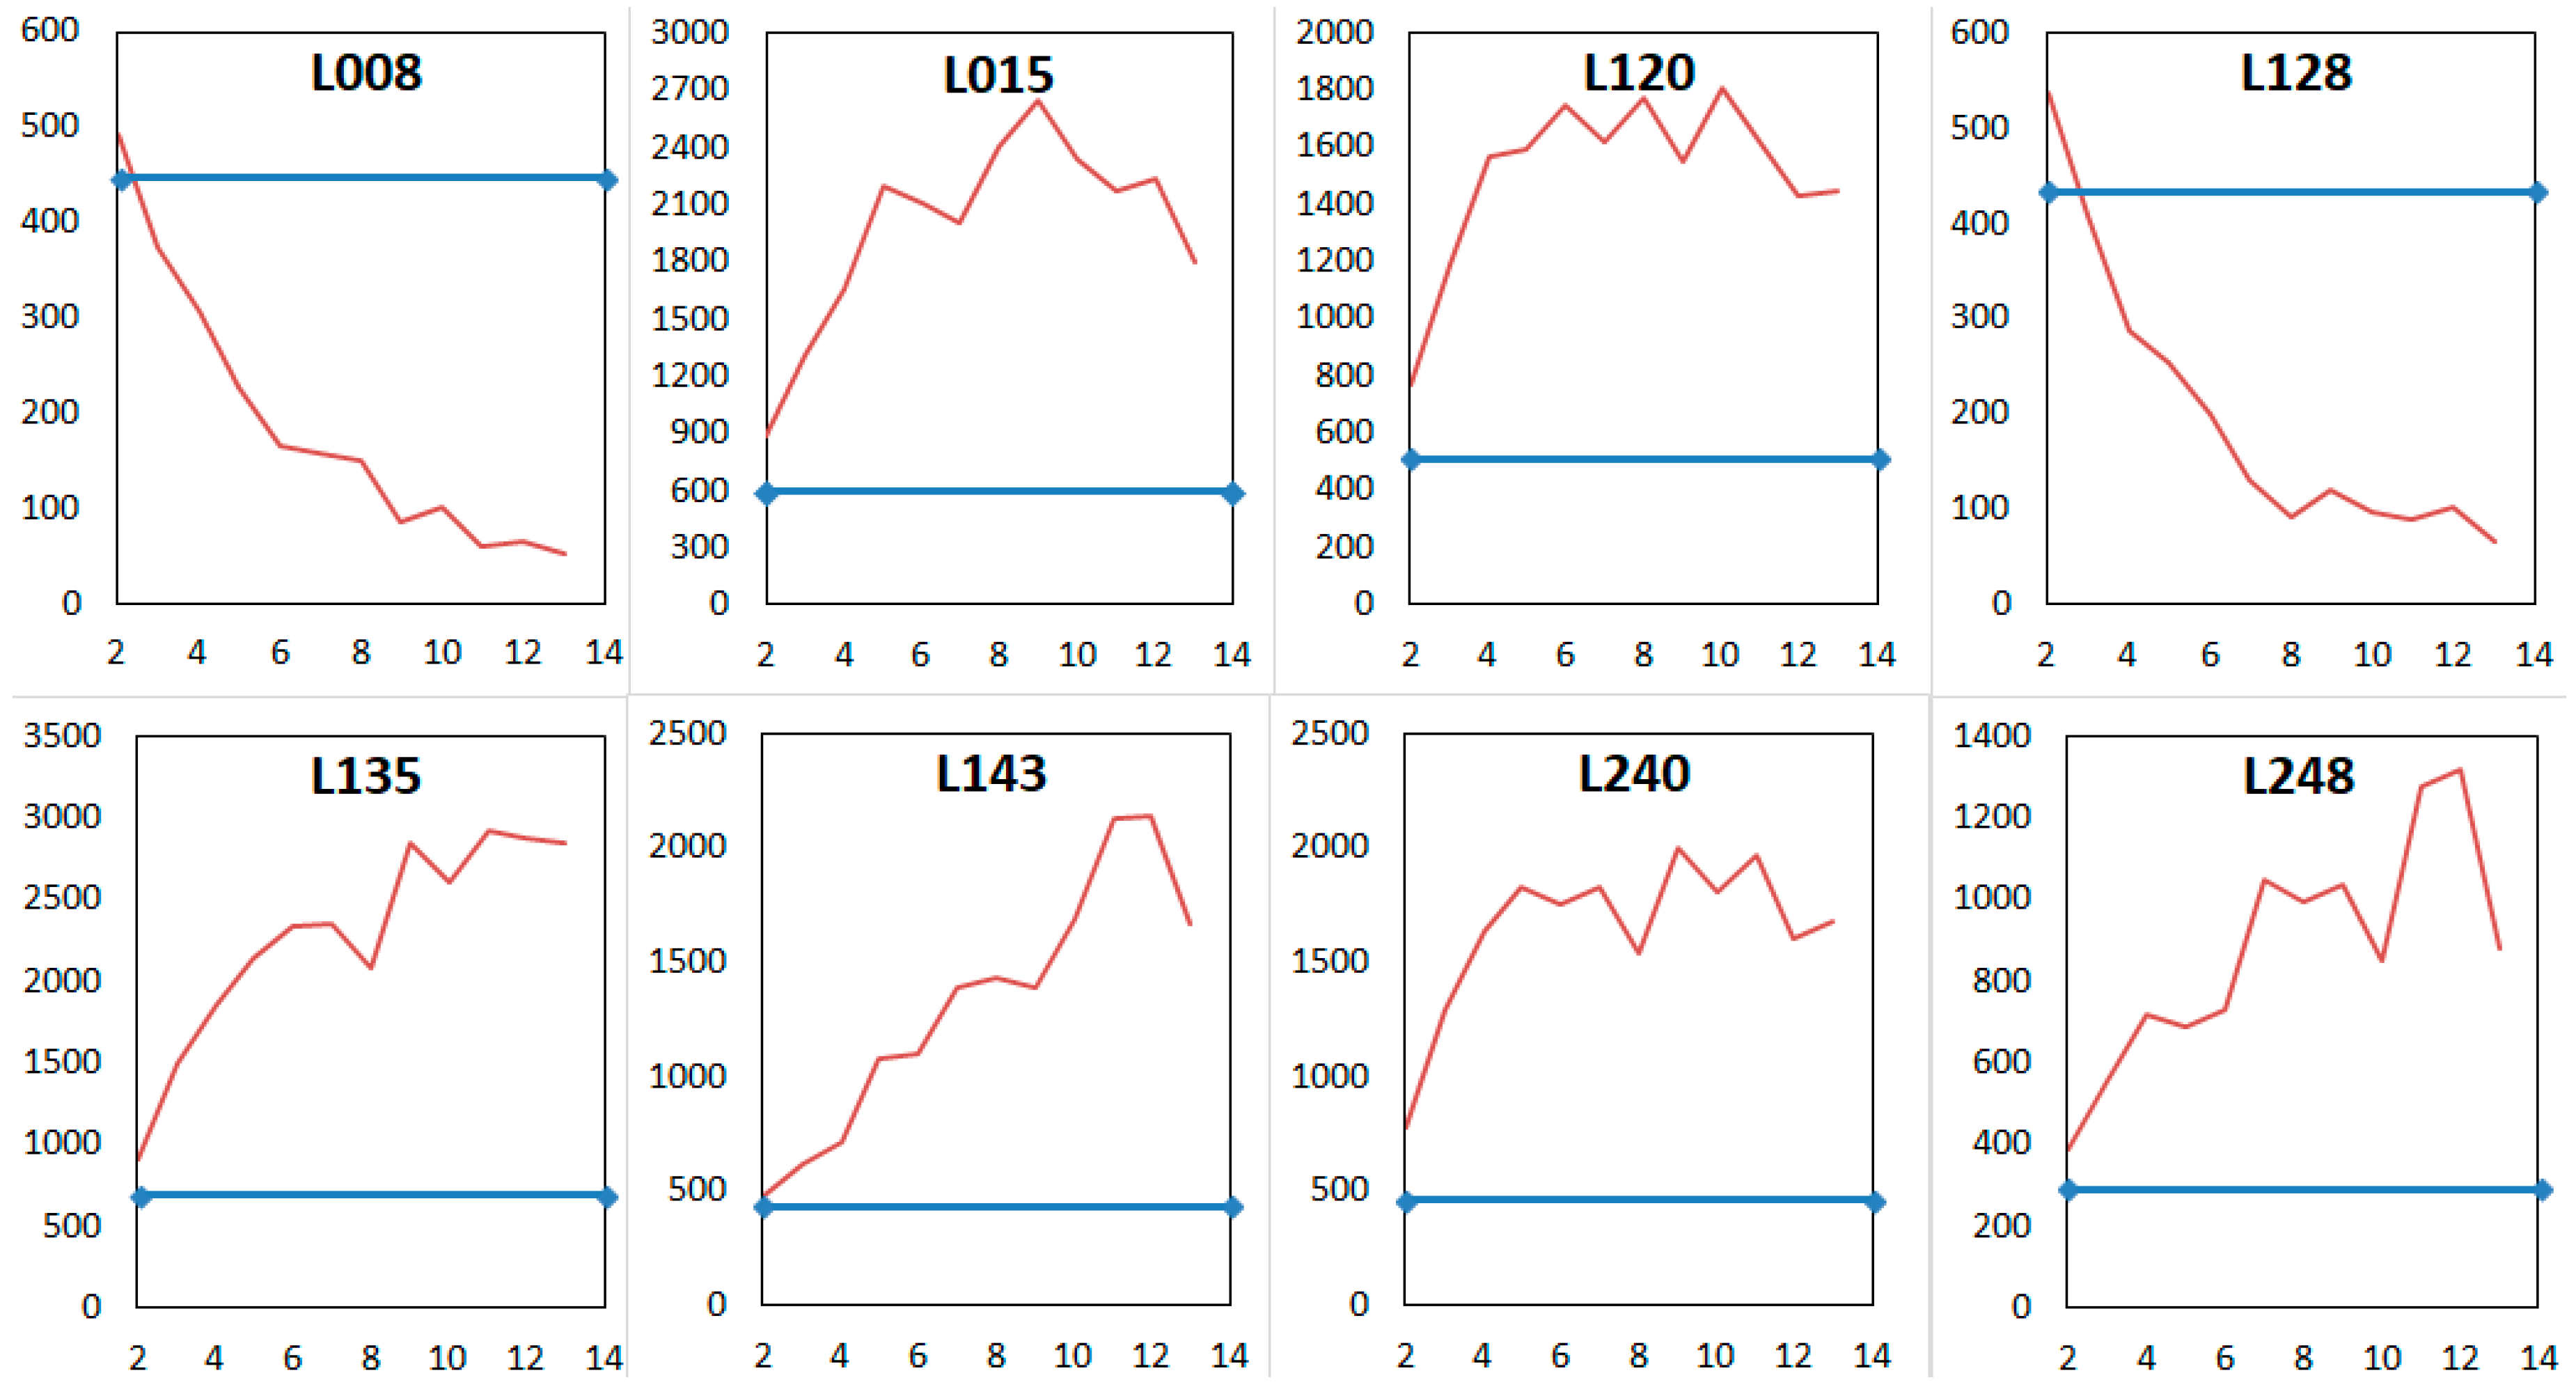
The above features show consistent variations with changes in axial and lateral resolutions at the modelling stage. The next section discusses the experimental results in detail and also shows that the LBP features can also help select these modelling parameters so that the features closely match with those of real ultrasound images.
7. Conclusions and Future Work
This paper has presented the complete framework for generating realistic and simulated ultrasound images incorporating image acquisition models, speckle noise formation processes and image interpolation schemes. The paper has introduced three sampling schemes, viz., radial-polar, radial-uniform and uniform grid sampling methods. These methods together with the speckle simulation model and the interpolation scheme formed the simulation model of the processing pipeline. These processes within the simulation model allows users to vary a wide range of parameters that control the image and noise formation processes. The simulated images with speckle noise could be used to evaluate noise filtering methods as ground truth data (the corresponding synthetic images without noise) are readily available.
The main contributions of the paper include a method for objective quality assessment of synthetic images using texture features derived from local binary patterns and detailed experimental analysis, that showed the effectiveness of LBP features in representing changes in image quality with modeling parameters. More importantly, the values of the LBP features approached the values computed from real synthetic images in a systematic way for the following parametric variations:
Radial polar: when the parameter n is increased from 10 to 110
Radial uniform: when the parameter nu is increased from 10 to 100
Uniform grid: when the spacing parameter δ is reduced from 14 to 2
The above analysis provided us an optimal set of modeling parameters that could be used for generating realistic synthetic images. The study also revealed that synthetic images generated by radial polar sampling technique gave better quality outputs compared to other sampling methods. The quality of such synthetic images was further validated using subjective evaluations performed by clinical experts.
Future work is directed towards using the proposed algorithm on a wider range of ultrasound images to analyse deviations in the values of LBP feature components and to evaluate the robustness of the selected LBP features under variations in imaged objects and tissue characteristics. The distribution of speckle noise also is dependent on the imaged tissue characteristics and therefore not uniform across the image. Variations in speckle distribution could be modelled by overlaying on the sampled points regions with assigned weights to control the influence of noise within the selected regions.
The method proposed and the quality analysis presented in this paper could be used for generating a synthetic ultrasound image dataset. This dataset would find applications in the performance evaluation of filtering systems.
