Article

Active Infrared Thermography for Seal Contamination Detection in Heat-Sealed Food Packaging

KU Leuven Department of Biosystems, MeBioS, Kasteelpark Arenberg 30, B-3001 Heverlee, Belgium
*
Author to whom correspondence should be addressed.
J. Imaging 2016, 2(4), 33; https://doi.org/10.3390/jimaging2040033
Submission received: 19 September 2016 / Revised: 8 November 2016 / Accepted: 10 November 2016 / Published: 16 November 2016
(This article belongs to the Special Issue The World in Infrared Imaging)

Abstract

:
Packaging protects food products from environmental influences, assuring quality and safety throughout shelf life if properly performed. Packaging quality depends on the quality of the packaging material and of the closure or seal. A common problem possibly jeopardizing seal quality is the presence of seal contamination, which can cause a decreased seal strength, an increased packaging failure risk and leak formation. Therefore, early detection and removal of seal contaminated packages from the production chain is crucial. In this work, a pulsed-type active thermography method using the heated seal bars as an excitation source was studied for detecting seal contamination. Thermal image sequences of contaminated seals were recorded shortly after sealing. The detection performances of six thermal image processing methods, based on a single frame, a fit of the cooling profiles, thermal signal reconstruction, pulsed phase thermography, principal component thermography and a matched filter, were compared. High resolution digital images served as a reference to quantify seal contamination, and processed thermal images were mapped to these references. The lowest detection limit (equivalent diameter 0.60 mm) was obtained for the method based on a fit of the cooling profiles. Moreover, the detection performance of this method did not depend strongly on the time after sealing at which recording of the thermal images was started, making it a robust and generally applicable method.

Graphical Abstract

1. Introduction

The main function of food packaging is to protect a product from environmental influences and to ensure its quality and safety throughout the distribution chain and during shelf life [1]. A package will only be able to fulfill this function if it is of adequate quality. Although several packaging materials exist, there is a trend towards packaging based on heat-sealed flexible materials because of their low weight and cost [2]. The quality of heat-sealed flexible packaging depends on the quality of the polymer material and of the closure or seal, yet achieving proper closure of the package is often challenging [3]. Adequate seal quality implies the complete fusion of two opposing seal layers. In heat sealing, this fusion is achieved by applying a specific combination of temperature and pressure during a certain period of time, allowing the long chain molecules of the seal layers to join [2,4].
Complete fusion of the seal layers can be hampered by an inadequate combination of those sealing parameters or by the presence of water vapor, air bubbles, wrinkles or product contamination in between the seal [4]. Seal contamination can cause a decreased seal strength and, thus, an increased risk of packaging failure [5]. Moreover, it may trigger the formation of (micro-)channels through which air and microorganisms can penetrate the package and spoil the enclosed food [6]. Seal contamination can also negatively impact seal appearance, causing loss of consumers’ confidence in packaging integrity [2]. Mihindukulasuriya (2011) stated that the presence of product contamination in the seal area should be avoided because it can potentially compromise seal strength [7]. Bach et al. (2012) showed that heat seal strength was dramatically decreased by the presence of solid contamination, yet less by the presence of pasty and fluid contamination [8].
These observations prove that early detection and removal of seal contaminated packages from the production chain is essential.

2. Related Work

There are several possible methods to inspect seal quality and package integrity. A major drawback of most methods currently used in industry is that they are destructive and can therefore only be applied to a subset of each production lot. Examples of destructive testing methods are burst, peel strength, creep and dye penetration tests [1,2,9]. Non-destructive packaging inspection methods have also been described, such as the mechanical squeeze test, the vacuum decay method and the use of tracer gasses [2,10,11]. Although these methods are non-destructive, they either require contact with the pack, creating the risk of cross-contamination, or they are too slow for continuous implementation. Because none of the previously-described methods meets the needs of industry, visual packaging inspection is still widely used. Human visual inspection is non-destructive and fast, yet it is subjective and prone to human errors [9]. Moreover, visual inspection is limited to transparent films. Since food producers want to guarantee food safety and the quality of all products, the demand for online seal inspection methods, which should be non-destructive, fast and contactless, increases. Pascall et al. (2002) presented a leak detection method based on ultrasonic imaging, but this method requires immersion in a coupling liquid and is therefore not contactless as such [9]. Ostyn et al. (2007) were able to detect wrinkles and solid contaminants in seals based on abnormal vibration of the sealing bars [2,3]. However, liquid contamination is difficult to detect with this method. Morita et al. (2007) explored the potential of terahertz radiation for detecting microleaks in seals [12]. Although the technique is able to detect both air- and water-filled channels, it is not an imaging technique, and therefore, the data are not straightforwardly interpreted. Shuangyang (2010) studied the inspection of seal quality using machine vision [13]. The use of an RGB camera is limited to the inspection of transparent films, and the detection of liquid contaminants is difficult even in these transparent films due to spreading of the liquid within the seal area. Barnes et al. (2012) used polarized light stress analysis and laser scatter imaging for seal inspection in polymer trays, yet up to now, the application was limited to transparent packaging materials [14]. Song et al. (2014) presented a methodology called “high voltage leak detection”, which can only be used for the inspection of non-conductive packaging concepts containing liquid-based food products in contact with the packaging material [15]. A novel type of ultrasound inspection consists of sending a “ping” of ultrasound to a pack and observing the echo. Anomalies in the seal are detected based on deviations in that echo. This method depends on the filling weight and pack shape and requires accurate calibration [2]. Since the described non-destructive inspection methods still show some limitations, research towards other sensor technologies is required.
In this work, a packaging inspection system based on infrared (IR) thermography was studied. IR thermography is a contactless, non-destructive testing method in which surface temperature distributions (thermograms) are recorded based on the amount of IR radiation emitted by the inspected scene. Thermography can be applied both passively and actively. In passive thermography, objects are inspected without applying an external thermal perturbation. In the active approach, the inspected objects are thermally excited, and the response to this excitation is recorded in time. Active thermography data are three-dimensional since the temperature of each spatial pixel is evaluated in time. Active thermography is used to detect (sub)surface defects based on differences in thermo-physical properties. Several types of active thermography can be distinguished based on the excitation source, the waveform of the excitation and the inspection mode [16,17]. IR thermography is especially suited for the detection of defects in seals of heat-sealed flexible packaging since the thermo-physical properties of the product and packaging material are typically very different, since most packaging films are transparent to IR radiation, while they are often visually non-transparent, and since a heating step is inherently present in the sealing process. Moreover, thermography produces relatively easy-to-interpret spatial thermograms of the inspected scene. Thermography methods for packaging inspection described in the literature mostly focused on the analysis of a single thermogram recorded at a specific time after sealing [18]. However, the temperature contrast between defect and background might not be optimal in that single thermogram, and defects might go unnoticed. Moreover, due to differences in thermo-physical properties, the optimal recording instant depends on the defect type.
Since seal contaminations mostly appear as subtle signatures in the thermogram series, it is expected that selecting an appropriate strategy for processing the thermal image sequences will improve the detection capabilities. Ibarra-Castanedo et al. (2004) presented an overview of IR image processing methods, such as thermal contrast computation, normalization, pulsed phase thermography (PPT), principal component thermography (PCT) and thermal signal reconstruction (TSR) using first and second derivatives [19,20,21]. References to those techniques are, amongst others, provided in Maldague (2001) and Ibarra-Castanedo et al. (2004) [16,19]. Li et al. (2010) studied the use of a matched filter to increase the signal-to-noise ratio for crack detection in IR images from vibrothermography experiments [22]. A matched filter is defined as the optimal linear filter to improve the signal-to-noise ratio in a stationary white noise process. In order to construct the filter, the profile of the signal to be detected should be known/approximated [22,23]. Li et al. (2010) described the spatial temperature profile of the crack as a Gaussian kernel. The temporal temperature pattern was obtained empirically. Using the matched filter, the crack detection performance was increased as compared to a method using scalar temperature increases [22].

3. Objective

The goal of this work was to detect contamination in seals of heat-sealed flexible food packaging using active IR thermography. Contaminated seal samples were created with a vertical form fill seal packaging machine. The heat of the seal bars was exploited as the thermal excitation source in a pulsed-type thermography experiment. Thermal image sequences of the seals were recorded shortly after sealing, and the added value of applying advanced processing methods to these thermal image sequences for contaminant detection was explored. The detection performances of six thermal image processing methods were compared. In the first method, temperature data of a single frame were thresholded. This method was included in the comparison to study whether recording a time sequence of thermograms indeed provides added value for defect detection. The second method consisted of fitting the temperature-time evolution of every spatial pixel in the logarithmic domain with a first order polynomial. Moreover, the detection capabilities of TSR fitting a fourth order polynomial, of PPT and of PCT were explored. Finally, a 3D matched filter technique was applied to the data. Moreover, the effect of the time after sealing at which image recording was started on the detection performances of all image processing methods was studied. High resolution digital images served as a reference to quantify seal contamination. The work described in this paper departs from the basis laid in [24].

4. Materials and Methods

4.1. Sample Preparation and Image Acquisition

Contaminated seal samples were prepared using a vertical form fill seal (VFFS) packaging machine (Audion AVM 190HS, Audion Elektro; Weesp, The Netherlands). A schematic representation of the filling tube and sealing system of the VFFS machine is shown in Figure 1. Before arriving to this part of the VFFS, a film handling system controls the tension and position of the packaging film. Next, the film is formed into a tube, and the back seal or vertical seal is formed to close the tube of film. This tube of film is then transported downwards by means of drive belts, and the bottom seal of a bag is sealed with the horizontal seal bars. Next, the product is fed through the filling tube, and the bags are closed by the horizontal seal bars. Finally, the filled bag is moved downwards so the next bag can be produced [2]. When the timing of the filling process and the sealing step are not properly matched, this may result in contaminated seals. In this study, seals of oriented polyamide/polyethylene (OPA/PE) 15/40 film were intentionally contaminated by manually sprinkling ground coffee particles into the filling tube immediately before sealing. The temperature of the ribbed horizontal seal bars was set at 140 °C, and the seal time was set at 0.5 s. Coffee was selected as a contaminant since it is a small, granular material and since its dark color provides high contrast in the digital reference images.
An IR camera (FLIR SC7600, FLIR Systems Inc., Wilsonville, OR, USA) was connected to the packaging machine. This camera has a focal plane array detector consisting of 640 × 512 IR detectors, a maximum frame rate of 100 Hz and a noise equivalent temperature difference (NETD) of <25 mK. In the setup used in this study, a spatial resolution of 0.3165 mm per pixel was achieved. The closing operation of the horizontal seal bars was set to trigger the IR camera to start recording thermal image sequences of the recently-produced seal. Images were recorded at a frame rate of 50 Hz for 20 s to obtain a total of 1000 frames. During the first 3.18 s (= first 159 frames), the seal was, however, still moving slightly downwards with a distance corresponding to the vertical size of the bags since the VFFS wants to ensure that the tube of packaging film is at the correct position to prepare the next seal. After this, the seal was kept still at a constant position. For image processing purposes, only the images in which the seal’s position was constant were considered in the thermal image sequences. Therefore, the 160th frame is called “Frame 1” in the remainder of the text, and the total length of the image sequences was 841 frames.
A total of 30 contaminated seal samples was prepared, and 30 corresponding thermal image sequences were recorded.
Next, the seal samples were retrieved from the VFFS machine, and high resolution digital images of the contaminated seals were acquired using an RGB-camera with a resolution of 4992 × 3328 pixels (Canon EOS-1 Ds Mark II Digital; Tokyo, Japan) equipped with a 28–105-mm zoom lens. A spatial resolution of 0.0417 mm per pixel was obtained. The images were recorded offline in a closed, cube-shaped box supplied with uniform illumination to avoid unwanted reflection of the ribbed profile present in the seals, as shown in Figure 2. The seals were positioned on a white background to maximize the contrast between background and contaminating particles.

4.2. Preprocessing of the Thermal Image Sequences

All image processing was performed in the 64-bit version of MATLAB 2013a (The MathWorks Inc., Natick, MA, USA) on a 3.40-GHz processor.
As a result of the way a flexible bag is formed in a VFFS machine, the thermal images of a recently-produced seal can be horizontally divided into three regions: one region in the center of the seal where an extra layer of polymer film is present due to the vertical seal and two regions located to the left and right of it. In this work, the right part of the seal was considered. This region of interest was manually selected for each sample in both thermal and digital images.
A bad pixel correction was performed on all thermal image sequences. Bad pixels were defined as those pixels whose temperature did not change more than 0.5 °C between the first and the last frame. They were replaced by the median of their 3 × 3 pixel neighborhood. This operation eliminates the possible presence of both dead and hot pixels, whose temperature stays constant at respectively a very low or a very high temperature as a function of time.
For two of the thermal processing techniques (“single frame” and “matched filter”; see Section 4.3), a background correction was applied to the thermal image sequences to correct for the pattern caused by the ribbed profile of the seal bars. A median filter with a horizontal rectangular kernel (height: 1 pixel; width: 51 pixels) was applied to each frame of the thermal image cube. Next, the median filtered version of each frame was subtracted from that frame. Since the other processing methods (“fit of the cooling profiles”, “TSR”, “PPT” and “PCT”; see Section 4.3) rely on the shape of the cooling profile, for these methods, this background correction was applied after performing the main thermal image processing step.

4.3. Processing of the Thermal Image Sequences

The preprocessed thermal image sequences were subsequently processed using six different methods: (1) a method based on a single frame; (2) a method based on a first order polynomial fit of the cooling profiles in the logarithmic domain; (3) a method based on thermal signal reconstruction; (4) a method based on pulsed phase thermography; (5) a method based on principal component thermography; and (6) a method based on a 3D matched filter. The principle of each of these methods is discussed below. Although some of these processing methods produce multiple output images (e.g., amplitude and phase images for pulsed phase thermography), only the output image providing the largest contrast between contamination and background was selected for each method. Results for the other output images were not included in the paper.

4.3.1. Single Frame

The first frame of the preprocessed thermal image sequences was stored for further processing. As explained in Section 4.1, this first frame was recorded 3.2 s after sealing. In the remainder of this paper, these thermal output images will be referred to as “single frame”.

4.3.2. Fit of the Cooling Profiles

The natural logarithm of temperature versus the natural logarithm of time of every pixel in the thermal image sequences was fitted with the first order polynomial ln ( T ) = p 1 ln ( t ) + p 2 . For every thermal image sequence, images based on the intercept (p2) and the slope (p1) were constructed. The p2 images provided the highest contrast between contaminants and background. These p2 images were background corrected as explained in Section 4.2 and stored for further processing. In the remainder of the paper, these thermal output images will be referred to as “p2”.

4.3.3. Thermal Signal Reconstruction

The natural logarithm of ΔT = TT0 (with T0 = 20 °C the temperature of the sample before excitation, i.e., before sealing) versus the natural logarithm of time for every pixel in the thermal image sequences was fitted with the fourth order polynomial ln ( Δ T ) = p 1 ln ( t ) 4 + p 2 ln ( t ) 3 + p 3 ln ( t ) 2 + p 4 ln ( t ) + p 5 [25]. For every thermal image sequence, images based on each of the five polynomial coefficients were constructed. The intercept (p5) images provided the highest contrast between contaminants and background. These p5 images were background corrected as explained in Section 4.2 and stored for further processing. In the remainder of the paper, these thermal output images will be referred to as “TSR p5”.

4.3.4. Pulsed Phase Thermography

The preprocessed thermal image sequences were transformed by applying a one-dimensional discrete Fourier transform on the time sequence of each pixel:
F n   =   k = 0 N 1 T ( k ) e 2 π ikn / N =   Re n + iIm n
with N the number of thermograms in the sequence, T ( k ) the temperature for the k -th thermogram in the sequence, n the frequency increment ( n = 0 ,   1 ,   ,   N / 2 due to the symmetry of the Fourier transform), i the imaginary number and Re and Im the real and imaginary part of the transform [16]. Amplitude A n and phase φ n were calculated from the real and imaginary part for every frequency value using [16]:
A n =   Re n 2 +   Im n 2  and  φ n = tan 1 ( Im n Re n )
As mentioned in [24], no clear phase contrast between defective and background pixels was found. The amplitude images at the lowest frequency bin (f = 0.059 Hz) provided the highest contrast between contaminants and background. These images were background corrected as explained in Section 4.2 and stored for further processing. In the remainder of the paper, these thermal output images will be referred to as “amplitude”.

4.3.5. Principal Component Thermography

The three-dimensional (x, y, time) preprocessed thermal image sequences were “unwrapped” to obtain a two-dimensional (x × y, time) matrix for each sample. These two-dimensional matrices were then subjected to a principal component analysis (PCA). PCA is a multivariate data analysis technique that reduces the dimensionality of a dataset. It transforms a large set of correlated variables to a smaller set of uncorrelated principal components (PCs), while still describing most of the variation in the data. For a more detailed description of principal component thermography, the reader is referred to Rajic (2002) [26]. In this study, a PCA based on the singular value decomposition (SVD) algorithm was performed on centered data.
For each sample, images based on the score values of the first two PCs were constructed. The images based on the first PC (PC1) provided the highest contrast between contamination and background. These PC1 images were background corrected as explained in Section 4.2 and stored for further processing. In the remainder of this paper, these thermal output images will be referred to as “PC1”.

4.3.6. Matched Filter

A matched filter is implemented as the convolution of an input signal with a time reversed known template or, equivalently, as the cross-correlation of an input signal with a known template. The cross-correlation c ( u , v , w ) between an image cube f and a template cube t positioned at pixel u, v, w is defined as:
c ( u , v , w ) = x , y , z f ( x , y , z ) t ( x u , y v , z w )
with x, y, z the pixels of f in the window of overlap between template and input data when the center of the template is positioned at u, v, w [27]. An efficient implementation of the cross-correlation is possible in the frequency domain according to the cross-correlation theorem [28]. To make sure the matched filter is invariant to changes in image amplitude due to non-uniform heating conditions, however, a normalized cross-correlation should be used. A basic definition for the normalized cross-correlation coefficient γ is given by:
γ ( u , v , w ) =   x , y , z [ f ( x , y , z ) f ¯ u , v , w ] [ t ( x u , y v , z w ) t ¯ ] { x , y , z [ f ( x , y , z ) f ¯ u , v , w ] ² x , y , z [ t ( x u , y v , z w ) t ¯ ] ²   } 0.5
with t ¯ the mean of the template and f ¯ u , v , w the mean of f in the window of overlap between template and input data when the center of the template is positioned at pixel u, v, w [27,29]. The implementation of this normalized cross-correlation in the frequency domain is not straight-forward [28]. Lewis (1995) described a methodology for the 2D case in which a fast Fourier transform is used for the implementation of the non-normalized cross-correlation to calculate the nominator of Equation (2), followed by an efficient normalization algorithm based on local sum tables to calculate the denominator of Equation (2). Tables containing the integral or running sum of the image f ( x , y , z ) and the squared image f ² ( x , y , z ) can be used for an efficient computation of the term x , y , z [ f ( x , y , z ) f ¯ u , v , w ] ² [27]. A detailed description of the denominator calculation can be found in Briechle and Hanebeck (2001) [29]. The methodology described by Lewis (1995) was implemented in the built-in MATLAB function “normxcorr2”. In this work, the function was expanded to three dimensions to be able to apply a 3D version of the method described by Lewis (1995) to the thermal image sequences. Moreover, a bias correction that takes into account the relative size of the image cube f and the template cube t was implemented. A template with spatial dimensions of 20 × 20 pixels and a time dimension of 841 frames was used. The 2 × 2 center pixels of the template were defined to represent a contamination, using an exponential decay defined by y = 30.9   e ( 0.00095 × time ) . The remainder of the pixels represent the background and have a constant value of 8.75. The background pixels have a constant value as a function of time since the matched filter is applied to thermal image sequences after performing the background correction discussed in Section 4.2. The numerical values of the exponential decay parameters and the constant background pixels were determined respectively by averaging the exponential decay parameters of 18 manually-selected defective pixels and by averaging the constant value of 18 manually-selected background pixels in experimental thermal image sequences. The matched filter output at Frame 421 (the center frame) was stored for further processing, because this is the frame showing the best discrimination since all information has just entered the filter cross-correlation [22]. In the remainder of the paper, this thermal output image will be referred to as “matched filter”.

4.4. Comparison of Image Processing Methods

The methodology described below was applied for all 30 samples. For every sample, the six thermal output images (“single frame”, “p2”, “TSR p5”, “amplitude”, “PC1” and “matched filter”) were compared to the digital reference image to evaluate the detection performances of the thermal processing methods.

4.4.1. Image Registration

The size of each thermal output image was adjusted to the size of the corresponding digital image by applying a bicubic interpolation. Next, 10 pairs of control points were manually selected, each pair consisting of a location in the digital image and the corresponding location in the thermal output image. Based on these pairs of control points, the thermal output image was registered to the digital image using a projective transformation.

4.4.2. Image Binarization

In the next step, the digital images and registered thermal output images were binarized. Since the contaminating particles typically represented only a limited portion of all pixels in an image, the images did not show a clear bimodal histogram. The background pixels and the defective pixels were represented in the histogram by respectively a large peak and a long tail. The widely-used Otsu method for image thresholding based on minimizing the intra-class variance in bi- or multi-modal histograms was not suited for these images [30]. Alternatively, the triangle threshold method presented by Zack et al. (1977) was used. In this method, a straight line is drawn between the peak in the histogram and its tail-end. For each point in the histogram between peak and tail-end, the distance to this line is calculated. The threshold is located at the point that is furthest away from the line [31]. For the digital images, the threshold was calculated to the left of the peak, as the contamination had a lower intensity than the background. For all thermal output images, the threshold was calculated to the right of the peak, as the contamination had a higher intensity than the background. Next, the images were binarized based on the calculated threshold. The number of particles and the overall percentage of contamination in the images were calculated.

4.4.3. Comparison of Digital and Thermal Images

To compare the registered thermal output images to the digital reference images, two lists were created for each combination considered. The first list contains all contaminating particles identified in the binarized digital image and the pixel coordinates comprising those particles. The second list contains the same information for the binarized thermal output image. Particles containing the same pixels in digital and thermal image were identified as overlapping particles. The thus obtained overlap results were used for two purposes.
Firstly, the overlap between the binarized digital and thermal images was visualized by showing both images and highlighting the overlapping particles.
Secondly, the overlap results were used to calculate the “percentage of falsely detected particles”. This parameter was defined as the ratio of the amount of non-overlapping particles present in the thermal output image to the total amount of particles present in the thermal output image. The mean and standard deviation of this parameter were calculated for each of the six thermal output image types. An analysis of variance (ANOVA) procedure was used to detect significant differences (α = 0.05). A positive omnibus test was followed by a Tukey–Kramer multiple comparison test [32].

4.4.4. Calculation of Detection Limits

In this step of the analysis, the size of both overlapping and non-overlapping particles was taken into account in order to calculate detection limits. Hence, a dataset was created containing for each combination of digital reference and thermal output image a list of the contaminating particles identified in the digital image, their equivalent diameter (= diameter of a circle with the same size as the particle) and a binary variable “detected”, which had a value of1 if the particle showed overlap with a particle in the thermal output image and a value of 0 if it did not show overlap with a particle in the thermal output image.
A binary logistic regression was performed on this dataset with “method” as a nominal predictor variable with six levels (“single frame”, “p2”, “TSR p5”, “amplitude”, “PC1” and “matched filter”), “amplitude” (D) as a continuous predictor variable and “detected” as a binary response variable. The predictor variable “method” was introduced in the regression model as a combination of five dummy variables (X1, X2, X3, X4 and X5) using effect coding. The coding was performed in such a way that information on the “single frame” method is contained in the intercept of the model, and all methods are compared to this “single frame” method. A full factorial model was performed to study the presence of interactions between the predictor variables. The formula of the full factorial binary logistic regression model was defined as [33]:
Prob ( detected = 1 ) = e α + i = 1 5 β i X i + β 6 D + j = 1 5 β j + 6 ( X j × D ) 1 + e α + i = 1 5 β i X i + β 6 D + j = 1 5 β j + 6 ( X j × D )
The equivalent diameter was expressed in mm and mean centered in the interaction terms to remove multicollinearity. The binary logistic regression was performed in the statistical software package JMP® Version 11 (SAS Institute Inc., Cary, NC, USA).
The processing time required for a single sample was registered for each of the six thermal processing methods.

4.4.5. Effect of Start Time of Recording after Sealing on Detection Performances

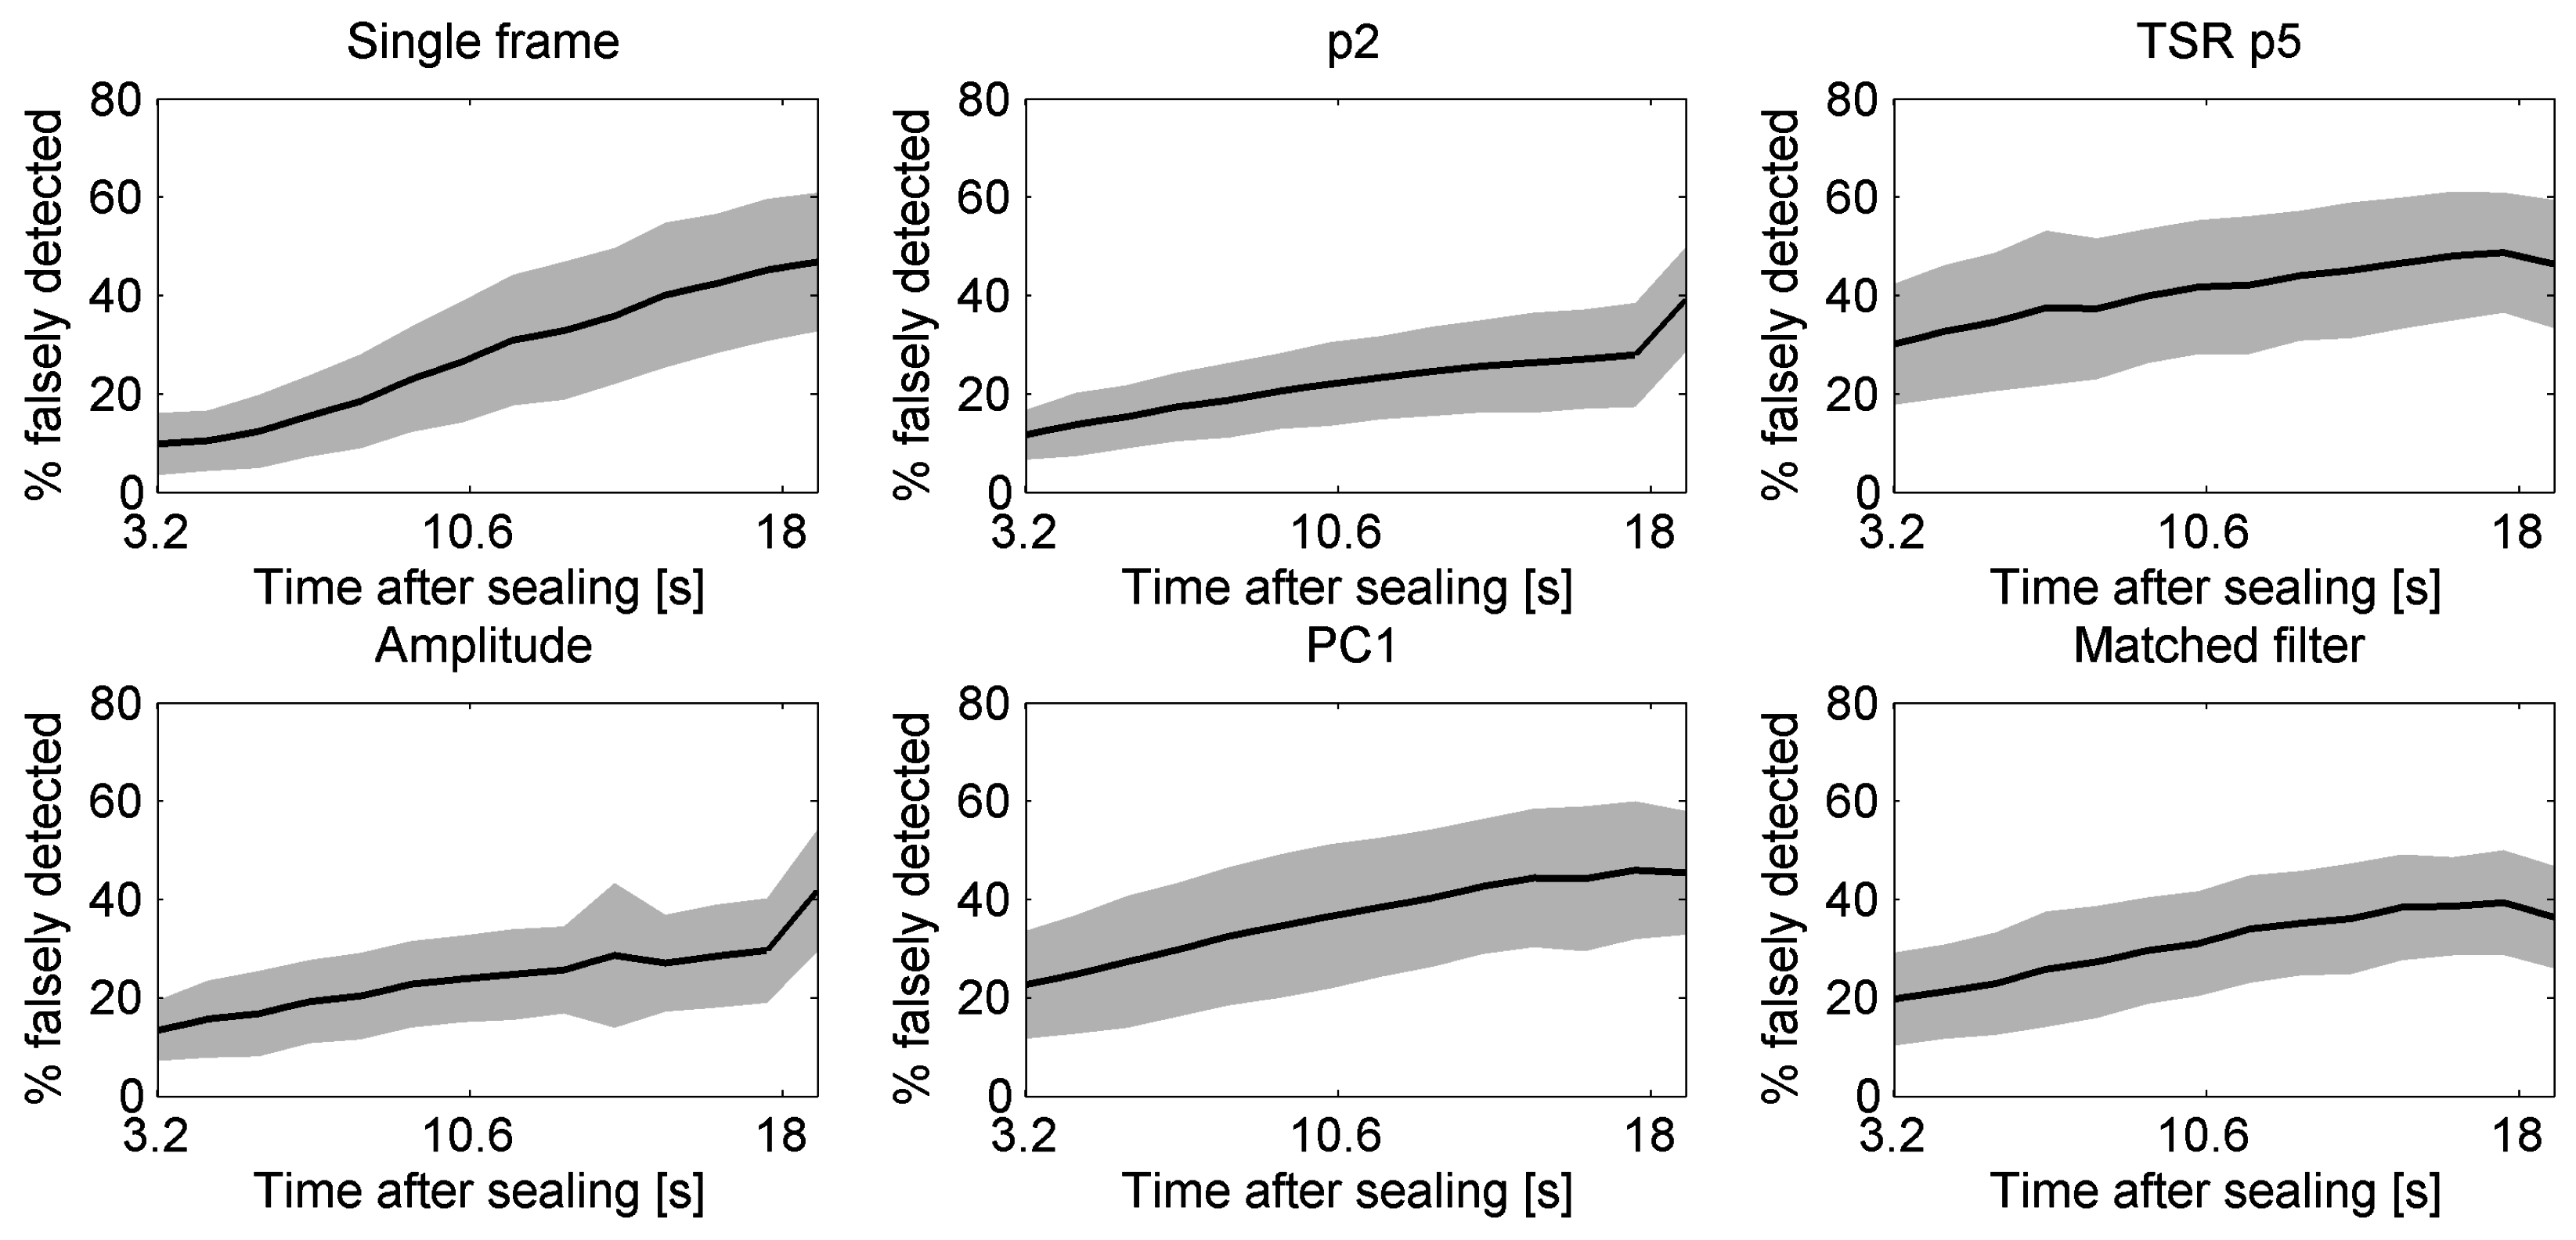
The time delay after sealing from which it is possible to start recording thermal images depends on the packaging machine and application under consideration. It is reasonable to expect that this timing influences the detection performances of the image processing methods considered in this work. To study this effect, subsamples of the thermal image sequences described in Section 4.1 were created by omitting a certain number of frames from the beginning of these sequences. In this way, recording start times of 3.2 s up to 18.8 s after sealing were considered, at intervals of 1.2 s. Next, these subsampled thermal image sequences were processed with all thermal processing methods. Detection limits and percentages of falsely-detected particles were calculated for each subsampled sequence using the methods described in Section 4.4.3 and Section 4.4.4.

5. Results

In Section 5.1, an example of the cooling profiles of the defective and sound (= contaminated and clean) seal areas of a single sample (Sample 28) is provided, and the first order fit and thermal signal reconstruction are illustrated. In Section 5.2, an overview of the inputs and outputs of the image processing steps performed in this study is shown for a part of this same sample. Section 5.3 presents an example of the overlap visualization between thermal and digital images. In Section 5.4, the results of the comparison of the six thermal data processing methods (“single frame”, “p2”, “TSR p5”, “amplitude”, “PC1” and “matched filter”) are shown. Section 5.5 describes the effect of the time after sealing at which image recording was started on the detection performances of those image processing methods.

5.1. Example of First Order Fit and Thermal Signal Reconstruction of the Cooling Profiles

Figure 3 shows the mean cooling profiles calculated based on all sound (=clean) pixels and all defect (=contaminated) pixels of Sample 28. The standard deviation of these profiles was also calculated and is shown as a shaded region surrounding the mean profiles. The overlap in these shaded regions illustrates the challenge in the contaminant detection problem considered in this study. Moreover, it is clear from these profiles that within the time frame in which thermal images were recorded in this study, there are only subtle slope differences between sound and defective profiles. The first order fit on the ln ( T ) versus ln ( t ) profiles, as described in Section 4.3.2, is illustrated in Figure 3a. The thermal signal reconstruction applying a fourth order fit to the ln ( Δ T ) versus ln ( t ) profiles is illustrated in Figure 3b. These figures show that the fourth order polynomial provides a better fit for the cooling profiles.

5.2. Overview of Image Processing Steps

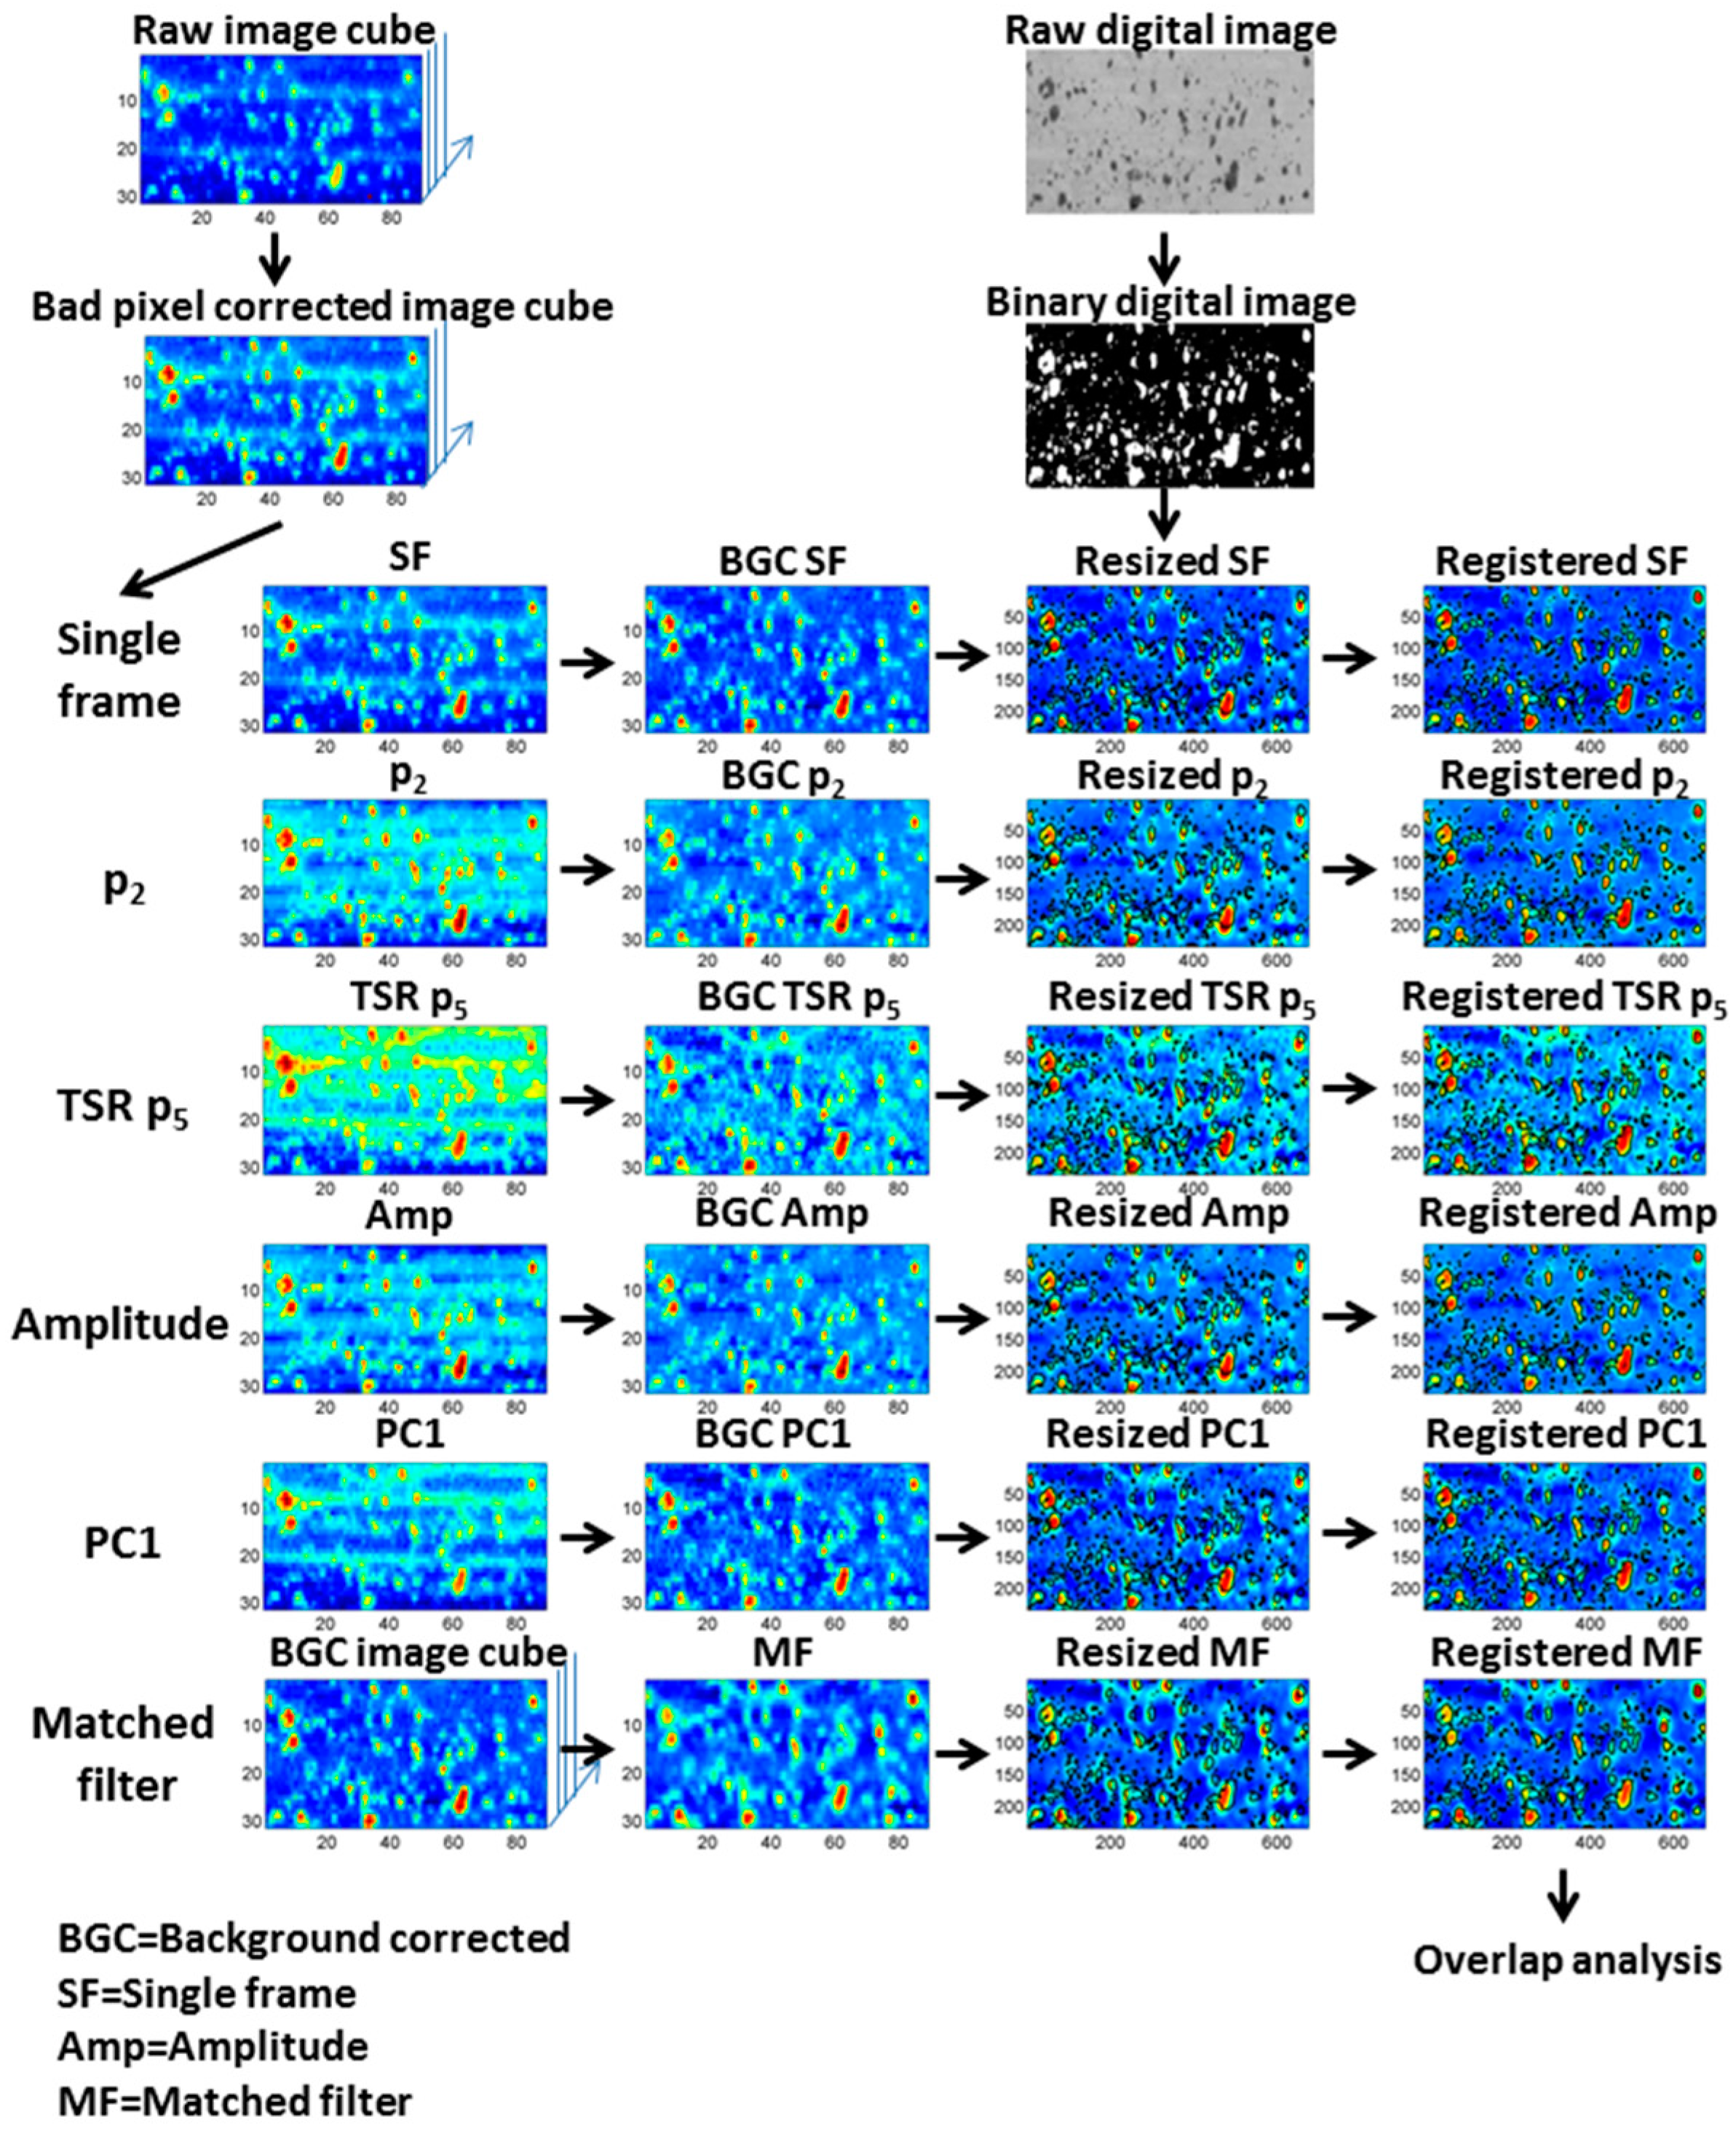
In Figure 4, an overview of all preprocessing and processing steps performed for the six thermal image processing methods is provided. These steps are explained in Section 4.2, Section 4.3 and Section 4.4 of this paper.

5.3. Example of Overlap Visualization

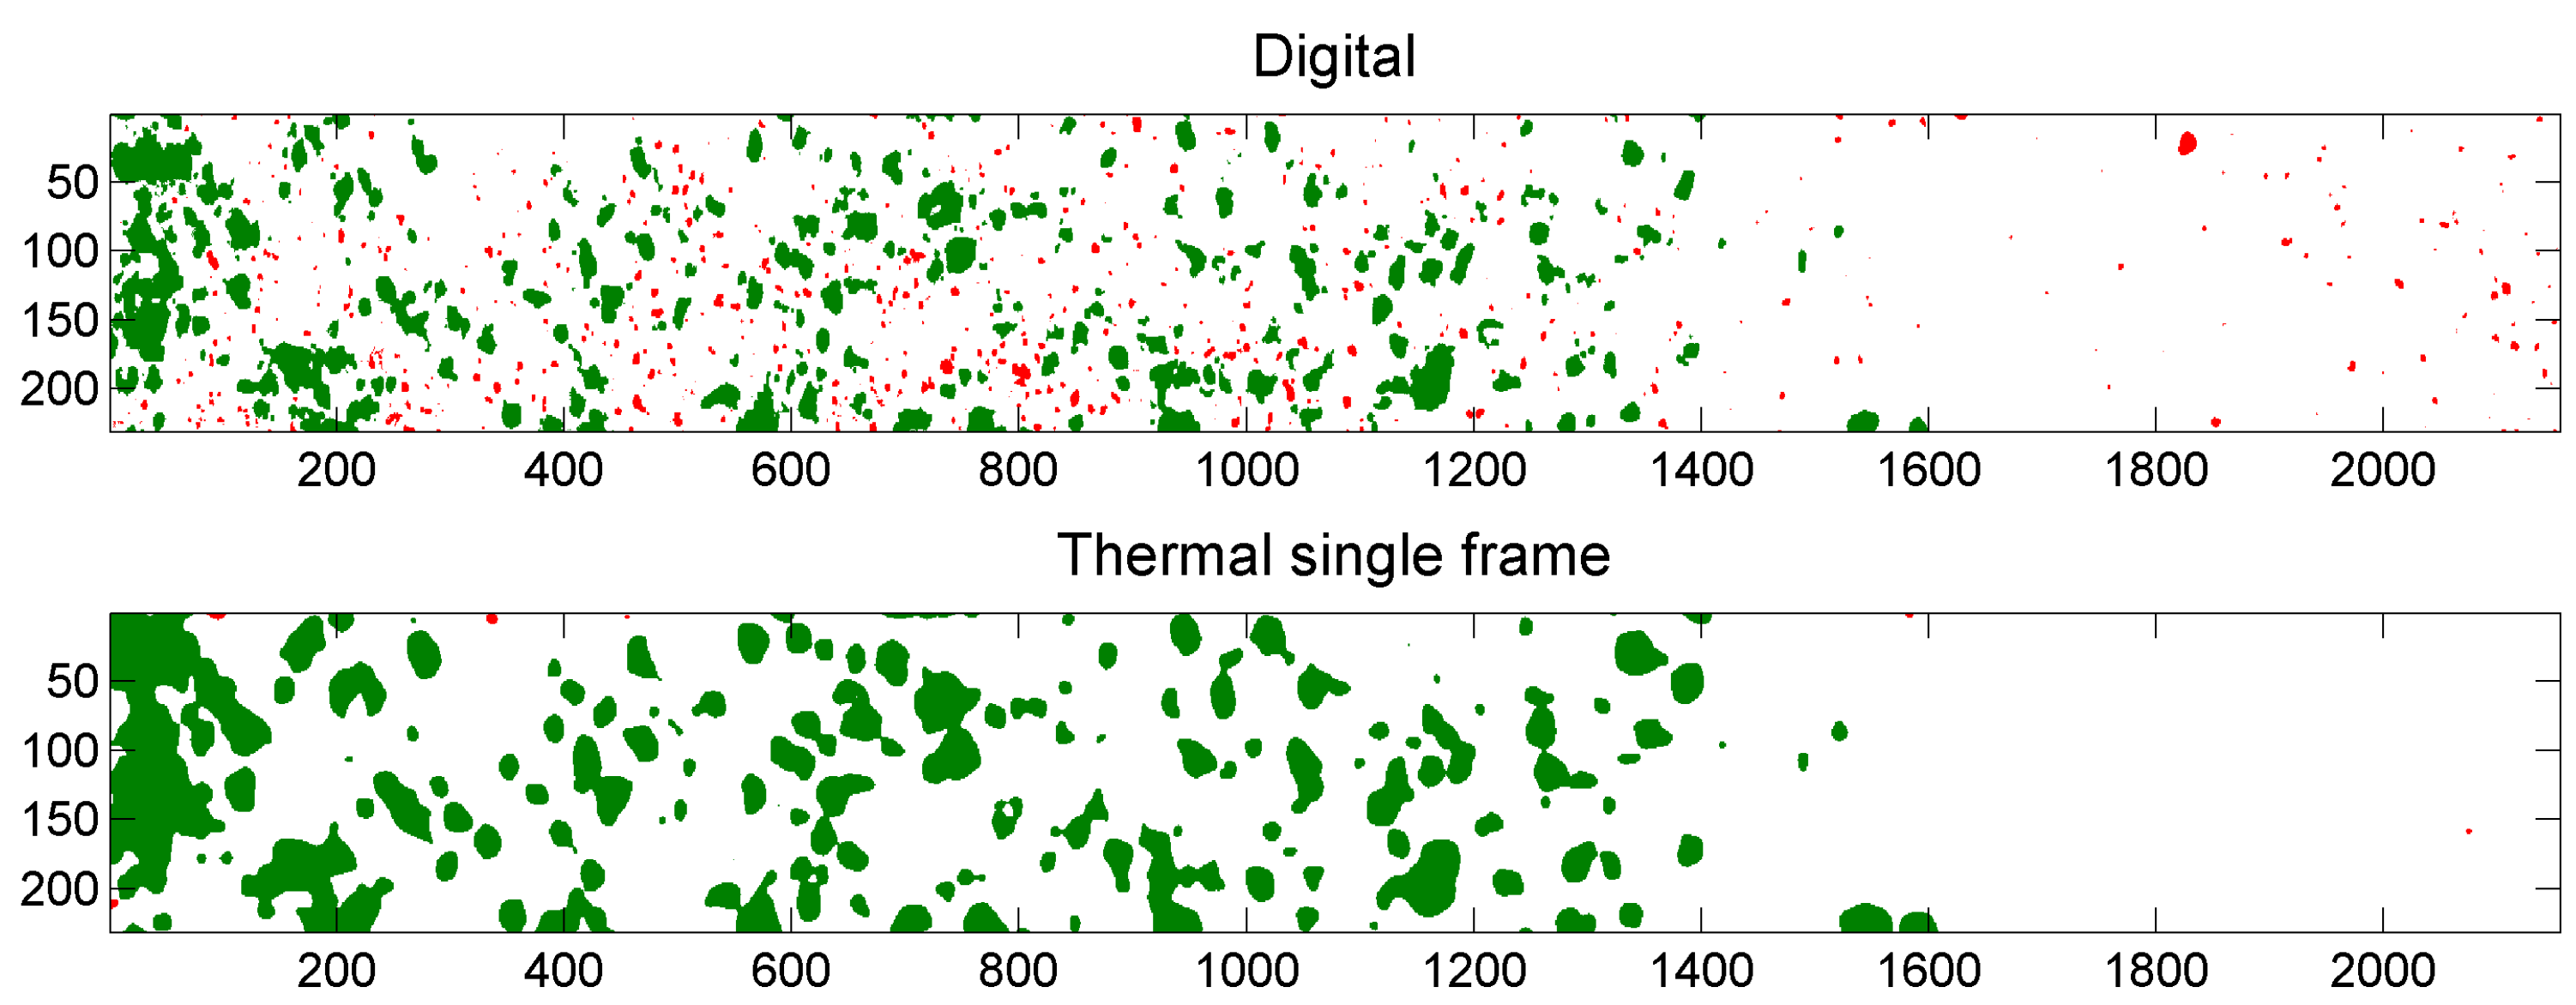
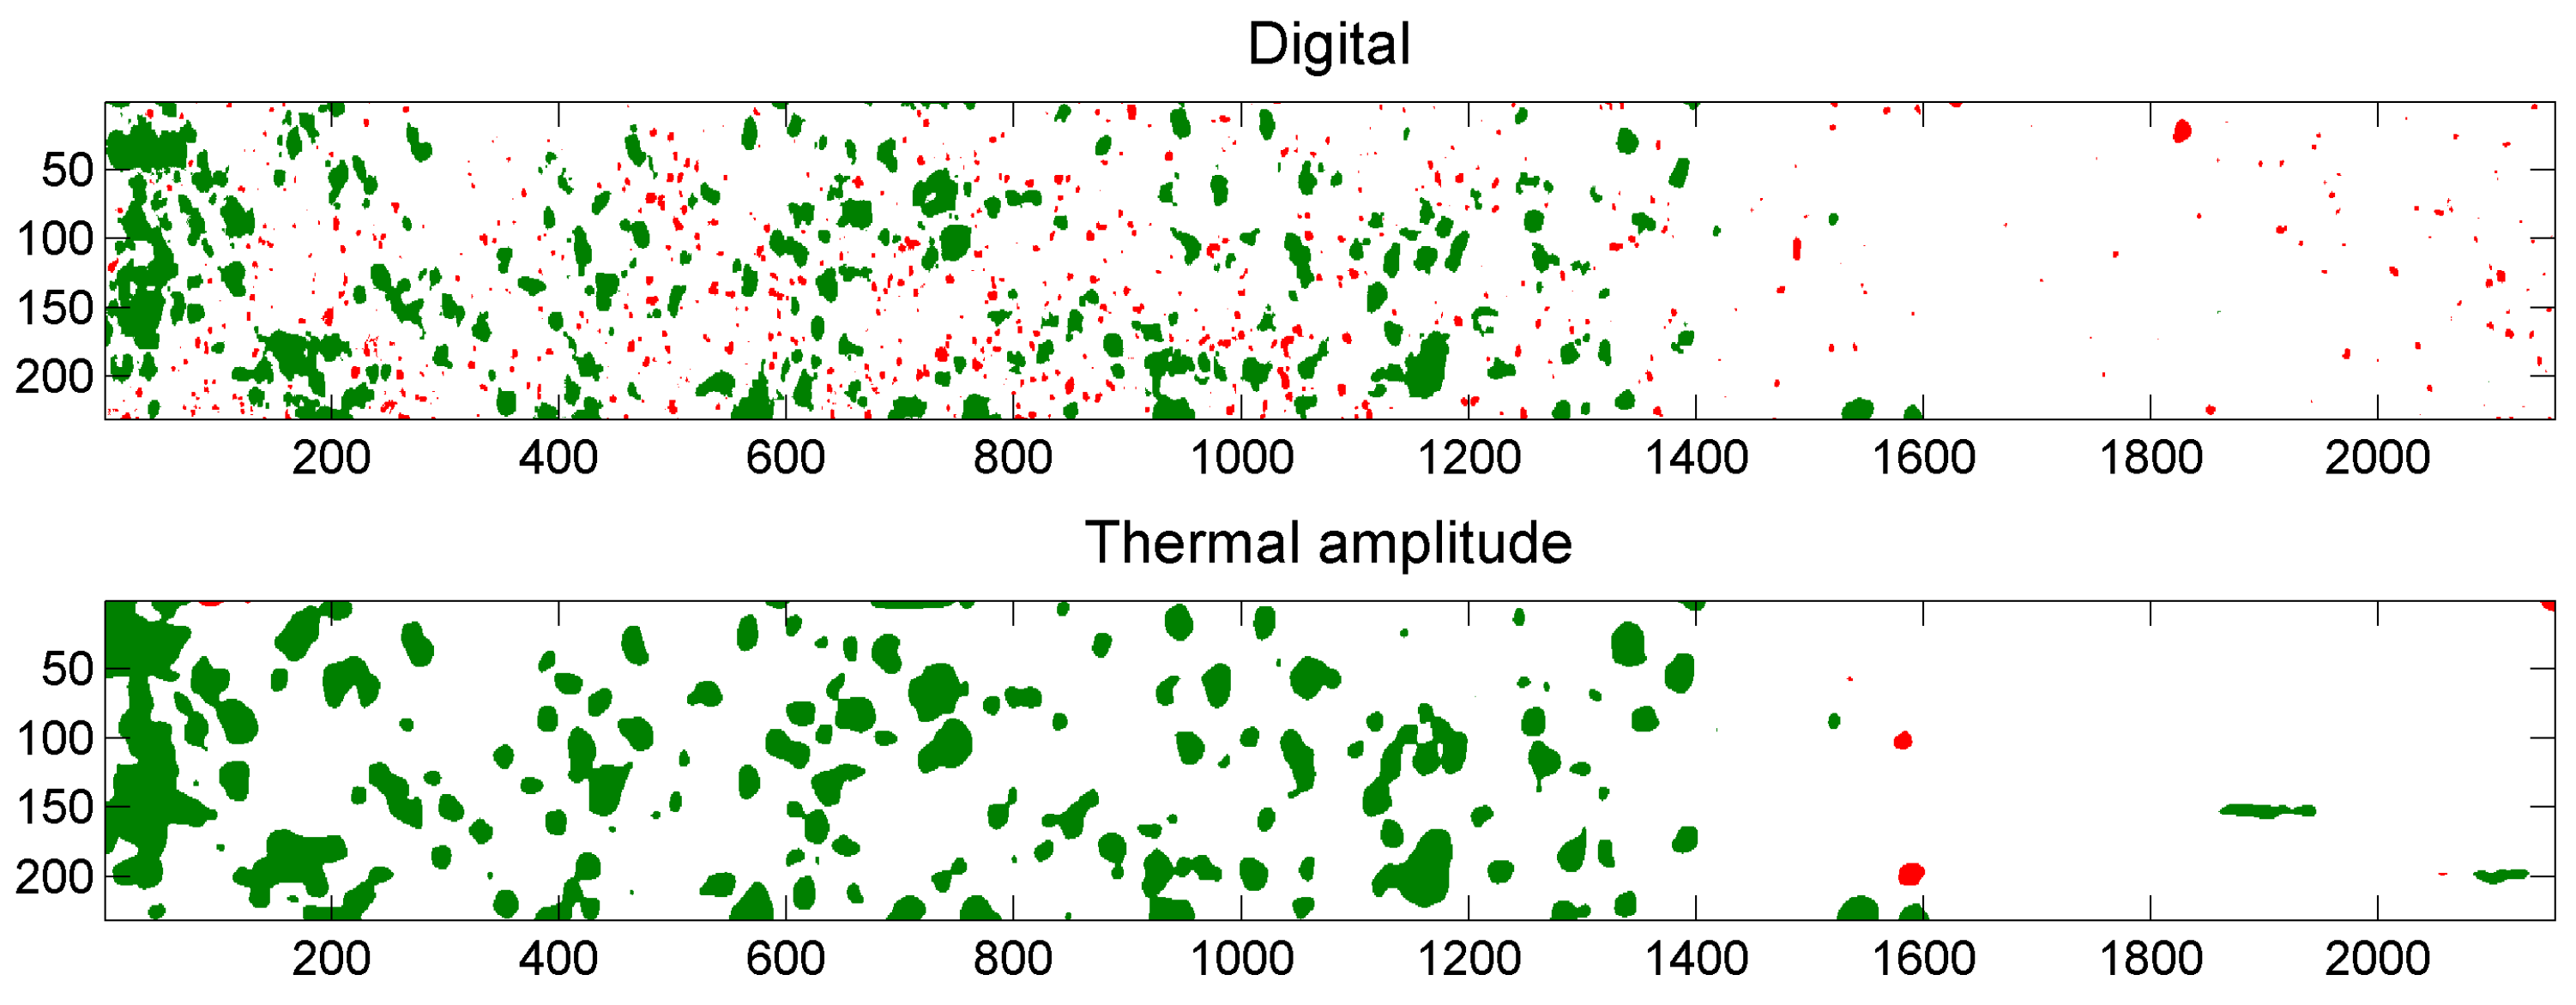
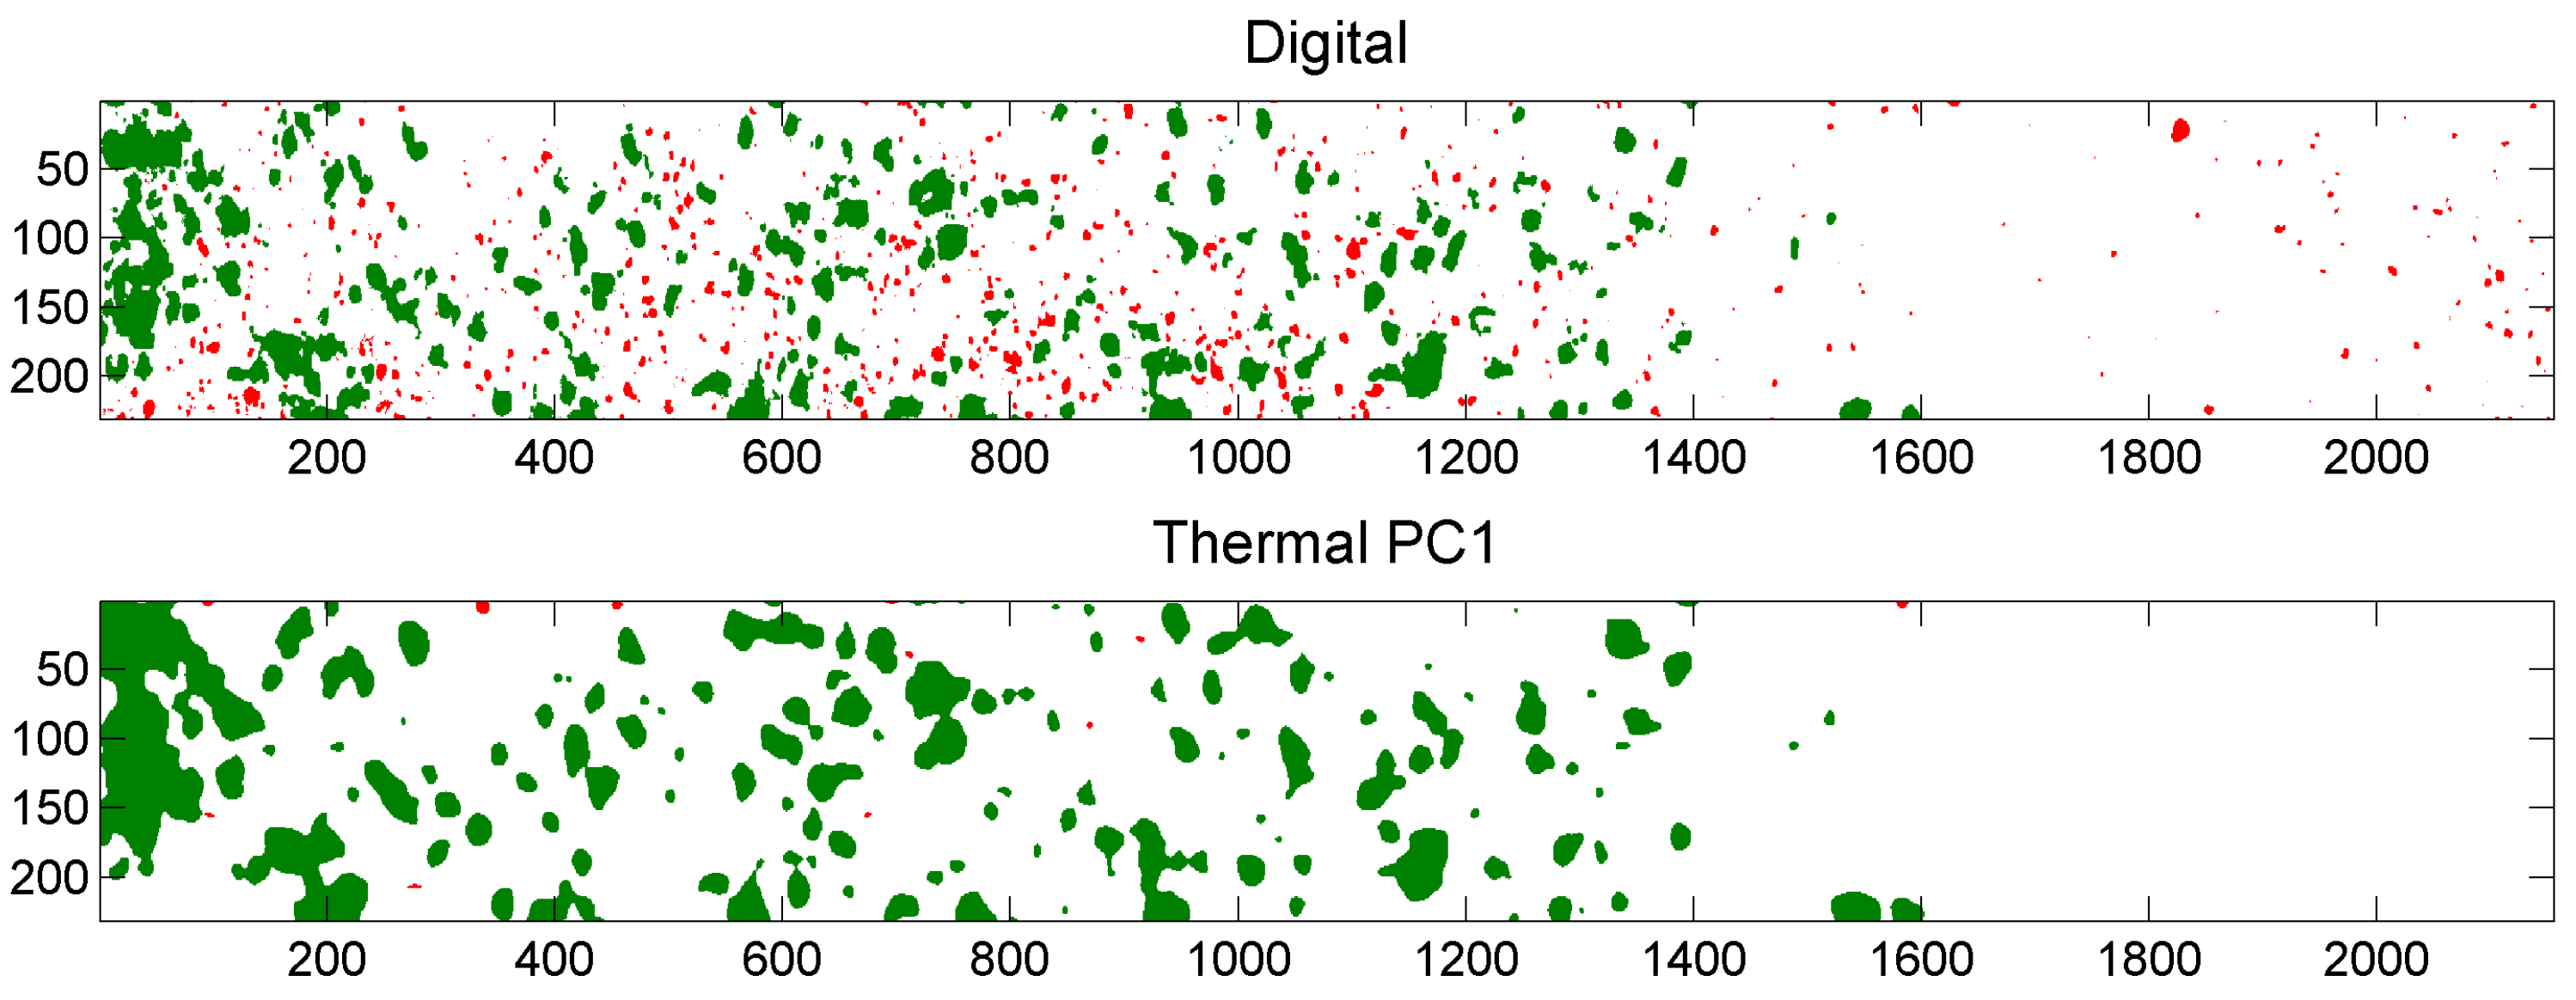
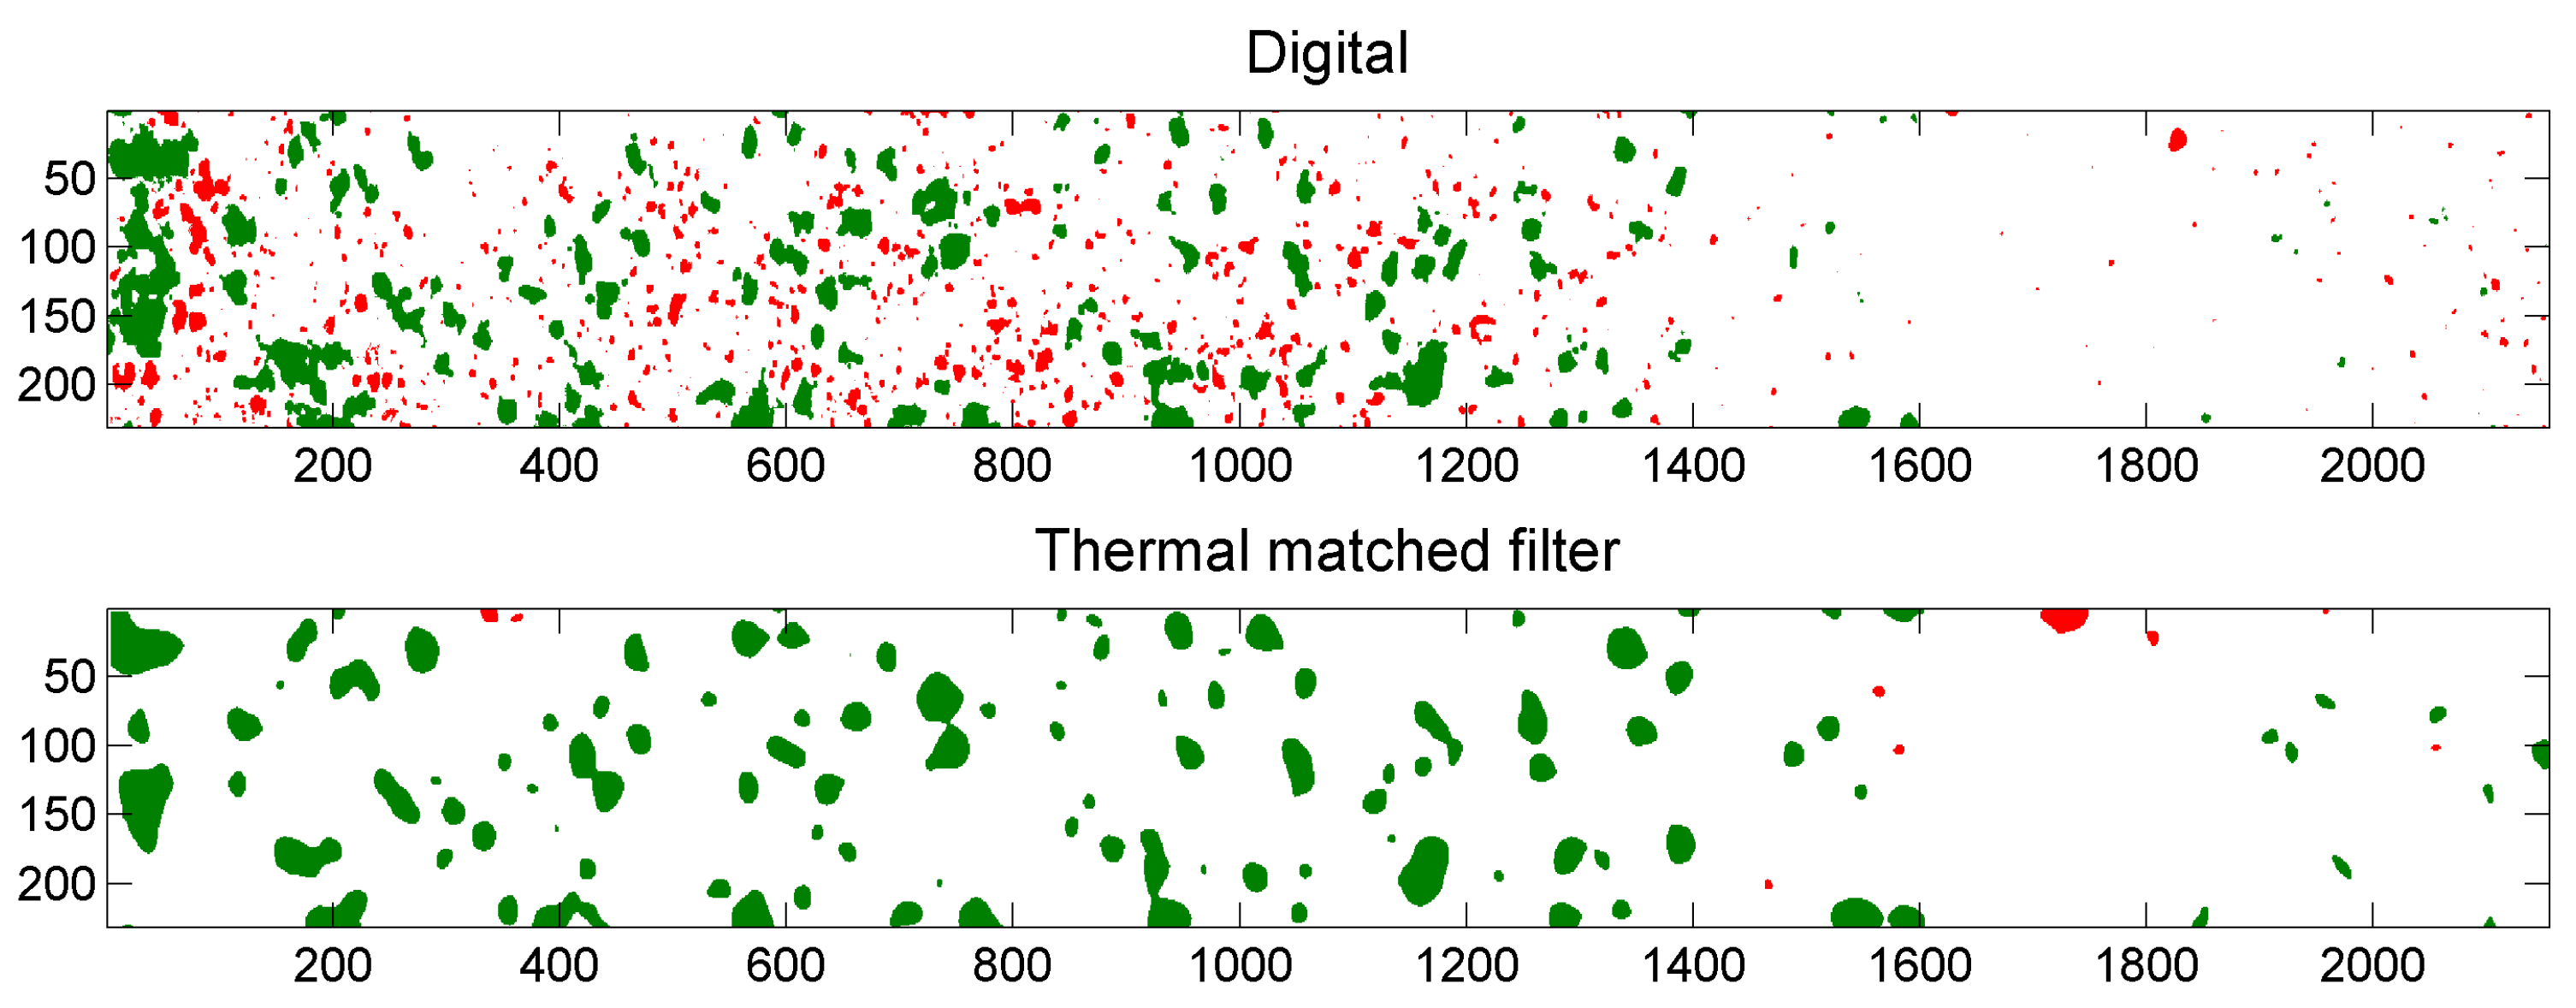
In Figure 5, the overlap between the digital reference image and the thermal output image “single frame” of Sample 28 is visualized. The top image shows the binarized digital image. Particles in green overlap with a particle in the binarized thermal output image. Particles in red only occur in the digital image. The bottom image shows the binarized thermal output image. Particles in green overlap with a particle in the binarized digital image. Particles in red only occur in the thermal output image. Figure 6, Figure 7, Figure 8, Figure 9 and Figure 10 are similar for respectively “p2”, “TSR p5”, “amplitude”, “PC1” and “matched filter”. It is evident from these overlap images that a large amount of very small particles present in the digital image does not occur in any of the thermal output images. This phenomenon is due to the resolution obtained in the digital imaging setup being much higher (0.0417 mm per pixel) than the resolution obtained in the thermal imaging setup (0.3165 mm per pixel). Although the overlap images already provide a visual impression regarding the detection capabilities of the different thermal image processing methods, they only represent the results for one sample. The reader is therefore guided towards the next section for a quantitative comparison of the six thermal output images.

5.4. Comparison of Detection Performances of the Thermal Data Processing Methods

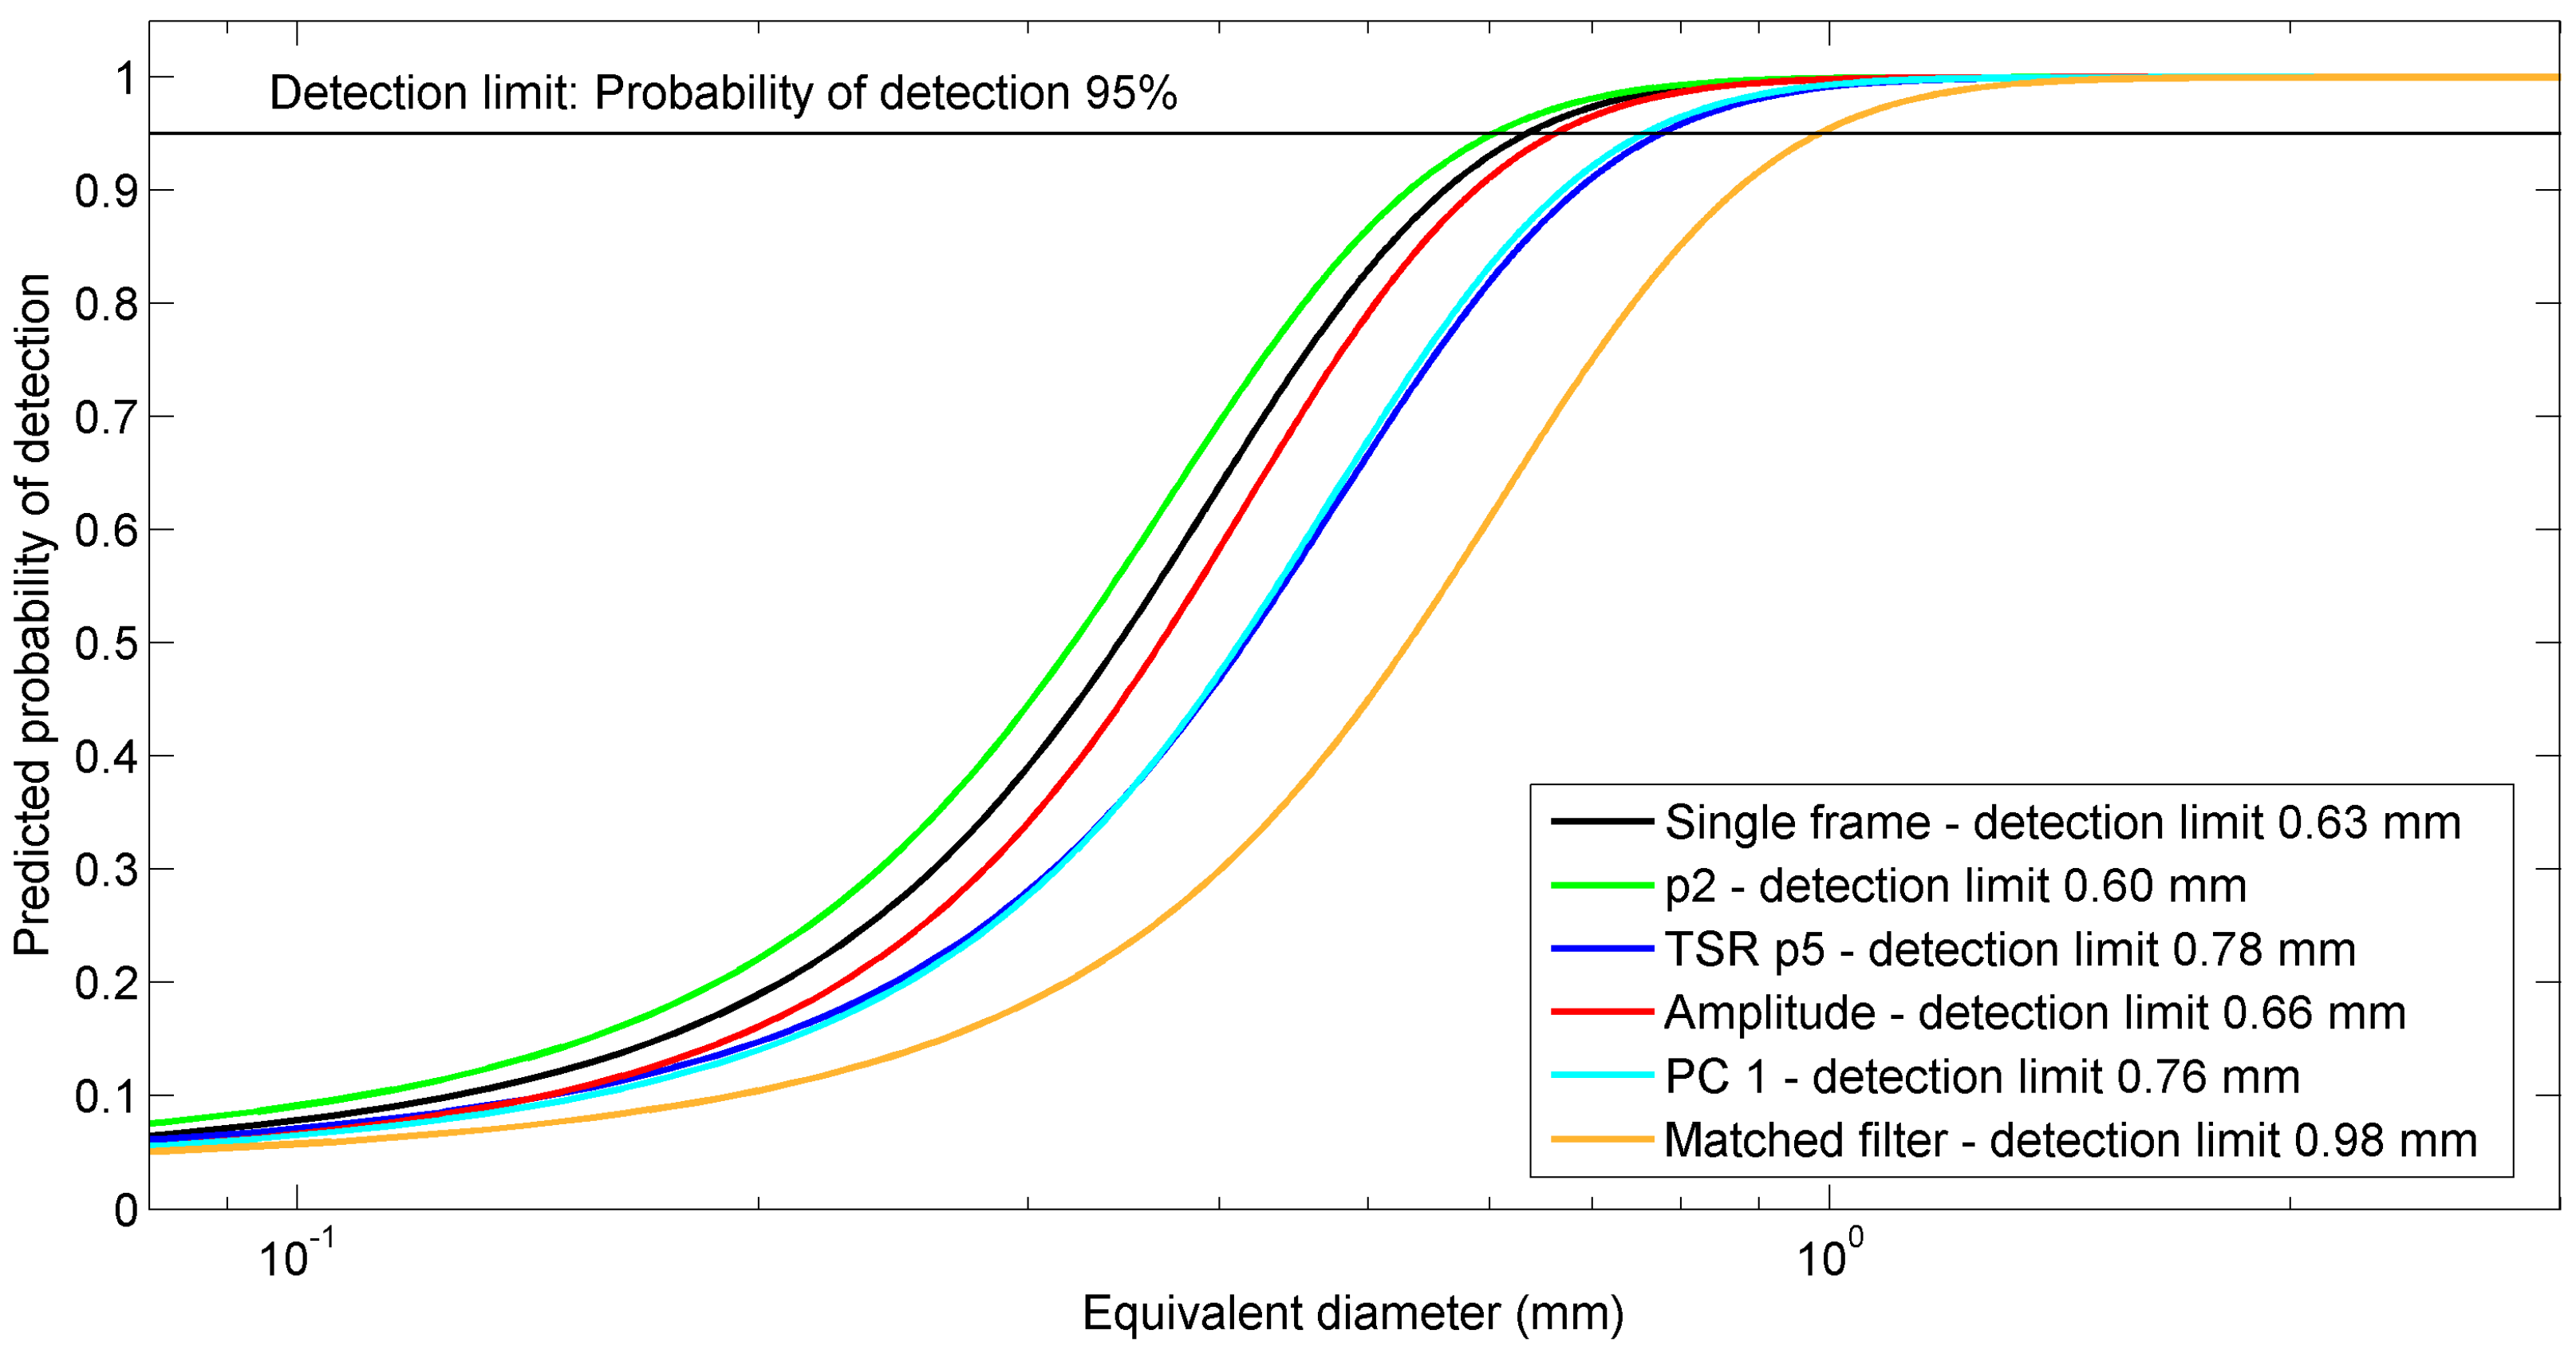
The results of the full factorial binary logistic regression defined in Equation (5) are shown in Table 1. Since all interactions included in the model have a significant effect (α = 0.05), no further model reduction was performed. As expected, the probability to detect a particle is positively related to its equivalent diameter D (p < 0.0001). The “amplitude” method (X3) has a p-value > α , yet since the interaction of X3 and D is significant (p < 0.0001), the “amplitude” method still has a significantly different profile from the “single frame” method. In general, the odds ratio is used to interpret the regression coefficients in a binary logistic regression. The presence of interaction terms in this model, however, causes the regression coefficients to be no longer interpretable. Based on the odds ratios, a multiple comparison test was performed for all six thermal processing methods. The regression curves for all methods were found to be significantly different. The regression curves of TSR p5 and PC1 were only borderline significantly different (p = 0.0315).
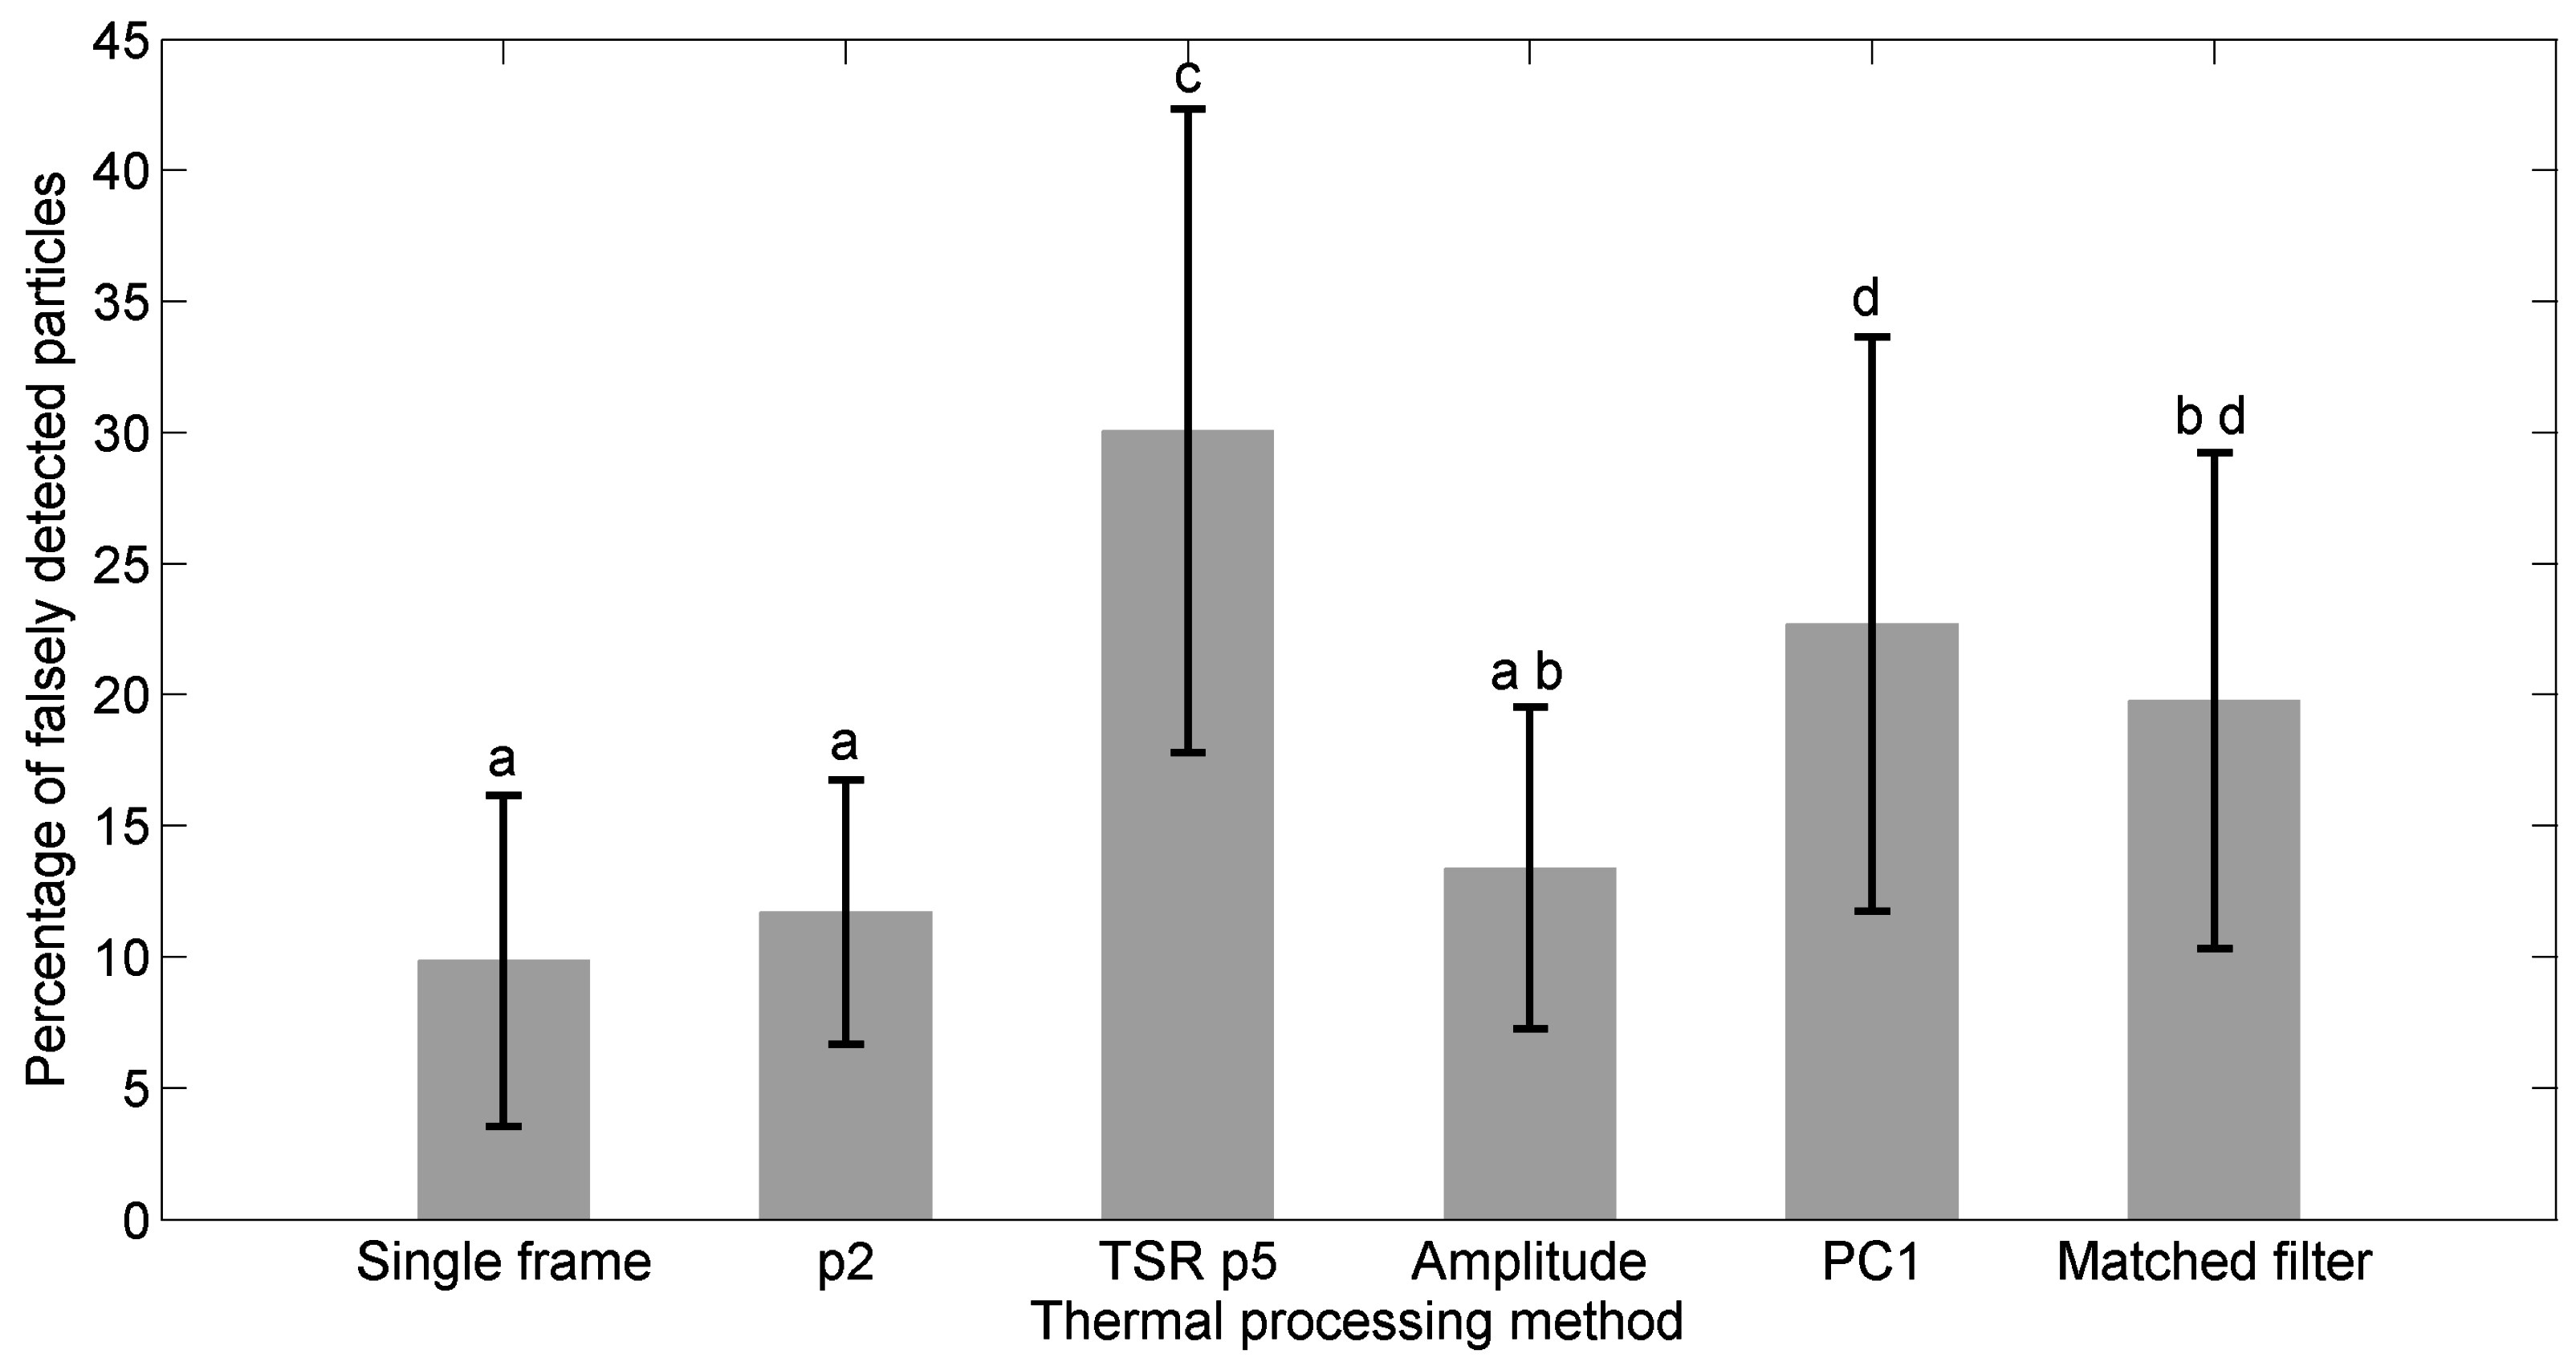
A graphical representation of the model is presented in Figure 11. In this figure, the probability of detection is plotted as a function of the equivalent diameter for each of the thermal processing methods. A detection limit is defined as the equivalent diameter in mm at which the probability of detection equals 95%. The lowest detection limit, an equivalent diameter of 0.60 mm, was obtained for the “p2” method. Detection limits of 0.63 mm, 0.66 mm, 0.76 mm, 0.78 mm and 0.98 mm were obtained for the “single frame” method, the “amplitude” method, the “PC1” method, the “TSR p5” method and the “matched filter” method, respectively. The curves of the “TSR p5” method and the “PC1” method are very close to each other, illustrating the borderline significant difference found in the multiple comparison test. Figure 12 presents the mean percentage of falsely-detected particles for the six types of thermal output images. The mean percentage of falsely-detected particles is lowest for the “single frame” method. However, no significant difference (α = 0.05) was detected between the mean percentage of falsely-detected particles of the methods “single frame”, “p2” and “amplitude”. The percentage of falsely-detected particles was significantly higher for the “TSR p5” method than for all other methods. In Table 2, the processing times required to process one sample are depicted for each of the six thermal processing methods. Since “single frame” is based on a single frame, it has a much shorter processing time than the other methods, which use information of all 841 thermal images.

5.5. Effect of Start Time of Recording after Sealing on Detection Performances

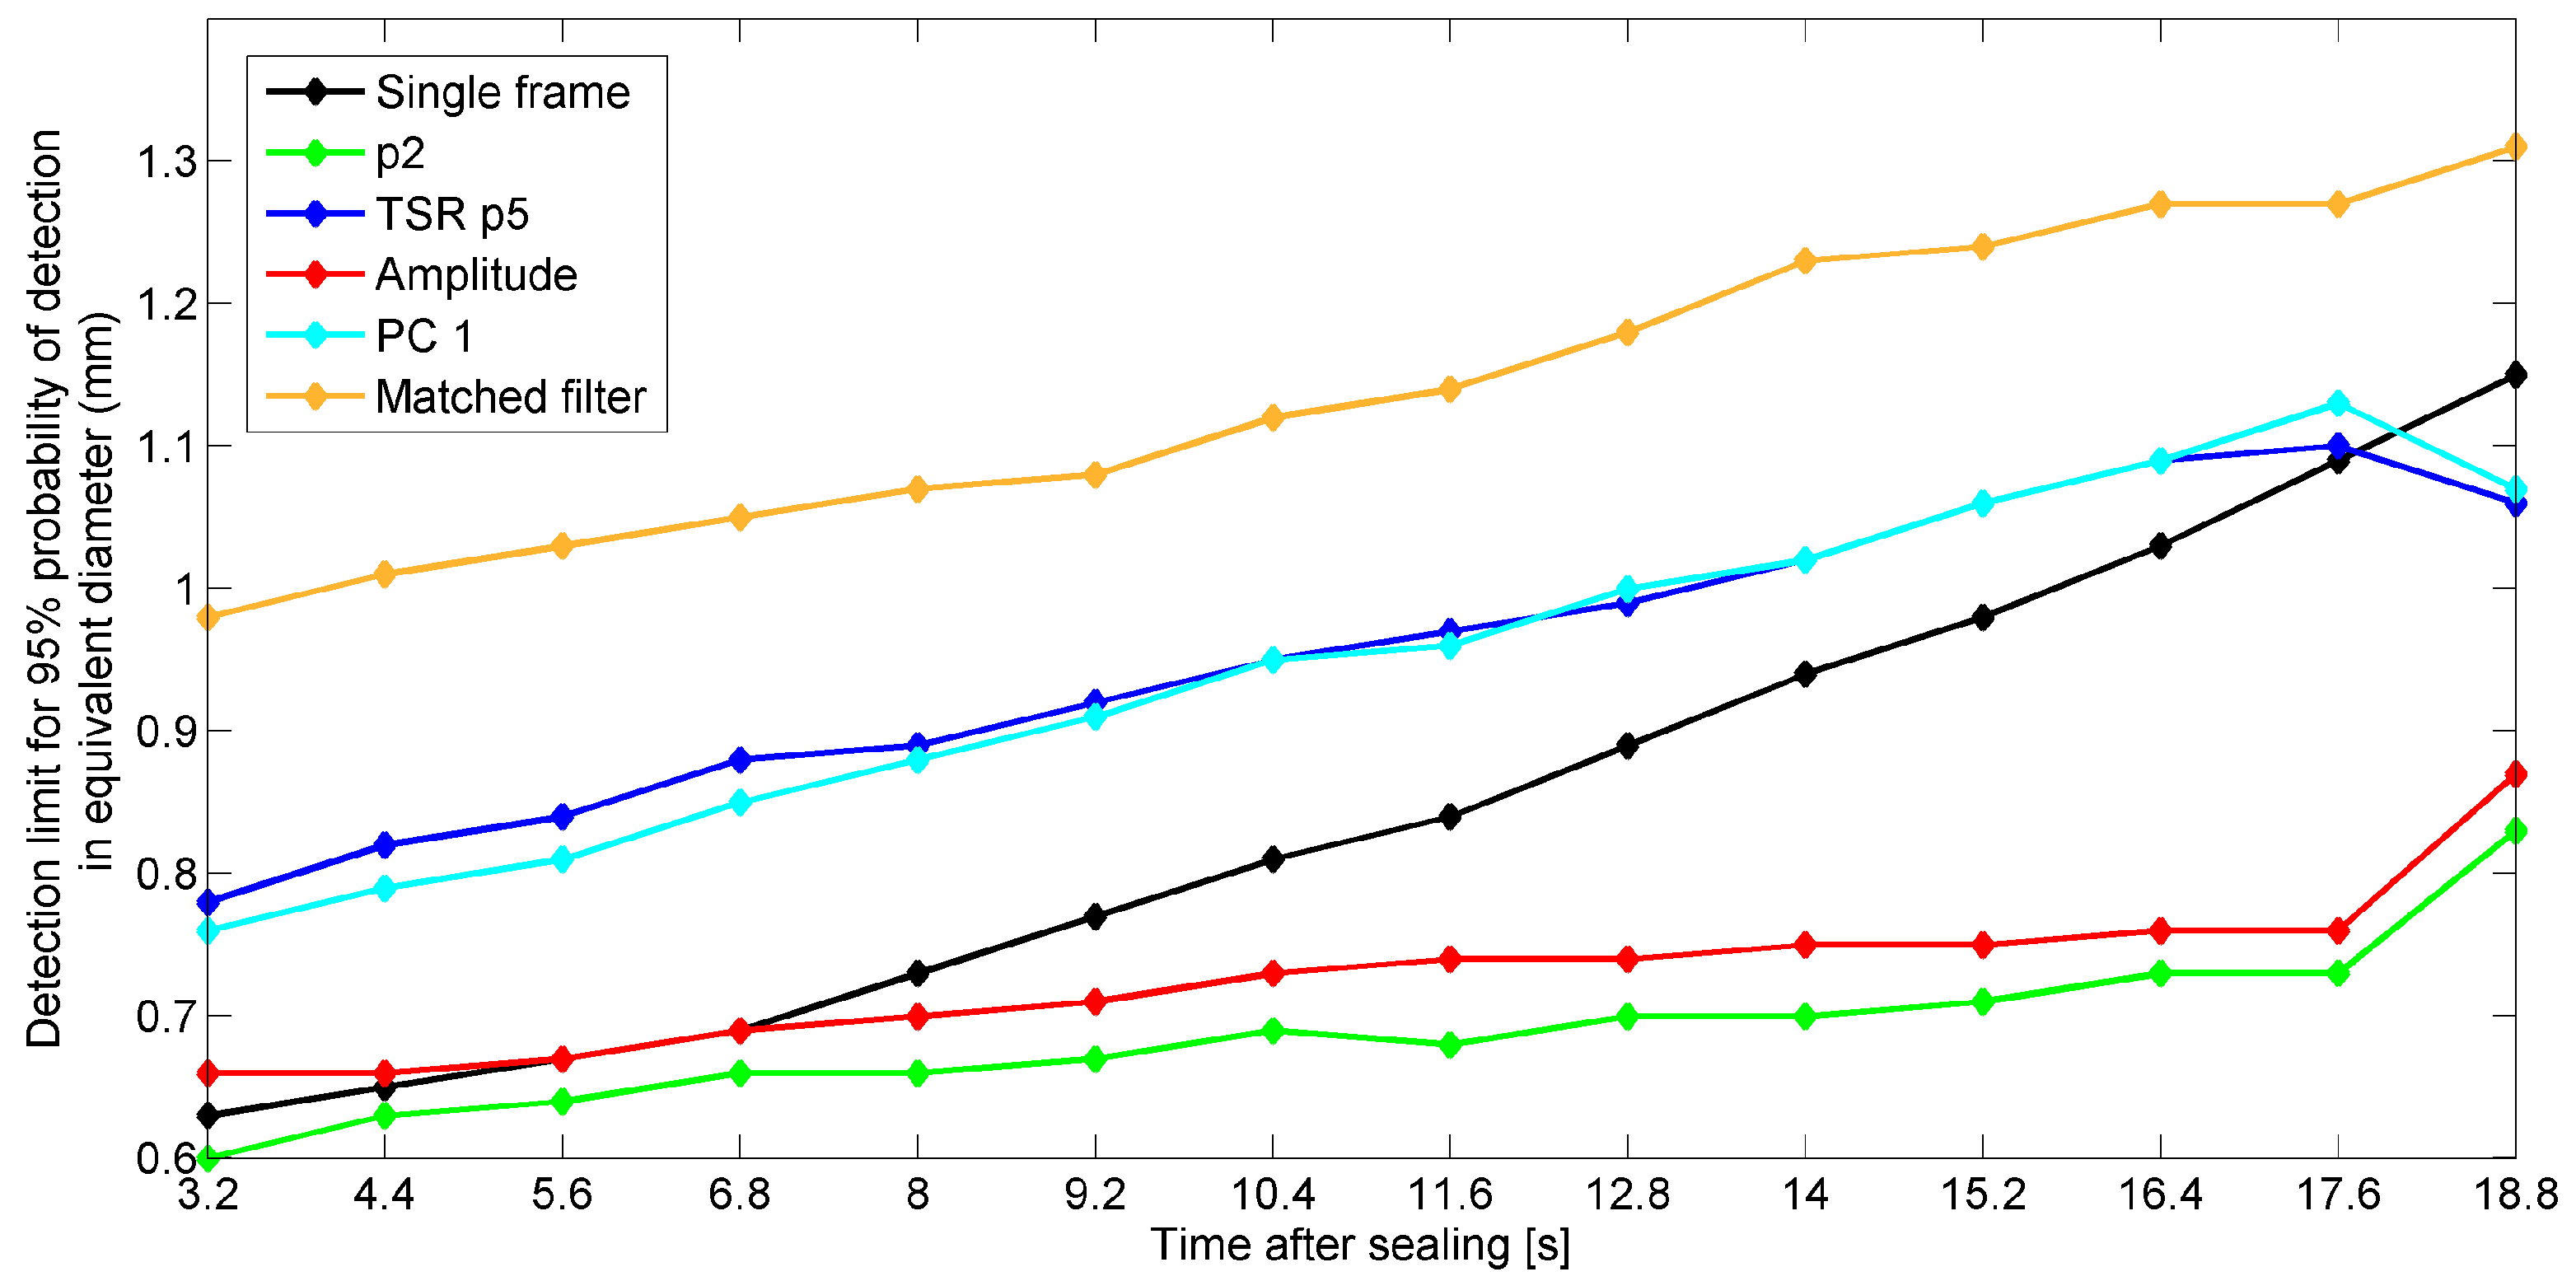
As described in Section 4.4.5, the effect of the time after sealing at which image recording was started on the detection performances of the “single frame”, “p2”, “TRS p5”, “amplitude”, “PC1” and “matched filter” methods was studied. The results are presented in Figure 13. The detection limit of the “single frame” method increases quadratically with the recording time after sealing. This increase is less pronounced for the “p2” and “amplitude” methods. The detection limit of the “p2” method is lower than that of the single frame method for all recording start times. The detection limits of “amplitude”, “TSR p5” and “PC1” decrease below that of the single frame method at recording start times of, respectively, 6.8 s, 18.8 s and 18.8 s. The detection limit of the “matched filter” method is highest for all recording start times.
Figure 14 shows the percentage of falsely-detected particles as a function of the recording start time after sealing. The increase in the percentage of falsely-detected particles is less pronounced for the “p2” and “amplitude” methods than for the “single frame” method. The “TSR p5” method results in a large percentage of falsely-detected particles for all recording start times. An ANOVA procedure as described in Section 4.4.3 was performed at each recording start time to detect significant differences (α = 0.05) between the methods. The percentage of falsely-detected particles of the “single frame” method was found to be significantly higher than that of the “p2” method for recording start times from 14 s–18.8 s, than that of the “amplitude” method for recording start times from 15.2 s–18.8 s and than that of the “matched filter” method for a recording start time of 18.8 s. The percentage of falsely-detected particles of the “single frame” method is not significantly higher than that of the “TSR p5” method and the “PC1” method for any of the recording start times considered.

6. Discussion

The lowest detection limit was obtained for the method based on the intercept of a first order fit of the cooling profiles in the logarithmic domain (“p2”). The second and third lowest detection limits were obtained for the methods based on the first thermal image (“single frame”) and on PPT (“amplitude”). The highest detection limit was obtained for the “matched filter” output. As mentioned in the “Related Work” section, a matched filter requires prior knowledge of the signal to be detected. The contaminating particles in this application were rather diverse in size and shape. Therefore, the assumption of the thermal profile of a “standard” defect used in the template of the matched filter did not perfectly apply to all defects present. A further exploration of the use of a 3D matched filter is of interest for active thermography applications in which the defect to be detected is well defined. The methods based on TSR (“TSR p5”) and PCT (“PC1”) have rather low detection capabilities in this case study, although it has been shown in the literature that they can be very effective for defect contrast enhancement. This can be explained by the fact that the application considered in this study is characterized by some practical limitations preventing the implementation of an ideal pulsed thermography experiment. Within the time frame in which thermal images were recorded, there are only subtle slope differences in the cooling curves of contaminated and clean seal areas. Methods typically used for advanced data processing in pulsed thermography (such as PPT, TSR and PCT) were developed for data showing a larger difference in the shape of the cooling profiles of sound and defective areas. This also explains why PPT analysis resulted in low phase contrasts and why TSR using first and second derivatives is not suited for the data recorded in this study. Since the time frame in which thermal images can be recorded is defined by practical limitations of the industrial application, i.e., in earlier thermograms, the seal is still moving downwards and recording later thermograms would require a longer standstill of the packaging machine, this study aims at obtaining the best possible detection capabilities given this time frame limitation. It is expected that detection limits can be further decreased if thermal images at earlier times after sealing could have been recorded. It would be possible to retrieve more information on the thermal images in the first part of the cooling profile by applying an image registration algorithm to the thermograms recorded of the seal while it is still in motion. Although these images are more disturbed by the thermal pattern caused by the ribbed seal bars and, thus, provide lower contrast if a single frame is considered (results not shown), adding them to the thermal image sequences might improve the detection limits of the advanced processing methods. Therefore, the development of an image registration algorithm to track moving seal samples is an interesting path for future research.
Although the TSR method provides an excellent fit of the cooling profiles of both clean and contaminated seal areas, this method does not provide better detection capabilities than the first order fit. Since this study aims at obtaining the best possible seal contamination detection performance and not at obtaining a perfect fit of the cooling profiles, the first order fit is in this case study preferred over the TSR method based on a fourth order fit.
The mean percentage of falsely-detected particles is lowest for the “single frame”, “p2” and “amplitude” methods, with no significant difference among these methods. The percentage of falsely-detected particles is significantly higher for the “TSR p5” method than for all other methods.
Although “p2” has a lower detection limit than the “single frame” method, the time required for the data processing is longer for the “p2” method than for the “single frame” method. It is, however, expected that the processing time of the “p2” method can be decreased to meet the needs of industry by applying more efficient fitting algorithms and/or by using faster processors for the calculations.
It is important to note that the detection performance of the “single frame” method depends strongly on how fast after thermal excitation this single frame can be acquired. This increase is less pronounced for the “p2” and “amplitude” methods. The detection limit of the “p2” method is lower than that of the single frame method for all recording start times. The detection limits of “amplitude”, “TSR p5” and “PC1” decrease below that of the single frame method at recording start times of, respectively, 6.8 s, 18.8 s and 18.8 s. The detection limit of the “matched filter” method is highest for all recording start times. The percentage of falsely-detected particles of the “single frame” method is also highly influenced by the recording time. The percentage of falsely-detected particles was found to be significantly higher than that of the “p2” method for recording start times from 6.8 s–18.8 s after sealing, than that of the “p1” method for recording start times from 14 s–18.8 s after sealing and than that of the “matched filter” method for a recording start time of 18.8 s after sealing.
Based on the previous paragraphs, it can be concluded that active thermography using advanced data processing based on a fit of the cooling profiles provides added value for the detection of seal contamination in the considered packaging application compared to using information from a single thermal frame only. Moreover, the detection limit of the “single frame” method depends strongly on the time at which this frame was recorded, while advanced data processing methods taking into account the cooling profile as a function of time are more robust with respect to the recording time after sealing, making them more generally applicable than the “single frame” method. Moreover, when several possible sources of seal contamination with diverse thermal and physical properties are present (e.g., both solid and liquid contaminants), selecting a single frame that shows optimal detection performance for all contaminants is challenging and requires a compromise. In such applications, an advanced data processing approach for active thermography that considers multiple frames in the cooling profile of the seal is especially preferred.
To judge the relevance of this work for the (food) packaging industry, knowledge is required on the critical contaminant size that jeopardizes seal strength and integrity. The literature mainly reports on the effect of seal leaks rather than seal contamination. Moreover, since the defect size that causes significant quality degradation depends on several factors, it is virtually impossible to define one critical defect size for all applications. The food (packaging) producer can use destructive tests to study the impact of a certain contaminant on seal strength and integrity. This study can serve as a basis to judge whether the detection limit obtained in this work meets the needs of a specific application. If lower detection limits are needed, further research should be performed to optimize the experimental setup (e.g., by adapting IR camera optics) and/or to explore alternative thermal image processing methods (e.g., methods described in [19]). Overall, we believe that active thermography holds promise as a robust and accurate detection method for the packaging industry.
The coffee particles used as a contaminant in this study serve as a reference for other small, granular contaminants. Other solid contaminants, air and liquid contaminants in the seal are also expected to be detectable, provided that the difference in thermo-physical properties between contaminant and packaging film is large enough to cause a measurable temperature contrast [17].
A practical consideration the food (packaging) producer should make when opting for infrared thermography to perform seal quality inspection is the positioning of the thermal camera in the production line. For a vertical form fill and seal packaging machine, this positioning is quite straightforward, but other industrial packaging lines might be less accessible.

7. Conclusions

In this study, a pulsed-type active thermography experiment was performed to detect solid contaminants in between seals of heat-sealed flexible food packages. In the aim of evaluating the added value of using advanced data processing approaches for active thermography, the detection performances of six methods (based on a single frame, a fit of the cooling profile, thermal signal reconstruction, pulsed phase thermography, principal component thermography and a matched filter) were compared. Moreover, the effect of the time after sealing at which recording was started on the detection performances of those methods was studied.
The lowest detection limit was found for the method based on a fit of the cooling profiles. Using this method, particles with an equivalent diameter of 0.60 mm were detected with a probability of 95%. This method also showed a mean percentage of falsely-detected particles that was not significantly different from the lowest mean percentage of falsely-detected particles obtained for the method based on a single frame.
Moreover, the detection capabilities of the method based on a fit of the cooling profiles do not depend strongly on the time after sealing at which recording of the thermal images was started, making it a robust and generally applicable method.

Acknowledgments

The research leading to these results was partially funded by the European Union’s Seventh Framework Programme for research, technological development and demonstration under Grant Agreement No. 311987. Another part of the results was obtained in the framework of a Flemish innovation partnership (VIS 100942) supported by the Institute for the Promotion of Innovation by Science and Technology in Flanders, Belgium (IWT), coordinated by the Pack4Food consortium. Bart De Ketelaere is research manager at the KU Leuven, supported by the Industrial Research Fund (IOF).

Author Contributions

Karlien D'huys and Bart De Ketelaere developed the experiments. Karlien D'huys performed the experiments. Karlien D'huys and Bart De Ketelaere analyzed the data. Karlien D'huys, Bart De Ketelaere and Wouter Saeys wrote the paper and reviewed drafts of the paper.

Conflicts of Interest

The authors declare no conflict of interest.

References

  1. Robertson, G.L. Food Packaging: Principles and Practice; CRC Press Taylor & Francis Group: Boca Raton, FL, USA, 2013. [Google Scholar]
  2. Dudbridge, M. Handbook of Seal Integrity in the Food Industry, 1st ed.; John Wiley & Sons: West Sussex, UK, 2016. [Google Scholar]
  3. Ostyn, B.; Darius, P.; De Baerdemaeker, J.; De Ketelaere, B. Statistical monitoring of a sealing process by means of multivariate accelerometer data. Qual. Eng. 2007, 19, 299–310. [Google Scholar] [CrossRef]
  4. Ozguler, A.; Morris, S.A.; O’Brien, W.D., Jr. Ultrasonic imaging of micro-leaks and seal contamination in flexible food packages by the pulse-echo technique. J. Food Sci. 1998, 63, 673–678. [Google Scholar] [CrossRef]
  5. Lampi, R.A.; Schulz, G.L.; Ciavarini, T.; Burke, P.T. Performance and integrity of retort pouch seals. Food Technol. 1976, 30, 38–48. [Google Scholar]
  6. Frazier, C.H.; Tian, Q.; Ozguler, A.; Morris, S.A.; O’Brien, W.D., Jr. High contrast ultrasound images of defects in food package seals. IEEE Trans. Ultrason. Ferroelectr. Freq. Control 2000, 47, 530–539. [Google Scholar] [CrossRef] [PubMed]
  7. Mihindukulasuriya, S.; Lim, L.-T. Effects of liquid contaminants on heat seal strength of low-density polyethylene film. Packag. Technol. Sci. 2011, 25, 271–284. [Google Scholar] [CrossRef]
  8. Bach, S.; Thürling, K.; Majschak, J.-P. Ultrasonic sealing of flexible packaging films—Principles and characteristics of an alternative sealing method. Packag. Technol. Sci. 2012, 25, 233–248. [Google Scholar] [CrossRef]
  9. Pascall, M.A.; Richtsmeier, J.; Riemer, J.; Farahbakhsh, B. Non-destructive packaging seal strength analysis and leak detection using ultrasonic imaging. Packag. Technol. Sci. 2002, 15, 275–285. [Google Scholar] [CrossRef]
  10. ASTM F2338. Standard Test Method for Nondestructive Detection of Leaks in Packages by Vacuum Decay Method; Active Standard ASTM: West Conshohocken, PA, USA, 2013. [Google Scholar]
  11. ASTM F2391-05. Standard Test Method for Measuring Package and Seal Integrity Using Helium as the Tracer Gas; Active Standard ASTM: West Conshohocken, PA, USA, 2011. [Google Scholar]
  12. Morita, Y.; Dobroiu, A.; Otani, C.; Kawase, K. Real-time terahertz diagnostics for detecting microleak defects in the seals of flexible plastic packaging. J. Adv. Mech. Des. Syst. 2007, 1, 338–345. [Google Scholar] [CrossRef]
  13. Shuangyang, Z. Fast inspection of food packing seals using machine vision. In Proceedings of the International Conference on Digital Manufacturing & Automation, Changcha, China, 18–20 December 2010; pp. 724–726.
  14. Barnes, M.; Dudbridge, M.; Duckett, T. Polarised light stress analysis and laser scatter imaging for non-contact inspection of heat seals in food trays. J. Food Eng. 2012, 112, 183–190. [Google Scholar] [CrossRef] [Green Version]
  15. Song, Y.S.; Gera, M.; Jain, B.; Koontz, J.L. Evaluation of a non-destructive high-voltage technique for the detection of pinhole leaks in flexible and semi-rigid packages for foods. Packag. Technol. Sci. 2014, 27, 423–436. [Google Scholar] [CrossRef]
  16. Maldague, X.P.V. Theory and Practice of Infrared Technology for Nondestructive Testing; Wiley: New York, NY, USA, 2001. [Google Scholar]
  17. Ibarra-Castanedo, C.; Tarpani, J.R.; Maldague, X.P.V. Nondestructive testing with thermography. Eur. J. Phys. 2013, 34, S91–S109. [Google Scholar] [CrossRef]
  18. Ignatowicz, S. Method and Apparatus for Analyzing Thermo-Graphic images to Detect Defects in Thermally Sealed Packaging. U.S. Patent 2007/0237201 A1, 11 October 2007. [Google Scholar]
  19. Ibarra-Castanedo, C.; González, D.; Klein, M.; Pilla, M.; Vallerand, S.; Maldague, X. Infrared image processing and data analysis. Infrared Phys. Technol. 2004, 46, 75–83. [Google Scholar] [CrossRef]
  20. Shepard, S.M. Temporal Noise Reduction, Compression and Analysis of Thermographic Image Data Sequences. U.S. Patent 6,516,084, 4 February 2003. [Google Scholar]
  21. Shepard, S.M.; Lhota, J.R.; Rubadeux, B.A.; Wang, D.; Ahmed, T. Reconstruction and enhancement of active thermographic image sequences. Opt. Eng. 2003, 42, 1337–1342. [Google Scholar] [CrossRef]
  22. Li, M.; Holland, S.D.; Meeker, W.Q. Statistical methods for automatic crack detection based on vibrothermography sequence-of-images data. Appl. Stoch. Models Bus. 2010, 26, 481–495. [Google Scholar] [CrossRef]
  23. Yoo, J.C.; Han, T.H. Fast normalized cross-correlation. Circ. Syst. Signal Process. 2009, 28, 819–843. [Google Scholar] [CrossRef]
  24. D’huys, K.; Saeys, W.; De Ketelaere, B. Detection of seal contamination in heat sealed food packaging based on active infrared thermography. In Proceedings of the Thermosense: Thermal Infrared Applications XXXVII, Baltimore, MD, USA, 20–24 April 2015.
  25. Ibarra-Castanedo, C.; Piau, J.-M.; Guilbert, S.; Avdelidis, N.P.; Genest, M.; Bendada, A.; Maldague, X.P.V. Comparative study of active thermography techniques for the nondestructive evaluation of honeycomb structures. Res. Nondestruct. Eval. 2009, 20, 1–31. [Google Scholar] [CrossRef]
  26. Rajic, N. Principal component thermography for flaw contrast enhancement and flaw depth characterization in composite structures. Compos. Struct. 2002, 58, 521–528. [Google Scholar] [CrossRef]
  27. Lewis, J.P. Fast normalized cross-correlation. Vis. Interface 1995, 10, 120–123. [Google Scholar]
  28. Brunelli, R. Template Matching Techniques in Computer Vision Theory and Practice; Wiley: New York, NY, USA, 2009. [Google Scholar]
  29. Briechle, K.; Hanebeck, U.D. Template matching using fast normalized cross correlation. In Proceedings of the Optical Pattern Recognition XII, Orlando, FL, USA, 16 April 2001.
  30. Otsu, N. A threshold selection method from gray-level histograms. IEEE Trans. Syst. Man Cybern. 1979, 9, 62–66. [Google Scholar] [CrossRef]
  31. Zack, G.W.; Rogers, W.E.; Latt, S.A. Automatic measurement of sister chromatid exchange frequency. J. Histochem. Cytochem. 1977, 25, 741–753. [Google Scholar] [CrossRef] [PubMed]
  32. Hochberg, Y.; Tamhane, A.C. Multiple Comparison Procedures; John Wiley & Sons: Hoboken, NJ, USA, 1987. [Google Scholar]
  33. Agresti, A. Categorical Data Analysis; Wiley: New York, NY, USA, 2012. [Google Scholar]
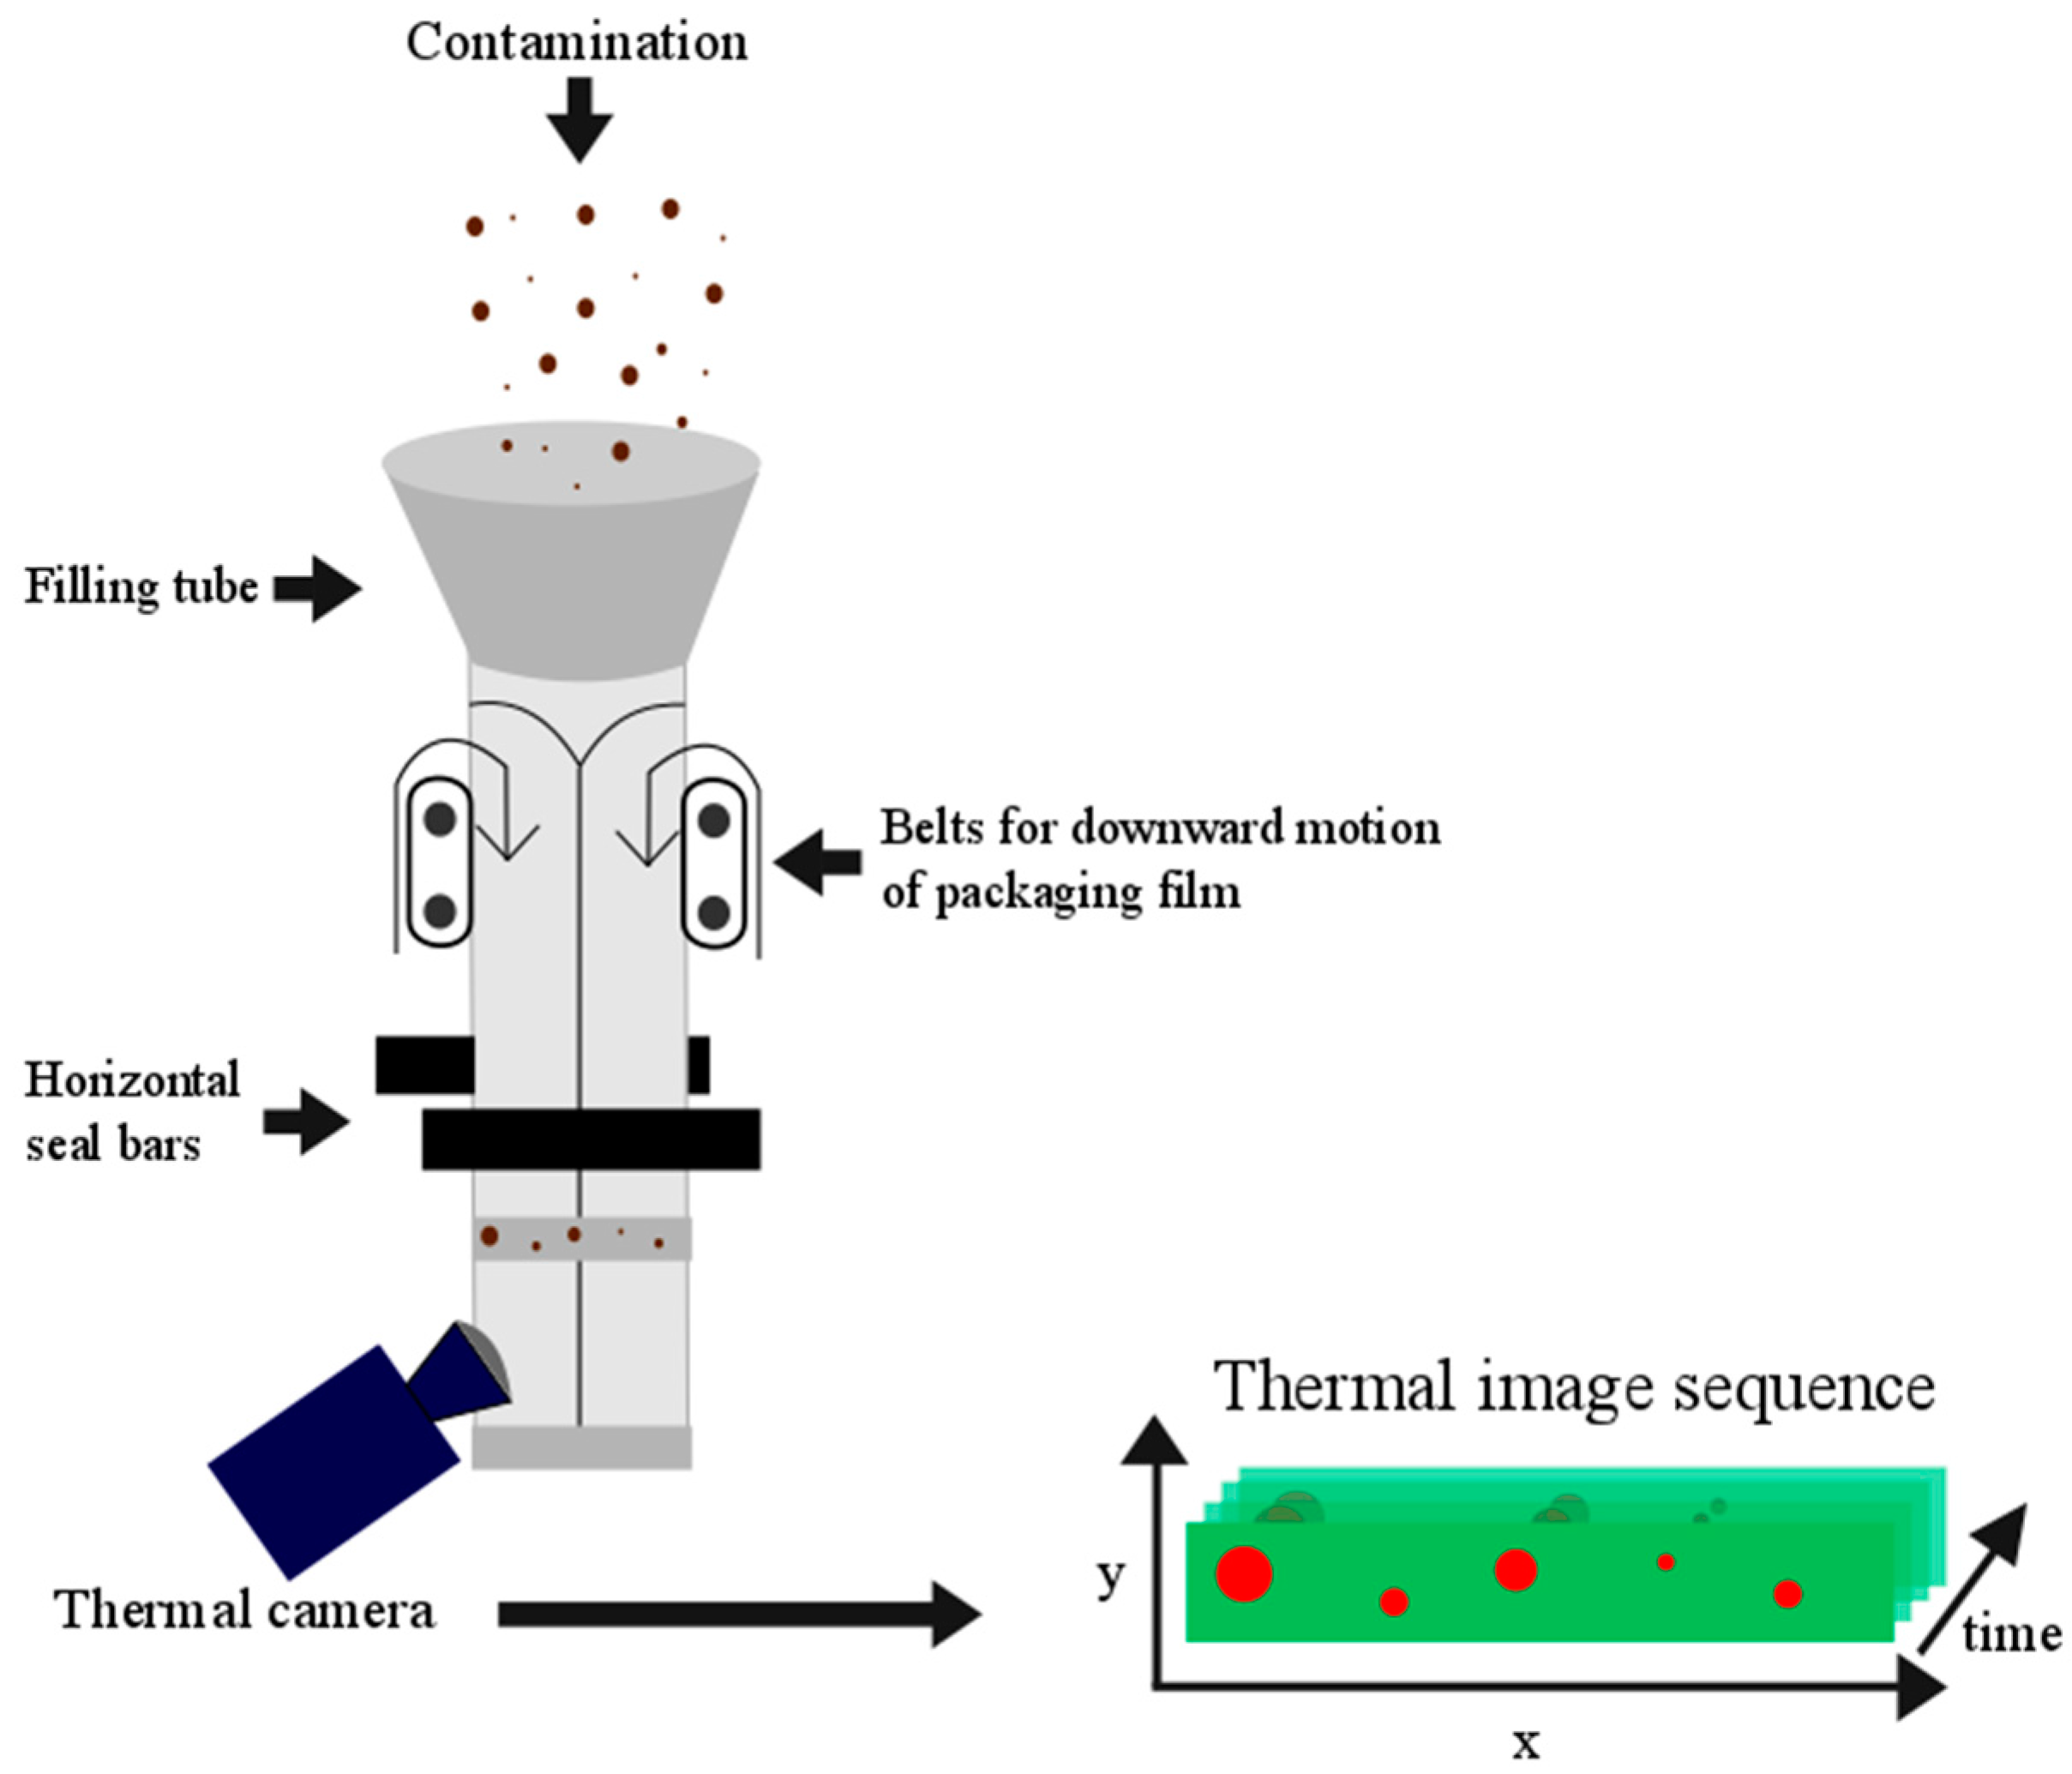
Figure 1. Schematic representation of the vertical form fill seal (VFFS) setup used for contaminated seal sample preparation and thermal image recording.
Jimaging 02 00033 g001
Figure 2. Box with uniform illumination and the RGB-camera used for high-resolution digital image recording.
Jimaging 02 00033 g002
Figure 3. Mean cooling profiles of all sound (= clean) and defect (= contaminated) pixels of Sample 28. The shaded regions represent one standard deviation. The first order fit is illustrated in (a); and the thermal signal reconstruction using a fourth order fit is illustrated in (b).
Jimaging 02 00033 g003
Figure 4. Overview of image processing steps. The input of all six thermal processing methods consists of a bad pixel corrected version of the raw thermal image sequences. The thermal output images of all methods are resized and registered to the digital reference images. Based on this, an overlap analysis and detection limit calculation is performed. The color scale of all images is normalized between zero and one to allow contrast comparison between the image processing algorithms. Coordinates are shown in pixels.
Jimaging 02 00033 g004
Figure 5. Binarized digital image (top); and binarized thermal output image “single frame” (bottom). Coordinates are shown in pixels. Particles that occur in both images are shown in green. Particles that occur only in the digital image or only in the thermal output image are shown in red in respectively the top image and the bottom image.
Jimaging 02 00033 g005
Figure 6. Binarized digital image (top); and binarized thermal output image “p2” (bottom). Coordinates are shown in pixels. Particles that occur in both images are shown in green. Particles that occur only in the digital image or only in the thermal output image are shown in red in respectively the top image and the bottom image.
Jimaging 02 00033 g006
Figure 7. Binarized digital image (top); and binarized thermal output image “thermal signal reconstruction (TSR) p5” (bottom). Coordinates are shown in pixels. Particles that occur in both images are shown in green. Particles that occur only in the digital image or only in the thermal output image are shown in red in respectively the top image and the bottom image.
Jimaging 02 00033 g007
Figure 8. Binarized digital image (top); and binarized thermal output image “amplitude” (bottom). Coordinates are shown in pixels. Particles that occur in both images are shown in green. Particles that occur only in the digital image or only in the thermal output image are shown in red in respectively the top image and the bottom image.
Jimaging 02 00033 g008
Figure 9. Binarized digital image (top); and binarized thermal output image “PC1” (bottom). Coordinates are shown in pixels. Particles that occur in both images are shown in green. Particles that occur only in the digital image or only in the thermal output image are shown in red in respectively the top image and the bottom image.
Jimaging 02 00033 g009
Figure 10. Binarized digital image (top); and binarized thermal output image “matched filter” (bottom). Coordinates are shown in pixels. Particles that occur in both images are shown in green. Particles that occur only in the digital image or only in the thermal output image are shown in red in respectively the top image and the bottom image.
Jimaging 02 00033 g010
Figure 11. Predicted probability of detection as a function of the equivalent diameter for six thermal output images “single frame”, “p2”, “TSR p5”, “amplitude”, “PC1” and “matched filter”. A logarithmic scale is used for the x-axis. The detection limit is defined as the equivalent diameter at which the probability of detection is equal to 95%. The detection limit for each processing method is reported in the legend.
Jimaging 02 00033 g011
Figure 12. Mean percentage of falsely-detected particles for the six thermal output images. The error bars represent one standard deviation. A Tukey–Kramer multiple comparison test with significance level α = 0.05 was performed, and significant differences are reported in the plot.
Jimaging 02 00033 g012
Figure 13. Detection limit for 95% probability of detection as a function of the time after sealing at which recording was started.
Jimaging 02 00033 g013
Figure 14. Mean percentage of falsely-detected particles as a function of the time after sealing at which recording was started. The shaded error region represents one standard deviation.
Jimaging 02 00033 g014
Table 1. Estimates, standard errors and p-values of the binary logistic regression model presented in Equation (5). X1 = p2, X2 = TSR p5, X3 = amplitude, X4 = PC1, X5 = matched filter and D = equivalent diameter. Information on the single frame method is contained in the intercept of the model.
PredictorEstimateStandard Errorp-Value
Intercept−3.4750.016<0.0001
X10.4190.016<0.0001
X2−0.0730.017<0.0001
X30.0280.0170.1129
X4−0.1320.018<0.0001
X5−0.4650.019<0.0001
D8.9600.059<0.0001
X1 × D1.4770.141<0.0001
X2 × D−0.7930.1260.0001
X3 × D1.0000.139<0.0001
X4 × D−0.4080.1290.0016
X5 × D−2.4570.115<0.0001
Table 2. Processing times for each of the six thermal output images on a 3.40-GHz processor. PPT, pulsed phase thermography; PCT, principal component thermography.
MethodProcessing Time per Sample
Single frame0.42 s
p2 (1st order fit)8.63 s
TSR p5 (4th order fit)19.06 s
Amplitude (PPT)3.93 s
PC1 (PCT)3.40 s
Matched filter24.76 s