Technical Note

Machine-Vision Systems Selection for Agricultural Vehicles: A Guide

1
Department Software Engineering, School of Computer Science, University Complutense of Madrid, José García Santesmases, 16, 28040 Madrid, Spain
2
Center for Automation and Robotics, UPM-CSIC, 28500 Madrid, Spain
3
Department of Computer Architecture and Automatic, School of Computer Science, University Complutense of Madrid, 28040 Madrid, Spain
*
Author to whom correspondence should be addressed.
J. Imaging 2016, 2(4), 34; https://doi.org/10.3390/jimaging2040034
Submission received: 12 September 2016 / Revised: 14 November 2016 / Accepted: 15 November 2016 / Published: 22 November 2016
(This article belongs to the Special Issue Image Processing in Agriculture and Forestry)

Abstract

:
Machine vision systems are becoming increasingly common onboard agricultural vehicles (autonomous and non-autonomous) for different tasks. This paper provides guidelines for selecting machine-vision systems for optimum performance, considering the adverse conditions on these outdoor environments with high variability on the illumination, irregular terrain conditions or different plant growth states, among others. In this regard, three main topics have been conveniently addressed for the best selection: (a) spectral bands (visible and infrared); (b) imaging sensors and optical systems (including intrinsic parameters) and (c) geometric visual system arrangement (considering extrinsic parameters and stereovision systems). A general overview, with detailed description and technical support, is provided for each topic with illustrative examples focused on specific applications in agriculture, although they could be applied in different contexts other than agricultural. A case study is provided as a result of research in the RHEA (Robot Fleets for Highly Effective Agriculture and Forestry Management) project for effective weed control in maize fields (wide-rows crops), funded by the European Union, where the machine vision system onboard the autonomous vehicles was the most important part of the full perception system, where machine vision was the most relevant. Details and results about crop row detection, weed patches identification, autonomous vehicle guidance and obstacle detection are provided together with a review of methods and approaches on these topics.

Graphical Abstract

1. Introduction

The incorporation of machine vision systems in agricultural environments is becoming more and more common, and is undergoing a period of continuous boom and growth, particularly onboard agricultural vehicles (autonomous and non-autonomous), but not limited to this case. These systems can be used for different agricultural tasks, including crop (patches, rows) detection, weed identification for site-specific treatments, monitoring or canopy identification, among others, where precise guidance is required and the security and surveillance in the area of influence become crucial issues.
With progress, machine vision systems become imperative in autonomous vehicles and very useful for driver assistance in non-autonomous vehicles, considering that they work under adverse outdoor conditions from the point of view of image processing, required for such purposes. A review of control systems in autonomous vehicles was carried out in [1,2,3], where four subsystems were identified: guidance, weed detection, precision actuation and mapping. Imaging sensors were used for different tasks, including guidance, weed detection or phenotyping analysis. Crop rows detection and weeds identification are common tasks in precision agriculture where image processing techniques are used for site-specific treatments [4,5,6,7,8,9,10,11,12,13,14,15,16], guidance based on crop lines following [17,18,19,20], obstacle detection for security purposes [21,22,23,24,25] or mapping the environment in olive trees [26], among others. Recent technological advances have allowed the incorporation of vision systems onboard Unmanned Aerial Vehicles (UAVs), which can also be considered as agricultural vehicles, demanding priority attention [27].
Once a vision system is to be installed onboard an agricultural vehicle, either for assistance, autonomy or specific applications, with the purposes expressed above, several questions are to be considered, namely: what is the system? What specifications should it have it? Where should we place it onboard the vehicle? How should it be oriented it towards the 3D scene? Answers to these and other problematic questions are crucial, and they are to be considered for any engineering design, affecting the machine vision system and its integration onboard the vehicle. The following main issues are to be addressed, without forgetting the economic costs:
  • Tradeoff between vision system specifications and performances. Operating spectral ranges are to be identified, i.e., multispectral, hyperspectral, including visible, infrared, thermal or ultra-violet. Spectral and spatial sensor’s resolutions are also to be considered including the intrinsic parameters.
  • Definition of the region of interest and panoramic view. Apart from the spatial resolutions mentioned above, the optical system plays an important role in acquiring images with sufficient quality, based on lens aperture. At the same time, lens distortions and aberrations are to be determined. The field of view, in conjunction with the sensor resolution, must also be determined.
  • Vision system arrangement with specific poses onboard the vehicles (ground or aerial). All issues concerning this point are related to the vision system location: height above the ground, distance to the working area or region of interest, rotation angles (roll, yaw and pitch). Extrinsic parameters are involved.
Thus, regarding the above considerations this paper addresses three main issues concerning the machine vision systems onboard agricultural vehicles, namely: (a) spectral-band selection; (b) imagers sensors and optical systems and (c) geometric system pose and arrangement. The main contribution of this paper involves such issues, which are to be considered before a machine vision system is selected to be installed onboard an agricultural vehicle for specific tasks in agriculture.
This paper is organized in two parts. The first one comprises three Section 2, Section 3 and Section 4. Section 2 describes the spectral band selection. Section 3 is devoted to imaging sensors and optical systems. Section 4 deals with the geometric system pose. Illustrative examples in agricultural contexts are also provided to clarify the related issues. The second part comprises Section 5, which describes a case study, based on the RHEA (Robot Fleets for Highly Effective Agriculture and Forestry Management) project [28]. In the corresponding subsections of Section 5 we explicitly indicate the link with Section 2, Section 3 and Section 4. Finally, an additional appendix provides the basic concepts for camera system geometry.

2. Spectral-Band Selection

2.1. Visible Spectrum

Most agricultural tasks using machine vision systems require image processing techniques with the aim of identifying specific spectral signatures. Vegetation indices allow the extraction of spectral features by combining two or more spectral bands, based on reflectance properties produced by the vegetation [29,30]. Some of them use only the three visible spectral bands, i.e., Red (R), Green (G) and Blue (B), where the goal is to enhance some specific band, accentuating the spectral signatures (color) of interest. In this regard, if the greenness is the interest, the G band values are to be enhanced, when soil segmentation is the interest, the R band values should be enhanced, excess green and excess red are two well-known indices for such purposes [11]. The first one is applied for detecting green plants, including crop patches and crop rows, weed patches, leaves and other vegetative parts. The second one is used for other purposes such as soil analysis (organic composition, moisture, etc.). CCD (Charge Coupled Device) or CMOS (Complementary Metal Oxide Semiconductor) are two common technologies used in imaging sensors devices. They are both based on the photoelectric effect to produce digital intensity values from incident light over specific picture elements (pixels), which are the smallest units, conveniently arranged in matrices with specified horizontal (H) and vertical (V) sizes or linearly as an array of pixels. Section three is devoted to sensors.
The greater the intensity of light, the more electrons are produced [31]. Light consists of photons (discrete particles), but a light source produces photons randomly throughout time. This causes noise in the perceived intensity of the light and this magnitude is equivalent to the square root of the number of photons generated by the source of light (Shot Noise) measured in electrons (e). Ideally, every photon would be converted in one electron, so that this conversion is governed by physical laws. Nevertheless, there are factors altering the ideal conversion, which produce what is known as noise, such as the read-out noise due to electronic operation, camera processing noise or dark current shot noise, among others, leading to discrepancies between the ideal and real performance. The electrons generated are stored within each pixel in the Well and the number of electrons that can be stored is known as Saturation Capacity or Well Depth (measured in e), so that if the Well receives more electrons than the saturation capacity no additional electrons are stored. The charge measured in the Well is called the Signal and the error due to this measurement is known as Temporal Dark Noise (TDN) or Read Noise (measured in e). After this, the grey imaging value (Grey Scale) is obtained by converting the signal value expressed in electrons into pixel values in bits (8, 16 or others) through Analog to Digital Units (ADUs). The ratio between the analog signal value and the digital grey scale value is known as Gain (measured in electrons per ADU) which differs from the analog to digital conversion. Manufacturers provide information about the ratio between the ideal and real situations measured in terms of Signal to Noise Ratio (SNR) in decibels (dB) or equivalently in bits of data, applying the conversion expression bit = log2(10SNR/20). Typical values of SNR are around 50–60 dB which can be determined through specific calibration processes. This is a quality measurement of camera performance between the ratio of noise versus the signal together with Dynamic Range, this last one also measured in dB or bits. The difference is that Dynamic Range considers only the TDN, while SNR also includes the root mean square summation of the Shot Noise. There is another metric known as Absolute Sensitivity Threshold, which is the minimum number of photons required to obtain a signal equivalent to the noise produced by the sensor. Below this threshold value no significant signal is produced. Sometimes, light density (photons/μm2) against signal (e) or SNR are available and the best sensor is the one with the highest signal/SNR values for the same light densities. The above is valid for both CCD and CMOS devices.
CCD and CMOS are blind to color, so that when color is to be generated a band-pass filter is placed in front of each sensor to allow the incidence of light according to the input radiation. Depending on the type of system, i.e., with a unique CCD or several, different technologies are used. A typical arrangement in imaging sensors with a unique CCD is the known as Bayer’s filter. Alternating red-green and blue-green pixels are conveniently placed to obtain RGB (Red, Green, Blue) images, complementary color’s filters (cyan, magenta, yellow) can also be used to produce CMY images. Software-based image processing techniques allow the direct/reverse transformation between the two colors models. In CCD devices, the charge produced on the pixels by the incident light is transferred, using vertical shift registers, to a node or nodes where the charges are converted to voltage, buffered and sent out as an analog signal, which is amplified and digitalized by an analog to digital (A/D) converter through the ADU. In CMOS devices, each pixel contains its own converter from charge to voltage, sometimes including amplifiers, noise reducers and electronic digitization. Because of this, the output uniformity is greater in CCD than in CMOS, giving high image qualities but with higher noise. In contrast, CMOS technology produces lower levels of noise with faster read-out, and lower power consumption.
Manufacturers of camera-based sensors (CCD, CMOS) provide for each device a data-sheet containing information (sometimes graphical) about the sensor sensitivity measured in terms of absolute Quantum Efficiency (QE) or Relative Response (RR) [31]. QE is the percentage of photons converted to electrons at a specific wavelength, expressed in percentage. The Signal (as a measure of the charge, as mentioned above) is computed as the product of LightDensity (LD), expressed as the number of photons/μm2, the pixel area (pixel size, PS) and QE as follows,
S i g n a l = L D × P S 2 × Q E
Figure 1a displays an illustrative generic graph representing a RR against wavelengths for a RGB sensor. Figure 1b also displays the QE against wavelengths for a three spectral RGB sensor with response in the near infrared and beyond. If the sensor is monochrome, a typical profile could be the one represented in Figure 1c, also against wavelengths.

2.2. Spectral Corrections: Vignetting Effect and White Balance

In agricultural outdoor environments the machine vision system works in adverse conditions where the natural illumination contains high NIR and UV spectral components (radiation). Generally, imaging sensors are highly sensitive to NIR radiation starting at 760 nm and to a lesser extent to UV, below 400 nm. Indeed, based on the spectral responses displayed in Figure 1b, the NIR heavily contaminates the three spectral channels (R, G and B), mainly the red channel in the range 760–800 nm, producing images with hot colors. This makes identification of green vegetation unfeasible. To avoid this undesired effect, cut-off filters are required, such as a Schneider UV/IR 486 [32]. Its operating curve specifies that wavelengths below 370 nm and above 760 nm are blocked, i.e., both UV and NIR radiations. Figure 2a displays just a corrupted image acquired without the UV/IR 486 cutting filter and Figure 2b equipped with such filter. As mentioned above, without such a filter the contamination is obvious and the undesired effect is clearly minimized with the filter. These images were acquired with a CCD-based sensor with the corresponding optical system onboard the tractor dedicated to maize crops belonging to the fleet of robots in the RHEA project [28]. Details about this system are provided in section five.
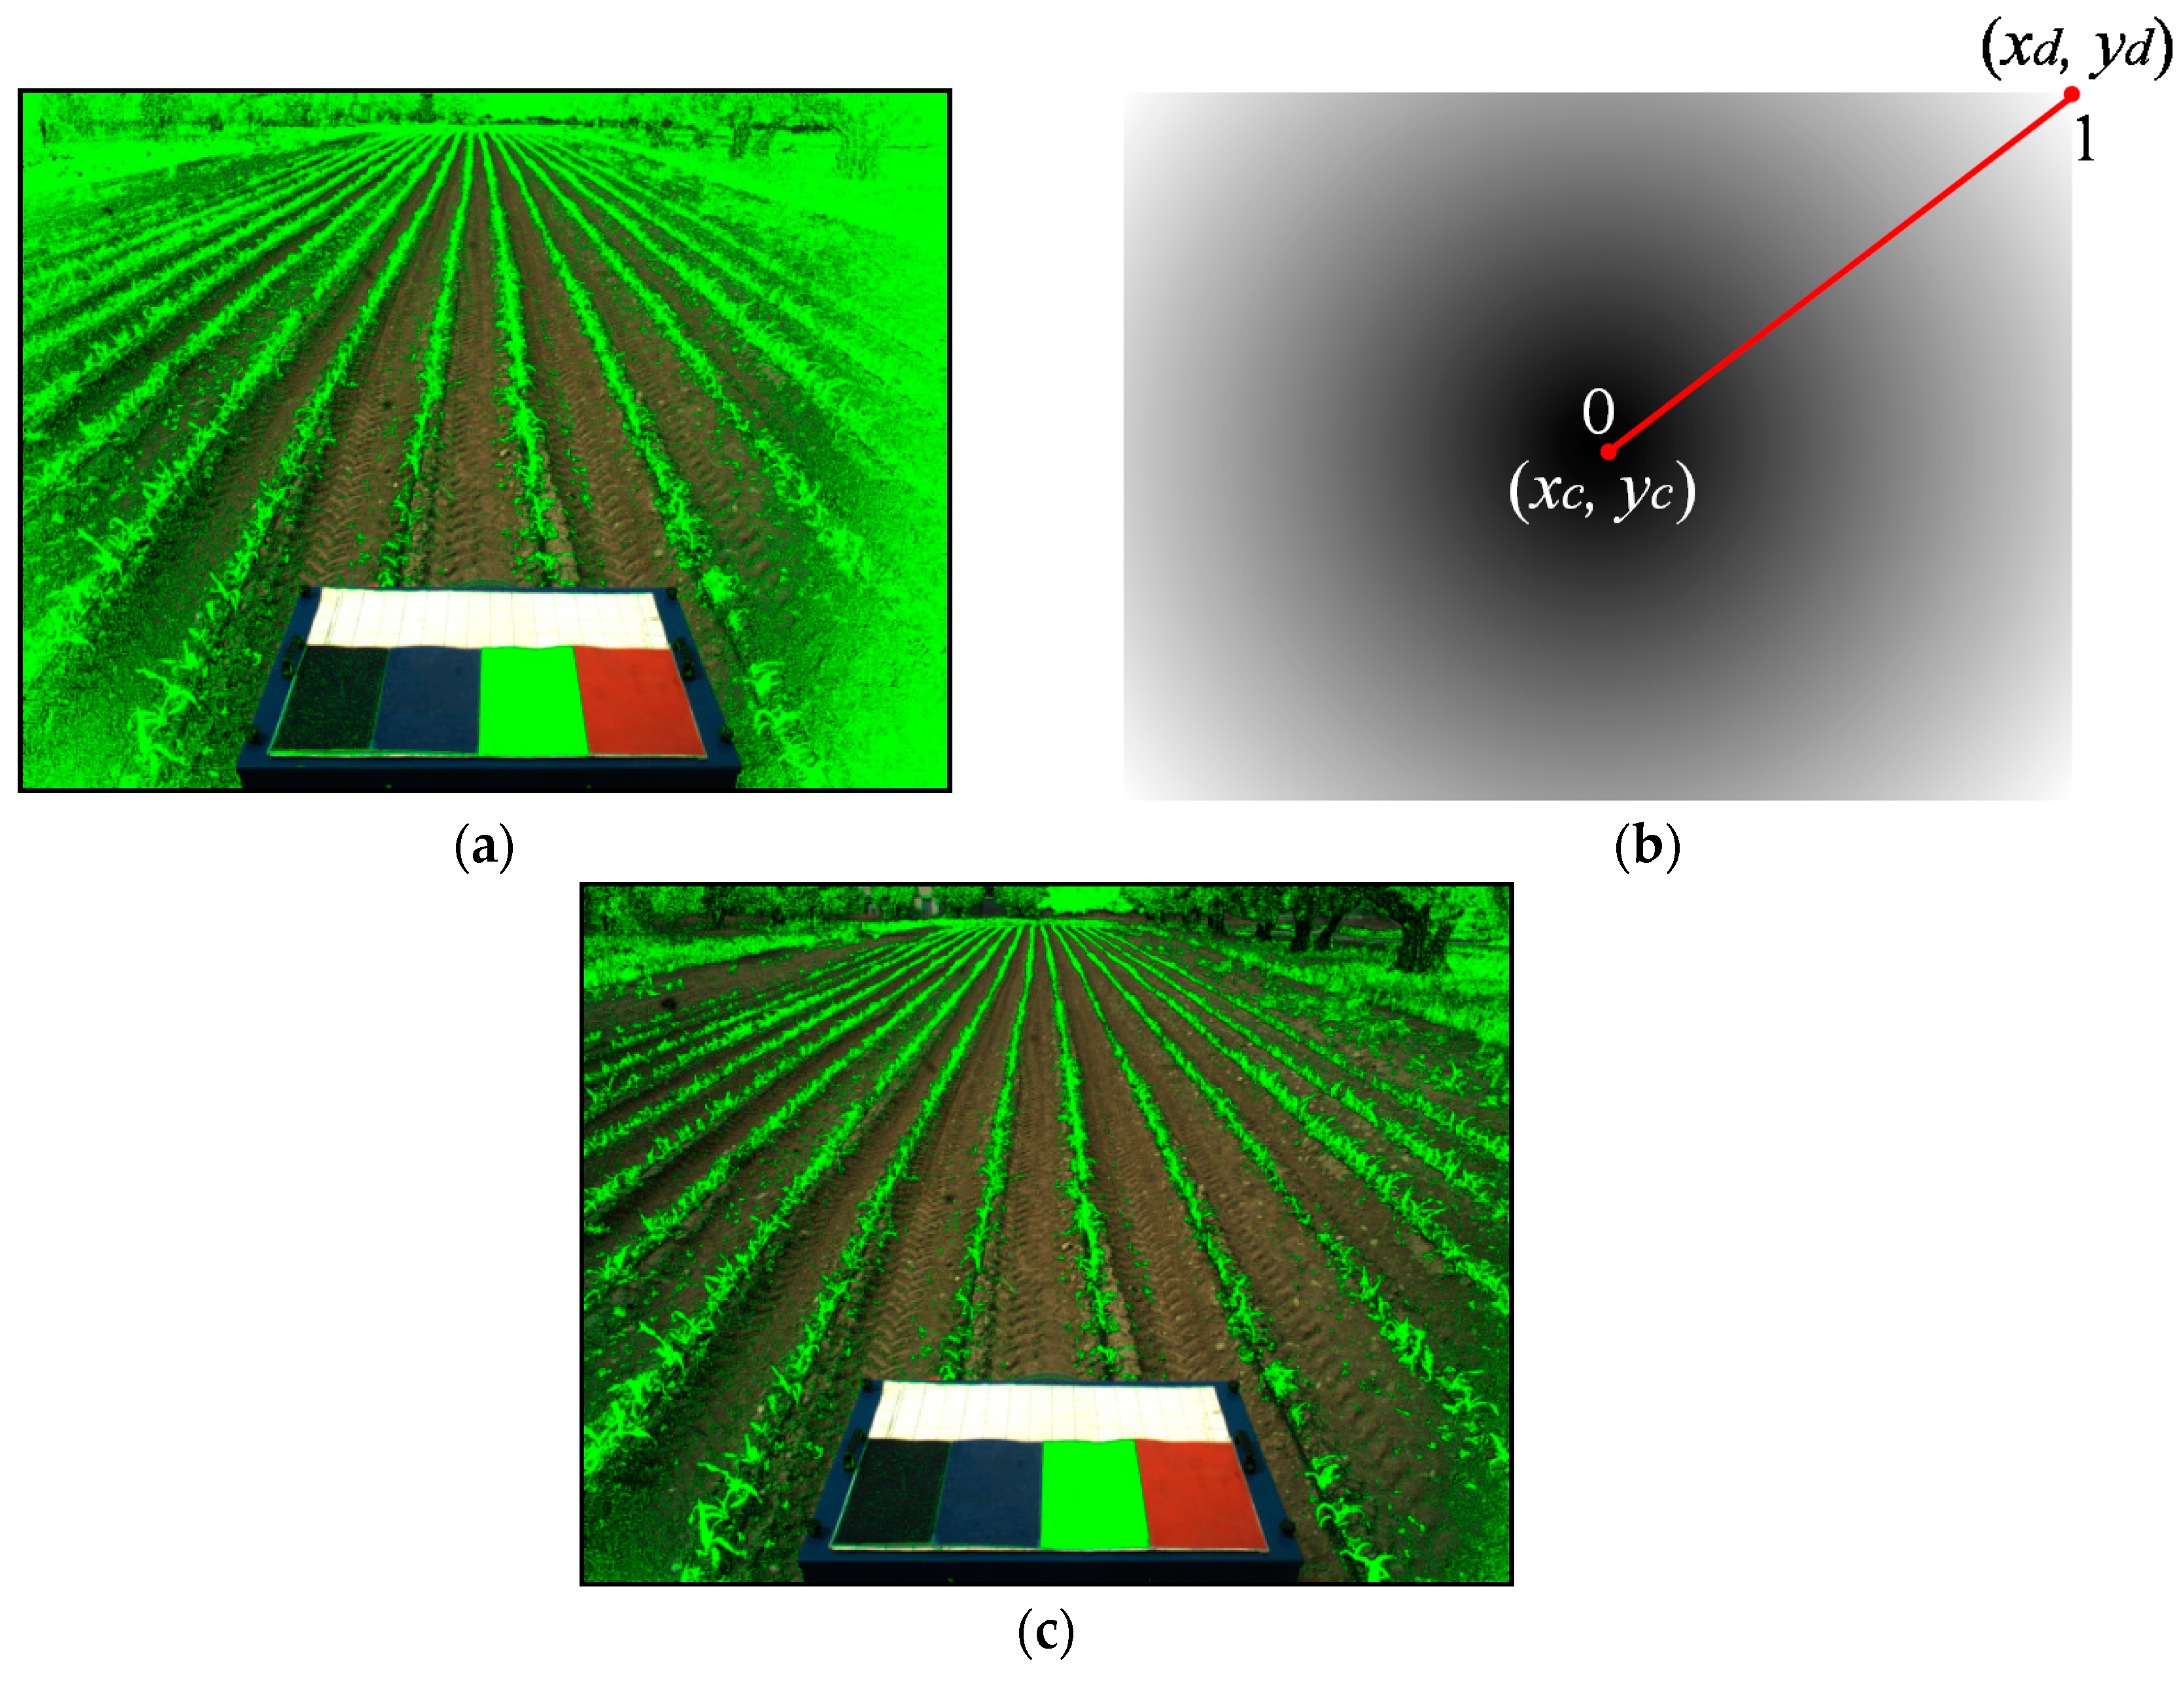
Despite the blocking filtering, a vignetting effect still remains, requiring correction. As specified by the manufacturer, the Schneider UV/IR 486 cut-off filter is based on what is known as thin-film technology containing more than thirty coats on one of its sides and a multi-resistant coating on the opposite one. The incidence angle of rays in the periphery of the filter is greater than in the center and they must travel longer distances along the different layers of interference. This effect is more pronounced the lower is the focal length of the lens, i.e., lenses with wide-angles. These cutting filters, particularly IR filters, are generally incorporated by the manufacturer on off-the-shelf digital cameras, because its selection for a specific agricultural application is unnecessary. The vignetting effect causes important anomalies on the spectral features. Indeed, because of the larger distances travelled by these rays, the IR wavelengths are filtered with higher intensity in areas far from the image center than in the central part of the image. By proximity of IR and Red (R) wavelengths in the spectrum, this last one is also affected with an excess of filtering at the expense of Green (G) and Blue (B) bands introducing an excess of G with respect to R, expressed with higher greenness at the external parts of the image and particularly at the corners. Figure 3a displays an image with greenness segmentation by applying the ExG index [8,11]. It is clear that an excess of green plants are segmented. Two approaches can be considered to correct this undesired effect. The first consists on the installation of UV/IR cutting filters just in front of the sensor (CCD, CMOS), with the aim of minimizing the distances traveled by the rays. As mentioned before, in off-the-shelf digital cameras this filter is built-in at the factory and most of the time no additional actions are required. In the second approach, when the first fails or it is not possible, specific spectral bands (R,G and B) corrections are required via software. For each pixel (x,y) a normalized distance ranging in [0,1] is computed as follows,
d ( x , y ) = ( x x c ) 2 + ( y y c ) 2 ( x d x c ) 2 + ( y d y c ) 2
where (xc,yc) and (xd,yd) are the coordinates of the image center and a corner point respectively, Figure 3b. Thus, the following intensity corrections can be applied,
R ( x , y ) = R ( x , y ) + μ R d ( x , y ) ; G ( x , y ) = G ( x , y ) + μ G d ( x , y ) ; B ( x , y ) = B ( x , y ) + μ B d ( x , y )
The corrected spectral values R’, G’ and B’ for each pixel location at (x,y) are obtained by adding to the original spectral values R, G and B (normalized in the range [0,1]) a term which is a function of the normalized distance d(x,y) and multiplied by the corresponding correction factor µR, µG and µB ranging in [0,1]. In this example, only R is to be increased but not the green and blue, because the greenness segmentation is intended. Figure 3c displays the corrected image by applying the following correction factors µR = 0.3, µG = µB = 0.0; as can be seen, the excess of greenness has been considerably reduced with the unique emphasis on R.
The B spectral band is also affected by proximity to the UV band when a cutting UV/IR filter is used. In this regard, a blue correction could be suitable in order to increase intensity values in the blue band. Nevertheless, because in agricultural applications the greenness is usually the interest, as in the above example, the blue correction is unnecessary.
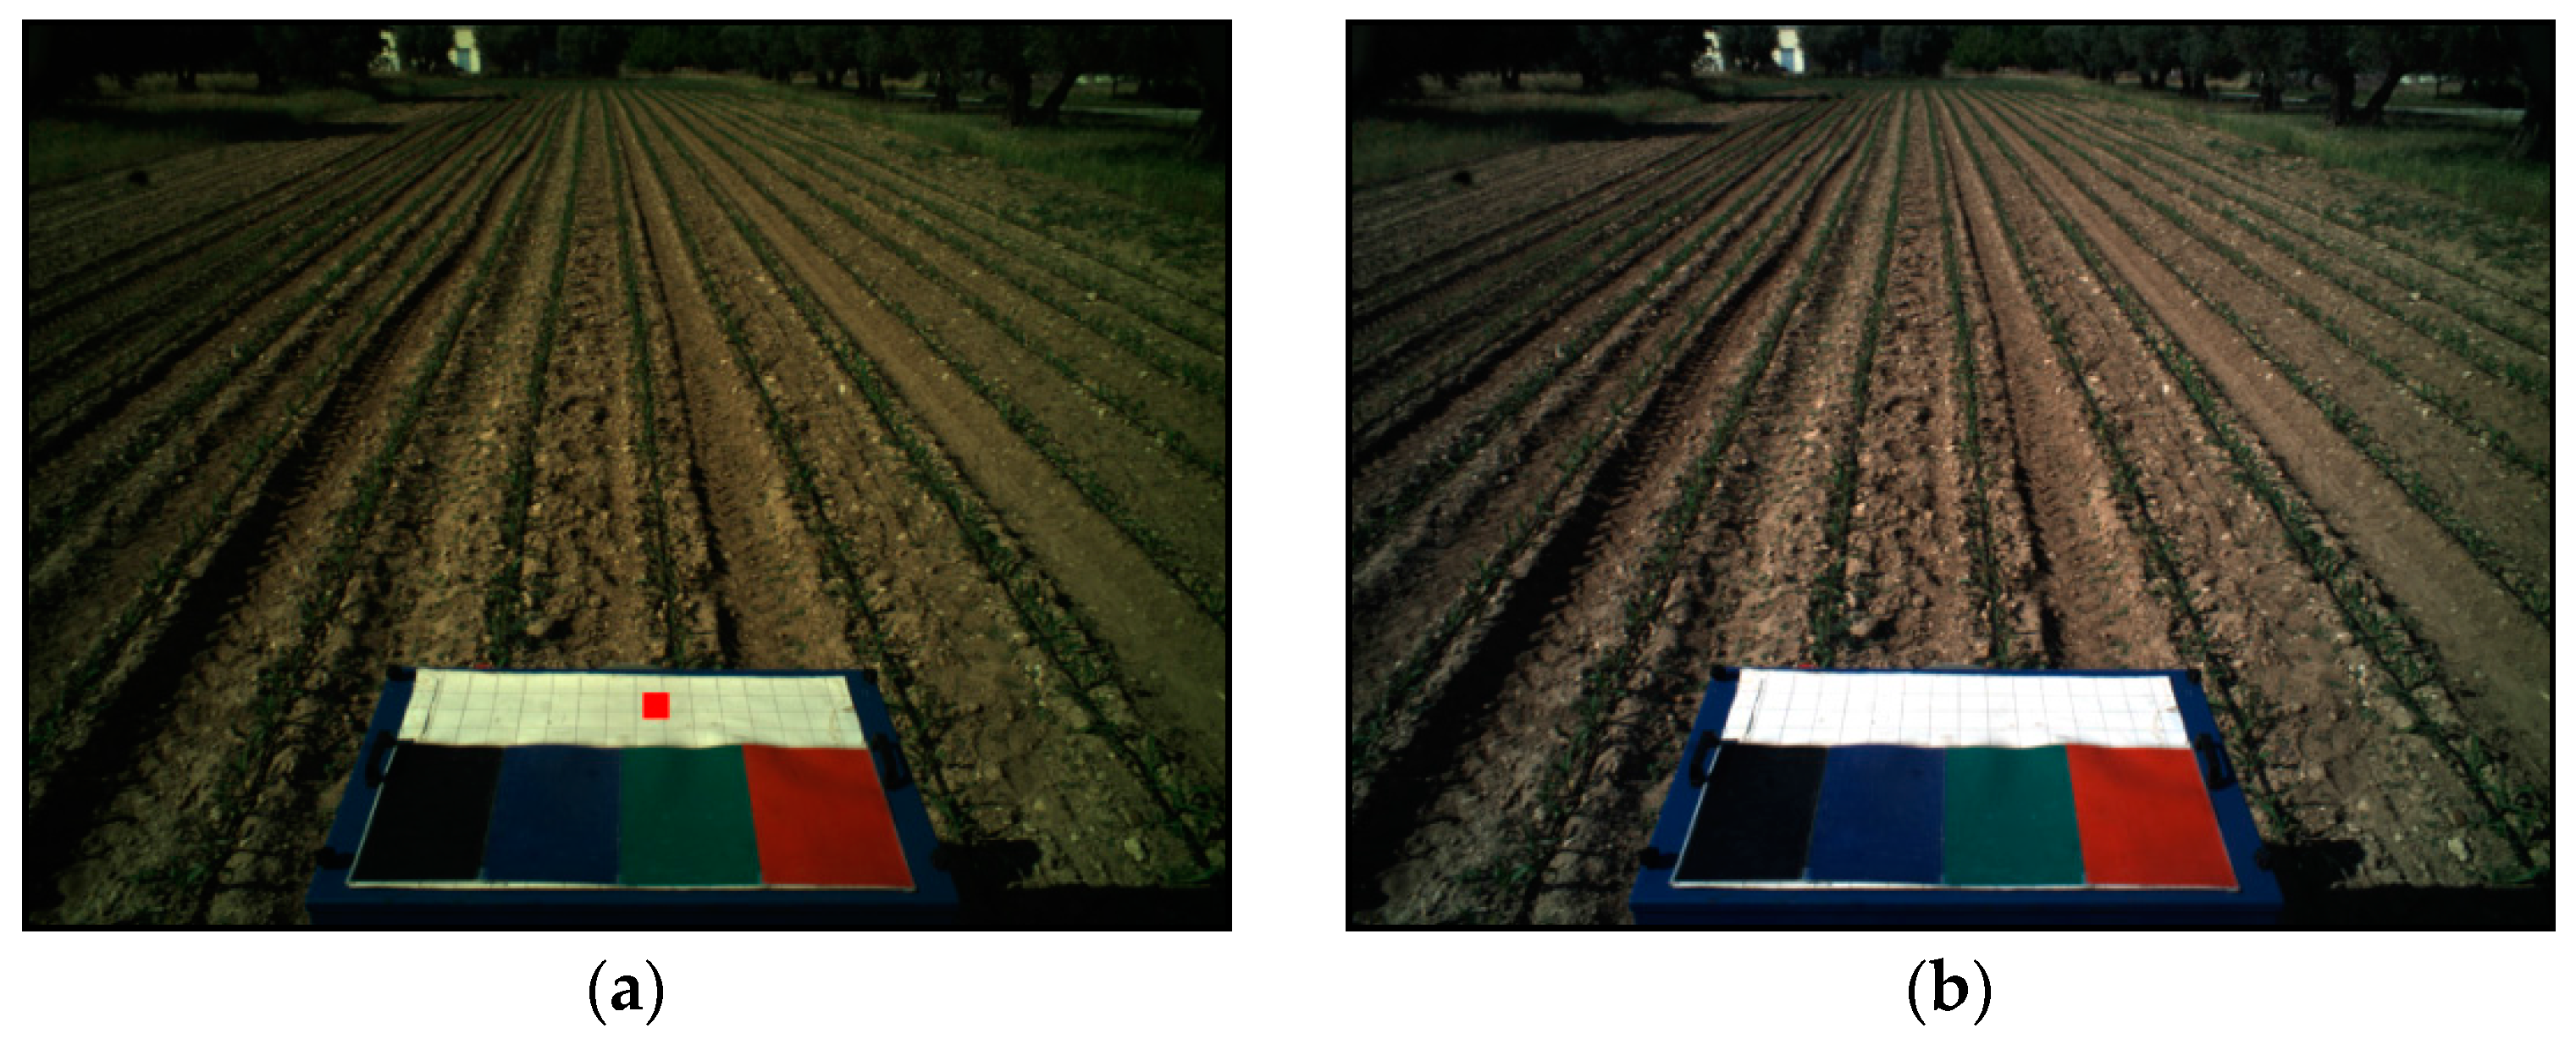
White balance is another option for improving image quality, based on the correction with reference to known spectral values. Assume we have a reference white panel with nominal spectral white values R, G, B as (255, 255, 255) or equivalently (1, 1, 1) for normalized values. Considering a region on the known white reference panel with sizes of 50 × 50 pixels as an example, the average values RW, GW, BW are computed for such a region and the white balance correction is applied as given by Equation (4). Figure 4 displays in (a) an original image with balance correction in (b).
[ R G B ] = [ 255 / R W 0 0 0 255 / G W 0 0 0 255 / B W ] [ R G B ]
The problem with the application of white balance is that the black area must be correctly located and free of additional effects, such as projection of shades affecting exclusively to such region but not to other parts in the image. For example, a shadow from the cabin on the reference panel causes anomalies on the spectral correction in the rest of the image.

2.3. Infrared Spectrum

It is well-known in remote sensing applications [33], where green vegetation is to be identified from sensors onboard airborne or satellite platforms equipped with multi(hyper)-spectral imagery sensors, that near infrared is a useful band for plant identification and phenotyping because green vegetation produces high reflectance in the NIR band due to chlorophyll activity and absorption [34,35]. In this regard, according to the agricultural application to be developed, the best approach consists of determining the matching between the agricultural objects to be detected and the sensor spectral response. Figure 5a displays typical reflectance spectra profiles at different wavelengths for crop and soil, which are roughly drawn from the information provided in [34], where the maximum reflectance is achieved between 700 nm and 1300nm. Thus, considering that NIR corresponds to wavelengths falling within the 760 to 1400 nm range, the best sensor for capturing crop reflectance should be the one with the higher response inside this range. There exist sensors based on Indium Gallium Arsenide (InGaAs) technologies covering different infrared ranges, roughly Short-Wave infrared (SWIR, ~1400–3000 nm), Mid-Wave infrared (MWIR, ~3000–8000 nm), and Long-Wave infrared (LWIR, ~8000–15,000 nm). Figure 5b displays two responses covering two spectral ranges corresponding to two respective versions of the Bobcat-640-GigE sensor [36]. This sensor contains a detector based on InGaAs (Indium/Gallium/Arsenic) as the substrate to build the focal plane array with two readout integrated circuit (ROIC) modes (Integrate Then Read, ITR and Integrate While Read, IWR) and noise level of 90 e and 640 × 512 pixels. Other substrates are also possible for NIR-based devices, covering different spectral ranges, such as Indium/Antimonide (InSb), Mercury/Cadmium/Tellurium (HgCdTe) among others with different sensibilities.
So, if we want to detect crop reflectance below 900 nm the most appropriate sensor is the one covering the range between 550 to 1700 nm, otherwise, if the crop reflectance is above 900 nm, the sensor covering the range from 900 to 1700 nm should be acceptable.
Table 1 summarizes different ranges of wavelengths (λ), expressed in nm, and related to the spectral bands (S) commonly used in agricultural applications, particularly for greenness identification. They cover Ultra-Violet (UV), Visible with Blue (B), Green (G), Red (R) and Infra-Red (IR) split on Near-Infrared (NIR), Short, Mid and Long waves.

2.4. Illustrative Examples and Summary

Assume we have a sensor with the spectral specifications displayed in Figure 1a, where the agricultural application consists in the crop row detection of green plants for guiding purposes in maize fields, where typical reflectance values are around 560 nm. Wavelengths for green reflectance is around 500–570 nm, thus the sensor response according to Figure 1a provides a relative red reflectance r = 0.20 and a relative green reflectance g = 0.80 and the Green Red Vegetation Index (GRVI) [33], GRVI = (g − r)/(g + r), results in 0.60. Nevertheless, if the reflectance sensor profiles are the ones provided in Figure 1b, r = 0.02 and a relative green reflectance g = 0.35 and GRVI is 0.89, then the sensor represented in Figure 1b is more efficient in this kind of situation. The best sensor for greenness identification, where wavelengths range from 500–570 nm, is the one with a green spectral response covering this range with tails being the minima out of such a range. In contrast, if the red spectral response in the range of 500570 nm is null, the GRVI achieves maximum values. In short, the best sensor for greenness identification will be the one with high green spectral responses in 500–570 nm and null for the red ones, i.e., with minimum overlapping between the spectral R and G bands. Regarding a monochrome sensor with its relative response displayed in Figure 1c, we can see that for 560 nm its response is close to 1.0, i.e., with a good performance for the intended greenness identification. Sometimes, during tilling operations, perhaps for automatic guidance [37], the goal is the identification of spectral responses from the soil. Consider that we are interested in the segmentation of dry clay soils with reflectance values around 650 nm. According to Figure 1a,b GRVI values are respectively −1.0 and −0.9; again the sensor represented by Figure 1a provides the best performance. Table 2 displays values for different vegetation indices [8,11] based on r, g and b values for 560 nm according to the RR and QE spectral responses in Figure 1a,b respectively. The best performances are achieved with the maximum values marked in bold.
There exist commercial 2CCD (bi-channel) [39] or 3CCD (three-channels) [40] devices capturing simultaneously visible RGB in raw Bayer or separated together with NIR, respectively. Visible and NIR spectra are separated by the dichroic coatings of the prism with a separation wavelength of about 760 nm in the 2CCD device and about 600 nm and also 760 nm for the separation of the green, red and NIR in the 3CCD device.
Sometimes, a band pass NIR filter can provide a solution by placing it in front of the optical system in the visible imager. In this regard, based on the visible spectral responses displayed in Figure 1, we must consider that the sensor is still active with sufficient responses for wavelengths inside the infrared range so that the CCD or CMOS cells are activated with wavelengths crossing the NIR filter. This was the solution proposed in [41,42] in the context of stereovision systems intended for autonomous navigation.
Another solution is the one proposed in [35], where the IR cutting filter in the visible camera, if any, is removed, allowing the input of NIR so that the RGB spectral channels contain an amount of NIR, i.e., R + NIR, G + NIR and B + NIR. With a filter blocking the blue wavelengths, placed in front of the lens or immediately in front of the sensor, the blue channel should be exclusively impacted with NIR exclusively providing the NIR component. Subtracting the blue channel (containing only NIR) from the other two, R, G and NIR spectral responses are obtained. Nevertheless, because the responses from all devices are real, and differ from the nominal or ideal, this procedure requires an extra effort in order to define the best cutting blue filter and also the combination of bands to obtain the required R and NIR real responses to derive vegetation indices by using R and NIR channels. A calibration and estimation is carried out in the laboratory with a tunable monochromatic light source spectrometer.
Active sensors are used for phenotyping studies based on Normalized Difference Vegetation Index (NDVI) and canopy densities [43]. A monochrome CCD camera (5 MPix) is mounted in a position two meters above the canopy surface inside a box with a LED light panel also inside the box illuminating the surface to produce nine spectral wavelengths (465, 500, 525, 590, 615, 625, 660, 740 and 850 nm) as the active light source for multispectral images.
Plant phenotyping represent an important challenge in agriculture applications where wavelength band selection plays an important role for determining some specific parameters such as morphology, biomass, leaf forms, fruit characteristics, yield estimations, water content, photosynthetic activity or stress. Different machine vision systems are to be considered because of the advances in imaging techniques, involving spectroscopy (multi-hyper), thermal infrared, fluorescence imaging, 3D imaging, and recently tomographic imaging (Nuclear Magnetic Resonance Imaging, Positron Emission Tomography, X-ray Computed Tomography) for seeds, roots or transport analysis [44].
Under the above considerations, the specifications and features for a machine vision system in outdoor applications and particularly for agricultural tasks can be summarized as follows:
  • Broad spectral dynamic range with adjustable parameters to control the amount of charge received by the sensor, considering the adverse environmental conditions that cause high variability on the illumination in such outdoor environments. In this regard, specific considerations are to be assumed depending on the vehicle (ground, aerial) where the machine vision system is to be installed onboard. Of particular relevance is the effect known as bidirectional reflectance, which appears in sunny days due to angular variations, which may become critical in aerial vehicles [45].
  • Ability to produce images with the maximum spectral quality as possible, avoiding or removing undesired effects such as the vignetting effect.
  • A system robust enough to cope with adverse situations and with responses as deterministic as possible.

3. Imaging sensors and Optical Systems Selection

3.1. Imaging Sensors

An important step during the machine-vision selection process is to consider the imaging sensors and the optical system together. As mentioned before, CCD or CMOS devices consist of pixels conveniently arranged in matrices with specified horizontal (H) and vertical (V) sizes or linearly as an array of pixels. The variety of sensors with different H × V sizes or linear sizes is certainly high, commercially there is a high variety of ranges, from 160 × 120 to 6576 × 4384 or above, UV and NIR-based systems contain the lower resolutions. The product H × V determines what is called MegaPixel (MP) in terms of millions of pixels, for example, a device with resolutions of 3376 × 2704 is measured as 9.1 MP. Physically each pixel has its own horizontal (h) and vertical (v) sizes, typical values range from 3.45 to 7.50 µm. The nominal sensor sizes, horizontal (Sh) and vertical (Sv), can be computed as Sh = h × H and Sh = v × V; nevertheless, real dimensions are a bit larger in size because the required alignments and arrangements. In summary, CCD and CMOS chip sizes vary considerably [46]. Historically, these dimensions come from Vidicon TV cameras with their imaging tubes projecting the image in a circle with a given diameter. CCD/CMOS chips are designed with rectangular dimensions with their corresponding diagonal lengths. The following association (type, diagonal) is established between the type of sensor and its diagonal in length units expressed in mm: (1/8″, 2.0), (1/6″, 3.0), (1/4″, 4.0), (1/3.6″, 5.0), (1/3.2″, 5.68), (1/3″, 6.0), (1/2.7″, 6.72), (1/2.5″, 7.18), (1/2.3″, 7.7), (1/2", 8.0), (1/1.8″, 8.93), (1/1.7″, 9.50), (1/1.6″, 10.07), (2/3″, 11.0), (1/1.2″, 13.3), (Super 16 mm, 14.54), (1″, 16.0), (4/3″, 21.6), (Canon APS-C, 26.7), (Pentax Sony Nikon DX, 28.4), (Canon APS-H, 34.5), (35 mm, 43.3), (Leica S2, 54.0), (Kodak KAF 3900, 61.3), (Leaf AFi 10, 66.57) or (Phase One P 65+, 67.4). A specific sensor is assigned to the type whose diagonal is at least as large as the one of the sensor. For example, assume a chip with sizes 11.6 × 9.5 mm2, with diagonal of 14.99 mm, it will be assigned to the type 1″. This will lead to some geometric constraints of particular interest in machine vision systems in agriculture and particularly for stereovision systems and also when choosing the optical lenses, as we will see later.
In terms of agricultural applications, the choice of a sensor will be determined by its potential features. So, if poor illumination conditions are expected, such as the ones carried out at dawn or dusk the most suitable should be a CMOS technology. CMOS is also appropriate when timing is critical, for example when the time between image acquisition and actuation is extremely low. This could be the case during weeds removal by applying herbicide, based on nozzle sprayers, where the camera is attached to each single nozzle sprayer and weeds are identified for immediate spraying. Cameras in zenithal positions with respect to the region of interest, CMOS should be suitable as it provides rapid responses. Nevertheless, in most agricultural applications, involving image processing, time is critical but not extreme. Moreover, illumination conditions cause problems because of high variability in days with alternating periods of sun and clouds with rapid and frequent changes. Also, problems can appear in days with high/low lighting intensity due to sunny/cloudy days in the outdoor agricultural environments, but these problems are never critical enough to require the use of a CMOS. Here, CCD-based sensors could be appropriate, conveniently connected to real time processors under efficient HW/SW architectures [47]. In this regard, Giga Ethernet (GigE, sometimes including dual ports), Camera Link, USB 2.0, USB3 Vision (USB 3.0) or IEEE 1394a,b (FireWire) are appropriate interfaces to guarantee sufficient data (images) transmission rates. A description about specific features and reasons for choosing the right camera bus are given in [48] based on throughput, cable length, standardized interface, power over cable, CPU usage, I/O synchronization and also effective cost, where relative rankings are provided for each bus.
Additionally, to deal with the adverse illumination conditions in outdoor agricultural environments we have still available two resources: exposure time and aperture. They can be controlled either by the optical system, by applying external control via HW/SW, or based on image processing or both, to achieve sufficient qualities avoiding images with over/under-exposure [49].
Exposure time is the time that the sensor is continuously receiving the light until the signal is produced. The higher the exposure time the greater is the light received by the sensor and vice versa. The exposure time values depend on several factors, including the type of sensor, such values are specified by manufacturers, generally varying from 3 μs to 60 s as maximum values in internal control mode and to ∞ for external control.
A trade-off must be achieved between the exposure time and aperture. The Exposure Value (EV), Equation (5), has been defined to combine both magnitudes so that different combinations give the same exposure value.
E V = log 2 ( F 2 / t )
where F is the f-number (defined in Section 3.2) and t is the exposure time.
EV is used in professional photography where there exists a broad knowledge about the more appropriate values for specific scenes, so that by fixing one of them the other can be obtained from Equation (5), once the EV is determined, based on existing look-up tables. In agricultural outdoor environments, as far as we know, there are no evidences about such values. In this regard, in optical systems with manual aperture, i.e., when the f-number must be set before the agriculture task, the best option is to apply a control via image processing. This is the case in the RHEA project [28] for weeds and crop row detection, where a Region Of Interest (ROI) was selected (Section 5), which is the area where specific treatment is to be applied and also the area containing the crop rows used as reference for guiding the autonomous vehicle. The image brightness on the ROI is processed, based on histogram image analysis, and the exposure time is conveniently increased or decreased depending on first order statistical histogram values, such as the mean and standard deviation. An image processing procedure was designed in [50] to automatically set the exposure time.
Another issue concerning the selection of imaging devices is the capability to capture frames, measured as frame rates per second (fps). Depending on the sensory technologies and spatial resolutions, currently fps can vary from 7 to 1300 or above; so that, in general, CMOS-based technologies allow the sensors to achieve higher fps than CCD-based. In this regard, from the point of view of agricultural applications, it is required to determine the best fps choice for performance. Common operation speeds in autonomous ground agricultural vehicles can range from 3 km/h (0.83 m/s) to 8 km/h (2.22 m/s) or higher. This means that the ROI to be processed, once it is mapped on the image plane, must be defined with sufficient length to guarantee that it can be processed inside the specified time limits, when the autonomous vehicle moves forward. In this regard, the fps and the tasks allocated to the imaging processor must be considered, because the processor is probably in charge of other different processes coming from other sensors [47].

3.2. Optical Systems

The amount of radiance received by the sensor is controlled by the optical system consisting of the following main features and elements [51]:
  • Set of lenses, which is the main part of the optical system. Manufacturers provide information about the focal length (f) and related parameters. Sometimes includes a manual focus setting or autofocus to achieve images of objects with the appropriate sharpness. Systems with variable focal length exist, based on motorized equipment with external control. The focal length is a critical parameter in agricultural applications which is to be considered later for geometric machine vision system arrangement.
  • Format. Specifying the area of the sensor to be illuminated. This area should be compatible with the type of imaging sensor, specified above. An optical system that does not illuminate the full area creates severe image distortions. Figure 6 displays a sensor of type 2/3″ and a lens of 1/2″, i.e., the full sensor area is greater than the area illuminated by the lens.
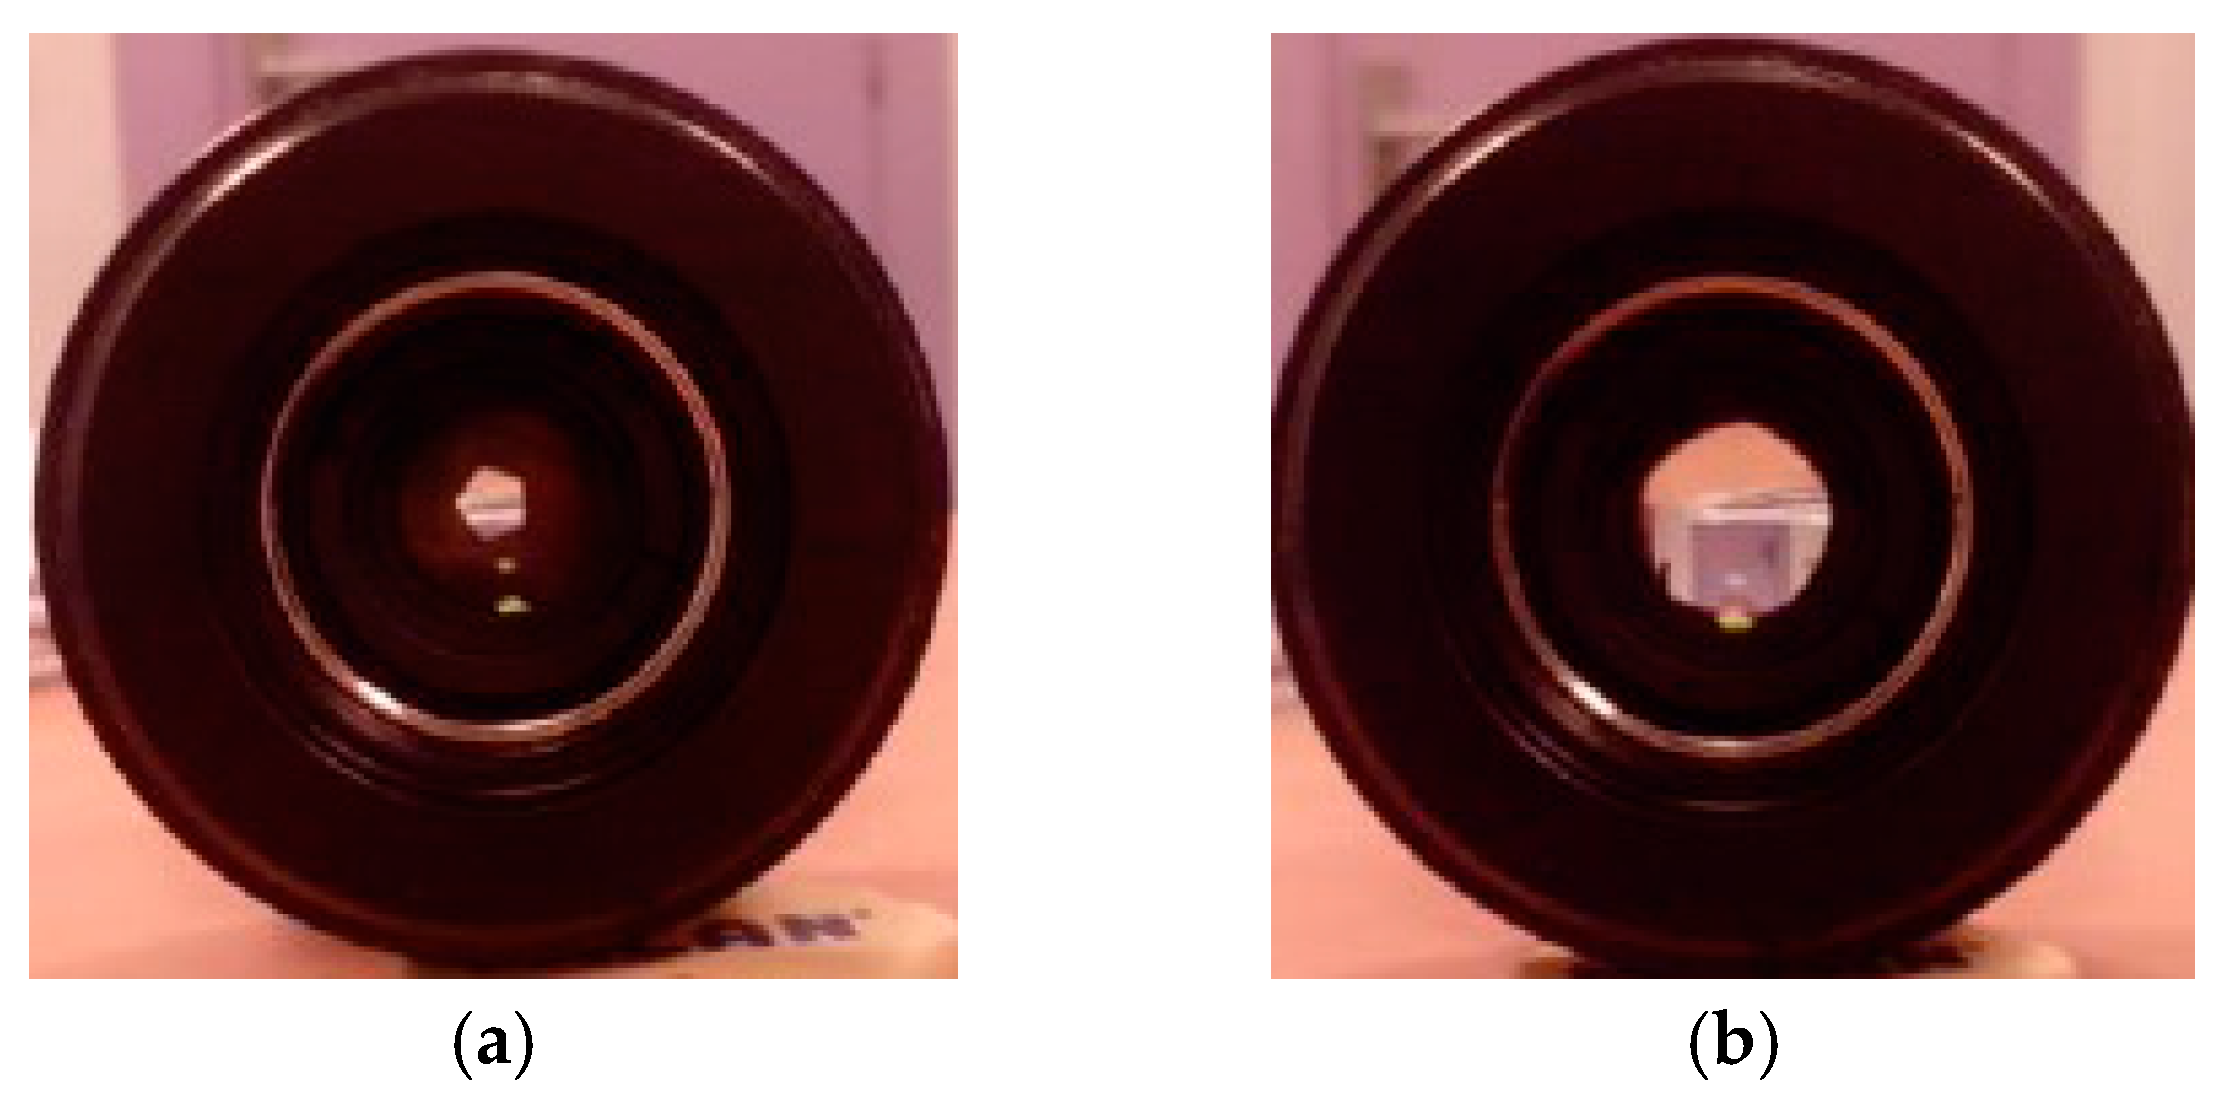
  • Iris diaphragm automatic or manual. This consists of a structure with movable blades producing an aperture which controls the area where the light, traveling towards the sensor, passes. Manufacturers specify it in terms of a value called the f-stop or f-number, which determines the ratio of f, to the area of the opening or more specifically the diameter (A) of the aperture area, i.e., N = f/A. The aperture setting is defined as steps or f-numbers, where each step defines a reduction by a half of the intensity from the previous stop and consequently a reduction in the aperture diameter of 2−⅟2. Figure 7 displays a lens aperture according to the f-number which is minimum in (a) with 16 and maximum in (b) with 1.9. Depending on the system, the scale varies, represented in fractional stops. So, to compute the scaled numbers in steps of N = 0, 1, 2, …, with the scale s, the following sequence is normally used: 20.5(Ns). The scales are defined as full stop (s = 1), half stop (s = 1/2), third stop (s = 1/3) and so on. The following is an illustrative example, if s = 1/3 the scaled numbers are: 1, 1.1, 1.3, …, 2.5,…16,…
  • Holders and interfaces. With the aim of adapting the required accessories, filter holders are specified. The type of mount (C/F) is also provided by manufactures.
  • Relative illumination and lens distortion. Relative illumination and distortion (barrel and pincushion) are provided as a function of focal distances.
  • Transmittance (T): Fraction of incident light power transmitted through the optical system. Typical lens transmittances vary from 60% to 90%. A T-stop is defined as the f-number divided by the square root of the transmittance for the lens. If T-stop is N the image contains the same intensity as the ideal lens with transmittance of 100% and with f-number N. Relative spectral transmittance with respect wavelengths is also usually provided. Special care should be taken to ensure the proper transmission of the desired wavelengths toward the sensor.
  • Optical filters. Used to attenuate or enhance the intensity of specific spectral bands, they transmit or reflect specific wavelengths. To achieve the maximum efficiency, their different parameters should be considered, including central wavelength, bandwidth, blocking range, optical density, cut on/off wavelength [52]. A common manufacturing technique consists of a deposition of layers alternating materials with high and low index of refraction. An example of a filter is the Schneider UV/IR 486 cut-off filter [32].
The choice of the optical system for agricultural applications is of special relevance in order to guarantee a correct performance oriented toward the acquisition of images with sufficient quality. In this regard, the image must be correctly focused (manually or with autofocus) because feature extraction depends highly on focus. Plants and structures that are out of focus do not provide appropriate features for discrimination. A compatible format between sensor and lens is mandatory in order to avoid distortions. An iris diaphragm could be automatic for self-adjusting, although a manual diaphragm could sometimes be suitable such that it can be controlled for a sufficient amount of illumination, which together with the exposure time control and image analysis allows the correct control for acquisition of images with the required quality. Transmittance and optical filters should be chosen properly to minimize undesired effects, such as vignetting. In agricultural applications the focal length selection is crucial for defining the most appropriate ROI. The next section is devoted to this issue.

3.3. Focal Length Selection

An important subject concerning the optical system is the selection of the focal length [53]. Depending on the field of view, the working distance where objects of interest are placed and the sensor sizes, the focal length requires a convenient selection. As mentioned before, it is well-known that the main element in the optical systems is the lens with its corresponding focal length, f, where in a converging lens all incoming rays parallel to the optical axis intersect. Figure 8 displays the basic elements of a generic converging optical system. H represents the field of view in the scene, h is the sensor size, D is the working distance and d is the distance from the lens to the image plane, i.e., the focus distance where the object appears focused on the image plane.
The Gaussian lens expression and magnification factor (m) are given as follows,
1 f = 1 D + 1 d ; m = h / 2 H / 2 = d D
By combining both expressions, the following relation can be derived,
f = h D h + H
For example, consider an agricultural machine vision application based on the Kodak KAI 04050 M/C sensor, specified in Section 5.1, with horizontal size 2336 pixels × 5.5 μm/pixel = 1285 mm. The ROI is 3 m wide or a tree is 3 m height, i.e., H = 3 m and the working distance is D = 5m. Under these considerations, applying the Equation (7) the required f results in 10.68 mm, which is a reference for selecting the focal length.

4. Geometric Visual System Attitude

4.1. Initial Considerations

Once the above issues have been considered, the next action, oriented toward the visual system selection in agricultural applications, is the geometric system arrangement. The main goal in this regard consists of determining the vision system pose, particularly onboard autonomous ground vehicles, where a set of specific 3D extrinsic parameters, involving translation and rotation matrices, are critical. These parameters combined with the also critical intrinsic parameters (focal length, sensor dimensions) allow us to determine how the 3D scene in the field is to be projected on the image plane. This represents an important challenge; particularly during the vision system selection process. Indeed, there are several tasks with specific requirements. The following is a list of examples:
  • Crop row detection: sometimes a fixed number of crop rows are to be detected for crops and weeds discrimination for site-specific treatments or precise guiding [5,7,10,11,12,13,14,15,16]. Depending on the number of crop rows to be detected or to follow during guidance, the vision system must be conveniently designed such that the required number of rows, considering the inter crop row spaces, can be imaged with sufficient image resolutions.
  • Plants leaves, weed patches, fruits, diseases: different applications have been developed based on sizes of structures. In [54] morphology of leaves is used for weed and crop discrimination based on features by applying neural networks. Apples are identified and counted on their context on the trees in [55]. Fungal or powdery mildew diseases are identified in [56,57]. The machine vision must provide sufficient information and the structures (leaves, patches fruits) must be imaged with sufficient sizes and dimensions to obtain discriminant features for the required classification or identification. In this regard, small mapped areas could be insufficient for such a purpose.
  • Tracking stubble lines: machine vision systems for tracking accumulations of straw for automatic baling in cereal has been addressed in [58], where a specific width is required to guide the tractor dragging the baling machine.
  • Spatial variations: plant height, fruit yield, and topographic features (slope and elevation) have been studied in [59], where specific machine vision system arrangements are studied.
  • 3D structure and guidance: stereovision systems are intended for 3D structure determination and guidance [20,21]. Multispectral analysis is carried improving the informative interpretation of crop/field status with respect to the 2D image plane. The panoramic 3D structure obtained must contain sufficient resolution for such interpretation and also provide a map where the autonomous ground vehicle applies path planning and obstacle avoidance for safe navigation. A variable field of view setup has been experimented for guidance in [22]. An adapted NDVI was used in [60] for distinguishing soil and plants trough a camera-based system for precise guidance in small vehicles.

4.2. System Geometry

The above are illustrative examples where the correct definition of intrinsic and extrinsic parameters will determine the machine vision effectiveness. The process to select a machine vision system, assuming image perspective projection, consists of the following steps:
  • Fix the position of the machine vision Cartesian system onboard the vehicle.
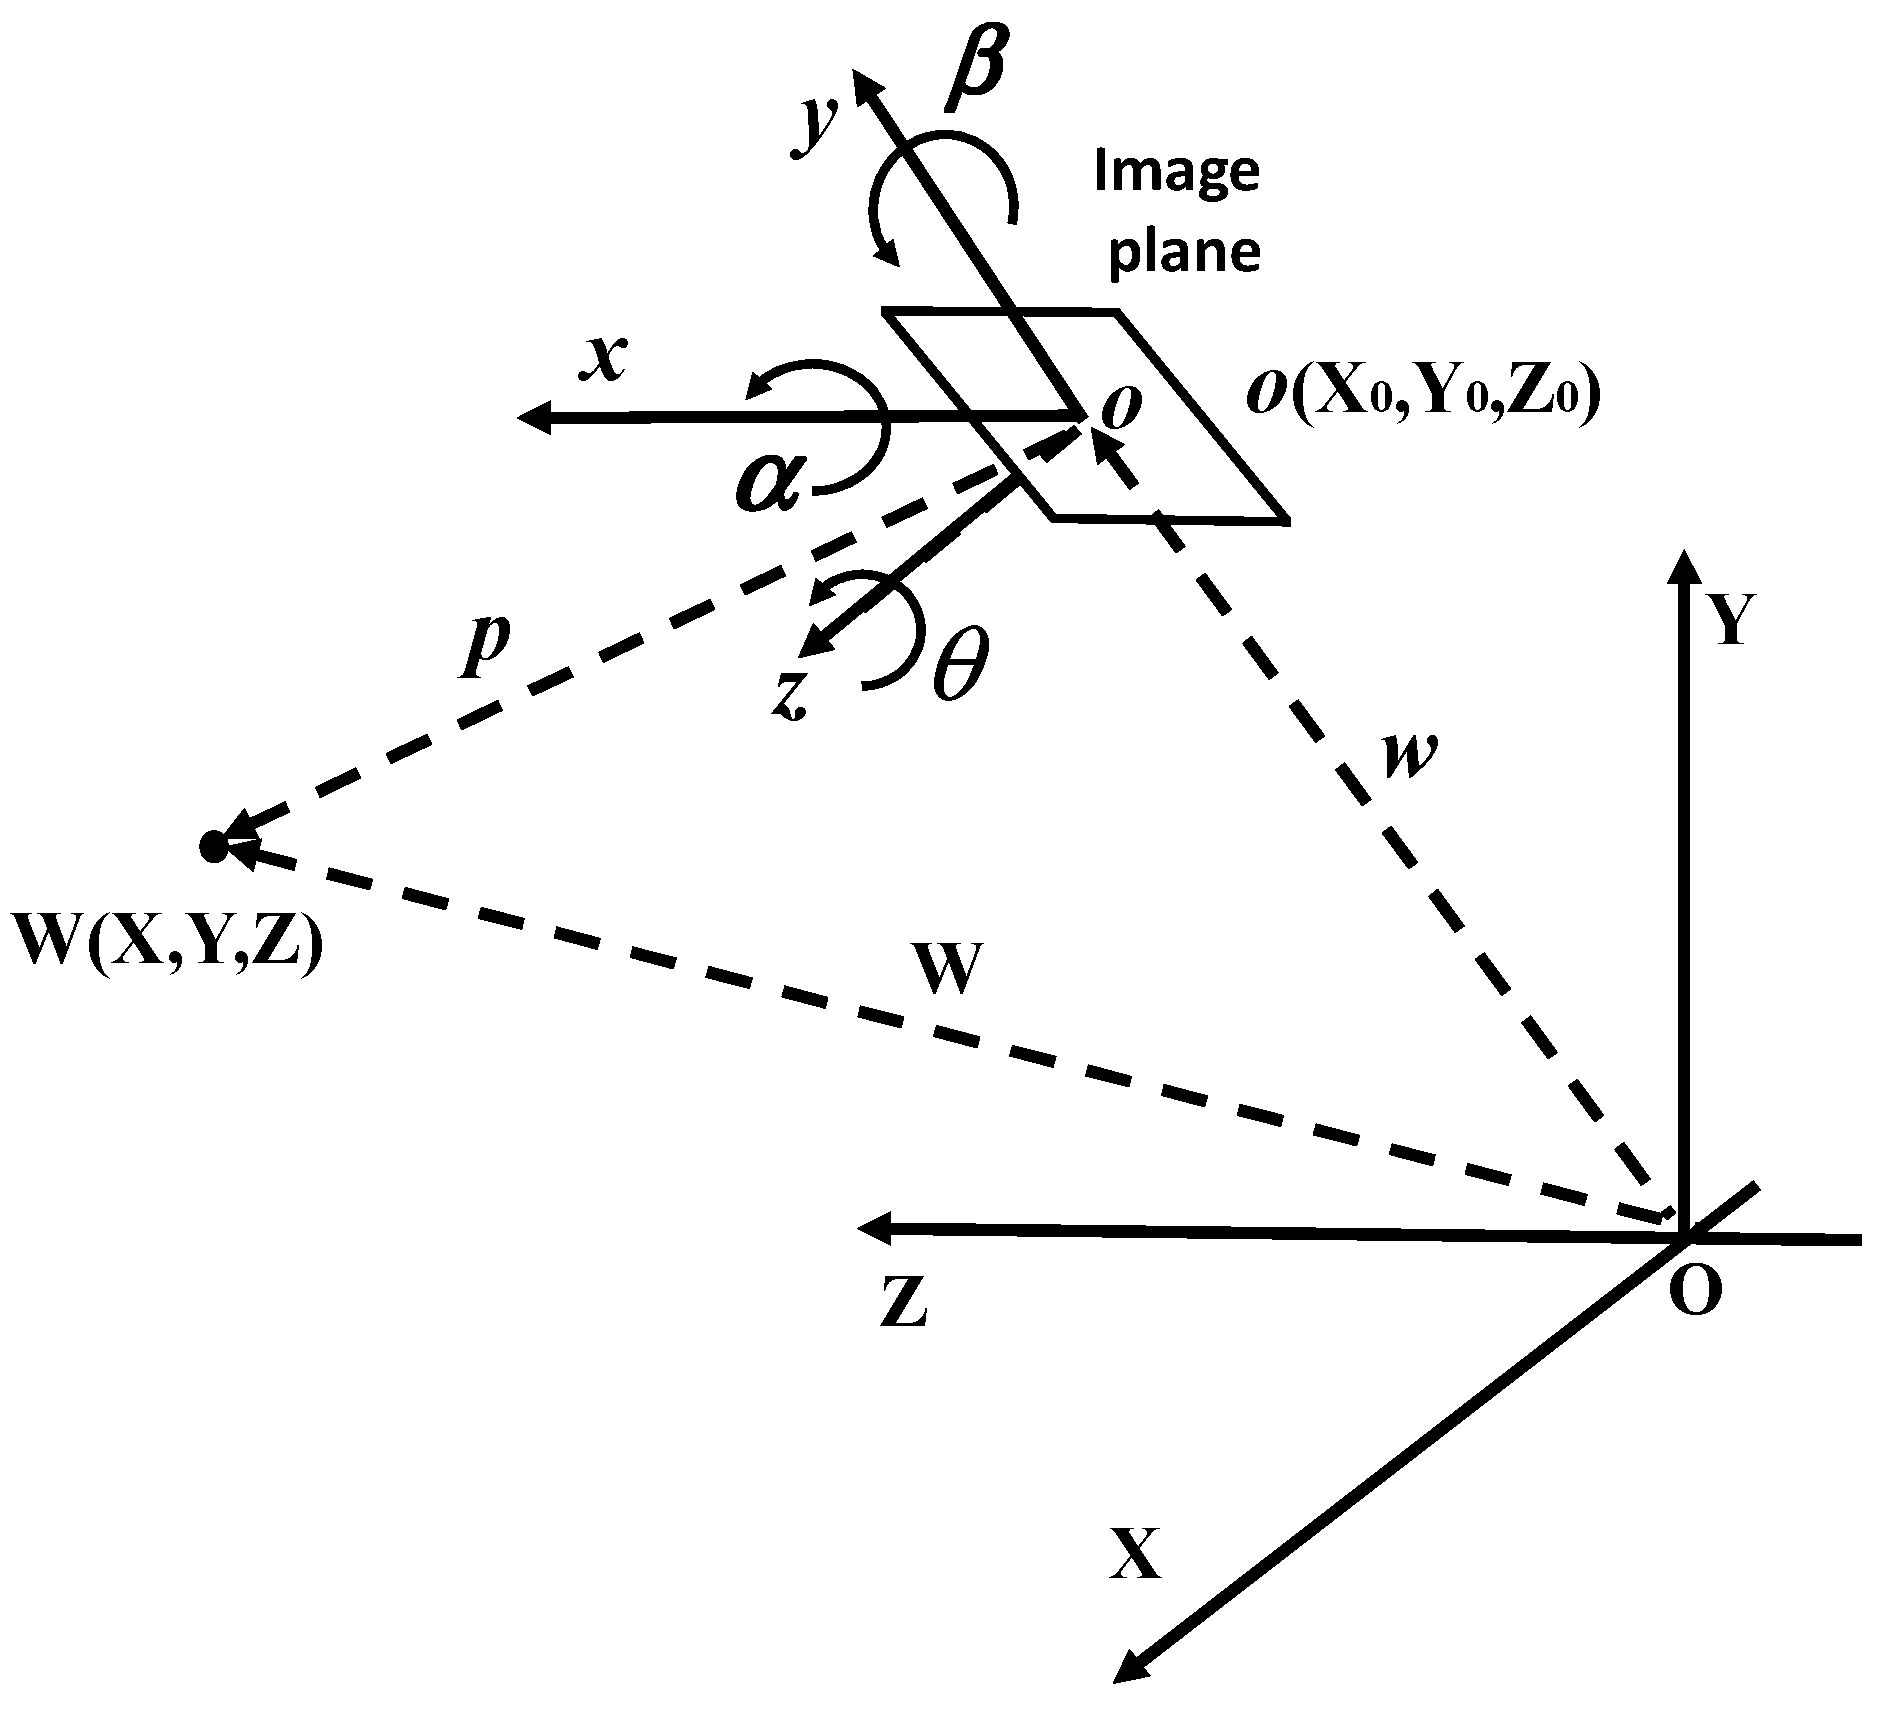
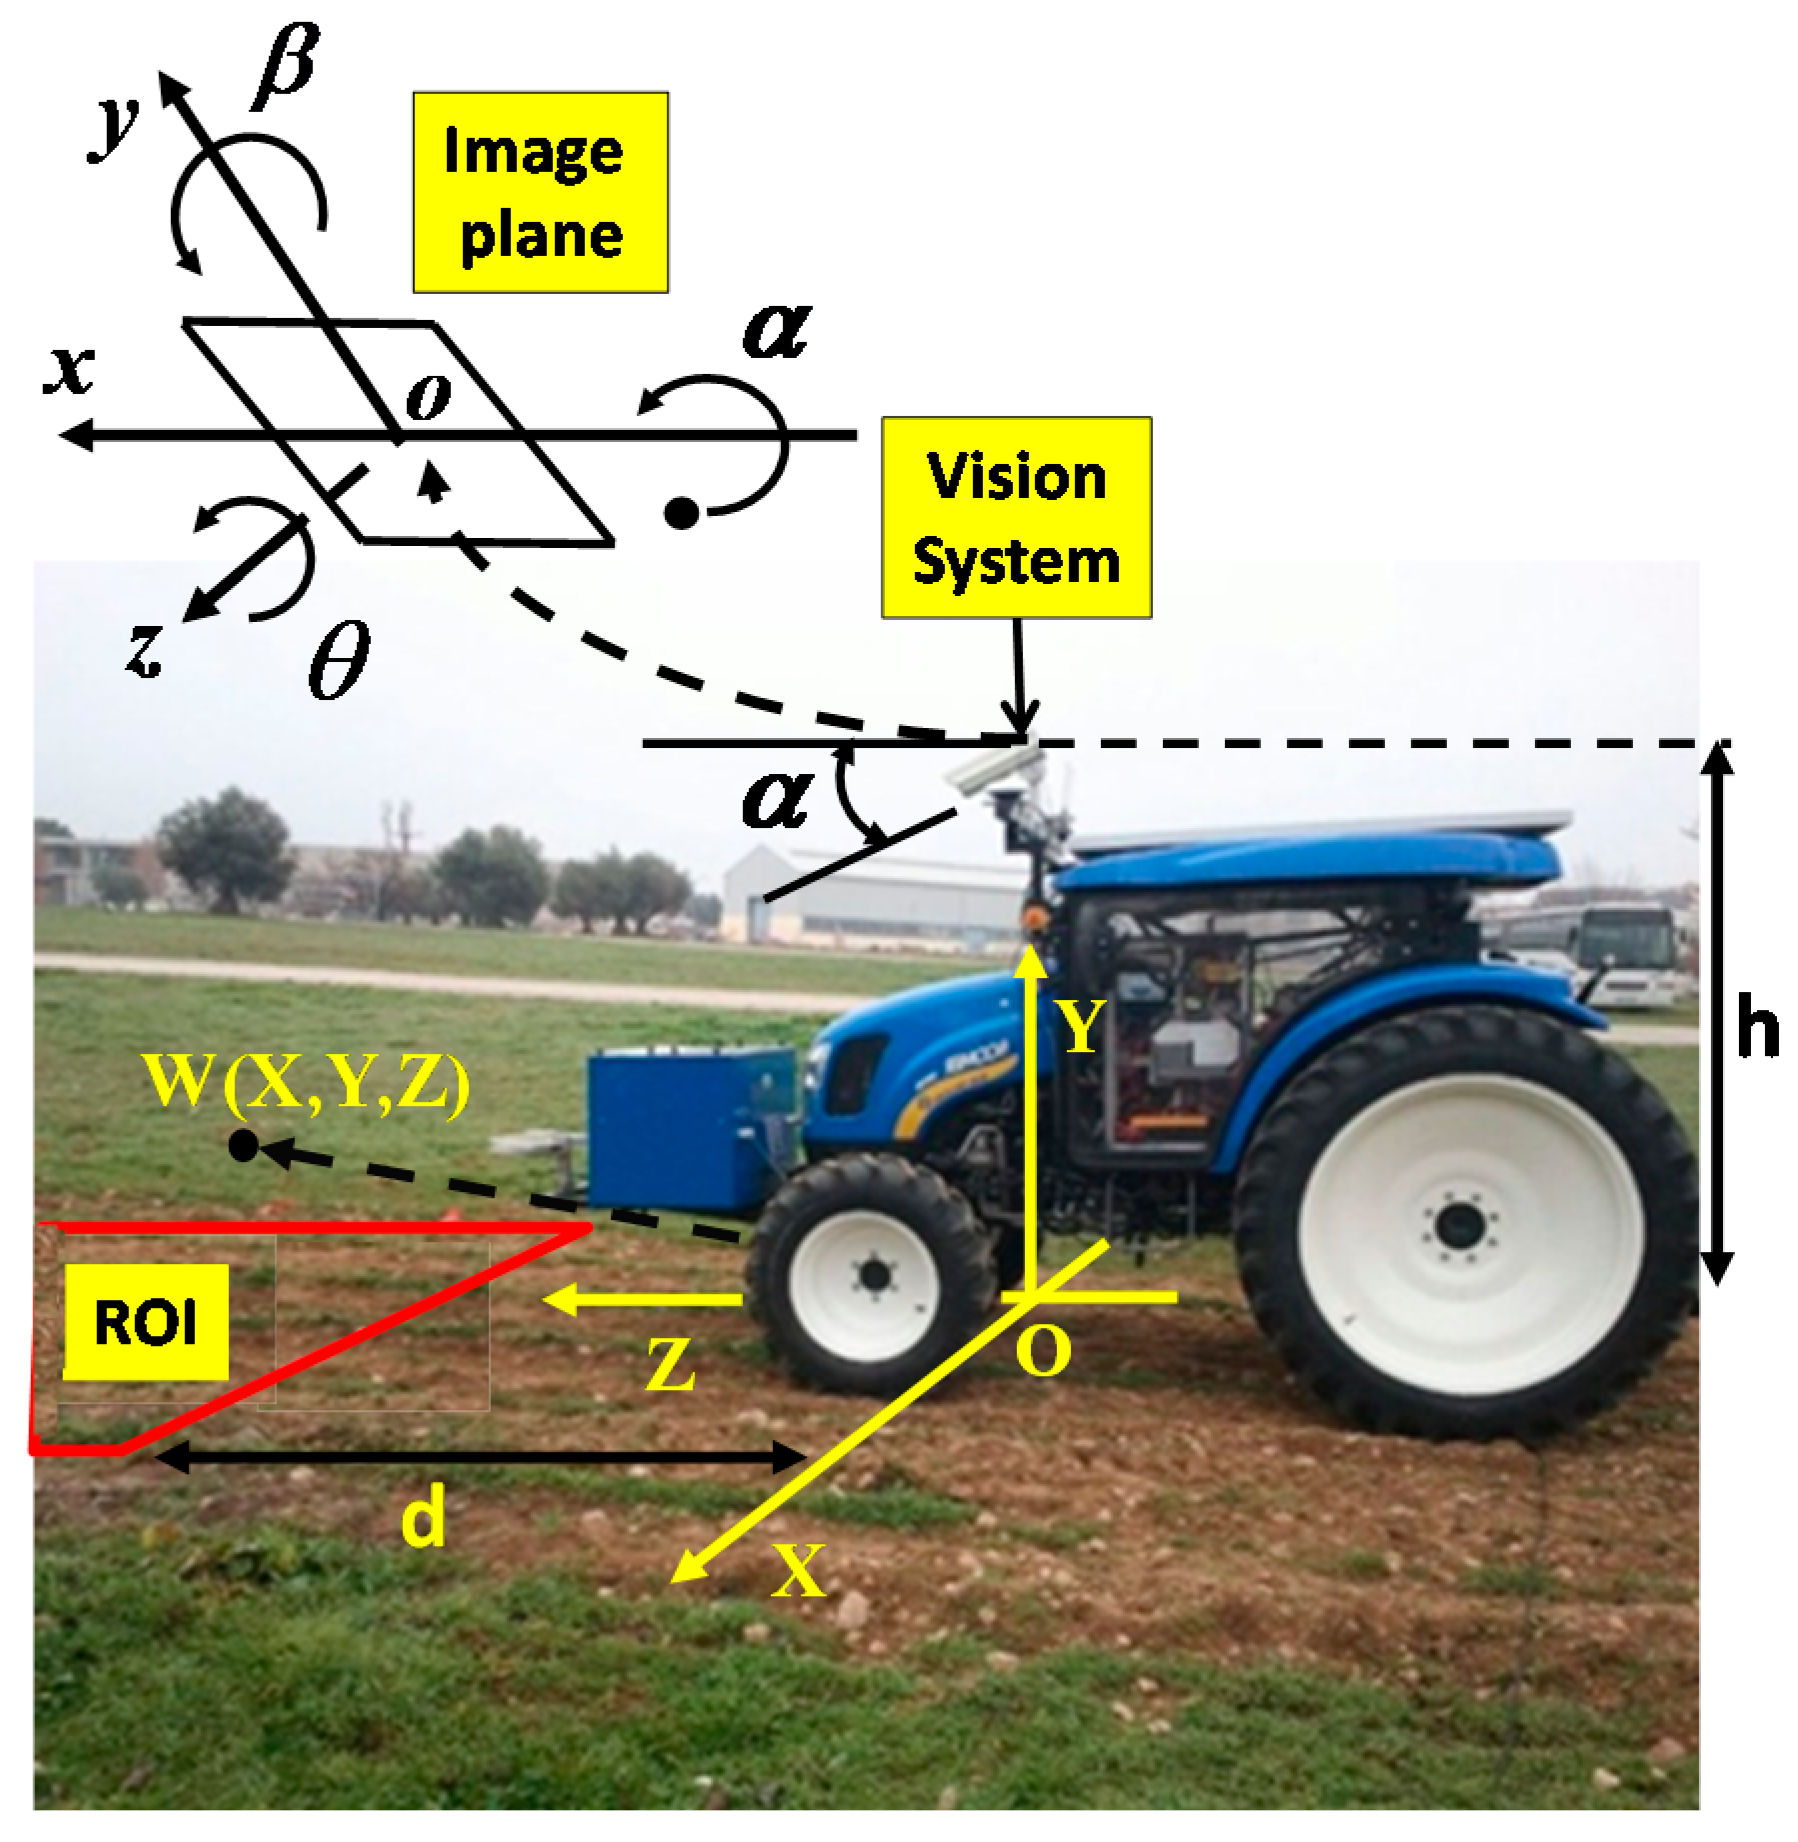
  • Take as reference the central point of the sensor o, i.e., the point where the two diagonals in the image plane intersect. This point will be the origin of the secondary coordinate system oxyz, with axes (x,y,z).
  • Fix the origin O and associated Cartesian axes (X,Y,Z) of the primary world coordinate system OXYZ. This is an imaginary system where the 3D points in the scene are to be referenced. Its positioning must be conveniently set as to facilitate the agricultural tasks.
Given a point W(X,Y,Z) with its corresponding spatial coordinates, the goal is to define the mapping of this point onto the image plane to obtain its coordinates (x,y) with respect to the system oxyz, either expressed as length or pixels units. Under the image perspective projection, the problem becomes a transformation between two 3D Cartesian coordinate systems, namely OXYZ and oxyz. To do that the following steps are required, where at each step an elemental homogenous transformation matrix is applied as follows [61]:
  • Initially the systems OXYZ and oxyz are both coincident, including their origins.
  • Move the origin of oxyz to a new spatial position located at W0(X0,Y0,Z0), which is the point chosen to place the central point of the image plane, i.e., the origin of the oxyz system. This operation is carried out by applying a translation operation through the matrix G.
  • Rotate the axes x, y and z with angles α, β and θ respectively. These rotations produce the corresponding elementary movements to place the image plane oriented toward the 3D scene (ROI) to be analyzed. These operations are carried out by applying the following respective operations Rα, Rβ and Rθ.
  • Once the image plane is oriented toward the scene, the point W(X,Y,Z) is to be mapped onto the image plane to form its corresponding image. This is based on the image perspective projection by applying the perspective transformation matrix P.
The point W(X,Y,Z) is mapped onto the image coordinates x and y through the following composition of elementary matrices in homogenous coordinates as defined in Appendix.
( x y z k ) = P R θ R β R α G ( X Y Z 1 )
The sizes of the sensor are measured in length units as expressed above as Sh and Sv, thus considering the origin of the oxyz reference system placed at the central point of the sensor device, the endpoints of the sensor are located at (−Sh/2, + Sh/2) and (−Sv/2, + Sv/2) for axes x and y respectively. The coordinates x and y are also expressed in length units with values in the following ranges: i.e., −Sh/2 ≤ x ≤ +Sh/2 and –Sv/2 ≤ y ≤ +Sv/2. Thus, to express x and y in pixel coordinates, xp and yp respectively the following transformation is applied,
x p = ( S h / 2 + x ) H S h   y p = ( S v / 2 + y ) V S v
Given a vision system setup, we can determine the imaging mapping of pixels in the 3D agricultural scenario allowing efficient analysis focused on secure specific operations. The following is a list of issues that can be established under the vision system setup for its correct selection:
  • Mapping of specific areas: to determine the number of pixels in the image, which allows us to determine if the imaged area is sufficient for posterior image processing analysis, such as morphological operations where the areas are sometimes eroded. For example, it is very important to determine if such areas can provide discriminatory information based on shape descriptors for dicotyledons against monocotyledons or other different species. Maximum and minimum weed patches dimensions should be also of interest [6,7,10,11,12,13,14,16,62].
  • Crop lines in wide row crops: determination of the maximum number of crop lines that can be fully seen widthwise. Maximum resolution that can be seen along with discriminant capabilities. Separation between crop lines to decide if weed patches can be distinguished or they could appear overlapped with the crop lines. Crop lines width and coverage [6,7,10].
  • Fruits: sizes of fruits for robust identification [63], where the imaged dimensions determine specific shapes based on sufficient fruit’s areas.
  • Canopy: where plant’s heights or other dimensions can be used as the basis for different applications, such as for plant counting to determine the number of plants of small young peach trees in a seedling nursery [64].
Illustrative examples are provided in section five in the context of the RHEA project [28], where the goal is to determine the best camera system arrangement for crop rows detection.
The machine visual system geometry represents an important issue to be considered in machine vision systems for agriculture:
  • The loss of the third dimension when the 3D scene is mapped onto 2D requires additional considerations in order to guarantee imaged working areas (ROIs) with sufficient resolutions and qualities.
  • Camera system arrangements onboard agricultural vehicles, together with the definition of the sensor’s resolutions and optical systems, are to be considered.
  • It is appropriate simulation studies to determine the best resolutions, based on geometric transformations from 3D to 2D.

4.3. Stereovision Systems

Stereovision systems, based on conventional lenses, are specifically dedicated to build 3D maps for different purposes in agriculture [65], including vehicles navigation, operator-assisted and autonomous systems [41], precision agriculture [42], recognition of fruits [66] or for obstacle avoidance for safety purposes [67]. Following the Barnard and Fishler [68] terminology, the problem of stereovision consists of the following steps: image acquisition, camera modeling, image matching and depth determination. The key step is the image matching, that is, the process of identifying the corresponding points in 3D scene. A set of constraints are generally applied for solving the matching problem, as explained in [68,69,70]: epipolar, similarity, uniqueness or smoothness.
Epipolar: derived from the system geometry, given a pixel in one image its correspondence in the other image will be on the unique line where the 3D spatial points belonging to a special line (epipolar) are imaged. Similarity: matched pixels have similar attributes or properties. Uniqueness: a pixel in the left image must be matched to a unique pixel in the right one, except for occlusions. Smoothness: disparity values in a given neighborhood change smoothly, except at a few discontinuities belonging to the edges, such as borders on trunks or obstacles.
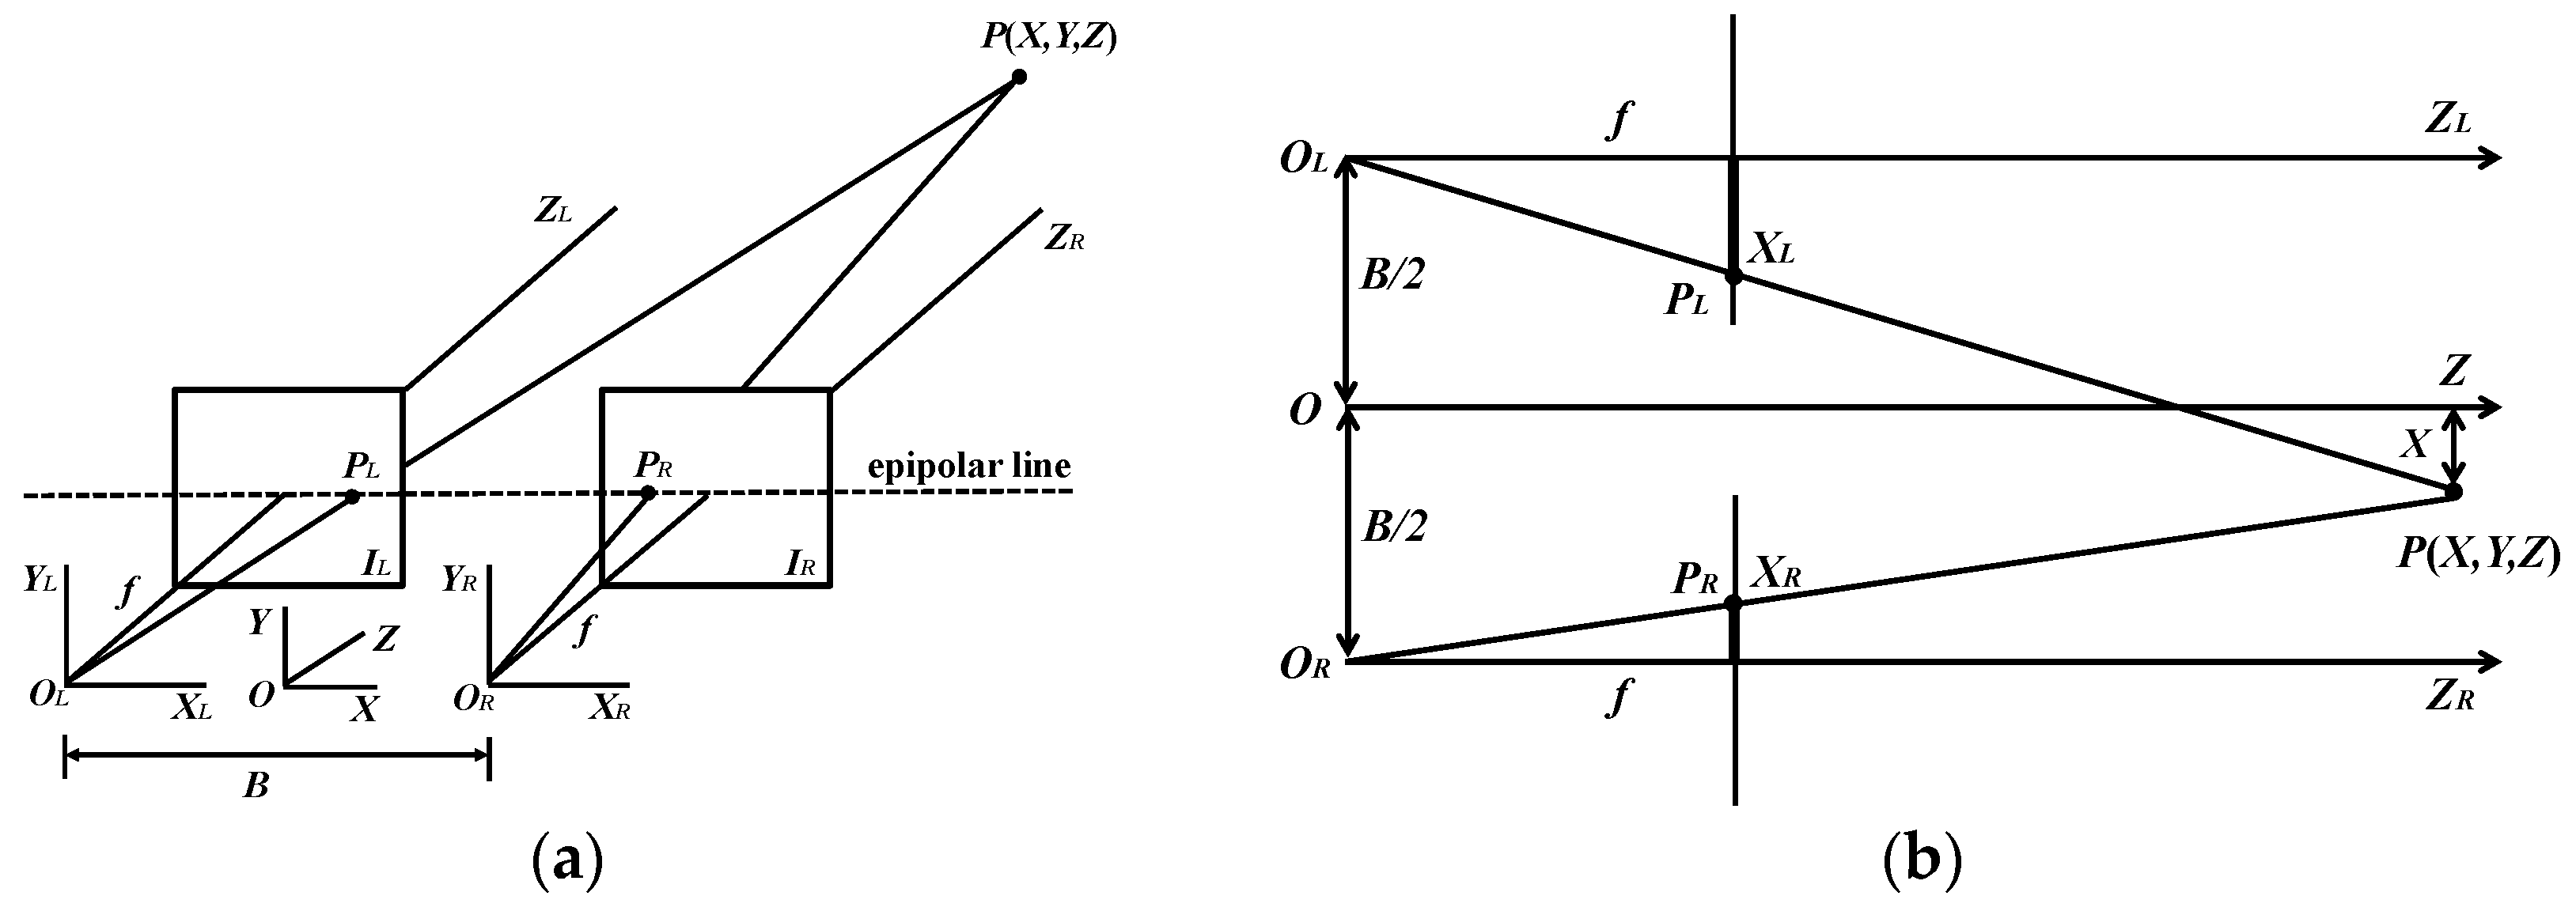
Consider two image planes, IL and IR associated to two stereo-cameras with parallel optical axes and projection centers OL and OR respectively and separated a baseline B, Figure 9a. The world coordinates system is defined by OXYZ, with the effective focal length, f, which is assumed to be identical in both optical systems. Let P(X,Y,Z) a 3D point expressed in OXYZ, which is projected onto the images planes on PL(XL, YL, ZL) and PR(XR, YR, ZR) with respect the image coordinates systems OLXLYLZL and ORXRYRZR. The projected rays POL and POR define the epipolar plane, whose intersections with image planes define the epipolar line. Given the projected point PL in the left image, its corresponding point PR in the right image lies on the epipolar line, which defines the epipolar constraint for stereo matching. The difference d = XL − XD is known as disparity. By applying triangulation and the similar triangles principle, once d is known by applying stereo correspondence, the depth, Z, for the point P can be established and hence the 3D determination. Figure 9b and Equation (10) display the similar triangles and the depth derivation.
O L   :   B 2 + X Z = X L f O R : B 2 X Z = X R f } X L = f Z ( X + B 2 ) X R = f Z ( X B 2 ) }   d = X L X R = f B Z Z = f B d
Once both f and B parameters have been fixed, the main issue is the computation of the disparity for each pixel or for specific features (edges, regions, interest points), this is known as the correspondence problem, which has been addressed broadly, although in different robotics contexts [71], but equally valid in agricultural settings.
In this regard, consider the following example, where we want to design a stereovision system with the following specifications and requirements: baseline 10 cm, the spatial coverage in the X direction should be at least 30 m for a distance Z of 60 m, and f of 10 mm. From Equation (10) we can obtain: X L = 10 m m 60 × 10 3 m m ( 30 × 10 3 m m + 100 m m 2 ) 5.01 m m and X R = 10 m m 60 × 10 3 m m ( 30 × 10 3 m m 100 m m 2 ) 4.99 m m , i.e., as an example, the CCD Kodak KAI 04050 M/C sensor, described in section five, with image resolutions of 2336 × 1752 pixels and 5.5 × 5.5 μm pixel-sizes suffices for this purpose. Indeed, XL/5.5 and XR/5.5 result in 910.61 pixels, falling inside the image resolutions.
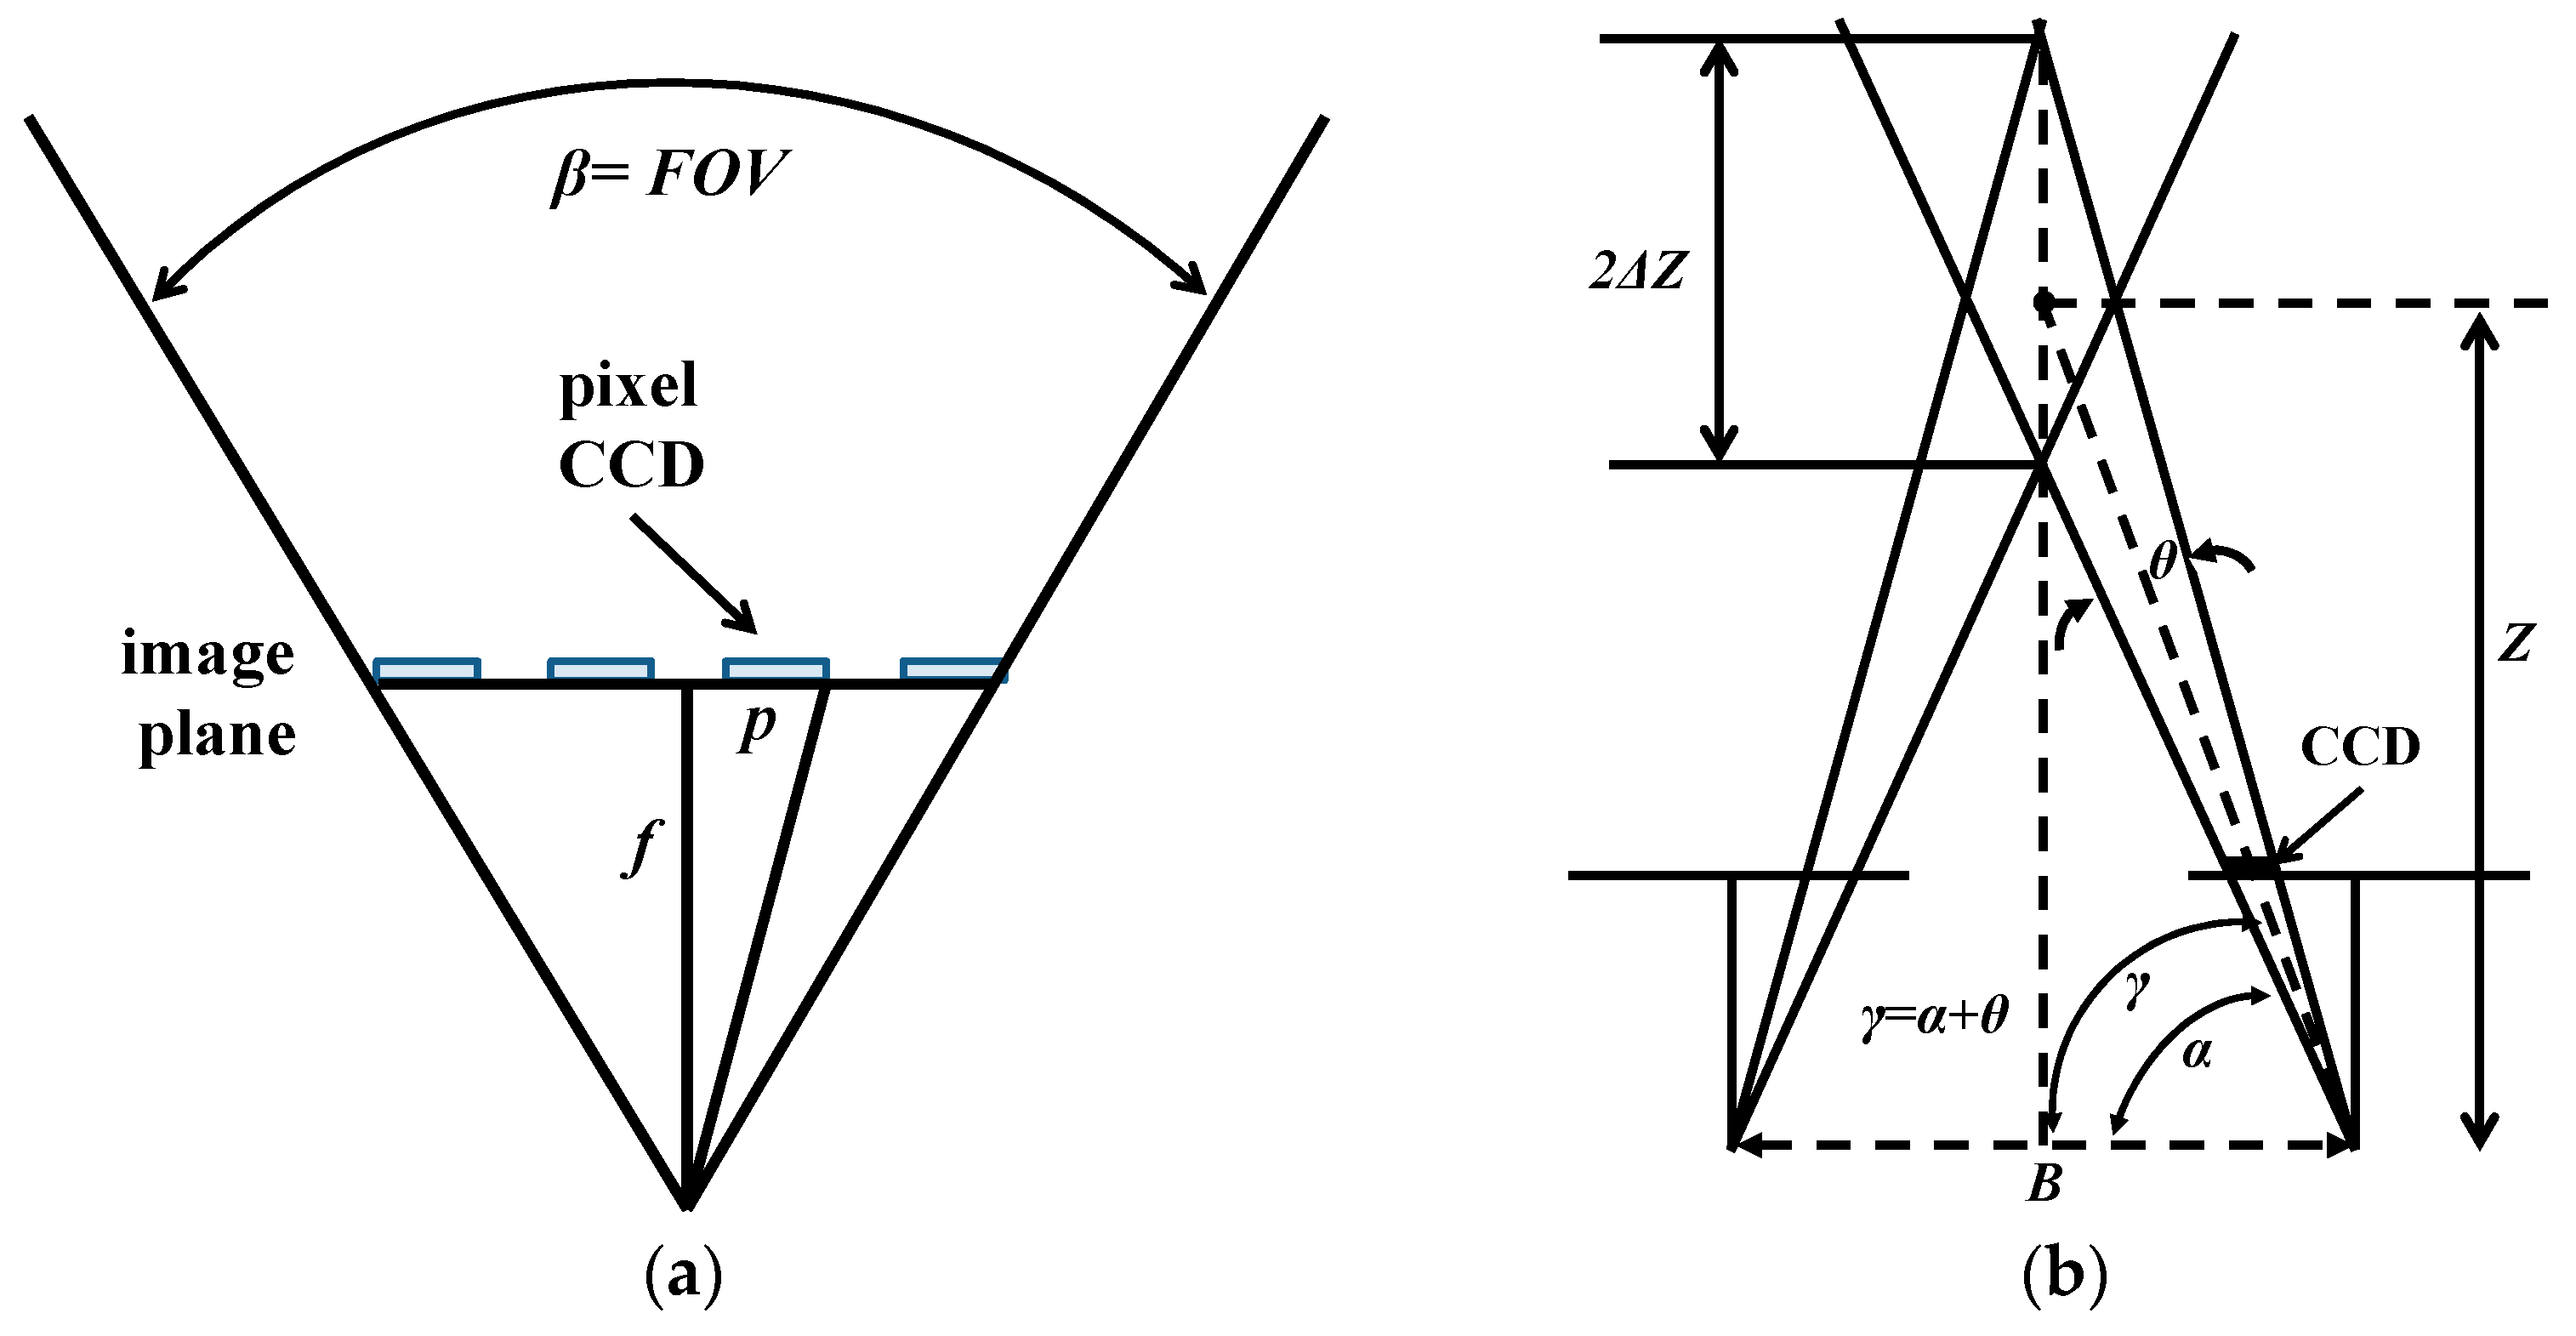
Precision in stereovision systems in agricultural applications becomes an important issue, because sometimes the ratio between 3D parameters and measurement errors becomes very significant. Indeed, assume the goal is to determine plant heights with few centimeters, if the systematic error introduced by the stereovision system is also of centimeters, the results could be dramatic and the system performance will be limited. This issue has been conveniently addressed in [72] under different system settings. Part of these limitations arises from the arrangement of the cells in the CCD/CMOS sensor device [73]. Assume the device contains n pixels (elements) along the horizontal X direction defined by its width p, Figure 10a, we can thus deduce the following relationship expressed in Equation (11),
t g β = n p 2 f β ( r a d i a n s ) ;   for   very   small   angles :   p f = 2 β n
where β determines the Field of View (FOV) angle.
From the geometric relations in Figure 10b the following equations can be derived,
t g γ = Z + Δ Z B / 2 ; t g α = Z B / 2
Z + Δ Z = B 2 t g γ Δ Z = B 2 t g γ Z = 1 2 B t g ( α + θ ) Z = B 2 t g ( t g 1 ( 2 Z B ) + θ ) Z
where Δ Z determines the accuracy in terms of the distance Z and the baseline. The Equation (13) can be expressed as a function of Z per baseline units as follows,
Δ Z B = 1 2 t g ( t g 1 ( 2 Z B ) + θ ) Z B
As an illustrative example, let a stereovision system with baseline B = 30 cm and f = 10 mm where each pixel is 5 μm as defined by the manufacturer. According to Equation (14) we need to know θ, which can be inferred from Figure 10, under the following assumption θ t g 1 ( p / f ) t g 1 ( 5 × 10 3 m m / 10 m m ) 5 × 10 4 r a d . Once obtained, the inaccuracy for a distance of 4m can be derived from Equation (13), as: Δ Z = 30 c m 2 t g ( t g 1 ( 800 c m 30 c m ) + 5 × 10 4 r a d ) 400 c m 5.4 c m , this means that the system must be validated with this inaccuracy to be considered as feasible or unfeasible.

5. A Case Study: Machine Vision Onboard an Autonomous Vehicle in the RHEA Project

The RHEA project [28] was envisaged for precision agricultural tasks in maize (Zea mays L.), wheat (Triticum aestivum L.) and olive trees (Olea europaea L.), and the experiments were performed over four years with a final demo (May, 2014) in two fields located in Arganda del Rey, Madrid, Spain, (40° 18′ 50.241″, −3° 29′ 4.653″ for wheat and 40° 18′ 57.924″, −3° 29′ 3.7134″ for maize and olive trees). A fleet of autonomous vehicles (ground and aerial) equipped with different sensors, all including a machine vision system, were the innovative elements used for such purpose. This case of study is focused on the machine vision system, installed onboard an autonomous ground vehicle based on a commercial tractor chassis, Figure 11a, used for weed detection and its removal in maize fields (wide row-crops). Weed detection is based on crop rows detection with respect the ground vehicle that allows the location of weed patches, at the same time it acts as an aid for guiding the vehicle. This study describes the full machine vision system onboard a tractor, considered as a whole, oriented toward a specific agricultural application. The full system contains a specific description related to the main issues addressed in the first part on this paper, i.e., spectral-band selection (Section 2), imaging sensors and optical systems (Section 3) and geometry (Section 4). This is explicitly stated.

5.1. Machine Vision System Specifications

The main components in the machine vision system were a camera-based with its optical system and an IMU (Inertial Measurement Unit), both embedded into a housing system with a fan controlled by a thermostat for cooling purposes, assuming that some agricultural tasks are conducted under high working temperatures, above 50 °C, Figure 11b. The housing system is IP65 protected to work in harsh environments (exposure to dust, drops of liquid from sprayers, etc.). The goal was to apply specific treatments in the ROI in front of the vehicle, which was a rectangular area 3 m wide and 2 m long, Figure 11a. It covers four crop rows in the field, as specified in RHEA. This area starts at 3 m (Section 5.2) with respect to a virtual vertical axis traversing the center of the image plane in the camera, i.e., where the scene is imaged, Figure 12.
The IMU, of LORD MicroStrain® Sensing Systems (Williston, VT, USA) is a 3DM-GX3®-35 high-performance model miniature Attitude Heading Reference System (AHRS) with GPS [74]. It is connected via RS232 to the processor and provides information about pitch and roll angles. These angles were used as aid for estimating the crop rows in the image, based on the geometric imaging projections from 3D to 2D, as described in Section 5.2.
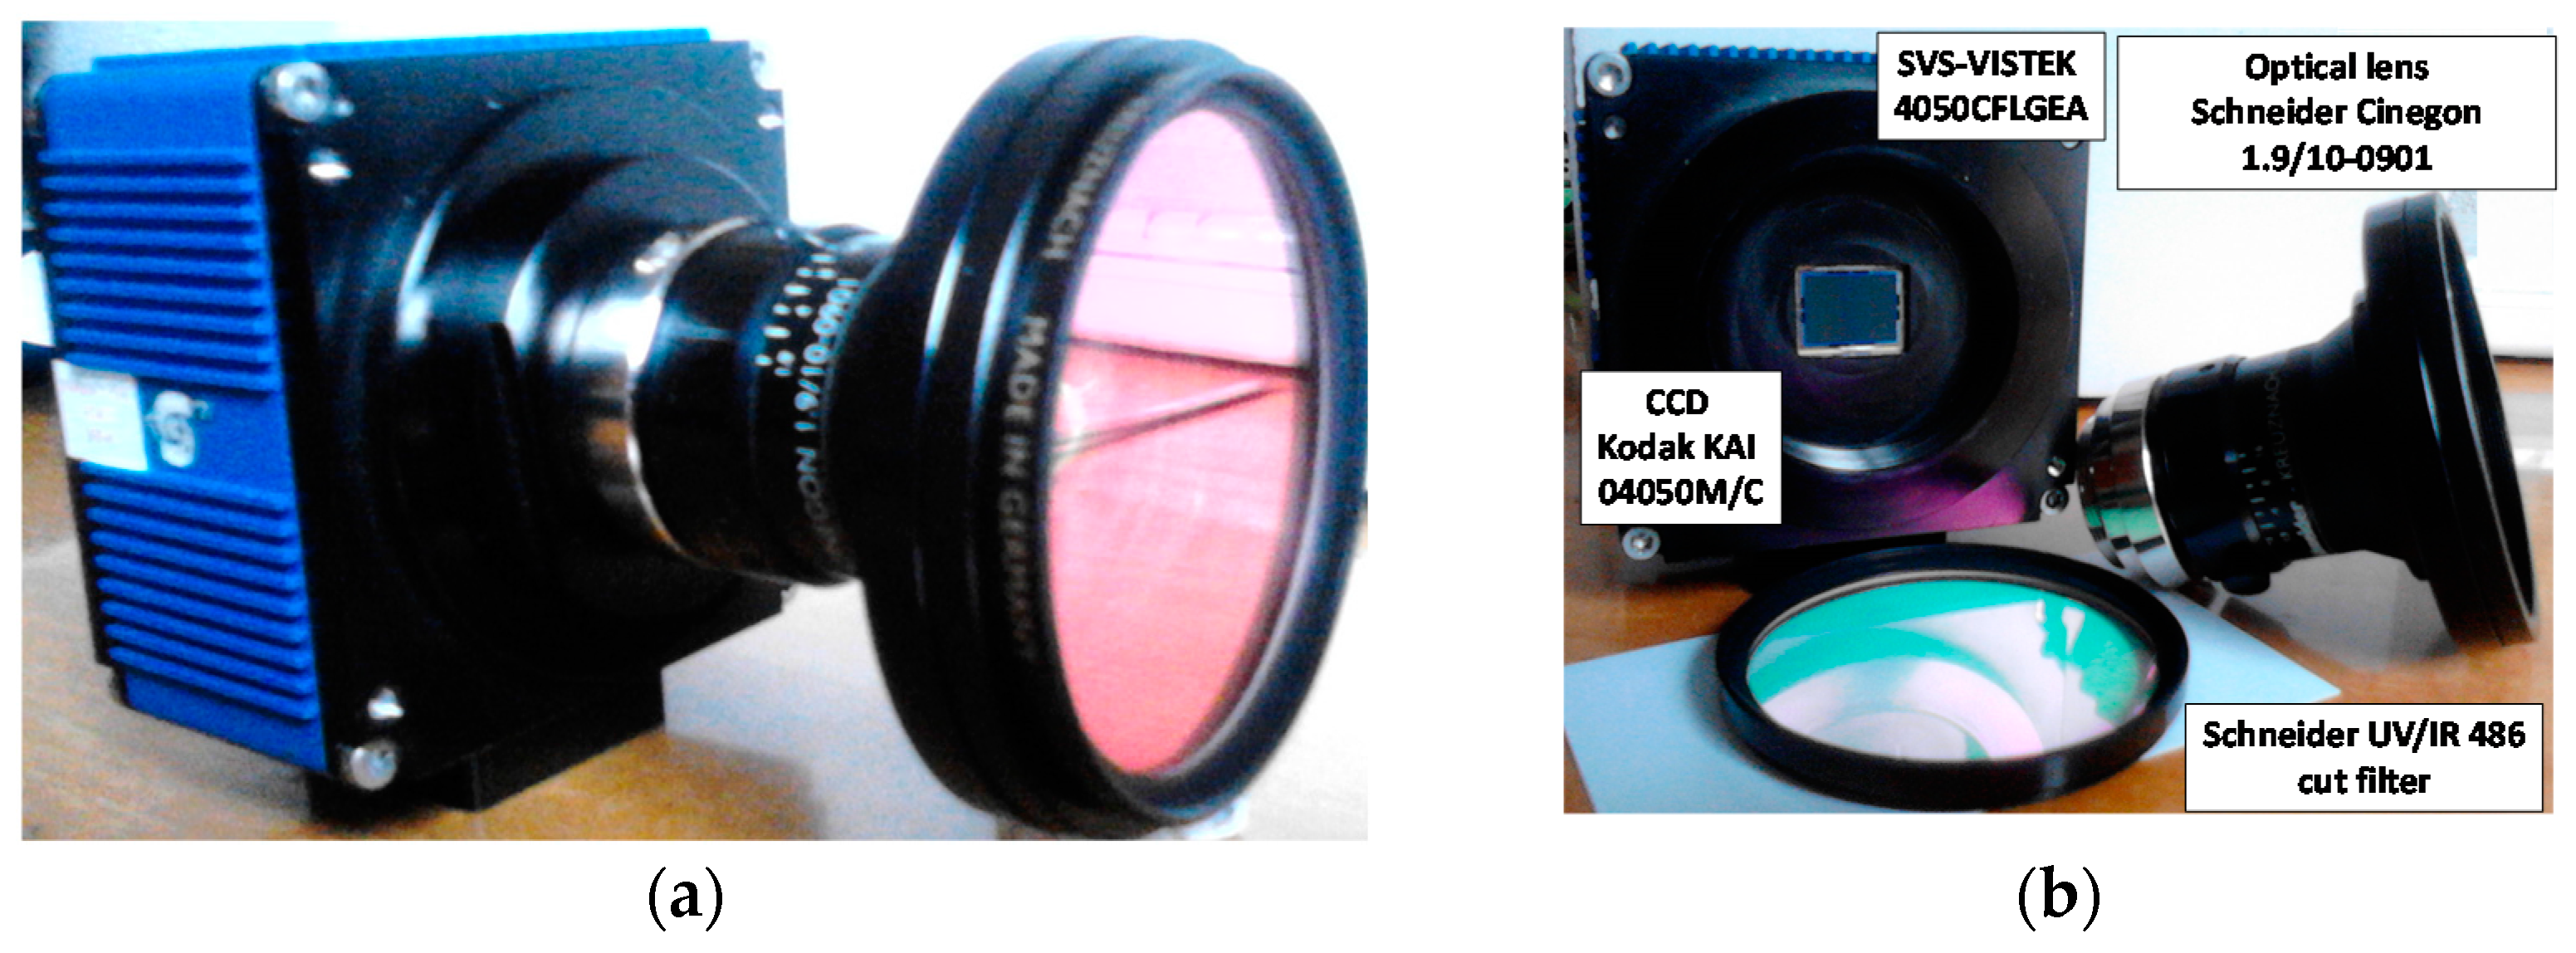
Specific considerations about spectral-band selection (Section 2), imaging sensors and optical systems specifications (Section 3) are provided below. The camera-based sensor, Figure 13a, is the SVS4050CFLGEA model from SVS-VISTEK [75] and is built with the CCD Kodak KAI 04050M/C sensor with a GR Bayer color filter; its resolution is 2336 × 1752 (H × V) pixels with a 5.5 by 5.5 μm pixel size. The manufacturer provides a data sheet for this device, with additional specifications, namely: frame rate (16.8 fps), sensor size (h × v =12.85 × 964 mm), type sensor format (1″), optical diagonal (1606 mm), minimum/maximum exposure times (6 μs/60 s or ∞ external), Red/Green/Blue gains modes (manual and auto), SNR (58 db/9 bit), internal memory (64 MB), manual/automatic white balance, lens mount (C-Mount), information about the operating temperature. The RR covers typical ranges in the visible spectrum, see Figure 1a as reference, starting at 300 nm with tails above 760 nm, i.e., receiving the impact of UV/IR radiations. The camera is Gigabit Ethernet compliant connected to the main processor. This processor consists of a CompactRIO-9082 [76], with a 1.33 GHz dual-core Intel Core i7 processor, including an LX150 FPGA with a Real-Time Operating System. LabVIEW Real-Time, release 2011, from National Instruments [77], was used as the development environment. On average, each image was processed on 400 ms.
The optical system, Figure 13a,b, consists of a lens with focal length of 10 mm, f-number varying from 1.9 to 16 covering maximum and minimum aperture respectively, format of 1″ (as required by the sensor format) and transmittance of 86%; it is equipped with an external UV/IR 486 filter with cutting wavelengths below 370 nm and above 760 nm, as described in Section 2.2.
In RHEA the f-number was fixed to 8 (intermediate value) and the exposure time was controlled by applying the procedure described in [50], which was based on the histogram analysis of the ROI. Vignetting correction was applied, as described in Section 2.2. No white balance was used because of the problems with shadows mapped onto the reference panel, described in Section 2.2. The frame rate was fixed to 3 fps, which was sufficient. Indeed, the maximum speed of the vehicle during the working operation was fixed to 6 Km/h, so that the vehicle requires 1.8 s to travel the 3 m length of the ROI, i.e., we had available about 5 frames, allowing us to discard possible failed images.

5.2. 3D Mapping onto 2D Imaging

Figure 13 displays the camera system geometry, based on the considerations addressed in Section 4. OXYZ is the reference frame located in the ground with its axes oriented as displayed; h is the height from O to the origin o of the reference frame oxyz attached to the camera; roll (θ), pitch (α), and yaw (β) define the three degrees of freedom of the image plane with respect to the referential system; d is the distance from the beginning of the ROI to the X axis.
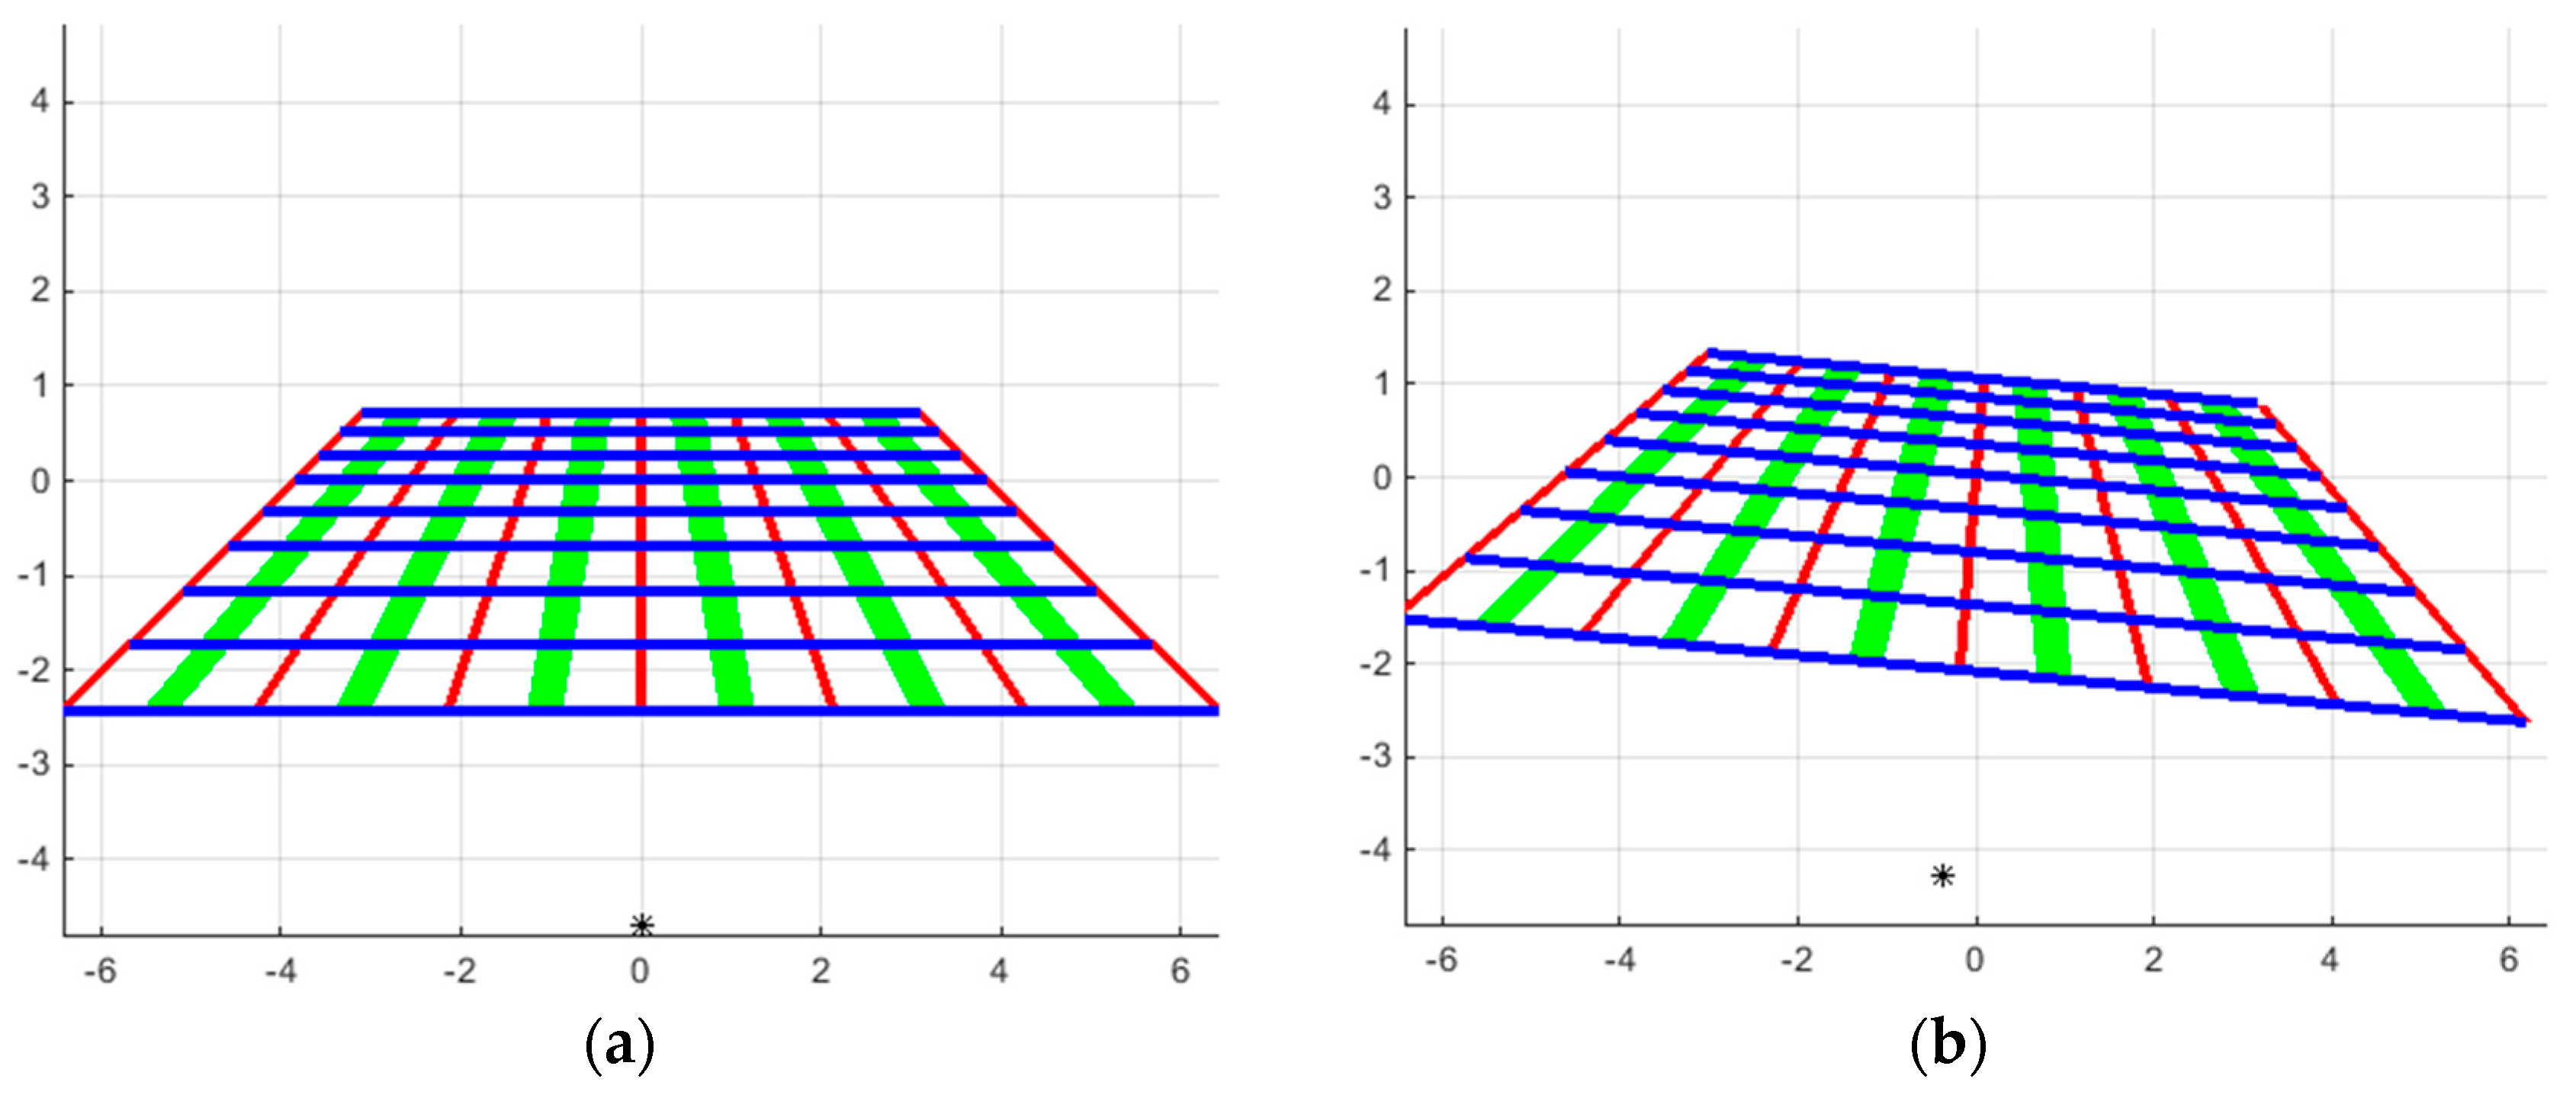
As an illustrative example for defining the vision system geometry, consider the camera-based sensor and optical system specified in Section 5.1. based on the geometric scheme described in the Appendix. The ROI is imaged onto the image plane as displayed in Figure 14a. Six crop rows are specified (which is a number different from the four crop rows in RHEA) separated from each other 0.75 m; eight horizontal strips are considered with a separation of 50 cm. The ROI is placed on the ground with 4.5 × 4 m2 (wide and long), placed 3 m ahead of the tractor with reference to the origin of the world coordinate system OXYZ, i.e., with XYZ coordinates (0,0,3) m, respectively. The extrinsic camera parameters are: (X0,Y0,Z0) ≡ (0,2,0) m and (α,β,θ) ≡ (20°,0°,0°). Figure 14b displays the same ROI imaged with the same arrangement but with a different θ, i.e., (α,β,θ) ≡ (20°,0°,+5°). As we can see the image becomes distorted in the second case. The asterisk displayed in both images is the mapping of a reference point with coordinates (X,Y,Z) ≡ (0,1,1) m.
Assume the same sensor SVS4050CFLGEA placed at (X0,Y0,Z0) ≡ (0,2,0) m, given a simulated patch with size 20 × 20 cm2 placed onto the ROI described above at different distances from the center O in the world coordinate system OXYZ. The imaged areas of this patch are measured in pixels and displayed in Table 3 as a function of the distances from the center, i.e., with Z values of 3, 4, 5 and 6 m, Y = 0 and X = ±10 cm; with two α values (15° and 20°), β and θ both fixed to 0° and also for the following four focal lengths (3.5, 8.0, 10.0, 12.0) mm.
We can see that the maximum/minimum areas are 8840/110 pixels, which corresponds respectively to imaged patches of 94 × 94 and 11 × 10 pixels2 for the same patch on the 3D ROI. This allows the evaluation of the vision system configuration in order to discriminate shapes or for posterior processing such as morphological operations. For example, if binary morphological erosion is applied over the above areas with a 3 × 3 structuring element these areas are reduced to 8464/72 pixels representing reduction rates of 4.2%/34.5%. This means that the best arrangement is the first one as the largest area allows for better subsequent discrimination based on area analysis. Designers can use the vision system geometry for different simulations. However, in addition, the following robot simulators could be used for previous analysis on agricultural environments [78,79].

5.3. Crop Rows Detection and Weed Coverage

Three methods were tested in RHEA for crop rows detection [5,10,80], the vignetting effect, produced by the use of the Schneider UV/IR 486 cut-off filter, was compensated based on the approach proposed on subsection (2.2). No white balance was required because this action was replaced by histogram analysis on the ROI, as explained in the above references. Alignments of row pixels were identified in [5] along specific directions defining the crop rows. Maximum accumulations corresponding to the number of expected crop rows define the crop rows. This approach, inspired by the human visual perception, is a simplification of the Hough transform [16]. Linear regression was applied in [10,80], where greenness was identified based on the computation of vegetation indices [11] followed by automatic thresholding. The IMU provides pitch and roll angles, which together with the remainder intrinsic/extrinsic parameters and Equation (8) the expected crop rows are drawn on the image, and then linear regression (least squares and Theil-Sen respectively) was applied for adjusting the expected crop rows to the real ones on each image.
More than 3000 images were analyzed belonging basically to three groups according to the growth stage of the crop: Low (5 cm), Medium (15 cm), High (30 cm). The images were acquired over different days under different illumination conditions, i.e., cloudy, sunny days, and days with high light variability. With the set of images analyzed and considering the maize crops at the above-mentioned three growth stages (low, medium, high), the averaged percentage of successes displayed in Table 4 were obtained.
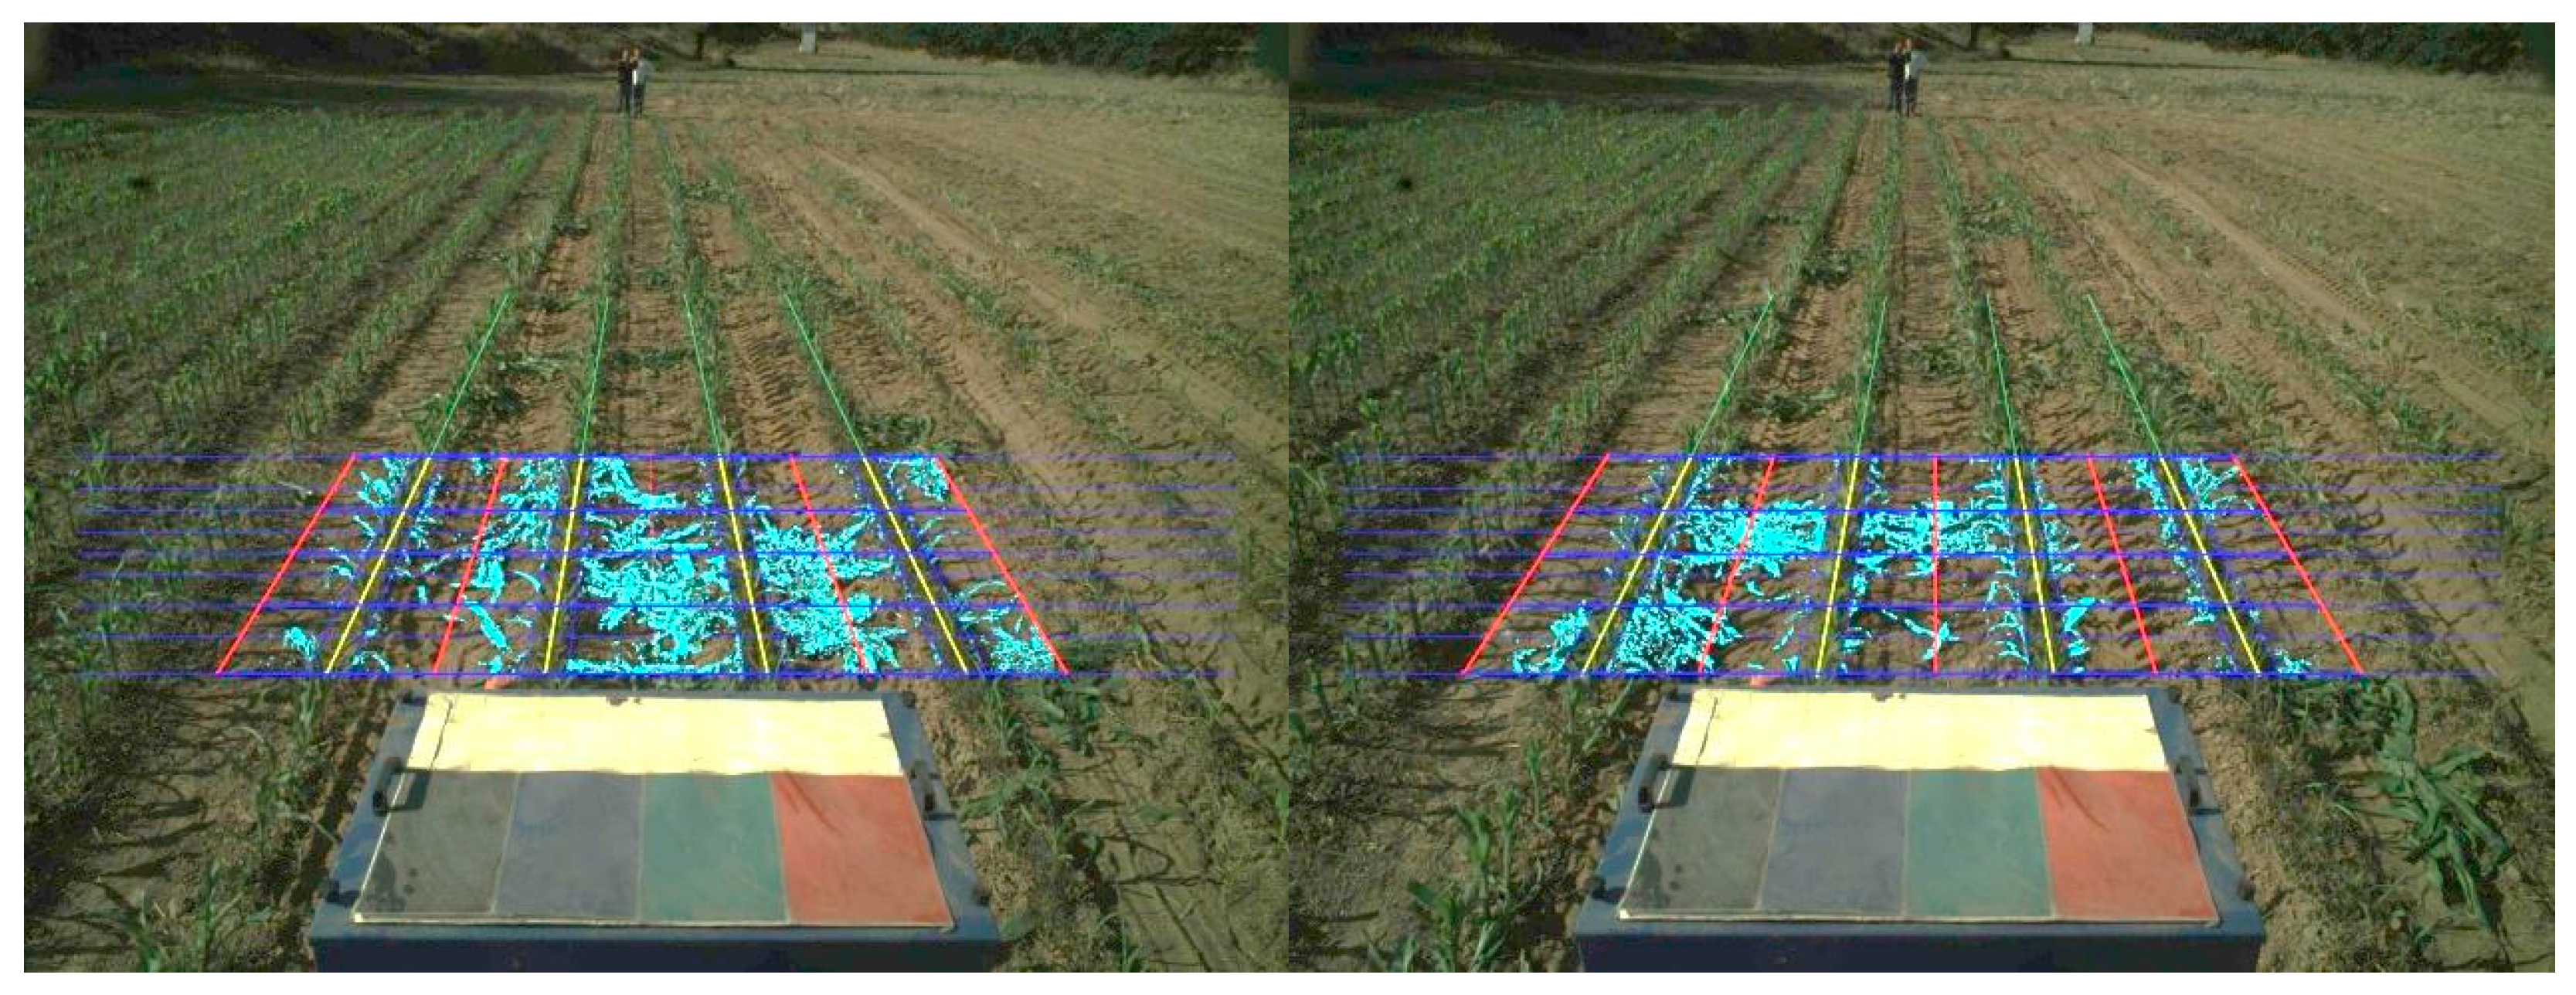
For each image, a density matrix of weeds associated with each ROI was computed. This matrix contains low, medium, and high density values. Figure 15 illustrates two consecutive images along a sub-path. They contain three types of lines defining the cells required for computing the density matrix as follows:
  • Once the crop lines are identified, they are confined to the ROI in the image (yellow lines).
  • To the left and right of each crop line, parallel lines are drawn (red). They divide the inter-crop space into two parts.
  • Horizontal lines (in blue) are spaced conveniently in pixels so that each line corresponds to a distance of 0.25 m from the base line of the spatial ROI in the scene.
  • The above lines define 8 × 8 trapezoidal cells, each trapezoid with its corresponding area Aij expressed in pixels. For each cell, the number of pixels identified as green pixels was computed, Gij, (drawn as cyan pixels in the image). Pixels close to the crop rows were excluded, with a margin of tolerance which represents 10% of the width of the cell along horizontal displacements. This is because this margin contains mainly crop plants but not weeds. The weed coverage for each cell is finally computed as dij = Aij/Gij, expressed in percentage. The different dij values compose the elements of the density matrix.
From a set of 500 images, obtained during the test campaigns mentioned above and also with the different growth stages, the weed coverage was classified according to three levels (Low, less than 33%, Medium, between 33% and 66%, and High, greater than 66%), associated to the Liquefied Petroleum Gas pressure levels of the physical weed controller used for weed removal in RHEA. These percentages are checked against the criterion of an expert, who determined the correct classification. The results are summarized in Table 5.
As before, the worst value corresponds to maize fields with a high growth stage, which is consistent with the real situation because of the reasons expressed above. Part of the inaccuracy comes from the incorrect crop lines detection.

5.4. Guidance

Nowadays, GPS systems are commonly used, being a well-known approach for autonomous guidance. However, in RHEA, tractor’s guidance was achieved by combining GPS and machine vision systems.
In RHEA a Mission Manager software-based was developed for handling the multi-robot system. It is responsible for generating global trajectories determining the path planning [81], which are previously established for each vehicle before the mission starts [82]. Regarding the global path following planned for the tractor, parallel routes that move alternately from one extreme of the field to the other are planned, following the crop row direction and turning in the headlands (the outer areas of the field). At the first stage, the GPS was used to provide information to the tractor to place it at the beginning of the crop rows, points belonging to the plan, as aligned as possible.
Once the tractor is placed and aligned, the tractor starts moving along the crop rows following the planned path by using GPS information. Specifically, a RTK-GPS (Real Time Kinematics-Global Positioning System) sensory system was used consisting of two GNSS (Global Navigation Satellite Systems) rover antennas, one for XYZ positioning and the other for heading calculations [47,81], where the correction signal is produced locally generated with a reference (local) base station, providing localization errors of below ±2 cm. Precise guidance was applied for controlling deviations from the planned path, based on the machine-vision system.
The system determines the diagonal (D) line equidistant to the two central crop rows detected in the image. Considering the bottom line in the image defining the ROI, two principal points are identified. The first is exactly the central point (Pc) in the horizontal row crossing the full image and overlapped with the bottom line in the ROI. The second (Pi) is the intersection point between D and the same bottom line in the ROI.
The difference between the x-horizontal coordinates of Pi and Pc determines the deviation with respect the correct trajectory. This difference (positive, negative or null) transformed from image pixels to length measurements was used for trajectory correction.
When Pi and Pc match, no correction was required; otherwise, the appropriate correction with respect the planned path (line-of-sight) was applied. In order to assume incorrect information provided by the machine vision system because of failures during the crop row detection, lower and upper limits were established considering that deviations greater than ±3 cm are ignored and that the path following continues with the GPS following the line-of-sight. The limit of ±3 cm represents the 8% with respect the half of the distance of 75 cm existing between adjacent crop rows.
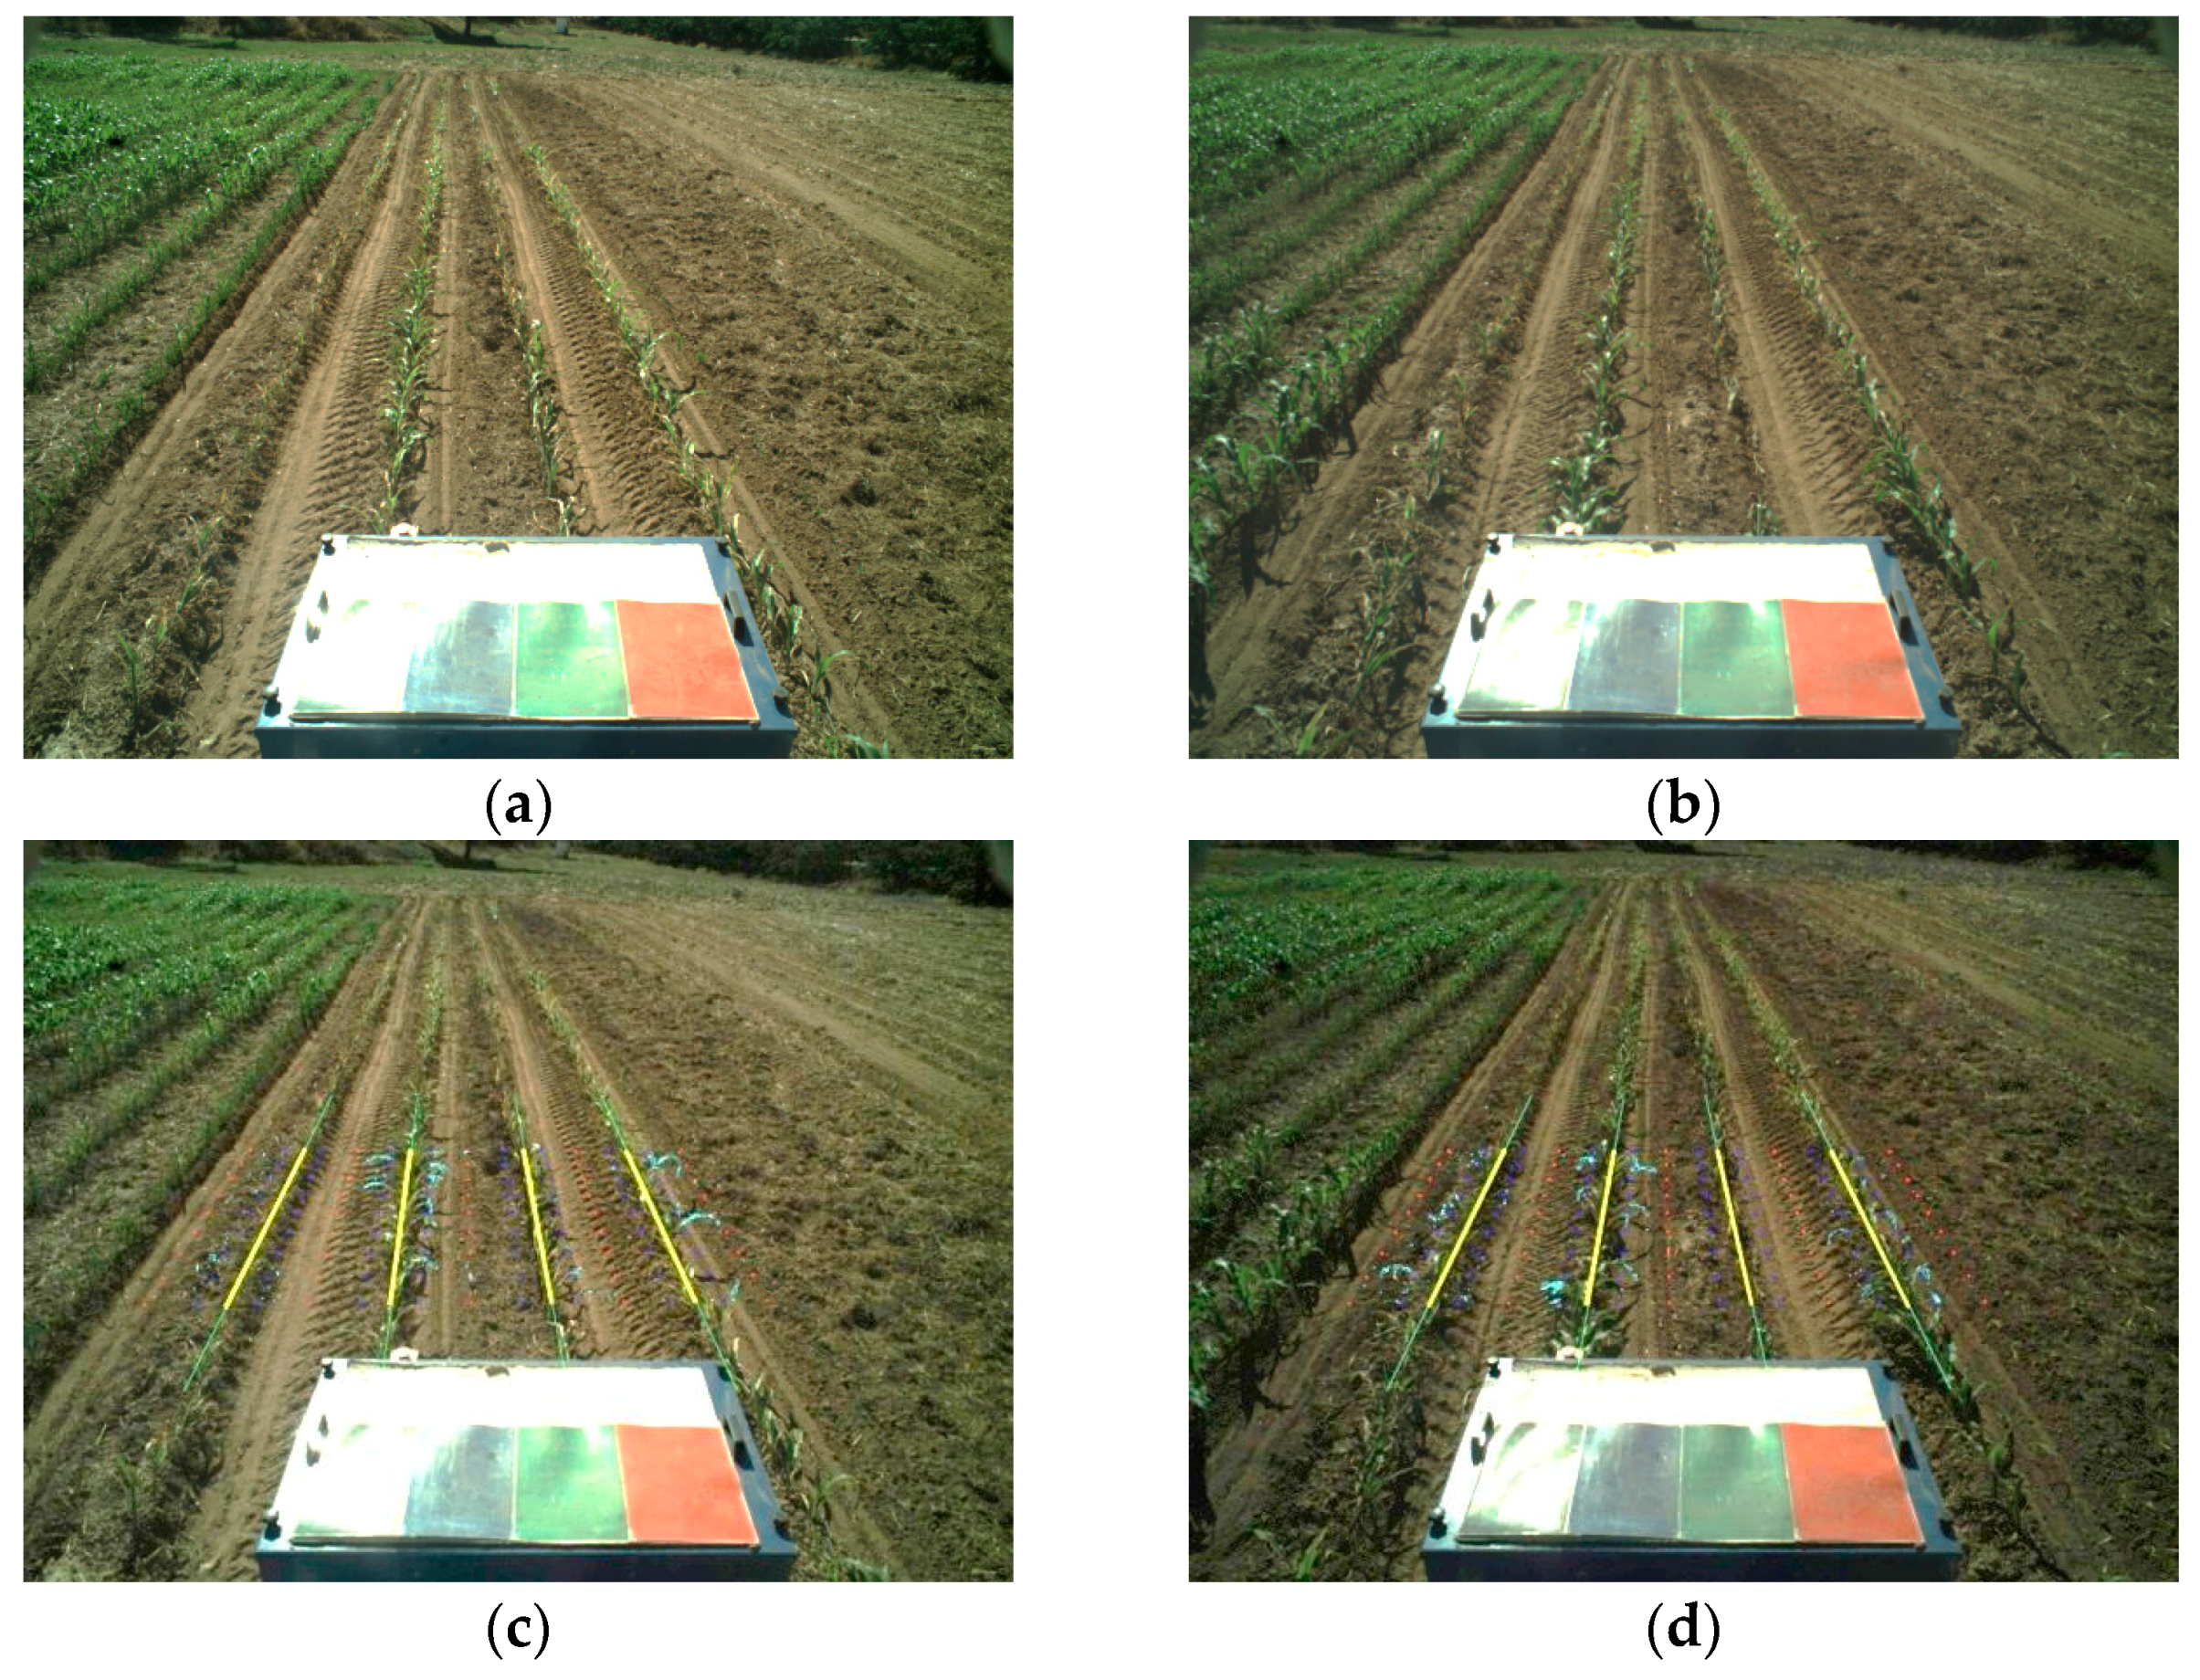
Figure 16a,b display two consecutive images acquired during the execution of a straight trajectory from the line-of-sight with their processed images and crop rows detected in the ROI (weeds are also identified around the crop lines). The tractor in 16a undergoes a slight deviation from the correct trajectory. Indeed, the upper right corner in the box, belonging to the tractor, is very close to the rightmost crop row and that this box is misaligned with respect to the four crop lines detected in the image displayed in 16c. This misalignment is corrected and can be observed in Figure 16b where the box is better centered relative to the central crop rows, Figure 15d. This situation was very common on rough maize fields because they contain abundant irregularities.
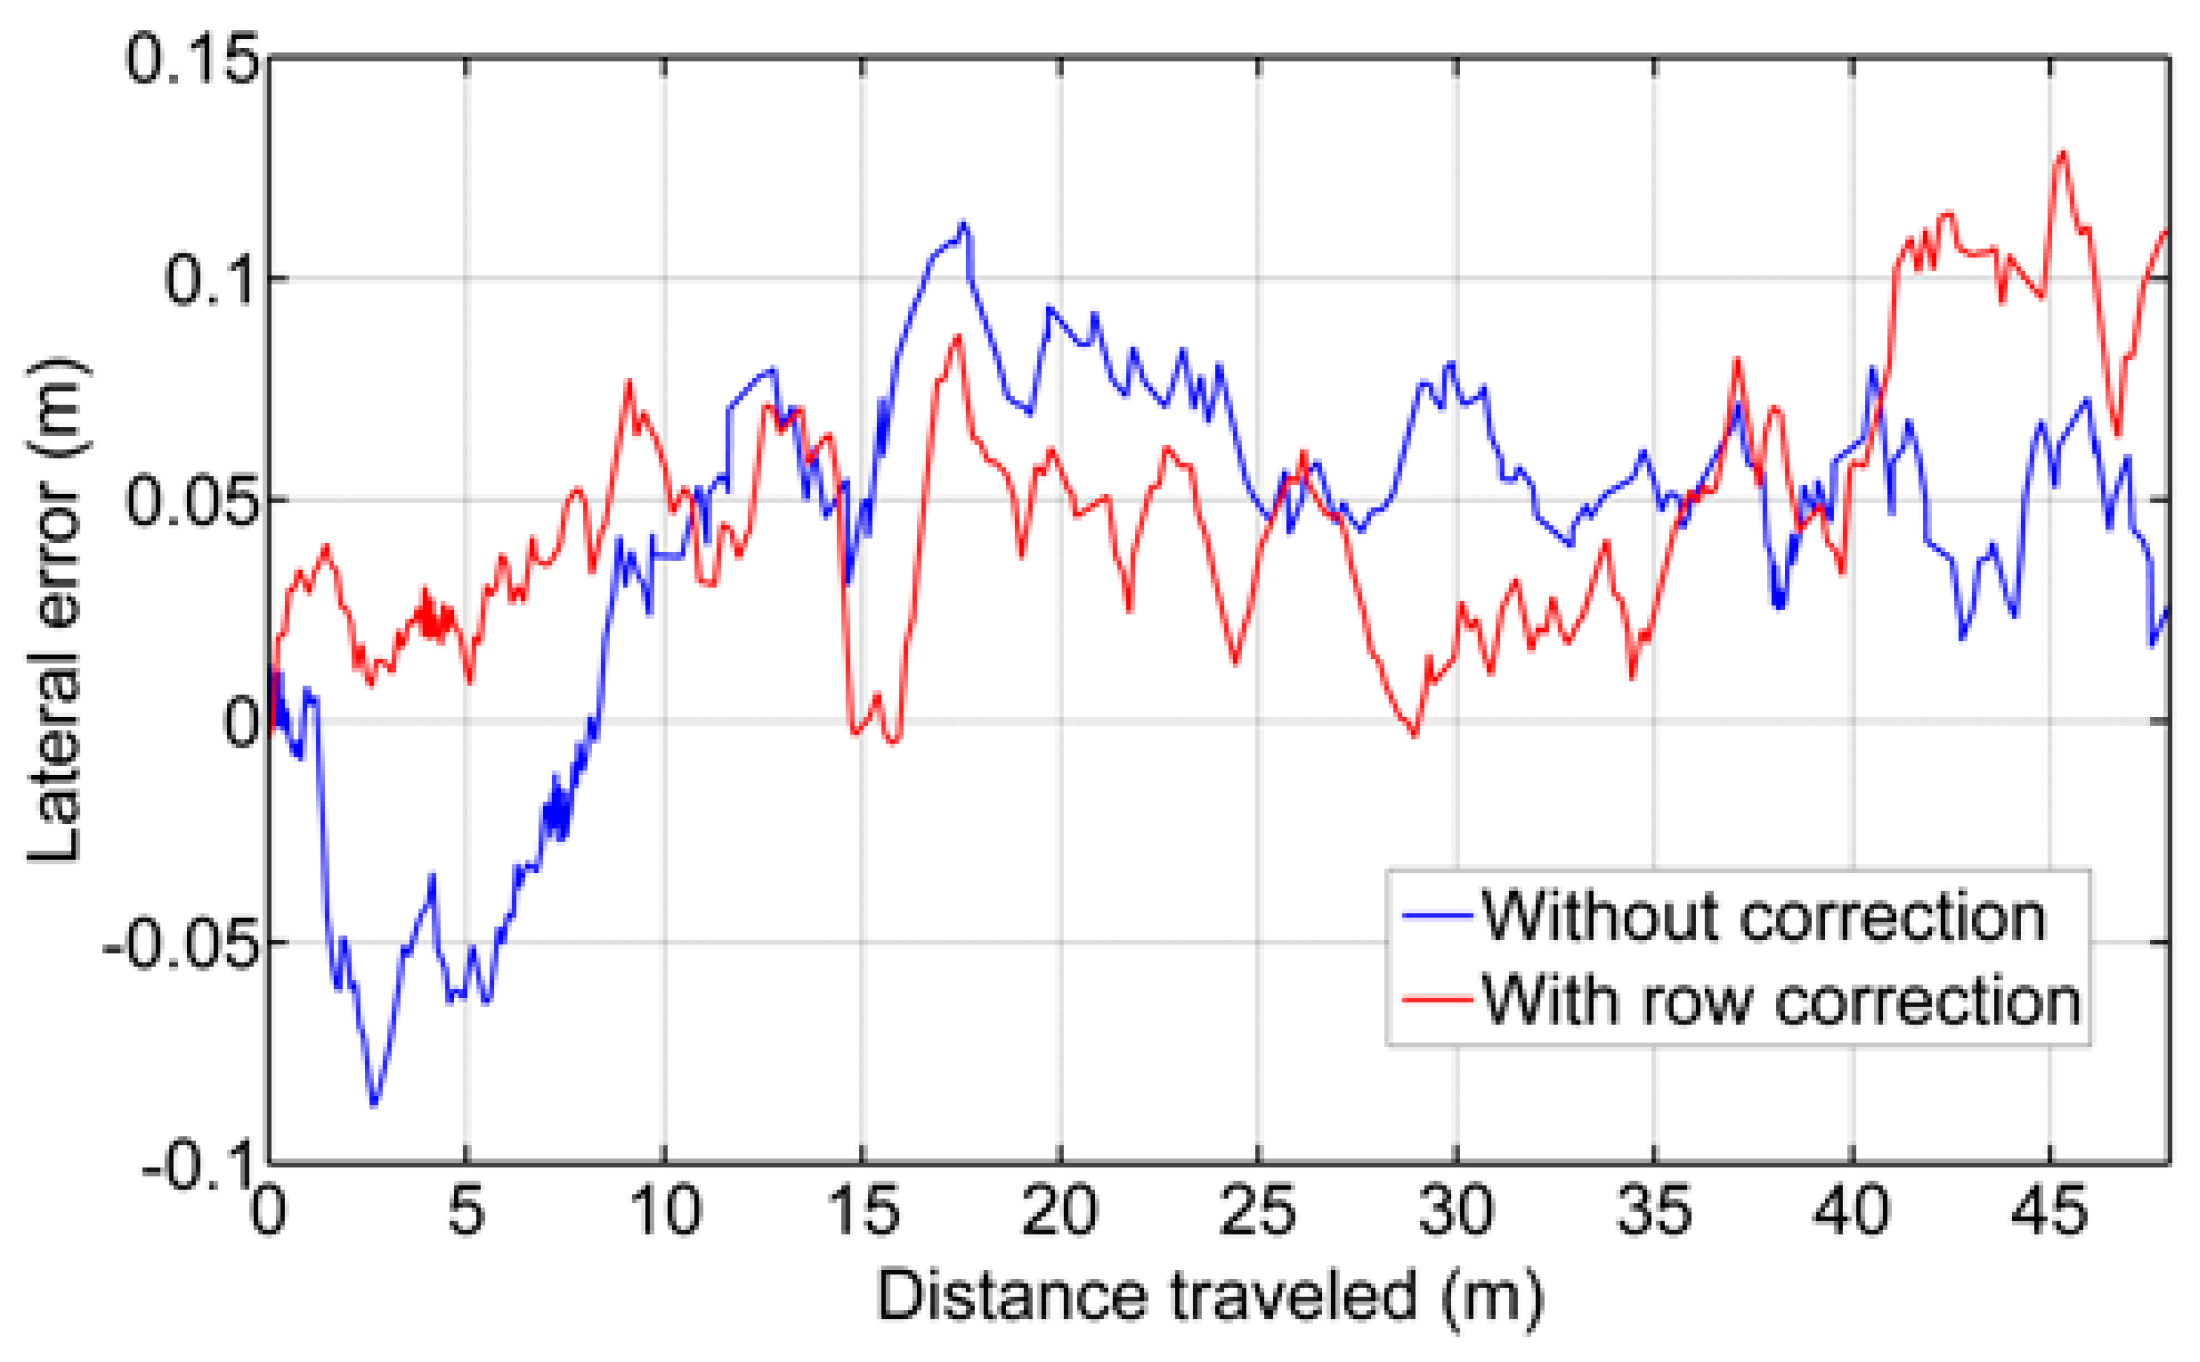
For testing purposes, a set of 400 images were randomly selected. Corrections ordered by the machine vision system were checked. After each correction, the position of the vehicle with respect the crop rows in the next image was verified. A correction has been demanded for 30% of the images (120 images). From these, the tractor was correctly positioned on 89% of the subsequent images. For the remaining images, the correction was erroneously demanded. In these cases, the following path was exclusively based on GPS for guidance. Figure 17 illustrates the comparison between the use of the information provided by the machine vision system and the use of the information provided exclusively by the GPS for crossing the maize field, where it is noteworthy that the row detection system slightly improves the row following, taking into account that the theoretical path to be followed using only the GPS system corresponds to the center of the row by which the two results are compared. It is worth noting that the crop rows at the end of the experimental field were slightly damaged (the last 10 m), due to the large number of tests performed, and in this area, the vision system for row detection produced a large number of errors.

5.5. Security: Obstacle Detection

Spatial and temporal analyses were applied in video sequences in obstacle detection for safety purposes in [25]. The spatial analysis is based on the b* channel in the CIELAB color space where most objects can be distinguished from the main structures (plants and soil). When objects contain high red and/or white components L* and a* channels were used. Texture information for each pixel is also computed, based on differences between maximum and minimum gray level values in a neighborhood environment around the pixel. Binary images were obtained at each step and combined with the logical and binary operation to obtain a final binary image containing potential objects in the environment. The temporal analysis is based on the difference between two consecutive frames where significant differences are obtained where objects appear and a new binary image is computed. The matching of the binary image obtained based on spatial analysis was compared to the one obtained for temporal differentiation. A comparison is established between the two binary images to verify/discard binary matches, which determine the presence of objects. Figure 18 displays illustrative examples with three persons and a vehicle coming from the front containing dangerous situations on the working agricultural scenario. New trends and methods are currently being tested based on deep learning approaches [67] following the ISO/DIS 18497 which is a standard for safety of highly automated agricultural machines, including tractors.

6. Conclusions

Machine vision is a relevant system in agricultural vehicles (autonomous and non-autonomous) for different tasks, including UAVs. An appropriate choice of such systems is an additional guarantee the successful performance of tasks in outdoor environments. In this regard, this paper has addressed the following three main topics for a correct selection in agricultural environments: (a) spectral band for identifying significant elements (plants, soil, objects); (b) imaging sensors and optical systems for mapping the scene onto images with sufficient quality and (c) geometric system pose and arrangement for mapping specific areas. A general overview, with detailed description and technical support, has been provided for each topic with illustrative examples focused on specific applications in agriculture. This represents a set of guidelines with sufficient details and descriptions, so that future engineers have sufficient basis for designing machine vision systems in agricultural applications, which represents a compilation and condensation of scattered ideas in the teeming area of applications in agriculture based on machine vision systems. The way is open for the incorporation of new incoming technologies, particularly 3D systems such as the ones based on Time of Flight (ToF) technologies.
A case study is provided as a result of research in the RHEA project (funded by the European Union) for effective weed control in maize fields (wide-rows crops) where many of the technical issues described in the paper have been applied with successful results.

Acknowledgments

The research leading to these results received funding from the European Union’s Seventh Framework Programme [FP7/2007–2013] under Grant Agreement No. 245986. Part of this work has been carried out by the first author funded by Universidad Politécnica Estatal del Carchi (Ecuador) and the second author funded by the National Council of Science and Technology of Mexico (CONACyT) for the doctoral grant number 210282 to undertake doctoral studies. Authors are grateful to the referees for their suggestions and constructive criticism of the original version of this paper.

Author Contributions

All of the authors contributed extensively to the work presented in this paper. Gonzalo Pajares has coordinated the work and participated on all sections, on his role as main researcher in RHEA on the University Complutense of Madrid. Iván García-Santillán provided specific support for defining contents related to spectral bands, imaging sensors, optical systems specifications and crop rows detection. Yerania Campos was in charge of obstacle detection, including image segmentation. Martín Montalvo, José Miguel Guerrero and Juan Romeo contributed equally in the design and testing of image processing methods for quality improvement, crop rows detection and weeds identification. Luis Emmi was in charge on autonomous guidance and its performance. María Guijarro revised the manuscript and supplied ground-truth images for assessment. Pablo Gonzalez-de-Santos, on his role of European project coordinator in RHEA, revised the results described in the case study and designed the mechanical system for the installation of the machine vision system onboard the vehicle.

Conflicts of Interest

The authors declare no conflict of interest.

Appendix: Camera System Geometry

The point W(X,Y,Z) is expressed in the 3D space with respect to the OXYZ world reference system. The origin o of the image plane is displaced with respect O according to the vector w with coordinates (X0,Y0,Z0). The elementary translations and rotations as described in Section 4 are expressed as follows, including the focal length (f),
( x y z k ) = P R θ R β R α G ( X Y Z 1 )
Figure A1. Reference systems and relations.
Jimaging 02 00034 g019
The elementary matrices involved are defined as follows, where CX ≡ cosX and SX ≡ sinX.
G = ( 1 0 0 X 0 0 1 0 Y 0 0 0 1 Z 0 0 0 0 1 ) P = ( 1 0 0 0 0 1 0 0 0 0 1 0 0 0 1 f 1 ) R α = ( 1 0 0 0 0 C α S α 0 0 S α C α 0 0 0 0 1 ) R β = ( C β 0 S β 0 0 1 0 0 S β 0   C β 0 0 0 0 1 ) R θ = ( C θ S θ 0 0 S θ C θ 0 0 0 0 1 0 0 0 0 1 )
R = R θ R β R α = ( C θ S θ 0 0 S θ C θ 0 0 0 0 1 0 0 0 0 1 ) ( C β 0 S β 0 0 1 0 0 S β 0   C β 0 0 0 0 1 ) ( 1 0 0 0 0 C α S α 0 0 S α C α 0 0 0 0 1 ) = ( C θ C β C θ S α S β + C α S θ C α S β C θ + S θ S α 0 S θ C β S θ S α S β + C α C θ S θ C α S β + C θ S α 0 S β S α C β C α C β 0 0 0 0 1 )
The composition of the elementary rotation matrices derive in a composed rotation matrix as follows,
R G = ( C θ C β C θ S α S β + C α S θ C α S β C θ + S θ S α X 0 C θ C β Y 0 ( C θ S α S β C α S θ ) Z 0 ( C α S β C θ + S θ S α ) S θ C β S θ S α S β + C α C θ S θ C α S β + C θ S α X 0 S θ C β Y 0 ( S θ S α S β C α C θ ) Z 0 ( C α S β S θ + C θ S α ) S β S α C β C α C β X 0 S β Y 0 ( S α C β ) Z 0 ( C α C β ) 0 0 0 1 )
P R G = ( C θ C β C θ S α S β + C α S θ C α S β C θ + S θ S α X 0 C θ C β Y 0 ( C θ S α S β C α S θ ) Z 0 ( C α S β C θ + S θ S α ) S θ C β S θ S α S β + C α C θ S θ C α S β + C θ S α X 0 S θ C β Y 0 ( S θ S α S β C α C θ ) Z 0 ( C α S β S θ + C θ S α ) S β S α C β C α C β X 0 S β Y 0 ( S α C β ) Z 0 ( C α C β ) 1 f ( S β ) 1 f ( S α C β ) 1 f ( C α C β ) 1 f ( X 0 S β Y 0 ( S α C β ) Z 0 ( C α C β ) ) + 1 )
Finally, the projections on the image plane are expressed as,
x = f ( X X 0 ) C θ C β + ( Y Y 0 ) C θ S α S β + C α S θ + ( Z Z 0 ) ( C α S β C θ + S θ S α ) ( X X 0 ) S β + ( Y Y 0 ) ( S α C β ) + ( Z Z 0 ) C α C β f y = f ( X X 0 ) ( S θ C β ) + ( Y Y 0 ) ( S θ S α S β + C α C θ ) + ( Z Z 0 ) ( C α S β S θ + C θ S α ) ( X X 0 ) S β + ( Y Y 0 ) ( S α C β ) + ( Z Z 0 ) C α C β f

References

  1. Slaughter, D.C.; Giles, D.K.; Downey, D. Autonomous robotic weed control systems: A review. Comput. Electron. Agric. 2008, 61, 63–78. [Google Scholar] [CrossRef]
  2. Shalal, N.; Low, T.; McCarthy, C.; Hancock, N. A review of autonomous navigation systems in agricultural environments. In Proceedings of the SEAg 2013: Innovative Agricultural Technologies for a Sustainable Future, Barton, Australia, 22–25 September 2013; Available online: http://eprints.usq.edu.au/24779/ (accessed on 20 July 2015).
  3. Mousazadeh, H. A technical review on navigation systems of agricultural autonomous off-road vehicles. J. Terramech. 2013, 50, 211–23. [Google Scholar] [CrossRef]
  4. López-Granados, F. Weed detection for site-specific weed management: Mapping and real-time approaches. Weed Res. 2011, 51, 1–11. [Google Scholar] [CrossRef]
  5. Romeo, J.; Pajares, G.; Montalvo, M.; Guerrero, J.M.; Guijarro, M.; Ribeiro, A. Crop row detection in maize fields inspired on the human visual perception. Sci. World J. 2012, 2012, 484390. [Google Scholar] [CrossRef] [PubMed]
  6. Romeo, J.; Pajares, G.; Montalvo, M.; Guerrero, J.M.; Guijarro, M.; de la Cruz, J.M. A new expert system for greenness identification in agricultural images. Exp. Syst. Appl. 2013, 40, 2275–2286. [Google Scholar] [CrossRef]
  7. Guerrero, J.M.; Pajares, G.; Montalvo, M.; Romeo, J.; Guijarro, M. Support vector machines for crop/weeds identification in maize fields. Exp. Syst. Appl. 2012, 39, 11149–11155. [Google Scholar] [CrossRef]
  8. Gée, Ch.; Bossu, J.; Jones, G.; Truchetet, F. Crop/weed discrimination in perspective agronomic images. Comput. Electron. Agric. 2008, 60, 49–59. [Google Scholar] [CrossRef]
  9. Zheng, L.; Zhang, J.; Wang, Q. Mean-shift-based color segmentation of images containing green vegetation. Comput. Electron. Agric. 2009, 65, 93–98. [Google Scholar] [CrossRef]
  10. Montalvo, M.; Pajares, G.; Guerrero, J.M.; Romeo, J.; Guijarro, M.; Ribeiro, A.; Ruz, J.J.; de la Cruz, J.M. Automatic detection of crop rows in maize fields with high weeds pressure. Exp. Syst. Appl. 2012, 39, 11889–11897. [Google Scholar] [CrossRef] [Green Version]
  11. Guijarro, M.; Pajares, G.; Riomoros, I.; Herrera, P.J.; Burgos-Artizzu, X.P.; Ribeiro, A. Automatic segmentation of relevant textures in agricultural images. Comput. Electron. Agric. 2011, 75, 75–83. [Google Scholar] [CrossRef] [Green Version]
  12. Burgos-Artizzu, X.P.; Ribeiro, A.; Tellaeche, A.; Pajares, G.; Fernández-Quintanilla, C. Improving weed pressure assessment using digital images from an experience-based reasoning approach. Comput. Electron. Agric. 2009, 65, 176–185. [Google Scholar] [CrossRef]
  13. Sainz-Costa, N.; Ribeiro, A.; Burgos-Artizzu, X.P.; Guijarro, M.; Pajares, G. Mapping wide row crops with video sequences acquired from a tractor moving at treatment speed. Sensors 2011, 11, 7095–7109. [Google Scholar] [CrossRef] [PubMed] [Green Version]
  14. Tellaeche, A.; Burgos-Artizzu, X.P.; Pajares, G.; Ribeiro, A. A new vision-based approach to differential spraying in precision agriculture. Comput. Electron. Agric. 2008, 60, 144–155. [Google Scholar] [CrossRef]
  15. Jones, G.; Gée, Ch.; Truchetet, F. Assessment of an inter-row weed infestation rate on simulated agronomic images. Comput. Electron. Agric. 2009, 67, 43–50. [Google Scholar] [CrossRef]
  16. Tellaeche, A.; Burgos-Artizzu, X.P.; Pajares, G.; Ribeiro, A. A vision-based method for weeds identification through the Bayesian decision theory. Pattern Recognit. 2008, 41, 521–530. [Google Scholar] [CrossRef]
  17. Li, M.; Imou, K.; Wakabayashi, K.; Yokoyama, S. Review of research on agricultural vehicle autonomous guidance. Int. J. Agric. Biol. Eng. 2009, 2, 1–26. [Google Scholar]
  18. Reid, J.F.; Searcy, S.W. Vision-based guidance of an agricultural tractor. IEEE Control. Syst. 1997, 7, 39–43. [Google Scholar] [CrossRef]
  19. Billingsley, J.; Schoenfisch, M. Vision-guidance of agricultural vehicles. Auton. Robots 1995, 2, 65–76. [Google Scholar] [CrossRef]
  20. Rovira-Más, F.; Zhang, Q.; Reid, J.F.; Will, J.D. Machine vision based automated tractor guidance. Int. J. Smart Eng. Syst. Des. 2003, 5, 467–480. [Google Scholar] [CrossRef]
  21. Kise, M.; Zhang, Q. Development of a stereovision sensing system for 3D crop row structure mapping and tractor guidance. Biosyst. Eng. 2008, 101, 191–198. [Google Scholar] [CrossRef]
  22. Xue, J.; Zhang, L.; Grift, T.E. Variable field-of-view machine vision based row guidance of an agricultural robot. Comput. Electron. Agric. 2012, 84, 85–91. [Google Scholar] [CrossRef]
  23. Wei, J.; Rovira-Mas, F.; Reid, J.F.; Han, S. Obstacle detection using stereo vision to enhance safety autonomous machines. Trans. ASABE 2005, 48, 2389–2397. [Google Scholar] [CrossRef]
  24. Nissimov, S.; Goldberger, J.; Alchanatis, V. Obstacle detection in a greenhouse environment using the Kinect sensor. Comput. Electron. Agric. 2015, 113, 104–115. [Google Scholar] [CrossRef]
  25. Campos, Y.; Sossa, H.; Pajares, G. Spatio-temporal analysis for obstacle detection in agricultural videos. Appl. Soft Comput. 2016, 45, 86–97. [Google Scholar] [CrossRef]
  26. Cheein, F.A.; Steiner, G.; Paina, G.P.; Carelli, R. Optimized EIF-SLAM algorithm for precision agriculture mapping based on stems detection. Comput. Electron. Agric. 2011, 78, 195–207. [Google Scholar] [CrossRef]
  27. Pajares, G. Overview and Current Status of Remote Sensing Applications Based on Unmanned Aerial Vehicles (UAVs). Photogramm. Eng. Remote Sens. 2015, 81, 281–329. [Google Scholar] [CrossRef]
  28. RHEA. Robot Fleets for Highly Effective Agriculture and Forestry Management. Available online: http://www.rhea-project.eu/ (accessed on 19 August 2016).
  29. Exelis Visual Information Solutions. Available online: http://www.exelisvis.com/docs/VegetationIndices.html (accessed on 19 August 2016).
  30. Meyer, G.E.; Camargo-Neto, J. Verification of color vegetation indices for automated crop imaging applications. Comput. Electron. Agric. 2008, 63, 282–293. [Google Scholar] [CrossRef]
  31. Point Grey Innovation and Imaging. How to Evaluate Camera Sensitivity. Available online: https://www.ptgrey.com/white-paper/id/10912 (accessed on 19 August 2016).
  32. Scheneider Kreuznach. Tips and Tricks. Available online: http://www.schneiderkreuznach.com/en/photo-imaging/product-field/b-w-fotofilter/products/filtertypes/special-filters/486-uvir-cut/ (accessed on 22 August 2016).
  33. Tucker, C.J. Red and photographic infrared linear combinations for monitoring vegetation. Remote Sens. Environ. 1979, 8, 127–150. [Google Scholar] [CrossRef]
  34. Ollinger, S.V. Sources of variability in canopy reflectance and the convergent properties of plants. New Phytol. 2011, 189, 375–394. [Google Scholar] [CrossRef] [PubMed]
  35. Rabatel, G.; Gorretta, N.; Labbé, S. Getting NDVI Spectral Bands from a Single Standard RGB Digital Camera: A Methodological Approach. In Proceedings of the 14th Conference of the Spanish Association for Artificial Intelligence, CAEPIA 2011, La Laguna, Spain, 7–11 November 2011; Volume 7023, pp. 333–342.
  36. Xenics Infrared Solutions. Bobcat-640-GigE High Resolution Small form Factor InGaAs Camera. Available online: http://www.applied-infrared.com.au/images/pdf/Bobcat-640-GigE_Industrial_LowRes.pdf (accessed on 22 August 2016).
  37. Kiani, S.; Kamgar, S.; Raoufat, M.H. Machine Vision and Soil Trace-based Guidance-Assistance System for Farm Tractors in Soil Preparation Operations. J. Agric. Sci. 2012, 4, 1–5. [Google Scholar] [CrossRef]
  38. Hague, T.; Tillet, N.; Wheeler, H. Automated crop and weed monitoring in widely spaced cereals. Precis. Agric. 2006, 1, 95–113. [Google Scholar] [CrossRef]
  39. JAI 2CCD Cameras. Available online: http://www.jai.com/en/products/ad-080ge (accessed on 22 August 2016).
  40. 3CCD Color cameras. Image acquisition. Resource Mapping. Remote Sensing and GIS for Conservation. Available online: http://www.resourcemappinggis.com/image_technical.html (accessed on 22 August 2016).
  41. Kise, M.; Zhang, Q.; Rovira-Más, F. A Stereovision-based Crop Row Detection Method for Tractor-automated Guidance. Biosyst. Eng. 2005, 90, 357–367. [Google Scholar] [CrossRef]
  42. Rovira-Más, F.; Zhang, Q.; Reid, J.F. Stereo vision three-dimensional terrain maps for precision agriculture. Comput. Electron. Agric. 2008, 60, 133–143. [Google Scholar] [CrossRef]
  43. Svensgaard, J.; Roitsch, T.; Christensen, S. Development of a Mobile Multispectral Imaging Platform for Precise Field Phenotyping. Agronomy 2014, 4, 322–336. [Google Scholar] [CrossRef]
  44. Li, L.; Zhang, Q.; Huang, D. A Review of Imaging Techniques for Plant Phenotyping. Sensors 2014, 14, 20078–20111. [Google Scholar] [CrossRef] [PubMed]
  45. Rasmussen, J.; Ntakos, G.; Nielsen, J.; Svensgaard, J.; Poulsen, R.N.; Christensen, S. Are vegetation indices derived from consumer-grade camerasmounted on UAVs sufficiently reliable for assessing experimentalplots? Eur. J. Agron. 2016, 74, 75–92. [Google Scholar] [CrossRef]
  46. Bockaert, V. Sensor sizes. Digital Photography Review. Available online: http://www.dpreview.com/glossary/camera-system/sensor-sizes (accessed on 22 August 2016).
  47. Emmi, L.; Gonzalez-de-Soto, M.; Pajares, G.; Gonzalez-de-Santos, P. Integrating Sensory/Actuation Systems in Agricultural Vehicles. Sensors 2014, 14, 4014–4049. [Google Scholar] [CrossRef] [PubMed]
  48. Choosing the Right Camera Bus. Available online: http://www.ni.com/white-paper/5386/en/ (accessed on 22 August 2016).
  49. Cambridge in Colour. Available online: http://www.cambridgeincolour.com/tutorials/camera-exposure.htm (accessed on 22 August 2016).
  50. Montalvo, M.; Guerrero, J.M.; Romeo, J.; Guijarro, M.; de la Cruz, J.M.; Pajares, G. Acquisition of Agronomic Images with Sufficient Quality by Automatic Exposure Time Control and Histogram MatchingLecture Notes in Computer Science. In Proceedings of the Advanced Concepts for Intelligent Vision Systems (ACIVS’13), Poznan, Poland, 28–31 October 2013; Volume 8192, pp. 37–48.
  51. Cinegon 1.9/10 Ruggedized Lens. Available online: http://www.schneiderkreuznach.com/fileadmin/user_upload/bu_industrial_solutions/industrieoptik/16mm_Lenses/Compact_Lenses/Cinegon_1.9–10_ruggedized.pdf (accessed on 27 March 2015).
  52. Optical Filters. Edmund Optics. Available online: http://www.edmundoptics.com/technical-resources-center/optics/optical-filters/?&#guide (accessed on 22 August 2016).
  53. Point Grey Innovation and Imaging. Selecting a lens for Your Camera. Available online: https://www.ptgrey.com/KB/10694 (accessed on 22 August 2016).
  54. Jeon, H.Y.; Tian, L.F.; Zhu, H. Robust Crop and Weed Segmentation under Uncontrolled Outdoor Illumination. Sensors 2011, 11, 6270–6283. [Google Scholar] [CrossRef] [PubMed]
  55. Linker, R.; Cohen, O.; Naor, A. Determination of the number of green apples in RGB images recorded in orchard. Comput. Electron. Agric. 2012, 81, 45–57. [Google Scholar] [CrossRef]
  56. Moshou, D.; Bravo, D.; Oberti, R.; West, J.S.; Ramon, H.; Vougioukas, S.; Bochtis, D. Intelligent multi-sensor system for the detection and treatment of fungal diseases in arable crops. Biosyst. Eng. 2011, 108, 311–321. [Google Scholar] [CrossRef]
  57. Oberti, R.; Marchi, M.; Tirelli, P.; Calcante, A.; Iriti, M.; Borghese, A.N. Automatic detection of powdery mildew on grapevine leaves by image analysis: Optimal view-angle range to increase the sensitivity. Comput. Electron. Agric. 2014, 104, 1–8. [Google Scholar] [CrossRef]
  58. Blas, M.R.; Blanke, M. Stereo vision with texture learning for fault-tolerant automatic baling. Comput. Electron. Agric. 2011, 75, 159–168. [Google Scholar] [CrossRef]
  59. Farooque, A.A.; Chang, Y.K.; Zaman, Q.U.; Groulx, D.; Schumann, A.W.; Esau, T.J. Performance evaluation of multiple ground based sensors mounted on a commercial wild blueberry harvester to sense plant height, fruit yield and topographic features in real-time. Comput. Electron. Agric. 2012, 84, 85–91. [Google Scholar] [CrossRef]
  60. Dworak, V.; Huebner, M.; Selbeck, J. Precise navigation of small agricultural robots in sensitive areas with a smart plant camera. J. Imaging 2015, 1, 115–133. [Google Scholar] [CrossRef]
  61. Fu, K.S.; Gonzalez, R.C.; Lee, C.S.G. Robótica: Control, Detección, Visión e Inteligencia; McGraw-Hill: Madrid, Spain, 1988. [Google Scholar]
  62. Herrera, P.J.; Dorado, J.; Ribeiro, A. A Novel Approach for Weed Type Classification Based on Shape Descriptors and a Fuzzy Decision-Making Method. Sensors 2014, 14, 15304–15324. [Google Scholar] [CrossRef] [PubMed]
  63. Li, P.; Lee, S.H.; Hsu, H.Y. Review on fruit harvesting method for potential use of automatic fruit harvesting systems. Procedia Eng. 2011, 23, 351–366. [Google Scholar] [CrossRef]
  64. Nguyen, T.T.; Slaughter, D.C.; Hanson, B.D.; Barber, A.; Freitas, A.; Robles, D.; Whelan, E. Automated mobile system for accurate outdoor tree crop enumeration using an uncalibrated camera. Sensors 2015, 15, 18427–18442. [Google Scholar] [CrossRef] [PubMed]
  65. Vázquez-Arellano, M.; Griepentrog, H.W.; Reiser, D.; Paraforos, D.S. 3-D imaging systems for agricultural applications-a review. Sensors 2016, 16, 618. [Google Scholar] [CrossRef] [PubMed]
  66. Rong, X.; Huanyu, J.; Yibin, Y. Recognition of clustered tomatoes based on binocular stereo vision. Comput. Electron. Agric. 2014, 106, 75–90. [Google Scholar]
  67. Steen, K.A.; Christiansen, P.; Karstoft, H.; Jørgensen, R.N. Using deep learning to challenge safety standard for highly autonomous machines in agriculture. J. Imaging 2016, 2, 6. [Google Scholar] [CrossRef]
  68. Barnard, S.; Fishler, M. Computational stereo. ACM Comput. Surv. 1982, 14, 553–572. [Google Scholar] [CrossRef]
  69. Cochran, S.D.; Medioni, G. 3-D Surface Description from binocular stereo. IEEE Trans. Pattern Anal. Mach. Intell. 1992, 14, 981–994. [Google Scholar] [CrossRef]
  70. Pajares, G.; de la Cruz, J.M. On combining support vector machines and simulated annealing in stereovision matching. IEEE Trans. Syst. Man Cybern. Part B 2004, 34, 1646–1657. [Google Scholar] [CrossRef]
  71. Correal, R.; Pajares, G.; Ruz, J.J. Automatic expert system for 3D terrain reconstruction based on stereo vision and histogram matching. Expert Syst. Appl. 2014, 41, 2043–2051. [Google Scholar] [CrossRef]
  72. Rovira-Más, F.; Wang, Q.; Zhang, Q. Design parameters for adjusting the visual field of binocular stereo cameras. Biosyst. Eng. 2010, 105, 59–70. [Google Scholar]
  73. Pajares, G.; de la Cruz, J.M. Visión por Computador: Imágenes Digitales y Aplicacione; RA-MA: Madrid, Spain, 2007. (In Spanish) [Google Scholar]
  74. MicroStrain Sensing Systems. Available online: http://www.microstrain.com/inertial/3dm-gx3–35 (accessed on 22 August 2016).
  75. SVS-VISTEK. Available online: https://www.svs-vistek.com/en/svcam-cameras/svs-svcam-search-result.php (accessed on 22 August 2016).
  76. National Instruments. CompactRIO. Available online: http://sine.ni.com/nips/cds/view/p/lang/es/nid/210001 (accessed on 22 August 2016).
  77. National Instruments. LabView. Available online: http://www.ni.com/labview/esa/ (accessed on 22 August 2016).
  78. Cyberbotics. Webots Robot Simulator. Available online: https://www.cyberbotics.com/ (accessed on 24 August 2016).
  79. Gazebo. Available online: http://gazebosim.org/ (accessed on 24 August 2016).
  80. Guerrero, J.M.; Guijarro, M.; Montalvo, M.; Romeo, J.; Emmi, L.; Ribeiro, A.; Pajares, G. Automatic expert system based on images for accuracy crop row detection in maize fields. Exp. Syst. Appl. 2013, 40, 656–664. [Google Scholar] [CrossRef]
  81. Gonzalez-de-Santos, P.; Ribeiro, A.; Fernandez-Quintanilla, C.; López-Granados, F.; Brandstoetter, M.; Tomic, S.; Pedrazzi, S.; Peruzzi, A.; Pajares, G.; Kaplanis, G.; et al. Fleets of robots for environmentally-safe pest control in agriculture. Precis. Agric. 2016, 1–41. [Google Scholar] [CrossRef]
  82. Conesa-Muñoz, J.; Pajares, G.; Ribeiro, A. Mix-opt: A new route operator for optimal coverage path planning for a fleet in an agricultural environment. Exp. Syst. Appl. 2016, 54, 364–378. [Google Scholar] [CrossRef]
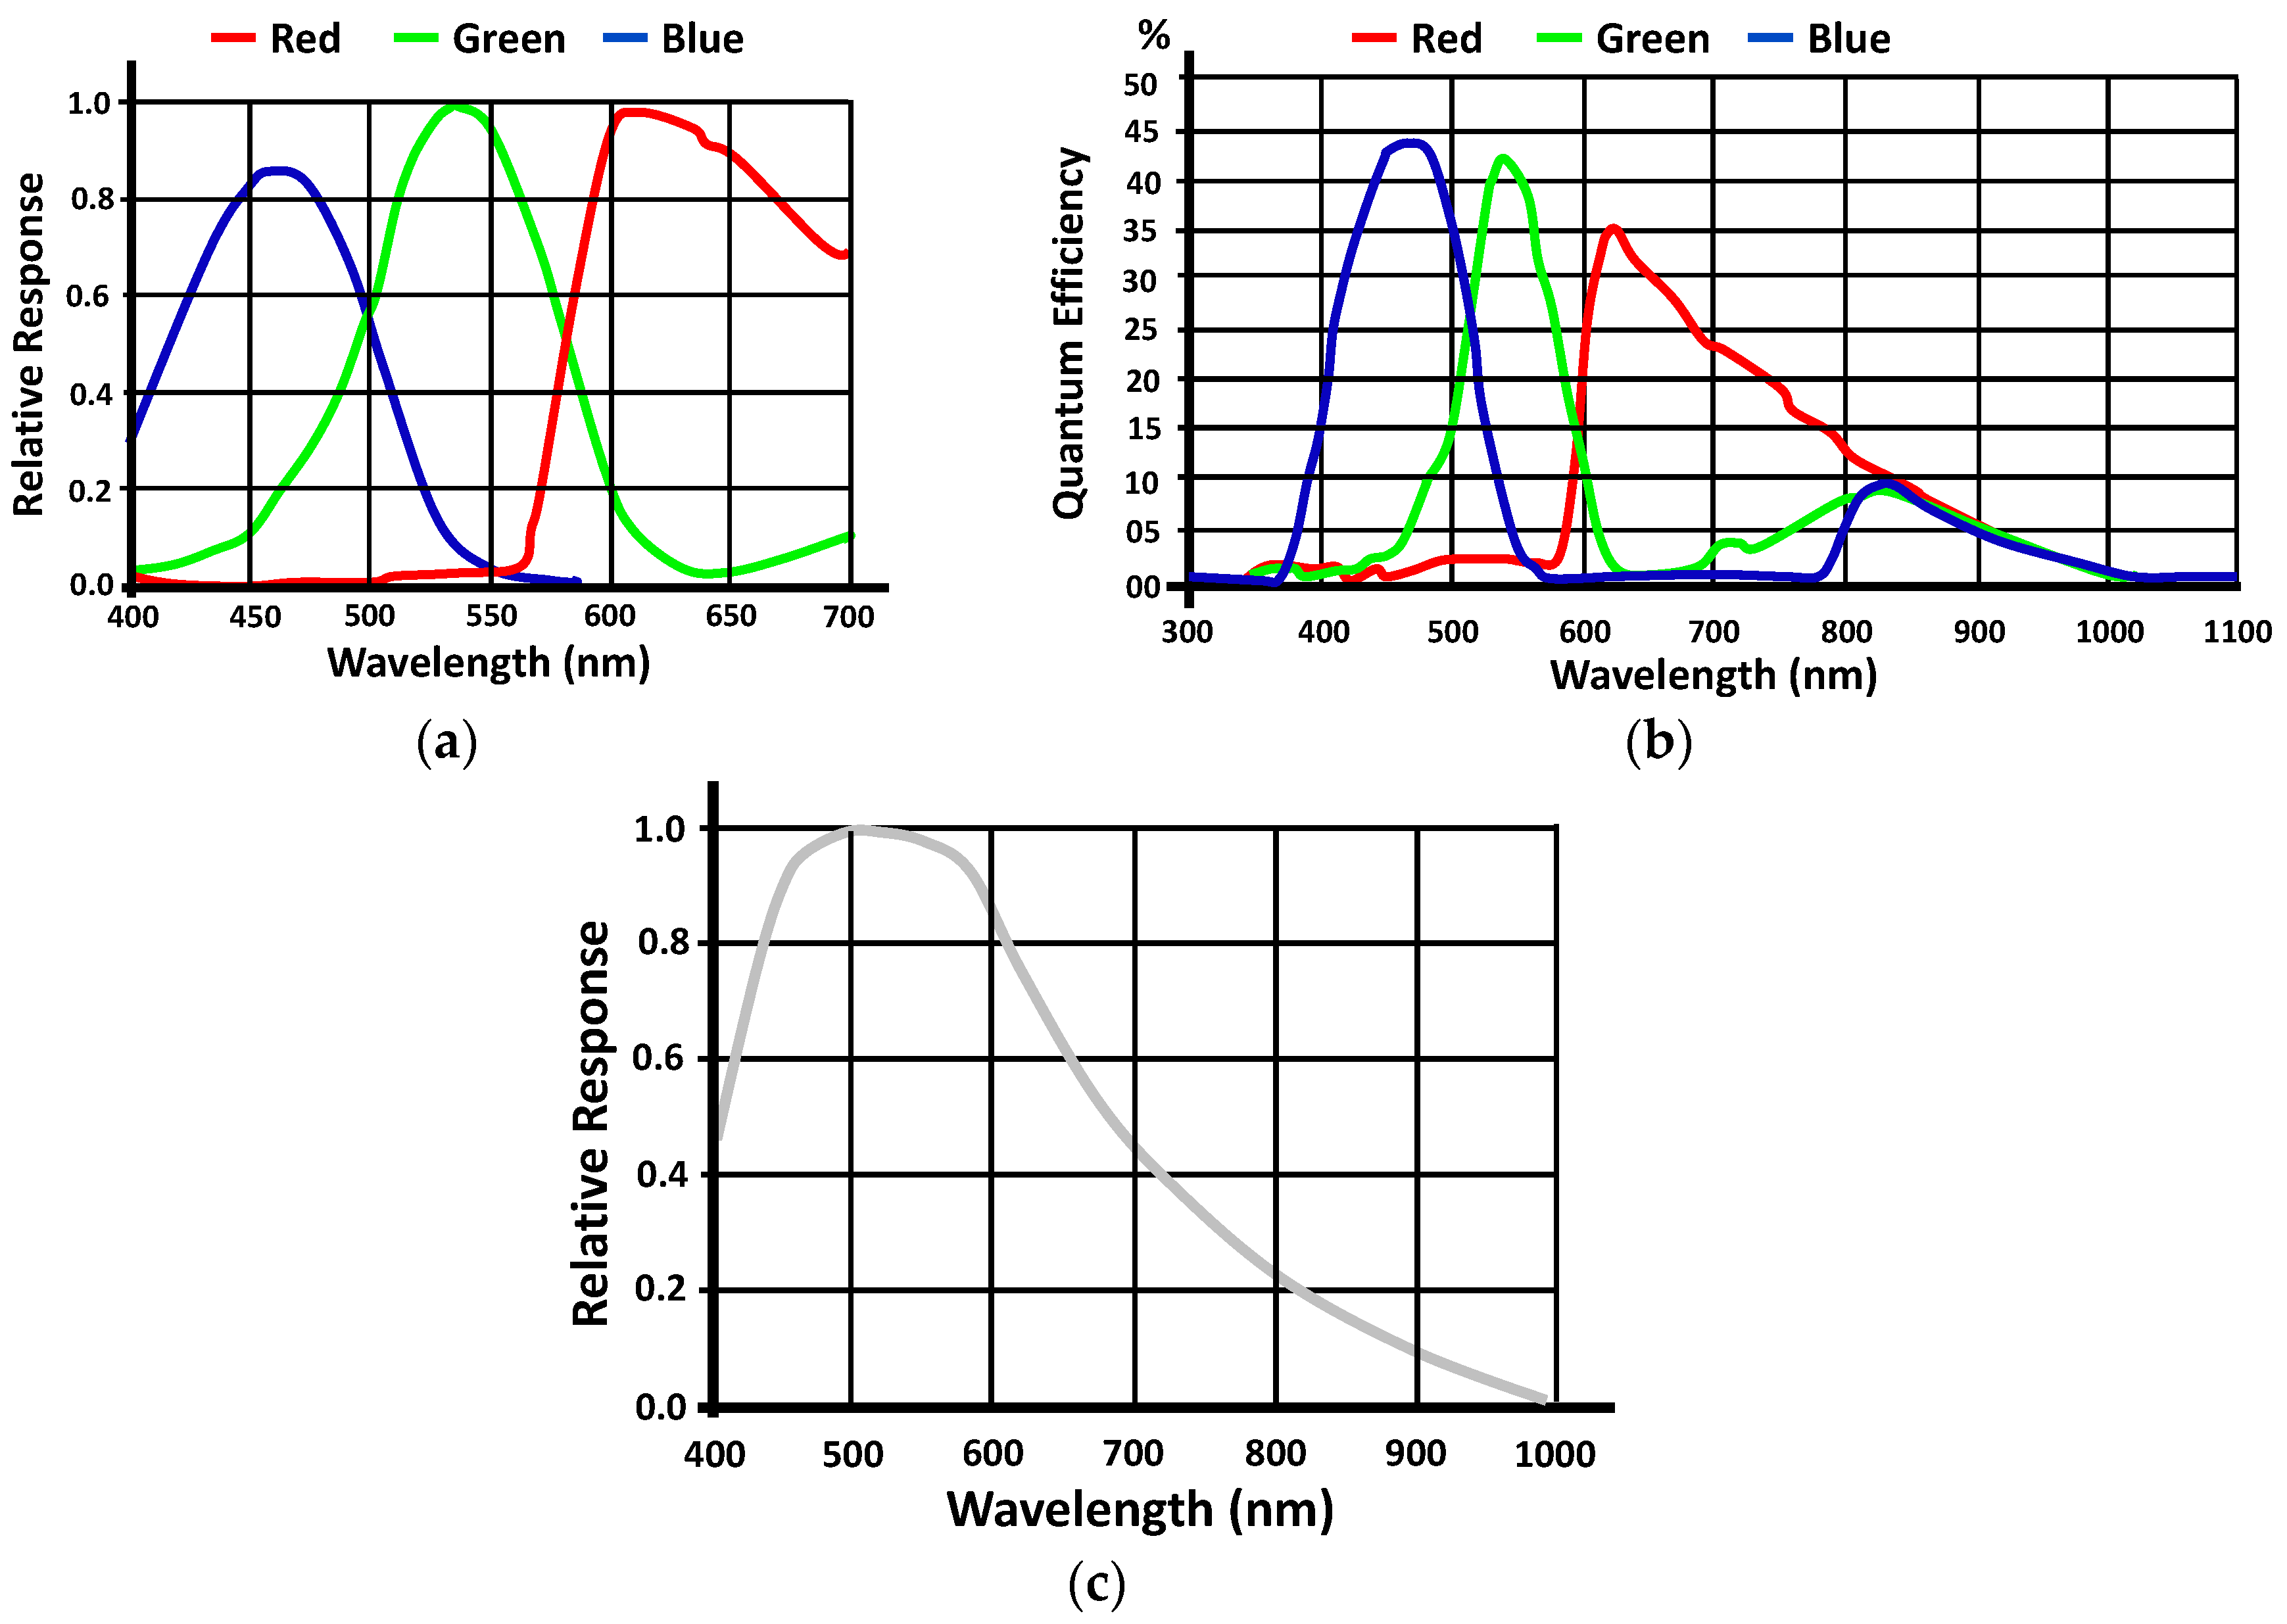
Figure 1. Generic spectral responses: (a) Relative Response (RR) for a RGB sensor; (b) Quantum Efficiency (QE) for a RGB sensor; (c) RR for a monochrome sensor.
Jimaging 02 00034 g001
Figure 2. Effect of the UV/IR cutting filtering: (a) without filter; (b) with filter.
Jimaging 02 00034 g002
Figure 3. Vignetting: (a) effect with emphasis on the external parts; (b) correction mask; (c) corrected image.
Jimaging 02 00034 g003
Figure 4. White balance: (a) original image; (b) corrected image.
Jimaging 02 00034 g004
Figure 5. (a) Typical spectral reflectance profiles for crops and soil roughly drawn from the information provided in [34]; (b) Relative response from two generic sensors covering Near-Infrared (NIR) and Short-Wave infrared (SWIR) spectral ranges.
Jimaging 02 00034 g005
Figure 6. Imaging distortion caused by a sensor of type 2/3″ and a lens of 1/2″.
Jimaging 02 00034 g006
Figure 7. Lens aperture according to the f-number: (a) minimum with 16; (b) maximum with 1.9.
Jimaging 02 00034 g007
Figure 8. Optical system setup.
Jimaging 02 00034 g008
Figure 9. Stereovision system geometry with parallel optical axes (images from [73]): (a) mapping of 3D point P(X,Y,Z) onto image planes; (b) geometric parameters on similar triangles.
Jimaging 02 00034 g009
Figure 10. Precision in stereovision systems (images from [73]): (a) geometric setting and parameters defined by the CCD; (b) geometric relations on triangles from the 3D mapping.
Jimaging 02 00034 g010
Figure 11. Machine vision system: (a) onboard the autonomous vehicle; (b) camera and optical systems and other elements in a housing system. Images adapted and taken from [47] respectively.
Jimaging 02 00034 g011
Figure 12. Camera system geometry. Image from [47].
Jimaging 02 00034 g012
Figure 13. Charge Coupled Device (CCD) sensor, lens and UV/IR cut filter: (a) assembled; (b) separated.
Jimaging 02 00034 g013
Figure 14. Geometric imaging projections of a Region Of Interest (ROI) for the SVS4050CFLGEA sensor with two different settings at (X0,Y0,Z0) ≡ (0,2,0) m: (a) with (α,β,θ) ≡ (20°,0°,0°); (b) with (α,β,θ) ≡ (20°,0°,+5°).
Jimaging 02 00034 g014
Figure 15. Consecutive images along a sub-path with the detected crop lines (yellow); parallel lines to the left and right crop lines (red); horizontal lines covering 0.25 m in the field. Images taken from [47].
Jimaging 02 00034 g015
Figure 16. Alignment of the vehicle along the crop rows. Images adapted and taken from [47]: (a) original image with deviation; (b) original image after correction; (c) misalignment of the tractor with respect the crop rows; (d) misalignment corrected.
Jimaging 02 00034 g016
Figure 17. Comparison of the vehicle guidance in a maize field, represented as the lateral error of the rear axle with respect to the theoretical center of the rows. Image from [47].
Jimaging 02 00034 g017
Figure 18. Peoples and a vehicle identified as obstacles in the working environment.
Jimaging 02 00034 g018aJimaging 02 00034 g018b
Table 1. Spectrum (S) and wavelengths λ (nm).
Sλ (nm)Sλ (nm)Sλ (nm)Sλ (nm)
UV1–380Visible380–780Blue450–500IRNear760–1400
Green500–600Short-Wave (SWIR)1400–3000
Mid-Wave (MWIR)3000–8000
Red600–760Long-Wave (LWIR)8000–15,000
Table 2. Vegetation indices values for RR and QE for a wavelength of 560 nm.
Vegetation IndicesRR for 560 nm, Figure 1a r = 0.20; g = 0.80; b = 0.01QE for 560 nm, Figure 1b r = 0.02; g = 0.35; b = 0.03
GRVI = (g r)/(g + r)0.600.89
ExG = 2 g r b1.390.65
ExR = 1.4 r – g−0.52−0.32
ExGR = ExG − ExR1.910.97
CIVE = 0.441r − 0.811 g + 0.385b + 18.7874518.2318.52
VEG = gr−ab(a−1) with a = 0.667 which was defined in [38]10.8515.29
Table 3. Imaged areas in pixels for a patch of 20 × 20 cm2 at different distances form the origin in the coordinates of the world system, α angles and focal lengths.
Distances from O (m)α°f (mm)Area (pixels)Distances from O (m)α°f (mm)Area (Pixels)
3153.57565 3.5212
8.039018.01070
10.0613610.01675
12.0884012.02415
203.5710 3.5188
8.036458.01007
10.0568410.01596
12.0829612.02320
4153.53716 3.5120
8.019008.0637
10.0293410.01026
12.0431212.01428
203.5342 3.5110
8.018068.0620
10.0281810.0998
12.0412812.01388
Table 4. Percentage of success for crop lines detection for three (low, medium, high) maize growth stages.
Crop Lines Detection
Maize growth stageLowMediumHigh
% of success959390
Table 5. Percentage of success for weeds detection for three (low, medium, high) maize growth stages.
Maize Growth Stage
Weed densitiesLowMediumHigh
% of success929088