Abstract
This work represents an overview of some of the applications of infrared thermography that have been carried out at the University of Naples Federico II over the years. The focus is on four topics: thermo-fluid-dynamics, materials inspection, cultural heritage and preventative maintenance. For each topic, some results are presented as thermal, and/or phase, images with the attention being essentially devoted to the capacity of these images to communicate information. For more details on test apparatuses, procedures and data analyses, the reader is referred to the previous published work, available in the literature.
1. Introduction
Researchers at the University of Naples Federico II have been actively involved in the use of infrared thermography (IRT) since the early 1970s. Considering that the first commercial infrared system, named AGA Thermovision, was released to the market around 1965 [1], speaking about the experience of this group would also mean retracing some of the key stages of the development of infrared thermography.
Indeed, the first infrared system used at the University of Naples was the AGA Thermovision 680, followed by AGA Thermovision 782, Agema 880 LW, Agema 900 LW, SC3000 LW, Cedip Jade MW, SC6000 LW, X6540sc MW, SC6800 MW, as well many handheld models like the B4, B50, B360, P640, T440, and T650sc by Flir systems. These infrared systems were used in many different applications, from thermo-fluid-dynamics to materials inspection, cultural heritage and preventative maintenance. Through the description of some of the obtained results, the steps taken by the research group into the infrared thermography world are examined; at the same time, the capability of infrared thermography to deal with different types of problems, as well as gather information for problem solving, are also shown.
The described applications are too numerous to be completely illustrated. Then, we prefer to provide the imaging community with some of the images collected during the years working with infrared thermography. Our desire is to avoid burdening readers with technical details and, on the contrary, spark their interest to go beyond the colors to understand the hidden messages. Of course, readers interested in a specific application will find the description lacking in details about test setup, testing procedure and testing parameters as well, but they can find all the necessary details in the several related references.
2. Thermo-Fluid-Dynamics Applications
The value of IR thermography to measure convective heat transfer coefficients involved with a broad variety of thermo-fluid-dynamics configurations, which may be also complex, is well established. Indeed, since the early introduction of a commercial infrared device in the mid sixties, infrared thermography soon became especially attractive to engineers struggling with boundary layer flows. The historical steps in the introduction of IRT in thermo-fluid-dynamics were traced by Meola and Carlomagno [2], while a comprehensive list of applications—including both natural and forced convection, turbine cooling (including film cooling), transition to turbulence and flow separation, micro systems, rotating bodies, impinging jets, flow instability, and two-phase and hypersonic flows—performed within the last two decades may be found in Carlomagno and Cardone [3]. In this work, some leading applications are presented and reviewed with the main aim of showing how the acquired thermographic images are able to rapidly communicate relevant aspects. A much wider essay can be found in the book of Astarita and Carlomagno [4].
2.1. Impinging Jets
Going back to 1986, we find the thermal image obtained at Federico II and reported in Figure 1 which represents the temperature distribution entailed by a jet impinging on a flat plate. This seems to be the first thermal image of an impinging jet.
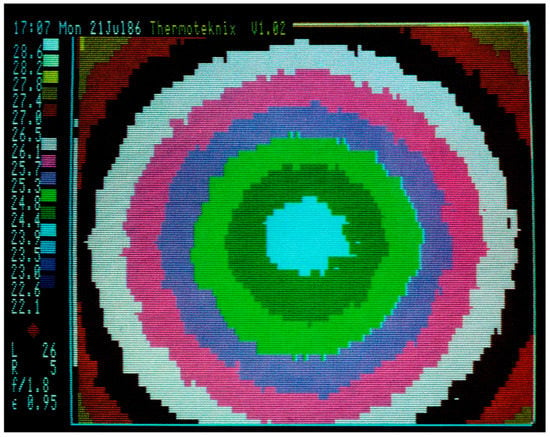
Figure 1.
Thermal image of a jet, of Reynolds number Re = 28,000, impinging at a distance z = 6 times the nozzle diameter d.
The investigation with impinging jets went on for many years and is still active [5]. In fact, the subject is of great interest to both academic and industrial communities as impinging jets are widely used in industrial applications for cooling, heating, and drying purposes. In particular, they are used to dissipate heat generated by microelectronic circuits, to achieve high heat transfer coefficients over the leading edge of turbine blades, to heat zones critical for the formation of ice over aircraft, to dry textiles, to temper glass, etc. Indeed, the subject presents critical aspects which are difficult to completely understand, since every application involves a different flow configuration. Amongst others are the flow pattern after impingement [6,7], the crossflow of spent air [8,9,10,11], entrainment effects [12], unsteady effects [13,14,15], influence of nozzle geometry [15], influence of shear layer dynamics [16], and behavior of a jet when working alone or within an array [17]. Most applications generally require the geometry of nozzles, as well as their number and spacing to be optimized in order to maximize the cooling/heating efficiency for a given power required to drive fans or blowers. All these aspects can be advantageously investigated with infrared thermography; this is possible by exploiting the most suitable heat flux sensor methodology amongst those described by Carlomagno and de Luca [18] and Carlomagno et al. [19]. Specifically, the heat flux sensors mainly used with IR thermography are heated thin foil, thin film and wall calorimeter (also called thin skin) [3,4,18].
Meola et al. [15], through measurements of adiabatic wall temperature Taw taken with the Agema 880 system, succeeded in visualizing the instability phenomena which develop for high Mach number values and are driven by the impingement distance. In particular, for z/d < 6, as M increases, the vortex ring, which is located in the shear layer at ≈1.2 d in the radial direction, strengthens up to its highest magnitude (M ≈ 0.7) and breaks up (Widnall instability); this entails entrainment of warmer ambient air and gives rise to the formation of structures so that the jet completely loses its axisymmetric nature. Snapshots of the Taw map for a single impinging jet of d = 5 mm, z/d = 4 and increasing Mach number are shown in Figure 2. For M = 0.3 (Figure 2a), the minimum Taw at 1.2 d has the shape of a completely developed and stable annulus. This annulus, which is the location of the vortex ring, for M = 0.4 is transformed into an unstable semicircle. In reality, the entire region outside the potential core is affected by unstable mixing phenomena. As the Mach number increases, the vortex ring reinforces and, for M = 0.67 (Figure 2b), breaks up in the impact with the plate, entraining warmer ambient air and giving rise to secondary minima at about 0.9 d and 2.2 d, with a maximum between them at about 1.6 d. As M further increases, such structures strengthen up and reach their highest magnitude for M = 0.85 (Figure 2c). To a further increase of M, these structures break up into numerous smaller ones, which tend to coalesce giving rise to a transient alternate circumferential movement (Figure 2d).
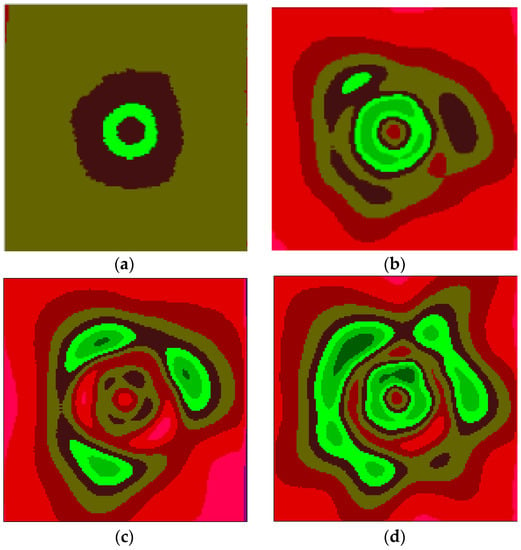
Figure 2.
Taw maps for d = 5 mm, z/d = 4 and for increasing Mach number. (a) M = 0.3; (b) M = 0.67; (c) M = 0.85; (d) M = 0.91.
A typical Tw map for an array of 5 × 5 round nozzles of d = 7.5 mm, taken with the Agema Thermovision 900, for z/d = 4 and flow rate = 9 kg/s m2 [20] is shown in Figure 3, together with a relief map of the heat transfer coefficient h. The h coefficient was evaluated with the heated thin foil technique [3] and by accounting for losses due to radiation and to lateral conduction.
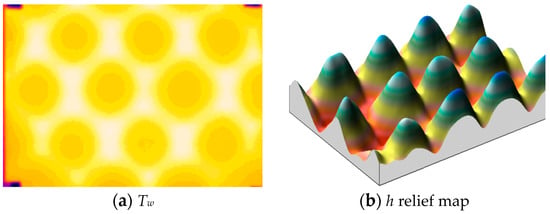
Figure 3.
Array of jets; d = 7.5 mm, z/d = 4, : (a) wall temperature; (b) heat transfer coefficient.
2.2. Hot Water Release
The discharge of hot water rejected by plant cooling systems into coastal areas represents an environmental problem because of the induced temperature changes with relevant modifications in the receiver waterbody. Besides, it represents a problem of thermal diffusion at the interface of two or more fluids, air–liquid or liquid–liquid, which is of academic and practical interest. Results herein presented refer to tests, which were carried out in an experimental laboratory facility (basin) [21] by considering jet discharge into either a stagnant or wavy environment. The surface water temperature was monitored by the Agema Thermovision 880 LW by acquiring sequences of images in steady-state or transient conditions; each image was averaged over 64 frames to reduce the instrument noise. The camera was positioned over a mobile platform and inclined of an angle of 20° to view a trapezoidal area; the distortion introduced by the camera setting was eliminated during image post-processing.
Some thermal images, taken at different time instants, for a flow rate Q = 10 ℓ/s jet discharging inside a stagnant environment are shown in Figure 4, so it is possible to follow the evolution of the hot jet diffusion in the basin up to its steady state.
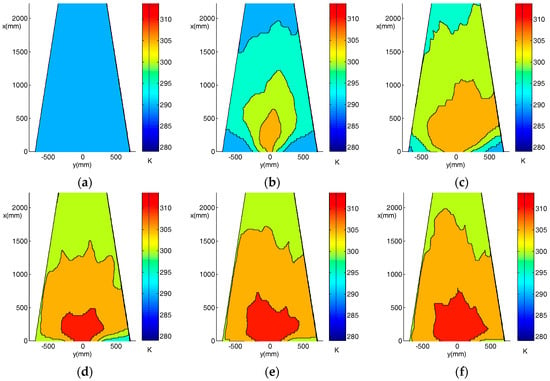
Figure 4.
Thermal images for discharge inside a stagnant environment. (a) t = 0 s; (b) t = 20 s; (c) t = 40 s; (d) t = 60 s; (e) t = 80 s; (f) t = 100 s.
Data can be reduced in dimensionless form in terms of with and , being Ts the generic surface temperature, Tm its maximum value (on the jet axis) and Ta the ambient temperature of water. Three maps, for flow rate Q = 10 ℓ/s at steady state, for wavy environment with height H = 4, 6 and 11 cm are shown in Figure 5b,c, respectively. As can be seen, the wave motion contrasts with the jet flow and flattens it towards the shoreline.
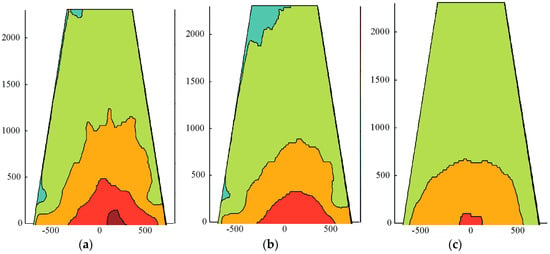
Figure 5.
for discharge inside a wavy environment with varying the wave height H. (a) H = 4 cm; (b) H = 6 cm; (c) H = 11 cm.
In this type of application, the use of infrared thermography is particularly advantageous because overcomes the problem of ambient water temperature rising in the basin encountered by previous researchers who used conventional (thermocouple or RTD) probes. Another important feature lies in the possibility of also performing quantitative measurements in the presence of opposing waves, which are troublesome to carry out with intrusive contact probes.
2.3. Flow Instability on a Rotating Disk
The line scan facility of the Agema 900 thermographic system is exploited by Astarita et al. [22] to detect the spiral vortices, attached to the disk surface, which occur in the transitional regime of a simply rotating disk and cause small azimuthal variations of the convective heat transfer coefficient In this case, the thermographic system scans a horizontal line that is fixed in space along one disk radius. Because of the disk rotation, each acquired line is displaced, relative to the disk surface, by an angle that is a function of the rotational speed and of the line acquisition frequency. With the aim of reducing noise, a large number of radial profiles (about 15,000) is acquired during each test by precisely monitoring the acquisition time, so that every point of the reconstructed image is, in reality, an average in time of the measured temperature values over the disk surface.
The reconstructed thermogram of Figure 6 shows a temperature map of the disk rotating with its periphery in the transitional regime, i.e., for a Reynolds number based on disk radius equal to ≅300,000, and the footprint of the vortices is clearly visible, there. The disk is rotating in the clockwise direction and its diameter coincides with the side of the surrounding black square. Temperature differences are very small so as not to influence the fluid dynamic instability phenomenon with a high heat transfer rate. The obtained temperature maps are used by the authors to quantitatively measure the number of vortices and the angle of the spirals, which both substantially agree with literature data acquired with other techniques.
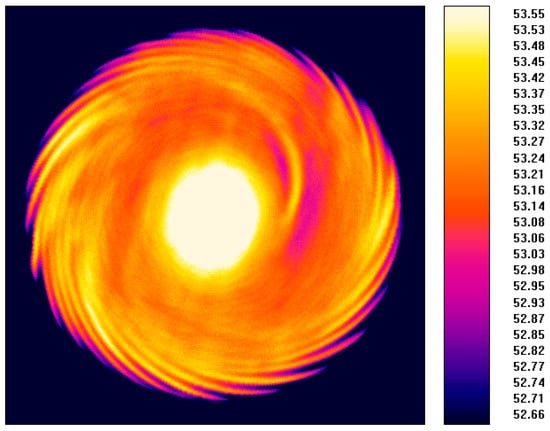
Figure 6.
Reconstructed thermogram of spiral vortices on a rotating disk for Re = 300,000.
3. Materials Inspection
3.1. Non-Destructive Testing
“The present research was focused on the study of unsteady surface temperature fields to obtain information about the internal physical structure of a thermally loaded system, by discriminating among surface temperature differences and their time evolution; in other words, the idea was to adopt the time variable in the place of the depth variable (i.e., the coordinate normal to the observed surface) to recover knowledge about the ‘inside’ of the system.”
This sentence is an excerpt from a work [23] by two researchers of the University of Naples and represents a milestone in the development of lock-in thermography. Indeed, the concept of lock-in thermography (LT) was first introduced by Carlomagno and Berardi [23] and later further investigated by other researchers throughout the world [24,25,26,27,28,29,30,31] and transformed into a practical technique.
Lock-in thermography has been widely used at Federico II to assess its capabilities and/or limitations [32,33,34,35,36,37,38,39,40,41]; some phase images are reported in the following. On the whole, it has been found that LT is capable of detecting many of the manufacturing defects in composite materials, like fiber misalignment (Figure 7) [42], slag inclusions (dark zones in Figure 8), non-uniform distribution of matrix and fibers (slight variations of color in Figure 8) [32], and distribution of carbon nanotubes in an epoxy resin matrix (Figure 9) [41]. LT can also be used to control if drilling has caused delamination around holes (Figure 10) [32] and to discover buried impact damage in composites [43], as well to gain more information on the damage caused by an impact on a Glare panel (Figure 11). In particular, the amusing phase image (Figure 11b), obtained with a close-up view lens, supplies information on delamination at the interface aluminum-glass/epoxy layers and on the deformation of the aluminum layers.
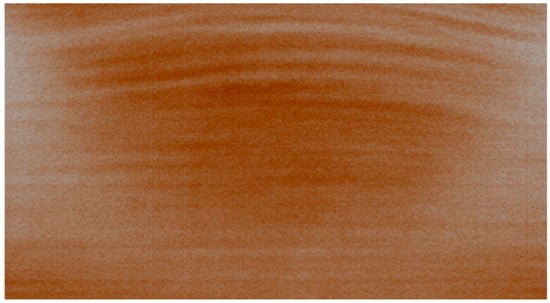
Figure 7.
Fibers misalignment in a carbon/epoxy laminate; phase image taken with SC6000 camera.
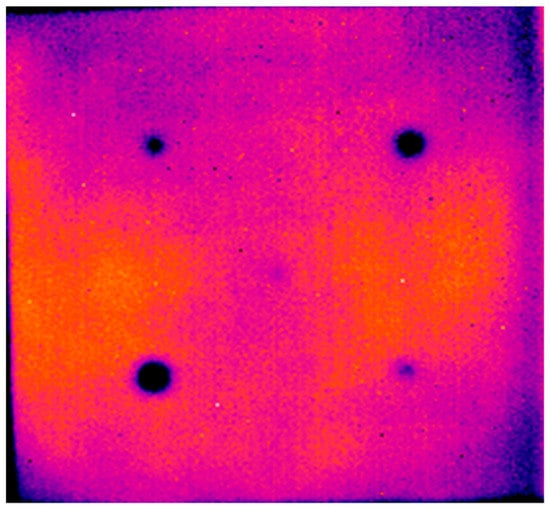
Figure 8.
Slag inclusions and non-uniform distribution of resin in a glass/epoxy laminate; phase image taken with SC3000 camera.
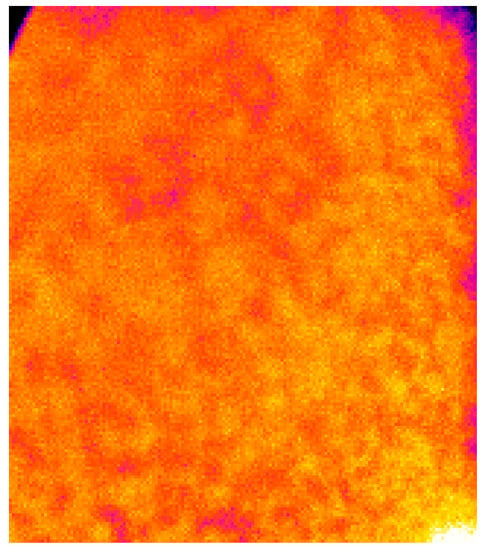
Figure 9.
Distribution of carbon nanotubes in epoxy resin; phase image taken with SC3000 camera.
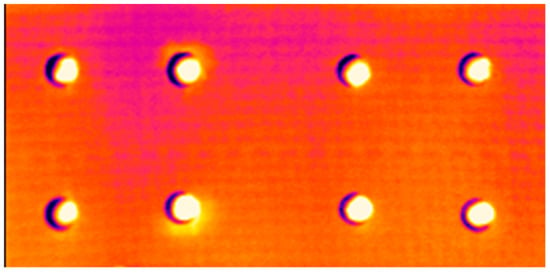
Figure 10.
Delamination around holes in a drilled carbon epoxy part; phase image taken with Agema 900 camera.
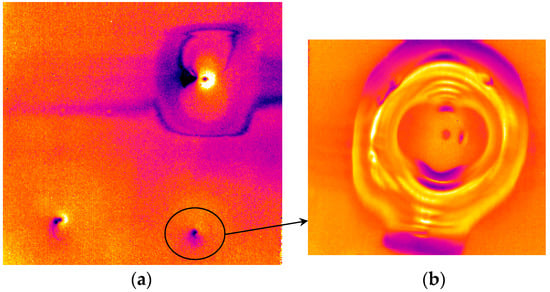
Figure 11.
Impact damage of a Glare panel; phase images taken with SC3000 camera. (a) phase image of a large panel (500 × 500 mm2); (b) close-up view.
Lock-in thermography can also be exploited to ascertain if the cooling passages of gas turbine blades are free of ceramic core fragments [40]; this is a difficult task especially in the presence of small blades like the one shown in Figure 12a. The dark zone, which is enclosed in the white rectangle on the right side of Figure 12b, clearly indicates the presence of residual ceramic core inside the cooling passage. It is worth noting that the ceramic core is normally removed through chemical etching and it is likely that, due to the complex geometry of the cooling passages, some fragments may remain attached to the walls and may either complicate successive manufacturing or compromise the in-service performance.
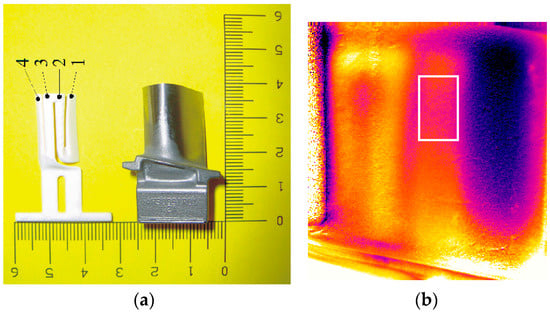
Figure 12.
Phase image taken with SC3000 camera showing obstruction of a cooling passage in a turbine blade. (a) visible image; (b) phase image.
3.2. Monitoring of Impact Tests
The research group at the University of Naples was among the first to use infrared thermography for monitoring impact tests. They began with feasibility trials on glass/epoxy specimens [44] and continued by considering both other types of composite materials and different impact energies [45,46,47,48,49,50]. Impact tests are performed with a modified Charpy pendulum, which allows the positioning of the infrared camera to view the surface opposite to the impact, with the camera acquiring sequences of thermal images during each impact event.
Some thermal images taken during impact at 12 J of a CFRP and of a GFRP laminate are reported in Figure 13 and Figure 14, respectively, while a video S1 (CFRP.wmv) is also supplied for the CFRP specimen. Both specimens include unidirectional fibers, which are oriented at [0°, 90°]s for the GFRP to attain a thickness of 2.9 mm and at [0°, ±45°, 90°]s for the CFRP one to attain a thickness of 2.4 mm. Sequences of images are acquired with the SC6800 MW camera at a frame rate of 960 Hz. From the thermal images, it is possible to follow the initiation of the impact damage and its progression with time. Specifically, the first images show the surface cooling down due to the thermoelastic effect because the material is initially in tension. Afterwards, the visible damage initiation starts with a hot tract (Figure 13d) in the CFRP and two hot spots (Figure 14f) in the GFRP. The video shows spectacular breakage of the CFRP laminate. In particular, a hot tract suddenly appears which stretches out to the right and to the left by tracing a furrow. In the meantime, lighter furrows are traced above and below it. At the end, the lighter area accounts for the overall extension of delamination.
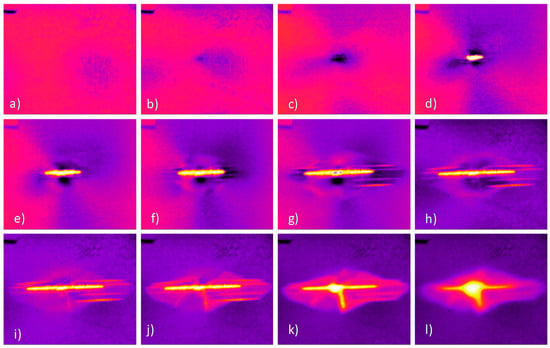
Figure 13.
Some thermal images taken with SC6800 camera at different time instants during impact of a CFRP specimen. (a) t = 0 s; (b) t = 0.001 s; (c) t = 0.002 s; (d) t = 0.003 s; (e) t = 0.004 s; (f) t = 0.005 s; (g) t = 0.007 s; (h) t = 0.015 s; (i) t = 0.016 s; (j) t = 0.032 s; (k) t = 0.189 s; (l) t = 0.605 s.
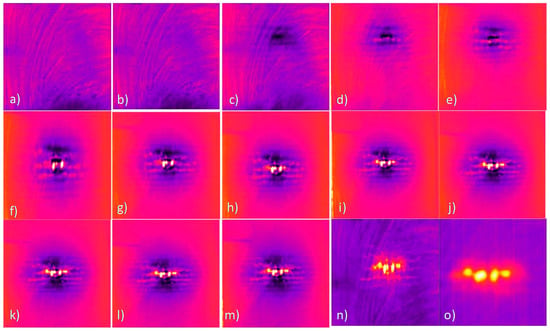
Figure 14.
Some thermal images taken with SC6800 camera at different time instants during impact of a GFRP specimen. (a) t = 0 s; (b) t = 0.001 s; (c) t = 0.002 s; (d) t = 0.003 s; (e) t = 0.004 s; (f) t = 0.005 s; (g) t = 0.006 s; (h) t = 0.007 s; (i) t = 0.008 s; (j) t = 0.009 s; (k) t = 0.010 s; (l) t = 0.011 s; (m) t = 0.012 s; (n) t = 0.026 s; (o) t = 0.60 s.
From the obtained results and considering the testing scope of assessing the performance under impact of composite materials for design purposes, it is evident that monitoring the impact event with an infrared imaging device represents the fast and best solution. In fact, it is common practice to search for the energy that causes damage of a given size. This is achieved through many impacts at increasing energy. The procedure includes several steps: put the panel in the impact machine, perform an impact of a given energy, remove the panel, perform non-destructive testing (generally, lock-in or ultrasonics) and put it again in the impact machine for another impact of different energy in another zone and so on. This procedure is time consuming and sometimes not very accurate since the commonly used NDT techniques fail to detect the actual extension of delamination; this is mainly because of the tendency of two delaminated surfaces to tightly adhere once the impactor moves away.
Of course, to get quantitative information on the impact damage, it is necessary to post-process the acquired sequences of thermal images. This is done by exploiting the software packages supplied with the instrumentation and by routines specifically developed in the Matlab environment [42,50]. Generally, a sequence of ∆T images is first created by subtracting temperature for unloaded conditions to every image of the sequence recorded during the impact event. From the ∆T images it is possible to get information useful for understanding of the impact damaging mechanisms. In particular, the following comments apply:
- ➢
- Negative ∆T values indicate thermoelastic effects and account for bending of the material under the impact force.
- ➢
- Depending on the type of material, small positive ∆T values indicate formation of micro-crack, delamination and/or light deformation.
- ➢
- High ∆T values indicate material breakage.
The obtained ∆T images can be further post-processed to learn more and get quantitative information. In fact, it is possible to extract:
- ➢
- Evolution in time of ∆T.
- ➢
- Minima and maxima ∆T values.
- ➢
- ∆T profiles along specific directions.
- ➢
- Extension of delaminated zones.
Examples of evolution in time of ∆T of specimens CFRP (Figure 13) and GFRP (Figure 14) are reported in Figure 15 and Figure 16, respectively. These plots were extracted in a central point; ∆T displays an abrupt rise when the material breaks up.
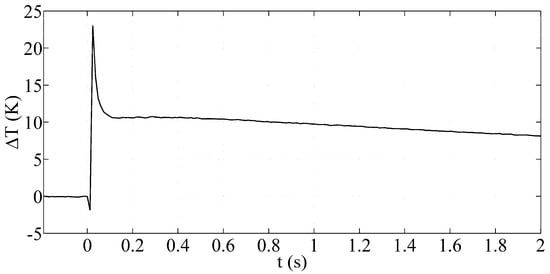
Figure 15.
∆T plot in time in a central point of the CFRP specimen of Figure 13.
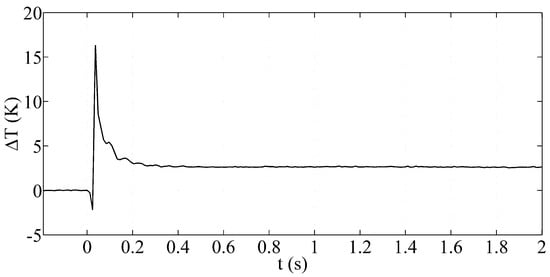
Figure 16.
∆T plot in time in a central point of the GFRP specimen of Figure 14.
As previously affirmed, from ∆T images it is also possible to evaluate the extension of the impact damage as well as of the impact-affected zone [42,50]. It is worth noting that, in presence of very small ∆T variations coupled with very light delamination (generally at the boundary with the sound material), the instrument noise [51] may be of concern. This problem can be advantageously solved with the use of a reference specimen [52].
4. Cultural Heritage
Infrared thermography, in particular lock-in thermography, has proven to be helpful to deal with many of the requirements of cultural heritage investigations [2]. As main outcomes, infrared thermography represents a valuable tool for non-destructive evaluation (NDE) of building structures of both historical interest and civil use, as well as artworks, because it can give indications about most sources of degradation. In particular, it is helpful to diagnose the state of the monument before restoration and during the verification of the quality of the actual restoration efforts. For example: analysis of the state of preservation of the architectonic elements; analysis of the characteristics of the applied stuccos; verification of effectiveness of biocide treatment applied to the stone after any cleaning process. Indeed, by choosing the most suitable thermographic technique, it is possible to monitor the conservation state of artworks over time and detect the presence of many types of defects (e.g., voids, cracks, disbondings) in different types of materials (e.g., concrete, masonry structures, bronze) [53,54]. When dealing with precious artworks, the main advantages of infrared thermography may be summarized with three words: non-contact, non-intrusive, and two-dimensional. It is possible to inspect either a large surface such as the facade of a palace, or a very small one of only few square millimeters. Conversely, the inspection depth is quite small, generally, in the order of centimeters. However, as demonstrated by Carlomagno et al. [55], IRT matches well with electric-type geophysical methods to characterize the overlapping zone from low-to-high depth in masonry structures.
The research group at the University of Naples has been involved in many applications [38,55,56,57,58,59]. As a typical example, here we only report on the evaluation of the funerary Dancers fresco, from Ruvo’s tomb in Apulia and now kept in the Archaeological Museum of Naples (Italy). This fresco, which includes six panels dating back to the 4th century BC, represents a very valuable artwork (unicum) and needs particular preservation treatments. Figure 17 shows a photo of one panel (Figure 17a) and two phase images (Figure 17b,c) which refer to the two encircled zones A and B. The painting border in the phase image of Figure 17b appears to be composed of three horizontal stripes instead of only one as visible to the naked eye (Figure 17a). Most probably, the painting was partially restored in the past by applying new paint over damaged zones and the three stripes were covered with only one large dark stripe [38]. Instead, the zone B gives indications about the presence of the original painting (yellow zones in the phase image of Figure 17b), which is also confirmed by the autoptic exam, or of cracks and/or deterioration in the fresco’s support (darker zones).
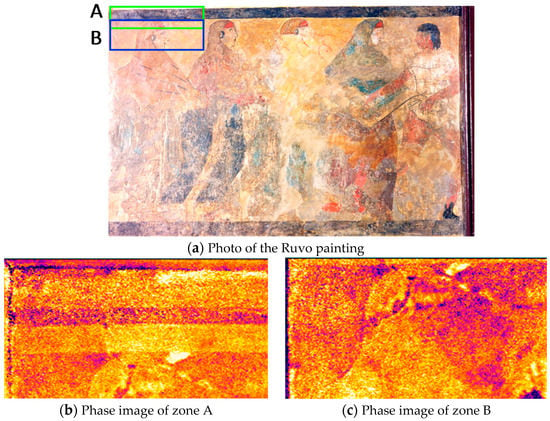
Figure 17.
Photo (a) and phase images (b,c) taken with an Agema 900 camera.
5. Predictive Maintenance (PM)
This is the field which allows for amply practical use of the vast variety of infrared imaging devices, from the simplest cheaper handheld cameras up to the more sophisticated ones, depending on the type of inspection and the analysis required (only qualitative, or also quantitative). In general, PM involves monitoring equipment over time, determining whether corrective action is required before equipment failure with corresponding financial savings. Building envelopes, roofs, HVC (heating, ventilation and air conditioning) systems, and electrical/mechanical equipment are only some of the test cases which may benefit from the use of an infrared imaging system. IRT also provides rapid and accurate diagnoses for furnace maintenance, refractory consumption management, etc. The use of a remote infrared imaging system allows for a completely safe inspection for both the component, whose integrity is guaranteed (i.e., no contact or alteration) and the personnel, who act in a protected environment (away from any harmful conditions). In most cases, with a handheld camera it is possible to get an overview of the entire installation involving complex set of electrical connections, valves, and pipes delivering hot or cold fluids, quickly and at a safe distance.
As an example, Figure 18 displays thermal images which were taken in an industrial context, with two handheld cameras, based on the micro-bolometric technology, the B4 (320 × 240 pixels) and the B50 (240 × 240 pixels) (Flir systems), respectively. As can be seen, it is possible to individuate, amongst a series, a motor that is not working (the second from right in Figure 18a) since it appears darker (i.e., colder) than the other ones. It is also possible to locate an electrical fault, as the high temperature on the right contactor phase (Figure 18b) indicates.
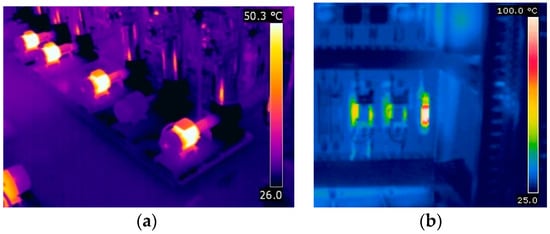
Figure 18.
Thermal images from industrial application. (a) Fault in a motor; (b) fault in a contactor.
Within architecture and civil engineering, the infrared camera not only represents a unique device for rapid monitoring of the condition of the building envelope to comply with the technical requirements for energy efficiency, but it is also a useful mean to gain information about buried structures, placement of beams and reinforcement, etc., for restoration purposes. In addition, one must note the convenience of using an infrared camera to discover if there are buried elements such as feeding and sewage pipes or electric conduits in a wall before drilling a hole. Examples of thermal images taken with the B4 camera to the outside and the inside of a building are reported in Figure 19. In particular, it is possible to recognize the structural elements buried under plaster in the phase image of the building faҫade (Figure 19a), but it is also possible to individuate the cold feeding pipe under pavement (Figure 19b), or a hot electrical conduit (Figure 19c).
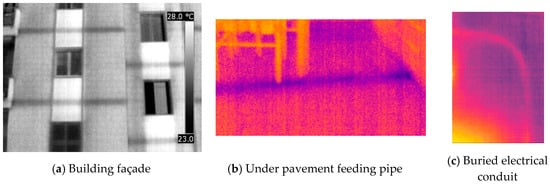
Figure 19.
Infrared thermography at home: outside (a); inside (b,c).
6. Conclusions
Herein, some of the images collected over more than 40 years while working with infrared thermography at the University of Naples Federico II have been described. Results are grouped into four main application topics. Of course, the topics which have been the focus of work with more outcomes are better-addressed than others. In any case, the discussion was limited to a minimum and no interpretative schemes were added, the intent being to depict the world by means of infrared colours. Indeed, most of the infrared images contain hidden information that might be fun to discover. However, a copious list of references is provided for the reader who wants to discover more.
Supplementary Materials
The following are available online at www.mdpi.com/2313-433X/2/4/36/s1, Video S1: CFRP.wmv.
Author Contributions
The three authors contributed equally to the paper.
Conflicts of Interest
The authors declare no conflict of interest.
References
- Rinaldi, R. Infrared Devices: Short History and New Trends. In Infrared Thermography: Recent Advances and Future Trends; Meola, C., Ed.; Bentham Science Publishers Ltd.: Oak Park, IL, USA, 2012. [Google Scholar]
- Meola, C.; Carlomagno, G.M. Recent advances in the use of infrared thermography. Meas. Sci. Technol. 2004, 15, R27–R58. [Google Scholar] [CrossRef]
- Carlomagno, G.M.; Cardone, G. Infrared thermography for convective heat transfer measurements. Exp. Fluids 2010, 49, 1187–1218. [Google Scholar] [CrossRef]
- Astarita, T.; Carlomagno, G.M. Infrared Thermography for Thermo-Fluid-Dynamics; Springer: Berlin/Heidelberg, Germany, 2013. [Google Scholar]
- Carlomagno, G.M.; Ianiro, A. Thermo-fluid-dynamics of submerged jets impinging at short nozzle-to-plate distance: A review. Exp. Therm. Fluid Sci. 2014, 58, 15–35. [Google Scholar] [CrossRef]
- Glauert, M.B. The wall jet. J. Fluid Mech. 1956, 1, 625–643. [Google Scholar] [CrossRef]
- Bakke, P. An experimental investigation of a wall jet. J. Fluid Mech. 1957, 2, 467–472. [Google Scholar] [CrossRef]
- Metzger, D.E.; Florschuetz, L.W.; Takeuchi, D.I.; Behee, R.D.; Berry, R.A. Heat transfer characteristics for inline and staggered arrays of circular jets with crossflow of spent air. J. Heat Transf. 1979, 101, 526–531. [Google Scholar] [CrossRef]
- Florschuetz, L.W.; Su, C.C. Effects of crossflow temperature on heat transfer within an array of impinging jets. J. Heat Transf. 1987, 109, 74–82. [Google Scholar] [CrossRef]
- Kercher, D.M.; Tabakoff, W. Heat transfer by a square array of round air jets impinging perpendicular to a flat surface including the effect of spent air. J. Eng. Power 1970, 92, 73–82. [Google Scholar] [CrossRef]
- Obot, N.T.; Trabold, T.A. Impingement heat transfer within arrays of circular jets, part 1: Effects of minimum, intermediate, and complete crossflow for small and large spacings. J. Heat Transf. 1987, 109, 872–879. [Google Scholar] [CrossRef]
- Goldstein, R.J.; Sobolik, K.A.; Seol, W.S. Effect of entrainment on the heat transfer to a heated circular air jet impinging on a flat surface. J. Heat Transf. 1990, 112, 608–611. [Google Scholar] [CrossRef]
- Didden, N.; Ho, C.M. Unsteady separation in a boundary layer produced by an impinging jet. J. Fluid Mech. 1985, 160, 235–256. [Google Scholar] [CrossRef]
- Monkewitz, B.R.; Bechert, D.W.; Barsikow, B.; Lehmann, B. Self-excited oscillations and mixing in a heated round. Jet. J. Fluid Mech. 1990, 213, 611–639. [Google Scholar] [CrossRef]
- Meola, C.; de Luca, L.; Carlomagno, G.M. Azimuthal instability in an impinging jet: Adiabatic wall temperature distribution. Exp. Fluids 1985, 18, 303–310. [Google Scholar] [CrossRef]
- Meola, C.; de Luca, L.; Carlomagno, G.M. Influence of shear layer dynamics on impingement heat transfer. Exp. Therm. Fluid Sci. 1996, 13, 29–37. [Google Scholar] [CrossRef]
- Gardon, R. Heat transfer between a flat plate and jets of air impinging on it. Int. Dev. Heat Transfer (ASME) 1962, 454–460. [Google Scholar]
- Carlomagno, G.M.; de Luca, L. Infrared Thermography in Convective Heat Transfer. In Handbook of Flow Visualization; Yang, W.J., Ed.; Taylor and Francis: London, UK, 2001; pp. 547–575. [Google Scholar]
- Carlomagno, G.M.; de Luca, L.; Cardone, G.; Astarita, T. Heat flux sensors for infrared thermography in convective heat transfer. Sensors 2014, 14, 21065–21116. [Google Scholar] [CrossRef] [PubMed]
- Meola, C.; Carlomagno, G.M. Intensive cooling of large surfaces with arrays of jets. In Proceedings of the International Conference on Quantitative Infrared Thermography Conference (QIRT06), Padua, Italy, 28–30 June 2006.
- Vicinanza, D.; Meola, C.; Carlomagno, G.M.; Di Natale, M. Temperature distribution of a hot water discharge in a wave environment. In Proceedings of the International Conference on the Mediterranean Coastal Environment, Hammamet, Tunisia, 23–27 October 2001.
- Astarita, T.; Cardone, G.; Carlomagno, G.M. Spiral vortices detection on a rotating disk. In Proceedings of the 23rd International Congress of Aeronautical Sciences, Toronto, ON, Canada, 8–13 September 2002.
- Carlomagno, G.M.; Berardi, P.G. Unsteady thermotopography in non-destructive testing. In Proceedings of the 3rd Biannual Infrared Information Exchange (IRIE ‘76), St. Louis, MO, USA, 24–26 August 1976.
- Busse, G. Optoacoustic phase angle measurement for probing a metal. Appl. Phys. Lett. 1979, 35, 759–760. [Google Scholar] [CrossRef]
- Thomas, R.L.; Pouch, J.J.; Wong, Y.H.; Favro, L.D.; Kuo, P.K.; Rosencwaig, A. Subsurface flaw detection in metals by photoacoustic microscopy. J. Appl. Phys. 1980, 51, 1152–1156. [Google Scholar] [CrossRef]
- Letho, A.; Jaarinen, J.; Tiusanen, T.; Jokinen, M.; Luukkala, M. Magnitude and phase in thermal wave imaging. Electron. Lett. 1981, 17, 364–365. [Google Scholar]
- Bennett, C.A., Jr.; Patty, R.R. Thermal wave interferometry: A potential application of the photoacoustic effect. Appl. Opt. 1982, 21, 49–54. [Google Scholar] [CrossRef] [PubMed]
- Beaudoin, J.L.; Merienne, E.; Danjoux, R.; Egee, M. Numerical system for infrared scanners and application to the subsurface control of materials by photo thermal radiometry Infrared Technology and Applications. Proc. SPIE 1985, 590, 287–292. [Google Scholar]
- Kuo, P.K.; Feng, Z.J.; Ahmed, T.; Favro, L.D.; Thomas, R.L.; Hartikainen, J. Parallel Thermal Wave Imaging Using a Vector Lockin Video Technique. In Photoacoustic and Photothermal Phenomena; Hess, P., Pelzl, J., Eds.; Springer: Heidelberg, Germany, 1987; pp. 415–418. [Google Scholar]
- Busse, G.; Wu, D.; Karpen, W. Thermal wave imaging with phase sensitive modulated thermography. J. Appl. Phys. 1992, 71, 3962–3965. [Google Scholar] [CrossRef]
- Wu, D.; Rantala, J.; Karpen, W.; Zenzinger, G.; Schönbach, B.; Rippel, W.; Steegmüller, R.; Diener, L.; Busse, G. Applications of lockin-thermography methods. In Review of Progress in Quantitative Nondestructive Evaluation; Thompson, D.O., Chimenti, D.E., Eds.; Plenum: New York, NY, USA, 1996; Volume 15, pp. 511–519. [Google Scholar]
- Meola, C.; Carlomagno, G.M.; Squillace, A.; Giorleo, G. Non-destructive control of industrial materials by means of lock-in thermography. Meas. Sci. Technol. 2002, 13, 1583–1590. [Google Scholar] [CrossRef]
- Meola, C.; Squillace, A.; Giorleo, G.; Nele, L. Experimental characterization of an innovative Glare® fibre reinforced metal laminate in pin bearing. J. Compos. Mater. 2003, 37, 1543–1552. [Google Scholar] [CrossRef]
- Meola, C.; Carlomagno, G.M.; Prisco, U.; Vitiello, A. Non-destructive control of polyethylene blanket insulation. Res. Nondestruct. Eval. 2004, 15, 55–63. [Google Scholar] [CrossRef]
- Meola, C.; Carlomagno, G.M.; Squillace, A.; Giorleo, G. The use of infrared thermography for nondestructive evaluation of joints. Infrared Phys. Technol. 2004, 46, 93–99. [Google Scholar] [CrossRef]
- Meola, C.; Carlomagno, G.M.; Giorleo, L. The use of infrared thermography for materials characterization. J. Mater. Process. Technol. 2004, 155–156, 1132–1137. [Google Scholar] [CrossRef]
- Meola, C.; Carlomagno, G.M.; Giorleo, L. Geometrical limitations to detection of defects in composites by means of infrared thermography. J. Nondestruct. Eval. 2004, 23, 125–132. [Google Scholar] [CrossRef]
- Meola, C.; Carlomagno, G.M. Application of infrared thermography to adhesion science. J. Adhes. Sci. Technol. 2006, 20, 589–632. [Google Scholar] [CrossRef]
- Meola, C.; Carlomagno, G.M.; Squillace, A.; Vitiello, A. Nondestructive evaluation of aerospace materials with lock-in thermography. Eng. Fail. Anal. 2006, 13, 380–388. [Google Scholar] [CrossRef]
- Meola, C.; Carlomagno, G.M.; Di Foggia, M.; Natale, O. Infrared thermography to detect residual ceramic in gas turbine blades. Appl. Phys. A 2008, 91, 685–691. [Google Scholar] [CrossRef]
- Bonavolontà, C.; Valentino, M.; Meola, C.; Carlomagno, G.M.; Volponi, R.; Rosca, I.D. Non destructive testing of carbon nanotube reinforced composite using HTS-SQUID and electromagnetic techniques. Supercond. Sci. Technol. 2009, 22. [Google Scholar] [CrossRef]
- Meola, C.; Boccardi, S.; Carlomagno, G.M. Infrared Thermography in the Evaluation of Aerospace Composite Materials; Woodhead Publishing: Cambridge, UK, 2016. [Google Scholar]
- Meola, C.; Boccardi, S.; Carlomagno, G.M.; Boffa, N.D.; Monaco, E.; Ricci, F. Nondestructive evaluation of carbon fibre reinforced composites with infrared thermography and ultrasonics. Compos. Struct. 2015, 134, 845–853. [Google Scholar] [CrossRef]
- Meola, C.; Carlomagno, G.M. Infrared thermography to impact-driven thermal effects. Appl. Phys. A 2009, 96, 759–762. [Google Scholar] [CrossRef]
- Meola, C.; Carlomagno, G.M. Impact damage in GFRP: New insights with infrared thermography. Compos. Part A 2010, 41, 1839–1847. [Google Scholar] [CrossRef]
- Meola, C.; Carlomagno, G.M.; Ricci, F. Monitoring of impact damage in carbon fibre reinforced polymers. In Proceedings of the 11th International Conference on Quantitative Infrared Thermography (QIRT 2012), Napoli, Italy, 11–14 June 2012.
- Meola, C.; Carlomagno, G.M. Infrared thermography to evaluate impact damage in glass/epoxy with manufacturing defects. Int. J. Impact Eng. 2014, 67, 1–11. [Google Scholar] [CrossRef]
- Boccardi, S.; Carlomagno, G.M.; Meola, C.; Russo, P.; Simeoli, G. Monitoring impact damaging of thermoplastic composites. J. Phys. Conf. Ser. 2015, 658. [Google Scholar] [CrossRef]
- Meola, C.; Boccardi, S.; Boffa, N.D.; Ricci, F.; Simeoli, G.; Russo, P.; Carlomagno, G.M. New perspectives on impact damaging of thermoset- and thermoplastic-matrix composites from thermographic images. Compos. Struct. 2016, 152, 746–754. [Google Scholar] [CrossRef]
- Boccardi, S.; Carlomagno, G.M.; Simeoli, G.; Russo, P.; Meola, C. Evaluation of impact affected areas of glass fibres thermoplastic composites from thermographic images. Meas. Sci. Technol. 2016, 7, 075602. [Google Scholar] [CrossRef]
- Meola, C.; Boccardi, S.; Carlomagno, G.M. Measurements of very small temperature variations with LWIR QWIP infrared camera. J. Infrared Phys. Technol. 2015, 72, 195–203. [Google Scholar] [CrossRef]
- Boccardi, S.; Carlomagno, G.M.; Meola, C. Basic temperature correction of QWIP cameras in thermo-elastic-plastic tests of composite materials. Appl. Opt. 2016, 55, D87–D94. [Google Scholar] [CrossRef] [PubMed]
- Grinzato, E.; Bison, P.G.; Martinetti, S. Monitoring of ancient buildings by the thermal method. J. Cult. Herit. 2002, 3, 21–29. [Google Scholar] [CrossRef]
- Grinzato, E.; Bressan, C.; Martinetti, S.; Bison, P.G.; Bonacina, C. Monitoring of the Scrovegni Chapel by IR thermography: Giotto at infrared. J. Infrared Phys. Technol. 2002, 43, 165–169. [Google Scholar] [CrossRef]
- Carlomagno, G.M.; Di Maio, R.; Meola, C.; Roberti, N. Infrared thermography and geophysical techniques in cultural heritage conservation. QIRT J. 2005, 2, 5–24. [Google Scholar] [CrossRef]
- Carlomagno, G.M.; Meola, C. Infrared thermography in the restoration of cultural properties. Proc. SPIE 2001, 4360, 203–216. [Google Scholar]
- Carlomagno, G.M.; Meola, C. Comparison between thermographic techniques for frescoes NDT. NDT E Int. 2002, 35, 559–565. [Google Scholar] [CrossRef]
- Meola, C.; Di Maio, R.; Roberti, N.; Carlomagno, G.M. Application of infrared thermography and geophysical methods to the architectural field. Eng. Fail. Anal. 2005, 12, 875–892. [Google Scholar] [CrossRef]
- Carlomagno, G.M.; Di Maio, R.; Fedi, M.; Meola, C. Integration of infrared thermography and high-frequency electromagnetic methods in archaeological surveys. J. Geophys. Eng. 2011, 8, S93–S105. [Google Scholar] [CrossRef]
© 2016 by the authors; licensee MDPI, Basel, Switzerland. This article is an open access article distributed under the terms and conditions of the Creative Commons Attribution (CC-BY) license (http://creativecommons.org/licenses/by/4.0/).