Author Contributions
Conceptualization, X.G. and J.Y.; methodology, X.G.; software, X.G.; validation, X.G.; formal analysis, X.G.; investigation, X.G. and Z.Y.; resources, J.Y.; data curation, X.G.; writing—original draft preparation, X.G.; writing—review and editing, Z.Y. and J.Y.; visualization, X.G.; supervision, J.Y.; project administration, J.Y. All authors have read and agreed to the published version of the manuscript.
Figure 1.
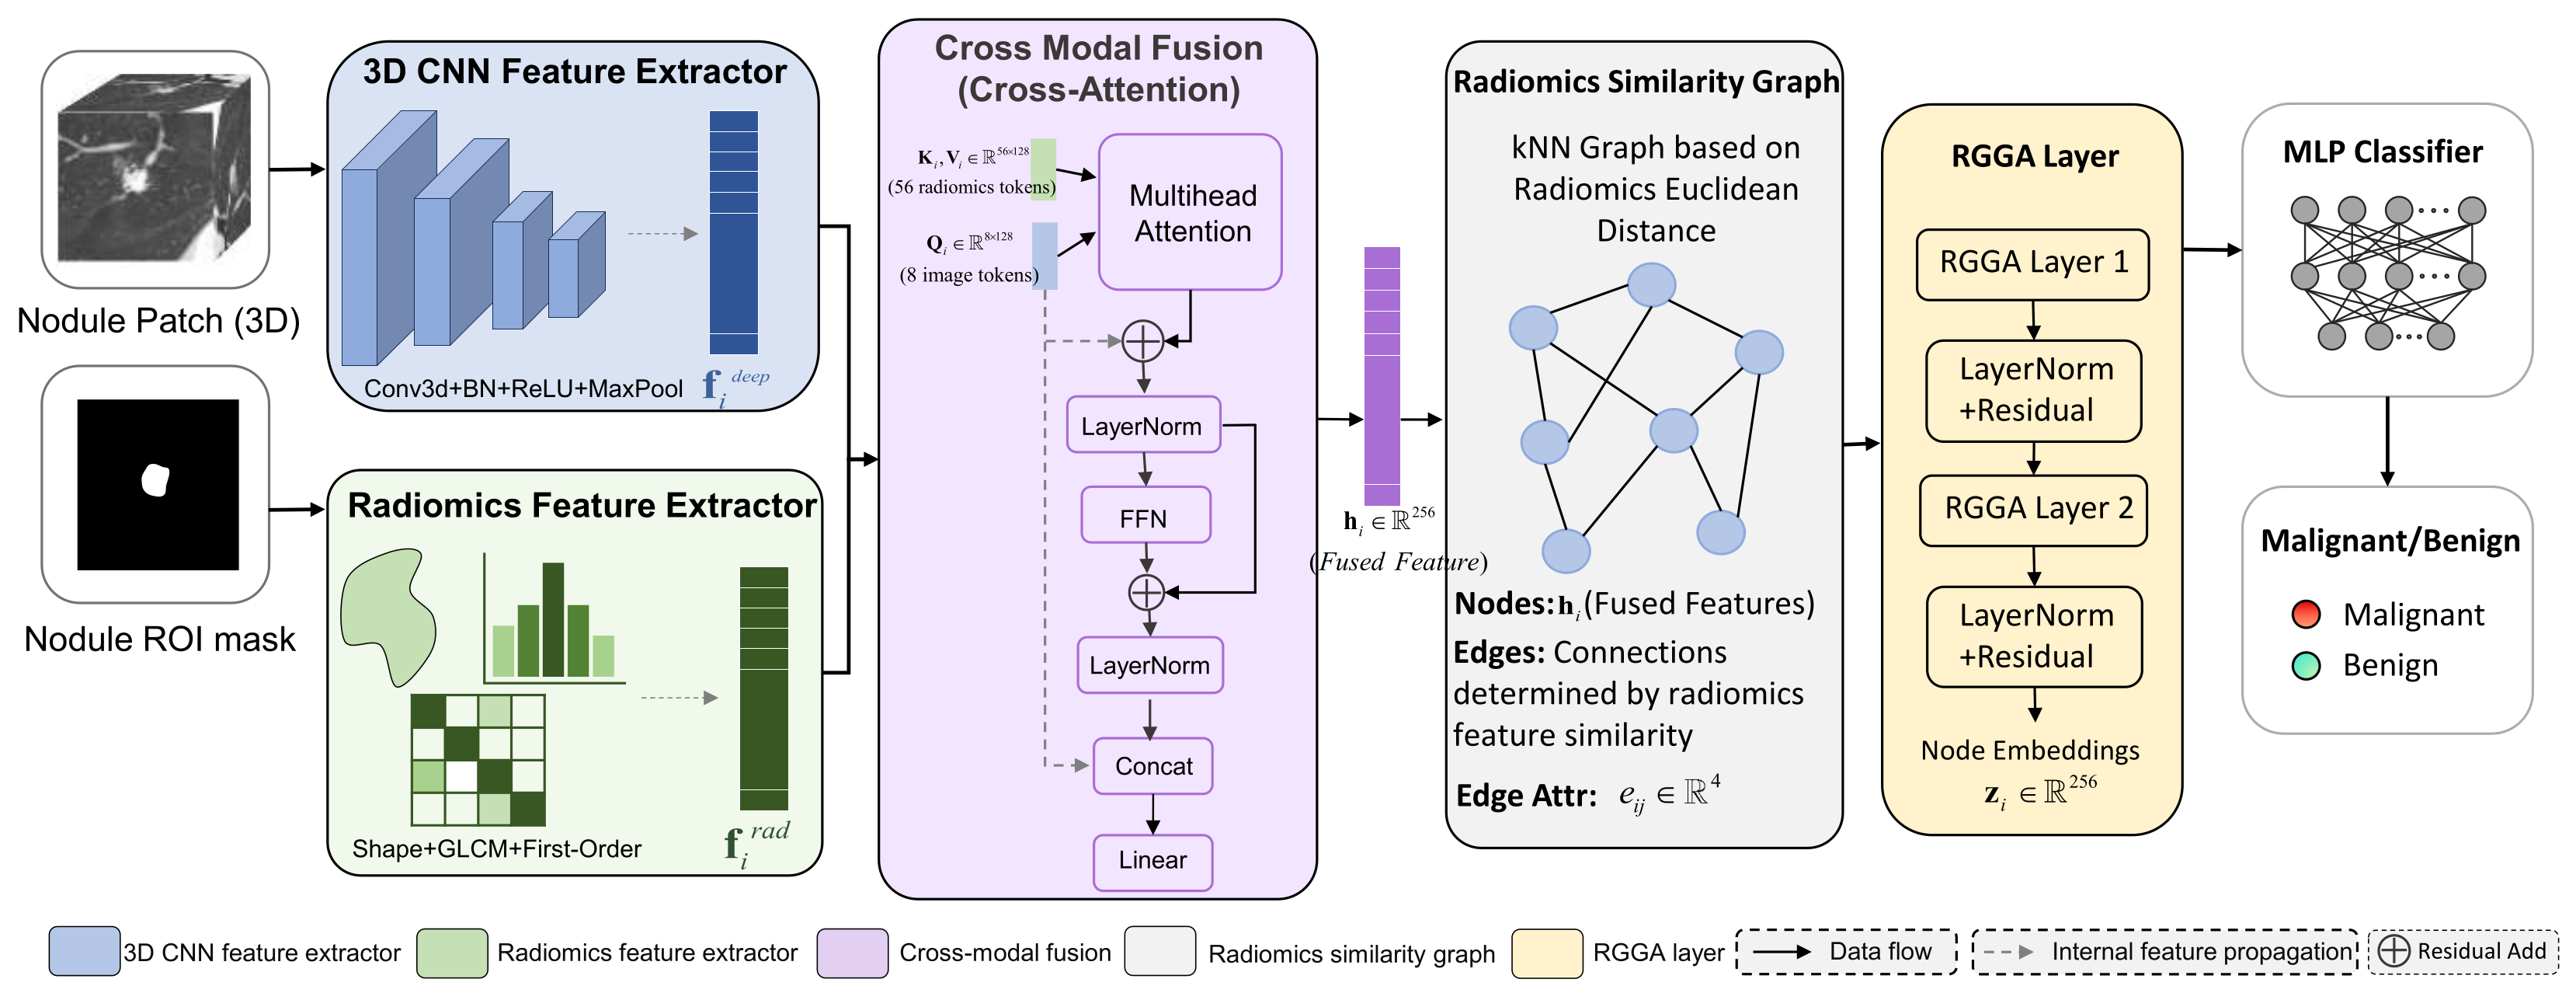
Overall framework of RGGA-Net. For each nodule, a 3D CNN and a radiomics feature extractor process the nodule patch and ROI mask in parallel, producing deep imaging features and a 56-dimensional handcrafted radiomics feature vector . For cross-modal fusion, the final CNN feature map is converted into eight spatial image tokens, while the 56 standardized radiomics features are individually mapped into 56 radiomics tokens. Multi-head cross-modal attention uses the image tokens as queries and the radiomics tokens as keys and values, yielding a 256-dimensional fused node representation . A radiomics similarity graph is then constructed by k-nearest-neighbor search in the standardized radiomics feature space, with 4-dimensional edge attributes encoding radiomics-derived inter-nodule differences. Two stacked RGGA layers with residual connections produce the final node embedding , which is fed into an MLP classifier for malignancy prediction.
Figure 1.
Overall framework of RGGA-Net. For each nodule, a 3D CNN and a radiomics feature extractor process the nodule patch and ROI mask in parallel, producing deep imaging features and a 56-dimensional handcrafted radiomics feature vector . For cross-modal fusion, the final CNN feature map is converted into eight spatial image tokens, while the 56 standardized radiomics features are individually mapped into 56 radiomics tokens. Multi-head cross-modal attention uses the image tokens as queries and the radiomics tokens as keys and values, yielding a 256-dimensional fused node representation . A radiomics similarity graph is then constructed by k-nearest-neighbor search in the standardized radiomics feature space, with 4-dimensional edge attributes encoding radiomics-derived inter-nodule differences. Two stacked RGGA layers with residual connections produce the final node embedding , which is fed into an MLP classifier for malignancy prediction.
Figure 2.
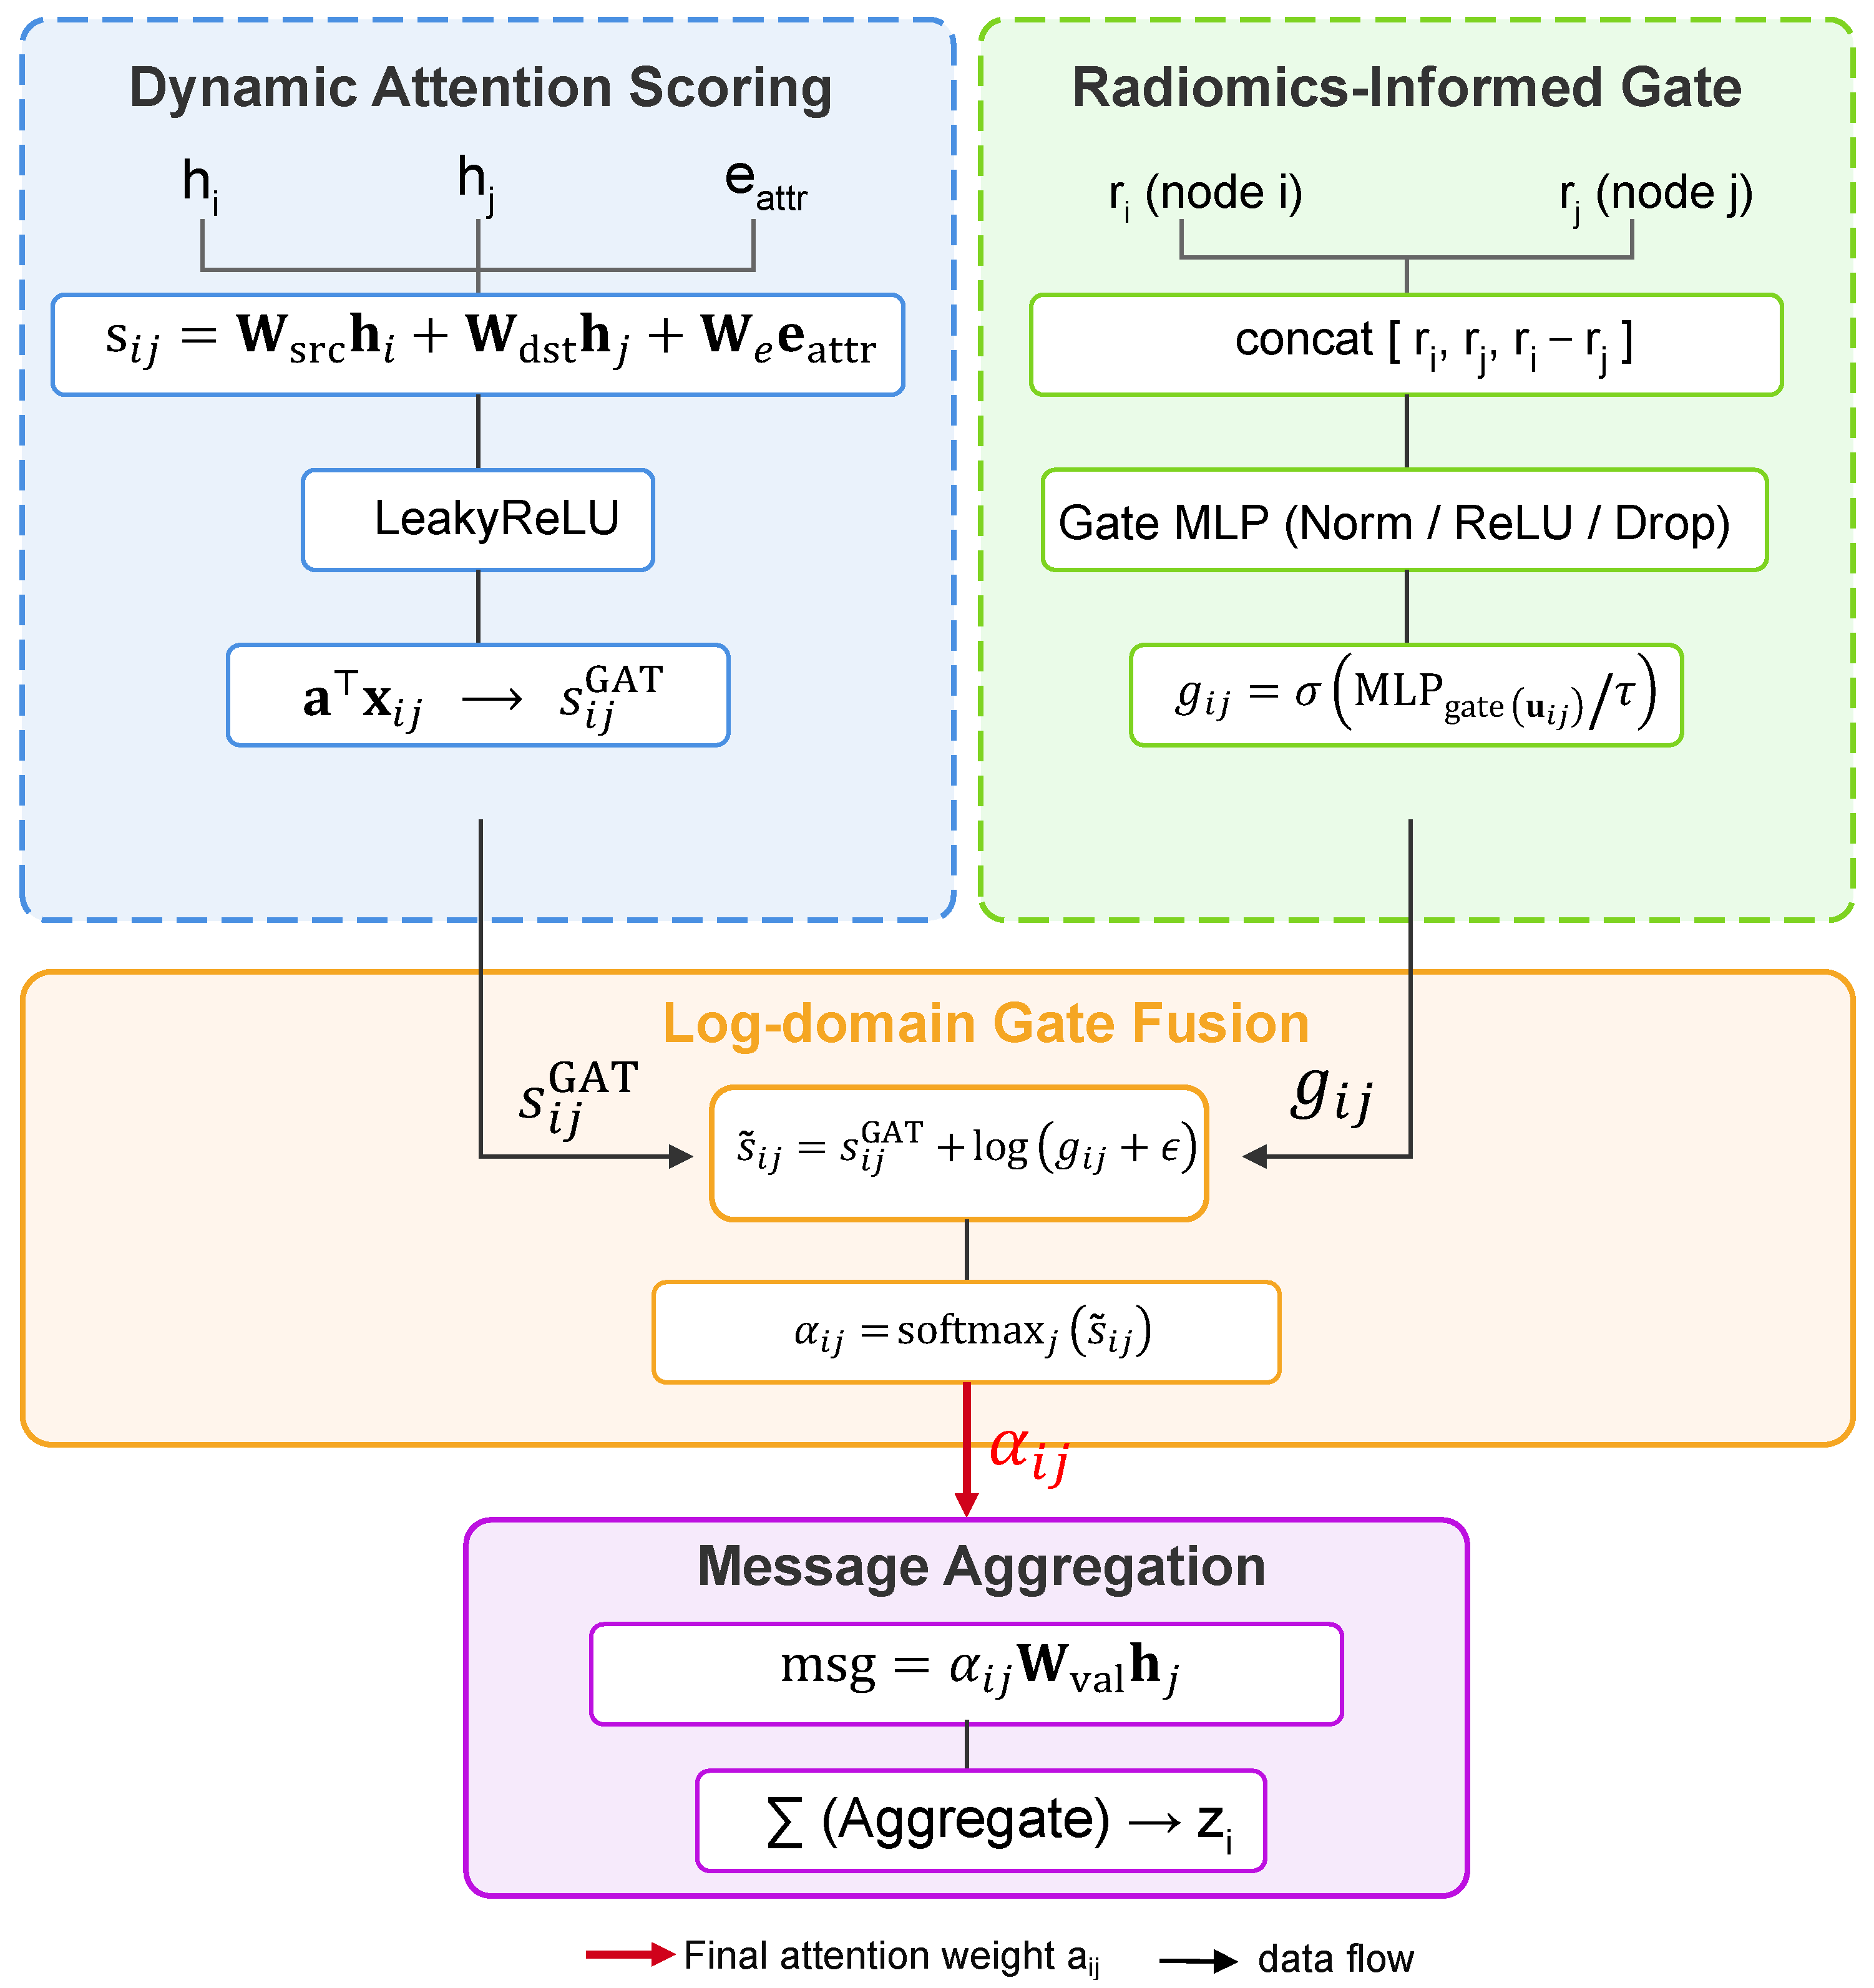
Architecture of the RGGA layer. The GATv2 branch computes a dynamic attention logit from node features , , and edge attribute via linear projection, LeakyReLU, and attention-vector contraction. In parallel, the radiomics-informed gate concatenates the standardized radiomics vectors , , and their difference , and passes them through a Gate MLP with a temperature-scaled sigmoid to produce a continuous gate value . The gate is incorporated into the attention logit through log-domain fusion, followed by softmax normalization over neighboring nodes to obtain the final attention coefficient . Messages are then aggregated to update the node embedding .
Figure 2.
Architecture of the RGGA layer. The GATv2 branch computes a dynamic attention logit from node features , , and edge attribute via linear projection, LeakyReLU, and attention-vector contraction. In parallel, the radiomics-informed gate concatenates the standardized radiomics vectors , , and their difference , and passes them through a Gate MLP with a temperature-scaled sigmoid to produce a continuous gate value . The gate is incorporated into the attention logit through log-domain fusion, followed by softmax normalization over neighboring nodes to obtain the final attention coefficient . Messages are then aggregated to update the node embedding .
Figure 3.
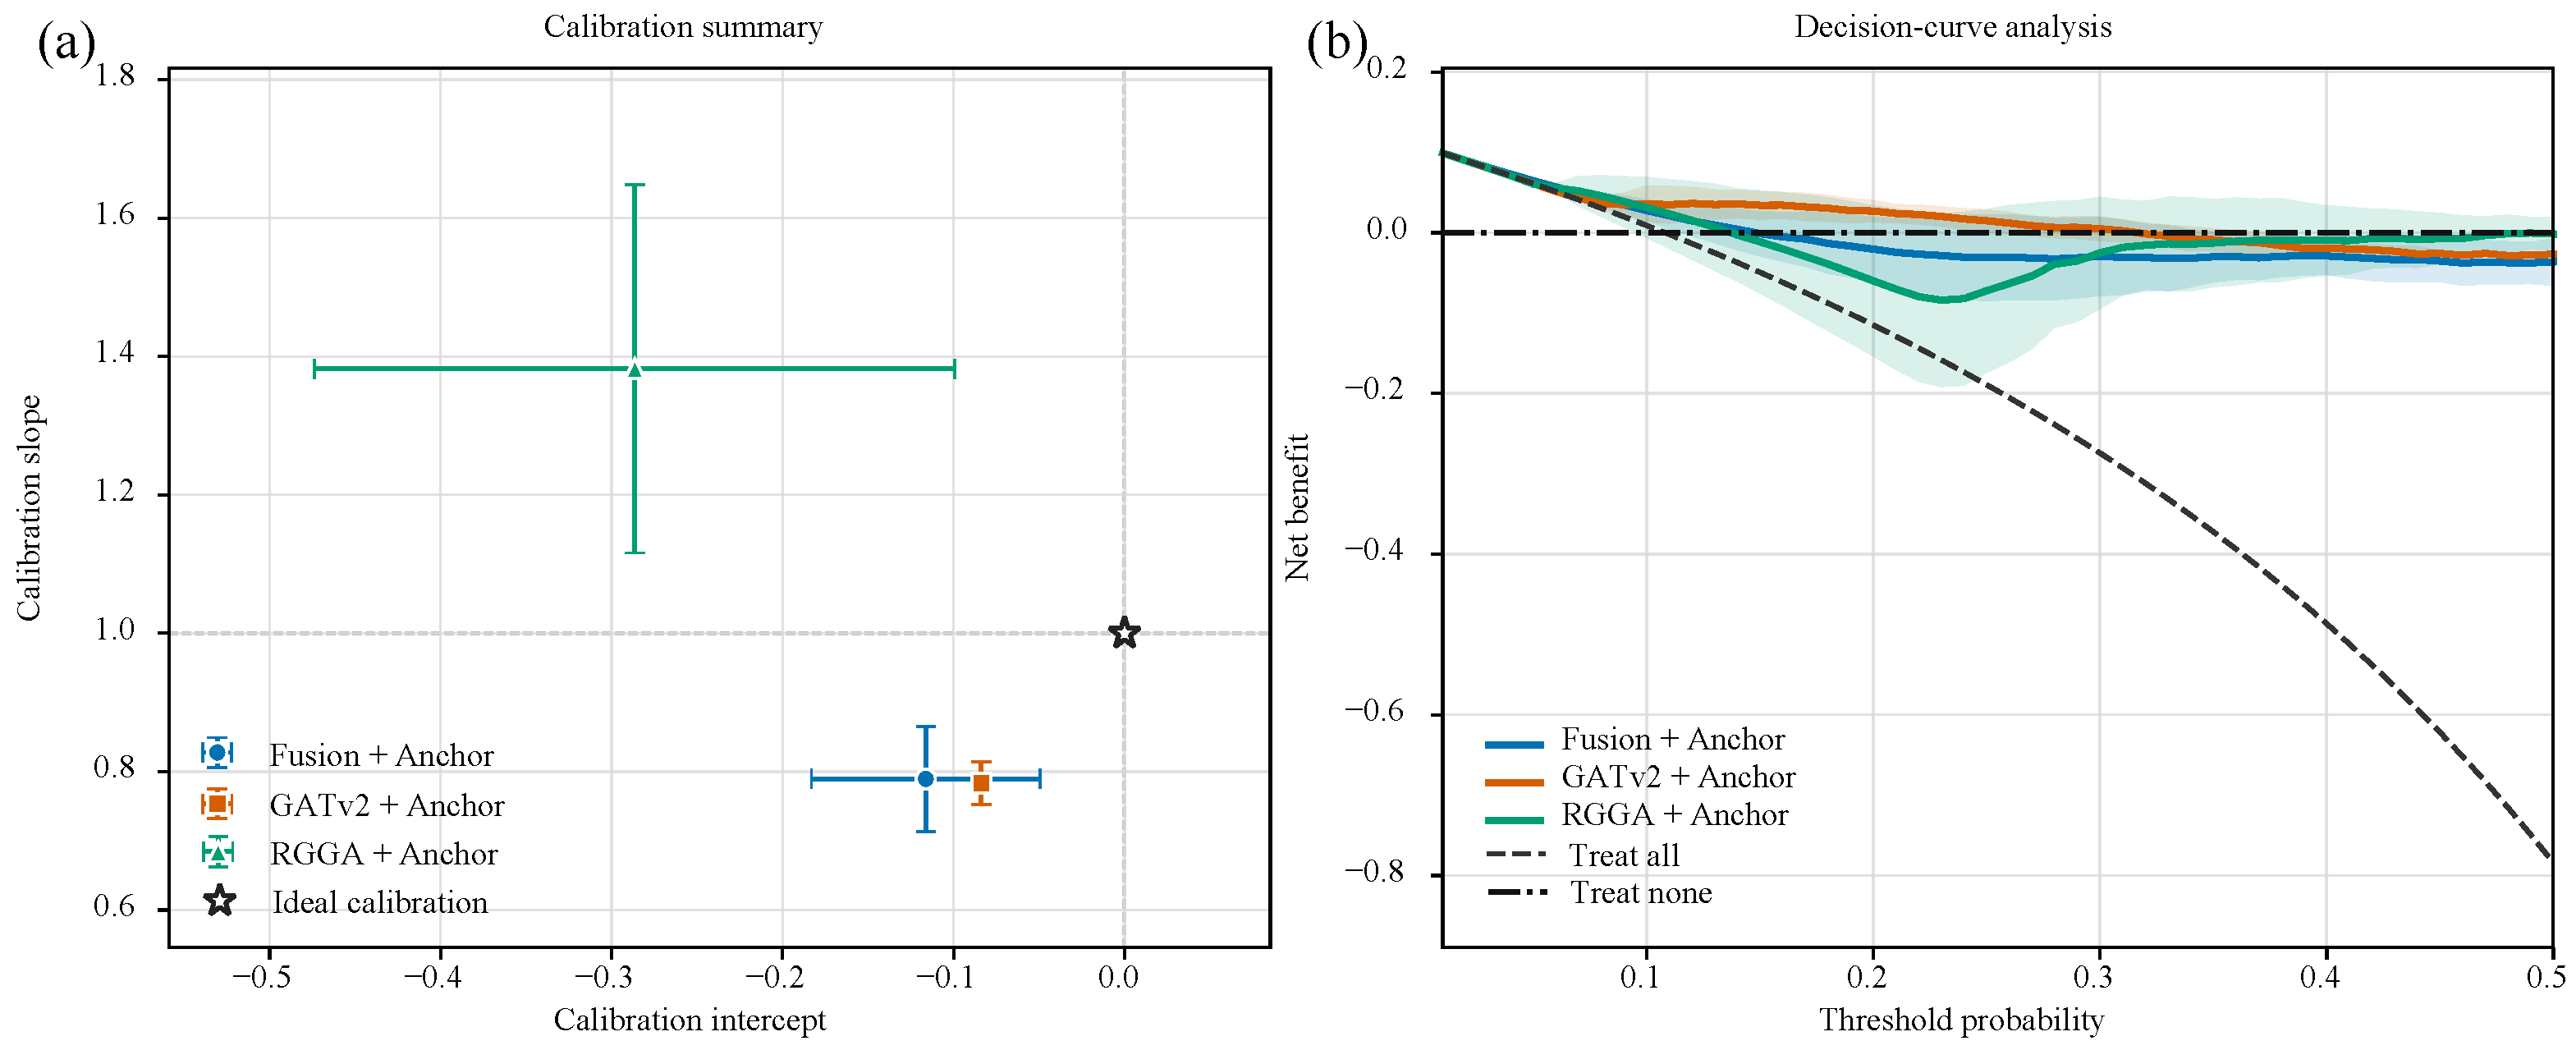
Calibration and decision-curve analysis on the internal held-out test set. (a) Calibration summary showing the mean calibration intercept and slope across three random seeds, with error bars indicating standard deviations. The star denotes the ideal calibration point (intercept , slope ). (b) Decision-curve analysis showing the mean net benefit of Fusion + Anchor, GATv2 + Anchor, and RGGA-Net across threshold probabilities, together with the treat-all and treat-none reference strategies. Shaded regions indicate variability across the three random seeds.
Figure 3.
Calibration and decision-curve analysis on the internal held-out test set. (a) Calibration summary showing the mean calibration intercept and slope across three random seeds, with error bars indicating standard deviations. The star denotes the ideal calibration point (intercept , slope ). (b) Decision-curve analysis showing the mean net benefit of Fusion + Anchor, GATv2 + Anchor, and RGGA-Net across threshold probabilities, together with the treat-all and treat-none reference strategies. Shaded regions indicate variability across the three random seeds.
Figure 4.
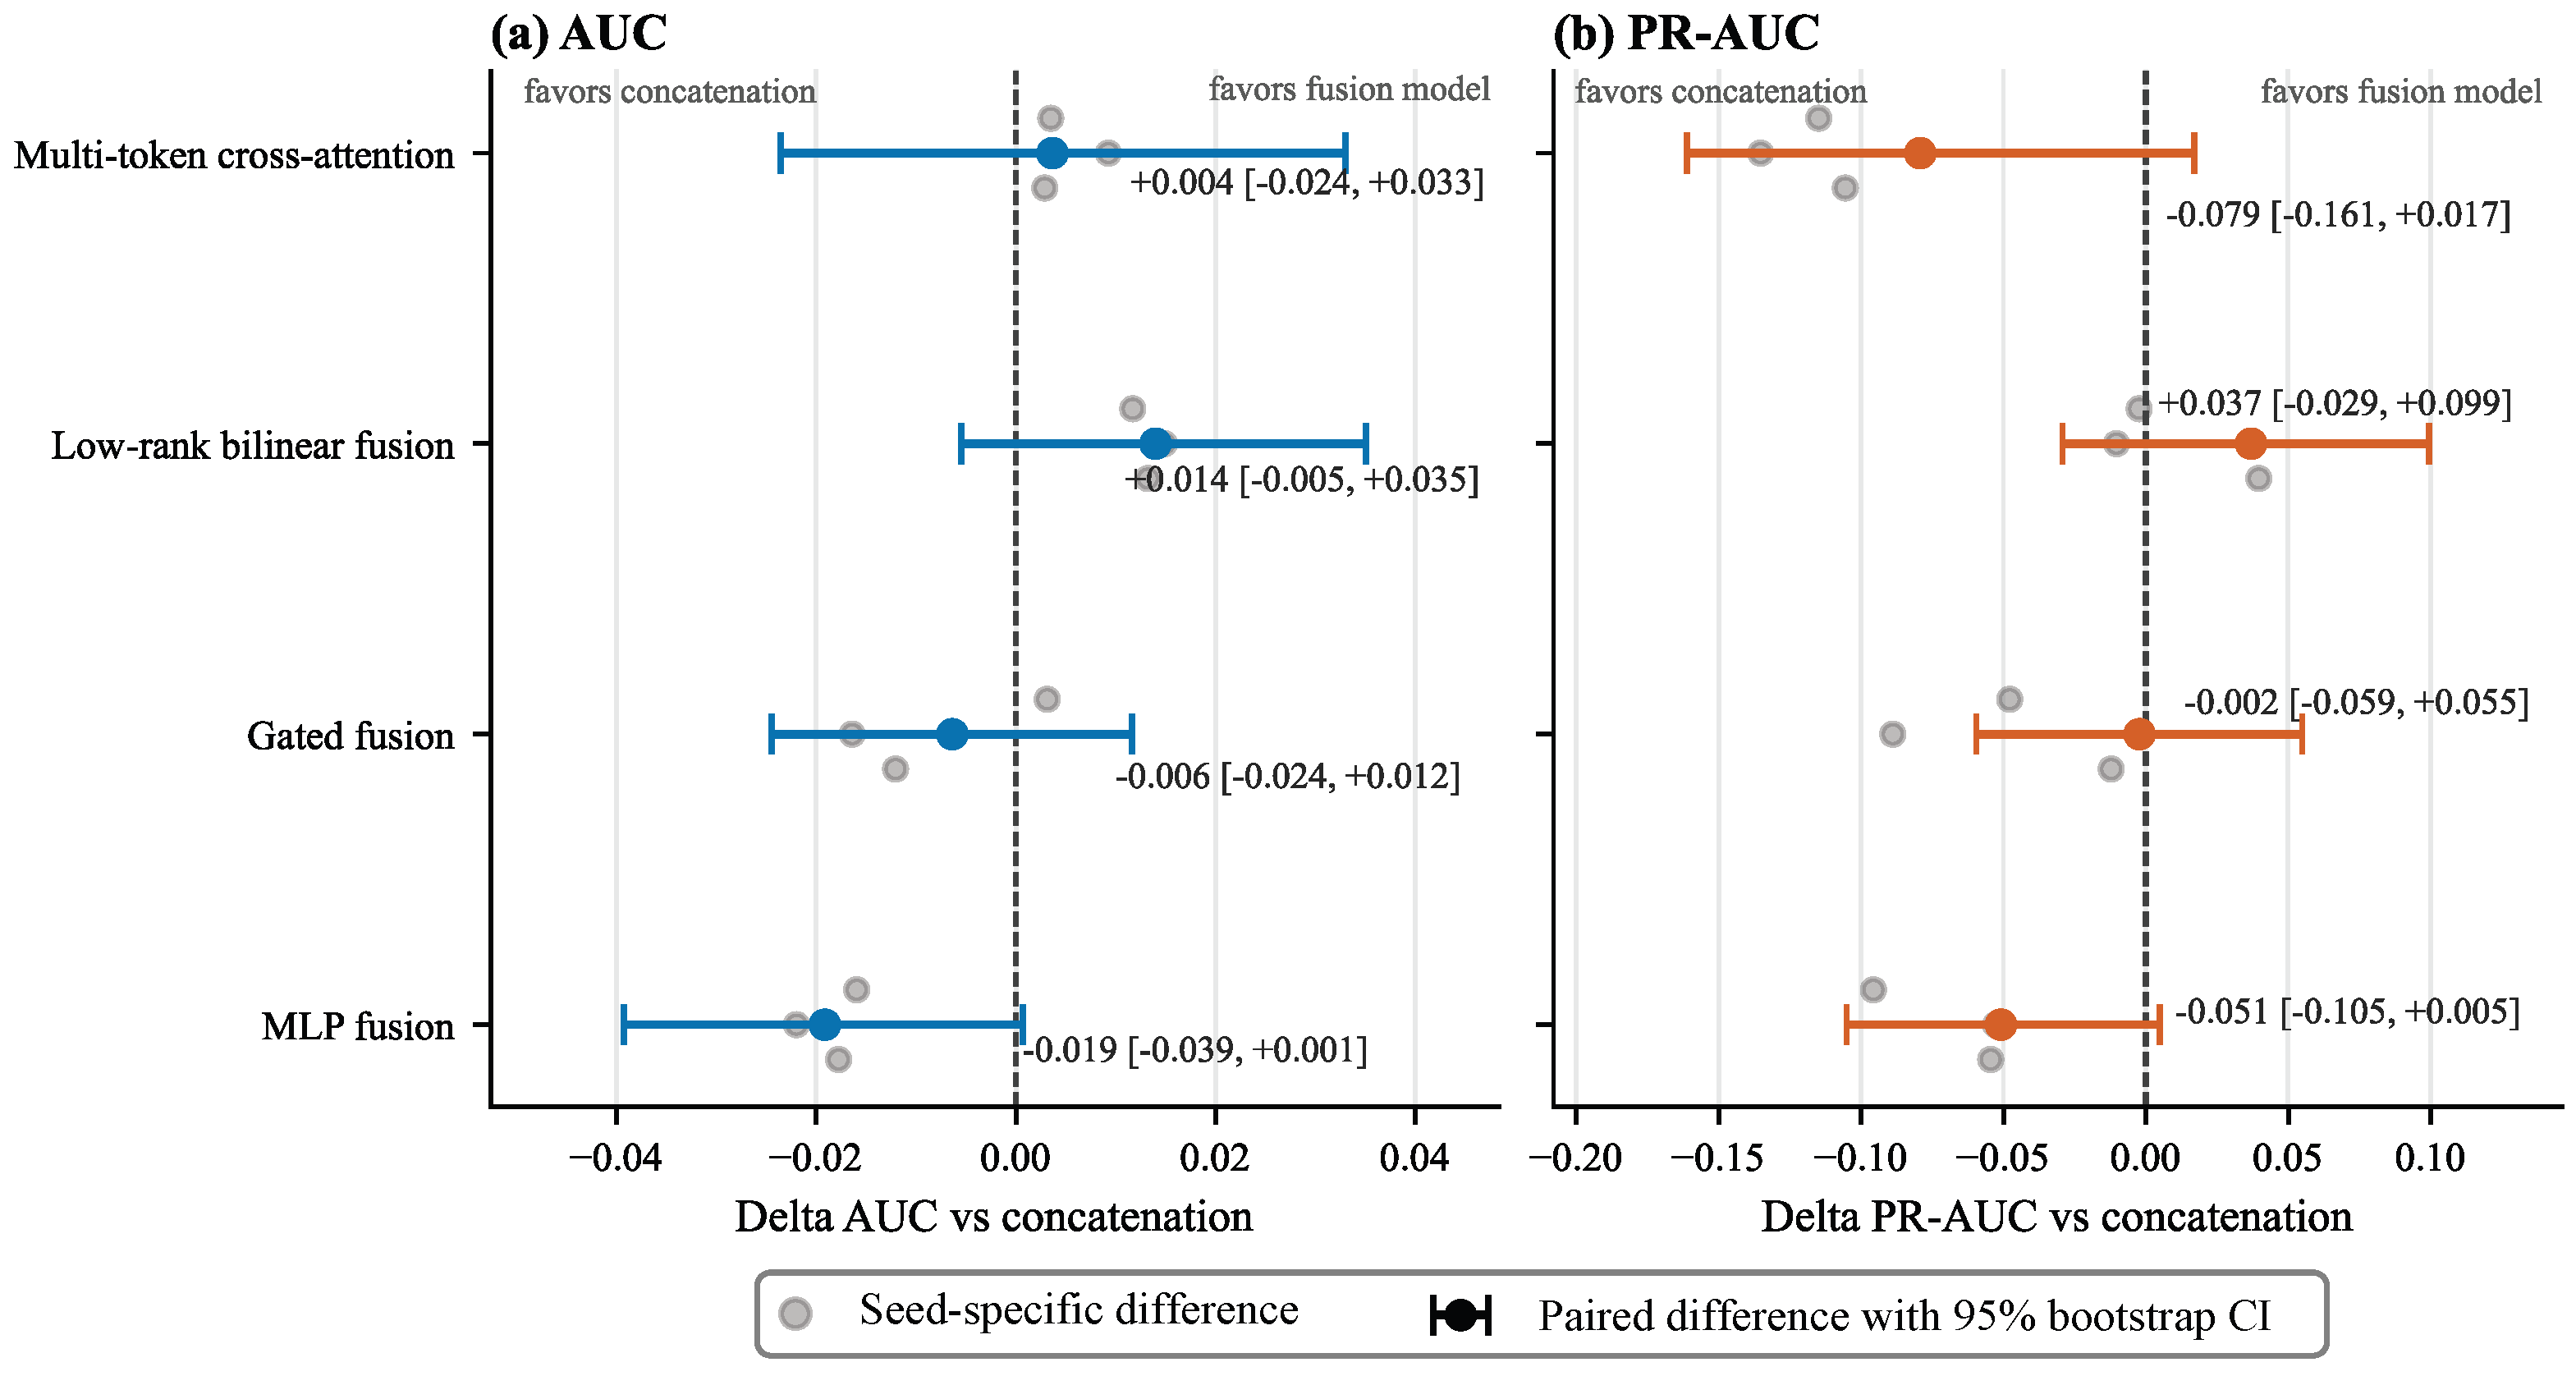
Controlled comparison of multimodal fusion strategies on the internal held-out test set. Paired differences in (a) AUC and (b) PR-AUC are reported relative to direct concatenation. Gray circles indicate seed-specific differences across three random seeds, whereas colored circles show the reported paired differences and horizontal error bars represent patient-level bootstrap 95% confidence intervals. Positive values favor the alternative fusion strategy, whereas negative values favor direct concatenation. All confidence intervals crossed zero, indicating that none of the alternative fusion operators demonstrated a statistically robust advantage over direct concatenation.
Figure 4.
Controlled comparison of multimodal fusion strategies on the internal held-out test set. Paired differences in (a) AUC and (b) PR-AUC are reported relative to direct concatenation. Gray circles indicate seed-specific differences across three random seeds, whereas colored circles show the reported paired differences and horizontal error bars represent patient-level bootstrap 95% confidence intervals. Positive values favor the alternative fusion strategy, whereas negative values favor direct concatenation. All confidence intervals crossed zero, indicating that none of the alternative fusion operators demonstrated a statistically robust advantage over direct concatenation.
Figure 5.
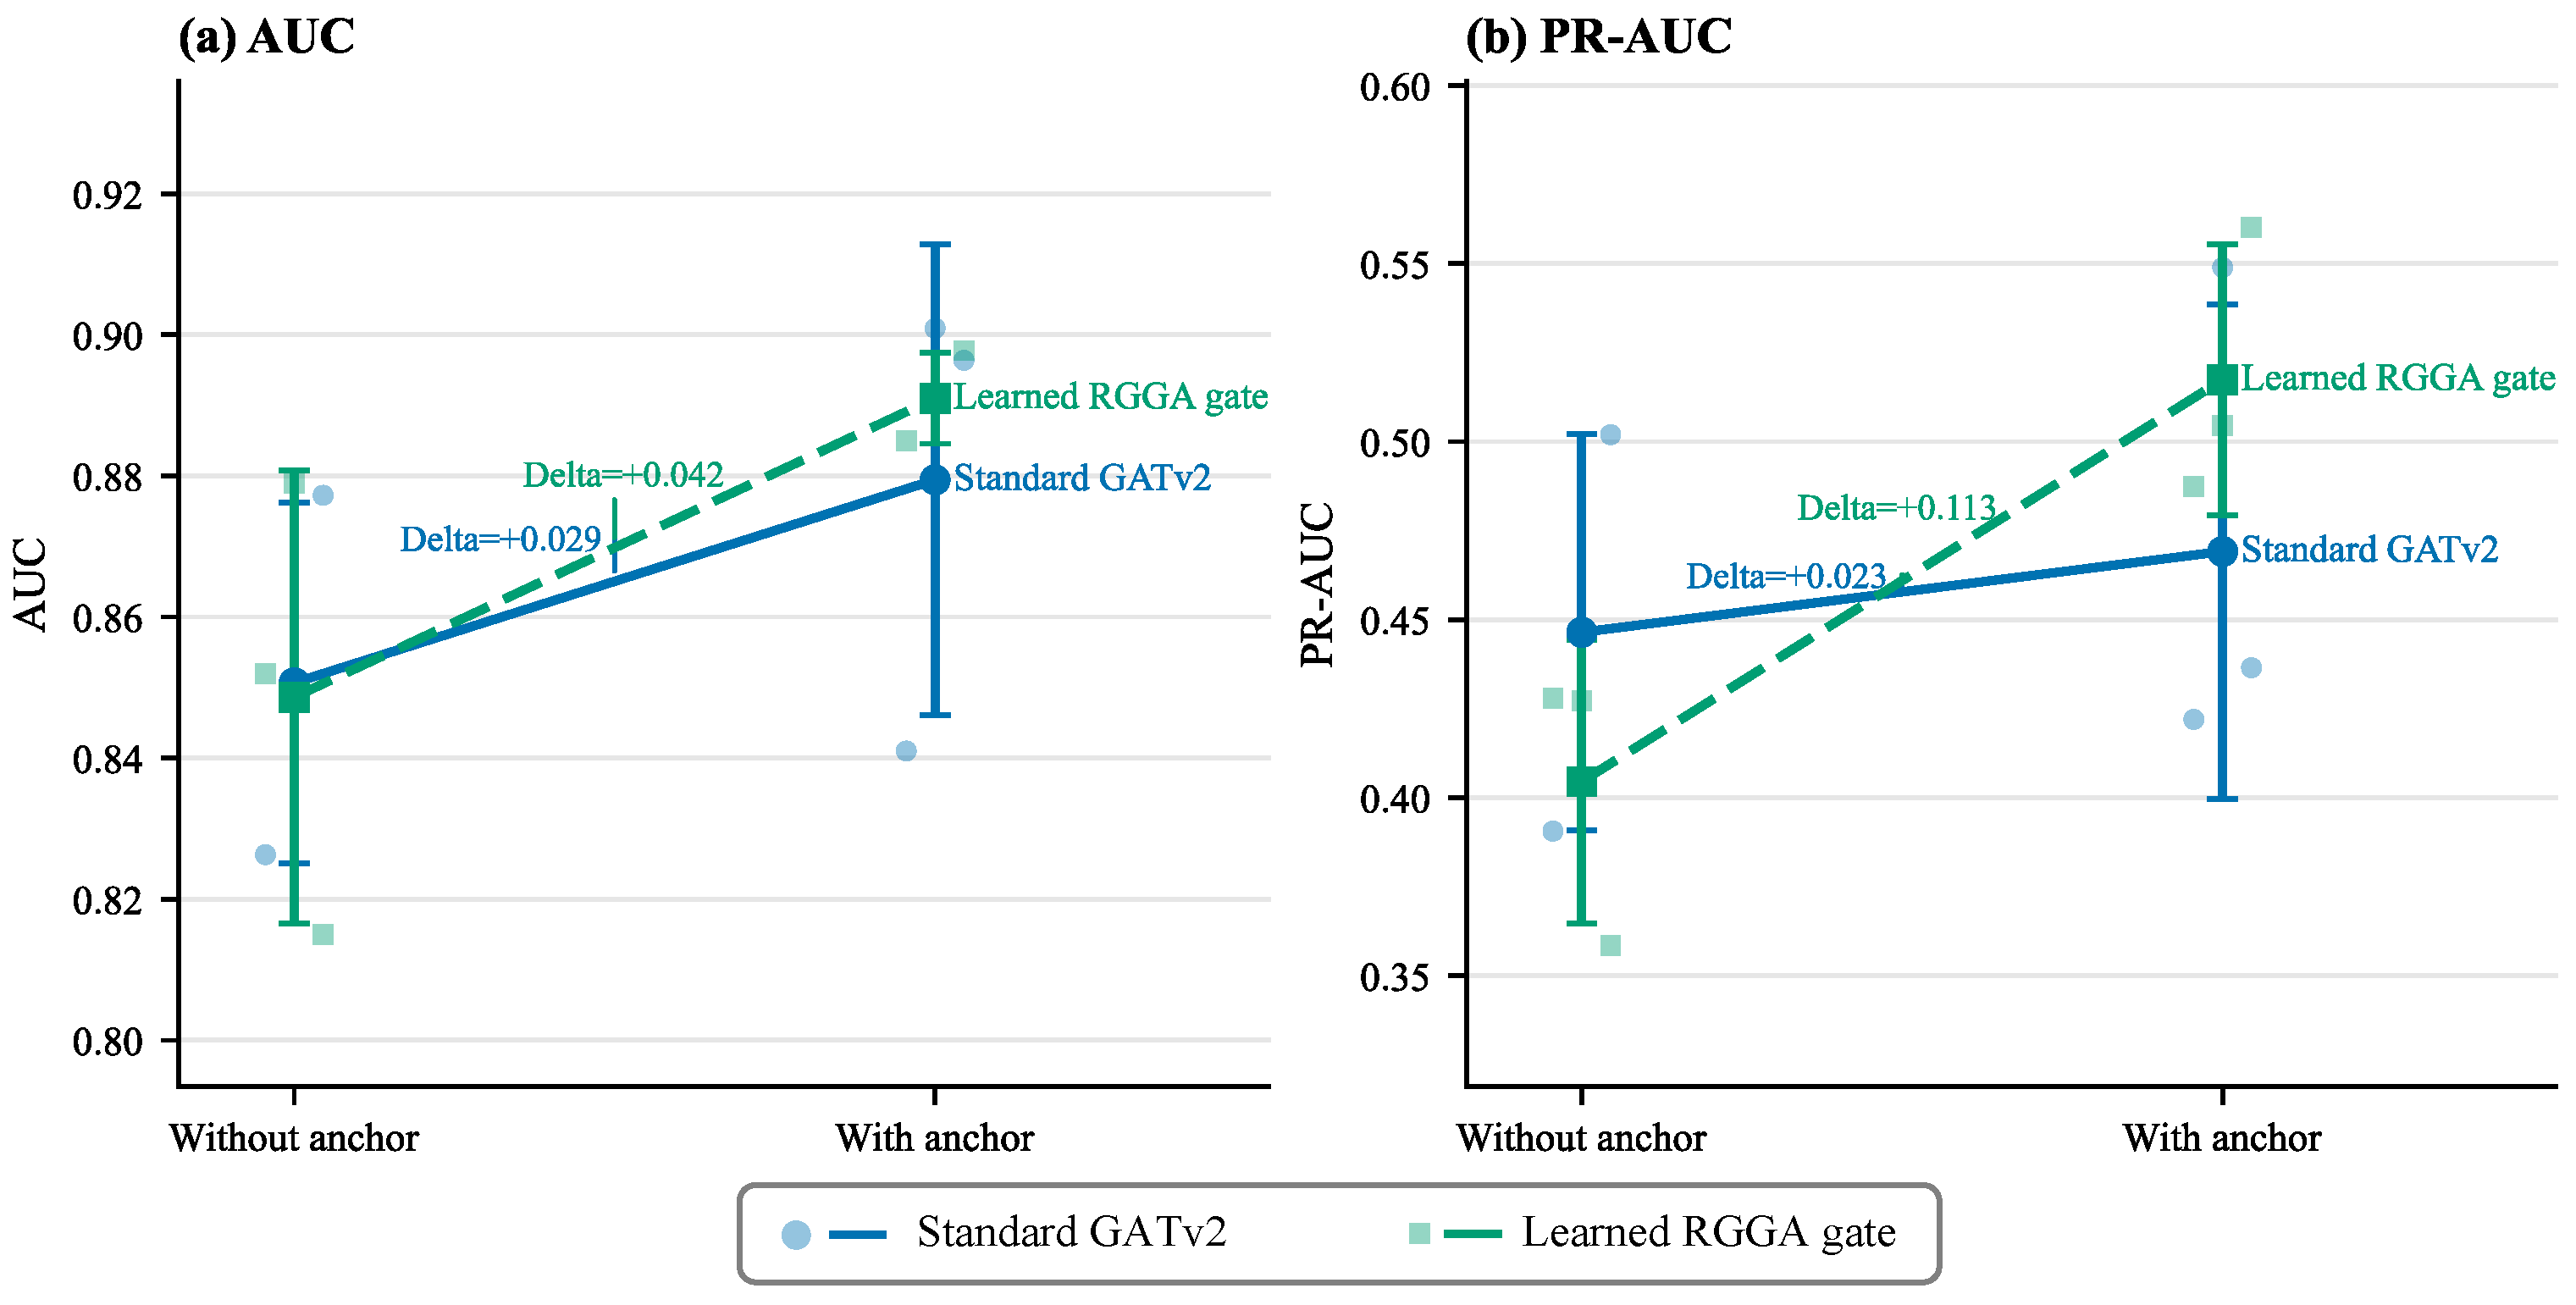
Ablation analysis of radiomics-guided gating and anchor regularization on the internal held-out test set. Panels (a,b) show the AUC and PR-AUC, respectively, of standard GATv2 and the learned RGGA gate, evaluated with and without anchor regularization. Large markers and error bars represent the mean and standard deviation across three random seeds, whereas lighter markers indicate seed-specific results. The annotated values denote the mean performance change associated with adding anchor regularization. Anchor regularization produced a larger mean improvement for the learned RGGA gate, particularly in PR-AUC, suggesting a favorable interaction pattern; however, this result does not establish statistically significant synergy.
Figure 5.
Ablation analysis of radiomics-guided gating and anchor regularization on the internal held-out test set. Panels (a,b) show the AUC and PR-AUC, respectively, of standard GATv2 and the learned RGGA gate, evaluated with and without anchor regularization. Large markers and error bars represent the mean and standard deviation across three random seeds, whereas lighter markers indicate seed-specific results. The annotated values denote the mean performance change associated with adding anchor regularization. Anchor regularization produced a larger mean improvement for the learned RGGA gate, particularly in PR-AUC, suggesting a favorable interaction pattern; however, this result does not establish statistically significant synergy.
Table 1.
Patient-level data split and nodule-count composition of the LUNA25 cohort. All CT scans and nodules belonging to the same patient were assigned to a single subset. In Panel B, values are reported as the total number of nodule samples, followed by the number and percentage of malignant nodules in parentheses. N denotes the number of nodules within the same CT scan.
Table 1.
Patient-level data split and nodule-count composition of the LUNA25 cohort. All CT scans and nodules belonging to the same patient were assigned to a single subset. In Panel B, values are reported as the total number of nodule samples, followed by the number and percentage of malignant nodules in parentheses. N denotes the number of nodules within the same CT scan.
| (A) Overall data split |
| Subset | Patients | CT scans | Nodules | Malignant | Benign | Positive ratio |
| Training | 1469 | 2844 | 4289 | 362 | 3927 | 8.44% |
| Validation | 315 | 590 | 888 | 83 | 805 | 9.35% |
| Test | 312 | 583 | 870 | 94 | 776 | 10.80% |
| Total | 2096 | 4017 | 6047 | 539 | 5508 | 8.91% |
| (B) Distribution by the number of nodules per CT scan |
| Subgroup | Training | Validation | Test |
| Nodules | Malignant | Nodules | Malignant | Nodules | Malignant |
| 1969 | 328 (16.66%) | 399 | 77 (19.30%) | 409 | 82 (20.05%) |
| 1080 | 34 (3.15%) | 254 | 6 (2.36%) | 224 | 12 (5.36%) |
| 1240 | 0 (0.00%) | 235 | 0 (0.00%) | 237 | 0 (0.00%) |
Table 2.
Multimodal fusion strategies evaluated in the controlled fusion comparison. All variants produced a 256-dimensional fused representation and used the same classification head, data split, and training protocol.
Table 2.
Multimodal fusion strategies evaluated in the controlled fusion comparison. All variants produced a 256-dimensional fused representation and used the same classification head, data split, and training protocol.
| Variant | Fusion Strategy | Description |
|---|
| F1 | Concatenation | Direct concatenation followed by linear projection |
| F2 | MLP fusion | Nonlinear fusion of concatenated image and radiomics features |
| F3 | Gated fusion | Learned sigmoid gate for adaptive modality weighting |
| F4 | Low-rank bilinear fusion | Parameter-efficient multiplicative cross-modal interaction |
| F5 | Multi-token attention | Attention between 8 image tokens and 56 radiomics tokens |
Table 3.
Principal hyperparameter settings of RGGA-Net.
Table 3.
Principal hyperparameter settings of RGGA-Net.
| Hyperparameter | Value |
|---|
| Number of kNN neighbors | during validation and testing;
during training |
| Embedding dimension | 256 |
| Number of graph-attention heads | 4 |
| Number of graph layers | 2 |
| Anchor-loss weight | 0.1 |
| Focal-loss parameters | |
| Random seeds | 2026, 2027, and 2028 |
Table 4.
Summary of compared methods for static malignancy risk assessment.
Table 4.
Summary of compared methods for static malignancy risk assessment.
| Method | Description | Type |
|---|
| Radiomics-only MLP [30] | A three-layer multilayer perceptron using only radiomics features as input | External baseline |
| 3D ResNet-18 [6] | A standard 3D convolutional neural network for independent single-nodule prediction without graph structure or radiomics features | External baseline |
| CNN-only | The proposed 3D CNN backbone for independent single-nodule prediction | Ablation |
| CNN + Radiomics (w/o graph) [9] | Fusion of deep features and radiomics features without graph modeling | Ablation |
| 3D Swin Transformer [7] | A 3D Swin Transformer-based baseline for independent single-nodule prediction, leveraging hierarchical self-attention to capture long-range dependencies in volumetric CT data | External baseline |
| GCN [31,32] | A standard graph convolutional network applied to the same multimodal fused features as our model, without radiomics-guided gating or attention mechanisms | External baseline |
| GATv2 [11] | Standard GATv2 applied to fused node features without the proposed radiomics-guided gating mechanism | Baseline & Ablation |
| RGGA-Net | Full model with multimodal feature fusion, radiomics-similarity-based graph construction, radiomics-gated graph attention, and anchor loss | Proposed |
Table 5.
Internal held-out test performance under the patient-level split. Values are reported as mean ± SD across three random seeds. Threshold-specific metrics were calculated using validation-derived Youden thresholds.
Table 5.
Internal held-out test performance under the patient-level split. Values are reported as mean ± SD across three random seeds. Threshold-specific metrics were calculated using validation-derived Youden thresholds.
| Method | AUC | PR-AUC | Sensitivity | Specificity | PPV | NPV | F1 | Brier |
|---|
| Radiomics MLP | | | | | | | | |
| 3D ResNet-18 | | | | | | | | |
| 3D Swin Transformer | | | | | | | | |
| GCN | | | | | | | | |
| Fusion + Anchor (G1) | | | | | | | | |
| GATv2 + Anchor (G3) | | | | | | | | |
| RGGA-Net (G6) | | | | | | | | |
Table 6.
Calibration performance on the internal held-out test set. Values are mean ± SD across three random seeds.
Table 6.
Calibration performance on the internal held-out test set. Values are mean ± SD across three random seeds.
| Model | Brier Score | Calibration Slope | Calibration Intercept | ECE |
|---|
| Fusion + Anchor (G1) | | | | |
| GATv2 + Anchor (G3) | | | | |
| RGGA-Net (G6) | | | | |
Table 7.
Controlled comparison of multimodal fusion strategies on the internal held-out test set. Values are mean ± SD across three random seeds.
Table 7.
Controlled comparison of multimodal fusion strategies on the internal held-out test set. Values are mean ± SD across three random seeds.
| Variant | Fusion Strategy | AUC | PR-AUC | Brier Score |
|---|
| F1 | Direct concatenation | | | |
| F2 | MLP fusion | | | |
| F3 | Gated fusion | | | |
| F4 | Low-rank bilinear fusion | | | |
| F5 | Multi-token attention | | | |
Table 8.
Stepwise ablation study of RGGA-Net on the internal held-out test set. Values are reported as mean ± SD across three random seeds. E2 uses the multi-token image–radiomics fusion module without graph message passing.
Table 8.
Stepwise ablation study of RGGA-Net on the internal held-out test set. Values are reported as mean ± SD across three random seeds. E2 uses the multi-token image–radiomics fusion module without graph message passing.
| Experiment | Fusion | Graph | RGGA
Gate | Anchor
Loss | Test AUC | vs. E1 |
|---|
| E1: CNN-only | × | × | × | × | | – |
| E2: CNN + Radiomics (w/o graph) | ✓ | × | × | × | | |
| E3: GATv2 | ✓ | ✓ | × | × | | |
| E4: RGGA w/o anchor loss | ✓ | ✓ | ✓ | × | | |
| E5: Full RGGA-Net | ✓ | ✓ | ✓ | ✓ | | |
Table 9.
Extended analysis of graph attention, radiomics gating, and anchor regularization on the internal held-out test set. Values are mean ± SD across three random seeds. Lower Brier scores indicate better probability accuracy.
Table 9.
Extended analysis of graph attention, radiomics gating, and anchor regularization on the internal held-out test set. Values are mean ± SD across three random seeds. Lower Brier scores indicate better probability accuracy.
| Variant | Model | Graph Module | Edge Modulation | Anchor Loss | AUC | PR-AUC | Brier Score |
|---|
| G1 | Fusion + Anchor | None | None | Yes | | | |
| G2 | GATv2 | GATv2 | None | No | | | |
| G3 | GATv2 + Anchor | GATv2 | None | Yes | | | |
| G4 | Fixed Gate + Anchor | GATv2 | Fixed | Yes | | | |
| G5 | RGGA | GATv2 | Learned | No | | | |
| G6 | RGGA + Anchor | GATv2 | Learned | Yes | | | |
Table 10.
Cross-dataset external evaluation on LIDC-IDRI using the primary strict label definition. Results were calculated from the three-seed ensemble probabilities. Threshold-specific metrics used the corresponding operating thresholds selected exclusively from the LUNA25 validation set.
Table 10.
Cross-dataset external evaluation on LIDC-IDRI using the primary strict label definition. Results were calculated from the three-seed ensemble probabilities. Threshold-specific metrics used the corresponding operating thresholds selected exclusively from the LUNA25 validation set.
| Model | AUC | PR-AUC | Brier | Sensitivity | Specificity | PPV | NPV | F1 |
|---|
| Fusion + Anchor | 0.6442 | 0.7165 | 0.2722 | 0.9302 | 0.0952 | 0.4956 | 0.5882 | 0.6467 |
| GATv2 + Anchor | 0.6721 | 0.6921 | 0.2353 | 0.8704 | 0.3016 | 0.5436 | 0.7090 | 0.6692 |
| RGGA + Anchor | 0.7023 | 0.7000 | 0.2504 | 0.1728 | 0.9556 | 0.7879 | 0.5473 | 0.2834 |
Table 11.
Patient-level paired bootstrap differences between RGGA + Anchor and the comparison models on LIDC-IDRI. Positive values favor RGGA + Anchor. All confidence intervals included zero.
Table 11.
Patient-level paired bootstrap differences between RGGA + Anchor and the comparison models on LIDC-IDRI. Positive values favor RGGA + Anchor. All confidence intervals included zero.
| Comparison | AUC (95% CI) | PR-AUC (95% CI) |
|---|
| RGGA vs. GATv2 + Anchor | 0.0308 (, 0.0785) | 0.0082 (, 0.0492) |
| RGGA vs. Fusion + Anchor | 0.0589 (, 0.1260) | (, 0.0495) |