Article

ODDM: Integration of SMOTE Tomek with Deep Learning on Imbalanced Color Fundus Images for Classification of Several Ocular Diseases

1
Department of Computer Science, National College of Business Administration & Economics Lahore, Multan Sub Campus, Multan 60000, Pakistan
2
Department of Computer Science, NFC Institute of Engineering and Technology, Multan 60000, Pakistan
3
Department of Business and Computing, Ravensbourne University, London SE10 0EW, UK
4
Division of Software Convergence, Sangmyung University, Seoul 03016, Republic of Korea
5
Department of AI and Robotics, Sejong University, Seoul 05006, Republic of Korea
*
Authors to whom correspondence should be addressed.
J. Imaging 2025, 11(8), 278; https://doi.org/10.3390/jimaging11080278
Submission received: 21 July 2025 / Revised: 4 August 2025 / Accepted: 7 August 2025 / Published: 18 August 2025
(This article belongs to the Special Issue Advances in Machine Learning for Medical Imaging Applications)

Abstract

Ocular disease (OD) represents a complex medical condition affecting humans. OD diagnosis is a challenging process in the current medical system, and blindness may occur if the disease is not detected at its initial phase. Recent studies showed significant outcomes in the identification of OD using deep learning (DL) models. Thus, this work aims to develop a multi-classification DL-based model for the classification of seven ODs, including normal (NOR), age-related macular degeneration (AMD), diabetic retinopathy (DR), glaucoma (GLU), maculopathy (MAC), non-proliferative diabetic retinopathy (NPDR), and proliferative diabetic retinopathy (PDR), using color fundus images (CFIs). This work proposes a custom model named the ocular disease detection model (ODDM) based on a CNN. The proposed ODDM is trained and tested on a publicly available ocular disease dataset (ODD). Additionally, the SMOTE Tomek (SM-TOM) approach is also used to handle the imbalanced distribution of the OD images in the ODD. The performance of the ODDM is compared with seven baseline models, including DenseNet-201 (R1), EfficientNet-B0 (R2), Inception-V3 (R3), MobileNet (R4), Vgg-16 (R5), Vgg-19 (R6), and ResNet-50 (R7). The proposed ODDM obtained a 98.94% AUC, along with 97.19% accuracy, a recall of 88.74%, a precision of 95.23%, and an F1-score of 88.31% in classifying the seven different types of OD. Furthermore, ANOVA and Tukey HSD (Honestly Significant Difference) post hoc tests are also applied to represent the statistical significance of the proposed ODDM. Thus, this study concludes that the results of the proposed ODDM are superior to those of baseline models and state-of-the-art models.

1. Introduction

The number of cases of ocular diseases (ODs) that can impair vision, such as trachoma, diabetic retinopathy (DR), cataracts, and age-related macular degeneration (AMD), has significantly increased in the past 20 years. According to a report by the World Health Organization (WHO), there are more than 2.2 billion individuals with vision impairments in the world. At least 45 percent of these incidents are unresolved or could have been avoided [1]. The primary causes of vision loss and blindness are cataracts, trachoma, and refractive problems left untreated (such as myopia, astigmatism, hypermetropia, and presbyopia). The WHO estimates that 10.6 million individuals have been diagnosed with trachoma, approximately 18 million people are bilaterally blind from cataracts, and more than 153 million are affected by chronic refractive problems that affect vision [2]. Furthermore, studies [1,2,3] revealed that AMD is the leading cause of blindness globally, accounting for 8.7% of cases (or 3 million individuals) of blindness, especially in developed nations. By 2040, it is anticipated that there will be 10 million instances [1,2,3,4,5,6]. Recent studies [4,5] also showed that 4.8% of the 37 million cases of blindness reported globally (e.g., 1.8 million people) are caused by DR.
In ophthalmology, ocular fundus imaging [7] is frequently used as a practical and affordable method of screening for retinal abnormalities and tracking the advancement of disease. Retinal images have excellent inter- and intra-examination agreement, sensitivity, and specificity when compared to in-person ophthalmologist examinations. Thus, in many clinical scenarios, retinal images can be used instead of ophthalmoscopy. Even in the absence of pupillary dilatation, high-quality retinal images are now more easily obtained because of developments in optical fundus imaging. Fundus cameras have several benefits, and because of the floodlight’s single-flash exposure, they are practical for patients. Furthermore, they do not affect the quality of the image in certain scenarios, such as a decrease in degeneration in cases of cataracts.
However, detecting eye disorders comes with several difficulties. First off, many common ODs like DR, AMD, and cataracts proceed without any obvious symptoms at first, making accurate early diagnosis challenging [8]. Secondly, it could take a while for doctors to determine the patient’s ailment. Third, the diagnosis requires specialists who are not always available. Fourth, even with the benefits that ocular fundus imaging offers, obtaining enough precise fundus images can occasionally be challenging, particularly for certain uncommon fundus illnesses [9]. The main reason for this is that it can be difficult to distinguish between the generated fundus pictures and eye anatomies due to their low contrast [10]. As a result, ophthalmologists may not accurately detect every indication of an eye condition. Sample images of ODs are presented in Figure 1.
OD rates are increasing at an alarming rate, although if patients are found and treated early, their odds of losing sight are better than 95% [8,9,10,11]. This motivates us to develop a model for the early detection of ODs to cure humans of blindness. Thus, this study introduces a custom multi-classification model, named the deep learning-based OD detection model (ODDM), based on a CNN, that classifies the normal (NOR) case and six types of ocular disorders, including AMD, DR, maculopathy (MAC), PDR, NPDR, and glaucoma (GLU), using CFIs.
Artificial intelligence (AI) approaches have been proposed to automate the process of OD detection to solve the aforementioned issues [11]. Machine learning (ML) techniques have been frequently used for the diagnosis of eye diseases [11,12]. Ocular diagnostic systems built with SVM and other traditional classifiers [13], in addition to K-nearest neighbors (KNNs) [14], showed strong performance on small datasets but poor performance on large datasets. Because OD detection is more difficult and specialized, these approaches might not be appropriate. Moreover, feature extraction has been performed manually in traditional ML methods. Recently, deep learning (DL) has emerged as the industry standard for computer vision technologies. Creating novel medical image processing algorithms to aid in health identification and diagnosis has drawn a lot of research interest [15,16,17,18,19,20,21]. DL approaches do not require lesion segmentation or labor-intensive feature identification and processing, in contrast to traditional ML algorithms [9,11]. CNNs have revolutionized the way basic computer vision and image processing problems like segmentation and classification are solved [22,23,24]. To evaluate the proposed ODDM, a publicly available benchmark OD [25] dataset is used in this study. An OD dataset has the issue of class imbalance; therefore, SMOTE Tomek (SM-TOM) is used to overcome this issue. The reason for choosing SM-TOM over other resampling methods is that it not only balances the OD dataset but also improves model performance [13] by eliminating noise [16] and refining decision boundaries [8]. Additionally, it also creates synthetic examples that interpolate between the various instances of minority features, thus minimizing the problem of overfitting due to random duplication. The capacity of generating more diverse and general samples makes it perform better on imbalanced data. Research studies [26,27,28,29] show significant performance in the binary classification of ODs; however, no evidence has been found that DL models classify several types of ODs such as AMD, DR, MAC, PDR, NPDR, and GLU. Additionally, the ODDM was compared to 06 baseline classifiers including DenseNet-201 (R1) [30], EfficientNet-B0 (R2) [31], Inception-V3 (R3) [32], MobileNet (R4) [33], Vgg-16 (R5) [34], Vgg-19 (R6) [35], and ResNet-50 (R7). The major contributions of this study are stated below:
  • Seven different types of ODs, including NOR, AMD, DR, MAC, PDR, NPDR, and GLU, are classified using the proposed ODDM. The proposed ODDM has the ability to extract the dominant features from CFIs that can be helpful in the accurate classification of ODs. Furthermore, this study also simplifies the proposed ODDM by reducing the number of trainable parameters to obtain a significant classifier.
  • SM-TOM is used to handle the imbalance class issue of the OD dataset, and the Grad-CAM heatmap technique is employed to highlight the infected region that occurred in the eye due to ODs.
  • Ablation experiments are performed to evaluate the effectiveness of the proposed ODDM, and the ANOVA and Tukey HSD (Honestly Significant Difference) post hoc tests are used to show the statistical significance of the proposed ODDM. Also, the proposed ODDM obtained 97.19% accuracy, which is superior to that of modern state-of-the-art (SOTA) approaches.
This study contains the following sections: Section 2 presents the modern literature that uses AI methods for the classification of ODs using different medical imaging modalities. Section 3 presents the comprehensive details of the dataset description, SM-TOM, the proposed ODDM, and performance evaluation matrices. In Section 4, the experimental results are discussed. Lastly, this study is concluded in Section 5.

2. Literature Review

Modern ML and image processing methods dominate the DR detection literature. Previous research studies used image processing techniques to pre-process fundus images and extracting features. These resulting features of CFIs were then classified into the respective eye disease classes using an AI approach. Table 1 presents the modern literature that used AI methods for the classification of ODs. One study [36] proposed a pre-trained multi-class classification model for several ocular disorders. This model classifies fundus images into several OD categories using a CNN and pre-trained classifiers. Peking University’s Ocular Disease Intelligent Recognition collection includes annotated images labeled as NOR, DR, GLU, myopia, AMD, and other disorders. Two pre-trained models, ResNet-50 and Vgg-16, were proposed for the identification of ODs. The ResNet-50 and Vgg-16 models were used to combine feature vectors from the right and left fundus images of the eye, and they achieved an accuracy of 92.35%.
Vidivelli et al. [37] proposed a multi-label DL model named CataractNetDetect for the classification of cataracts from pairs of CFIs. The proposed CataractNetDetect model demonstrates significant outcomes and achieves a 97.90% AUC. Li et al. [38] used two different CNN-based pre-trained models for the classification of ophthalmological disorders. They trained and tested these models on a publicly available benchmark ODIR dataset. Additionally, the performance of the two optimizers, Stochastic Gradient Descent (SGD) and Adam, was also observed. The highest testing accuracy of 89.64% was achieved by the MobileNet model with the Adam optimizer.
Rubina et al. [39] used a Vgg-16 model for the classification of DR. They divided DR into two classes including mild multi-class diabetic eye diseases (DEDs) and multi-class DED. Vgg-16 achieved a classification accuracy of 88.30% and 85.95% on multi-class DED and mild multi-class DED, respectively.
One study [40] designed a deep convolutional neural network (DCNN) model to classify retinal fundus images into binary categories. The authors used the APTOS 2019 dataset to train and test their proposed model and achieved a significant classification accuracy of 90.35%. Pawar et al. [41] designed a 19-layer CNN model to classify ODs using fundus images collected based on the International Clinical Diabetic Retinopathy (ICDR) severity scale. According to the ICDR severity scale, these fundus images were classified into five stages of DR. Before training the proposed model, the quality of the fundus images was graded by a senior ophthalmologist. They attained a remarkable specificity of 91.47%.
Farag et al. [42] proposed a DenseNet encoder and a convolutional attention module block-based DL model for DR severity identification. Features were extracted using an encoder from the APTOS 2019 dataset fundus images and then refined using an attention block. Their proposed model showed 82.00% accuracy for the identification of severity DR grading. Vadduri et al. [43] described a method for automatically classifying cases of diabetic eye disease (DED) based on images. Before training the TL models (i.e., Vgg-16, Xception, ResNet-50, CNN), various image enhancement techniques, such as CLAHE and illumination correction, were used. Accuracy levels of 90.00% or higher in the recognition of ODs were achieved by all TL models.
Tan et al. [44] conducted a review to analyze AI methods for the classification of ODs. Their study concluded that the amalgamation of feature extraction methods with DL models was potentially used by researchers for the classification of ODs using retinal imaging. Oliveira et al. [45] proposed a model that uses a visual attention module for the identification of eye-tracking diseases. Their study mainly focused on the diagnosis of autism spectrum disorder (ASD), and they achieved an average precision of 90.00%, a recall of 69.00%, and a specificity of 93.00%. Another study [46] also suggested a model named SGIV for a DCNN for the diagnosis of ASD. Raghavendra et al. [47] designed a novel 18-layer CNN model for the identification of glaucoma using ocular images. For the training of their proposed model, they used a publicly available OD dataset that contains a total of 1426 images, including 589 normal and 837 glaucoma images. They achieved an accuracy of 98.13%.
Ferreira et al. [48] proposed a CNN method for the detection and diagnosis of glaucoma. The proposed CNN model was also used to perform the segmentation of the optic disk. Phylogenetic analysis was utilized to characterize ROIs using texture descriptors. Three databases, including RIM-ONE, DRIONS-DB, and DRISHTI-GS, were used for training and testing the CNN model. Their proposed model outcomes were significant, achieving 100% on all measures (such as recall, specificity, and accuracy) in red channel analysis. Alfifa et al. [49] used a DL architecture with their newly introduced retinal nerve fiber layer (RNFL) to overcome the issue of the shape and size of the optic disk and optic cup. They tested their model on the ORIGA dataset and attained an accuracy of 92.88% with an AUC of 89.34%.
Using a CNN on fundus images, the authors of [50] proposed a two-stage method for OD localization. A semi-automatic ground truth creation strategy was proposed that gives the essential annotations enabling the training of a YOLOv4-based model for autonomous OD localization. They trained their proposed method on the ORIGA dataset for OD localization. They achieved promising results of 87.40%, 89.79%, and 88.70% in accuracy, precision, and recall, respectively. Additionally, one study [51] used OCT images to analyze retinal disorders. Khan et al. [52] designed a CNN model by integrating several optimization methods for the detection of various eye disorders. The performance of the proposed model was tested on several datasets, including ODIR, DR-HAGIS, and IDRiD, and achieved a diagnostic accuracy of 95.5%.
A rule-based NLP model was designed by Wykoff [53] for classifying proliferative diabetic retinopathy (PDR) and non-proliferative diabetic retinopathy (NPDR) severity by using clinical notes. The proposed model achieved notable outcomes such as 98.8% PPV and 90.5% sensitivity. Another study [54] developed a novel model named the novel MTL-based teacher ensemble method based on knowledge distillation for classifying eye diseases. The proposed model was evaluated on a dataset of 7212 labeled and 35,854 unlabeled images across 3502 patients and attained 83% accuracy.
Lu et al. [55] developed a CNN model by combining two deep networks, i.e., ResNet-50 and Vgg-19, for the classification of retinal diseases. The encoder–decoder network model was used to extract the semantic data from OCT images, and the ReLayNet model was used to perform the segmentation of retinal layers from OCT images. Their proposed model obtained the first position in the MICCAI RETOUCH challenge in 2017 on both the segmentation and classification of retinal diseases. For segmenting the retinal layers, the proposed model achieves a dice coefficient of 76.67%, while an AUC of 1.00 was achieved in detecting eye diseases.
Szeskin et al. [56] designed a CNN with a combination of dilated convolution filters to perform the pixelwise classification of OCT scans. The proposed model was tested on 106 clinical OCT scans and yielded an F1-score of 0.78 and an AUC of 0.937 in classifying eye diseases. Another study [57] designed a CNN model and tested it on 1338 retinal glaucoma images. The average scores achieved by the proposed model were 97.04% recall, 98.99% specificity, and 97.20% precision. Devalla et al. [58] designed a novel deep learning network called a dilated residual U-Net (DRU-NET) for segmenting glaucoma. The proposed model achieves a notable outcome of the dice coefficient, which was 0.91 ± 0.05 in the detection of glaucoma disease.
Arslan et al. [59] proposed two CNN models for segmentation by combining SSF-Net and TSF-Net. The performance of the model was evaluated on an open dataset, named Retinal Images for Pigment Signs. The proposed model was executed for up to 4-fold cross-validation. The results reveal that SSF-Net and TSF-Net show significant results for the screening and analysis of retinal diseases. Haider et al. [60] designed two models, SLS-Net and SLSR-Net, for the pixelwise segmentation of an optic cup and optic disk for the identification of glaucoma. They trained and tested their proposed network on four datasets and achieved remarkable outcomes in segmenting the ODs. Furthermore, another study [61] also developed two networks named ESS-Net and FBSS-Net for the segmentation of OD and OC for glaucoma detection and achieved good results.
Table 1. Recent studies that used deep learning models for the classification of ODs.
RefYearMethodDataset NameNo of DiseasesOutcomes
Lenka et al. [62]2025GCNDRISTHI-GS02Accuracy = 97.43%
Hu et al. [63]2025FundusNetUKBB and EyePACS02AUC = 77.00%
Kansal et al. [64]2025TL + LDA + BiLSTMODIR08Accuracy 98.04%
Butt et al. [65]2025CNNDDR05Accuracy = 95.92%
Nguyen et al. [66]2024ResNet-152Eye diseases using UFI02Accuracy = 96.47%
Li et al. [67]2024CNNTRIPOD02Accuracy = 92.04%
Al-Fahdawi et al. [68]2024HRNetOIA-ODIR08Accuracy = 88.56%
Hussain et al. [69]2024CNNOHD02Accuracy = 96.15%
Hemelings et al. [70]2023CNNAIROGS02Accuracy = 85.84%
Sengar et al. [71]2023CNNRFMiD02Accuracy = 90.02%
Thanki [72]2023DCNNDRISTHI-GS02Accuracy = 75.30%
Nazir et al. [73]2021CNNEYEPACS datasets02Accuracy = 97.13%
Bodapati et al [74]2021DCNNAPTOS 201901Accuracy = 84.31%
Khan et al. [75]2021VGG-19APTOS 201904Accuracy = 97.47%
Sarki et al. [76]2021CNNMessidor-201Accuracy = 81.33%
Pahuja et al. [77]2022SVM and CNNAPTOS 201902Accuracy = 85.42%
Vidivelli et al. [78]2025CNNODIR05Accuracy = 89.64%
Farag et al. [79]2022CBAMAPTOS 201902Accuracy = 93.45%
Vives et al. [80]2021CNNAPTOS 201902Accuracy = 94.54%
Zhang et al. [81]2022CNNAPTOS 201902Accuracy = 96.15%
Gangwar et al. [82]2021ResNet-50APTOS 201902Accuracy = 92.39%
In previous studies [2,4,9,16,32,33,34,35,36], we observed several limitations, as some studies [62,63,64,65,66,67,68] focused on binary classification, determining whether ODs were present or not. However, a few studies [75,77] addressed multiple ODs but did not achieve satisfactory results. A major reason for this was that the dataset of OD images used by these studies was insufficient and imbalanced. Additionally, large pre-trained models were used by prior studies [72,73,74,77,78,79,80,81,82,83], which led to the issue of gradient vanishing, affecting classification accuracy. To address these challenges, we proposed the ODDM. In this model, we used SM-TOM to balance the imbalanced classes. Additionally, we simplified the ODDM to reduce the number of trainable parameters, which will improve the classification results significantly.

3. Materials and Methods

This section presents the experimental methodology for the evaluation of the ODDM with baseline models.

3.1. Workflow of ODDM for Classification of ODs

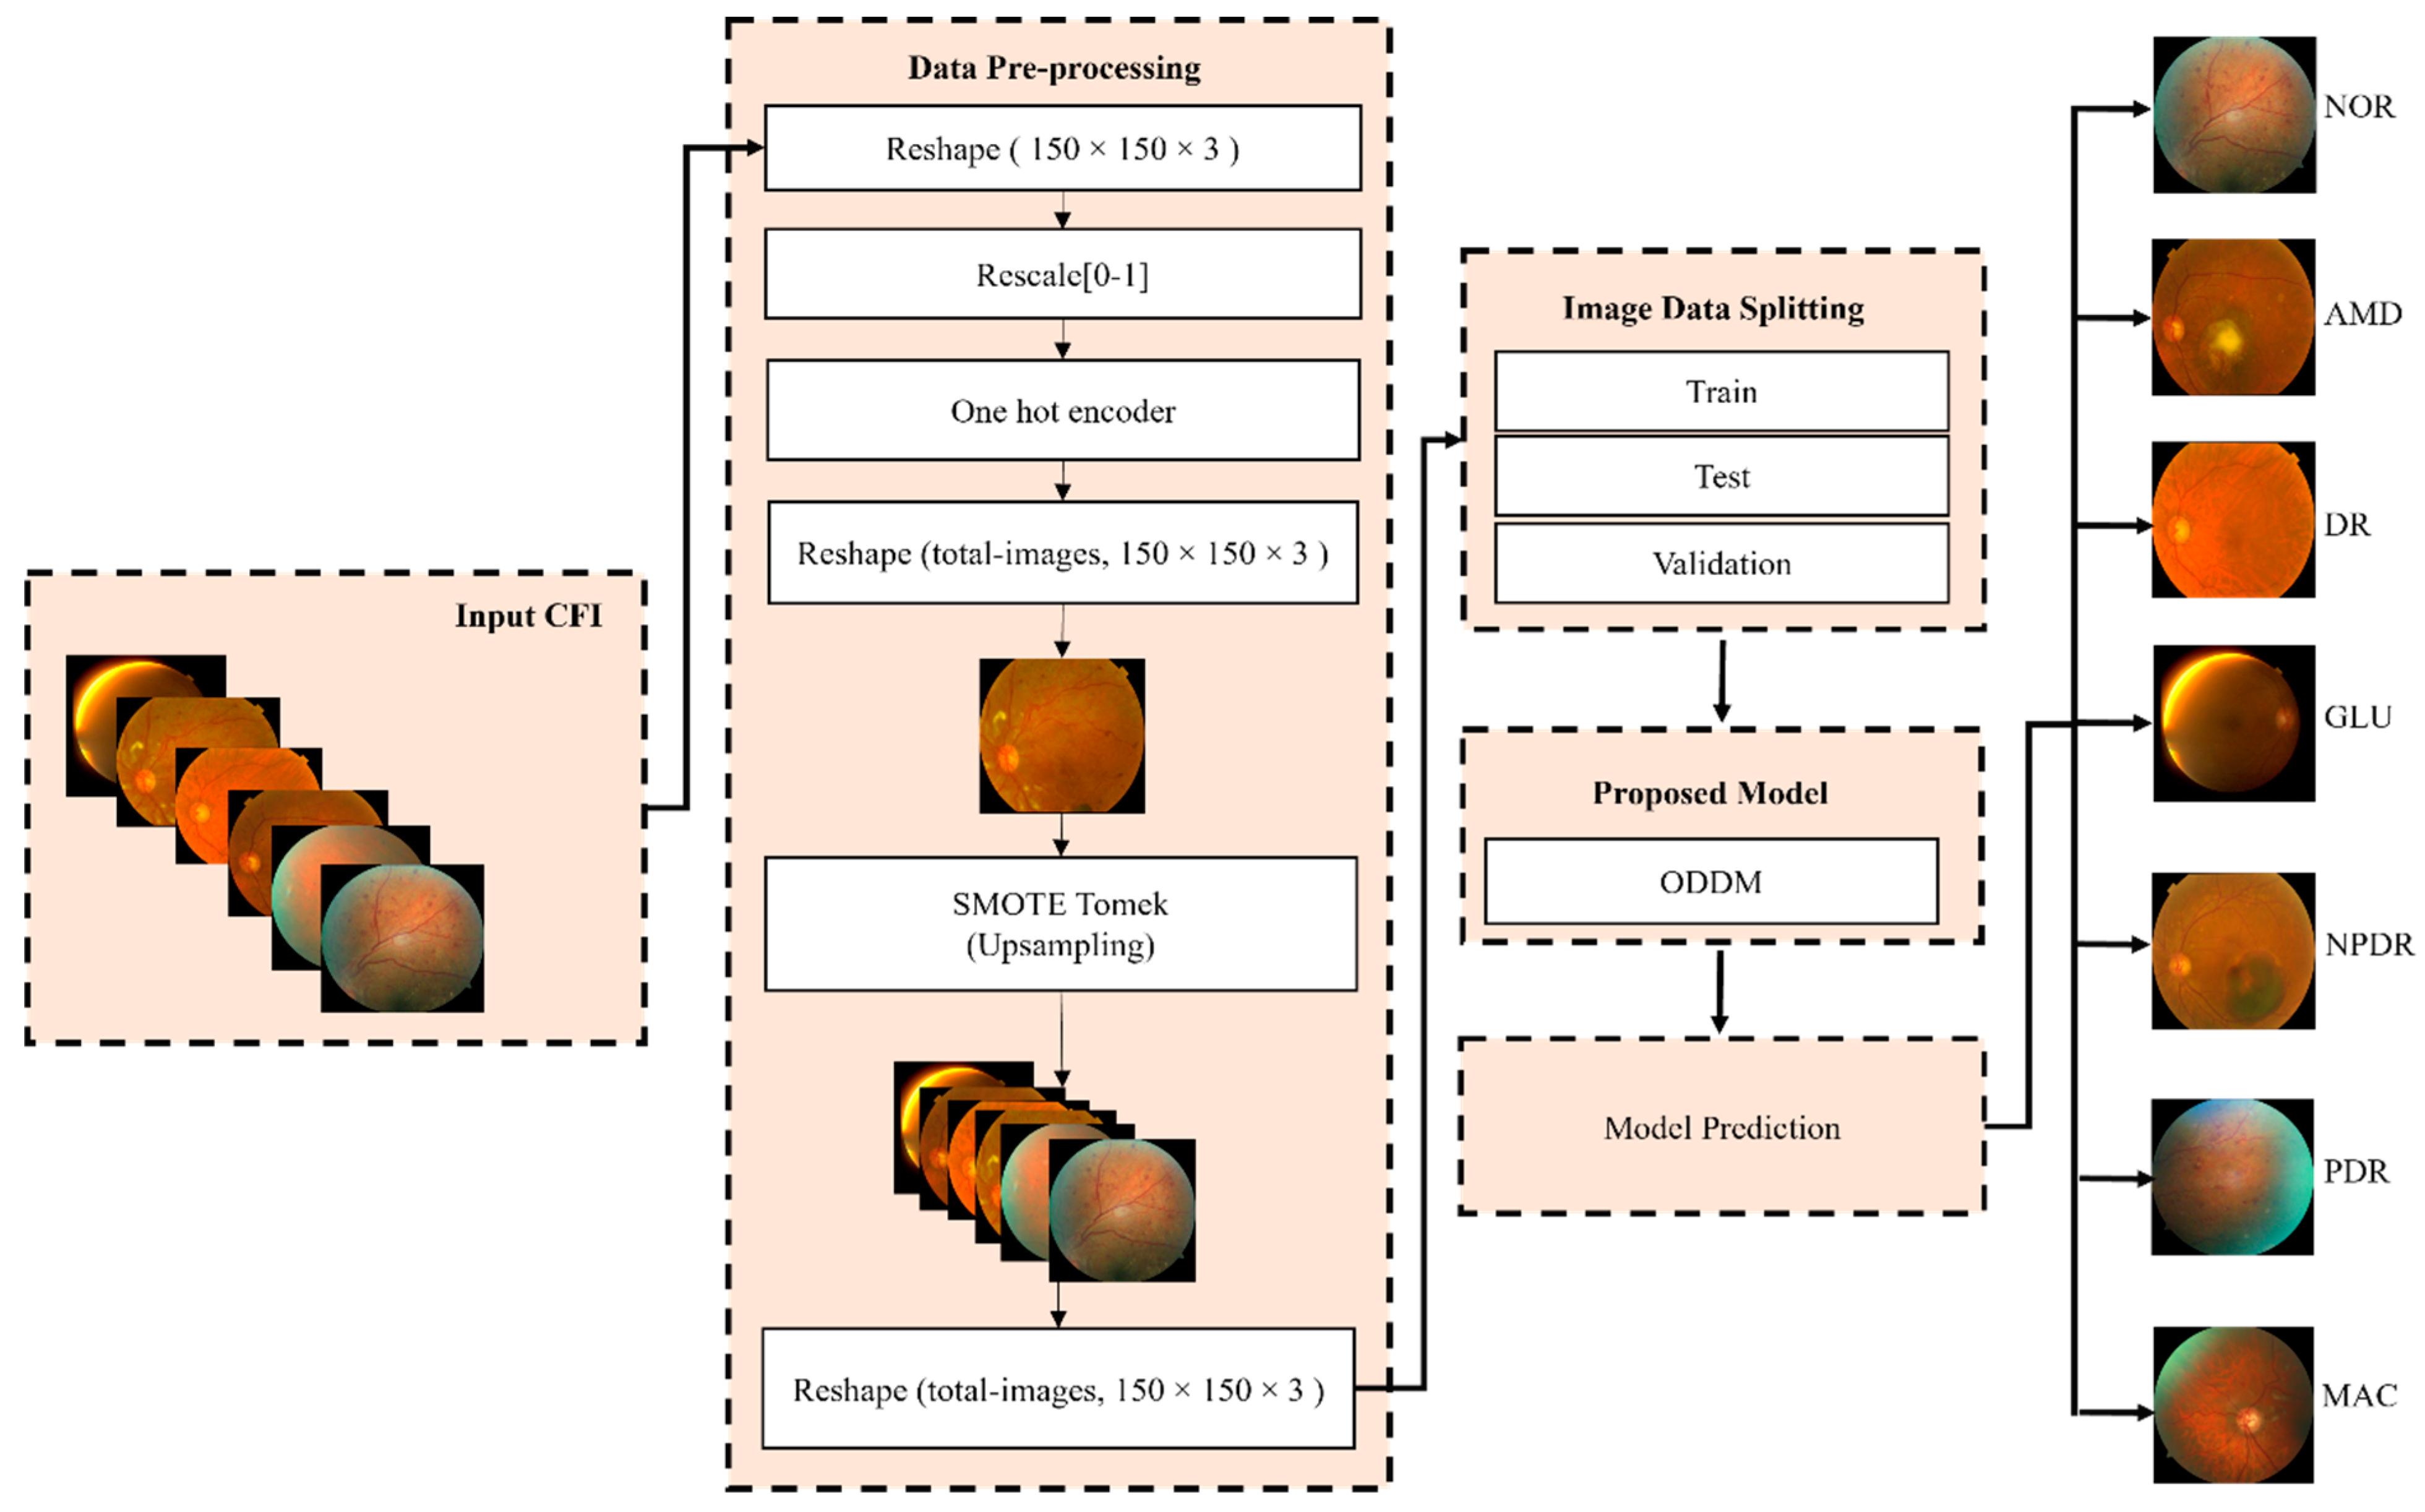
Diabetes is a major factor in infections of the human eyes. Fundus images are used by researchers to diagnose ODs. The early detection of ODs can protect patients from severe eye complications or blindness. Several studies [81,82,83] used DL algorithms to enhance the accuracy of the detection of ODs. The development of AI and image processing has directly contributed to the substantial transformation that has taken place in the field of medical imaging [84,85,86]. Thus, this study designs an ODDM based on DL for the classification of seven different types of ODs, including NOR, AMD, DR, GL, MP, NPDR, and PDR, using CFIs. We fixed the size of the input CFI to 150 × 150 × 3 to reduce the computational cost. Additionally, data normalization and SM-TOM methods were used to protect the ODDM from overfitting and resolve the issue of an unequal distribution of CFI samples within each class of the dataset [72]. The OD dataset was divided into 4-fold cross-validation sets for training, validation, and testing. The proposed ODDM and seven baseline models were executed up to 30 epochs, and the value of the learning rate is 0.00001. The reason for executing the models up to 30 epochs is that we used early stopping for every 5 epochs and examined the results to ensure that the model remained safe from overfitting. In addition to that, we changed the learning rate whenever the model was overfitted. We trained the model for 50 epochs, but the model’s performance converged, and training more would not significantly improve the results after 30 epochs. The classification performance of the proposed ODDM and other models was compared in terms of many metrics, such as accuracy, loss, precision, recall, area under the curve (AUC), and F1-score. A GRAD-CAM heatmap was produced by using the ODDM to visualize ODs. Figure 2 presents the proposed framework used for the classification of ODs.

3.2. Dataset Description

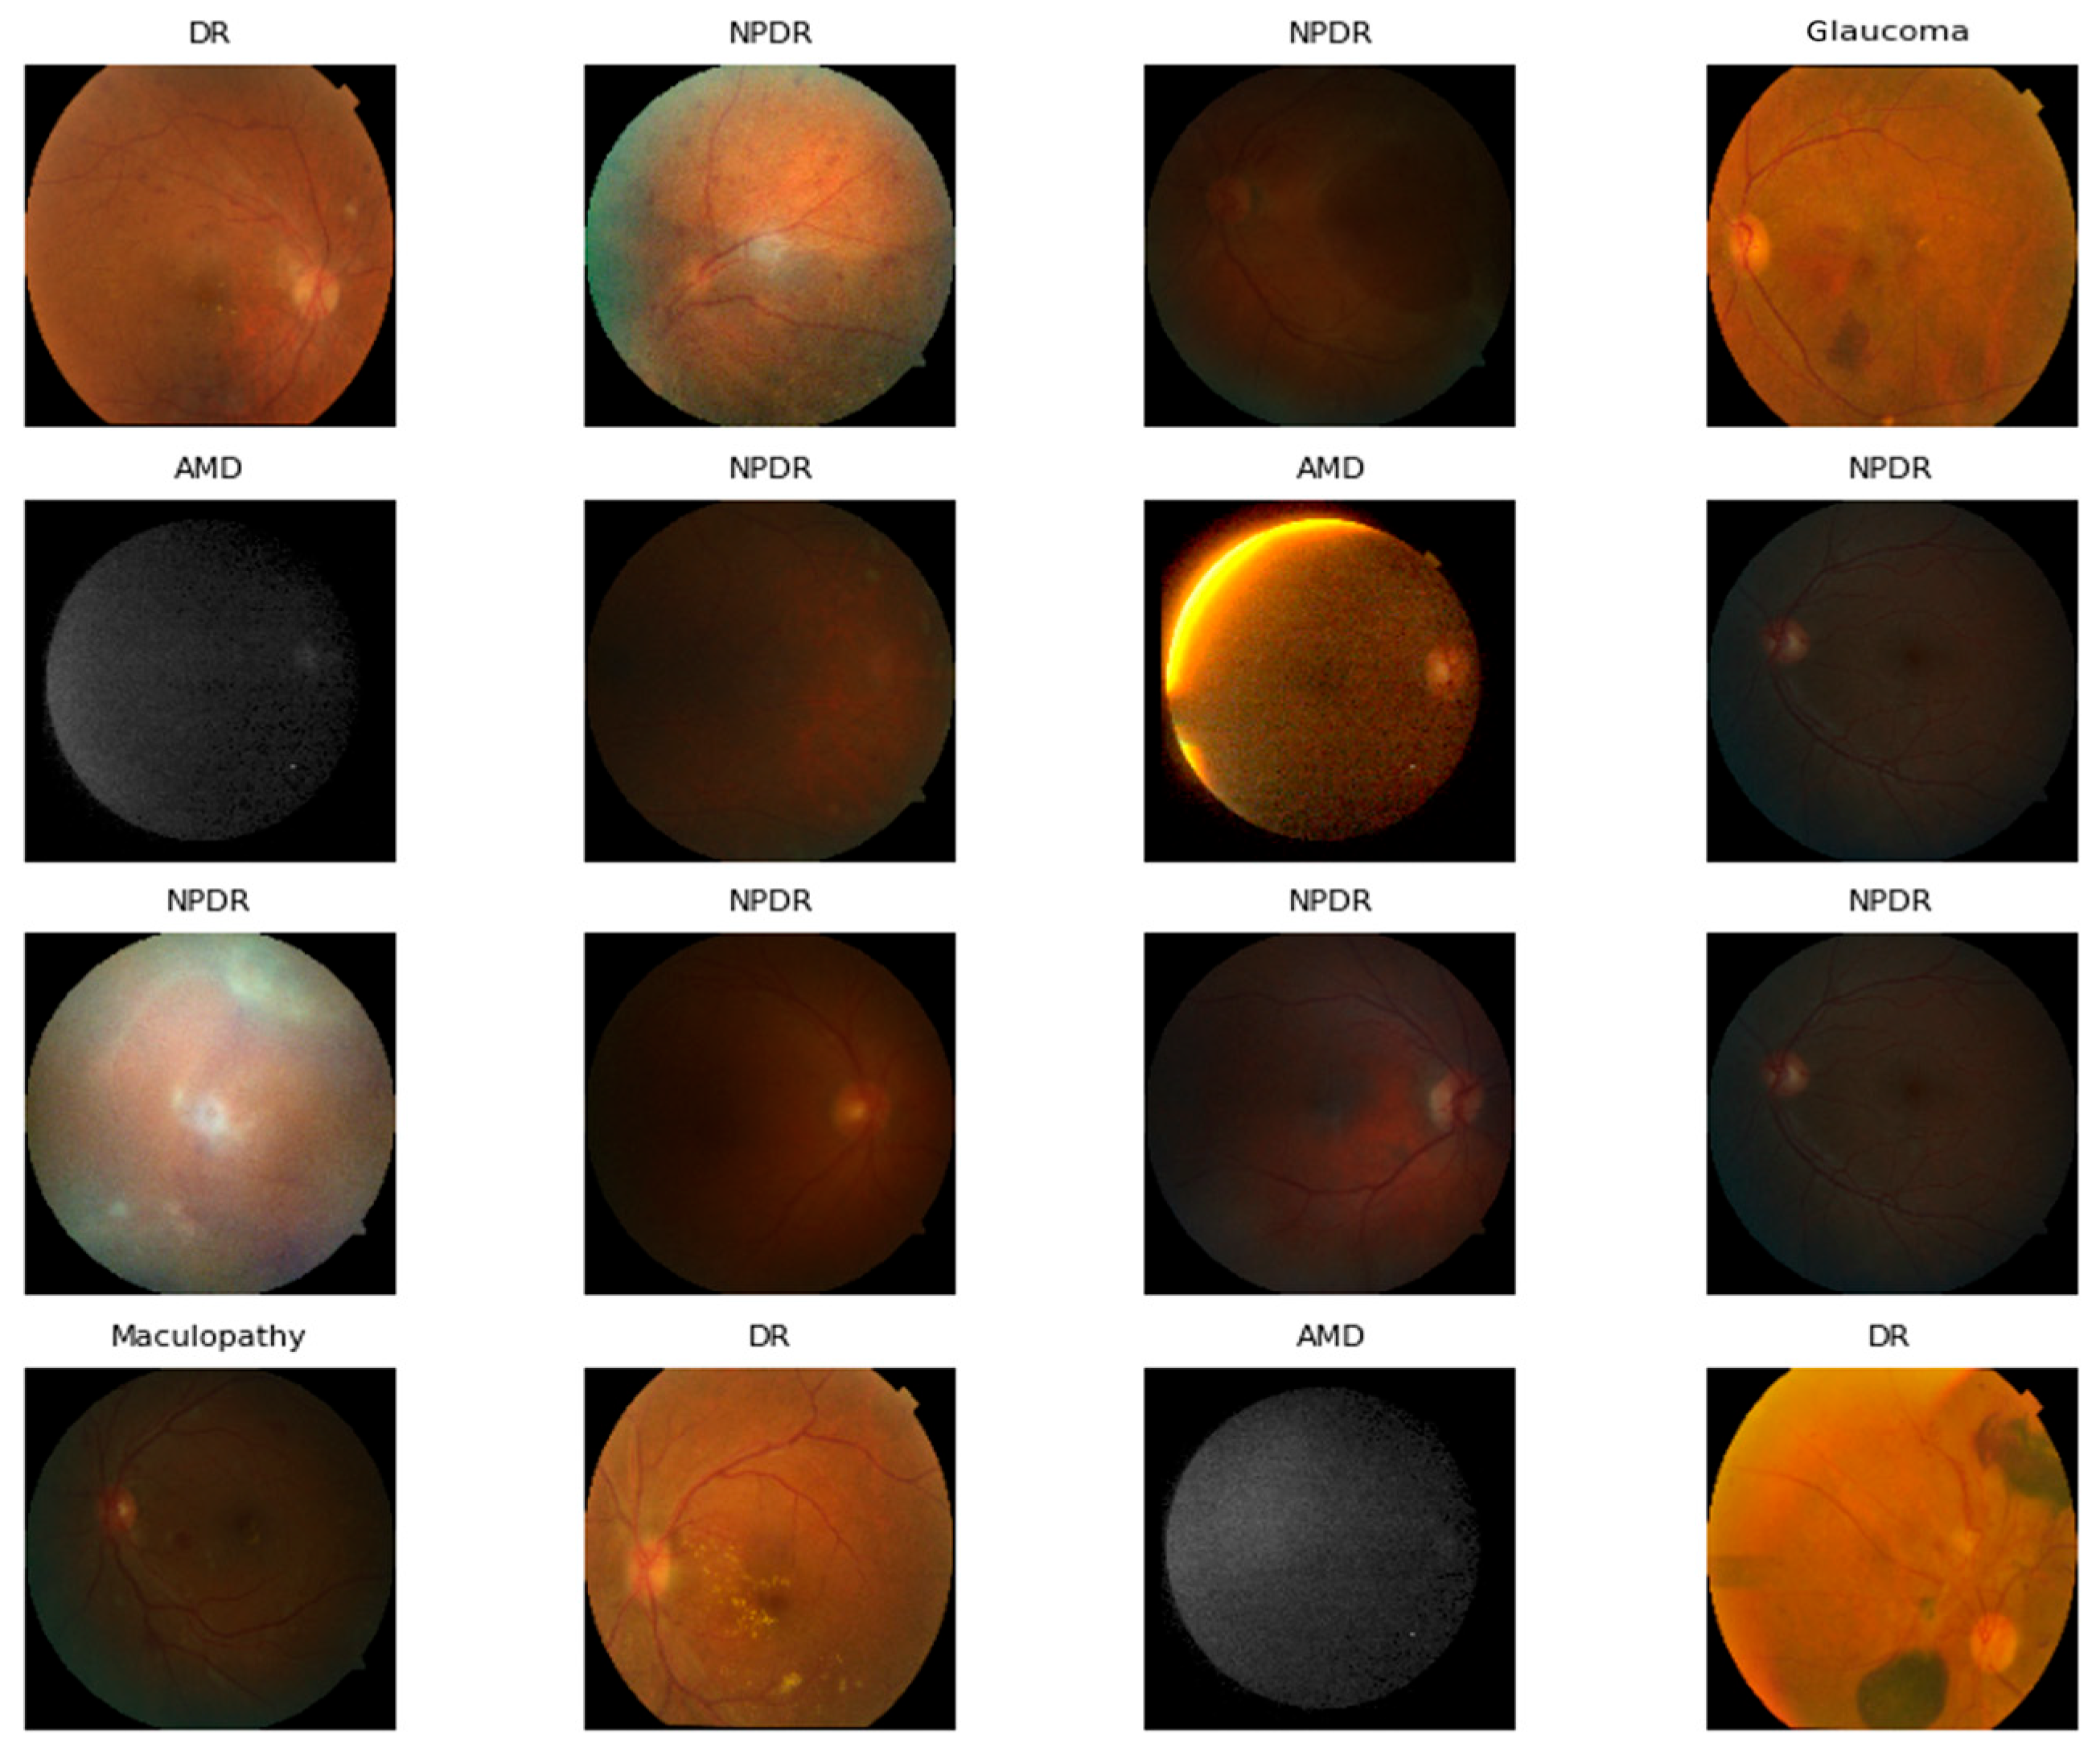
In this study, we used the OD dataset created by Cen et al. [25]. This dataset contains CFIs, which correspond to several different ODs from the Joint Shantou International Eye Center (JSIEC), Shantou City, Guangdong Province, China. A total of 2572 images, including 273 CFIs of AMD, 318 CFIs of DR, 270 CFIs of MAC, 368 CFIs of NPDR, 576 CFIs of NOR, 404 CFIs of PDR, and 363 CFIs of GLU, were used to evaluate the proposed ODDM to classify these diseases. Table 2 presents a detailed summary of the dataset. Additionally, Figure 3 depicts sample images of ODs.

3.3. Handling Imbalanced Classes of OD Dataset Using SM-TOM

The dataset used in this study has an imbalanced number of OD images. Several studies [87,88,89,90] conclude that imbalanced datasets can affect the training of the model. Therefore, we applied SM-TOM to balance the OD dataset. The SMOTE oversampling approach was designed by Chawla et al. [89]. The contrasting random sampling method only duplicates the random images from the minority class. SMOTE generates CFIs based on the Euclidean distance of each minority class data point, and Tomek is the modified form of the condensed nearest neighbor, which is also used for increasing the number of image samples of the minority class. We also set the K-nearest neighbors (K = 5) for SM-TOM. This study combines SM-TOM to generate different synthetic images from the original image data, as depicted in Figure 4. Additionally, the pseudocode of the proposed SM-TOM is outlined in Algorithm 1. A detailed summary of the OD dataset after applying SM-TOM is presented in Table 3.
Algorithm 1: SMOTE Tomek algorithm for increasing the number of CFI of the minority class.
Input :   S   Set   for   training ,   M   instances   of   minority   set ,   U   No   of   nearest   neighbors , C Quantity of synthetic CFI images to compensate the original CFI in the minority classes of ODs.
Output :   A   group   of   synthetic   samples   from   the   minority :   O ˈ
1 :   S T =   ɸ      / /   S T  is a collection of samples that are generated using Smote Tomek.
2 :   For   all   O i   in   O   do:
                                              N o i     k   nearest   neighbors   of   O i   in   S
                                              n     the   number   of   samples   in   N o i   and not in O
                                              if   k / 2     n   < k   then                                                       / / o i   is a borderline sample.
                                              add   o i   t o   S T
                    End if
End
3 :   O ˈ =   ɸ                                               / / O ˈ   is a set containing synthetic samples.
4: For all     s t ʹ i   in   S T   do:
             For   i = 1   t o   C   do:
                              o  ← choose a random sample from N s t i
                              s t ʹ i  ←  s t ʹ i   + j * ( s t ʹ i o )  is a random number in (0, 1), s t ʹ i is a synthetic CFI.
                      add s t ʹ i   to O ˈ
                      End For
End For
5: O ˈ   =   O   U   O ˈ
6 :             return O ˈ

3.4. K-Fold Cross-Validation

For this study, we applied K-fold Validation (CV) where K = 4. In 4-fold CV, the ODDM was trained on three folds and tested on one independent fold. Additionally, the ODs used in the testing fold were not utilized in the testing phase. A detailed summary of the dataset after applying SM-TOM with 4-fold CV is presented in Table 4.

3.5. Proposed ODDM

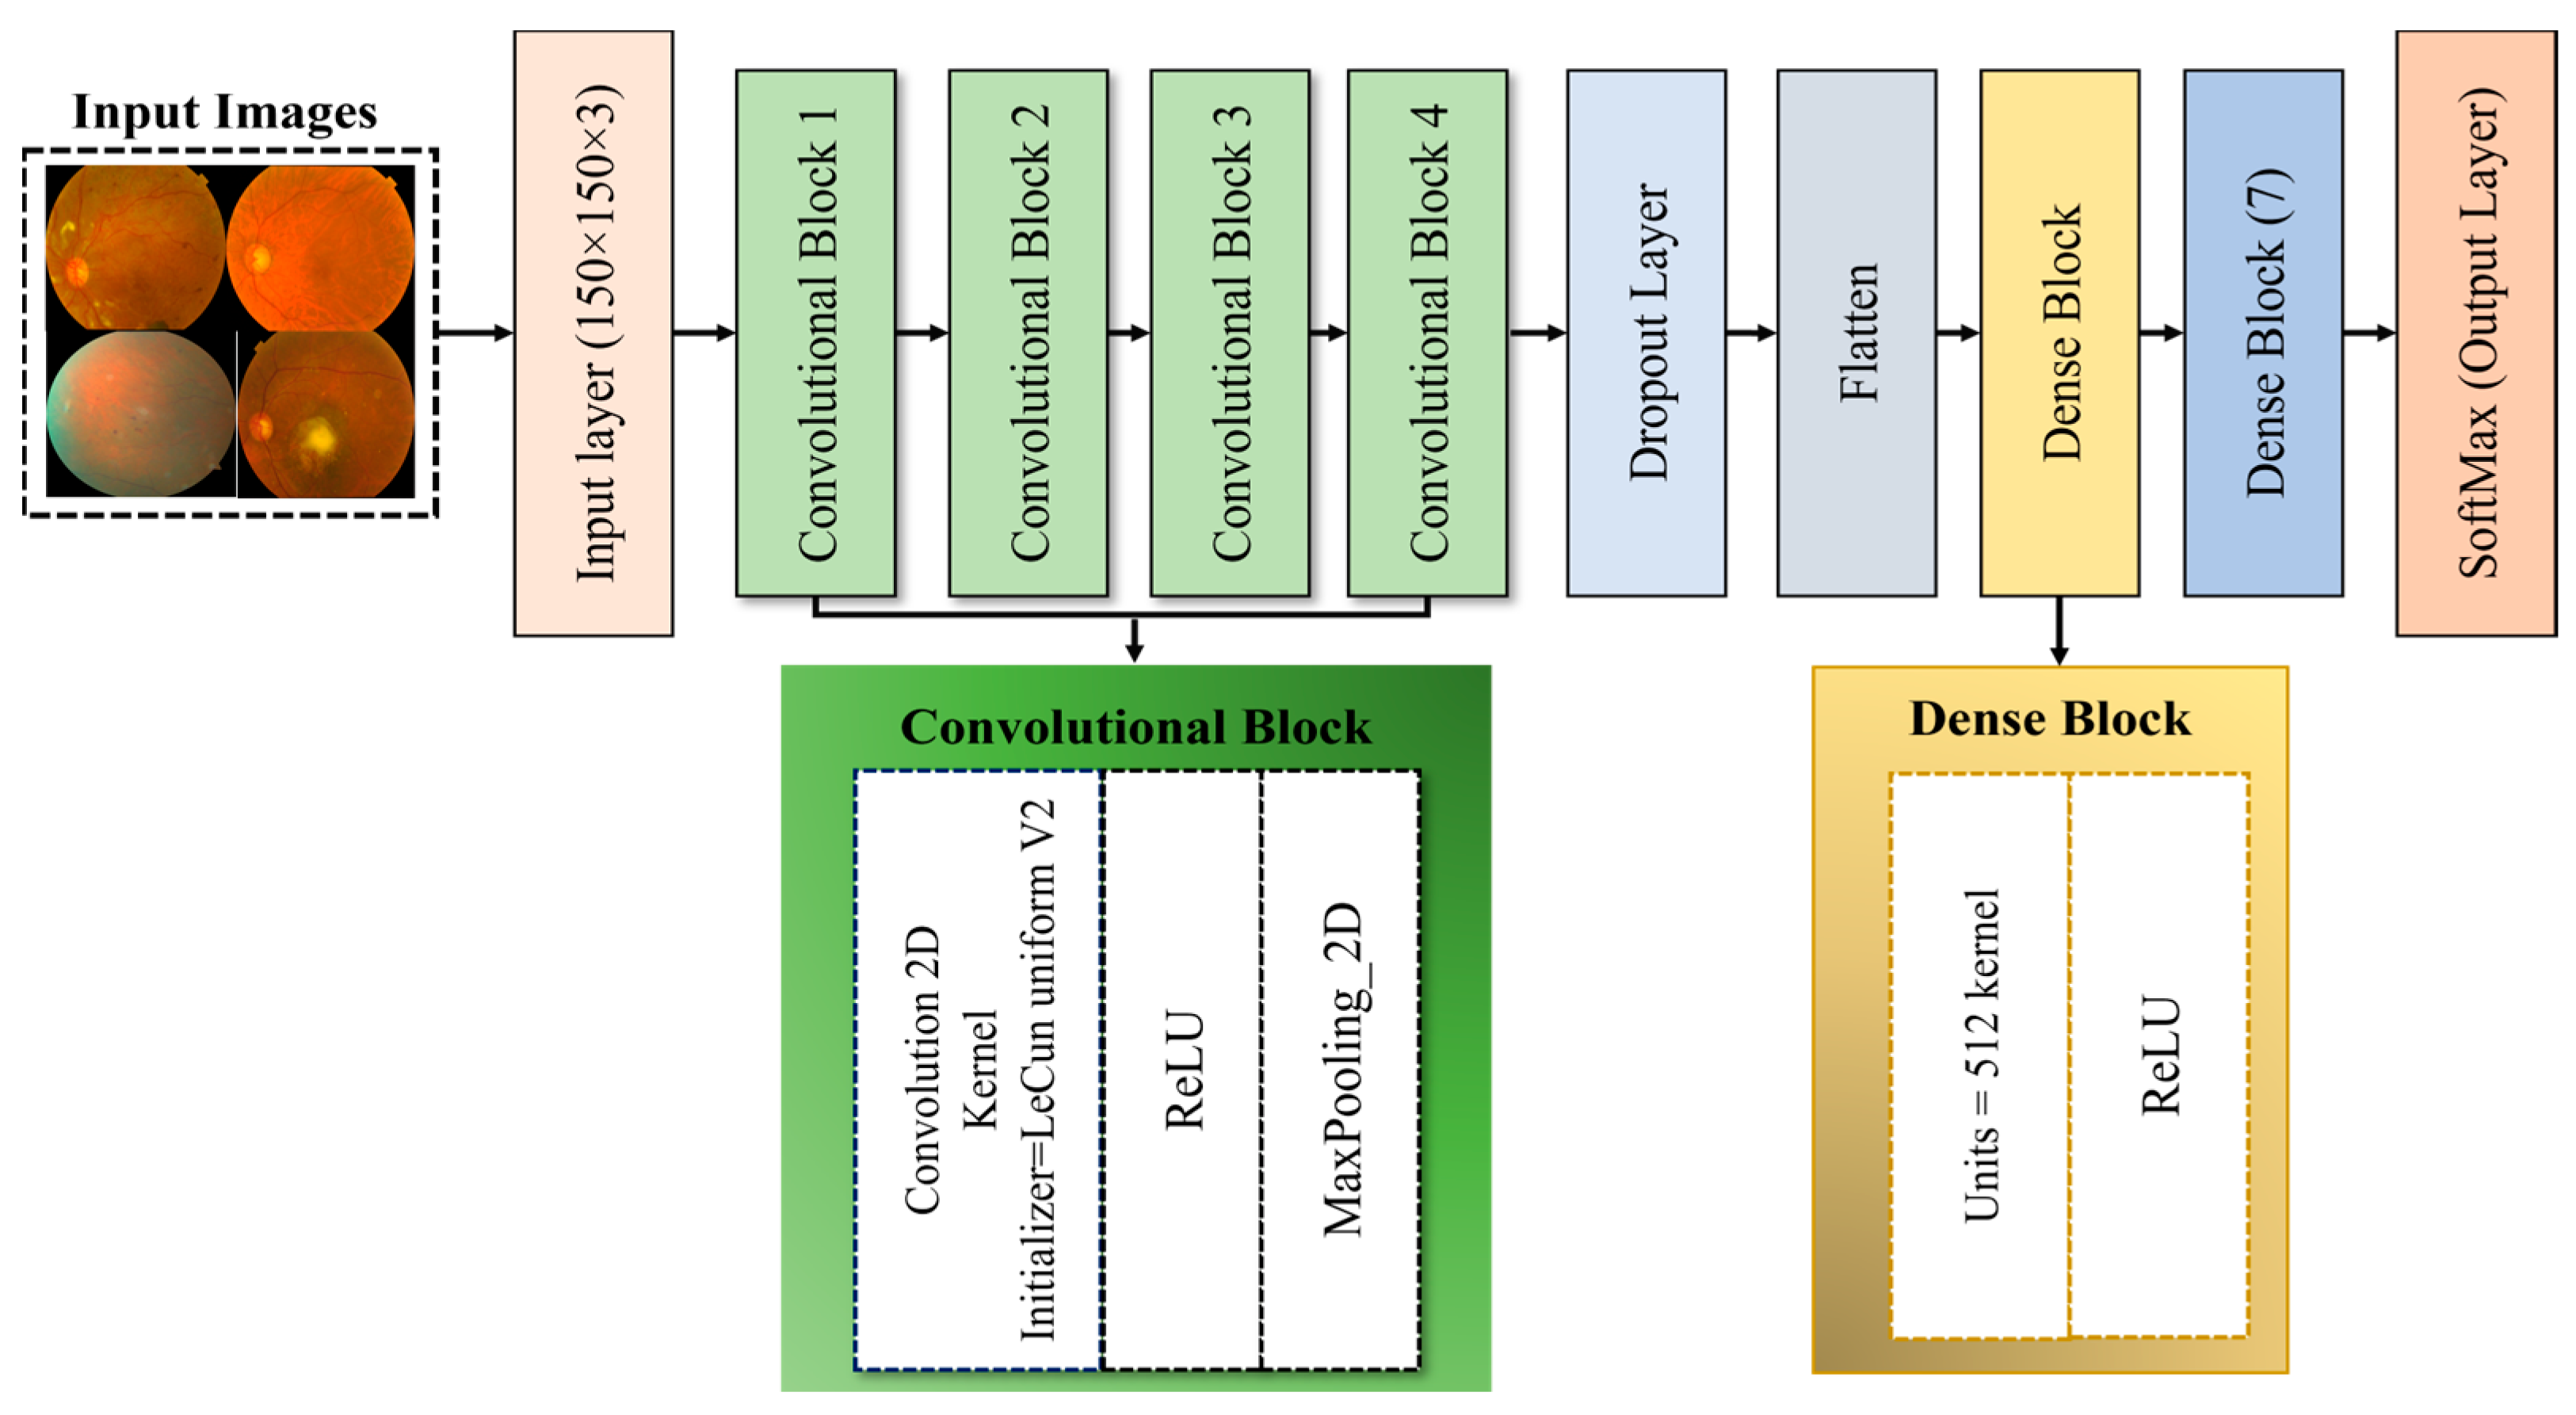
DL methods have widely been used by recent studies [88,89,90] for the diagnosis of several diseases, such as skin cancer [91], COVID-19 [92], breast cancer [93,94,95], etc. This study designs a custom model named the OD detection model (ODDM), which is based on a CNN. The purpose of the ODDM is to classify seven ODs, including NOR, AMD, DR, GLU, MAC, NPDR, and PDR, using CFIs. The proposed ODDM consists of five convolutional blocks (ConvL_Bs), non-linear activation functions (N_LAFs), fully connected layers (FCLs), a dropout layer (D_PL), and dense layer blocks (D_LB). Each ConvL_B takes three steps (i.e., convolution2D (Conv_2D), ReLU, and max pooling (M_PL)) to complete the process. Additionally, D_LB is based on units of 512 kernels and the ReLU function. The proposed ODDM is illustrated in Figure 5. Table 5 presents a detailed summary of the proposed ODDM and its training parameters.

3.5.1. ConvL_Bs of ODDM

The primary element of the proposed ODDM consists of three steps: (a) kernel-based convolution, (b) stacking, and (c) the use of N_LAFs to complete the process. Therefore, the LecunUniformV2 initializer was used to assign the kernel. For this study, we fixed the input image to 150 × 150 × 3 and set the kernel size to 5 × 5.
Consider the input matrix I M , kernels K u , l   [ 1 , , L ] , and an output O , (here output O means the output of the entire three-step process). For an individual kernel K u , the convolution output is calculated by using Equation (1).
Step   1 :   f l = I M     K u ,   l   [ 1 , , L ]
where represents a convolution operation. Then, all f l matrixes are stacked into a three-dimensional matrix M , as discussed in Equation (2).
Step   2 :   M = [ f 1 , , f ( L ) ]
Finally, the matrix M is passed into the N_LAFs and outputs the final matrix.
Step   3 :   O = N _ L A F ( M )
This study computes the sizes A of three main components (input, kernel, and output), as described in Equation (4).
A y =           W I     × H I × C I                                                                                   y = I M               W K × H K × C K             y = K u ,   l   [ 1 , , L ]                           W j × H j × C j                                                                                       y = J  
The above-mentioned triple elements ( W I ,   H I ,   C I ) represent the size of the width, height, and channels of the matrix, respectively [30]. The subscripts I ,   K , and J represent input, kernel, and output, respectively. L denotes the total number of filters. Note that C I = C K , which means that the channel of input C I should equal the channel of the kernel C K . Supposing that these filters move with the padding of n p and stride of n s , we can obtain the sizes ( W j × H j   × C j ) of output matrix J , as presented in Equation (5).
W J = 1 + 2 × n p + W I W K n s H J = 1 + ( 2 × n p + H I H K ) n s C J = L
Here the channel of output C J should equal the number of filters L .

3.5.2. Flatten Layer

For this study, we place the flattened layer (F_LT) between ConvL_B and D_LB. The purpose of the F_LT layer is to convert 2D data into a 1D array, and then this data is provided to the FCL of the proposed ODDM. The purpose of using the F_LT layer in the ODDM is to flatten the spatial dimension data of the CFI. Equation (6) is used to perform the F_LT process.
F F _ L T = F l a t t e n   ( A y )

3.5.3. D_LB of Proposed ODDM

The N_LAFs are used in D_LB, and details about them are presented below. For this study, we used ReLU as N_LAF, which is represented by P . Supposing that R S T is the entry of the matrix M , we used Equations (7) and (8) to perform ReLU operations.
P R e L U R S T = R e L U ( R S T )
R e L U ( R S T ) = m a x   ( 0 , R S T )
The dense layer takes in a single matrix and produces results based on that matrix’s attributes. Using a dense layer, the output of the proposed ODDM involves classifying the data into their respective classes. Therefore, the SoftMax activation method is used in the dense layer for this classification. SoftMax is a probability-based activation function where the total number of classes is equal to the number of neurons. For this study, the number of classes and neurons is 7.
Equation (9) is used to perform the SoftMax operation.
S i = e R S T i j n e R S T j
Additionally, the proposed ODDM contains a total of 1,091,495 parameters, of which 1,091,495 are trainable parameters, and none of the parameters are non-trainable.

3.6. Performance Evaluation

The performance of the proposed ODDM was measured by using a confusion matrix. For this study, 4-fold cross-validation was used for the training and validation of the proposed ODDM and baseline models. The proposed ODDM and baseline models were evaluated in terms of several metrics, as discussed in Equations (10)–(14).
A c c u r a c y = T P + T N T P + F N + F P + T N
P r e c i s i o n = T P T P + F P
R e c a l l = T P T P + F N
F 1 S c o r e = 2 × P r e c i s i o n × R e c a l l P r e c i s i o n + R e c a l l
M C C = T P × T N F P × F N ( T P + F P ) ( T P + F N ) ( T N + F P ) ( T N + F N )

3.7. ANOVA and Tukey’s HSD Post Hoc Test

For this study, an ANOVA (analysis of variance) [95] test is applied to determine the statistically significant difference between the proposed ODDM and seven models, including the R1, R2, R3, R4, R5, R6, and R7 models. However, the ANOVA test only presents the difference that exists in the models, not where the difference lies. Therefore, Tukey’s HSD post hoc [96] test is also used to compare the models pairwise. This study considers two hypotheses: (1) the Null Hypothesis (H0) and (2) Alternative Hypothesis (H1). H0 indicates that there is no significant difference in the accuracy obtained by the proposed ODDM and other baseline models. Additionally, H1 suggests that at least one model has a significant difference compared to other models in terms of accuracy.

3.8. Proposed Algorithm

In this study, the pseudocode of the proposed ODDM is presented in Algorithm 2. The structure of Algorithm 2 is divided into 05 sections, namely Z 1 , Z 2 , Z 3 , Z 4 , Z 5 . The pre-processing of the CFIs of ODs is discussed in Z 1 . The process of balancing the size of the CFIs by using the SM-TOM method is presented in Z 2 . The architecture of the proposed ODDM is provided in Z 3 . After enhancing the size of the CFI dataset, the training and validation process of the proposed ODDM is discussed in Z 4 . Finally, the performance of the proposed ODDM is computed in Z 5 .
Algorithm 2:Classification of ocular diseases using CFI.
Input: A 1 = CFI
Output:Ocular Diseases Classification
PRE-PROCESSING: Z1
1 Z 1 : A 1 A 3
2 R e s c a l e   I m a g e :   A 1 A 2
3 N o r m a l i z a t i o n :   A 2 A 3
SYNTHETIC IMAGES USING SM-TOM: Z2
4 A 3 See Algorithm (1)
PROPOSED ODDM MODEL: Z3
5 Z 3 O 1 :
         For i in O 1 :
                       Add Conv_2D in O 1  See Equation (5)
                       Add ReLU in O 1  See Equations (7) and (8)
                       Add M_PL in O 1  See Equations (1)–(4)
         End
Add F_LT in Z 3  See Equation (6)
Add D_BL in Z 3
         For j in D_BL:
                       Add ReLU in D_BL See Equations (7) and (8)
                       Add SoftMax in D_BL See Equation (9)
         End
End
TRAINING & VALIDATION SPLIT FOR ODDM MODEL: Z4
6Training set: A T r a i n _ O D _ C F I i , Validation set: A V a l _ O D _ C F I i
7For f = 1 : | A T r a i n _ O D _ C F I i on A3
8               Training Image: A T r a i n _ O D _ C F I i , r
9                               A T r a i n _ O D _ C F I r : training CFI image in epoch runs (r)
10                               A T r a i n _ O D _ C F I r     A T r a i n _ O D _ C F I i , r
11End
12 P r e d   t ,   u = p r e d i c t   [ H t , u ,     A T r a i n _ O D _ C F I i   ]
PERFORMANCE EVALUATION PARAMETERS: Z5
13For Z = 1:5% Z represents the no. of performance evaluators.
               Parameters: P m t , u  See Equations (10)–(14)
End
14Select Best Model B ( P m ) in terms of Z
15End

4. Results and Discussions

This section presents the comprehensive outcomes obtained by using the proposed ODDM with and without SM-TOM and other baseline models such as R1, R2, R3, R4, R5, R6, and R7.

4.1. Experimental Setups and Hyperparameters of Proposed ODDM and Baseline Models

In this study, TensorFlow (TF) v2.16.1 was used for the implementation of the proposed ODDM and baseline models. Additionally, the Keras library was also used with TF to perform the backend process and execution of the proposed ODDM. The imbalanced-learn library v0.12.3 was used for the implementation of the SM-TOM method. For this work, the operations that are not associated with neural networks were programmed using the Python language version 3.13.0. The entire experiment was executed on a workstation equipped with a Windows 10 operating system, which has specifications including a Core i8 processor of the 11th generation, 32 GB of RAM, and an 11 GB NVIDIA GPU. Table 6 presents the hyperparameters that are used to fine-tune the proposed ODDM.

4.2. Results of Proposed ODDM and Baseline Models

The performance of the proposed ODDM with and without using SM-TOM is compared with baseline models in classifying ODs using CFIs. Additionally, the comprehensive results obtained by using the proposed ODDM are shown in Table 7.

4.2.1. Results of Proposed ODDM in Terms of Accuracy

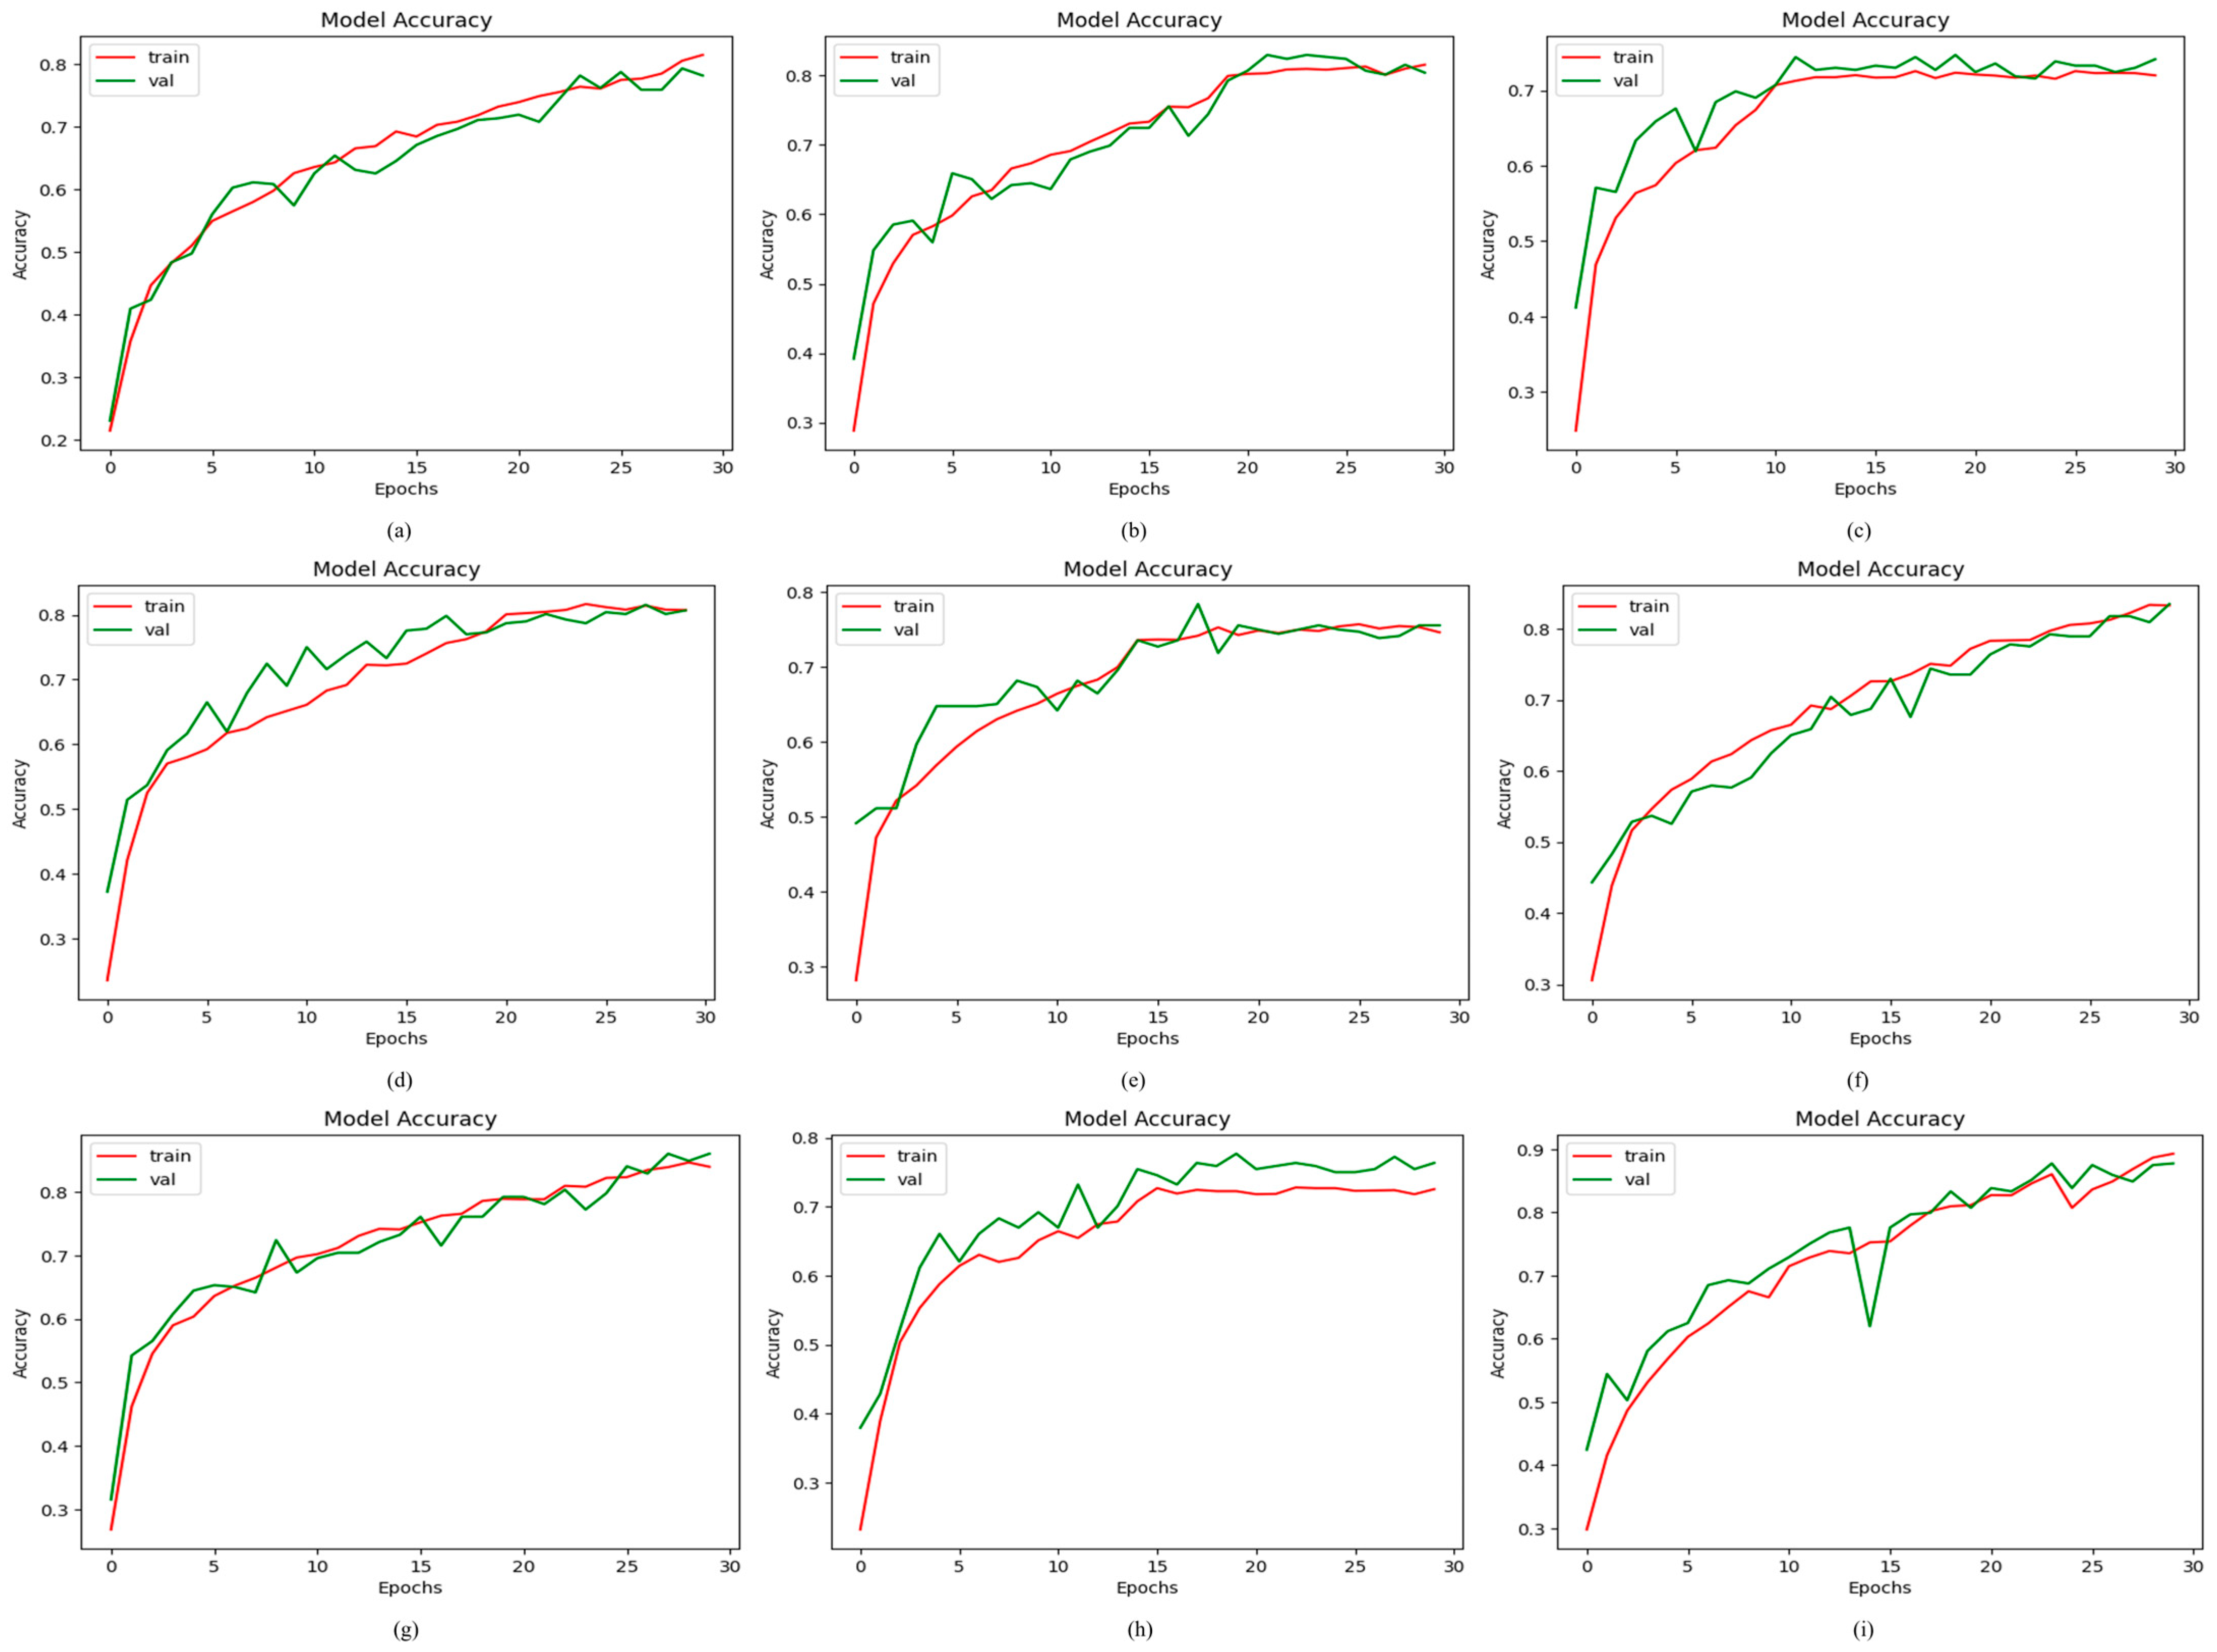
From Table 7, it is observed that the proposed ODDM with SM-TOM achieves the highest classification accuracy of 97.19% (95% CI (Confidence Interval): 95.50–98.80%), precision of 95.23%, recall of 88.74%, F1-score of 88.31%, and AUC of 98.94%. The models R5 and R6 achieve a classification accuracy of 73.33% (95% CI: 68.91–77.81%) and 85.14% (95% CI: 81.60–88.70%), respectively. The lowest result obtained by R3 in terms of accuracy is 73.13% (95% CI: 68.70–77.60%). Additionally, R2 and R7 achieve a classification accuracy of 80.80% (95% CI: 76.80–84.40%) and 83.15% (95% CI: 79.40–87.00%), respectively. Furthermore, the proposed model without SM-TOM attains a classification accuracy of 77.15% and an F1-score of 75.12%. Figure 6 presents the graphical representation attained by using the proposed ODDM and other models in terms of accuracy.

4.2.2. Results of Proposed ODDM in Terms of AUC

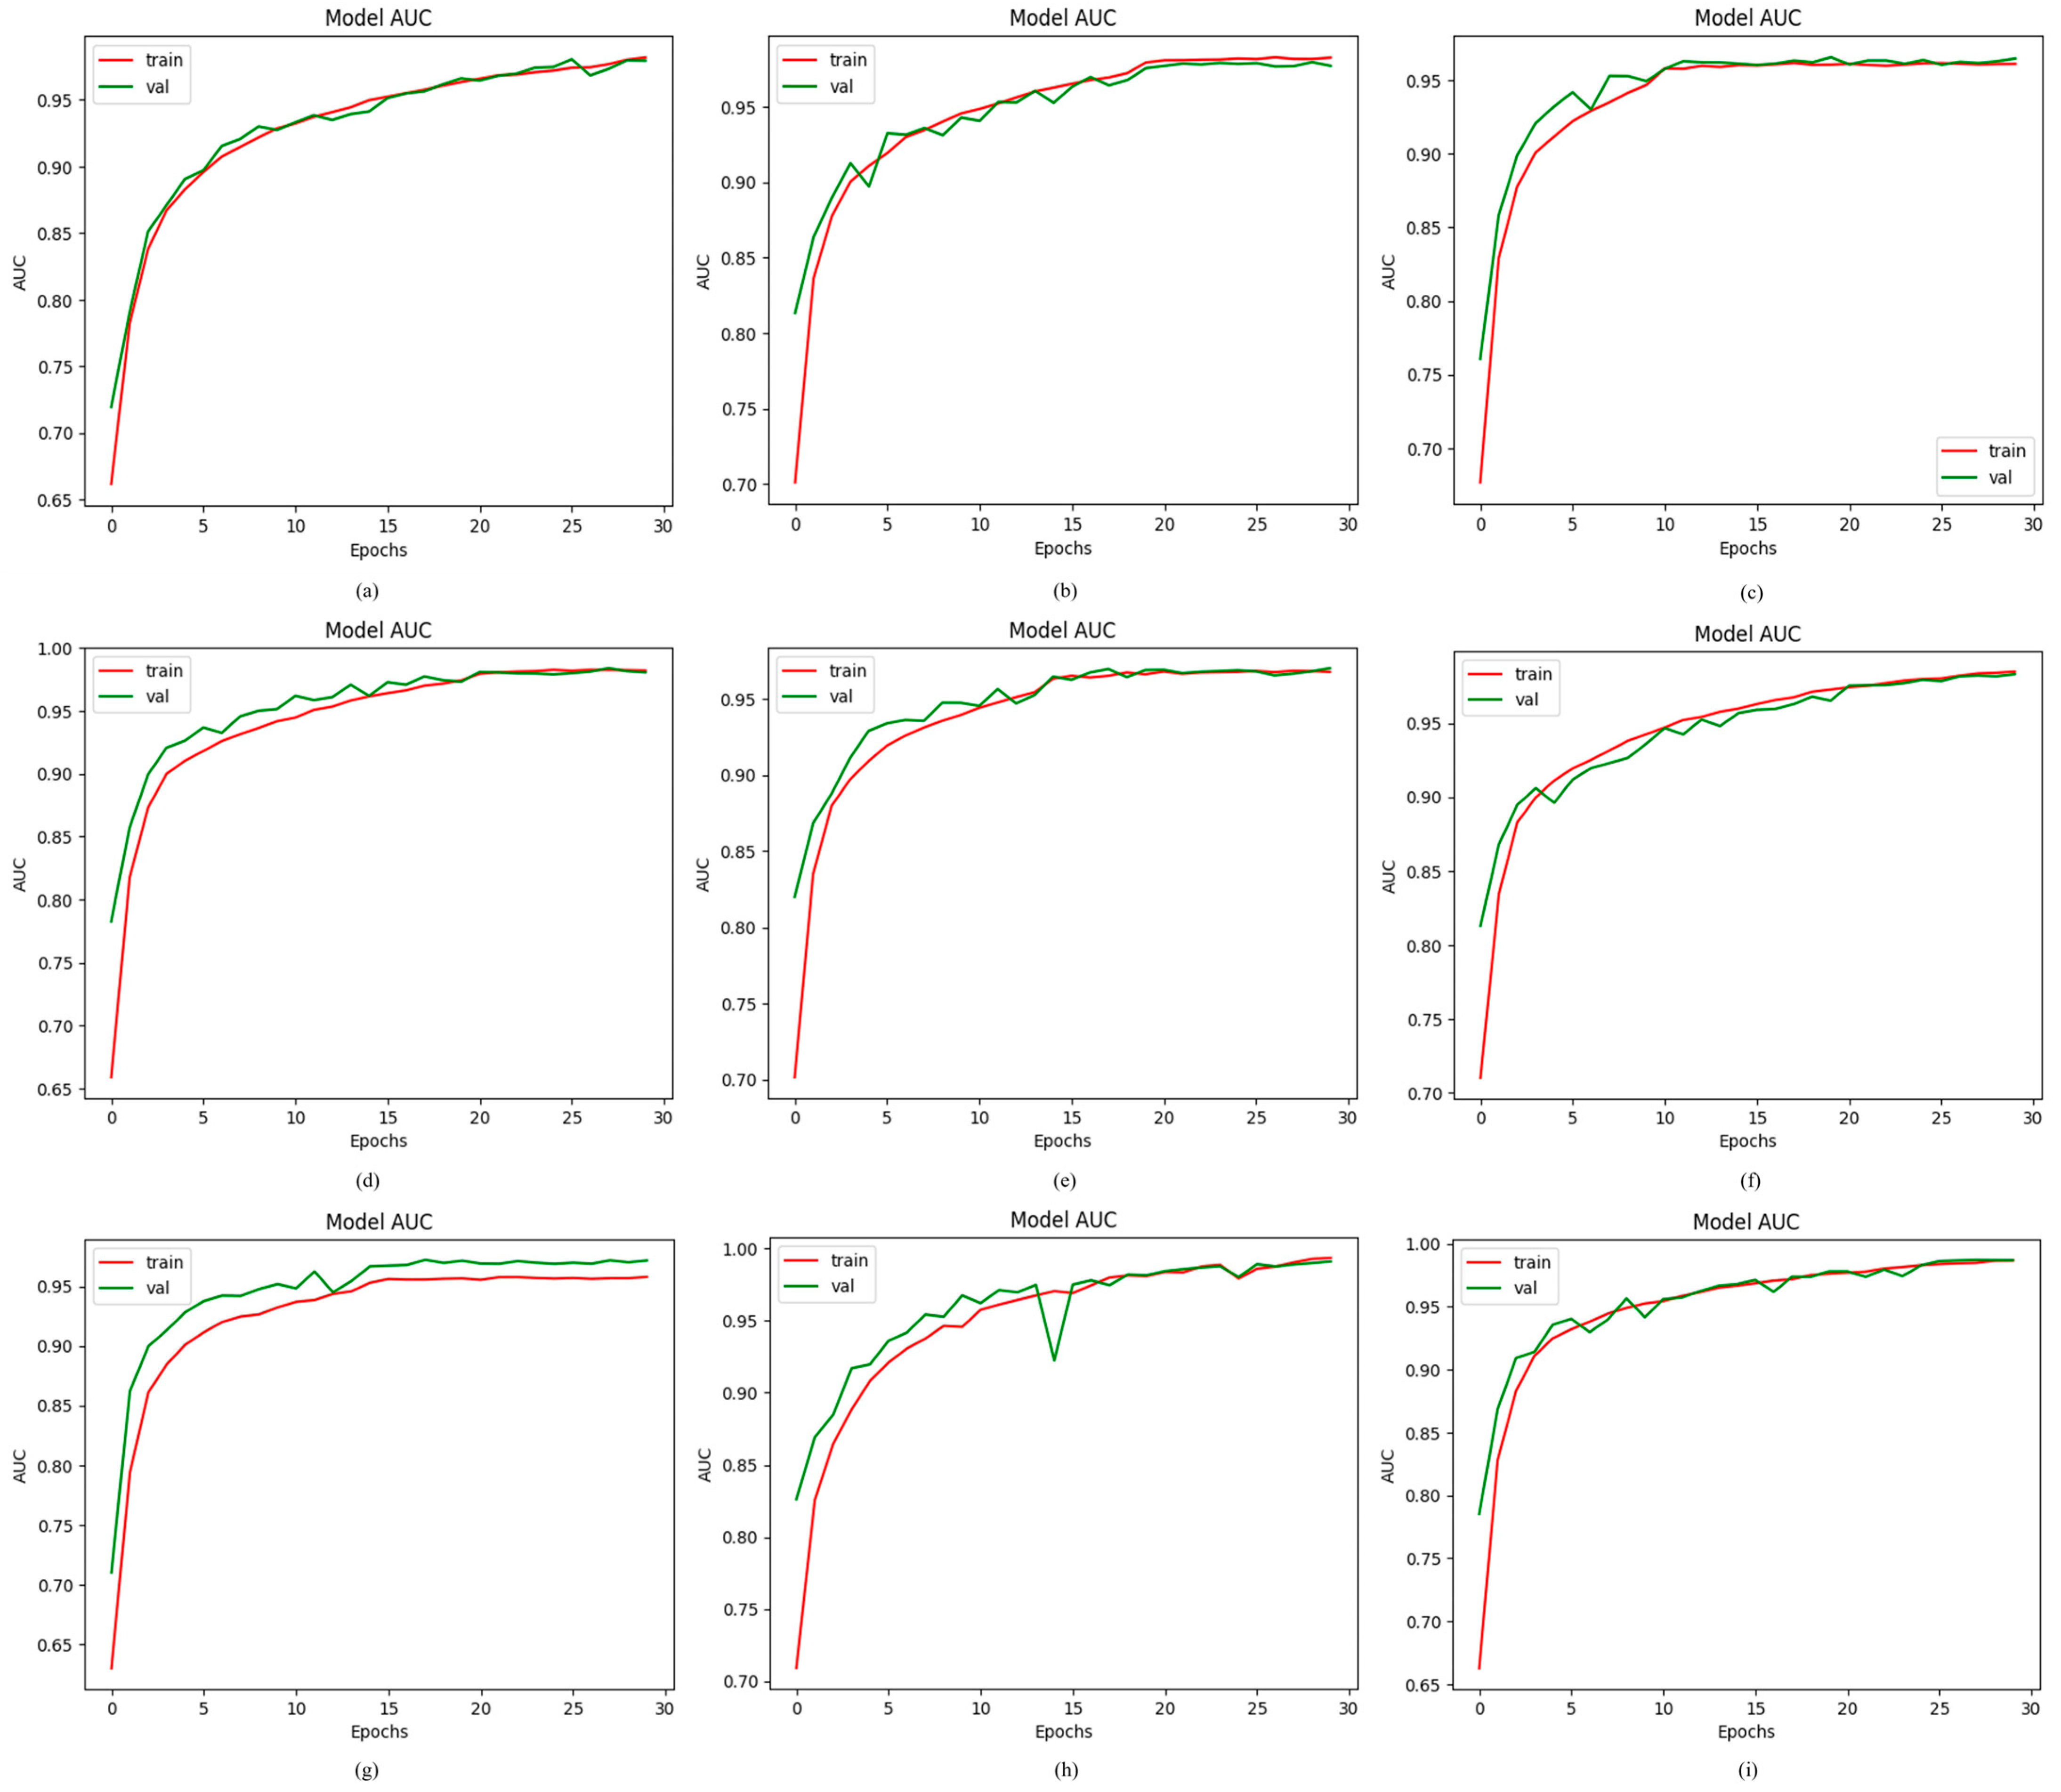
This study uses the AUC to calculate the efficacy of the proposed ODDM in distinguishing OD classes. The value of the AUC ranges between 0 and 1. A higher value shows that the model performs significantly well in classifying the seven ODs, including NOR, AMD, DR, GLU, MAC, NPDR, and PDR. Therefore, to observe their efficiency, a comprehensive comparison was made between the proposed ODDM and the baseline models. The proposed ODDM with SM-TOM attains the highest AUC of 98.94%. R1, R6, R2, R5, R4, R7, and R3 attain an AUC of 98.46%, 98.57%, 97.85%, 96.66%, 98.17%, 98.12%, and 96.04%, respectively. Additionally, the AUC of 96.31% is achieved by the proposed ODDM without SM-TOM. The results show that the performance of the proposed ODDM with SM-TOM is high compared to baseline models in terms of the AUC. The outcomes of these models are illustrated in Figure 7.

4.2.3. Results of Proposed ODDM in Terms of Precision

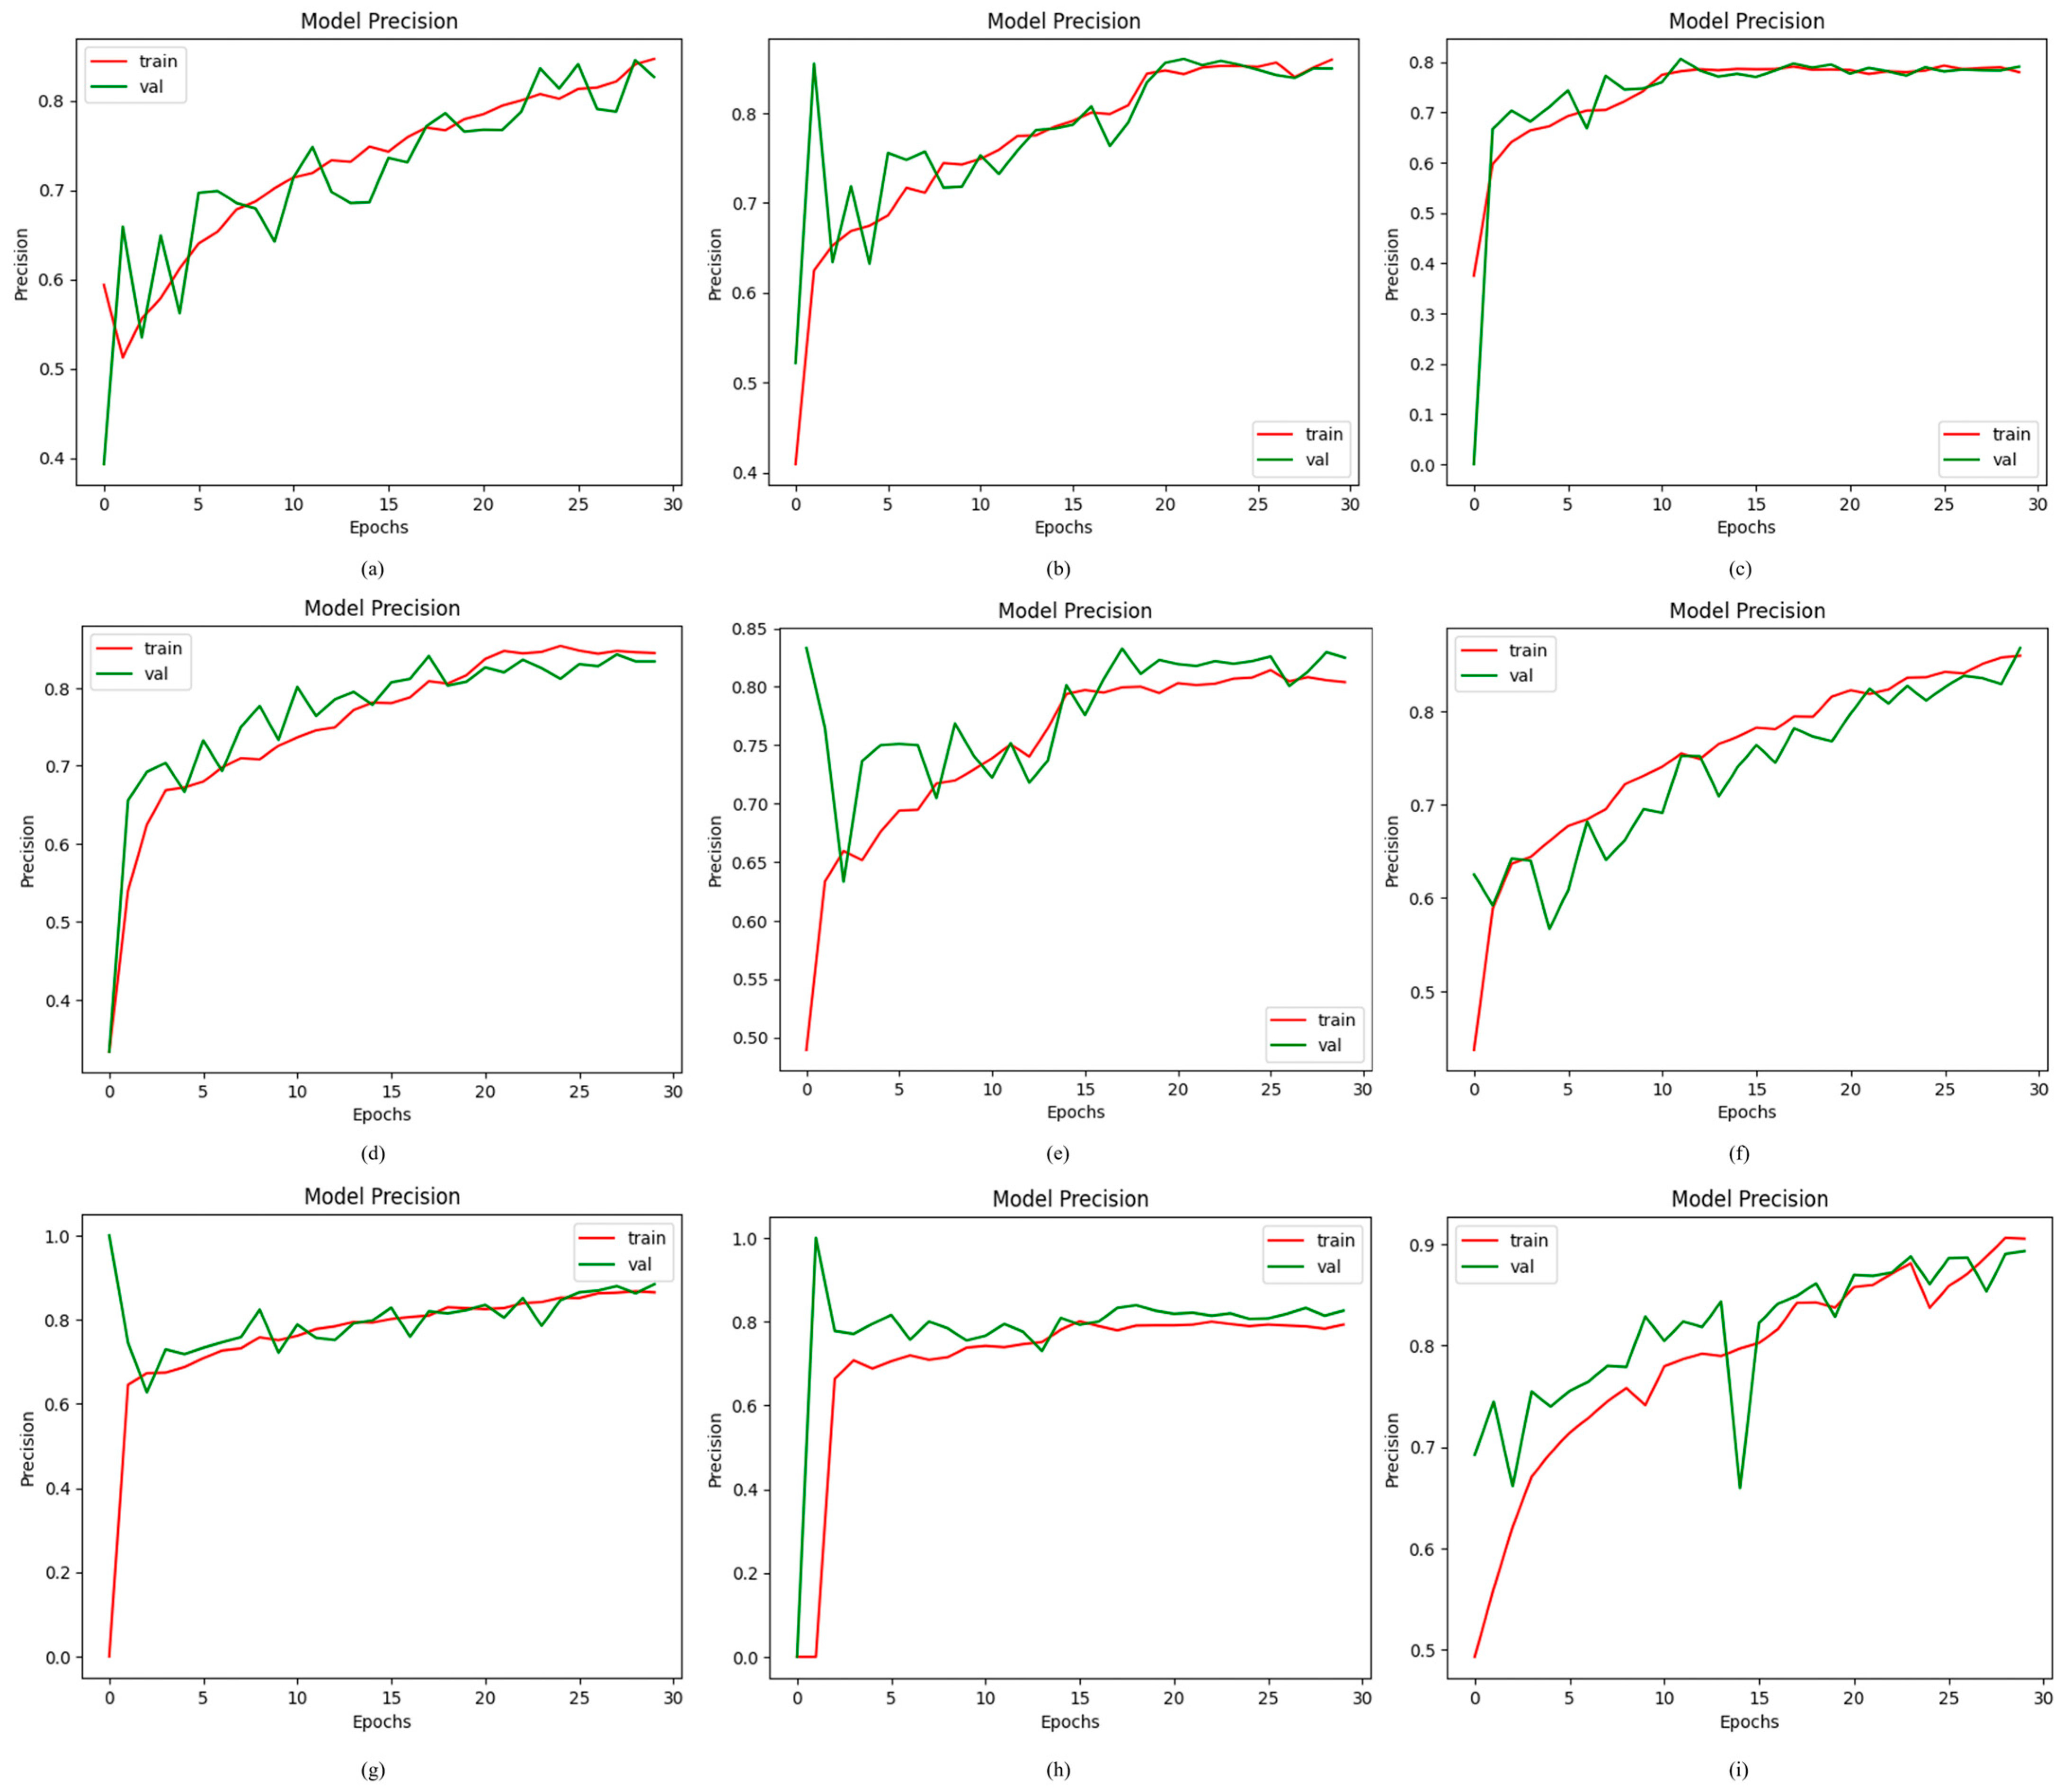
The precision metric is used to measure the TP prediction obtained by the model in classifying ODs using CFIs. A greater value of precision means that the models used in this study predict a lower value of FP. A graphical representation of the results obtained by the proposed ODDM and baseline models is depicted in Figure 8. The results reveal that the proposed ODDM with SM-TOM achieves the highest precision of 95.23% as compared to other models. Moreover, the proposed ODDM without SM-TOM achieved a precision of 83.73%. R1 attains a precision of 86.58%. The other models R6, R4, R2, R7, and R3 attain a precision of 88.66%, 82.74%, 83.77%, 84.63%, and 80.39%, respectively. The lowest precision value is attained by R5, which is 79.23%.

4.2.4. Results of Proposed ODDM in Terms of Recall

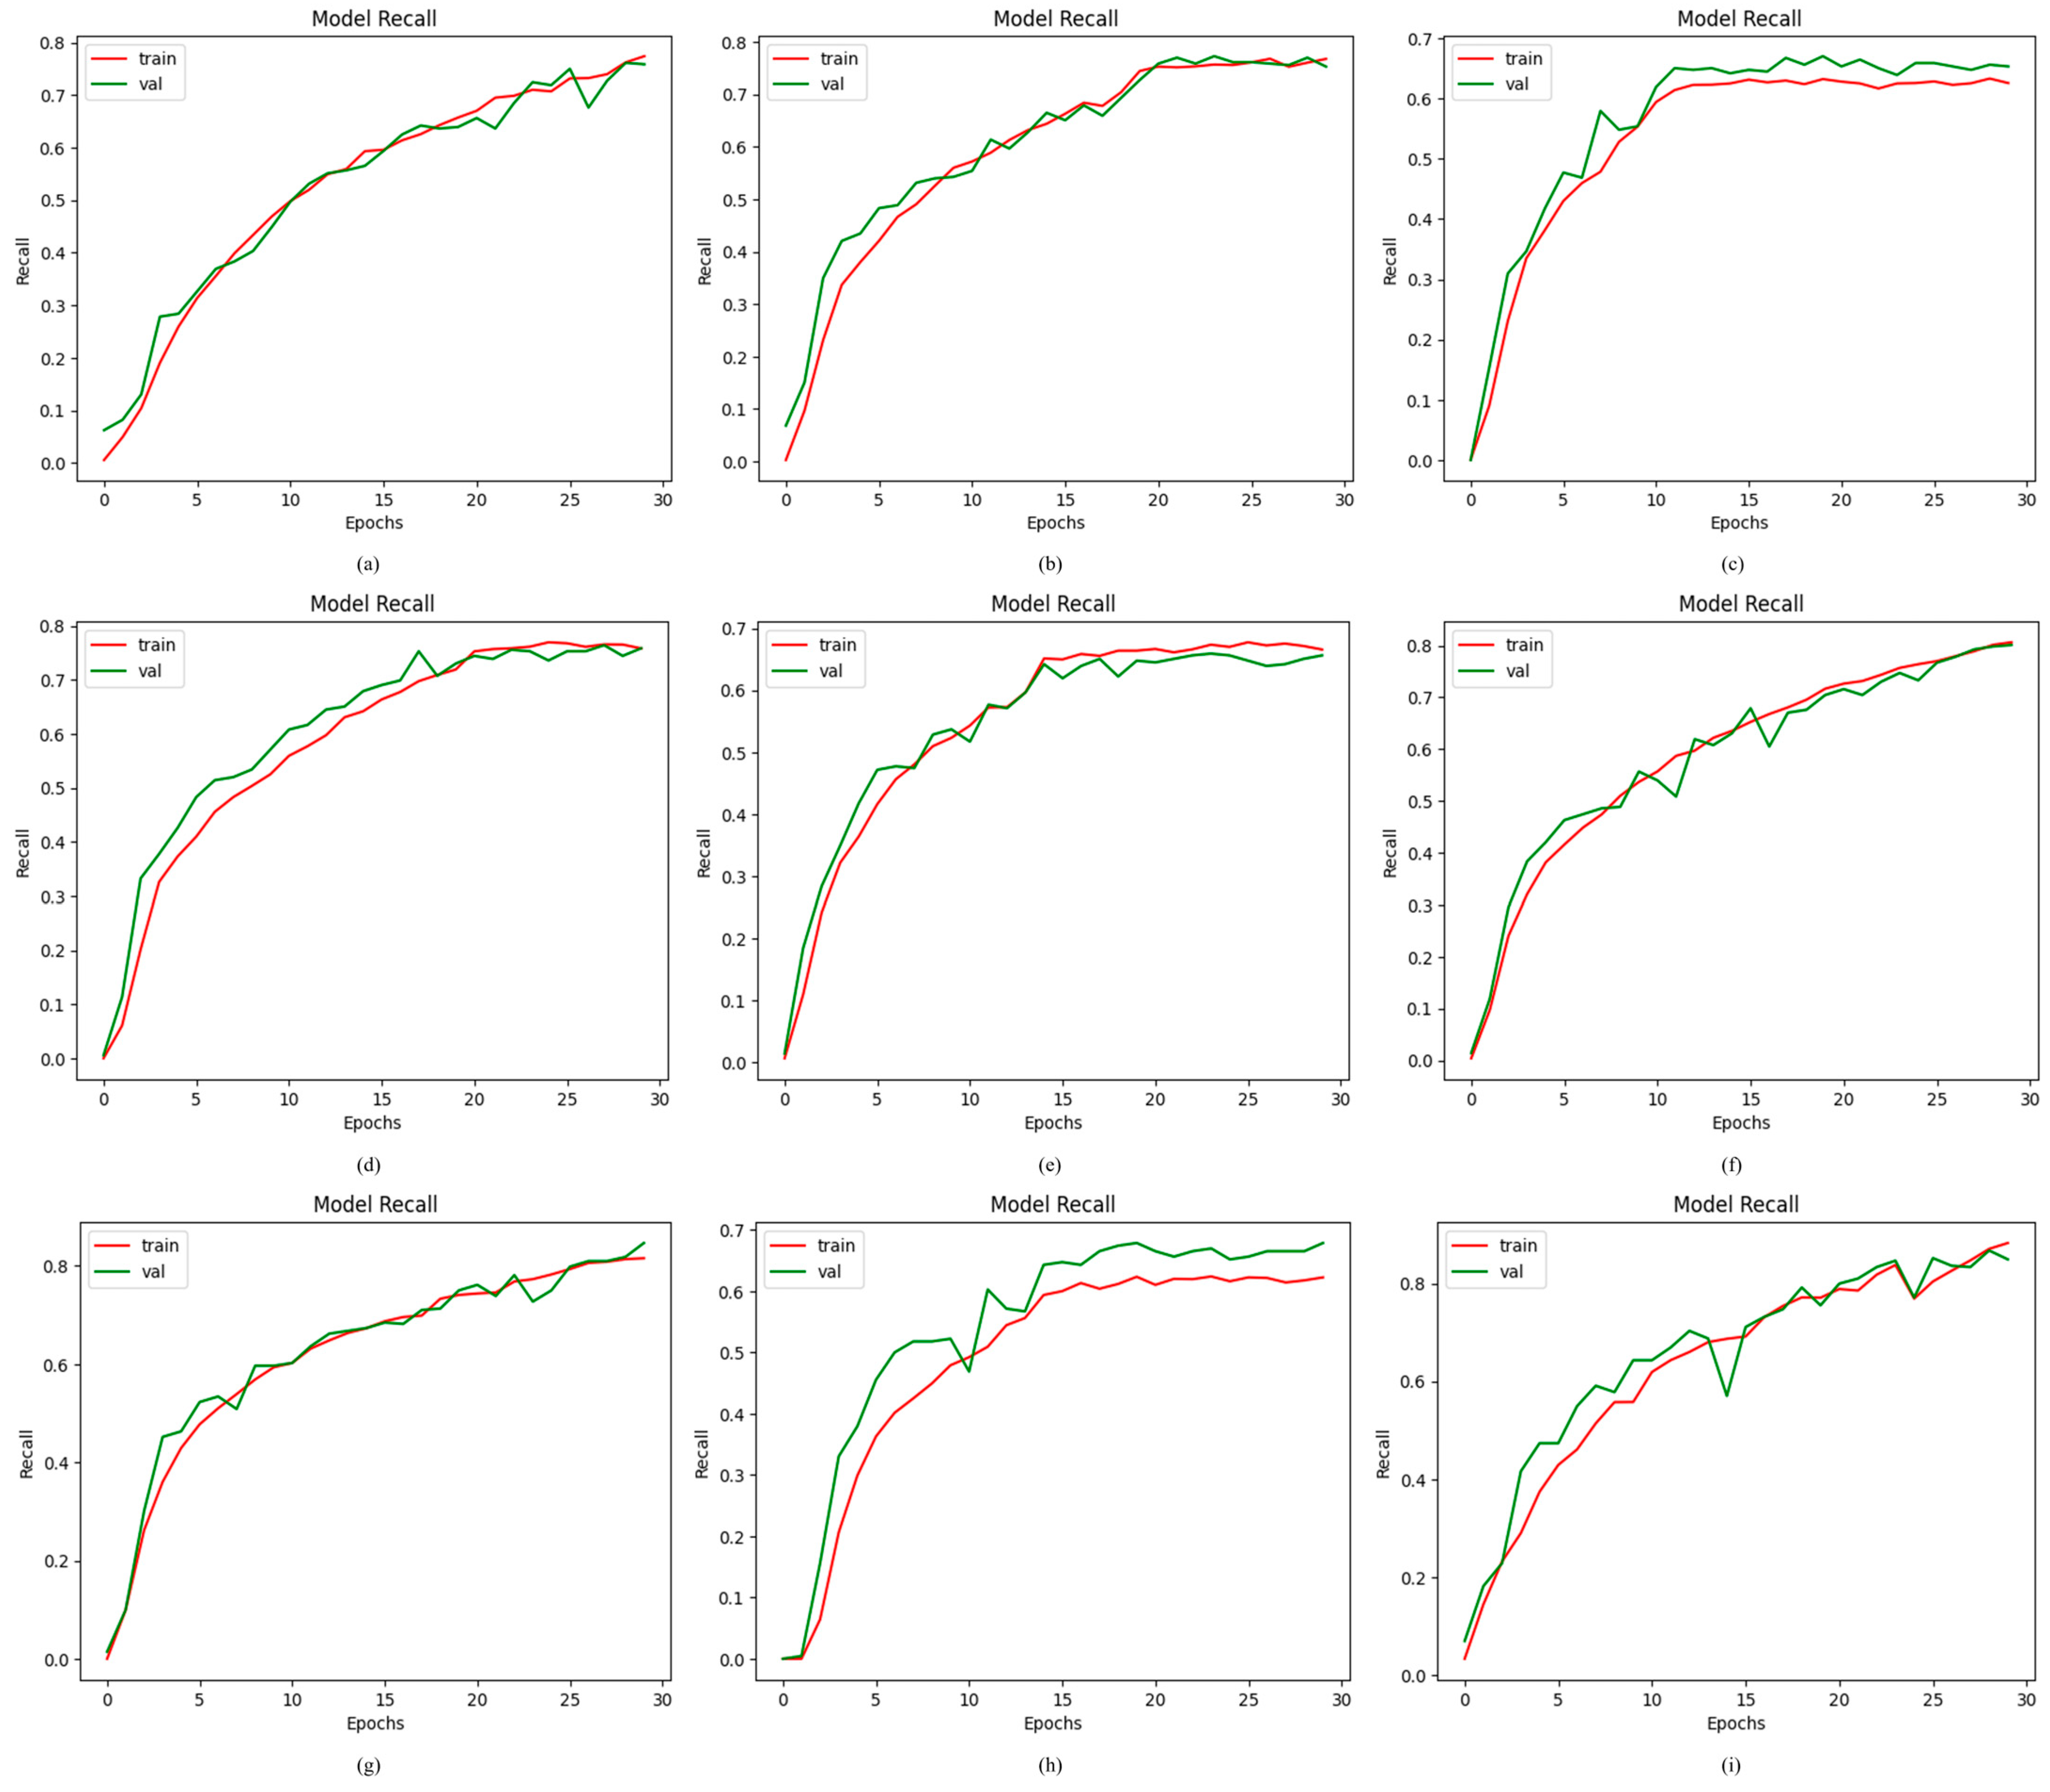
The purpose of recall is to accurately identify TPs from the actual positive CFIs of the OD dataset used in this work. Figure 9 illustrates the recall curve that is generated by evaluating the proposed ODDM in comparison to R1, R5, R6, R3, R2, and R4. The highest recall value of 88.74% is achieved by the proposed ODDM with SM-TOM. The lowest recall value of 66.13% is attained by R3. The models R7, R6, R1, R4, R2, and R5 achieved a recall of 81.01%, 83.02%, 79.41%, 75.46%, 75.73%, and 66.13, respectively.

4.2.5. Results of Proposed ODDM in Terms of F1-Score

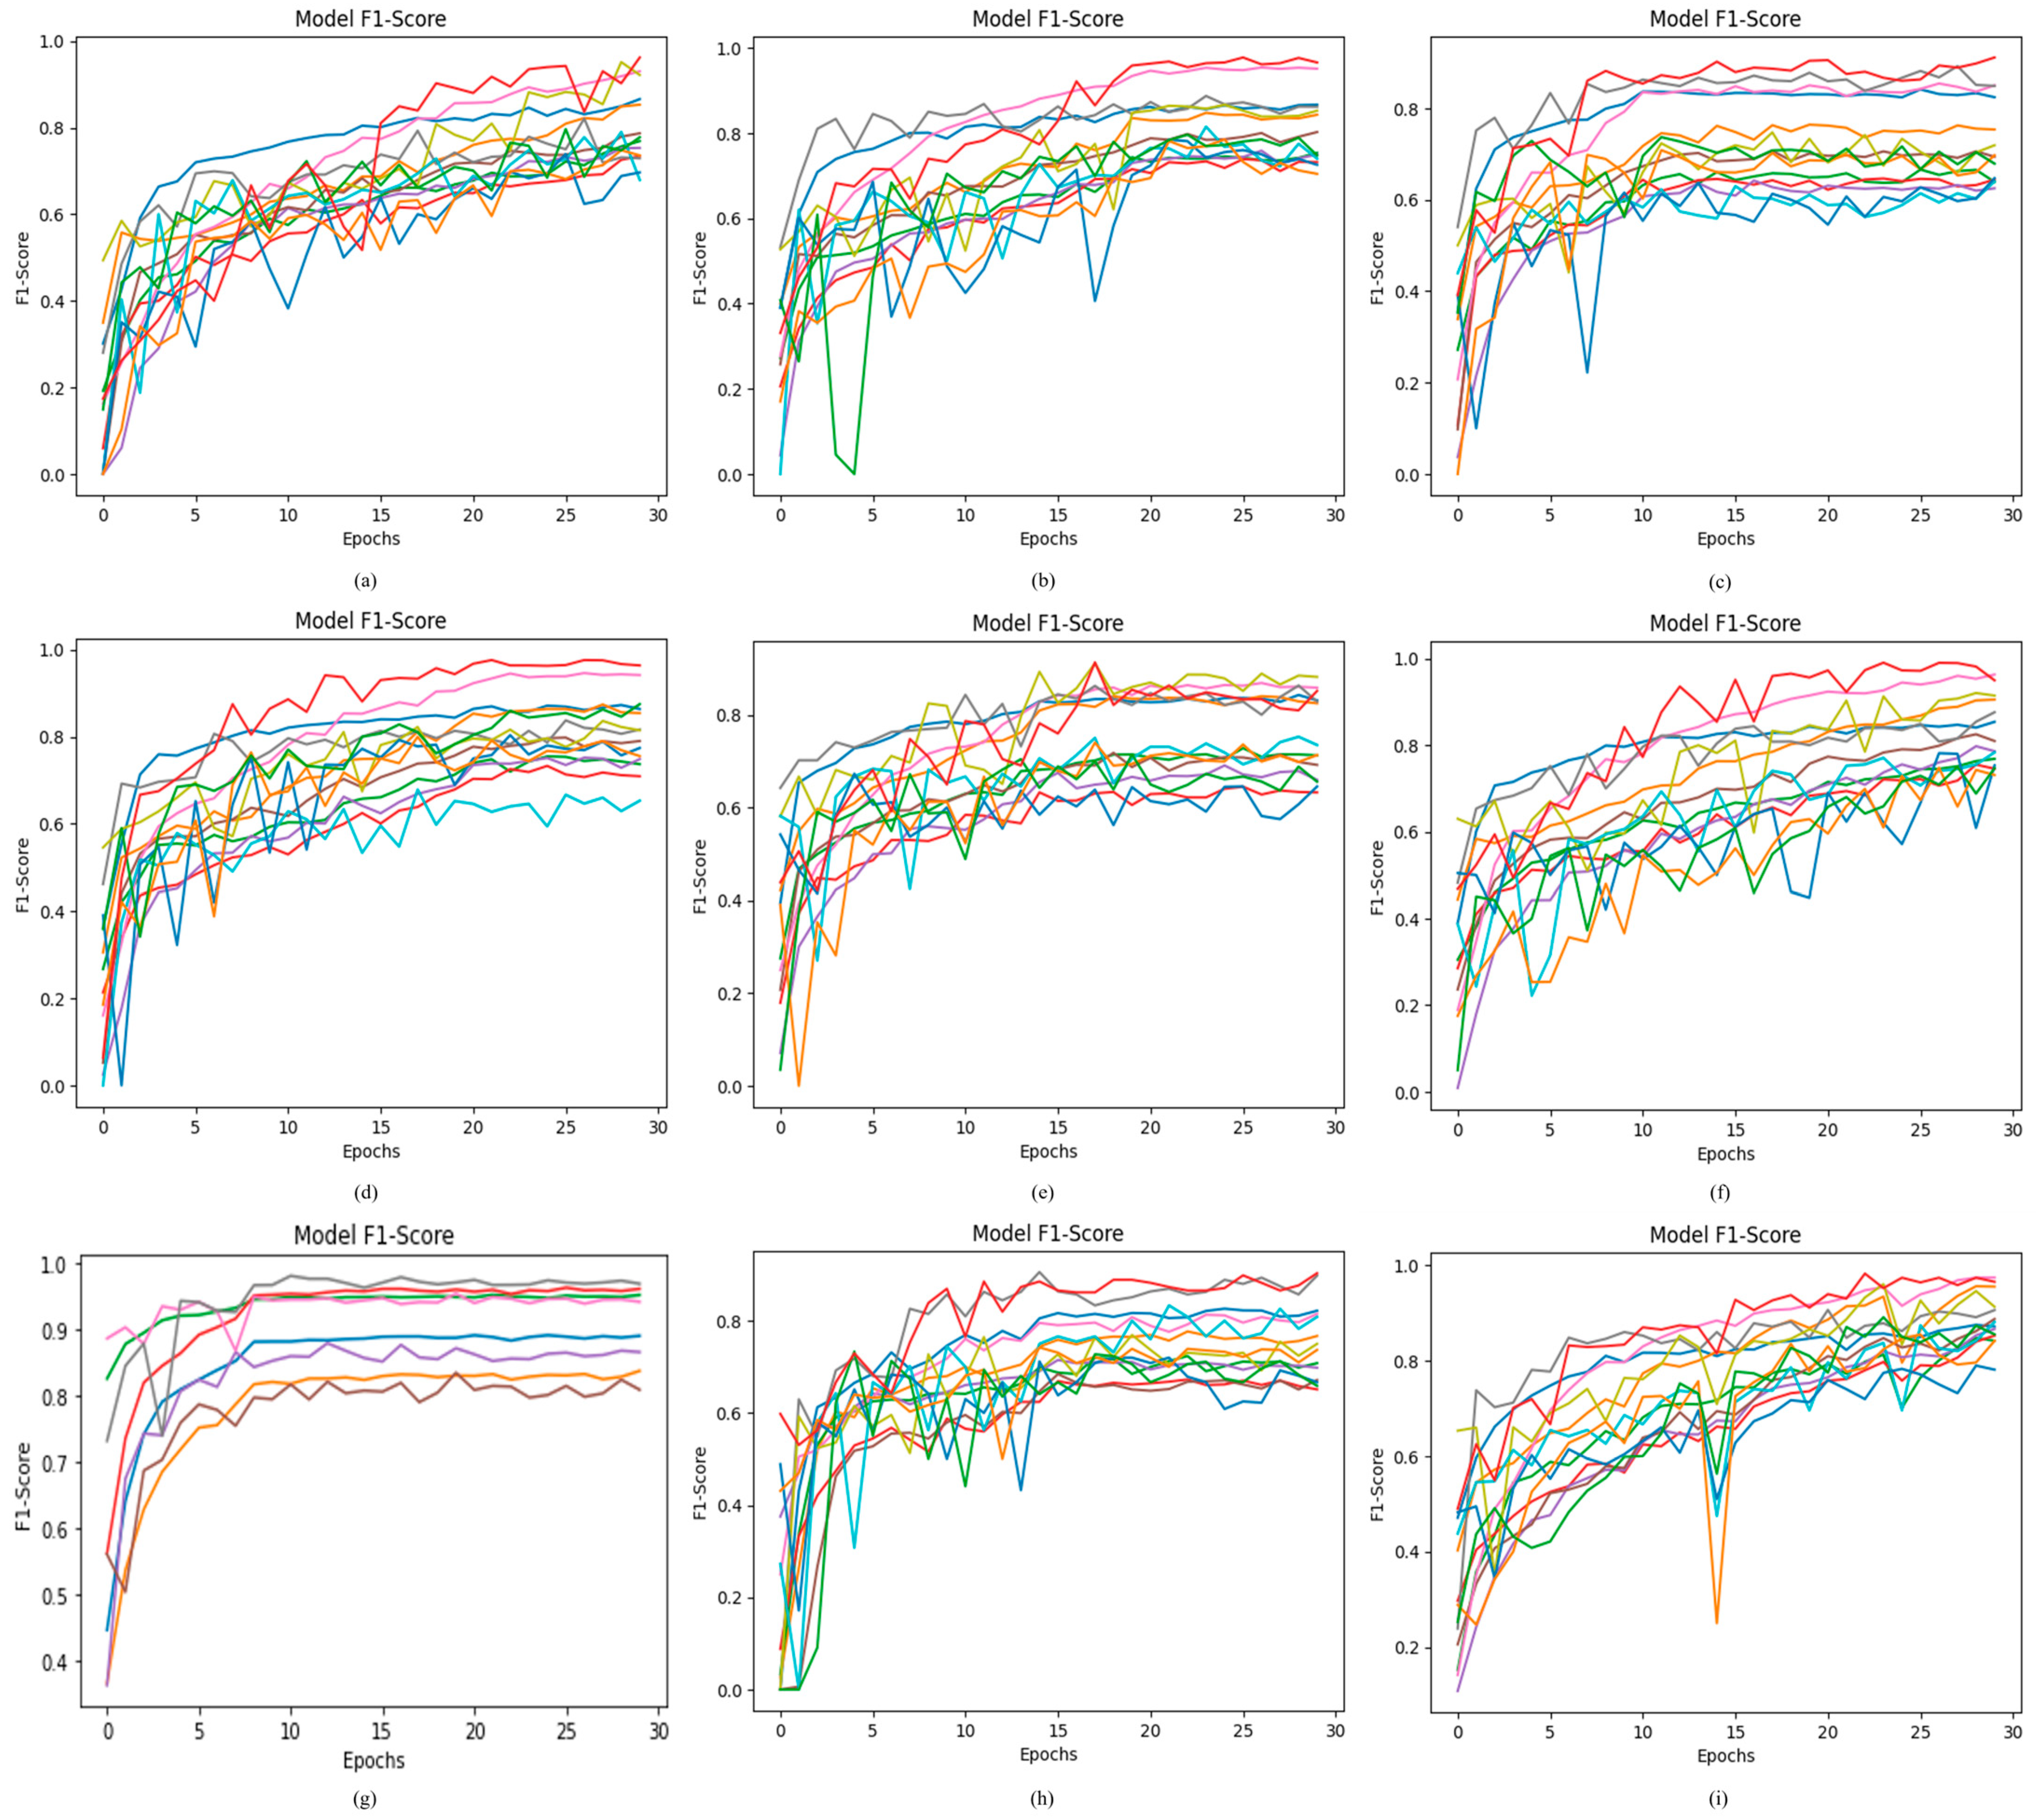
The F1-score is used to measure the harmonic mean of precision and recall. A greater value of the F1-score means that the model performs appropriately in classifying the seven classes of ODs. The proposed ODDM with SM-TOM attains the highest F1-score of 88.31% as compared to the other models used in this study. R5 and R6 achieve an F1-score of 74.19% and 84.94%, respectively. The R1 model achieves an F1-score of 83.18%. The F1-score for R4 and R2 is 78.91% and 81.04%, respectively. R3 attained the lowest F1-score at 73.05%. The detailed results obtained by using the proposed model and baseline models are presented in Figure 10.

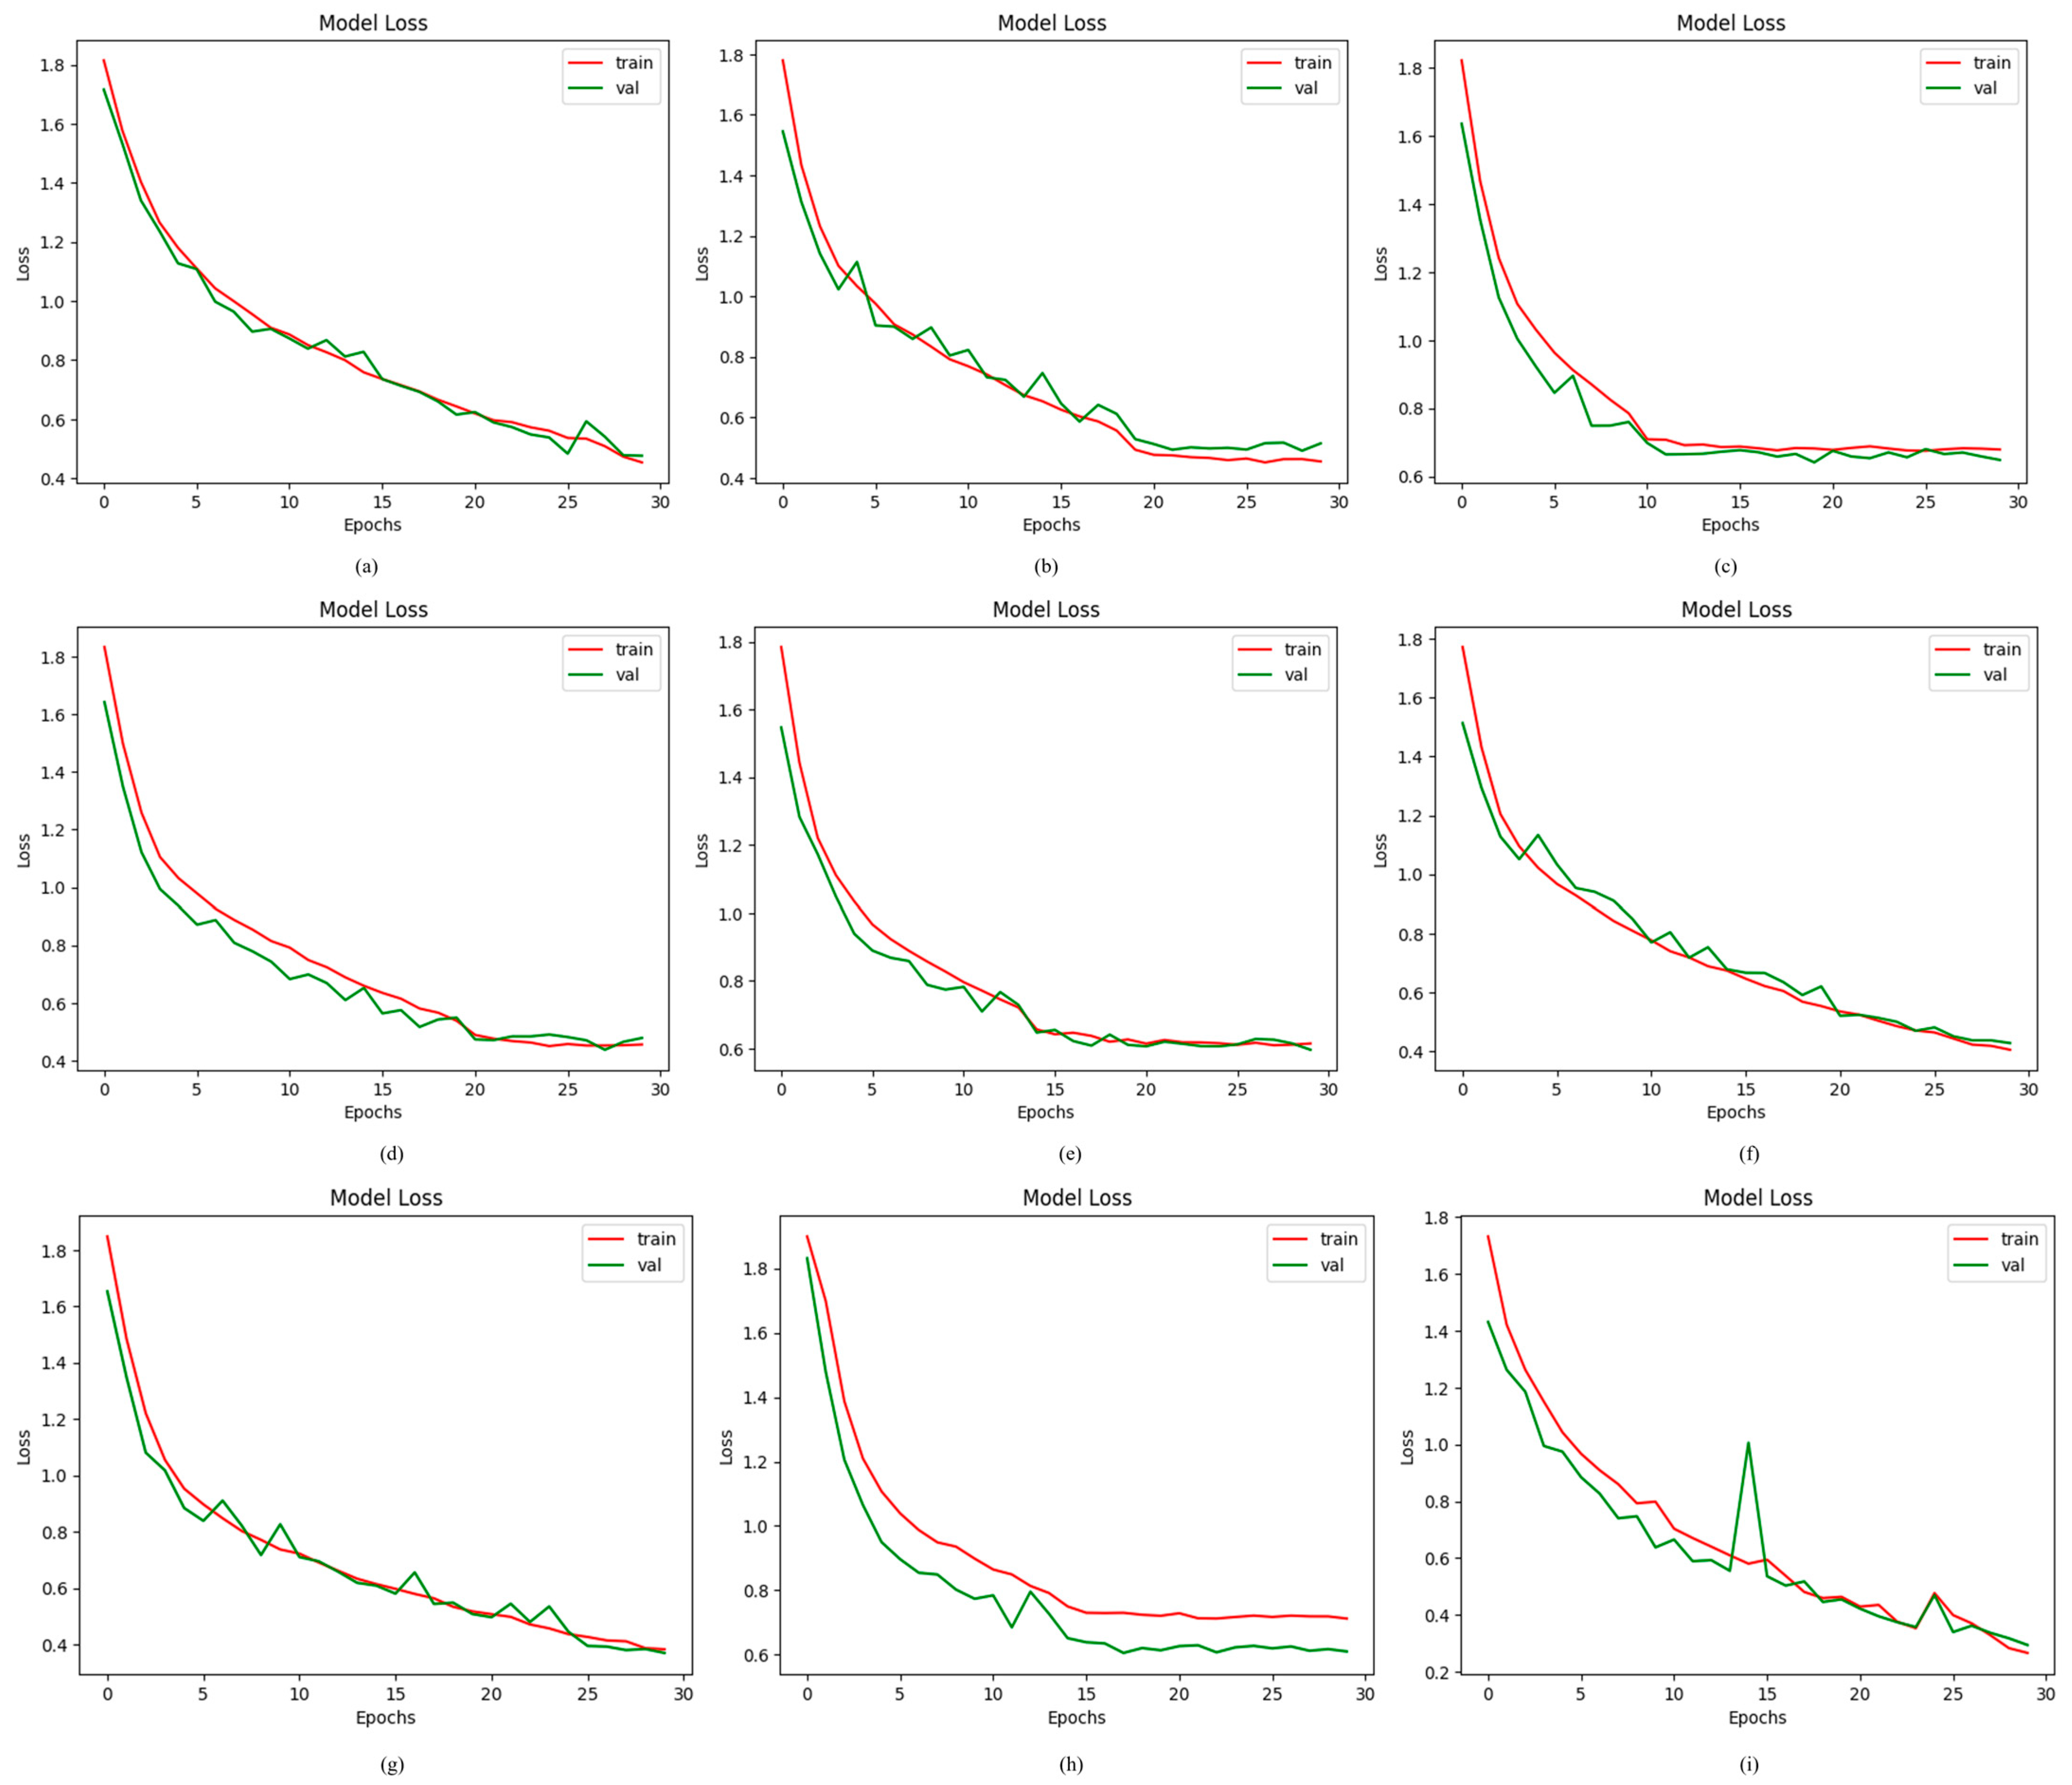
4.2.6. Results of Proposed ODDM in Terms of Loss

Loss functions represent the numerical difference between the predicted and actual values. In this study, the loss of the proposed ODDM and baseline models is determined by using a categorical cross-entropy function. When the proposed ODDM was trained using SM-TOM, the results were remarkable. R1 had a loss value of 0.4227%. R2 and R6 produced loss values of 0.4894% and 0.4005%, respectively. Additionally, R7, R4, R5, and R3 achieved loss values of 0.4403, 0.4603%, 0.6267%, and 0.6824%, respectively. The proposed ODDM with SM-TOM produced a loss of 0.3873%. However, the proposed ODDM without SM-TOM generated a loss of 0.6883%. The loss values produced by the proposed ODDM and other models used in this work are presented in Figure 11.

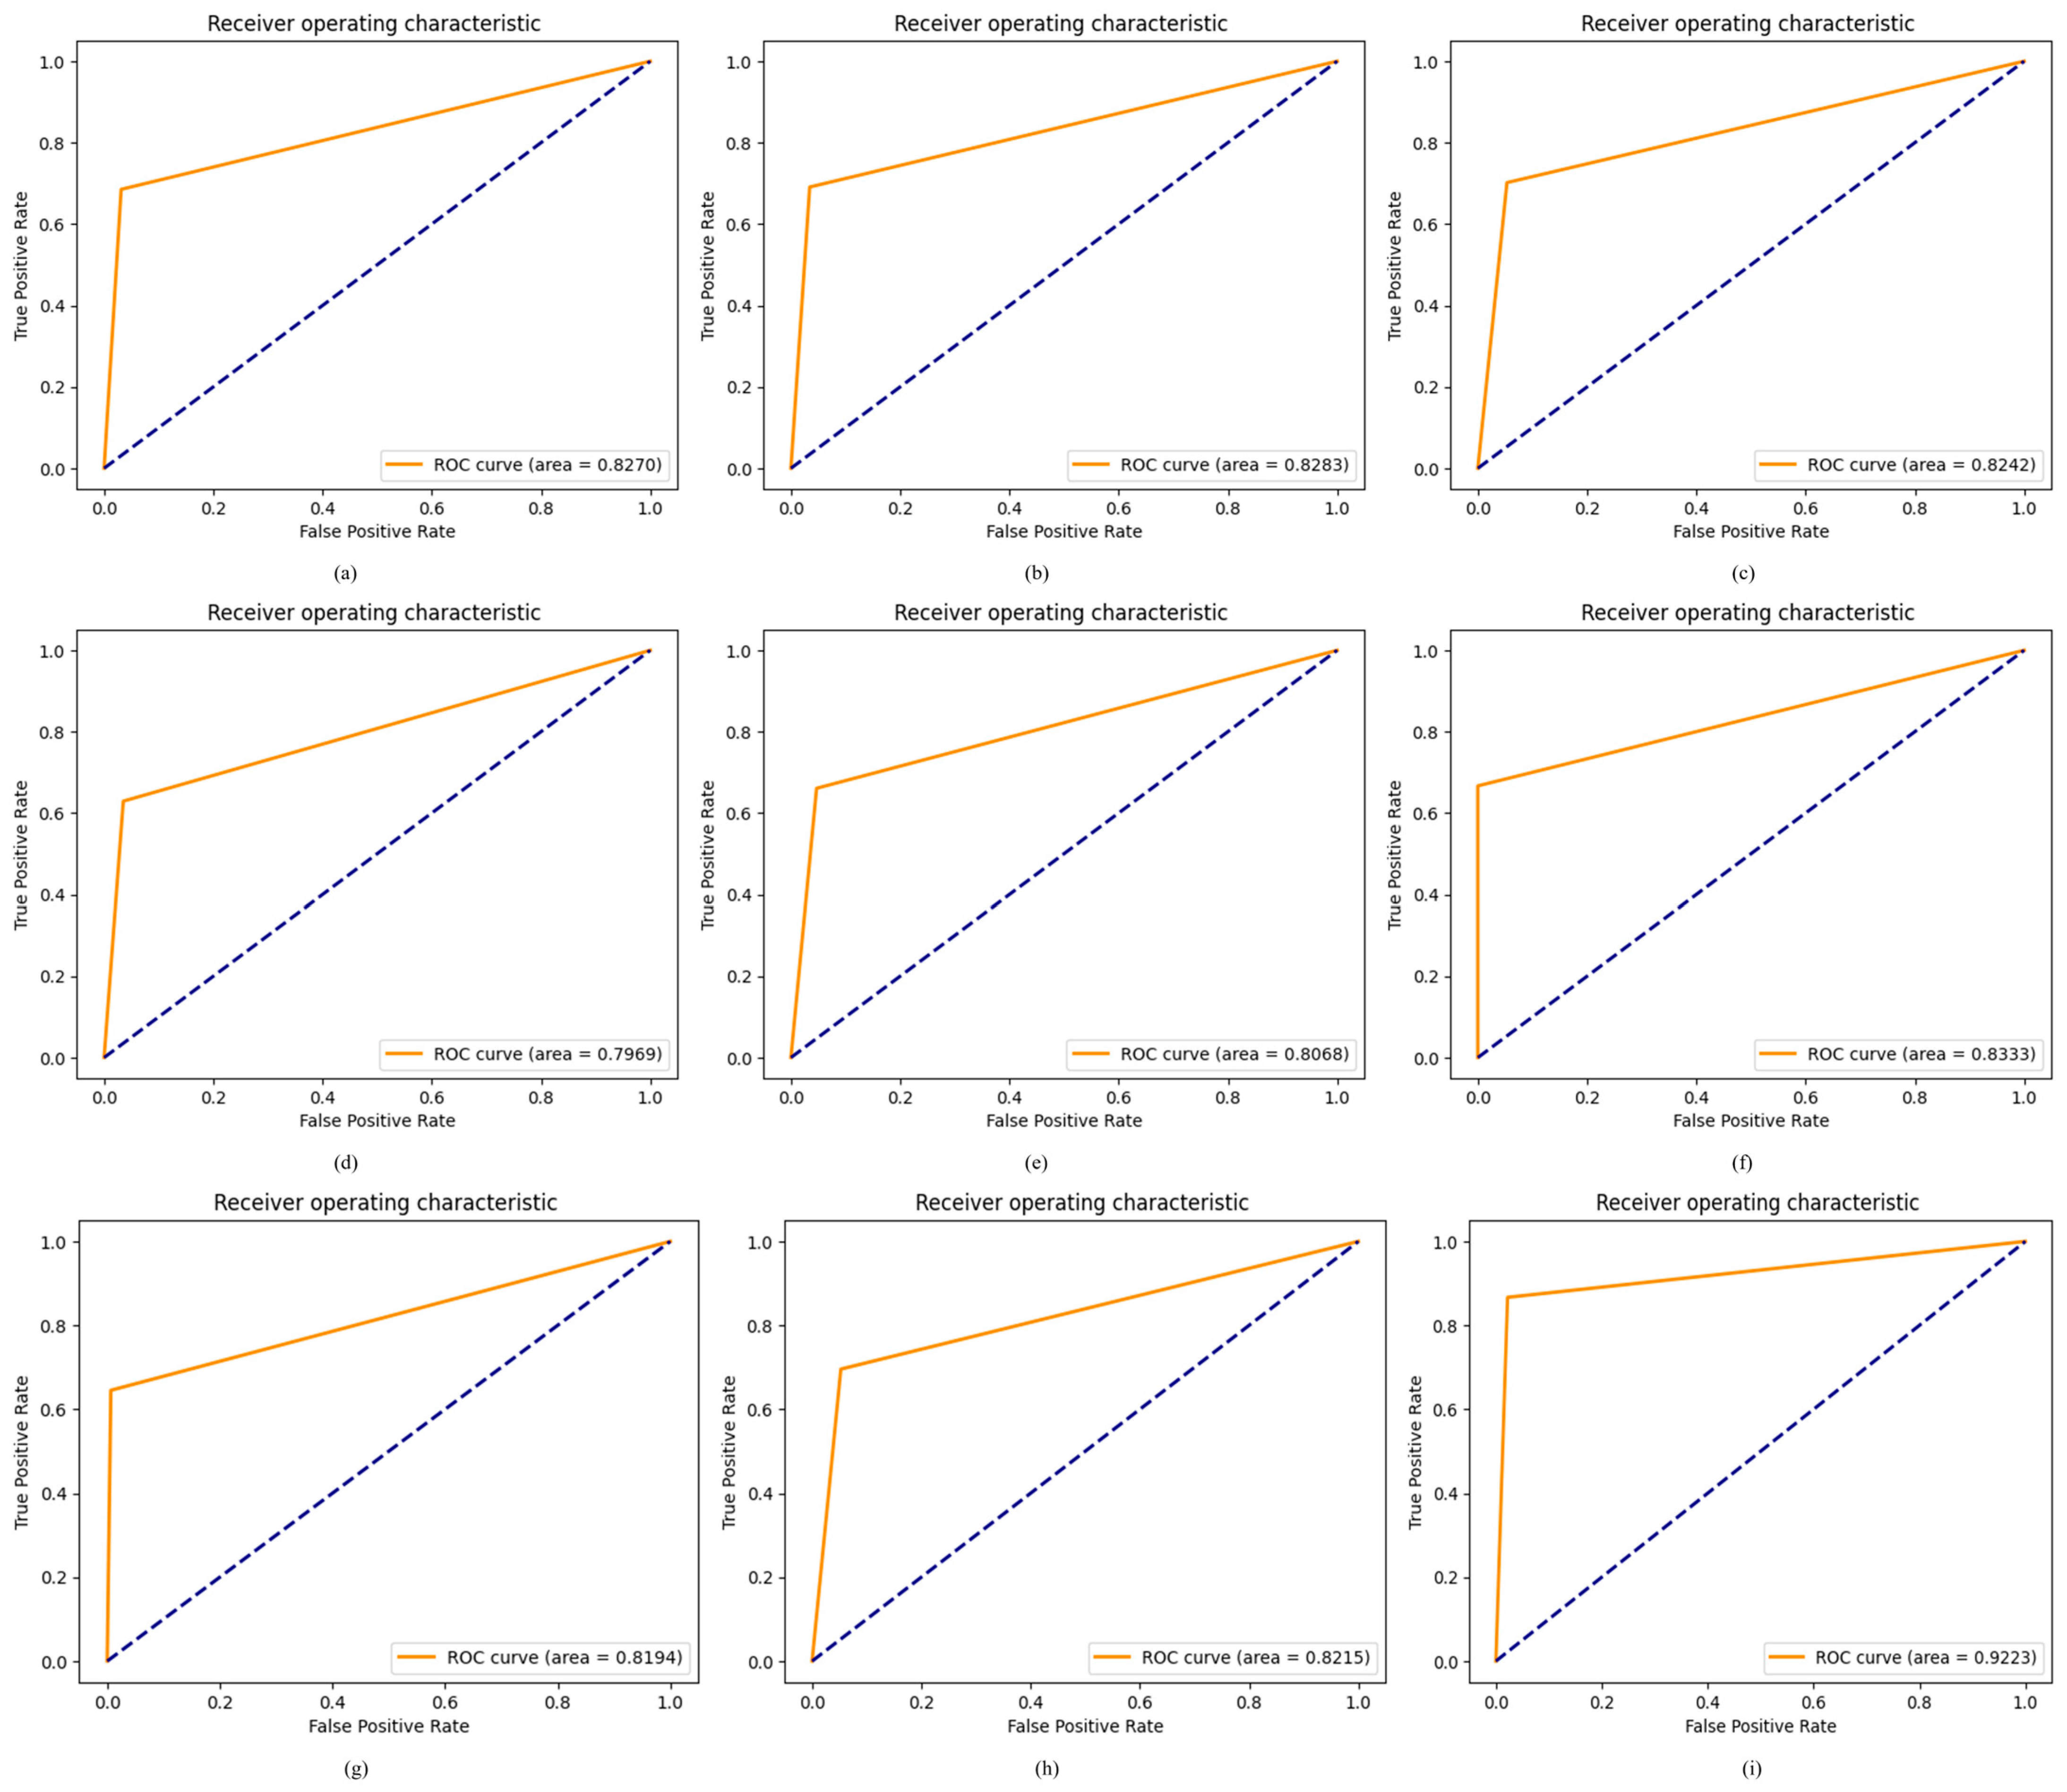
4.2.7. Results of Proposed ODDM in Terms of ROC

Model efficacy is assessed using an ROC curve, where a larger ROC signifies a more successful model in classifying ODs. The ROC curve was used to compare the proposed ODDM with and without SM-TOM with baseline models after enhancing the OD datasets. The proposed ODDM with and without SM-TOM attained ROC values of 0.9923 and 0.8215, respectively. The baseline models R1, R2, R3, R4, R5, R6, and R7 attained ROC values of 0.8290, 0.8283, 0.8242, 0.7969, 0.8068, 0.8333, and 0.8194, respectively, as shown in Figure 12. In the ROC curve, a significant enhancement is observed in the performance of the proposed ODDM, with SM-TOM, which is depicted in Figure 12.

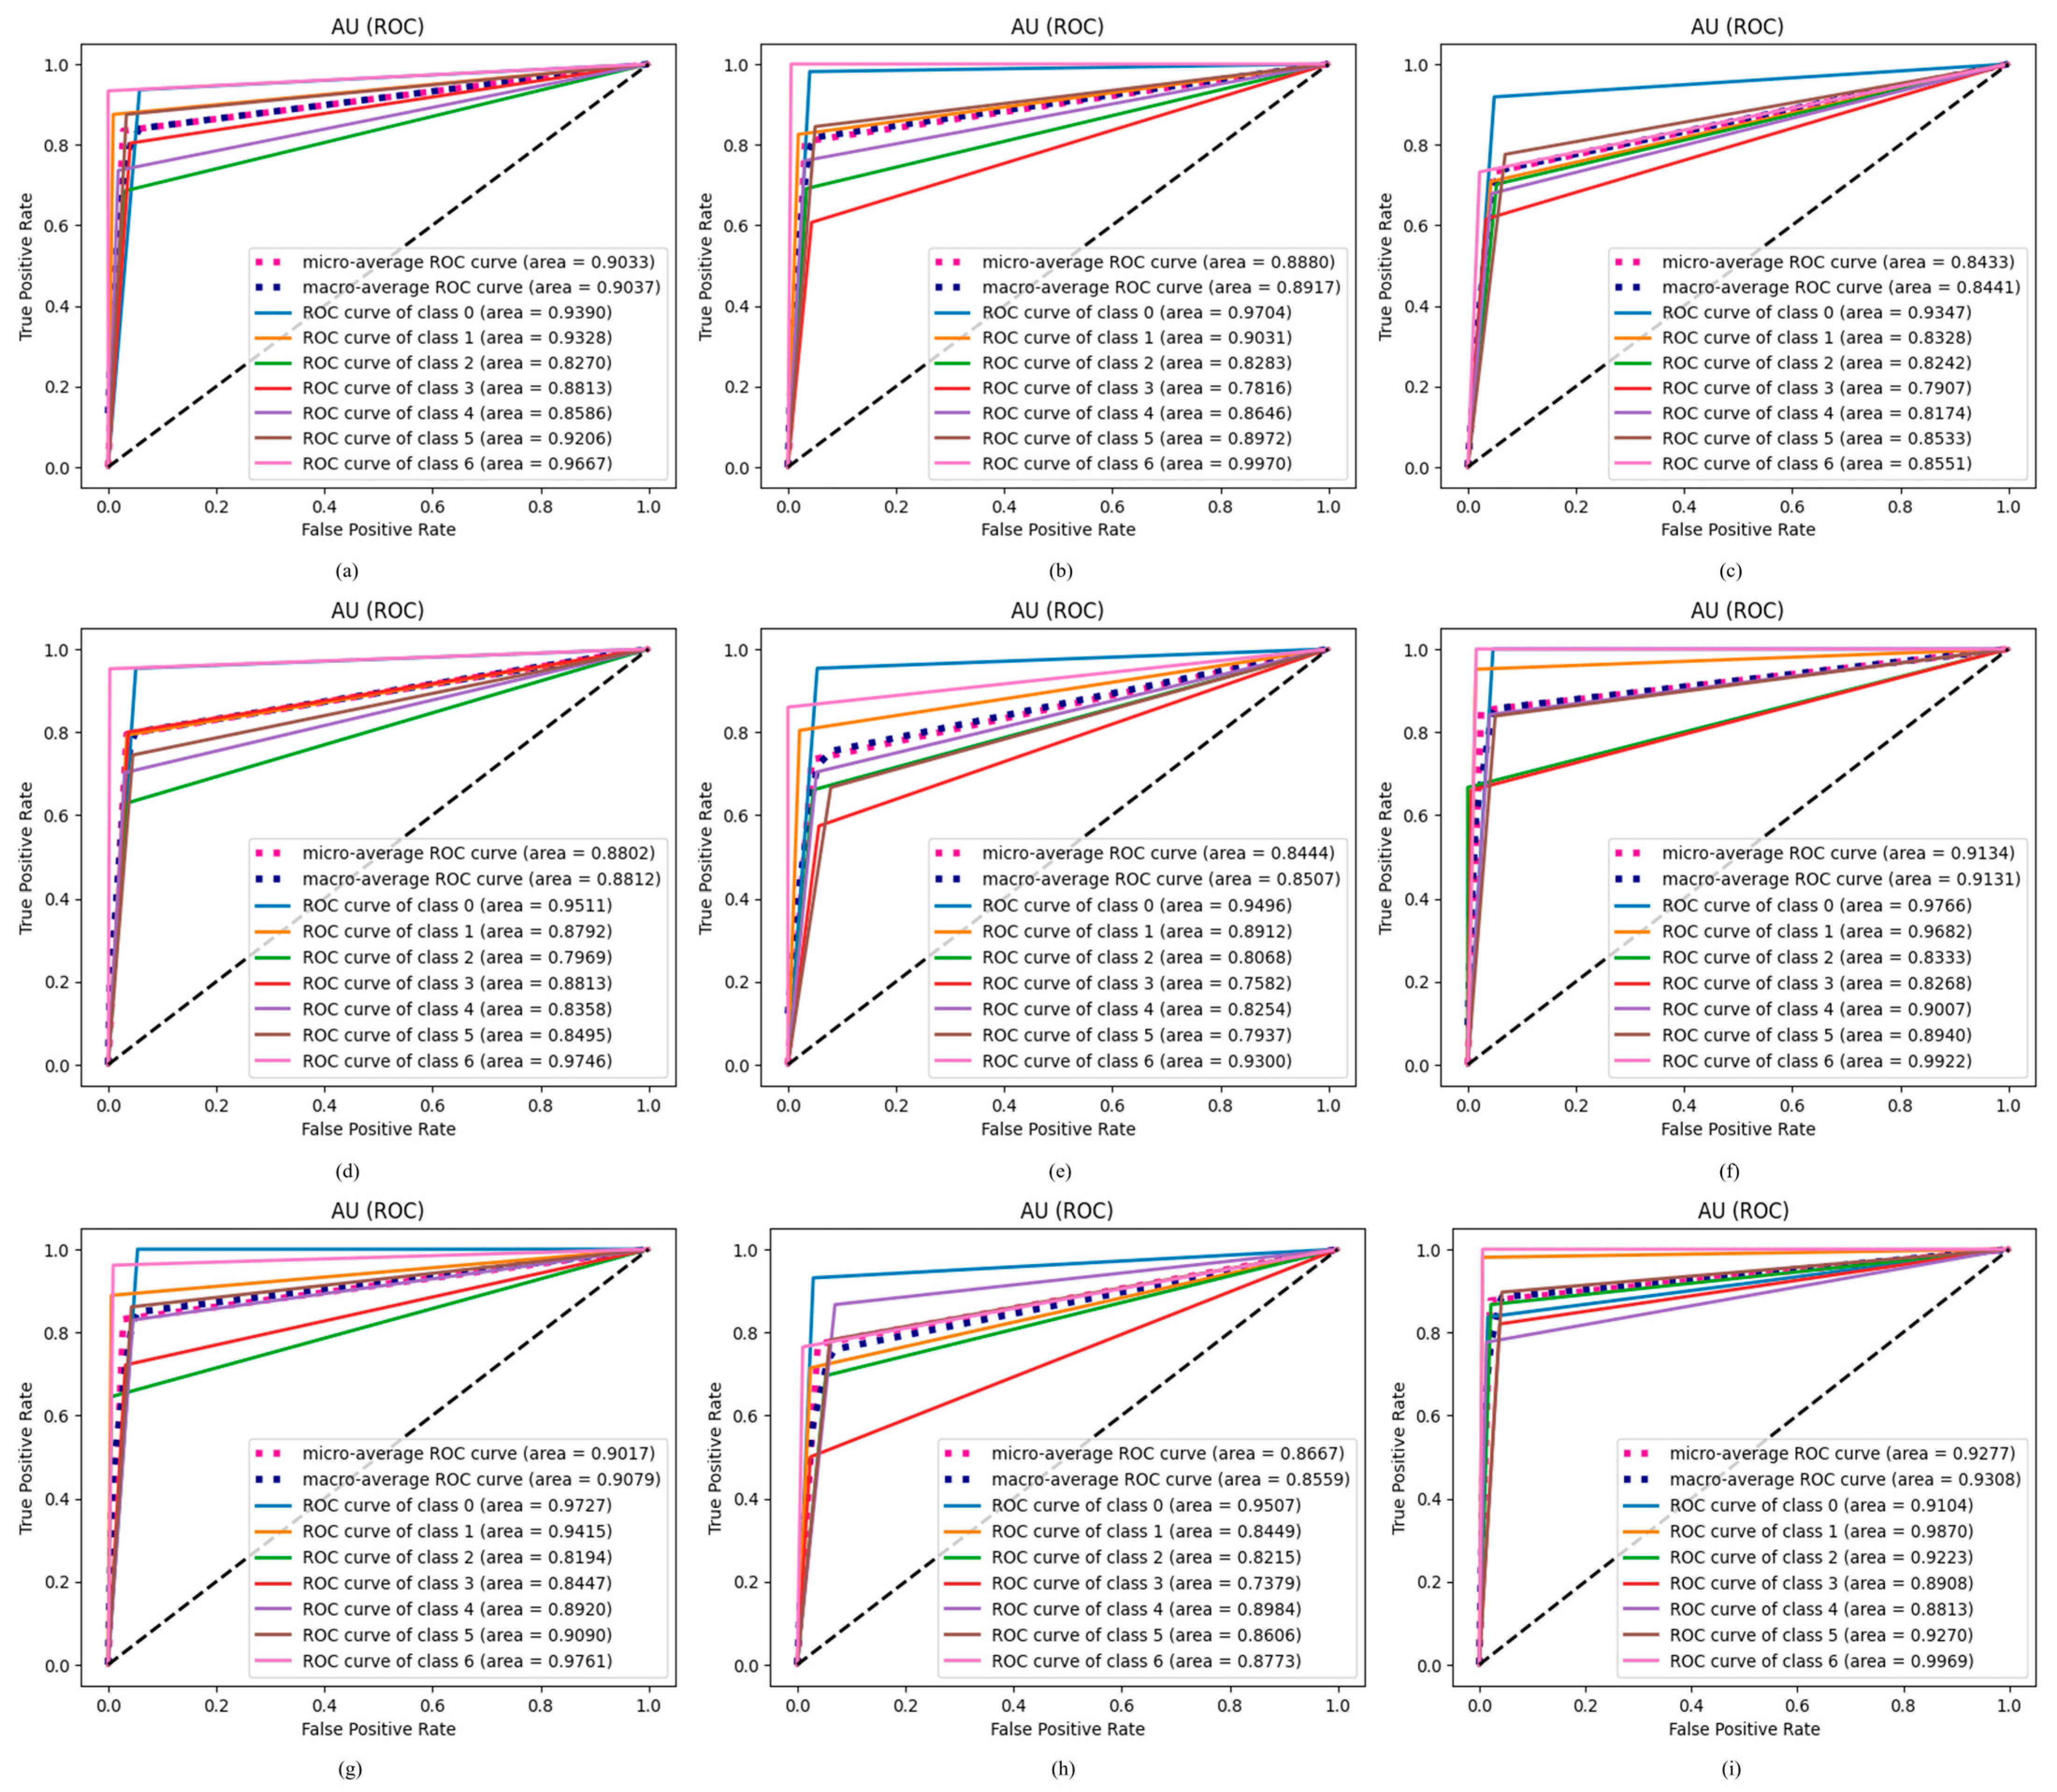
4.2.8. Results of Proposed ODDM in Terms of AU ROC

In this study, we used AU ROC to perform a classwise evaluation of the proposed ODDM and baseline models. Figure 13 represents the AU ROC of the proposed ODDM and baseline models. In AU ROC, class 0 denotes AMD, class 1 denotes DR, class 2 represents GLU, class 3 represents MAC, class 4 represents NOR, class 5 represents NPDR, and class 6 denotes PDR. The proposed ODDM with SM-TOM achieves the highest micro-average ROC curve of 0.9277 and macro-average ROC curve of 0.9308 as compared to other baseline models. A detailed classwise representation of the proposed ODDM and baseline models is depicted in Figure 13.

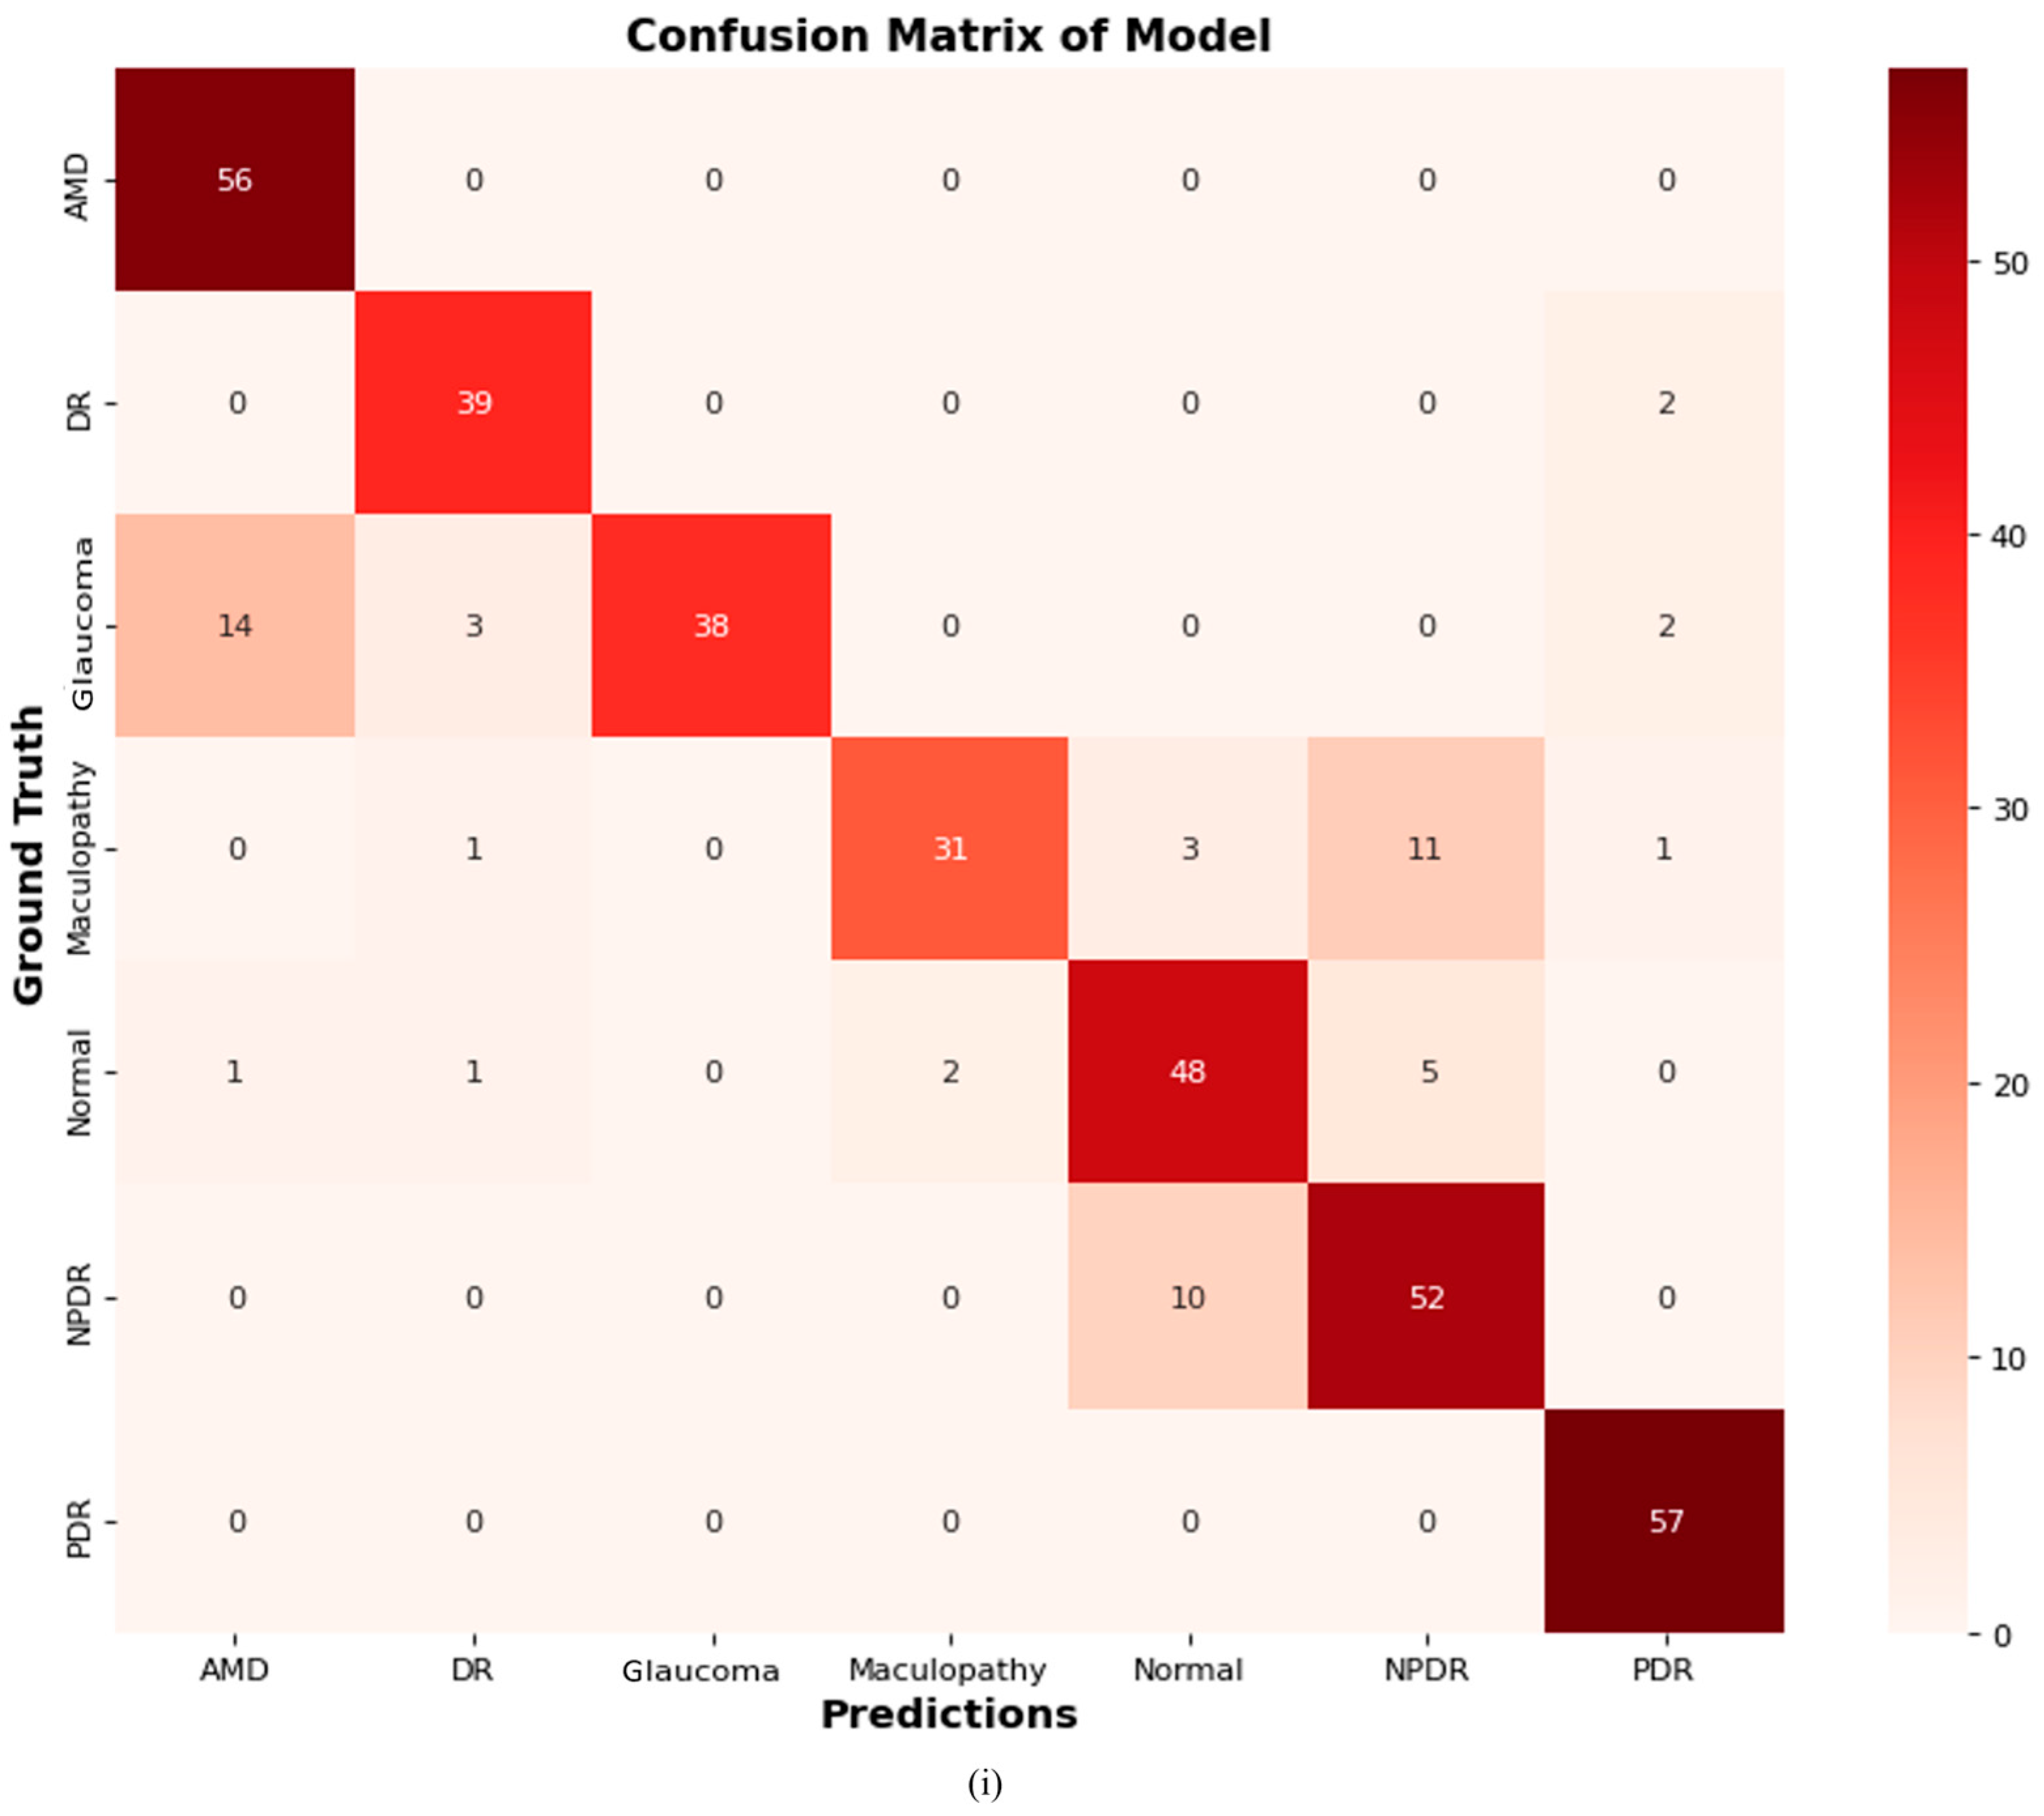
4.2.9. Confusion Matrix of Proposed ODDM

A confusion matrix is generated to evaluate the performance of the proposed ODDM and baseline models, as depicted in Figure 14. The proposed ODDM correctly classifies 56 cases as AMD, 39 cases as DR, 38 cases as GLU, 31 cases as MAC, 48 cases as NOR, 52 cases as NPDR, and 57 cases as PDR. Additionally, the proposed ODDM misclassifies 02 cases of DR as PDR and 03 cases of MAC as NOR. The R1 model accurately classifies 44, 49, 37, 45, 39, 42, and 56 cases as AMD, DR, GLU, MAC, NOR, NPDR, and PDR, respectively. Furthermore, R5 correctly classifies 41 cases as AMD, 41 cases as DR, 37 cases as GLU, 35 cases as MAC, 38 cases as NOR, 40 cases as NPDR, and 43 cases as PDR. The detailed results of the confusion matrix are presented in Figure 14.

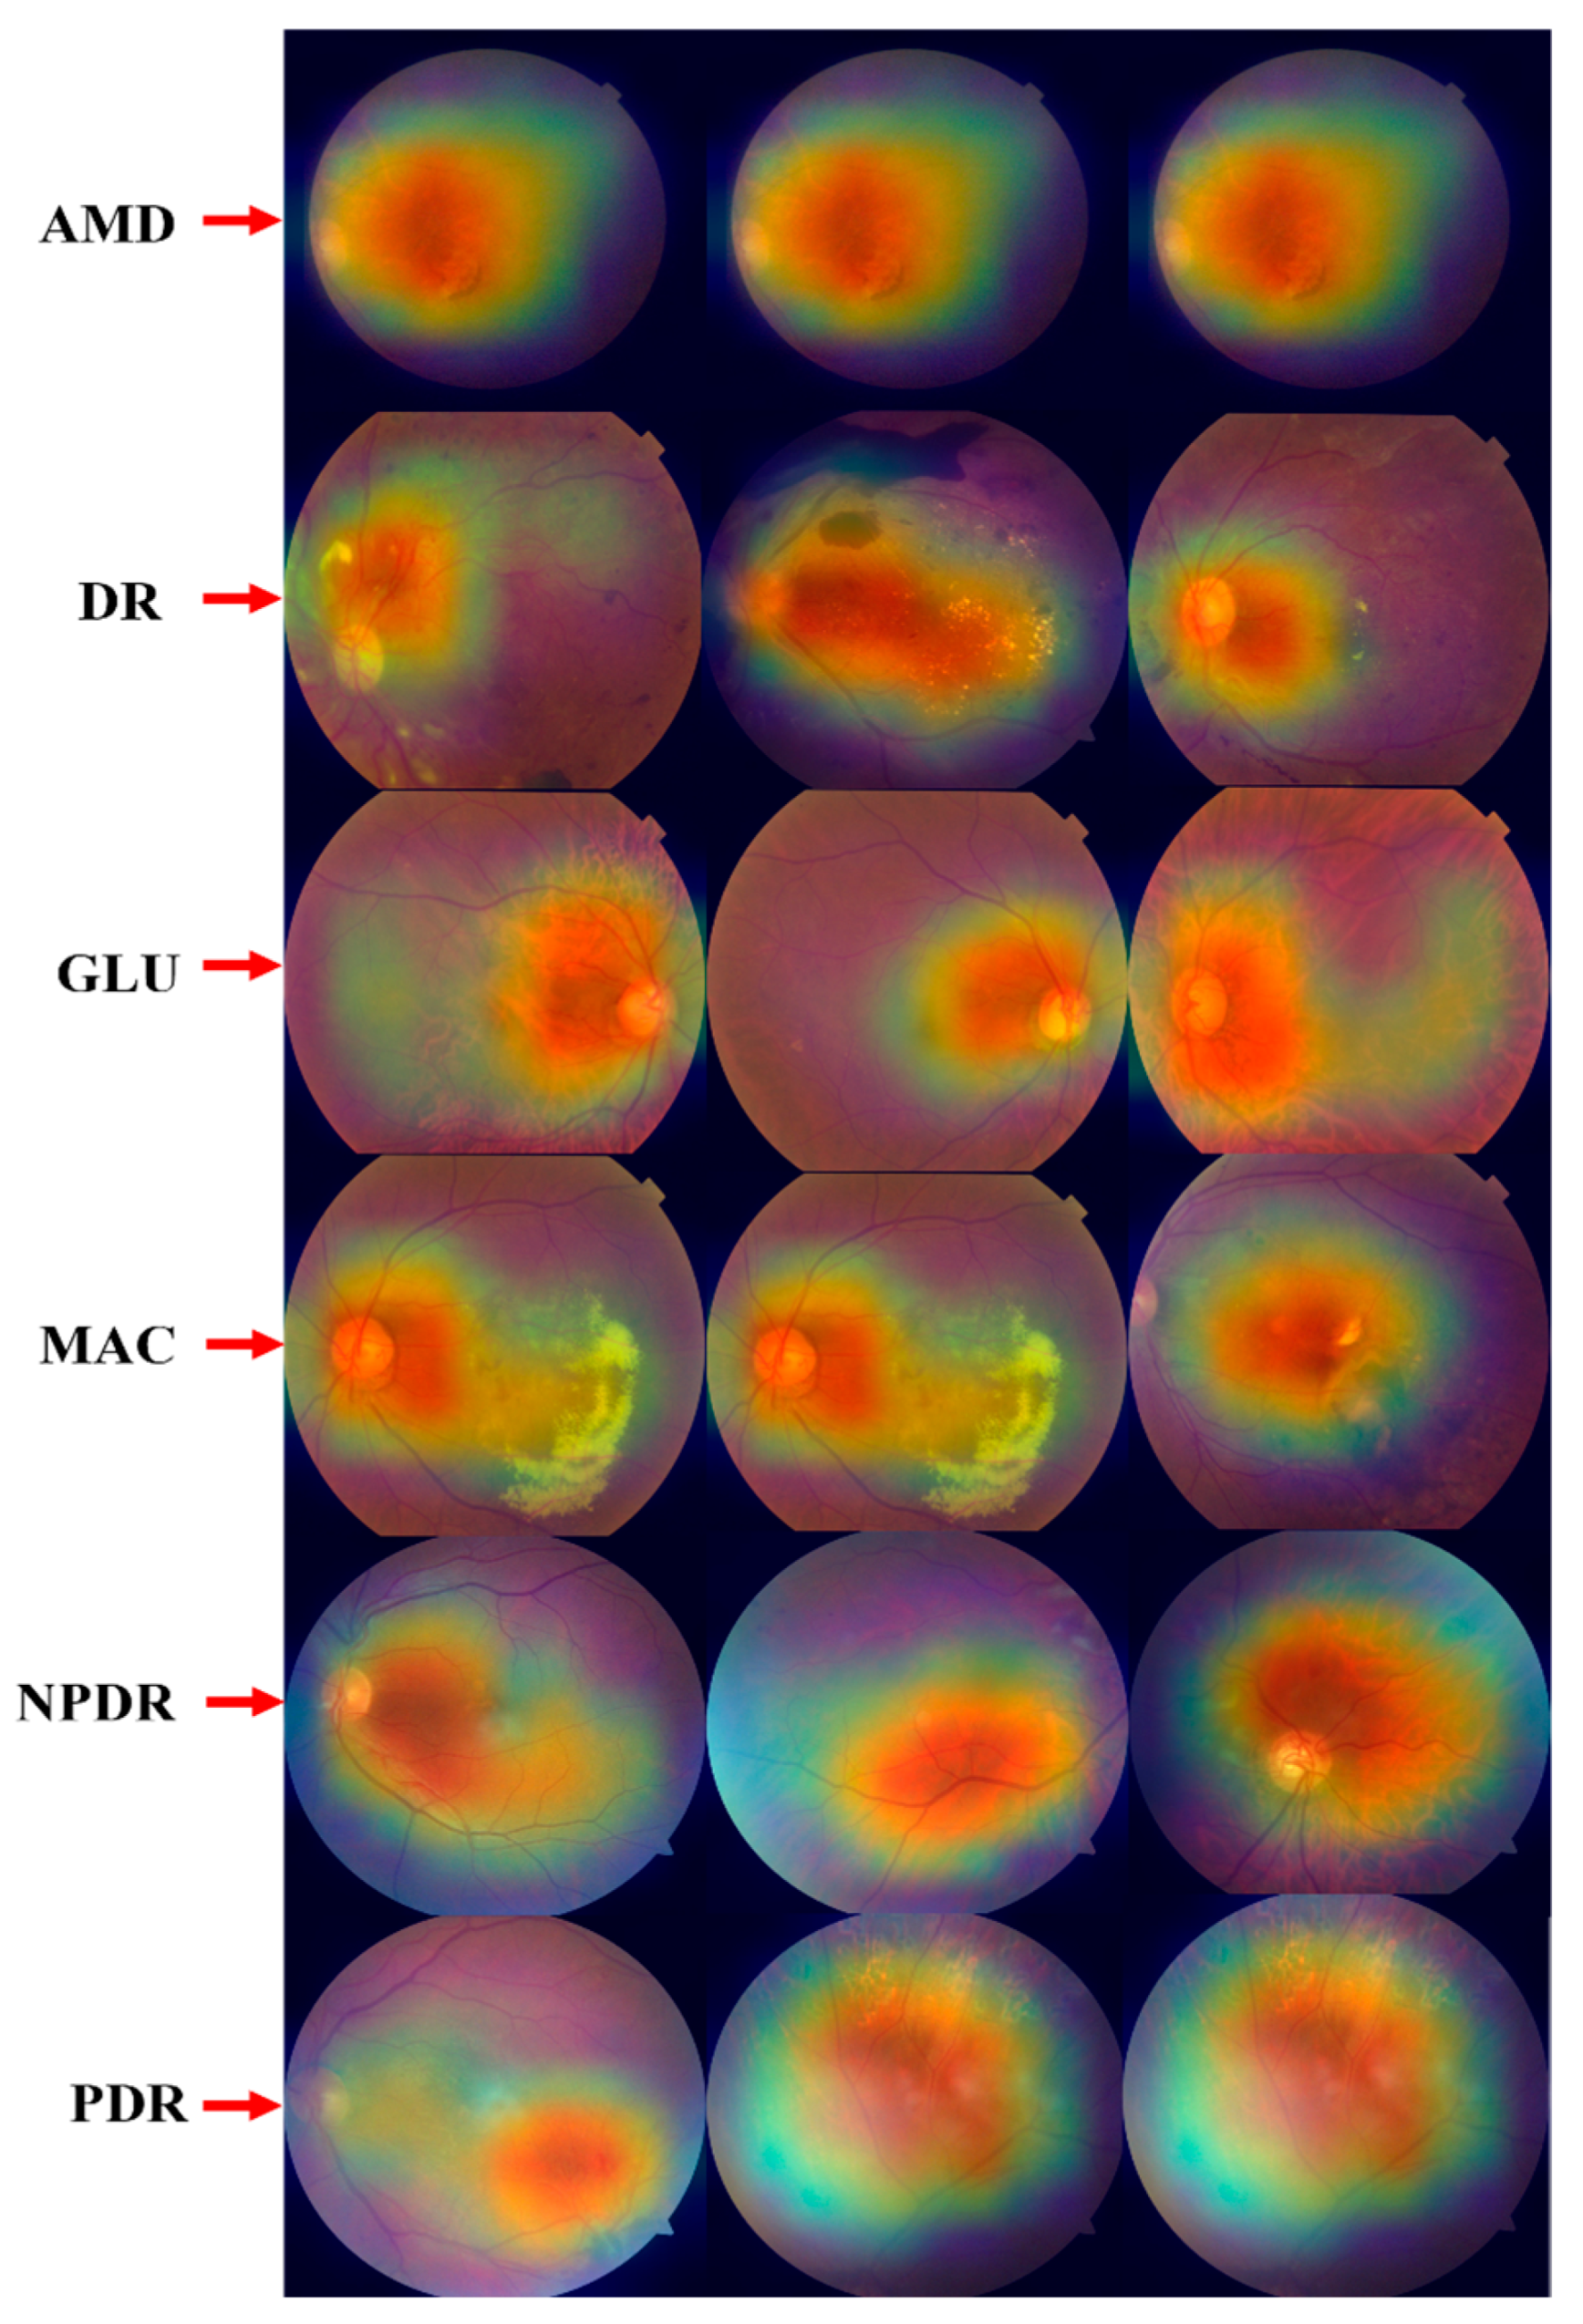
4.2.10. GRAD-CAM Visualization of Proposed ODDM

This section presents the GRAD-CAM approach to visually represent the output of the ODDM. The purpose of the heatmap is to depict the relevant area of the ODs that the proposed ODDM focuses on. Figure 15 illustrates the heatmap of the proposed ODDM.

4.3. Ablation Experiments

This work integrates SM-TOM with the proposed ODDM for the classification of ODs using CFIs. To assess whether the proposed ODDM was effective in ODs using CFIs, the outcomes of the ablation experiment were statistically determined using the control variable approach. Table 8 shows the effectiveness of the proposed ODDM with and without SM-TOM in classifying the ODs by using CFIs. In ablation, two experiments were performed. Experiment 1 was used to apply the proposed ODDM for the classification of ODs. Experiment 2 used the proposed ODDM with SM-TOM to classify the ODs.
When comparing the results of Experiments 1 and 2, it is revealed that combining SM-TOM with the ODDM increases the average classification accuracy by 20.04%. Experiment 2 shows noteworthy outcomes that can be attributed to two factors: first, Tomek link [97] undersampling removes samples from majority class boundaries; second, SMOTE [91,92,93] creates synthetic CFIs of the minority class to balance the OD dataset. The proposed ODDM with SM-TOM effectively generalizes across both groups using a balanced OD dataset, leading to improved performance and reduced bias towards the majority class.

4.4. Results of ANOVA and Tukey’s HSD Post Hoc Test

This study employs an ANOVA and Tukey’s HSD post hoc test to evaluate the statistical significance of the models. The results obtained by using an ANOVA are presented in Table 9.
From Table 9, it was observed that the p-value < 0.05, which rejects H0. Thus, this means that there is a statistically significant difference in the accuracy of at least one model compared to other models. We then applied Tukey’s HSD post hoc test to compare the models pairwise. The reason for using Tukey’s HSD post hoc test is to determine which models differ significantly from each other. All detailed results are presented in Table 10.
From Table 10, it was observed that the proposed ODDM (with SM-TOM) statistically outperforms R1 with a p-value of 0.005. This shows that the proposed ODDM (with SM-TOM) is statistically superior to the R1 model. The proposed ODDM is also compared with all other models, including R2, R3, R4, R5, R6, and R7, and the results reveal that the proposed ODDM is statistically significant in all of them.

4.5. Comparison of Proposed ODDM with SOTA

This section presents a comparison of the proposed ODDM with recent SOTA methods. Table 11 shows an extensive comparison of the proposed ODDM with SOTA in terms of accuracy.

4.6. Discussion

ODs are generally classified by using CFIs [9]. Several studies [11,12,13,14,15,16,17,21,23] used CFIs for the classification of several types of ODs such as DR, AMD, MAC, etc. ODs are clusters of multiple eye diseases, and it is difficult for eye specialists or ophthalmologists to identify the eye disease accurately [26,27,28]. However, the condition of eye diseases varies from patient to patient [30]. Several studies [32,35,36,37,38,39,44,46] conclude that a patient with diabetic history is at risk of diabetic retinopathy. If ODs are not diagnosed in their initial stage, patients can face severe eye complications and blindness. Thus, the objective of this study was to develop a custom model named the ODDM for the classification of seven types of ODs. A publicly available benchmark OD dataset [25] was used. The dataset contains an imbalanced number of images in each class of ODs, as discussed in Table 2. To handle this issue, the SM-TOM method was used to balance the distribution of the CFI in each class of the OD dataset. After applying SM-TOM [46], a detailed enhanced dataset was created and is presented in Table 3. Additionally, Algorithm 1 presents the pseudocode of SM-TOM. Several pre-processing methods were also used. The workflow of the proposed framework is presented in Figure 2. The proposed ODDM was trained and tested on the enhanced dataset. Additionally, the operation of the proposed ODDM is presented in Algorithm 2.
The proposed ODDM with and without employing SM-TOM was compared with seven CNN-based baseline models, including R1, R2, R3, R4, R5, R6, and R7. The highest classification accuracy of 97.19% was achieved by the proposed ODDM with SM-TOM. The other seven baseline models R7, R5, R6, R1, R4, R2, and R3 produced an accuracy of 83.15%, 73.33%, 85.14%, 83.42%, 79.46%, 80.80%, and 73.13%. Additionally, 77.15% accuracy was achieved by the proposed ODDM without using SM-TOM for the classification of ODs. Table 7 presents the comprehensive results obtained by using the proposed ODDM and other baseline models. Ablation experiments were also performed to observe the effectiveness of the proposed ODDM with SM-TOM, as discussed in Table 8. Additionally, ANOVA and Tukey HSD post hoc tests were also performed to represent the statistical significance of the proposed model and other models used in this work for the classification of ODs. The results in Table 10 demonstrate that the proposed ODDM with SM-TOM is statistically superior compared to the R1, R2, R3, R4, R5, R6, and R7 models.
With a significant classification accuracy of 97.19%, the outcomes shown in Table 7 demonstrate the effectiveness of the proposed ODDM with SM-TOM in classifying ODs and extracting prominent discriminative patterns from CFIs. The baseline models used in this study attained less classification accuracy due to their deep network [52], and their last convolutional layer limited their classification performance [93,94,95]. The filter size of these baseline models was not appropriate [55], and their neurons connected to the input layer are so large that they may neglect the dominant features of the CFI. Furthermore, a vanishing gradient [58,59,60,61,62,63,64,65,66,67,68] problem occurred throughout the training process of these baseline models. The integration of SM-TOM and the proposed ODDM resolves all of these issues. In the proposed ODDM, a streamlined CNN layer structure is included to keep the gradient from disappearing. Furthermore, the proposed ODDM generates fewer training parameters, which further lowers the network’s complexity, as discussed in Table 5.
As discussed in Table 11, Al-Fahdawi et al. [68] proposed a CNN-based deepNet model for the classification of OD. They achieved a classification accuracy of 74.62%. Vidivelli et al. [37] proposed a model named CataractNetDetect for the classification of cataracts from pairs of CFIs. The CataractNetDetect model achieves a 97.90% AUC. Another study [97] proposed a CNN model for the diagnosis of ODs. This proposed model produced an accuracy of 72.70%. Rubina et al. [39] used a Vgg-16 model for the classification of DR. Vgg-16 achieved a classification accuracy of 85.95% on mild multi-class DED. Farag et al. [42] proposed a CBAM model for the identification of the severity level of diabetic retinopathy and achieved an accuracy of 95.00%. Pawar et al. [41] designed a 19-layer CNN model to classify ODs using the CFIs obtained from ICDR. The proposed 19-layer CNN model attained a remarkable specificity of 91.47%. Bhati et al. [93] used a CNN model for ophthalmic disease detection on imbalanced fundus images. They achieved a classification accuracy of 93.14%. Vadduri et al. [43] applied various TL methods for automatically classifying DED based on images. Accuracy levels of 90.00% or higher in classifying DED were achieved by all TL models. This study proposed an ODDM with SM-TOM for the classification of ODs by CFIs on an imbalanced dataset. The proposed ODDM achieved a classification accuracy of 97.17%, which is superior to that of SOTA classifiers.

5. Conclusions

ODs represent a group of diseases that affect the functioning of the human eye. CFIs are used to diagnose ODs. Therefore, this study designed the proposed ODDM with SM-TOM for the classification of ODs using CFIs. The proposed ODDM contains convolutional blocks with further layers, such as ConvL, max pooling, and ReLU, to classify ODs. The ocular dataset contains an imbalanced distribution of images in each class of ODs, so SM-TOM was used to handle this problem. Additionally, Grad-CAM shows a heatmap of class activation to demonstrate the process of the proposed ODDM. The proposed ODDM with SM-TOM obtained an accuracy of 97.19%, a recall of 88.74%, a precision of 95.23%, a 98.94% AUC, and an F1-score of 88.31%, which were superior to those of baseline models as well as modern SOTA. Ablation experiments also demonstrated the effectiveness of the proposed ODDM with SM-TOM. Thus, this study concluded that the proposed ODDM with SM-TOM can be a great help to ophthalmologists in classifying ODs such as AMD, DR, MAC, NPDR, PDR, GLU, and NOR. One limitation of this study is that the proposed ODDM is not suitable for the OCT images used for the identification of ODs. In the future, we will integrate the federated learning model with the proposed ODDM for patient data privacy.

Author Contributions

Conceptualization A.D.A.Q. and H.M.; methodology, A.D.A.Q., A.N. and R.A.N.; validation, R.A.N., D.J. and S.N.H.; formal analysis, S.N.H. and A.N.; investigation, S.N.H. and R.A.N.; resources, R.A.N. and D.J.; data curation, S.N.H.; writing—original draft preparation, A.D.A.Q., H.M. and S.N.H.; writing—review and editing, R.A.N., D.J. and A.N.; visualization, H.M. and A.N.; supervision, A.N., D.J. and R.A.N.; funding acquisition, R.A.N. All authors have read and agreed to the published version of the manuscript.

Funding

This work was supported by a National Research Foundation (NRF) grant funded by the Ministry of Science and ICT (MSIT), Republic of Korea, through the Development Research Program NRF [2022-R1-G1A1(010226)].

Institutional Review Board Statement

Not applicable.

Informed Consent Statement

Not applicable.

Data Availability Statement

The original contributions presented in this study are included in the article. Further inquiries can be directed to the corresponding authors.

Conflicts of Interest

The authors declare no conflicts of interest.

Abbreviations

The following abbreviations are used in this manuscript:
ODsOcular Diseases
CFIsColor Fundus Images
DLDeep Learning
CNNConvolutional Neural Network
NORNormal
AMDAge-Related Macular Degeneration
DRDiabetic Retinopathy
GLUGlaucoma
MACMaculopathy
NPDRNon-Proliferative Diabetic Retinopathy
PDRProliferative Diabetic Retinopathy

References

  1. Flaxman, S.R.; Bourne, R.R.; Resnikoff, S.; Ackland, P.; Braithwaite, T.; Cicinelli, M.V.; Zheng, Y. Global causes of blindness and distance vision impairment 1990–2020: A systematic review and meta-analysis. Lancet Glob. Health 2017, 5, e1221–e1234. [Google Scholar] [CrossRef]
  2. Wiedemann, P. LOVE your eyes—World Sight Day 2022. Int. J. Ophthalmol. 2022, 15, 1567. [Google Scholar] [CrossRef] [PubMed]
  3. Wong, W.L.; Su, X.; Li, X.; Cheung, C.M.G.; Klein, R.; Cheng, C.Y.; Wong, T.Y. Global prevalence of age-related macular degeneration and disease burden projection for 2020 and 2040: A systematic review and meta-analysis. Lancet Glob. Health 2014, 2, e106–e116. [Google Scholar] [CrossRef]
  4. Cheyne, C.P.; Burgess, P.I.; Broadbent, D.M.; García-Fiñana, M.; Stratton, I.M.; Criddle, T.; Jones, L. Incidence of sight-threatening diabetic retinopathy in an established urban screening programme: An 11-year cohort study. Diabet. Med. 2021, 38, e14583. [Google Scholar] [CrossRef]
  5. Schultz, N.M.; Bhardwaj, S.; Barclay, C.; Gaspar, L.; Schwartz, J. Global burden of dry age-related macular degeneration: A targeted literature review. Clin. Ther. 2021, 43, 1792–1818. [Google Scholar] [CrossRef]
  6. Wild, S.; Roglic, G.; Green, A.; Sicree, R.; King, H. Global prevalence of diabetes: Estimates for the year 2000 and projections for 2030. Diabetes Care 2004, 27, 1047–1053. [Google Scholar] [CrossRef] [PubMed]
  7. Lim, G.; Bellemo, V.; Xie, Y.; Lee, X.Q.; Yip, M.Y.; Ting, D.S. Different fundus imaging modalities and technical factors in AI screening for diabetic retinopathy: A review. Eye Vis. 2020, 7, 21. [Google Scholar] [CrossRef] [PubMed]
  8. He, J.; Li, C.; Ye, J.; Qiao, Y.; Gu, L. Multi-label ocular disease classification with a dense correlation deep neural network. Biomed. Signal Process. Control. 2021, 63, 102167. [Google Scholar] [CrossRef]
  9. Wang, J.; Yang, L.; Huo, Z.; He, W.; Luo, J. Multi-label classification of fundus images with efficientnet. IEEE Access 2020, 8, 212499–212508. [Google Scholar] [CrossRef]
  10. Azzopardi, G.; Strisciuglio, N.; Vento, M.; Petkov, N. Trainable COSFIRE filters for vessel delineation with application to retinal images. Med. Image Anal. 2015, 19, 46–57. [Google Scholar] [CrossRef]
  11. Zhang, Z.; Srivastava, R.; Liu, H.; Chen, X.; Duan, L.; Kee Wong, D.W.; Liu, J. A survey on computer aided diagnosis for ocular diseases. BMC Med. Inform. Decis. Mak. 2014, 14, 80. [Google Scholar] [CrossRef]
  12. Sarhan, M.H.; Nasseri, M.A.; Zapp, D.; Maier, M.; Lohmann, C.P.; Navab, N.; Eslami, A. Machine learning techniques for ophthalmic data processing: A review. IEEE J. Biomed. Health Inform. 2020, 24, 3338–3350. [Google Scholar] [CrossRef]
  13. Burlina, P.M.; Joshi, N.; Pekala, M.; Pacheco, K.D.; Freund, D.E.; Bressler, N.M. Automated grading of age-related macular degeneration from color fundus images using deep convolutional neural networks. JAMA Ophthalmol. 2017, 135, 1170–1176. [Google Scholar] [CrossRef]
  14. Chen, X.; Xu, Y.; Duan, L.; Yan, S.; Zhang, Z.; Wong, D.W.K.; Liu, J. Multiple ocular diseases classification with graph regularized probabilistic multi-label learning. In Proceedings of the Computer Vision—ACCV 2014: 12th Asian Conference on Computer Vision, Singapore, 1–5 November 2014; Revised Selected Papers, Part IV 12. Springer International Publishing: Cham, Switzerland, 2015; pp. 127–142. [Google Scholar]
  15. Li, Z.; Keel, S.; Liu, C.; He, Y.; Meng, W.; Scheetz, J.; He, M. An automated grading system for detection of vision-threatening referable diabetic retinopathy on the basis of color fundus photographs. Diabetes Care 2018, 41, 2509–2516. [Google Scholar] [CrossRef]
  16. Richards, B.A.; Lillicrap, T.P.; Beaudoin, P.; Bengio, Y.; Bogacz, R.; Christensen, A.; Kording, K.P. A deep learning framework for neuroscience. Nat. Neurosci. 2019, 22, 1761–1770. [Google Scholar] [CrossRef]
  17. Wang, Z.; Keane, P.A.; Chiang, M.; Cheung, C.Y.; Wong, T.Y.; Ting, D.S.W. Artificial intelligence and deep learning in ophthalmology. In Artificial Intelligence in Medicine; Springer International Publishing: Cham, Switzerland, 2022; pp. 1519–1552. [Google Scholar]
  18. Gulshan, V.; Peng, L.; Coram, M.; Stumpe, M.C.; Wu, D.; Narayanaswamy, A.; Webster, D.R. Development and validation of a deep learning algorithm for detection of diabetic retinopathy in retinal fundus photographs. JAMA 2016, 316, 2402–2410. [Google Scholar] [CrossRef]
  19. Litjens, G.; Ciompi, F.; Wolterink, J.M.; de Vos, B.D.; Leiner, T.; Teuwen, J.; Išgum, I. State-of-the-art deep learning in cardiovascular image analysis. JACC Cardiovasc. Imaging 2019, 12 Pt 1, 1549–1565. [Google Scholar] [CrossRef] [PubMed]
  20. Esteva, A.; Kuprel, B.; Novoa, R.A.; Ko, J.; Swetter, S.M.; Blau, H.M.; Thrun, S. Dermatologist-level classification of skin cancer with deep neural networks. Nature 2017, 542, 115–118. [Google Scholar] [CrossRef] [PubMed]
  21. Sureyya Rifaioglu, A.; Doğan, T.; Jesus Martin, M.; Cetin-Atalay, R.; Atalay, V. DEEPred: Automated protein function prediction with multi-task feed-forward deep neural networks. Sci. Rep. 2019, 9, 7344. [Google Scholar] [CrossRef]
  22. Sultan, A.S.; Elgharib, M.A.; Tavares, T.; Jessri, M.; Basile, J.R. The use of artificial intelligence, machine learning and deep learning in oncologic histopathology. J. Oral Pathol. Med. 2020, 49, 849–856. [Google Scholar] [CrossRef] [PubMed]
  23. Diaz-Pinto, A.; Morales, S.; Naranjo, V.; Köhler, T.; Mossi, J.M.; Navea, A. CNNs for automatic glaucoma assessment using fundus images: An extensive validation. Biomed. Eng. Online 2019, 18, 29. [Google Scholar] [CrossRef] [PubMed]
  24. Simonyan, K.; Zisserman, A. Very deep convolutional networks for large-scale image recognition. arXiv 2014, arXiv:1409.1556. [Google Scholar]
  25. Cen, L.P.; Ji, J.; Lin, J.W.; Ju, S.T.; Lin, H.J.; Li, T.P.; Zhang, M. Automatic detection of 39 fundus diseases and conditions in retinal photographs using deep neural networks. Nat. Commun. 2021, 12, 4828. [Google Scholar] [CrossRef]
  26. Dubey, S.; Dixit, M. Recent developments on computer aided systems for diagnosis of diabetic retinopathy: A review. Multimed. Tools Appl. 2023, 82, 14471–14525. [Google Scholar] [CrossRef]
  27. Ashraf, M.N.; Hussain, M.; Habib, Z. Review of Various Tasks Performed in the Preprocessing Phase of a Diabetic Retinopathy Diagnosis System. Curr. Med. Imaging 2020, 16, 397–426. [Google Scholar] [CrossRef]
  28. Kyei, S.; Kwasi Gyaami, R.; Abowine, J.B.; Zaabaar, E.; Asiedu, K.; Boadi-Kusi, S.B.; Ayerakwah, P.A. Risk of major myopia-associated non-communicable ocular health disorders in Ghana. PLoS ONE 2024, 19, e0297052. [Google Scholar] [CrossRef]
  29. Bali, A.; Mansotra, V. Analysis of deep learning techniques for prediction of eye diseases: A systematic review. Arch. Comput. Methods Eng. 2024, 31, 487–520. [Google Scholar] [CrossRef]
  30. Sharma, H.; Wasim, J.; Sharma, P. Analysis of eye disease classification by fundus images using different machine/deep/transfer learning techniques. In Proceedings of the 2024 4th International Conference on Innovative Practices in Technology and Management (ICIPTM), Noida, India, 21–23 February 2024; pp. 1–6. [Google Scholar]
  31. Hassan, M.U.; Al-Awady, A.A.; Ahmed, N.; Saeed, M.; Alqahtani, J.; Alahmari, A.M.M.; Javed, M.W. A transfer learning enabled approach for ocular disease detection and classification. Health Inf. Sci. Syst. 2024, 12, 36. [Google Scholar] [CrossRef]
  32. Hasnain, M.A.; Malik, H.; Asad, M.M.; Sherwani, F. Deep learning architectures in dental diagnostics: A systematic comparison of techniques for accurate prediction of dental disease through x-ray imaging. Int. J. Intell. Comput. Cybern. 2024, 17, 161–180. [Google Scholar] [CrossRef]
  33. Tahir, A.; Malik, H.; Chaudhry, M.U. Multi-classification Deep Learning Models for Detecting Multiple Chest Infection Using Cough and Breath Sounds. In Deep Learning for Multimedia Processing Applications; CRC Press: Boca Raton, FL, USA, 2024; pp. 216–249. [Google Scholar]
  34. Malik, H.; Anees, T. Federated learning with deep convolutional neural networks for the detection of multiple chest diseases using chest X-rays. Multimed. Tools Appl. 2024, 83, 63017–63045. [Google Scholar] [CrossRef]
  35. Malik, H.; Anees, T. Multi-modal deep learning methods for classification of chest diseases using different medical imaging and cough sounds. PLoS ONE 2024, 19, e0296352. [Google Scholar] [CrossRef]
  36. Abd El-Khalek, A.A.; Balaha, H.M.; Alghamdi, N.S.; Ghazal, M.; Khalil, A.T.; Abo-Elsoud, M.E.A.; El-Baz, A. A concentrated machine learning-based classification system for age-related macular degeneration (AMD) diagnosis using fundus images. Sci. Rep. 2024, 14, 2434. [Google Scholar] [CrossRef]
  37. Vidivelli, S.; Padmakumari, P.; Parthiban, C.; DharunBalaji, A.; Manikandan, R.; Gandomi, A.H. Optimising deep learning models for ophthalmological disorder classification. Sci. Rep. 2025, 15, 3115. [Google Scholar] [CrossRef] [PubMed]
  38. Li, N.; Kondo, N.; Ogawa, Y.; Shiraga, K.; Shibasaki, M.; Pinna, D.; Suzuki, T. Fundus camera-based precision monitoring of blood vitamin A level for Wagyu cattle using deep learning. Sci. Rep. 2025, 15, 4125. [Google Scholar] [CrossRef] [PubMed]
  39. Sarki, R.; Ahmed, K.; Wang, H.; Zhang, Y. Automated detection of mild and multi-class diabetic eye diseases using deep learning. Health Inf. Sci. Syst. 2020, 8, 32. [Google Scholar] [CrossRef]
  40. Anoop, B.K. Binary classification of DR-diabetic retinopathy using CNN with fundus colour images. Mater. Today Proc. 2022, 58, 212–216. [Google Scholar]
  41. Pawar, B.; Lobo, S.N.; Joseph, M.; Jegannathan, S.; Jayraj, H. Validation of artificial intelligence algorithm in the detection and staging of diabetic retinopathy through fundus photography: An automated tool for detection and grading of diabetic retinopathy. Middle East Afr. J. Ophthalmol. 2021, 28, 81–86. [Google Scholar] [CrossRef]
  42. Farag, M.M.; Fouad, M.; Abdel-Hamid, A.T. Automatic severity classification of diabetic retinopathy based on densenet and convolutional block attention module. IEEE Access 2022, 10, 38299–38308. [Google Scholar] [CrossRef]
  43. Vadduri, M.; Kuppusamy, P. Enhancing Ocular Healthcare: Deep Learning-Based multi-class Diabetic Eye Disease Segmentation and Classification. IEEE Access 2023, 11, 137881–137898. [Google Scholar] [CrossRef]
  44. Tan, Y.Y.; Kang, H.G.; Lee, C.J.; Kim, S.S.; Park, S.; Thakur, S.; Cheng, C.Y. Prognostic potentials of AI in ophthalmology: Systemic disease forecasting via retinal imaging. Eye Vis. 2024, 11, 17. [Google Scholar] [CrossRef]
  45. Oliveira, J.S.; Franco, F.O.; Revers, M.C.; Silva, A.F.; Portolese, J.; Brentani, H.; Nunes, F.L. Computer-aided autism diagnosis based on visual attention models using eye tracking. Sci. Rep. 2021, 11, 10131. [Google Scholar] [CrossRef]
  46. Li, B.; Barney, E.; Hudac, C.; Nuechterlein, N.; Ventola, P.; Shapiro, L.; Shic, F. Selection of Eye-Tracking Stimuli for Prediction by Sparsely Grouped Input Variables for Neural Networks: Towards Biomarker Refinement for Autism. In Proceedings of the ACM Symposium on Eye Tracking Research and Applications, Stuttgart, Germany, 2–5 June 2020; pp. 1–8. [Google Scholar]
  47. Raghavendra, U.; Fujita, H.; Bhandary, S.V.; Gudigar, A.; Tan, J.H.; Acharya, U.R. Deep convolution neural network for accurate diagnosis of glaucoma using digital fundus images. Inf. Sci. 2018, 441, 41–49. [Google Scholar] [CrossRef]
  48. dos Santos Ferreira, M.V.; de Carvalho Filho, A.O.; de Sousa, A.D.; Silva, A.C.; Gattass, M. Convolutional neural network and texture descriptor-based automatic detection and diagnosis of glaucoma. Expert Syst. Appl. 2018, 110, 250–263. [Google Scholar] [CrossRef]
  49. Prananda, A.R.; Frannita, E.L.; Hutami, A.H.T.; Maarif, M.R.; Fitriyani, N.L.; Syafrudin, M. Retinal nerve fiber layer analysis using deep learning to improve glaucoma detection in eye disease assessment. Appl. Sci. 2022, 13, 37. [Google Scholar] [CrossRef]
  50. Sheraz, H.; Shehryar, T.; Khan, Z.A. Two stage-network: Automatic localization of Optic Disc (OD) and classification of glaucoma in fundus images using deep learning techniques. Multimed. Tools Appl. 2024, 84, 12949–12977. [Google Scholar] [CrossRef]
  51. Liu, Z.; Huang, W.; Wang, Z.; Jin, L.; Congdon, N.; Zheng, Y.; Liu, Y. Evaluation of a self-imaging OCT for remote diagnosis and monitoring of retinal diseases. Br. J. Ophthalmol. 2024, 108, 1154–1160. [Google Scholar] [CrossRef] [PubMed]
  52. Khan, A.Q.; Sun, G.; Khalid, M.; Imran, A.; Bilal, A.; Azam, M.; Sarwar, R. A novel fusion of genetic grey wolf optimization and kernel extreme learning machines for precise diabetic eye disease classification. PLoS ONE 2024, 19, e0303094. [Google Scholar] [CrossRef]
  53. Wykoff, C.C.; Do, D.V.; Goldberg, R.A.; Dhoot, D.S.; Lim, J.I.; Du, W.; Clark, W.L. Ocular and Systemic Risk Factors for Disease Worsening Among Patients with NPDR: Post Hoc Analysis of the PANORAMA Trial. Ophthalmol. Retin. 2024, 8, 399–408. [Google Scholar] [CrossRef]
  54. Chelaramani, S.; Gupta, M.; Agarwal, V.; Gupta, P.; Habash, R. Multi-task knowledge distillation for eye disease prediction. In Proceedings of the IEEE/CVF Winter Conference on Applications of Computer Vision (WACV), Virtual, 5–9 January 2021; pp. 3983–3993. [Google Scholar]
  55. Lu, D.; Heisler, M.; Lee, S.; Ding, G.W.; Navajas, E.; Sarunic, M.V.; Beg, M.F. Deep-learning based multiclass retinal fluid segmentation and detection in optical coherence tomography images using a fully convolutional neural network. Med. Image Anal. 2019, 54, 100–110. [Google Scholar] [CrossRef]
  56. Szeskin, A.; Yehuda, R.; Shmueli, O.; Levy, J.; Joskowicz, L. A column-based deep learning method for the detection and quantification of atrophy associated with AMD in OCT scans. Med. Image Anal. 2021, 72, 102130. [Google Scholar] [CrossRef]
  57. Aamir, M.; Irfan, M.; Ali, T.; Ali, G.; Shaf, A.; Al-Beshri, A.; Mahnashi, M.H. An adoptive threshold-based multi-level deep convolutional neural network for glaucoma eye disease detection and classification. Diagnostics 2020, 10, 602. [Google Scholar] [CrossRef]
  58. Devalla, S.K.; Renukanand, P.K.; Sreedhar, B.K.; Subramanian, G.; Zhang, L.; Perera, S.; Girard, M.J. DRUNET: A dilated-residual U-Net deep learning network to segment optic nerve head tissues in optical coherence tomography images. Biomed. Opt. Express 2018, 9, 3244–3265. [Google Scholar] [CrossRef]
  59. Arsalan, M.; Haider, A.; Park, C.; Hong, J.S.; Park, K.R. Multiscale triplet spatial information fusion-based deep learning method to detect retinal pigment signs with fundus images. Eng. Appl. Artif. Intell. 2024, 133, 108353. [Google Scholar] [CrossRef]
  60. Haider, A.; Arsalan, M.; Lee, M.B.; Owais, M.; Mahmood, T.; Sultan, H.; Park, K.R. Artificial Intelligence-based computer-aided diagnosis of glaucoma using retinal fundus images. Expert Syst. Appl. 2022, 207, 117968. [Google Scholar] [CrossRef]
  61. Haider, A.; Arsalan, M.; Park, C.; Sultan, H.; Park, K.R. Exploring deep feature-blending capabilities to assist glaucoma screening. Appl. Soft Comput. 2023, 133, 109918. [Google Scholar] [CrossRef]
  62. Lenka, S.; Lazarus, M.Z.; Panda, G. Glaucoma detection from retinal fundus images using graph convolution-based multi-task model. E-Prime-Adv. Electr. Eng. Electron. Energy 2025, 11, 100931. [Google Scholar] [CrossRef]
  63. Hu, W.; Li, K.; Gagnon, J.; Wang, Y.; Raney, T.; Chen, J.; Zhang, B. FundusNet: A Deep-Learning Approach for Fast Diagnosis of Neurodegenerative and Eye Diseases Using Fundus Images. Bioengineering 2025, 12, 57. [Google Scholar] [CrossRef]
  64. Kansal, I.; Khullar, V.; Sharma, P.; Singh, S.; Hamid, J.A.; Santhosh, A.J. Multiple model visual feature embedding and selection method for an efficient ocular disease classification. Sci. Rep. 2025, 15, 5157. [Google Scholar] [CrossRef]
  65. Butt, M.; Awang Iskandar, D.N.F.; Khan, M.A.; Latif, G.; Bashar, A. MEDCnet: A Memory Efficient Approach for Processing High-Resolution Fundus Images for Diabetic Retinopathy Classification Using CNN. Int. J. Imaging Syst. Technol. 2025, 35, e70063. [Google Scholar] [CrossRef]
  66. Nguyen, T.D.; Le, D.T.; Bum, J.; Kim, S.; Song, S.J.; Choo, H. Retinal disease diagnosis using deep learning on ultra-wide-field fundus images. Diagnostics 2024, 14, 105. [Google Scholar] [CrossRef]
  67. Li, Y.; Zhang, R.; Dong, L.; Shi, X.; Zhou, W.; Wu, H.; Wei, W. Predicting systemic diseases in fundus images: Systematic review of setting, reporting, bias, and models’ clinical availability in deep learning studies. Eye 2024, 38, 1246–1251. [Google Scholar] [CrossRef]
  68. Al-Fahdawi, S.; Al-Waisy, A.S.; Zeebaree, D.Q.; Qahwaji, R.; Natiq, H.; Mohammed, M.A.; Deveci, M. Fundus-deepnet: Multi-label deep learning classification system for enhanced detection of multiple ocular diseases through data fusion of fundus images. Inf. Fusion 2024, 102, 102059. [Google Scholar] [CrossRef]
  69. Hussain, S.K.; Ramay, S.A.; Shaheer, H.; Abbas, T.; Mushtaq, M.A.; Paracha, S.; Saeed, N. Automated Classification of Ophthalmic Disorders Using Color Fundus Images. Kurd. Stud. 2024, 12, 1344–1348. [Google Scholar]
  70. Hemelings, R.; Elen, B.; Schuster, A.K.; Blaschko, M.B.; Barbosa-Breda, J.; Hujanen, P.; Stalmans, I. A generalizable deep learning regression model for automated glaucoma screening from fundus images. npj Digit. Med. 2023, 6, 112. [Google Scholar] [CrossRef]
  71. Sengar, N.; Joshi, R.C.; Dutta, M.K.; Burget, R. EyeDeep-Net: A multi-class diagnosis of retinal diseases using deep neural network. Neural Comput. Appl. 2023, 35, 10551–10571. [Google Scholar] [CrossRef]
  72. Thanki, R. A deep neural network and machine learning approach for retinal fundus image classification. Healthc. Anal. 2023, 3, 100140. [Google Scholar] [CrossRef]
  73. Nazir, T.; Nawaz, M.; Rashid, J.; Mahum, R.; Masood, M.; Mehmood, A.; Hussain, A. Detection of diabetic eye disease from retinal images using a deep learning based CenterNet model. Sensors 2021, 21, 5283. [Google Scholar] [CrossRef]
  74. Bodapati, J.D.; Shaik, N.S.; Naralasetti, V. Deep convolution feature aggregation: An application to diabetic retinopathy severity level prediction. Signal Image Video Process. 2021, 15, 923–930. [Google Scholar] [CrossRef]
  75. Khan, M.S.M.; Ahmed, M.; Rasel, R.Z.; Khan, M.M. Cataract detection using convolutional neural network with VGG-19 model. In Proceedings of the 2021 IEEE World AI IoT Congress (AIIoT), Online, 10–13 May 2021; IEEE: New York, NY, USA, 2021; pp. 0209–0212. [Google Scholar]
  76. Sarki, R.; Ahmed, K.; Wang, H.; Zhang, Y.; Wang, K. Convolutional neural network for multi-class classification of diabetic eye disease. EAI Endorsed Trans. Scalable Inf. Syst. 2022, 9, e5. [Google Scholar] [CrossRef]
  77. Pahuja, R.; Sisodia, U.; Tiwari, A.; Sharma, S.; Nagrath, P. A Dynamic Approach of Eye Disease Classification Using Deep Learning and Machine Learning Model. In Proceedings of Data Analytics and Management; Springer: Singapore, 2022; pp. 719–736. [Google Scholar]
  78. Vives-Boix, V.; Ruiz-Fernández, D. Diabetic retinopathy detection through convolutional neural networks with synaptic metaplasticity. Comput. Methods Programs Biomed. 2021, 206, 106094. [Google Scholar] [CrossRef]
  79. Zhang, C.; Lei, T.; Chen, P. Diabetic retinopathy grading by a source-free transfer learning approach. Biomed. Signal Process. Control. 2022, 73, 103423. [Google Scholar] [CrossRef]
  80. Gangwar, A.K.; Ravi, V. Diabetic retinopathy detection using transfer learning and deep learning. In Evolution in Computational Intelligence: Frontiers in Intelligent Computing: Theory and Applications (FICTA 2020); Springer: Singapore, 2021; Volume 1, pp. 679–689. [Google Scholar]
  81. Malik, H.; Farooq, M.S.; Khelifi, A.; Abid, A.; Qureshi, J.N.; Hussain, M. A comparison of transfer learning performance versus health experts in disease diagnosis from medical imaging. IEEE Access 2020, 8, 139367–139386. [Google Scholar] [CrossRef]
  82. Malik, H.; Anees, T.; Din, M.; Naeem, A. CDC_Net: Multi-classification convolutional neural network model for detection of COVID-19, pneumothorax, pneumonia, lung Cancer, and tuberculosis using chest X-rays. Multimed. Tools Appl. 2023, 82, 13855–13880. [Google Scholar] [CrossRef]
  83. Khan, A.H.; Malik, H.; Khalil, W.; Hussain, S.K.; Anees, T.; Hussain, M. Spatial Correlation Module for Classification of Multi-Label Ocular Diseases Using Color Fundus Images. Comput. Mater. Contin. 2023, 76, 133–150. [Google Scholar] [CrossRef]
  84. Malik, H.; Anees, T. BDCNet: Multi-classification convolutional neural network model for classification of COVID-19, pneumonia, and lung cancer from chest radiographs. Multimed. Syst. 2022, 28, 815–829. [Google Scholar] [CrossRef]
  85. Hasnain, M.A.; Ali, S.; Malik, H.; Irfan, M.; Maqbool, M.S. Deep learning-based classification of dental disease using X-rays. J. Comput. Biomed. Inform. 2023, 5, 82–95. [Google Scholar]
  86. Chawla, N.V.; Bowyer, K.W.; Hall, L.O.; Kegelmeyer, W.P. SMOTE: Synthetic minority over-sampling technique. J. Artif. Intell. Res. 2002, 16, 321–357. [Google Scholar] [CrossRef]
  87. Riaz, S.; Naeem, A.; Malik, H.; Naqvi, R.A.; Loh, W.K. Federated and Transfer Learning Methods for the Classification of Melanoma and Nonmelanoma Skin Cancers: A Prospective Study. Sensors 2023, 23, 8457. [Google Scholar] [CrossRef]
  88. Majidpour, J.; Rashid, T.A.; Thinakaran, R.; Batumalay, M.; Dewi, D.A.; Hassan, B.A.; Arabi, H. NSGA-II-DL: Metaheuristic optimal feature selection with Deep Learning Framework for HER2 classification in Breast Cancer. IEEE Access 2024, 12, 38885–38898. [Google Scholar]
  89. Cuevas, A.; Febrero, M.; Fraiman, R. An anova test for functional data. Comput. Stat. Data Anal. 2004, 47, 111–122. [Google Scholar] [CrossRef]
  90. Abdi, H.; Williams, L.J. Tukey’s honestly significant difference (HSD) test. Encycl. Res. Des. 2010, 3, 1–5. [Google Scholar]
  91. Hairani, H.; Anggrawan, A.; Priyanto, D. Improvement performance of the random forest method on unbalanced diabetes data classification using Smote-Tomek Link. JOIV Int. J. Inform. Vis. 2023, 7, 258–264. [Google Scholar] [CrossRef]
  92. Malik, H.; Anees, T. Deep Learning-based Classification of COVID-19 Variants and Lung Cancer Using CT Scans. J. Comput. Biomed. Inform. 2023, 6, 238–269. [Google Scholar]
  93. Bhati, A.; Gour, N.; Khanna, P.; Ojha, A. Discriminative kernel convolution network for multi-label ophthalmic disease detection on imbalanced fundus image dataset. Comput. Biol. Med. 2023, 153, 106519. [Google Scholar] [CrossRef]
  94. Xiao, Y.; Ding, X.; Liu, S.; Ma, Y.; Zhang, T.; Xiang, Z.; Zhou, X. Fusion-Attention Diagnosis Network (FADNet): An end-to-end framework for optic disc segmentation and ocular disease classification. Inf. Fusion 2025, 124, 103333. [Google Scholar] [CrossRef]
  95. Hanfi, R.; Mathur, H.; Shrivastava, R. Hybrid attention-based deep learning for multi-label ophthalmic disease detection on fundus images. Graefe’s Arch. Clin. Exp. Ophthalmol. 2025. Online ahead of print. [Google Scholar]
  96. Rani, A.A.; Karthikeyini, C.; Ravi, C.R. Eye Disease Prediction Using Deep Learning and Attention on Oct Scans. SN Comput. Sci. 2024, 5, 1065. [Google Scholar] [CrossRef]
  97. Pandey, P.U.; Ballios, B.G.; Christakis, P.G.; Kaplan, A.J.; Mathew, D.J.; Tone, S.O.; Wong, J.C. Ensemble of deep convolutional neural networks is more accurate and reliable than board-certified ophthalmologists at detecting multiple diseases in retinal fundus photographs. Br. J. Ophthalmol. 2024, 108, 417–423. [Google Scholar] [CrossRef] [PubMed]
Figure 1. A few samples of CFIs of ODs.
Jimaging 11 00278 g001
Figure 2. The workflow of the proposed ODDM for the classification of ODs using CFIs.
Jimaging 11 00278 g002
Figure 3. A few original sample images of ocular diseases before using SM-TOM.
Jimaging 11 00278 g003
Figure 4. Synthetic CFIs of ODs generated by using SM-TOM.
Jimaging 11 00278 g004
Figure 5. The structure of the proposed ODDM used for the classification of seven different ODs using CFIs.
Jimaging 11 00278 g005
Figure 6. Results achieved by proposed ODDM and baseline models in terms of accuracy: (a) R1, (b) R2, (c) R3, (d) R4, (e) R5, (f) R6, (g) R7, (h) proposed ODDM without SM-TOM, and (i) proposed ODDM with SM-TOM.
Jimaging 11 00278 g006
Figure 7. Results achieved by proposed ODDM and baseline models in terms of AUC: (a) R1, (b) R2, (c) R3, (d) R4, (e) R5, (f) R6, (g) R7, (h) proposed ODDM without SM-TOM, and (i) proposed ODDM with SM-TOM.
Jimaging 11 00278 g007
Figure 8. Results achieved by proposed ODDM and baseline models in terms of precision: (a) R1, (b) R2, (c) R3, (d) R4, (e) R5, (f) R6, (g) R7, (h) proposed ODDM without SM-TOM, and (i) proposed ODDM with SM-TOM.
Jimaging 11 00278 g008
Figure 9. Results achieved by proposed ODDM and baseline models in terms of recall: (a) R1, (b) R2, (c) R3, (d) R4, (e) R5, (f) R6, (g) R7, (h) proposed ODDM without SM-TOM, and (i) proposed ODDM with SM-TOM.
Jimaging 11 00278 g009
Figure 10. Results achieved by proposed ODDM and baseline models in terms of F1-score: (a) R1, (b) R2, (c) R3, (d) R4, (e) R5, (f) R6, (g) R7, (h) proposed ODDM without SM-TOM, and (i) proposed ODDM with SM-TOM.
Jimaging 11 00278 g010
Figure 11. Results achieved by proposed ODDM and baseline models in terms of loss: (a) R1, (b) R2, (c) R3, (d) R4, (e) R5, (f) R6, (g) R7, (h) proposed ODDM without SM-TOM, and (i) proposed ODDM with SM-TOM.
Jimaging 11 00278 g011
Figure 12. Results achieved by proposed ODDM and baseline models in terms of ROC: (a) R1, (b) R2, (c) R3, (d) R4, (e) R5, (f) R6, (g) R7, (h) proposed ODDM without SM-TOM, and (i) proposed ODDM with SM-TOM.
Jimaging 11 00278 g012
Figure 13. Results achieved by proposed ODDM and baseline models in terms of AU ROC: (a) R1, (b) R2, (c) R3, (d) R4, (e) R5, (f) R6, (g) R7, (h) proposed ODDM without SM-TOM, and (i) proposed ODDM with SM-TOM.
Jimaging 11 00278 g013
Figure 14. Confusion matrix: (a) R1, (b) R2, (c) R3, (d) R4, (e) R5, (f) R6, (g) R7, (h) proposed ODDM without SM-TOM, and (i) proposed ODDM with SM-TOM.
Jimaging 11 00278 g014aJimaging 11 00278 g014bJimaging 11 00278 g014cJimaging 11 00278 g014dJimaging 11 00278 g014e
Figure 15. GRAD-CAM visualization of proposed ODDM to highlight infected region.
Jimaging 11 00278 g015
Table 2. A summary of the ocular disease dataset before applying SM-TOM.
No. of Ocular ClassesOcular DiseasesNo. of CFIs
0AMD273
1DR318
2MAC270
3NPDR368
4NOR576
5PDR404
6GLU363
Total2572
Table 3. A summary of the ocular disease dataset after applying SM-TOM.
No. of Ocular ClassesOcular DiseasesNo. of CFI
0AMD576
1DR576
2MAC576
3NPDR576
4NOR576
5PDR576
6GLU576
Total4032
Table 4. A summary of the ocular disease dataset after applying SM-TOM and 4-fold CV.
FoldsAMDDRMACNPDRNORPDRGLUTotal
11441441441441441441441008
21441441441441441441441008
31441441441441441441441008
41441441441441441441441008
Total5765765765765765765764032
Table 5. A comprehensive summary of the proposed ODDM.
Layer TypeOutput ShapeParameters
Con_conv2d_(Conv2D)(None, 146, 146, 16)1216
MPL_average_pooling2d_(AveragePooling2D)(None, 73, 73, 16)0
Con_conv2d_1_(Conv2D)(None, 69, 69, 32)12,832
MPL_average_pooling2d_1_(AveragePooling2D)(None, 34, 34, 32)0
Con_conv2d_2_(Conv2D)(None, 30, 30, 64)51,264
MPL_average_pooling2d_2_(AveragePooling2D)(None, 15, 15, 64)0
Con_conv2d_3_(Conv2D)(None, 11, 11, 128)204,928
MPL_average_pooling2d_3_(AveragePooling2D)(None, 5, 5, 128)0
DO_dropout_(Dropout)(None, 5, 5, 128)0
FLT_flatten_(Flatten)(None, 3200)0
D_Dense_(Dense)(None, 512)819,456
DO_dropout_1_(Dropout)(None, 512)0
D_dense_1_(Dense)(None, 7)1799
Total params:1,091,495
Trainable params:1,091,495
Non-trainable params:0
Table 6. The hyperparameters of the proposed ODDM.
HyperparametersValue
Learning rate0.00001
Batch size32
Momentum0.9
No. of iterations30 epochs
Activation functionReLU, SoftMax
OptimizerRMSprop
Table 7. Evaluation of proposed ODDM and baseline models in terms of many performance metrics.
ModelsAccuracy (%)Precision (%)Recall (%)F1-Score (%)AUC (%)
R573.3379.2366.1374.1996.66
R685.1488.6683.0284.9498.57
R183.4286.5879.4183.1898.46
R479.4682.7475.4678.9198.17
R280.8083.7775.7381.0497.85
R373.1380.3964.3673.0596.04
R783.1584.6381.0182.3298.12
Proposed ODDM (Without SM-TOM)77.1583.7366.8175.1296.31
Proposed ODDM (With SM-TOM)97.1995.2388.7488.3198.94
Table 8. Outcomes produced by proposed ODDM with and without SM-TOM for classification of ODs using CFIs.
ExperimentsProposed ModelSM-TOMImage SizeAccuracy
1ODDM×150 × 150 × 377.15%
2ODDM150 × 150 × 397.19%
Table 9. Results obtained by using ANOVA test.
TestF-Statisticsp-Value
ANOVA17.310.0021
Table 10. Pairwise comparison of proposed model with baseline models for measuring statistical significance in terms of accuracy.
ComparisonMean Differencep-ValueStatistically Significant?
Proposed ODDM (With SM-TOM) vs. R16.960.005Yes
Proposed ODDM (With SM-TOM) vs. R28.180.004Yes
Proposed ODDM (With SM-TOM) vs. R312.020.003Yes
Proposed ODDM (With SM-TOM) vs. R48.850.042Yes
Proposed ODDM (With SM-TOM) vs. R511.920.003Yes
Proposed ODDM (With SM-TOM) vs. R66.010.001Yes
Proposed ODDM (With SM-TOM) vs. R77.020.002Yes
Table 11. Comparison of proposed ODDM with SOTA.
RefYearModelsNo. of ODsOcular DiseasesAccuracy
[78]2025CNN GLU, DR, Hypertension, Myopia, and Cataract89.64%
[94]2025Attention Module3Myopia, Normal, and Other Ocular Diseases90.40%
[95]2025Attention Module2Multiple Ophthalmology95.30%
[96]2024Attention with Inception-V34NOR, DME, CNV, and Drusen96.00%
[68]2024Deep-Net5DR, AMD, Hypertension, GLU, and Cataract74.62%
[97]2024CNN2GLU and Normal72.70%
[42]2022CBAM2DR and Normal95.00%
[81]2022TL2DR and Normal91.20%
[82]2021CNN2DR and Normal82.18%
[70]2023CNN2GLU and Normal92.50%
[93]2023CNN3DR, Cataract, and GLU93.14%
[73]2023CNN2GLU and Normal83.00%
Proposed ODDM with SM-TOM7DR, AMD, MAC, GLU, NPDR, PDR, and NOR97.19%
Disclaimer/Publisher’s Note: The statements, opinions and data contained in all publications are solely those of the individual author(s) and contributor(s) and not of MDPI and/or the editor(s). MDPI and/or the editor(s) disclaim responsibility for any injury to people or property resulting from any ideas, methods, instructions or products referred to in the content.