Article

Evaluation of Non-Invasive Methods for (R)-[11C]PK11195 PET Image Quantification in Multiple Sclerosis

by
Dimitri B. A. Mantovani
1,
Milena S. Pitombeira
2,
Phelipi N. Schuck
3,
Adriel S. de Araújo
4,
Carlos Alberto Buchpiguel
1,2,
Daniele de Paula Faria
1,2,* and
Ana Maria M. da Silva
1
1
Faculdade de Medicina FMUSP, Universidade de Sao Paulo, Sao Paulo 05403-911, Brazil
2
Laboratory of Nuclear Medicine (LIM 43), Department of Radiology and Oncology, Faculdade de Medicina FMUSP, Universidade de Sao Paulo, Sao Paulo 05403-911, Brazil
3
Weill Cornell Medical College, New York, NY 10065, USA
4
Graduate Program in Computer Science, Pontificia Universidade Catolica do Rio Grande do Sul PUCRS, Porto Alegre 90619-900, Brazil
*
Author to whom correspondence should be addressed.
J. Imaging 2024, 10(2), 39; https://doi.org/10.3390/jimaging10020039
Submission received: 24 November 2023 / Revised: 26 January 2024 / Accepted: 29 January 2024 / Published: 31 January 2024

Abstract

:
This study aims to evaluate non-invasive PET quantification methods for (R)-[11C]PK11195 uptake measurement in multiple sclerosis (MS) patients and healthy controls (HC) in comparison with arterial input function (AIF) using dynamic (R)-[11C]PK11195 PET and magnetic resonance images. The total volume of distribution (VT) and distribution volume ratio (DVR) were measured in the gray matter, white matter, caudate nucleus, putamen, pallidum, thalamus, cerebellum, and brainstem using AIF, the image-derived input function (IDIF) from the carotid arteries, and pseudo-reference regions from supervised clustering analysis (SVCA). Uptake differences between MS and HC groups were tested using statistical tests adjusted for age and sex, and correlations between the results from the different quantification methods were also analyzed. Significant DVR differences were observed in the gray matter, white matter, putamen, pallidum, thalamus, and brainstem of MS patients when compared to the HC group. Also, strong correlations were found in DVR values between non-invasive methods and AIF (0.928 for IDIF and 0.975 for SVCA, p < 0.0001). On the other hand, (R)-[11C]PK11195 uptake could not be differentiated between MS patients and HC using VT values, and a weak correlation (0.356, p < 0.0001) was found between VTAIF and VTIDIF. Our study shows that the best alternative for AIF is using SVCA for reference region modeling, in addition to a cautious and appropriate methodology.

1. Introduction

Multiple sclerosis (MS) is a neurological disorder that causes severe damage to the brain and spinal cord through inflammatory and neurodegenerative processes [1,2]. MS features can be observed using imaging techniques such as magnetic resonance (MR) and positron emission tomography (PET), which can provide insightful information about the pathophysiology of MS patients [3].
Dynamic PET imaging using 18-kDa translocator protein (TSPO) tracers, such as (R)-[11C]PK11195, enables the evaluation of neuroinflammatory processes by the quantification of tracer distribution parameters, such as the total volume of distribution (VT) and the distribution volume ratio (DVR).
The most reliable method for fully quantitative PET analysis is compartmental modeling with a metabolite-corrected arterial plasma tracer concentration curve, also known as arterial input function (AIF) [4,5,6]. However, due to the requirement of arterial cannulation, sophisticated equipment, and experienced professionals, AIF extraction is considered an invasive and complex procedure. Non-invasive input functions, such as image-derived input functions (IDIF) and reference regions, approach [5,7].
Recent IDIF methods are commonly based on time-activity curves extracted from blood pool sites in the PET image, such as the aorta or the carotid arteries for images with limited field-of-view. Nevertheless, these methods are highly dependent on blood vessel morphology and very susceptible to motion and partial volume effects (PVE) [7,8,9,10,11,12,13]. Input functions from reference regions also provide an adequate approach to PET quantification based on time-activity curves from non-specific binding tissues [14,15,16,17]. Nevertheless, no reference region is available for TSPO tracer once innate immune cells are spread in the whole central nervous system (CNS), and virtually all CNS can be affected by MS pathology [3].
Alternatively, pseudo-reference regions can be identified by a supervised clustering algorithm (SVCA) that classifies voxels in PET images by their kinetic behavior [18,19,20]. SVCA assumes that the time-activity curve of any voxel in the brain can be described as a linear combination of four predefined kinetic classes extracted from this study population: gray matter, white matter, blood, and a high specific binding tissue. Using a multilinear regression approach, its output is a voxel cluster mask used as a pseudo-reference region for PET quantification [18].
IDIF from carotid arteries and SVCA methods have already been used in MS cohort studies [13,21,22,23,24,25]. However, there is a lack of MS studies that directly correlate these non-invasive methods with AIF. This study aims to evaluate non-invasive methods (IDIF and SVCA) for (R)-[11C]PK11195 uptake measurement in PET images of relapsing-remitting MS (RRMS) patients and healthy controls (HC) in a direct comparison to AIF.

2. Materials and Methods

2.1. Study Cohort

This study is a retrospective analysis of a cross-sectional study that was approved by our local institutional ethics committees (registration number: 2.451.027) in accordance with the 1964 Declaration of Helsinki [26]. All image data were already anonymized to preserve participant confidentiality. All images were acquired at the Nuclear Medicine Center of the Hospital das Clinicas at the University of São Paulo, USP [26,27]. Shortly, (R)-[11C]PK11195 PET/MR images from 24 RRMS patients and 16 HC were evaluated. Table 1 shows the demographic data. Further information about the participants’ inclusion and exclusion criteria can be found in de Souza et al., 2021 and Pitombeira et al., 2022 [26,27].

2.2. Image Acquisition

(R)-[11C]PK11195 60-min dynamic PET images were acquired in a hybrid PET/MR 3 T system (SIGNA, General Electric Healthcare, Milwaukee, WI, USA) with approximately 4.0 mm of spatial resolution [26], simultaneously with a 1 min intravenous injection containing 385.54 ± 0.47 MBq of tracer activity. Arterial blood samples were manually obtained throughout the 60 min dynamic acquisition at 1 s, 10 s, 30 s, 45 s, 60 s, 90 s, 2 min, 3 min, 5 min, 10 min, 20 min, 30 min, 45 min, and 60 min postinjection. In addition, blood samples collected at 20, 45, and 60 min postinjection were used for metabolite analysis. Further information about the blood analysis is described by de Souza et al., 2021 [27].

2.3. Image Reconstruction

The 60 min PET list mode data were reconstructed in 21 frames (6 × 10 s, 2 × 30 s, 3 × 60 s, 2 × 120 s, 2 × 180 s, 3 × 300 s, and 3 × 600 s) using a 3D OSEM algorithm (2 iterations and 28 subsets) with time-of-flight information, resolution modeling, and using the GE atlas-based method for attenuation correction. After reconstruction, each frame of the dynamic PET image was smoothed with a 3 mm Gaussian filter for noise reduction. Three-dimensional MR images were acquired with T1-weighted fast spoiled gradient recalled-echo sequences (TR = 7.6 ms, TE = 3.1 ms, TI = 600 ms, flip angle = 8° slice thickness = 1 mm) using a 24-channel Head Neck Unit coil [26].

2.4. Image Processing

PET/MR image analysis was performed in PMOD 4.0 (PMOD Technologies Ltd., Zurich, Switzerland). Dynamic PET images were interframe motion-corrected using a rigid registration approach with the average of 11 first frames as the reference frame and co-registered with the respective T1-weighted MR images in the PNEURO tool. Time-activity curves from the cortical gray matter (brain and cerebellum), white matter, caudate nucleus, putamen, pallidum, thalamus, whole cerebellum, and brainstem VOIs were extracted using N30R83 Hammers-Atlas [28,29].

2.5. Input Functions: Extraction

Circular regions of interest (ROI) of 4 mm in diameter were placed in 4 consecutive slices over the carotid arteries’ C4 portion on the averaged 7 first frames (90 s) from PET registered to MRI [12]. These ROIs were dilated in 2 voxels, generating an enlarged volume of interest (VOI) related to the radioactivity spillover to adjacent tissues. Then, the enlarged VOI was dilated by 4 voxels to obtain a background VOI. The VOIs were applied to the dynamic data to obtain the carotid, adjacent tissues, and background time-activity curves. PVC was performed on IDIF data using the external PVC tool with a 4 × 4 × 4 mm3 point spread function (PSF) in PMOD. Finally, a metabolite correction was performed using population-based data from a previous study [27], which investigated the (R)-[11C]PK11195 metabolization in MS patients and healthy subjects in a Brazilian cohort.
Pseudo-reference regions were obtained using a four-tissue-based SVCA (SVCA4) [18,19,20]. The first step for the SVCA4 model construction was a whole-brain framewise normalization of the dynamic PET data of each subject, which was used to extract pre-defined kinetic classes. Each voxel value in the PET data were subtracted from the mean whole-brain frame’s value and divided by the whole-brain frame’s standard deviation. Gray matter, white matter, and blood pool classes were extracted from the HC images, while the high specific binding class was extracted from MS patients’ thalamus [18]. Carotid arteries from IDIF were used for the blood pool class [30]. Quality control steps were performed during extracting the pseudo-reference region, such as the leave-one-out procedure for SVCA4 construction and checking if the clusters’ time-activity curves had high activity peaks and fast washouts [30]. We also investigated the effect of excluding the first 20 min from the PET data on the SVCA4 results, aiming to reduce time-consuming acquisitions due to dynamic acquisitions.

2.6. PET Quantification

Logan graphical models were used to estimate the pharmacokinetic parameters related to the (R)-[11C]PK11195 PET distribution [31,32]. For AIF and IDIF methods, the Logan model based on a blood input function (Logan Plot) was used to estimate VT in target tissues in the last 40 min of the PET acquisition (t* = 20 min). Clusters from SVCA4 were used as input for the Logan Reference analysis for DVR estimation in target tissues (t* = 20 min).
The fitting performance of the Logan graphical analysis for each input function was assessed through the determination coefficient (R2), since Akaike’s information criterion cannot be applied due to the presence of the noisy term on both sides of the model equation. To compare all input function methods, DVR values were calculated for AIF and IDIF as the ratio between the target tissue VT and the pseudo reference region VT. Bland–Altman analysis and linear regressions were applied to compare the parameters from the non-invasive methods with the AIF. Correlations were assessed by the Pearson coefficients. The agreement between the VT and DVR parameters was also evaluated in the correlation analysis.

2.7. Statistical Analysis

Student’s t-tests with 95% confidence and unassumed equal variances were applied to identify whether there were age differences between groups, and chi-square tests were also used to assess differences concerning sex. Generalized linear models (GLM) adjusted for age and sex were used on VT and DVR values to evaluate whether the quantification methods could identify (R)-[11C]PK11195 binding differences in selected brain regions between the MS and HC groups. All statistics were performed using SPSS (IBM SPSS Statistics for Windows, version 21.0; Armonk, NY, USA: IBM Corp.). All figures were created using GraphPad Prism (GraphPad Prism version 10.0.0 for Windows, GraphPad Software, Boston, MA, USA).

3. Results

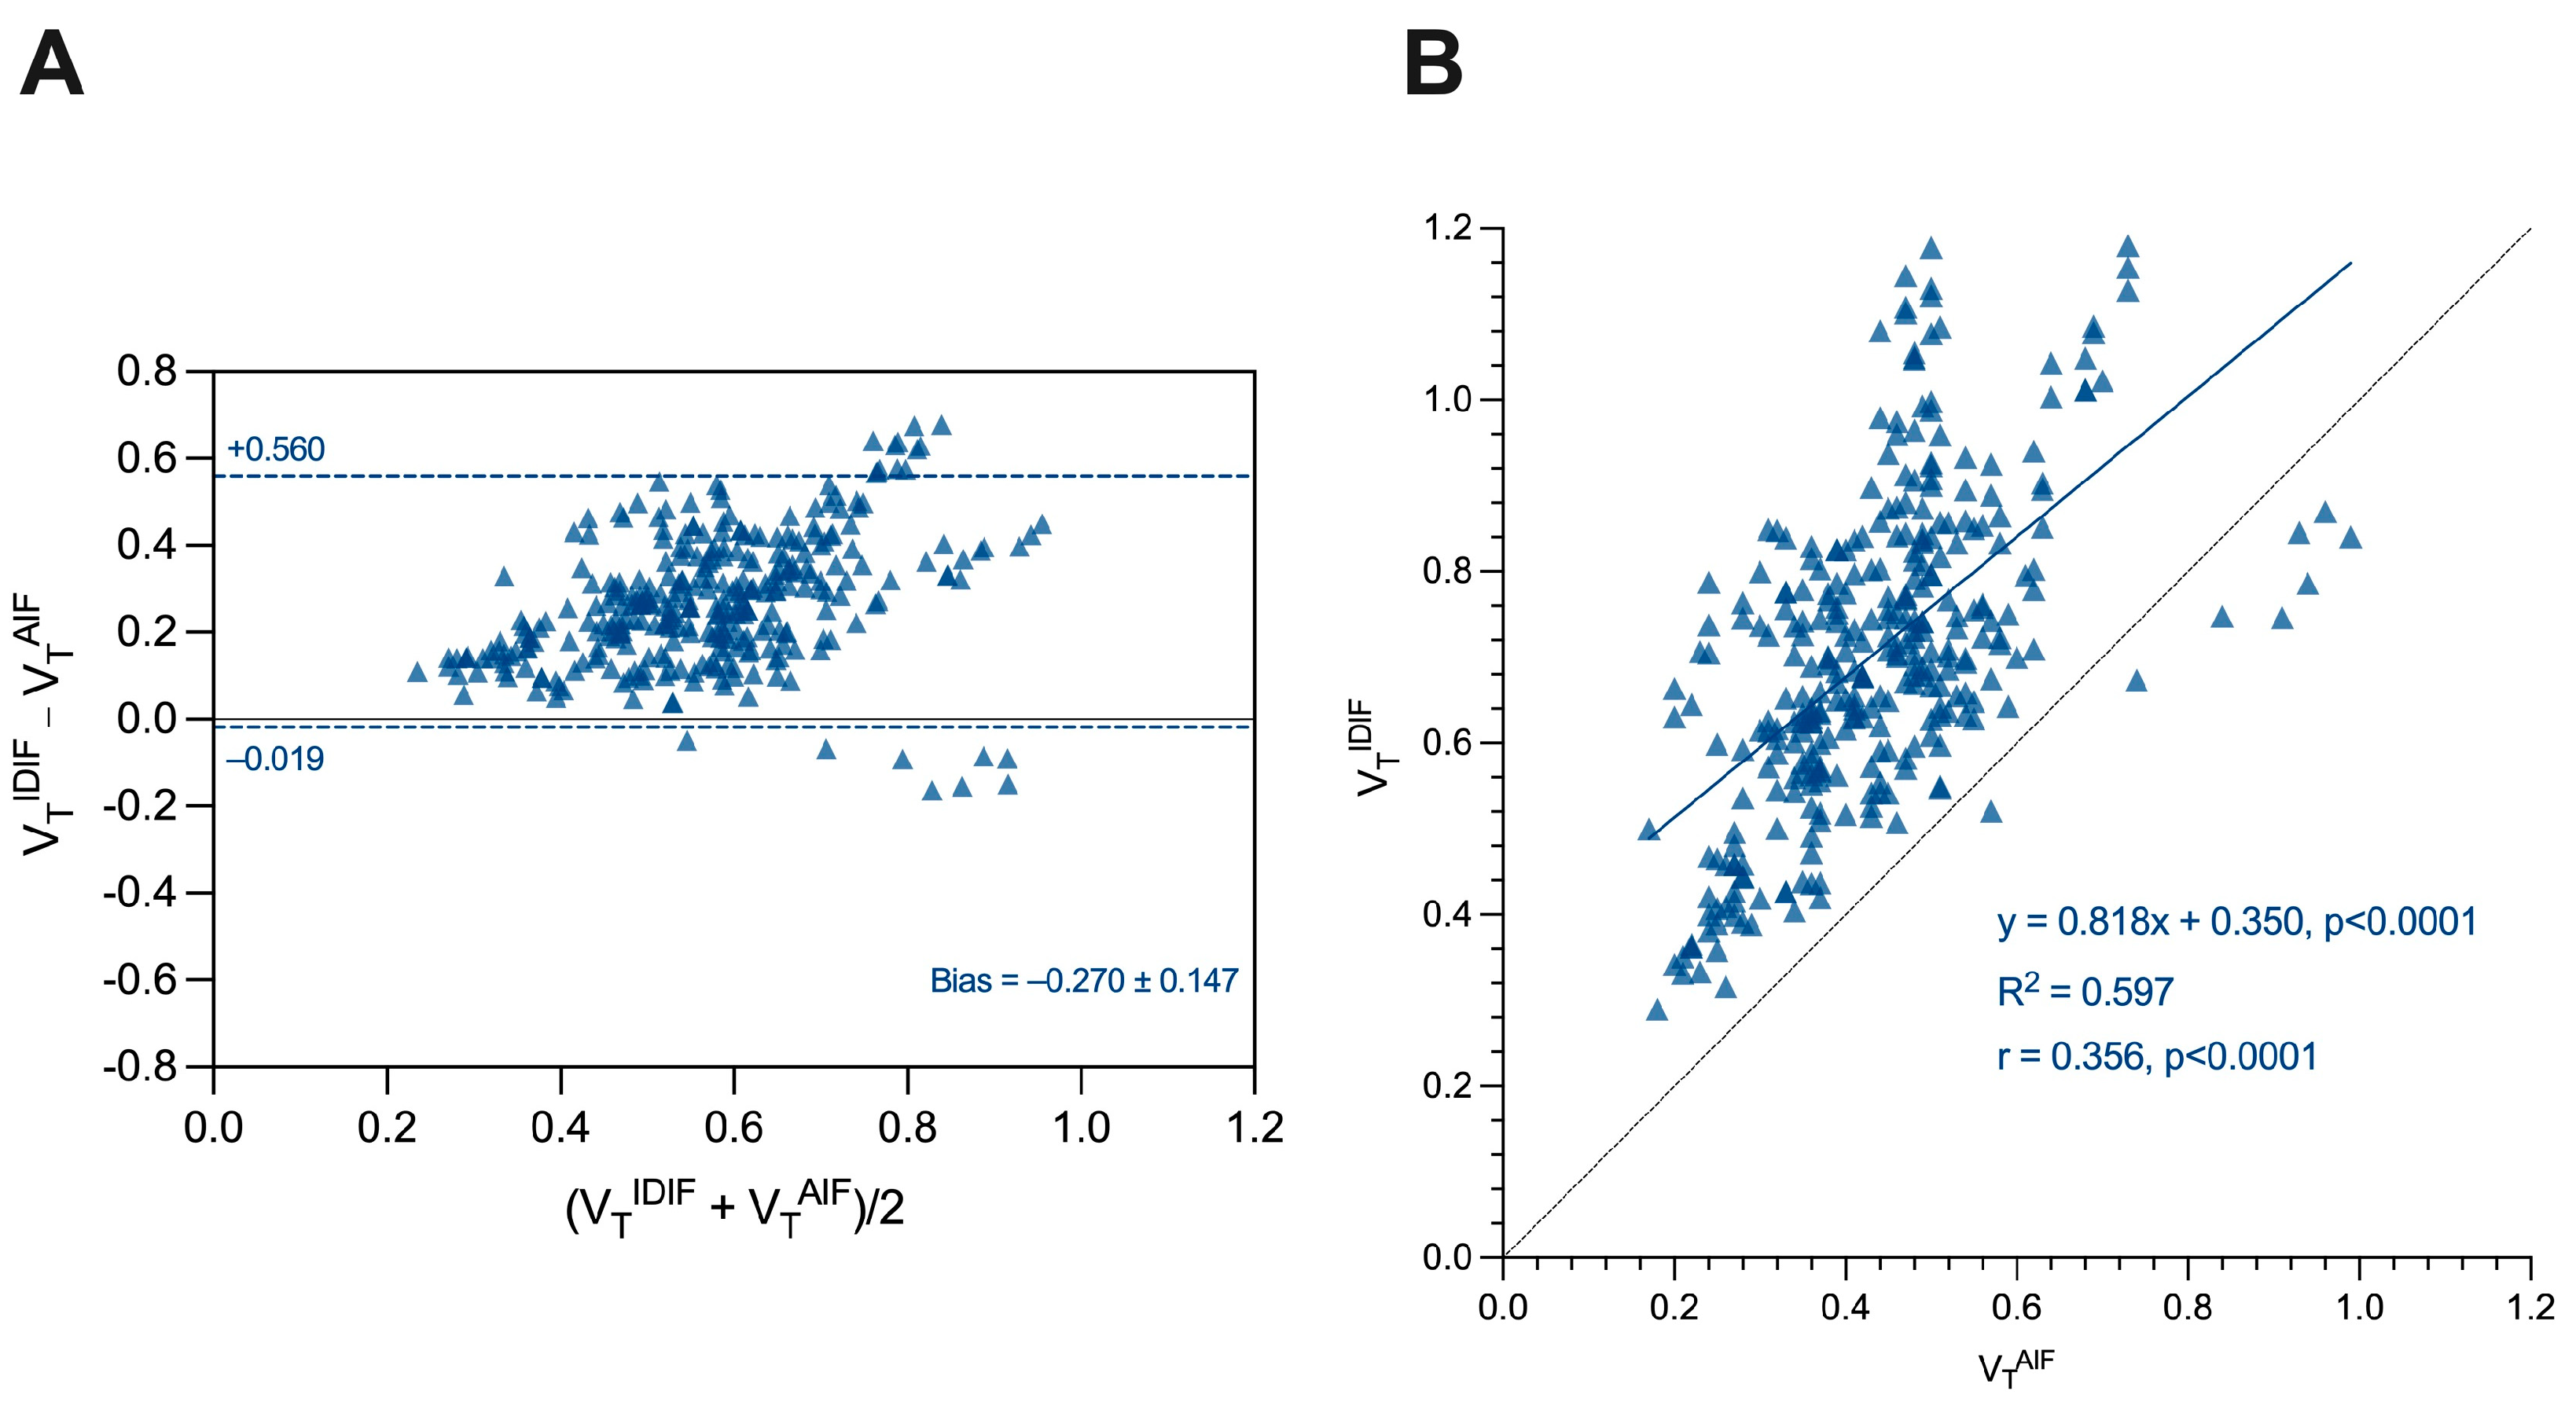
3.1. Input Functions: Extraction and Corrections

The PVC method enabled the partial recovery of the carotid spill-over, resulting in an overall increase of approximately 109% in the IDIF area under the curve (AUC). It is important to emphasize that these results were obtained using the geometric transfer matrix method in PMOD, which is non-dependent on blood data, thus making the process completely non-invasive.
The pseudo-reference regions were extracted using a leave-one-out procedure, avoiding the bias of testing the model on the data used to build it. Thus, a unique SVCA4 model was constructed and applied for each subject without seeing its data. The results of the pseudo-reference region kinetic analysis can be found in the Supplementary Material (Figures S1 and S2).

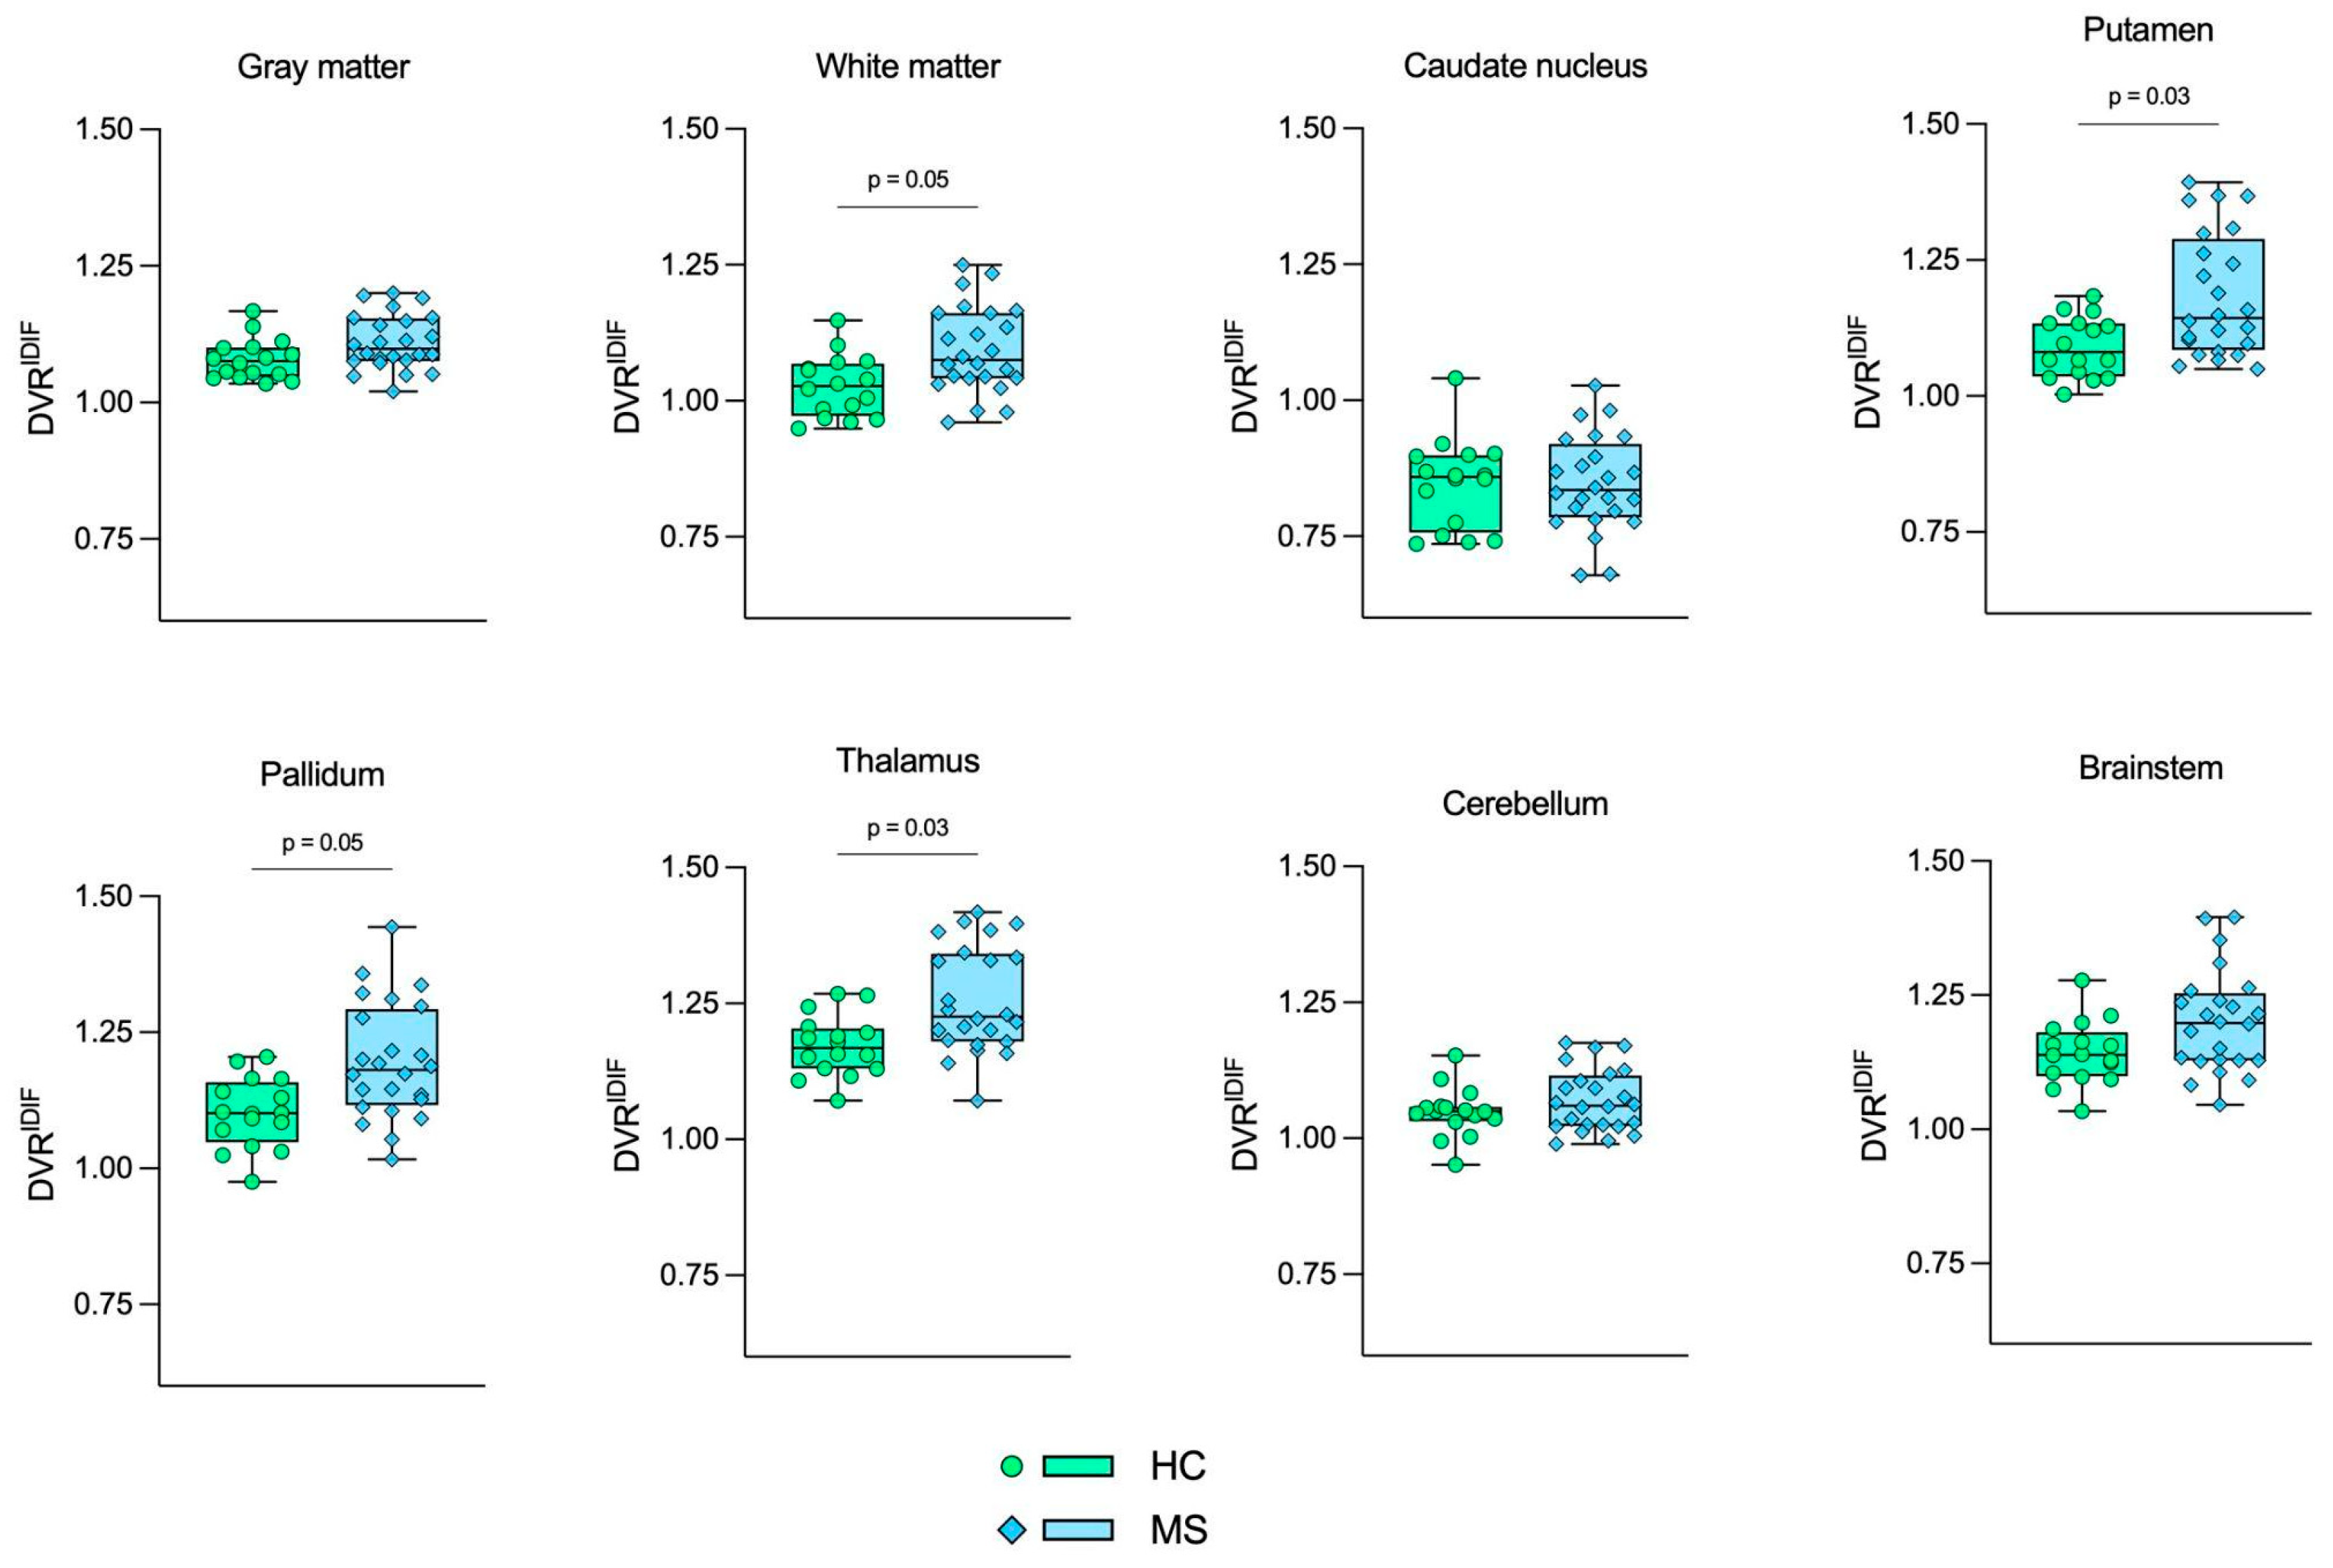
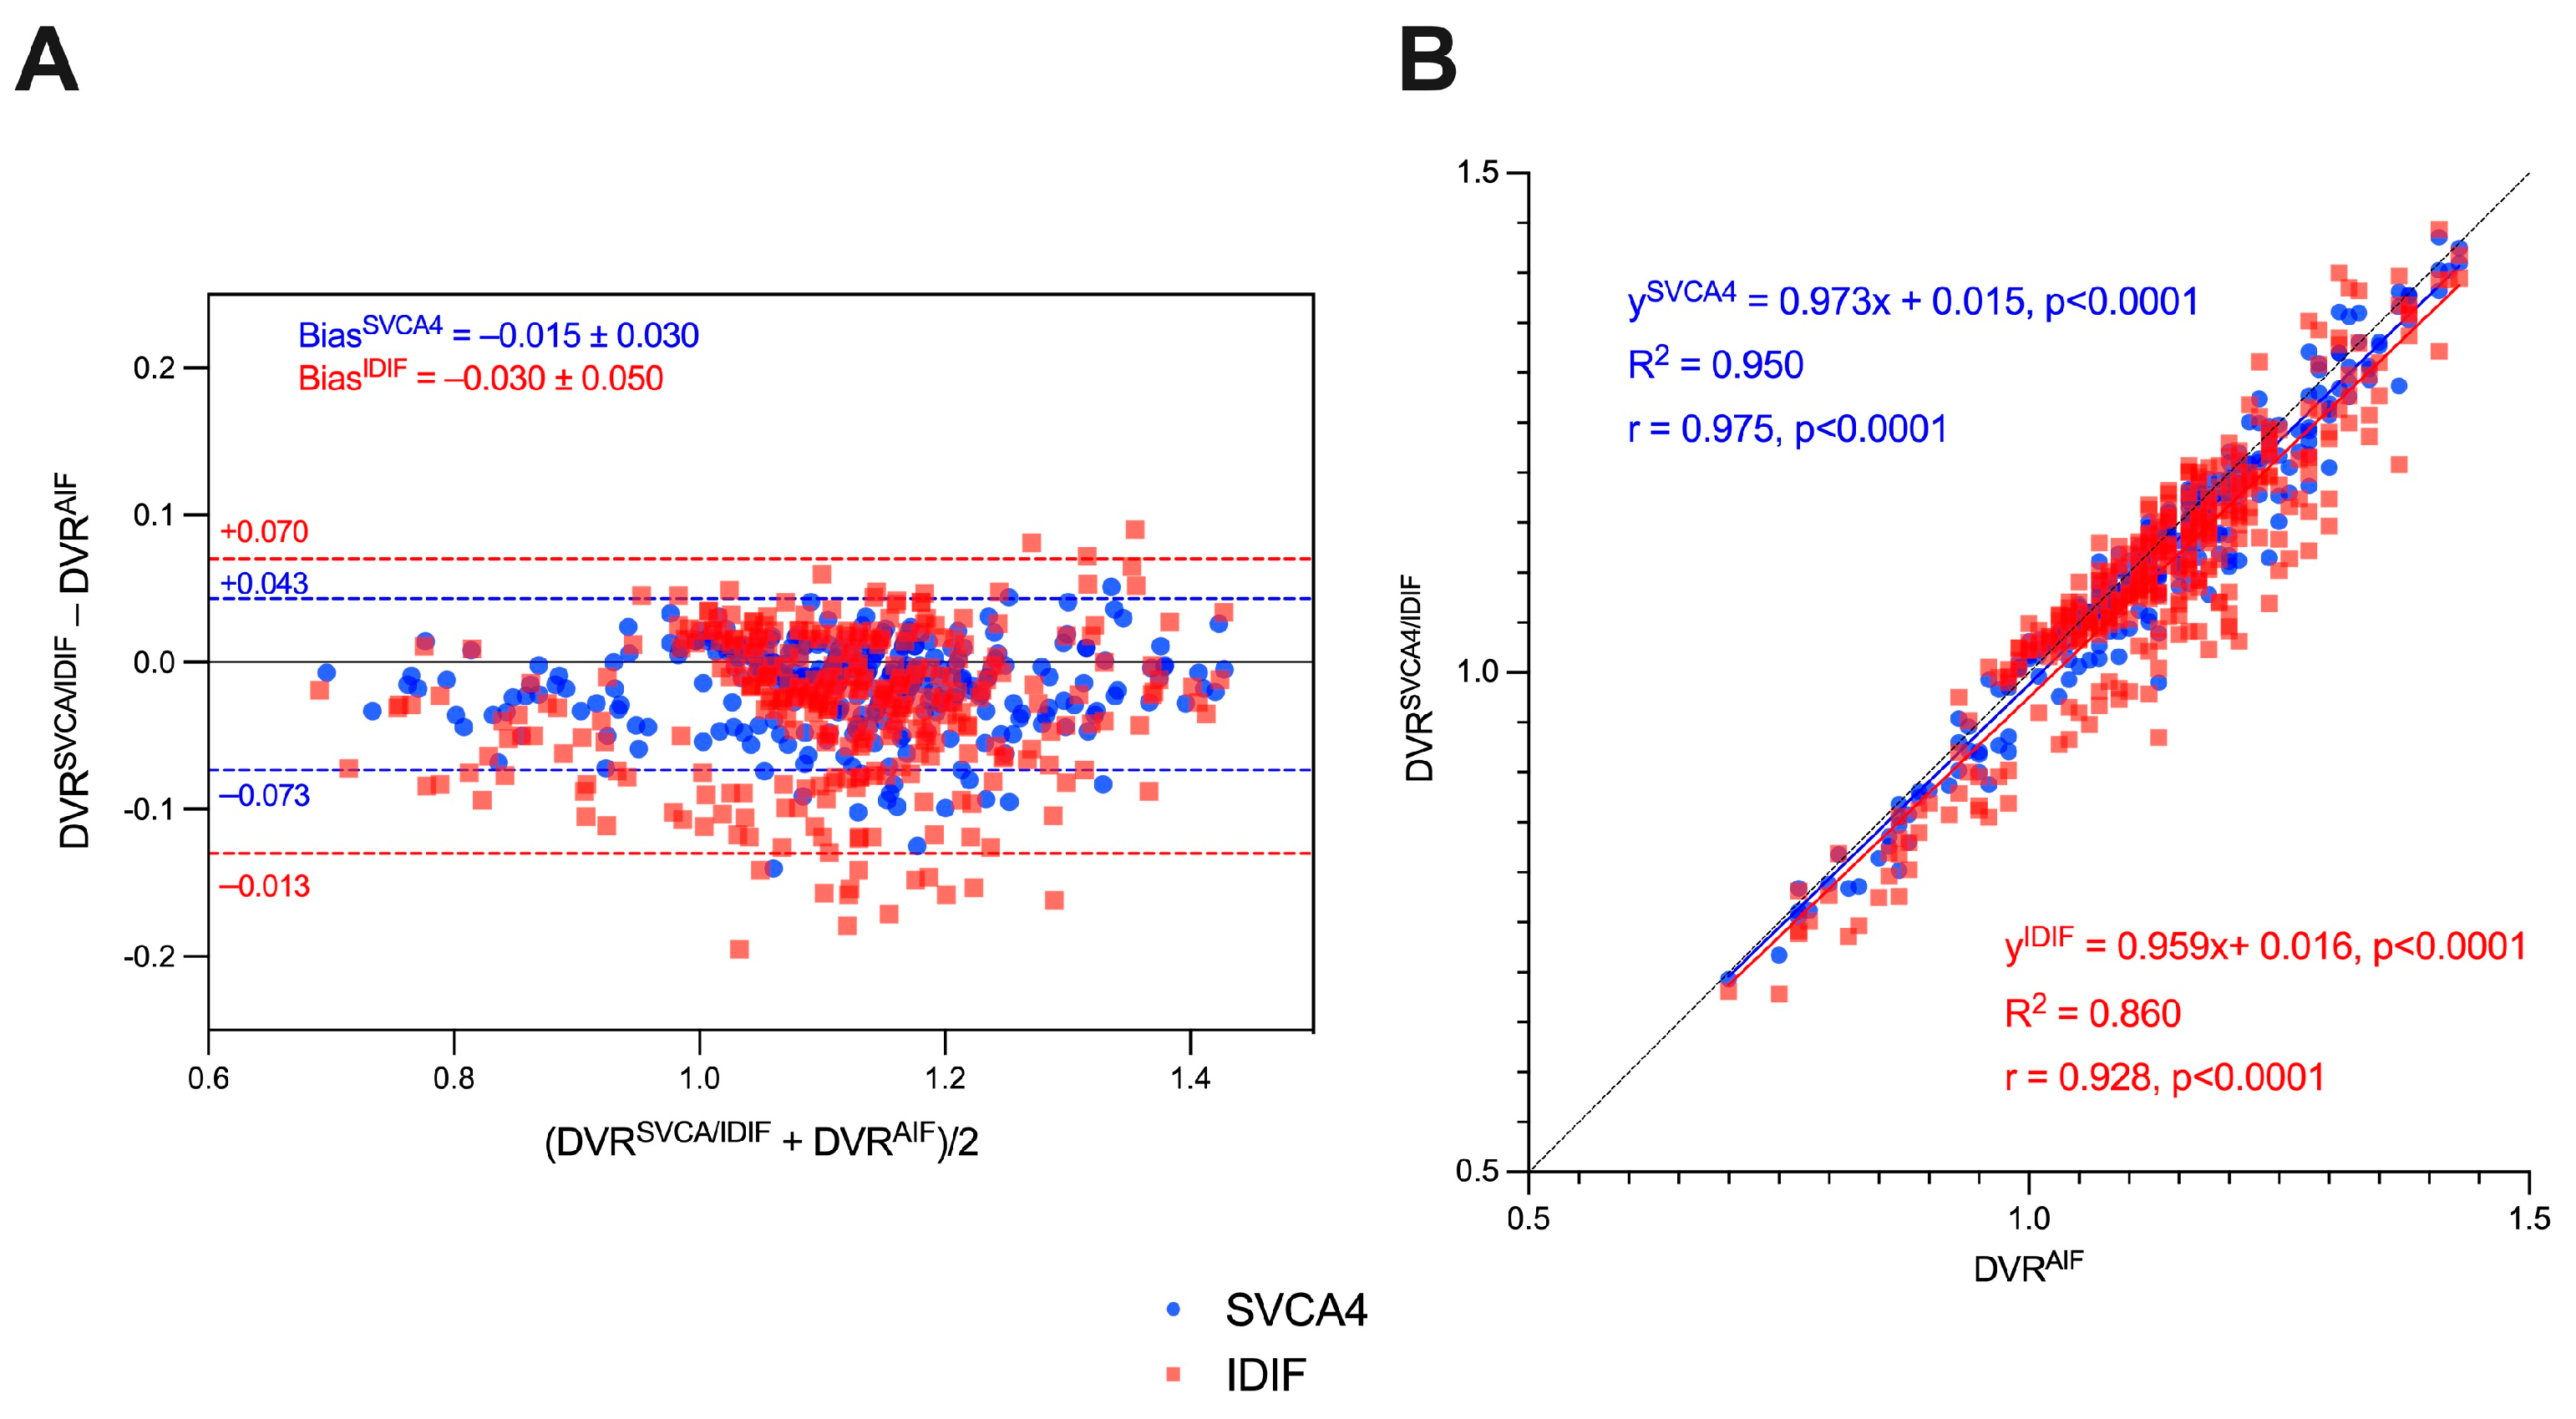
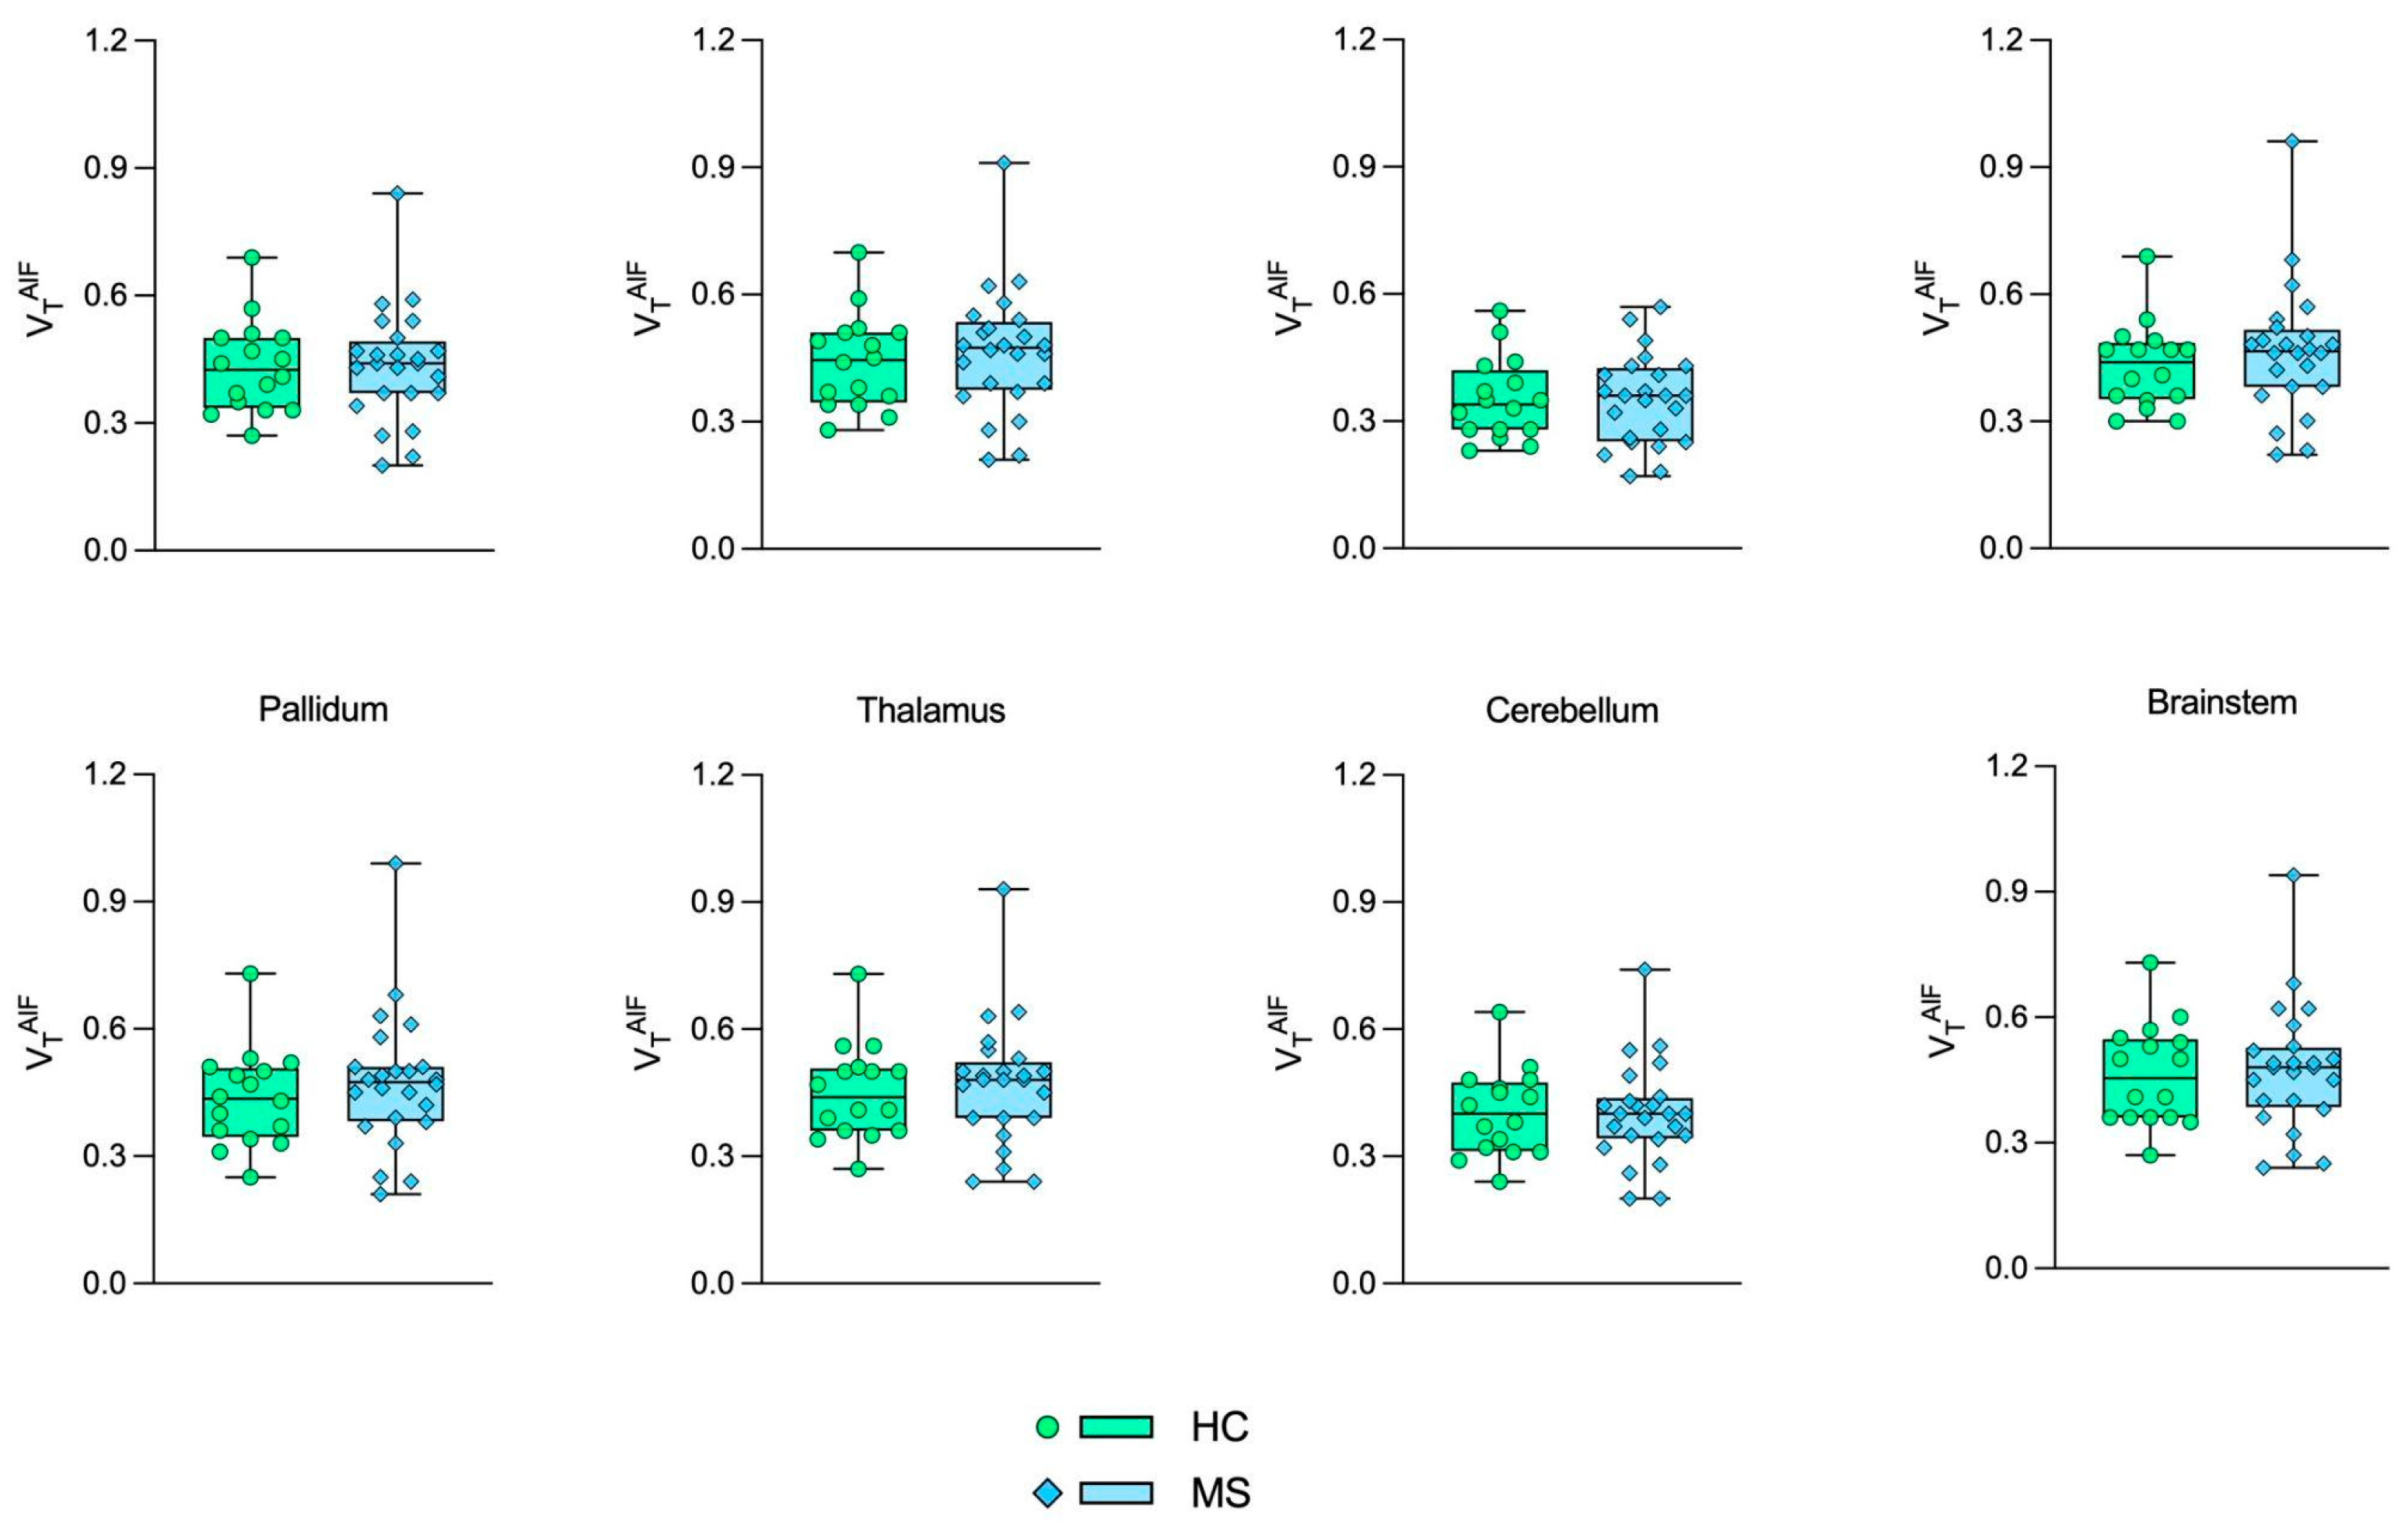
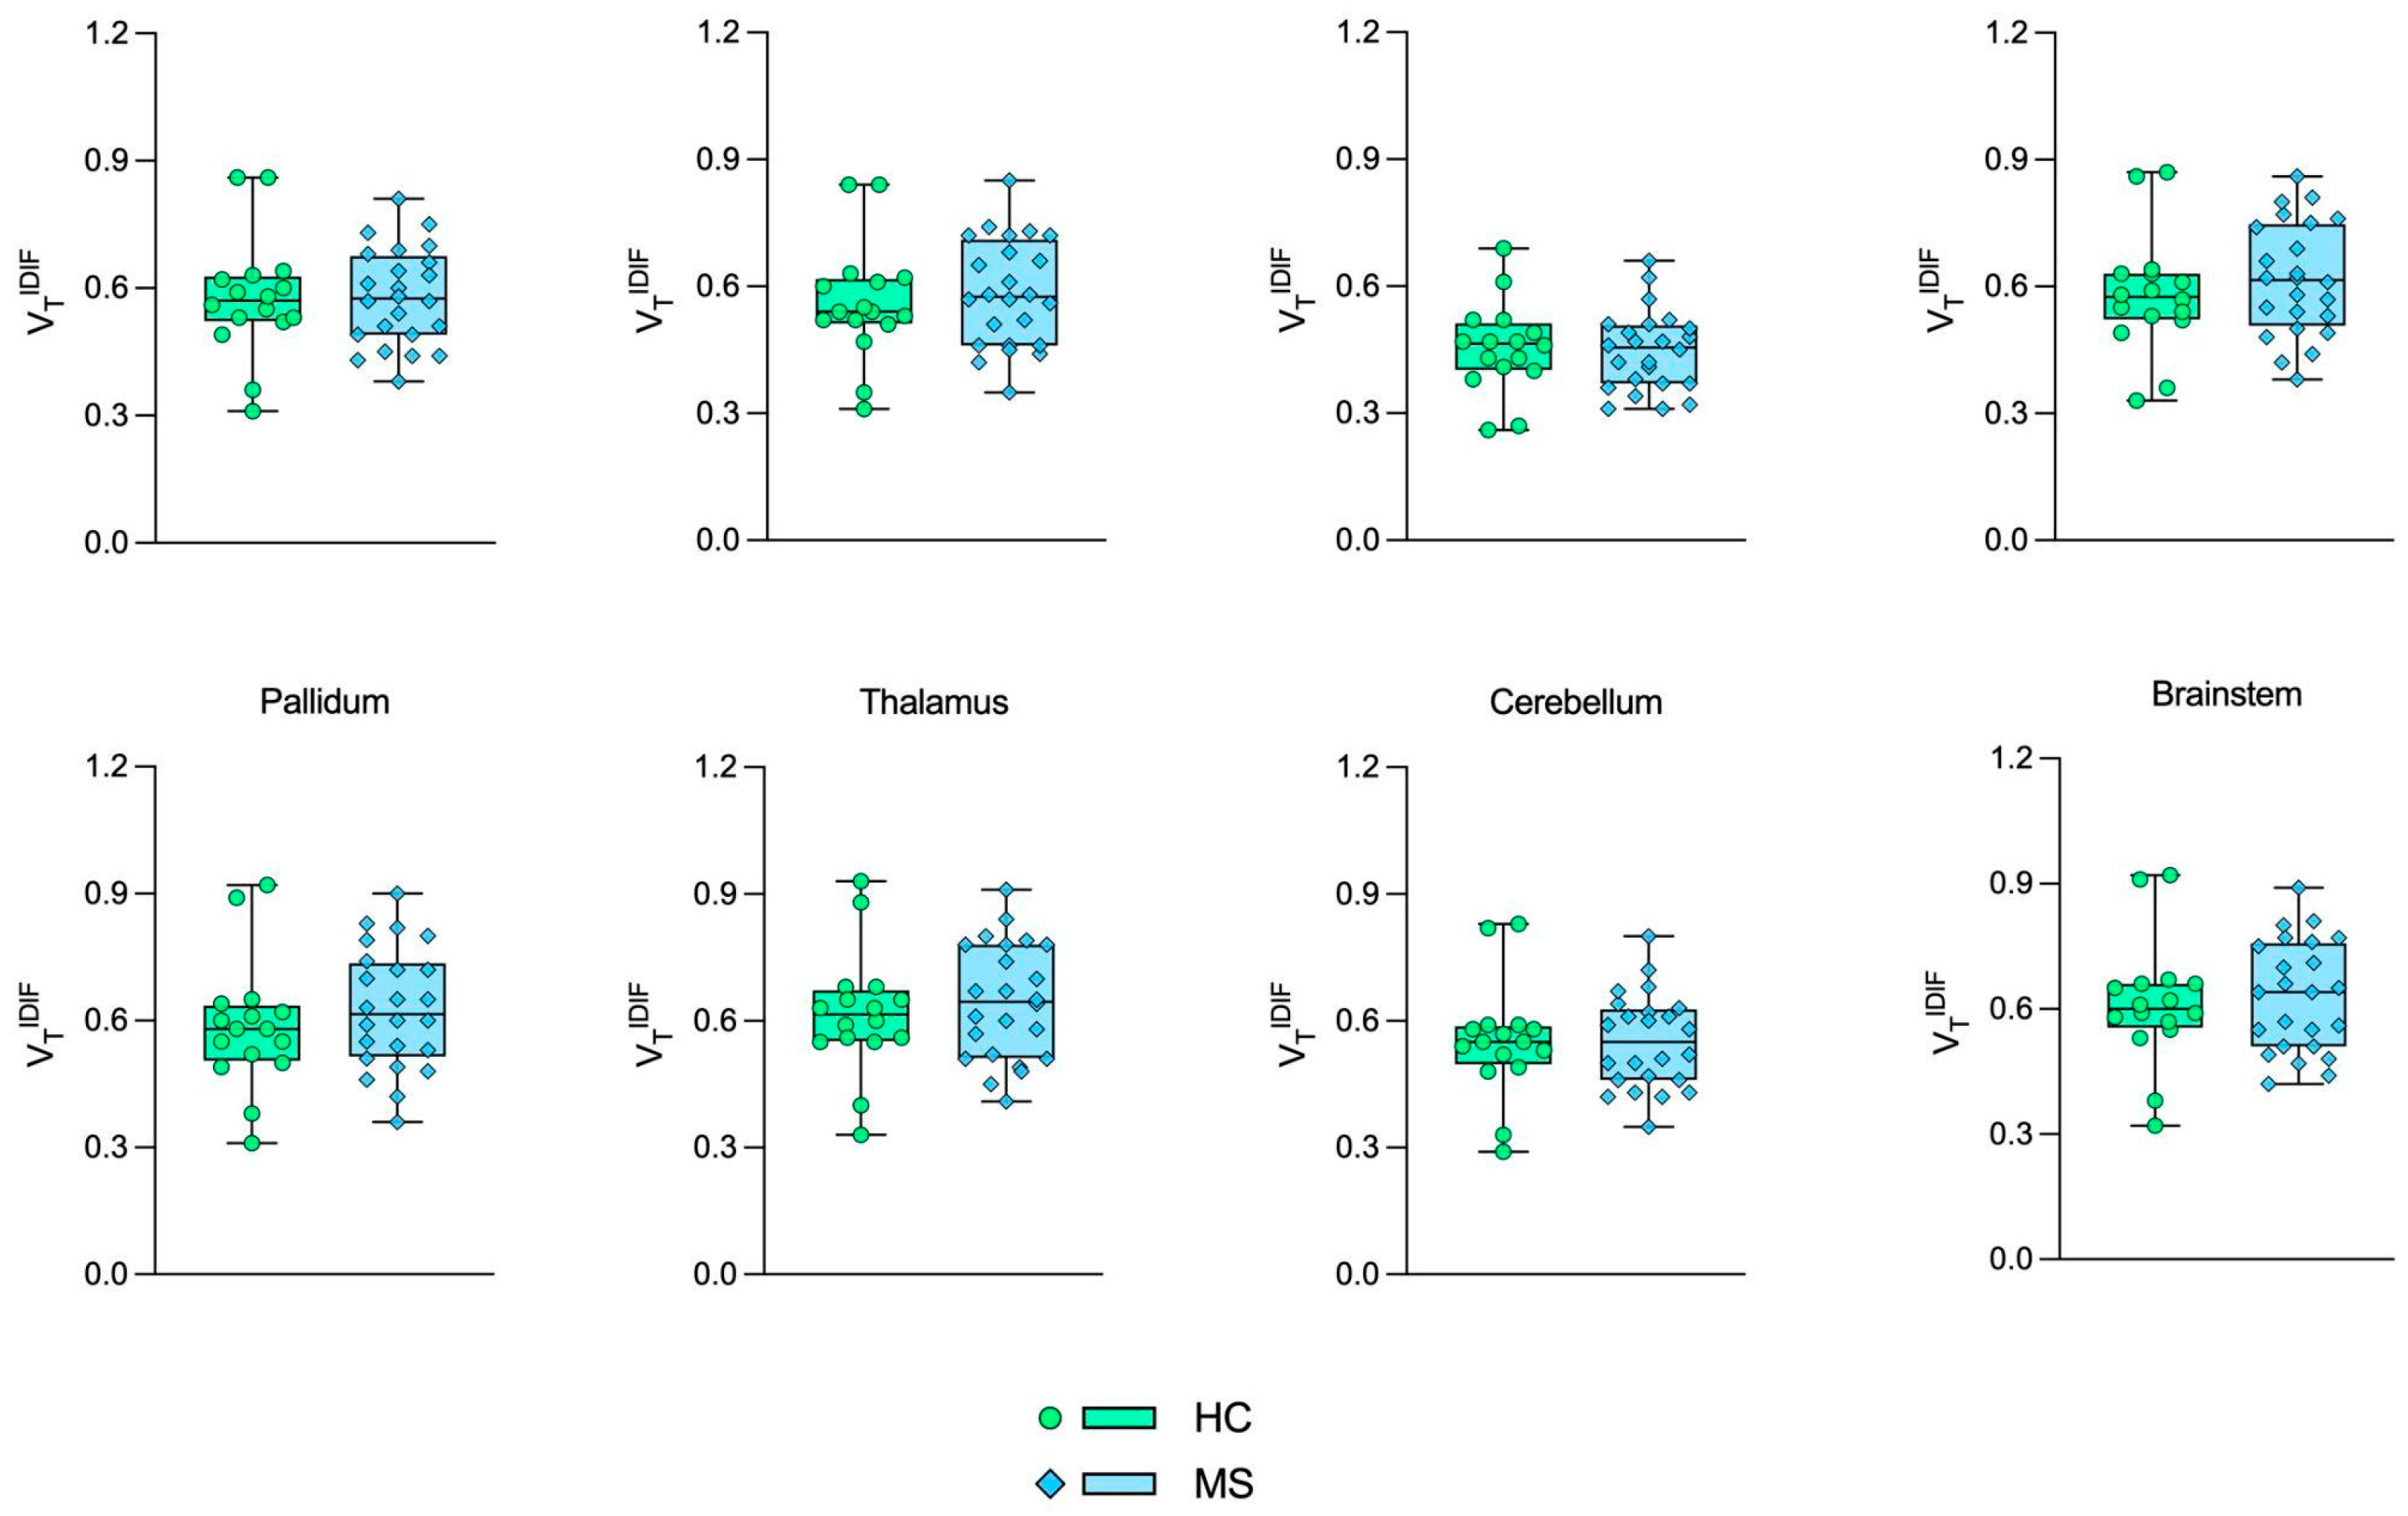
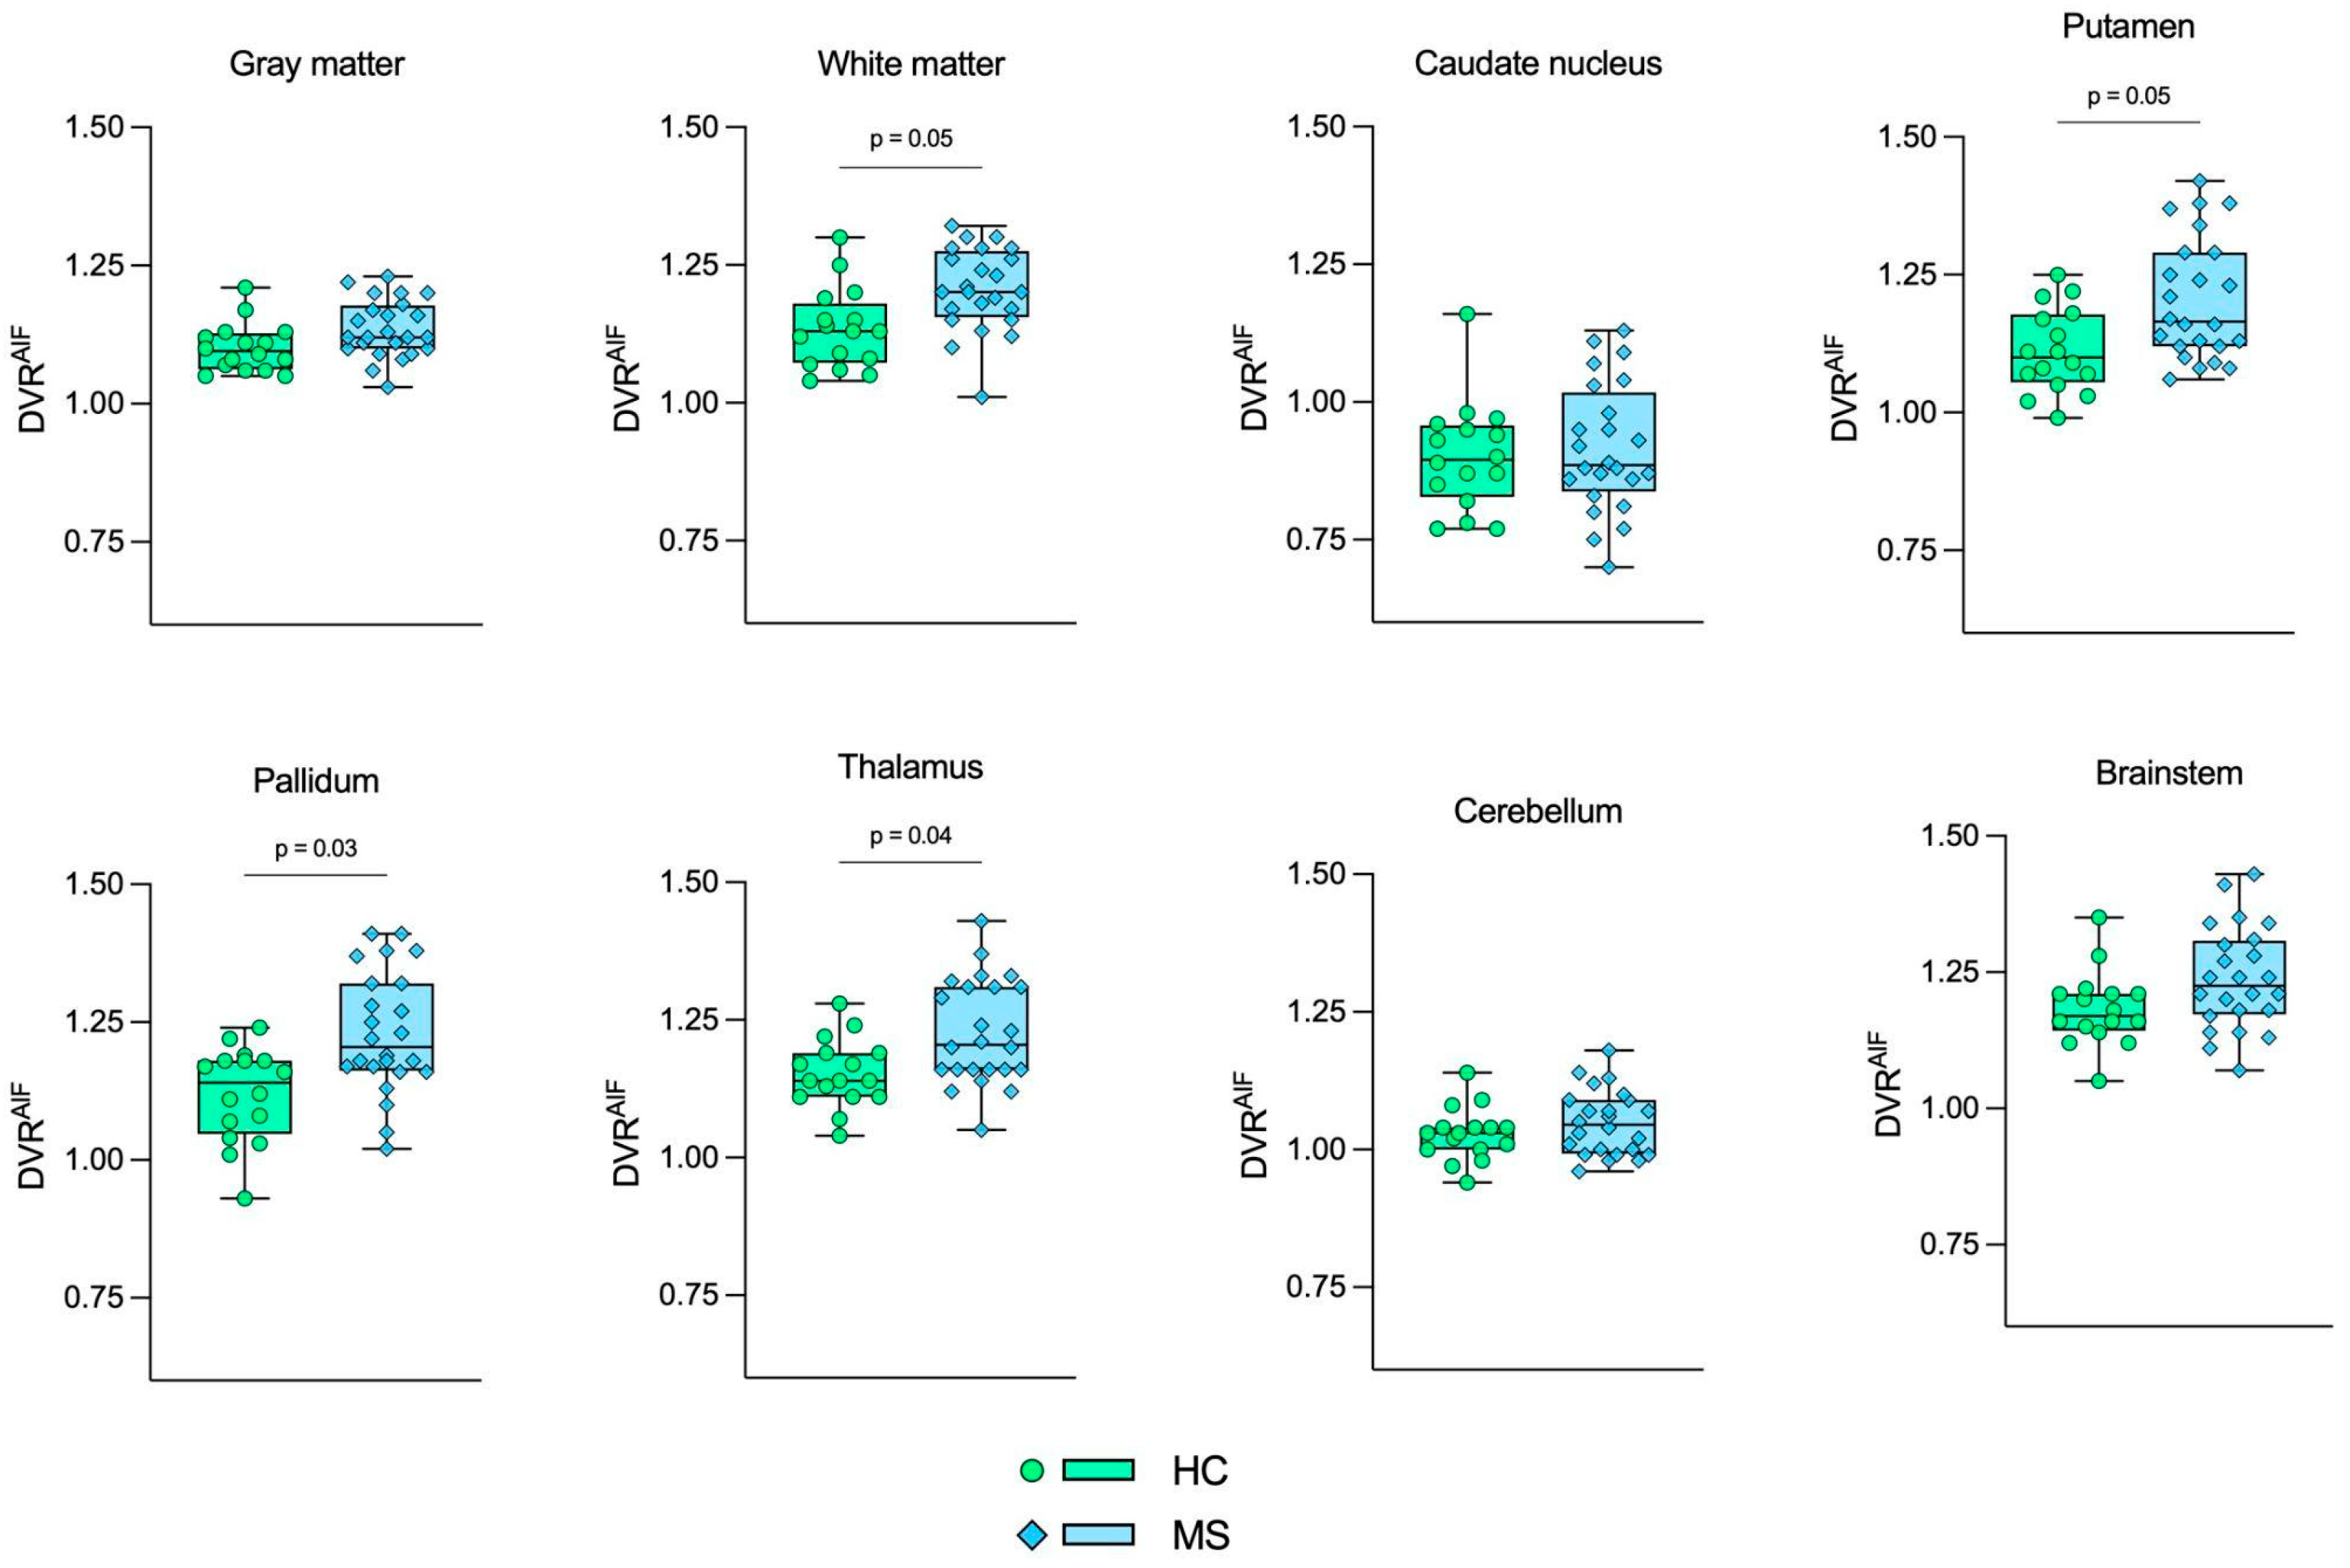
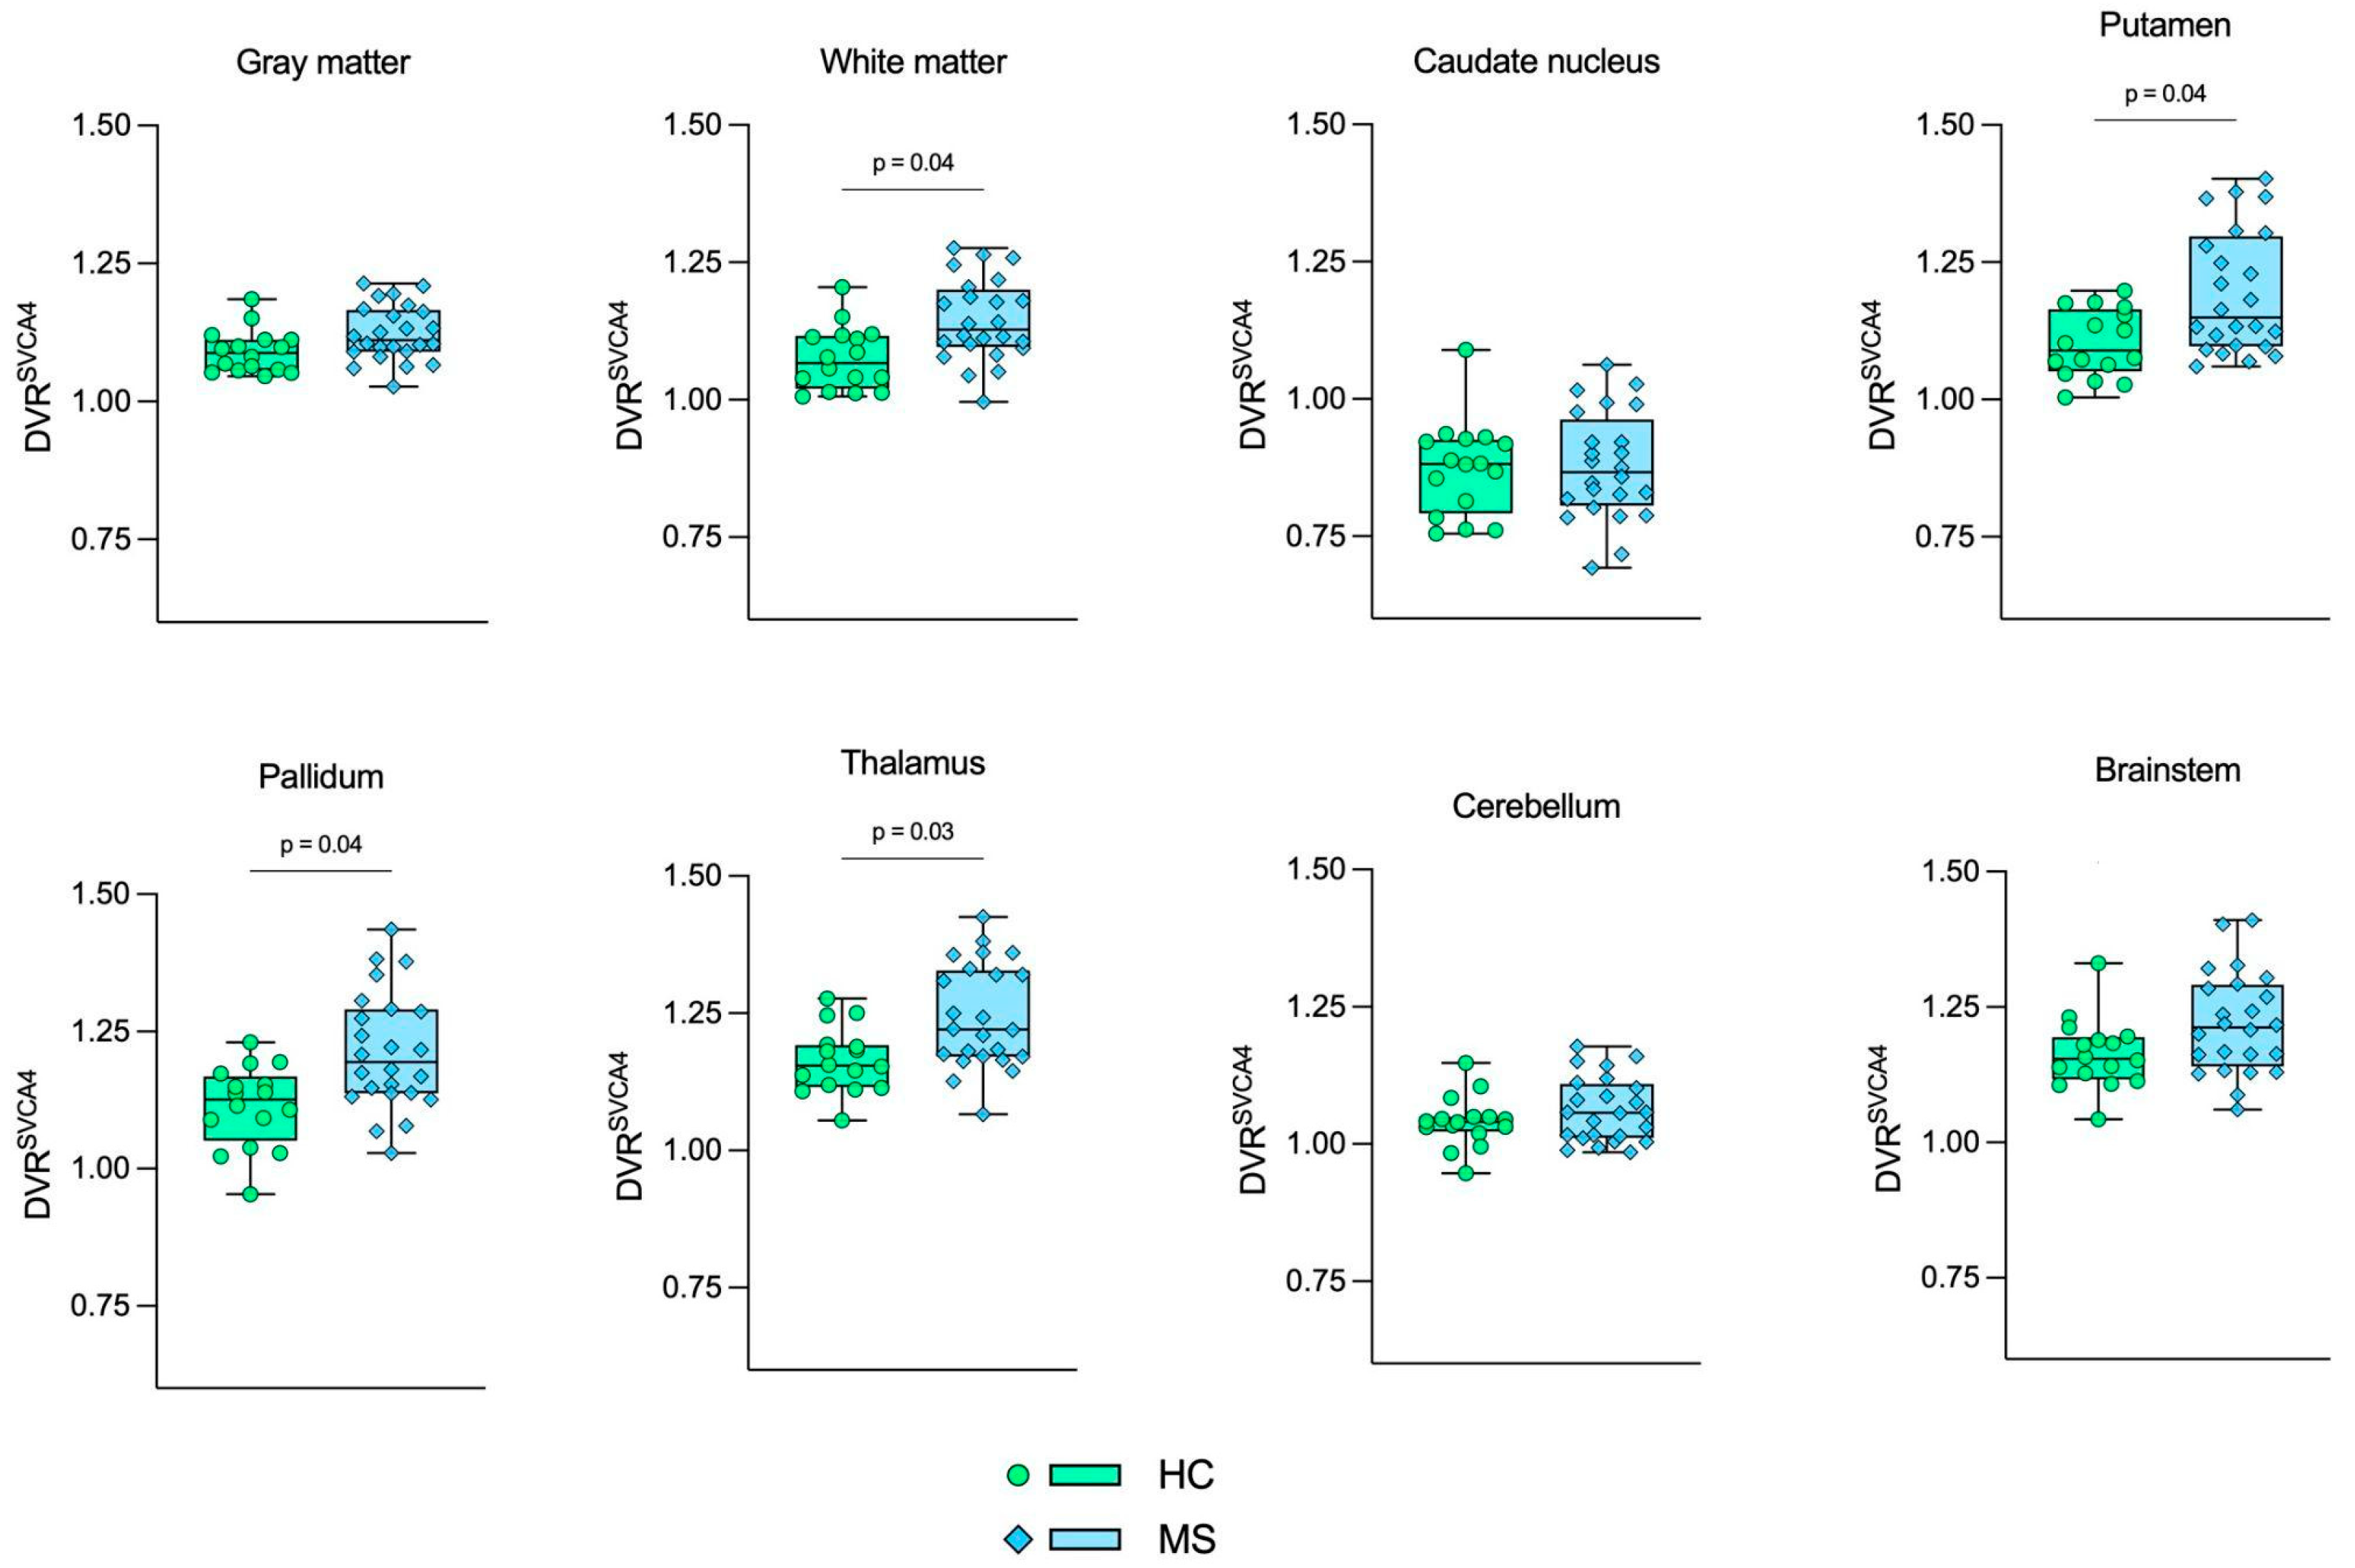
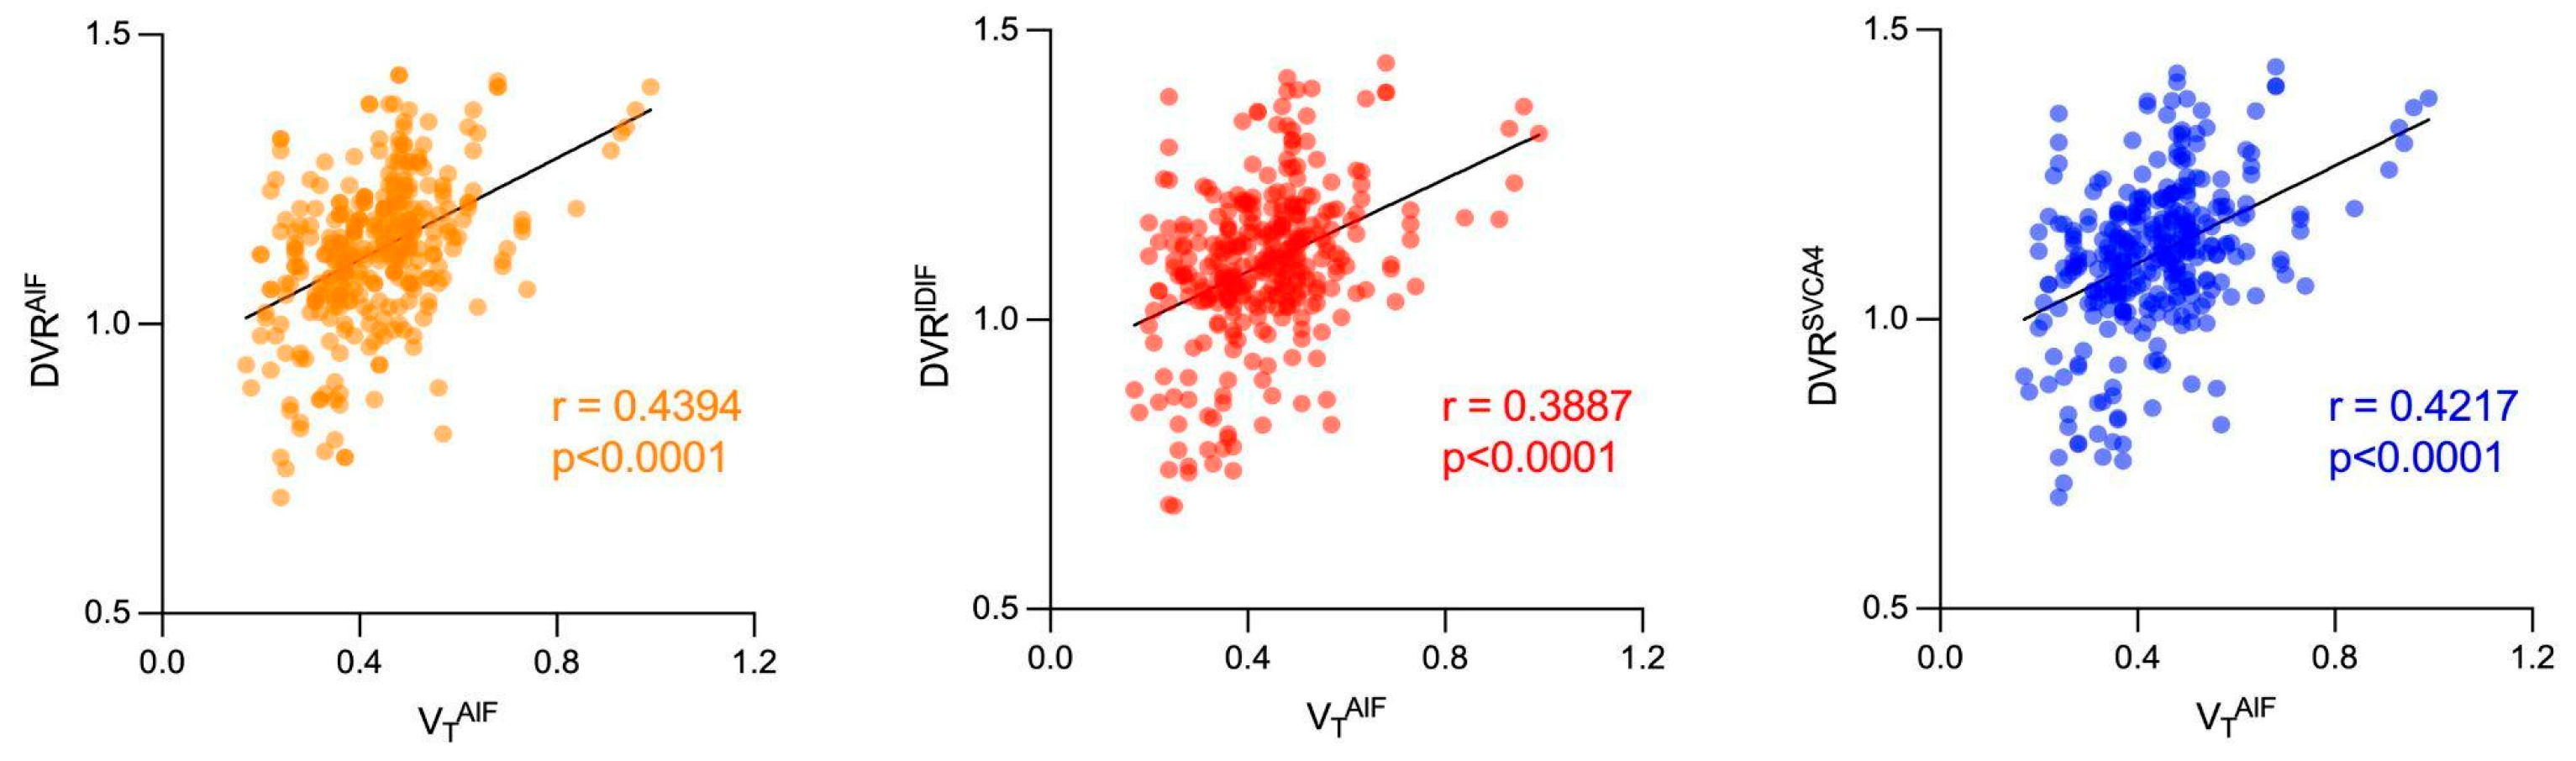
3.2. Image Quantification

All quantification models showed R2 values equal to or higher than 0.99 for AIF, IDIF, and SVCA4.
Table 2 shows the VT mean, standard deviation, and p-values using the AIF (VTAIF) and IDIF (VTIDIF) for the HC and MS groups. For almost all brain regions, slightly higher VTAIF and VTIDIF values were observed in the MS cohort when compared to the HC group; however, the statistical analysis (GLM) showed that there are no significant differences in (R)-[11C]PK11195-VT values between the groups. Additional Student’s t-tests were performed without age and sex corrections for VTAIF and VTIDIF, as no statistical difference was found.
Figure 1 and Figure 2 show the boxplot representation of VTAIF and VTIDIF parameters in MS and HC groups, respectively. Despite the higher deviation from the mean for VTIDIF in the HC group and the overall VT overestimation by IDIF in comparison to AIF, the VT distribution was very similar among the groups.
Figure 3 shows the Bland-Altman (3A) and linear regression plots (3B) from the VT comparison between AIF and IDIF. The Bland–Altman analysis showed a bias equal to 0.276 ± 0.147 in VT values, highlighting the VTIDIF overestimation when compared to VTAIF. The linear regression resulted in R2, slope, and intercept values equal to 0.596, 0.818 (p < 0.0001), and 0.350, respectively. A weak correlation was found between the VT measurements (0.356, p < 0.0001).
Table 3 shows the DVR mean, standard deviation, and p-values using the AIF (DVRAIF), IDIF (DVRIDIF), and SVCA4 (DVRSVCA4) for the HC and MS groups (Tables S1 and S2 in the Supplementary Material show no sex differences in the analysis). Higher DVR values were found in the MS group in comparison to the control group, and GLM tests identified significant differences in the same brain regions for all quantification methods. The DVR differences were observed in white matter, putamen, pallidum, and thalamus. The respective p-values are shown in Table 3.
Figure 4, Figure 5 and Figure 6 show the boxplot representation of DVRAIF, DVRIDIF, and DVRSVCA4 parameters in both HC and MS groups, respectively. These figures show a strong similarity between the DVR distribution among all quantification methods, despite the fact that IDIF and SVCA4 underestimated the (R)-[11C]PK11195-DVR values in both groups in comparison to AIF. Such similarities and underestimations in DVR values are highlighted by Figure 7. The Bland–Altman (7A) analysis showed a bias equal to −0.030 ± 0.050 for IDIF and −0.015 ± 0.030 for SVCA4. The linear regression resulted in R2, slope, and intercept values of 0.860, 0.959 (p < 0.0001), and 0.016 for IDIF, and 0.950, 0.973 (p < 0.0001), and 0.015, respectively, for SVCA4.
The results of the correlation analysis of VT and DVR parameters are shown in Figure 8. A moderate correlation between DVR and VTAIF was found for DVRAIF (0.4394, p < 0.0001) and DVRSVCA4 (0.4217, p < 0.0001), while a weak correlation was found for DVRIDIF (0.3887, p < 0.0001).
Figure 9 shows the Bland–Altman (9A) and linear regression (9B) analysis between the DVRSVCA4 values quantified using the full image (0–60 min) and the reduced image (20–60 min). It is noted that both methods provided very similar results, with a bias equal to 0.025 ± 0.042 and the parameters from the linear regression, R2, slope, and intercept equal to 0.901, 0.939 (p < 0.0001), and 0.015. Finally, a strong correlation was found between the two variables (0.975, p < 0.0001).

4. Discussion

This study evaluated two fully non-invasive approaches (IDIF and SVCA4) to provide reliable kinetic analysis in a cohort of patients with MS in comparison with arterial blood sampling. Our results show that SVCA4, together with the Logan Reference analysis (t* = 20 min), is the most reliable alternative for (R)-[11C]PK11195 kinetic modeling in both healthy subjects and MS patients, providing DVR results that could identify statistically significant (R)-[11C]PK11195 uptake differences in multiple subcortical regions and in the white matter, even correcting for age and sex (Table 3). Also, the pseudo-reference region extraction have not been affected significantly by excluding the initial 20 min data from the predefined kinetic classes, showing that the SVCA4 method is applicable for shorter (R)-[11C]PK11195-PET acquisitions.
Our results are consistent with other studies in the literature that assessed the (R)-[11C]PK11195 pharmacokinetics with DVR, including patients with different MS phenotypes [21,22,23,24]. In corroboration, the DVR and the non-dispensable binding potential (DVR-1), quantified through linearization analysis, are the most used parameters in MS studies, followed by the VT quantification [12,13,25]. Undoubtedly, blood sampling is the most reliable method for tracer concentration measurement in the patient’s bloodstream; however, the high variability of VT values in both controls and MS patients and the poor correlation between VTAIF and VTIDIF found in our results suggest that VT quantification by linearization methods using blood-derived input functions, even with arterial blood data, may not be the best alternative for neuroinflammation assessment in MS patients. These results are supported by the Pitombeira et al. [26] study, where no significant (R)-[11C]PK11195-VT differences were found in the same relapsing-remitting MS patients, but they also included primary and secondary progressive MS phenotypes in the analysis. Several factors may be related to these findings, such as the (R)-[11C]PK11195-specific binding to plasma proteins and endothelial cells and also errors associated with IDIF obtention. But because a very similar DVR distribution was found for all input function methods (AIF, IDIF, and SVCA4), we suppose that the differences in the results are much more linked to the analyzed parameter than the input function method used.
Our results show that when normalized for SVCA4-derived pseudo-reference regions, the (R)-[11C]PK11195 uptake analysis becomes more reliable, as suggested by a recent review study about TSPO quantification [33]. In the study of Kang et al. [12], the authors investigated the behavior of VT and DVR parameters in a test-retest study to identify the most robust method for TSPO-PET analysis in MS chronic lesions. They concluded that the VT quantified through the Logan graphical analysis using a PVE-uncorrected IDIF should be the best non-invasive alternative, a deviation from the present study. Some critical points may be responsible for the differences in the results from the present study in comparison with Kang et al. [12], such as the carotid delineation and the pseudo-reference region extraction, which both are essential steps to quantify the tracer distribution and are present in both studies.
Our carotid segmentation is based on Kang and collaborators’ methodology, with a circular ROI in the C4 portion of both left and right carotids. However, we aimed to include volumetric radioactivity measurements by placing consecutive circular ROIs, mainly to account for the radioactivity spillover in adjacent tissues and background [12]. Furthermore, these modifications provided an average 109% increase in input function AUC through the geometric transfer matrix method, which should enhance the robustness of the IDIF analysis. In addition, all PVC analyses can be considered non-invasive since there is no requirement for blood data to rescale the input curve.
A processing step directly related to the DVR and BPND values is pseudo reference region extraction. The supervised clustering methodology is used to classify low-binding gray matter voxels based on their kinetic behavior through a multilinear regression analysis, and its result is highly dependent upon the predefined kinetic classes used to fit the constant weights. Therefore, possibly the leading cause of the differences between the studies is in obtaining these predefined curves. In the present study, the kinetic classes were extracted from this study population using several quality control processes, such as the leave-one-out method and evaluations of previously mentioned kinetic characteristics. The leave-one-out methodology prevents the multilinear regression from being contaminated with the data being processed, thus testing the generalizability of the SVCA4 model [30]. Also, kinetic aspects such as high peak activity concentrations and fast washouts are desirable when using reference-tissue modeling approaches, and therefore such characteristics should be checked through kinetic rate constants (K1, k2, K1/k2) from full compartmental modeling analysis [30,33]. Such information was assessed in the SVCA4-derived pseudo-reference regions in our study using the reversible two-tissue compartment model (2T4k) with the AIF. The results can be found in the supplementary material (Figure S3).
A limiting factor in our data analysis, in comparison with Kang’s investigation [12], is that the variability between (R)-[11C]PK11195 scan sessions (test-retest) could not be assessed. As such, information about the stability of the VT and DVR parameters between scan sessions could not be compared in our study cohort. Further details on the (R)-[11C]PK11195 kinetic analysis stability in MS studies can be found in the study of Kang et al. [12].
Another very important factor for the reliability and accuracy of tracer quantification is the image reconstruction step, mainly for dynamic series, which are remarkable for noisy frames and possibly affected by patient motion. The standard 3D OSEM algorithm, which was applied in this study, does not account for motion effects during the projection data correction steps, such as attenuation correction, thus affecting the image resolution and the reliability of the quantitative data extracted from the reconstructed images [34]. In addition, PVC techniques for the whole brain were not applied to our (R)-[11C]PK11195-PET images, which may be a future improvement in the reconstruction of our acquisition data through iterative methods with a priori information using MR images, together with motion compensation, which can greatly improve the noise reduction and quantification accuracy [35,36].
Finally, reducing the dynamic scan time for (R)-[11C]PK11195-PET studies can offer several benefits, including increased patient comfort, fewer movement artifacts, time savings, and still being able to perform reliable tracer kinetic modeling using the Logan Reference analysis. This could be a promising approach for future studies investigating innate immune cell activation in neurological disorders, mainly in MS.

5. Conclusions

In conclusion, our study shows that the best alternative for invasive (R)-[11C]PK11195 quantification methods in MS patients is the SVCA4, in addition to a cautious and appropriate methodology. However, new IDIF methods should be applied to (R)-[11C]PK11195-PET images in order to find a better agreement between the quantitative parameters. Finally, as the aim of this study was only to compare the quantification output from non-invasive input functions and AIF, further studies may also aim to evaluate the feasibility of generating (R)-[11C]PK11195-DVR parametric maps and their respective readouts by nuclear physicians to assess the potential clinical applications of TSPO-PET.

Supplementary Materials

The following supporting information can be downloaded at: https://www.mdpi.com/article/10.3390/jimaging10020039/s1, Figure S1: (R)-[11C]PK11195 kinetics in SVCA4-derived pseudo reference region assessed by the 2T4kvB model using AIF. Light gray boxes represent the HC group while dark gray boxes represent the MS group, Figure S2: (R)-[11C]PK11195-VT in SVCA4-derived pseudo reference regions measured with the Logan Plot using AIF and IDIF. Light gray boxes represent the HC group while dark gray boxes represent the MS group, Figure S3: (R)-[11C]PK11195 time-activity curves in SVCA4-derived pseudo reference regions in both HC and MS groups; Table S1: Descriptive statistics of DVRAIF values separated by sex in healthy controls, Table S2: Descriptive statistics of DVRAIF values separated by sex in MS patients.

Author Contributions

Conceptualization: D.B.A.M., M.S.P., P.N.S., D.d.P.F. and A.M.M.d.S.; Methodology: D.B.A.M., M.S.P., P.N.S., A.S.d.A., D.d.P.F. and A.M.M.d.S.; Formal analysis and investigation: D.B.A.M., M.S.P., P.N.S., A.S.d.A., D.d.P.F. and A.M.M.d.S.; Writing—original draft preparation: D.B.A.M.; Writing—review and editing: M.S.P., P.N.S., D.d.P.F. and A.M.M.d.S.; Funding acquisition: C.A.B. and D.d.P.F.; Resources: C.A.B. and D.d.P.F.; Supervision: D.d.P.F. and A.M.M.d.S. All authors have read and agreed to the published version of the manuscript.

Funding

This work was supported by GE Healthcare, No. 12496139131, which played no role in the study design, in the collection, analysis, and interpretation of data, in the writing and publication of the manuscript, and by the Coordenação de Aperfeiçoamento de Pessoal de Nível Superior—Brasil (CAPES)—Finance Code 001. DPF is a research fellow of the Conselho Nacional de Desenvolvimento Científico e Tecnológico (CNPq).

Institutional Review Board Statement

All subjects gave their informed consent for inclusion before they participated in the study. The study was conducted in accordance with the Declaration of Helsinki, and the protocol was approved by the Ethics Committee of the University of São Paulo, School of Medicine (registration number: 2.451.027, approved on 20 December 2017).To preserve participants’ confidentiality, all image data were anonymized, and a number was assigned to each subject. All records were stored on password-protected computers, which were only accessible by the main investigators.

Informed Consent Statement

All participants included in this study gave written informed consent.

Data Availability Statement

The data supporting the findings of these studies are available from the corresponding author upon reasonable request.

Conflicts of Interest

The authors declare no conflicts of interest.

References

  1. Finkelsztejn, A.; Cristovam, R.d.A.; Moraes, G.S.; Lopes, M.G.; Silva, A.V.; Garcia, M.S.; Cola, C.M.; Bastiani, C.E.; Ferreira, L.B.; da Costa, A.L.; et al. Clinical features of multiple sclerosis in the south of Brazil: A partial analysis. Arq. Neuropsiquiatr. 2009, 67, 1071–1075. [Google Scholar] [CrossRef] [PubMed]
  2. Samkoff, L.M.; Goodman, A.D. (Eds.) Multiple Sclerosis and CNS Inflammatory Disorders; John Wiley & Sons Inc.: Chichester, UK, 2014; 1p. [Google Scholar]
  3. Banati, R.B.; Newcombe, J.; Gunn, R.N.; Cagnin, A.; Turkheimer, F.; Heppner, F.; Price, G.; Wegner, F.; Giovannoni, G.; Miller, D.H.; et al. The peripheral benzodiazepine binding site in the brain in multiple sclerosis. Brain 2000, 123, 2321–2337. [Google Scholar] [CrossRef] [PubMed]
  4. Jučaite, A.; Cselényi, Z.; Arvidsson, A.; Ahlberg, G.; Julin, P.; Varnäs, K.; Stenkrona, P.; Andersson, J.; Halldin, C.; Farde, L. Kinetic analysis and test-retest variability of the radioligand [11C](R)-PK11195 binding to TSPO in the human brain—A PET study in control subjects. EJNMMI Res. 2012, 2, 15. [Google Scholar] [CrossRef]
  5. Lammertsma, A.A. Forward to the Past: The Case for Quantitative PET Imaging. J. Nucl. Med. 2017, 58, 1019–1024. [Google Scholar] [CrossRef] [PubMed]
  6. Wang, G.; Rahmim, A.; Gunn, R.N. PET Parametric Imaging: Past, Present, and Future. IEEE Trans. Radiat. Plasma Med. Sci. 2020, 4, 663–675. [Google Scholar] [CrossRef] [PubMed]
  7. van der Weijden, C.W.J.; Mossel, P.; Bartels, A.L.; Dierckx, R.A.J.O.; Luurtsema, G.; Lammertsma, A.A.; Willemsen, A.T.M.; de Vries, E.F.J. Non-invasive kinetic modelling approaches for quantitative analysis of brain PET studies. Eur. J. Nucl. Med. Mol. Imaging 2023, 50, 1636–1650. [Google Scholar] [CrossRef] [PubMed]
  8. Zanotti-Fregonara, P.; Fadaili, E.M.; Maroy, R.; Comtat, C.; Souloumiac, A.; Jan, S.; Ribeiro, M.J.; Gaura, V.; Bar-Hen, A.; Trébossen, R. Comparison of Eight Methods for the Estimation of the Image-Derived Input Function in Dynamic [18F]-FDG PET Human Brain Studies. J. Cereb. Blood Flow. Metab. 2009, 29, 1825–1835. [Google Scholar] [CrossRef] [PubMed]
  9. Zanotti-Fregonara, P.; Liow, J.S.; Comtat, C.; Zoghbi, S.S.; Zhang, Y.; Pike, V.W.; Fujita, M.; Innis, R.B. Image-derived input function in PET brain studies: Blood-based methods are resistant to motion artifacts. Nucl. Med. Commun. 2012, 33, 982–989. [Google Scholar] [CrossRef]
  10. Croteau, E.; Lavallée, E.; Labbe, S.M.; Hubert, L.; Pifferi, F.; Rousseau, J.A.; Cunnane, S.C.; Carpentier, A.C.; Lecomte, R.; Bénard, F. Image-derived input function in dynamic human PET/CT: Methodology and validation with 11C-acetate and 18F-fluorothioheptadecanoic acid in muscle and 18F-fluorodeoxyglucose in brain. Eur. J. Nucl. Med. Mol. Imaging. 2010, 37, 1539–1550. [Google Scholar] [CrossRef]
  11. Politis, M.; Giannetti, P.; Su, P.; Turkheimer, F.; Keihaninejad, S.; Wu, K.; Waldman, A.; Malik, O.; Matthews, P.M.; Reynolds, R.; et al. Increased PK11195 PET binding in the cortex of patients with MS correlates with disability. Neurology 2012, 79, 523–530. [Google Scholar] [CrossRef]
  12. Kang, Y.; Schlyer, D.; Kaunzner, U.W.; Kuceyeski, A.; Kothari, P.J.; Gauthier, S.A. Comparison of two different methods of image analysis for the assessment of microglial activation in patients with multiple sclerosis using (R)-[N-methyl-carbon-11]PK11195. PLoS ONE 2018, 13, e0201289. [Google Scholar] [CrossRef]
  13. Kaunzner, U.W.; Kang, Y.; Zhang, S.; Morris, E.; Yao, Y.; Pandya, S.; Rua, S.M.H.; Park, C.; Gillen, K.M.; Nguyen, T.D.; et al. Quantitative susceptibility mapping identifies inflammation in a subset of chronic multiple sclerosis lesions. Brain 2019, 142, 133–145. [Google Scholar] [CrossRef] [PubMed]
  14. Kropholler, M.A.; Boellaard, R.; Schuitemaker, A.; Folkersma, H.; van Berckel, B.N.; Lammertsma, A.A. Evaluation of Reference Tissue Models for the Analysis of [11C](R)-PK11195 Studies. J. Cereb. Blood Flow. Metab. 2006, 26, 1431–1441. [Google Scholar] [CrossRef] [PubMed]
  15. Rizzo, G.; Veronese, M.; Tonietto, M.; Bodini, B.; Stankoff, B.; Wimberley, C.; Lavisse, S.; Bottlaender, M.; Bloomfield, P.S.; Howes, O.; et al. Generalization of endothelial modelling of TSPO PET imaging: Considerations on tracer affinities. J. Cereb. Blood Flow. Metab. 2019, 39, 874–885. [Google Scholar] [CrossRef] [PubMed]
  16. Stokholm, M.G.; Iranzo, A.; Østergaard, K.; Serradell, M.; Otto, M.; Svendsen, K.B.; Garrido, A.; Vilas, D.; Borghammer, P.; Santamaria, J.; et al. Assessment of neuroinflammation in patients with idiopathic rapid-eye-movement sleep behaviour disorder: A case-control study. Lancet Neurol. 2017, 16, 789–796. [Google Scholar] [CrossRef] [PubMed]
  17. Passamonti, L.; Vázquez, R.P.; Hong, Y.; Allinson, K.S.; Williamson, D.; Borchert, R.J.; Sami, S.; Cope, T.; Bevan-Jones, W.; Jones, S.; et al. 18 F-AV-1451 positron emission tomography in Alzheimer’s disease and progressive supranuclear palsy. Brain 2017, 24, 340. [Google Scholar] [CrossRef]
  18. Turkheimer, F.E.; Edison, P.; Pavese, N.; Roncaroli, F.; Anderson, A.N.; Hammers, A.; Gerhard, A.; Hinz, R.; Tai, Y.F.; Brooks, D. Reference and target region modeling of [11C]-(R)-PK11195 brain studies. J. Nucl. Med. Off. Publ. Soc. Nucl. Med. 2007, 48, 158–167. [Google Scholar]
  19. Boellaard, R.; Turkheimer, F.E.; Hinz, R.; Schuitemaker, A.; Scheltens, P.; van Berckel, B.N.M.; Lammertsma, A.A. Performance of a modified supervised cluster algorithm for extracting reference region input functions from (R)-(R)-[11C]PK11195 brain PET studies. In 2008 IEEE Nuclear Science Symposium Conference Record; IEEE: Dresden, Germany, 2008; pp. 5400–5402. Available online: http://ieeexplore.ieee.org/document/4774453 (accessed on 16 February 2023).
  20. Yaqub, M.; van Berckel, B.N.; Schuitemaker, A.; Hinz, R.; E Turkheimer, F.; Tomasi, G.; Lammertsma, A.A.; Boellaard, R. Optimization of Supervised Cluster Analysis for Extracting Reference Tissue Input Curves in (R)-[11C]PK11195 Brain PET Studies. J. Cereb. Blood Flow. Metab. 2012, 32, 1600–1608. [Google Scholar] [CrossRef]
  21. Giannetti, P.; Politis, M.; Su, P.; Turkheimer, F.; Malik, O.; Keihaninejad, S.; Wu, K.; Reynolds, R.; Nicholas, R.; Piccini, P. Microglia activation in multiple sclerosis black holes predicts outcome in progressive patients: An in vivo [(11)C](R)-PK11195-PET pilot study. Neurobiol. Dis. 2014, 65, 203–210. [Google Scholar] [CrossRef]
  22. Rissanen, E.; Tuisku, J.; Rokka, J.; Paavilainen, T.; Parkkola, R.; Rinne, J.O.; Airas, L. In Vivo Detection of Diffuse Inflammation in Secondary Progressive Multiple Sclerosis Using PET Imaging and the Radioligand 11C-PK11195. J. Nucl. Med. 2014, 55, 939–944. [Google Scholar] [CrossRef]
  23. Rissanen, E.; Tuisku, J.; Vahlberg, T.; Sucksdorff, M.; Paavilainen, T.; Parkkola, R.; Rokka, J.; Gerhard, A.; Hinz, R.; Talbot, P.S. Microglial activation, white matter tract damage, and disability in MS. Neurol. Neuroimmunol. Neuroinflamm. 2018, 5, e443. [Google Scholar] [CrossRef]
  24. Sucksdorff, M.; Rissanen, E.; Tuisku, J.; Nuutinen, S.; Paavilainen, T.; Rokka, J.; Rinne, J.; Airas, L. Evaluation of the Effect of Fingolimod Treatment on Microglial Activation Using Serial PET Imaging in Multiple Sclerosis. J. Nucl. Med. 2017, 58, 1646–1651. [Google Scholar] [CrossRef] [PubMed]
  25. Kaunzner, U.W.; Kang, Y.; Monohan, E.; Kothari, P.J.; Nealon, N.; Perumal, J.; Vartanian, T.; Kuceyeski, A.; Vallabhajosula, S.; Mozley, P.D.; et al. Reduction of PK11195 uptake observed in multiple sclerosis lesions after natalizumab initiation. Mult. Scler. Relat. Disord. 2017, 15, 27–33. [Google Scholar] [CrossRef] [PubMed]
  26. Pitombeira, M.S.; Koole, M.; Campanholo, K.R.; Souza, A.M.; Duran, F.L.S.; Solla, D.J.F.; Mendes, M.F.; Pereira, S.L.A.; Rimkus, C.M.; Busatto, G.F.; et al. Innate immune cells and myelin profile in multiple sclerosis: A multi-tracer PET/MR study. Eur. J. Nucl. Med. Mol. Imaging 2022, 49, 4551–4566. [Google Scholar] [CrossRef] [PubMed]
  27. de Souza, A.M.; Pitombeira, M.S.; de Souza, L.E.; Marques, F.L.N.; Buchpiguel, C.A.; Real, C.C.; de Paula Faria, D. 11C-PK11195 plasma metabolization has the same rate in multiple sclerosis patients and healthy controls: A cross-sectional study. Neural Regen. Res. 2021, 16, 2494. [Google Scholar] [PubMed]
  28. Hammers, A.; Allom, R.; Koepp, M.J.; Free, S.L.; Myers, R.; Lemieux, L.; Mitchell, T.N.; Brooks, D.J.; Duncan, J.S. Three-dimensional maximum probability atlas of the human brain, with particular reference to the temporal lobe. Hum. Brain Mapp. 2003, 19, 224–247. [Google Scholar] [CrossRef] [PubMed]
  29. Gousias, I.S.; Rueckert, D.; Heckemann, R.A.; Dyet, L.E.; Boardman, J.P.; Edwards, A.D.; Hammers, A. Automatic segmentation of brain MRIs of 2-year-olds into 83 regions of interest. NeuroImage 2008, 40, 672–684. [Google Scholar] [CrossRef]
  30. Schubert, J.; Tonietto, M.; Turkheimer, F.; Zanotti-Fregonara, P.; Veronese, M. Supervised clustering for TSPO PET imaging. Eur. J. Nucl. Med. Mol. Imaging 2021, 49, 257–268. [Google Scholar] [CrossRef]
  31. Logan, J. Graphical analysis of PET data applied to reversible and irreversible tracers. Nucl. Med. Biol. 2000, 27, 661–670. [Google Scholar] [CrossRef]
  32. Logan, J.; Fowler, J.S.; Volkow, N.D.; Wang, G.J.; Ding, Y.S.; Alexoff, D.L. Distribution Volume Ratios without Blood Sampling from Graphical Analysis of PET Data. J. Cereb. Blood Flow. Metab. 1996, 16, 834–840. [Google Scholar] [CrossRef]
  33. Wimberley, C.; Lavisse, S.; Hillmer, A.; Hinz, R.; Turkheimer, F.; Zanotti-Fregonara, P. Kinetic modeling and parameter estimation of TSPO PET imaging in the human brain. Eur. J. Nucl. Med. Mol. Imaging 2021, 49, 246–256. [Google Scholar] [CrossRef] [PubMed]
  34. Hunter, C.R.R.N.; Klein, R.; Beanlands, R.S.; Dekemp, R.A. Patient motion effects on the quantification of regional myocardial blood flow with dynamic PET imaging. Med. Phys. 2016, 43, 1829–1840. [Google Scholar] [CrossRef] [PubMed]
  35. De Pierro, A.R. A modified expectation maximization algorithm for penalized likelihood estimation in emission tomography. IEEE Trans. Med. Imaging 1995, 14, 132–137. [Google Scholar] [CrossRef] [PubMed]
  36. Qi, J.; Huesman, R.H. List mode reconstruction for PET with motion compensation: A simulation study. In Proceedings of the IEEE International Symposium on Biomedical Imaging, Washington, DC, USA, 7–10 July 2002; IEEE: Washington, WA, USA, 2002; pp. 413–416. [Google Scholar] [CrossRef]
Figure 1. Boxplot representation of VTAIF. Green boxes with circles represent the VTAIF values in the HC group, and blue boxes with diamonds represent the VTAIF values in the MS group. HC: Healthy control. MS: Multiple sclerosis.
Jimaging 10 00039 g001
Figure 2. Boxplot representation of VTIDIF. Green boxes with circles represent the VTIDIF values in the HC group, and blue boxes with diamonds represent the VTIDIF values in the MS group. HC: Healthy control. MS: Multiple sclerosis.
Jimaging 10 00039 g002
Figure 3. Bland–Altman (A) and linear regression analysis (B) of VTIDIF and VTAIF.
Jimaging 10 00039 g003
Figure 4. Boxplot representation of DVRAIF. Green boxes with circles represent the DVRAIF values in the HC group, and blue boxes with diamonds represent the DVRAIF values in the MS group. The p-values from GLM tests are shown, respectively. HC: Healthy control. MS: Multiple sclerosis.
Jimaging 10 00039 g004
Figure 5. Boxplot representation of DVRIDIF. Green boxes with circles represent the DVRIDIF values in the HC group, and blue boxes with diamonds represent the DVRIDIF values in the MS group. The p-values from GLM tests are shown, respectively. HC: Healthy control. MS: Multiple sclerosis.
Jimaging 10 00039 g005
Figure 6. Boxplot representation of DVRSVCA4. Green boxes with circles represent the DVRSVCA4 values in the HC group, and blue boxes with diamonds represent the DVRSVCA4 values in the MS group. The p-values from GLM tests are shown, respectively. HC: Healthy control. MS: Multiple sclerosis.
Jimaging 10 00039 g006
Figure 7. Bland–Altman (A) and linear regression analysis (B) of DVRAIF, DVRIDIF, and DVRSVCA4 (IDIF in red and SVCA4 in blue).
Jimaging 10 00039 g007
Figure 8. Correlation analysis between VTAIF and DVRAIF (orange), DVRIDIF (red), and DVRSVCA4 (blue).
Jimaging 10 00039 g008
Figure 9. Bland–Altman (A) and linear regression analysis (B) of DVRSVCA4 (0–60 min) and DVRSVCA4 (20–60 min).
Jimaging 10 00039 g009
Table 1. Demographic information from study cohort.
HCRRMSp-Value
Age (years)41.8 ± 12.735.0 ± 7.60.06 &
Sex (F/M)11/516/80.73 #
Education (years)14.2 ± 3.913.7 ± 3.60.70 &
EDSS (range)-1.0–6.0-
Disease duration (years)-9.1 ± 6.4-
Number of relapses-7.0 ± 8.0-
Use of DMT (Y/N)-22/2-
&: Student’s t-test. #: Fischer’s exact test. HC: Healthy control. RRMS: Relapsing-Remitting Multiple Sclerosis. F: Female. M: Male. Y: Yes. N: No. EDSS: Expanded Disability Status Scale. DMT: Disease-Modifying Therapy.
Table 2. VT values for the blood-based input functions.
AIF aIDIF a
HC b (n = 16)MS b (n = 24)p-Value cHC b (n = 16)MS b (n = 24)p-Value c
Gray matter0.43 ± 0.110.44 ± 0.130.860.58 ± 0.140.58 ± 0.120.24
White matter0.44 ± 0.110.46 ± 0.150.800.56 ± 0.140.58 ± 0.130.23
Caudate nucleus0.35 ± 0.090.35 ± 0.110.610.46 ± 0.110.45 ± 0.090.41
Putamen0.43 ± 0.100.46 ± 0.150.770.58 ± 0.140.62 ± 0.130.17
Pallidum0.44 ± 0.120.47 ± 0.160.770.59 ± 0.150.63 ± 0.140.18
Thalamus0.45 ± 0.110.47 ± 0.150.840.62 ± 0.150.65 ± 0.140.19
Cerebellum0.40 ± 0.100.40 ± 0.120.880.55 ± 0.140.55 ± 0.110.23
Brainstem0.46 ± 0.120.47 ± 0.150.790.61 ± 0.150.63 ± 0.130.34
a: Logan Plot. b: mean ± standard deviation. c: Generalized linear model adjusted for age and sex (95%). AIF: Arterial input function. IDIF: Image-derived input function. HC: Healthy control. MS: Multiple sclerosis patients.
Table 3. DVR values for each quantification method.
AIFIDIFSVCA4
HC a (n = 16)MS a (n = 24)p-Value bHC a (n = 16)MS a (n = 24)p-Value bHC a (n = 16)MS a (n = 24)p-Value b
Gray matter1.10 ± 0.041.13 ± 0.050.121.07 ± 0.031.11 ± 0.050.081.09 ± 0.031.12 ± 0.050.09
White matter1.13 ± 0.071.20 ± 0.070.05 *1.02 ± 0.051.09 ± 0.080.05 *1.07 ± 0.051.14 ± 0.070.04 *
Caudate nucleus0.90 ± 0.090.91 ± 0.110.770.84 ± 0.080.84 ± 0.080.950.87 ± 0.080.87 ± 0.090.90
Putamen1.11 ± 0.071.20 ± 0.110.05 *1.09 ± 0.051.18 ± 0.110.03 *1.10 ± 0.061.19 ± 0.110.04 *
Pallidum1.11 ± 0.081.23 ± 0.110.03 *1.10 ± 0.061.19 ± 0.100.05 *1.11 ± 0.071.21 ± 0.100.04 *
Thalamus1.15 ± 0.061.22 ± 0.090.04 *1.17 ± 0.051.25 ± 0.090.03 *1.16 ± 0.051.24 ± 0.090.03 *
Cerebellum1.02 ± 0.041.04 ± 0.050.461.04 ± 0.041.06 ± 0.050.511.03 ± 0.041.06 ± 0.050.44
Brainstem1.18 ± 0.061.23 ± 0.090.091.14 ± 0.051.20 ± 0.090.131.16 ± 0.061.21 ± 0.090.12
a: mean ± standard deviation. b: Generalized linear model adjusted for age and sex (95%). AIF: Arterial input function. IDIF: Image-derived input function. HC: Healthy control. MS: Multiple sclerosis. *: p-Value<0.05.
Disclaimer/Publisher’s Note: The statements, opinions and data contained in all publications are solely those of the individual author(s) and contributor(s) and not of MDPI and/or the editor(s). MDPI and/or the editor(s) disclaim responsibility for any injury to people or property resulting from any ideas, methods, instructions or products referred to in the content.

