A Systems Firm-Centered Perspective on the Environmental Assessment of Recyclable PET and Glass Soft Drink Containers
Abstract
1. Introduction
2. Background
2.1. LCA and Logistic Operations
2.2. The Case Company and Its Activities
3. Results
3.1. LCA Calculations
3.2. Results of Simulations
3.2.1. The Effect of Different Percentages of Returned Glass Bottles
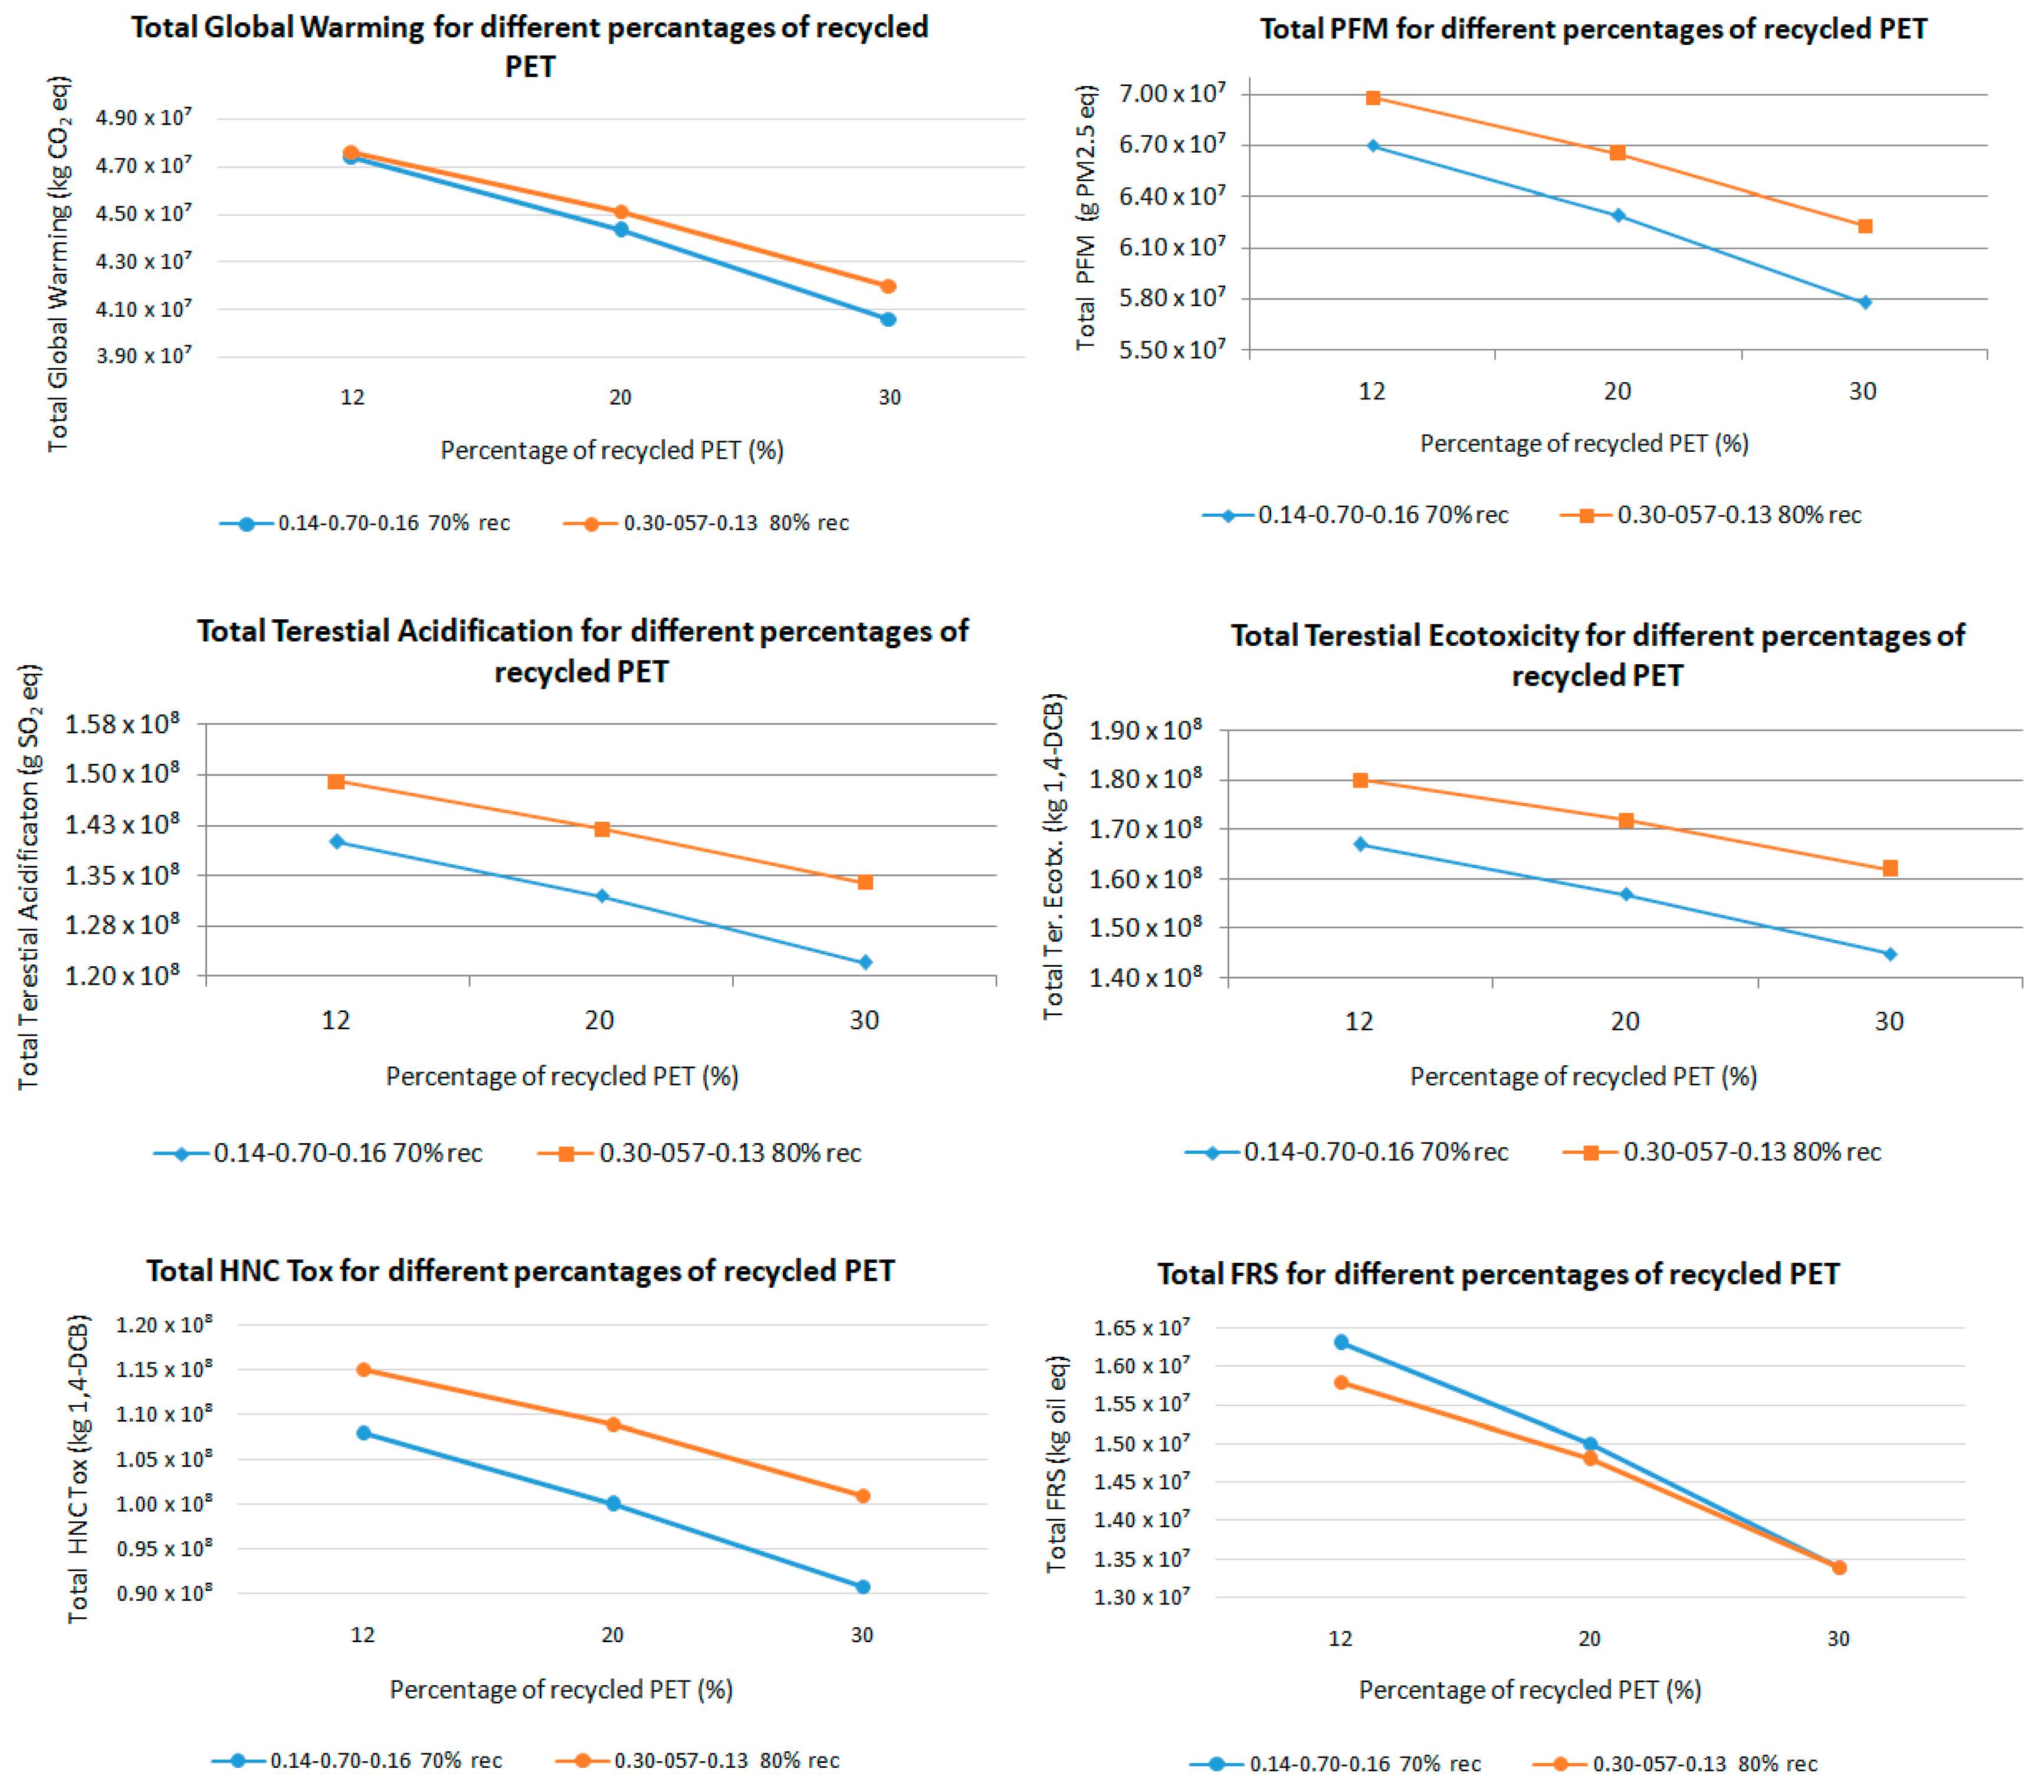
3.2.2. The Effect of Using Recycled PET in New Plastic Bottles
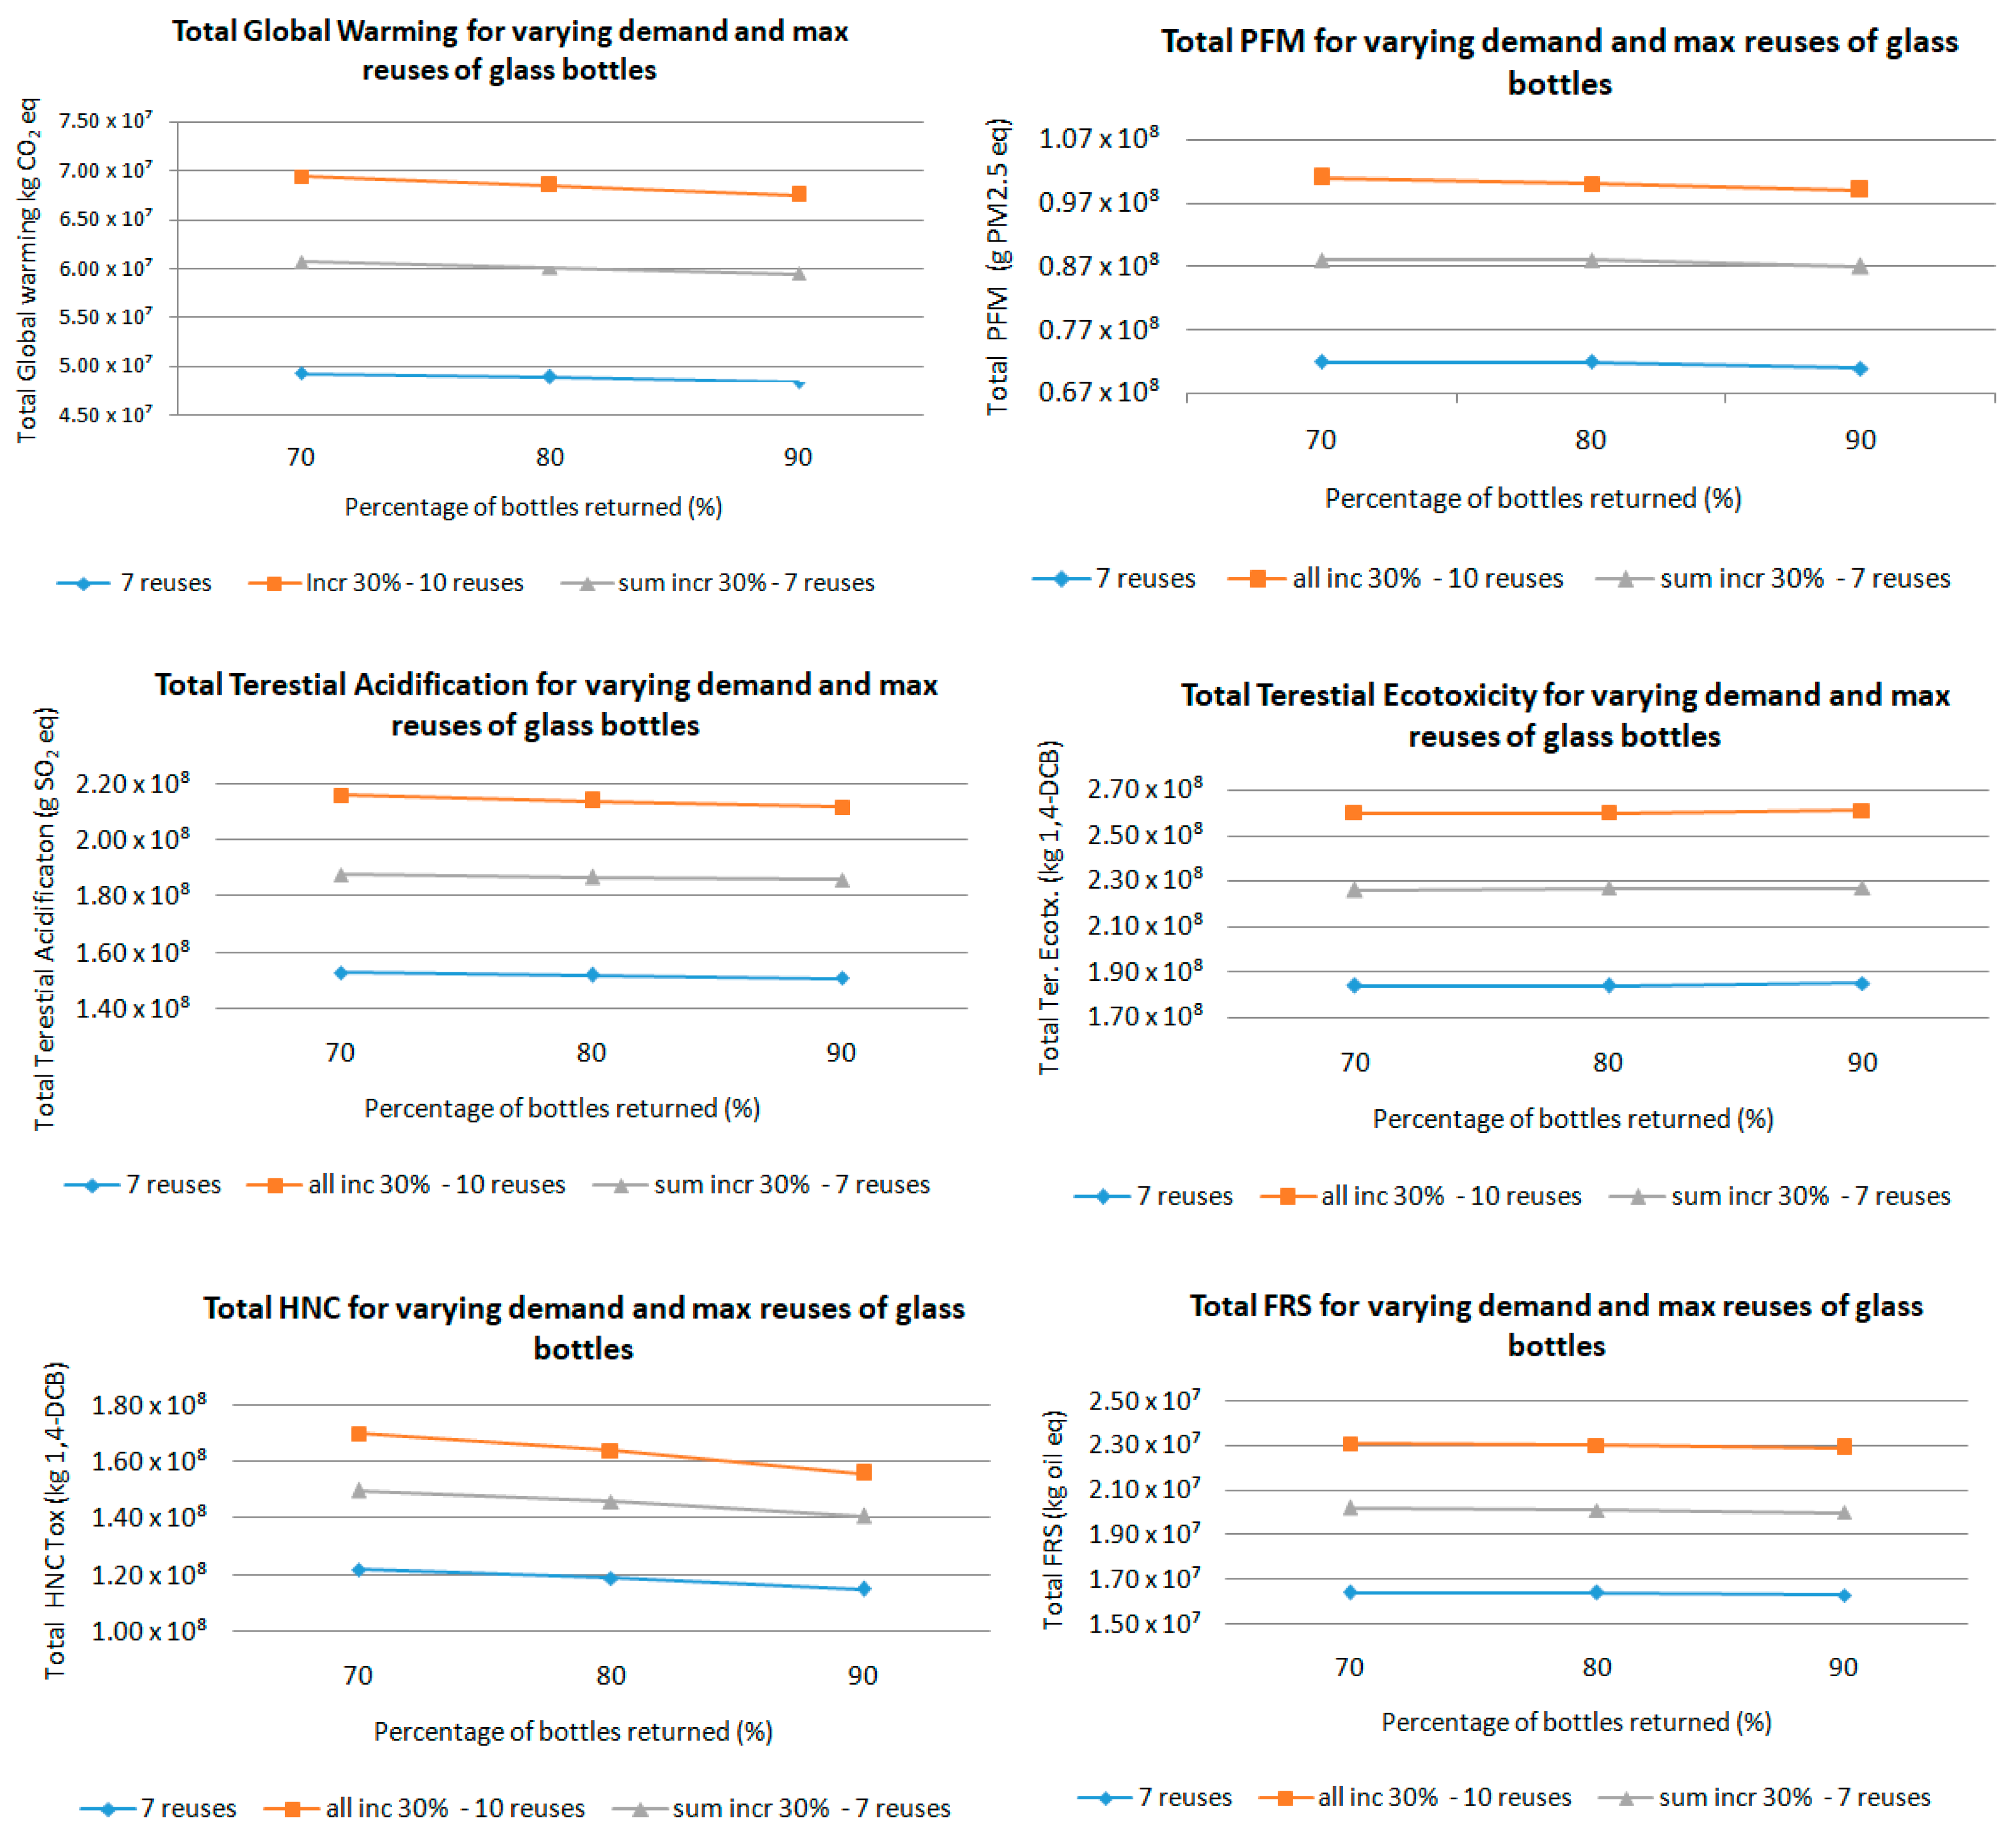
3.2.3. System Response to Varying Demand and Maximum Uses of Returned Glass Bottles
3.2.4. Environmental Impact Per Bottle Produced
4. Materials and Methods
5. Discussion and Conclusions
Author Contributions
Funding
Data Availability Statement
Conflicts of Interest
References
- Geyer, R.; Jambeck, J.R.; Law, K.L. Production, use, and fate of all plastics ever made. Sci. Adv. 2017, 3, e1700782. [Google Scholar] [CrossRef] [PubMed]
- Mendes, A.C.; Pedersen, G.A. Perspectives on sustainable food packaging:–is bio-based plastics a solution? Trends in Food Sci. Technol. 2021, 112, 839–846. [Google Scholar] [CrossRef]
- Pal, M.; Devrani, M.; Hadush, A. Recent developments in food packaging technologies. Beverage Food World 2019, 46, 21–25. [Google Scholar]
- Tulashie, S.K.; Boadu, E.K.; Dapaah, S. Plastic waste to fuel via pyrolysis: A key way to solving the severe plastic waste problem in Ghana. Therm. Sci. Eng. Prog. 2019, 11, 417–424. [Google Scholar] [CrossRef]
- Barnes, D.K.A.; Galgani, F.; Thompson, R.C.; Barlaz, M. Accumulation and fragmentation of plastic debris in global environments. Philos. Trans. R. Soc. B Biol. Sci. 2009, 364, 1985–1998. [Google Scholar] [CrossRef]
- Mann, M.E. The New Climate War: The Fight to Take Our Planet Back; Scribe Publications: London, UK, 2021. [Google Scholar]
- Waring, R.H.; Harris, R.M.; Mitchell, S.C. Plastic contamination of the food chain: A threat to human health? Maturitas 2018, 115, 64–68. [Google Scholar] [CrossRef]
- Directive (EU) 2019/904 of the European Parliament and of the Council of 5 June 2019 on the reduction of the impact of certain plastic product on the environment. Off. J. Eur. Union 2019, L155, 1–19.
- Grand View Research. U.S. Soft Drinks Market Size, Share & Trends Analysis Report by Product (Carbonated Drinks, Packaged Water, Iced/RTD Tea Drinks, Fruit Beverages, Energy Drinks), by Distribution Channel, and Segment Forecasts, 2024–2030; Grand View Research: San Francisco, CA, USA, 2018. [Google Scholar]
- FoodDrink Europe. Data & Trends: EU Food and Drink Industry 2016; FoodDrink Europe: Brussels, Belgium, 2016. [Google Scholar]
- ICAP. 40 High Performance Sectors in Greece; Athens Chamber of Industry and Commerce: Athens, Greece, 2016. [Google Scholar]
- Mirasgedis, S.; Georgopoulou, E.; Sarafidis, Y.; Papagiannaki, K.; Lalas, D.P. The impact of climate change on the pattern of demand for bottled water and non-alcoholic beverages. Bus. Strateg. Environ. 2014, 23, 272–288. [Google Scholar] [CrossRef]
- De Feo, G.; Ferrara, C.; Minichini, F. Comparison between the perceived and actual environmental sustainability of beverage packagings in glass, plastic, and aluminum. J. Clean. Prod. 2022, 333, 130158. [Google Scholar] [CrossRef]
- Ahmad, S.M.; Ahmad, A.S. The impact of polyethylene terephthalate waste on different bituminous designs. J. Eng. Appl. Sci. 2022, 69, 53. [Google Scholar] [CrossRef]
- Ingrao, C.; Wojnarowska, M. Findings from a stream lined life cycle assessment of PET-bottles for beverage –packaging applications, in the context of circular economy. Sci. Total Environ. 2023, 892, 164805. [Google Scholar] [CrossRef] [PubMed]
- Nistico, R. Polyethylene terephthalate (PET) in the packaging industry. Polym. Test. 2020, 90, 106707. [Google Scholar] [CrossRef]
- Allen, D.; Linsley, C.; Spoelman, N.; Johl, A. The Fraud of Plastic Recycling: How Big Oil and the Plastics Industry Deceived the Public for Decades and Caused the Plastic Waste Crisis. Center for Climate Integrity. 2024. Available online: http://climateintegrity.org/uploads/media/Fraud-of-Plastic-Recycling-2024.pdf (accessed on 13 September 2024).
- Duarte, L.T.; e Silva, E.M.P.; Branco, J.R.T.; Lins, V.F.C. Production and characterization of thermally sprayed polyethylene terephthalate coatings. Surf. Coat. Technol. 2004, 182, 261–267. [Google Scholar] [CrossRef]
- Sarker, M.; Rashid, M.M. Thermal Degradation of Poly (ethylene terephthalate) Waste Soft Drinks Bottles and Low Density Polyethylene Grocery Bags. Intern. J. Sustain. Energy Environ. 2013, 1, 78–86. Available online: www.ijsee.com, http://www.ijsee.com/IJSEE_VOL.%201,%20NO.%203,%20April%202013/Thermal%20degradation%20of%20poly%20%20(ethylene%20terephthalate)%20waste%20soft%20drinks%20bottles%20and%20Low%20Density%20%20Polyethylene%20Grocery%20Bags.pdf (accessed on 12 September 2024).
- Lebreton, L.; Andrady, A. Future scenarios of global plastic waste generation and disposal. Palgrave Commun. 2019, 5, 6. [Google Scholar] [CrossRef]
- Islam, M.D.; Lee, Z.; Shaleh, A.; Soo, H.S. The United Nations Assembly resolution to end plastic pollution: Challenges to effective policy interventions. Env. Dev. Sustain. 2024, 26, 10927–10944. [Google Scholar] [CrossRef]
- Guignone, G.; Calmon, L.J.; Vieira, D.; Bravo, A. BIM and LCA integration methodologies: A critical analysis and proposed guidelines. J. Build. Eng. 2023, 73, 106780. [Google Scholar] [CrossRef]
- Pauer, E.; Heinrich, V.; Tacker, M. Methods for the Assessment of Environmental Sustainability of Packaging: A review. IJRDO J. Agric. Res. 2017, 3, 33–62. Available online: https://www.ijrdo.org/index.php/ar/article/view/86/75 (accessed on 13 September 2024).
- Ferrara, C.; De Feo, G.; Picone, V. LCA of Glass Versus PET Mineral Water Bottles: An Italian Case Study. Recycling 2021, 6, 50. [Google Scholar] [CrossRef]
- Amienyo, D.; Gujba, H.; Stichnothe, H.; Azapagic, A. Life cycle environmental impacts of carbonated soft drinks. Int. J. Life Cycle Assess. 2013, 18, 77–92. [Google Scholar] [CrossRef]
- Almeida, C.M.V.B.; Rodrigues, A.J.M.; Agostinho, F.; Giannetti, B.F. Material selection for environmental responsibility: The case of soft drinks packaging in Brazil. J. Clean. Prod. 2017, 142, 172–179. [Google Scholar] [CrossRef]
- Τua, C.; Grosso, M.; Rigamonti, L. Reusing glass bottles in Italy: A life cycle assessment evaluation. Procedia CIRP 2020, 90, 192–197. [Google Scholar] [CrossRef]
- Simon, B.; Amor, M.B.; Földényi, R. Life cycle impact assessment of beverage packaging systems: Focus on the collection of post-consumer bottles. J. Clean. Prod. 2016, 112, 238–248. [Google Scholar] [CrossRef]
- Boutros, M.; Saba, S.; Manneh, R. Life cycle assessment of two packaging materials for carbonated beverage (polyethylene terephthalate vs. glass): Case study for the Lebanese context and importance of the end-of-life scenarios. J. Clean. Prod. 2021, 314, 128289. [Google Scholar] [CrossRef]
- Ponstein, H.J.; Meyer-Aurich, A.; Prochnow, A. Greenhouse gas emissions and mitigation options for German wine production. J. Clean. Prod. 2019, 212, 800–809. [Google Scholar] [CrossRef]
- Cleary, J. Life cycle assessment of wine and spirit packaging at the product and the municipal scale: A Toronto, Canada case study. J. Clean. Prod. 2013, 44, 143–151. [Google Scholar] [CrossRef]
- Ferrara, C.; De Feo, G. Comparative life-cycle assessment of alternative systems for wine packaging in Italy. J. Clean. Prod. 2020, 259, 120888. [Google Scholar] [CrossRef]
- Stefanini, R.; Borghesi, G.; Ronzano, A.; Vignali, G. Plastic or glass: A new environmental assessment with a marine litter indicator for the comparison of pasteurized milk bottles. Int. J. Life Cycle Assess. 2021, 26, 767–784. [Google Scholar] [CrossRef]
- Ramanathan, U.; He, Q.; Subramanian, N.; Gunasekaran, A.; Sarpong, D. Collaborative closed-loop supply chain framework for sustainable manufacturing: Evidence from the Indian packaging industry. Technol. Forcast Soc. Chang. 2023, 191, 122489. [Google Scholar] [CrossRef]
- Gomes, T.S.; Visconte, L.L.Y.; Pacheco, E.B.A.V. Life Cycle Assessment of Polyethylene Terephthalate Packaging: An Overview. J. Polym. Environ. 2019, 27, 533–548. [Google Scholar] [CrossRef]
- Alvarado Chcon, F.; Brouwer, M.T.; Thodenvan Velzen, E.U. Effect of recycled content and rPET quality on the properties of PET bottles, part I: Optical and mechanical properties. Packag. Technol. Sci. 2020, 33, 347–357. [Google Scholar] [CrossRef]
- Basuhi, R.; Bhuwalka, K.; Roth, R.; Olivetti, E.A. Evaluating strategies to increase PET bottle recycling in the United States. J. Ind. Ecol. 2024, 28, 916–927. [Google Scholar] [CrossRef]
- Nguyen, P.-M.; Berrard, C.; Daoud, N.; Saillard, P.; Peyroux, J.; Vitrac, O. Assessment of chemical risks and circular economy implications of recycled PET in food packaging with functional barriers. Resour. Environ. Sustain. 2024, 17, 100163. [Google Scholar] [CrossRef]
- Nardi, P.C.C.; da Silva, R.L.M.; Ribeiro, E.M.S.; de Oliveira, S.V.W.B. Proposal for a methodology to monitor sustainability in the production of soft drinks in Ref PET. J. Clean. Prod. 2017, 151, 218–234. [Google Scholar] [CrossRef]
- IPCC. Climate Change 2013: The Physical Science Basis. In Contribution of Working Group I to the Fifth Assessment Report of the Intergovernmental Panel on Climate Change; Stocker, T.F., Qin, D., Plattner, G.K., Tignor, M., Allen, S.K., Boschung, J., Nauels, A., Xia, Y., Bex, V., Midgley, P.M., Eds.; Cambridge University Press: Cambridge, UK, 2013; p. 1535. [Google Scholar] [CrossRef]
- WMO. Scientific Assessment of Ozone Depletion: 2010; Global Ozone Research and Monitoring Project—Report No. 52; World Meteorological Organization: Geneva, Switzerland, 2011; Available online: https://ozone.unep.org/sites/default/files/2019-05/00-SAP-2010-Assement-report.pdf (accessed on 14 September 2024).
- Frischknecht, R.; Braunschweig, A.; Hofstetter, P.; S uter, P. Human health damages due to ionizing radiation in life cycle impact assessment. Environ. Impact Assess. Rev. 2000, 20, 159–189. [Google Scholar] [CrossRef]
- van Zelm, R.; Preiss, P.; van Goethem, T.; Van Dingenen, R.; Huijbregts, M. Regionalized life cycle impact assessment of air pollution on the global scale: Damage to human health and vegetation. Atmos. Environ. 2016, 134, 129–137. [Google Scholar] [CrossRef]
- Roy, P.-O.; Azevedo, L.B.; Margni, M.; vanZelm, R.; Deschênes, L.; Huijbregts, M.A.J. Characterization factors for terrestrial acidification at the global scale: A systematic analysis of spatial variability and uncertainty. Sci. Total Environ. 2014, 500, 270–276. [Google Scholar] [CrossRef]
- van Zelm, R.; Huijbregts, M.A.J.; Van de Meent, D. USES-LCA 2.0-a global nested multi-media fate, exposure, and effects model. Int. J. Life Cycle Assess. 2009, 14, 282–284. [Google Scholar] [CrossRef]
- Curran, M.; Hellweg, S.; Beck, J. Is there any empirical support for biodiversity offset policy? Ecol. Appl. 2014, 24, 617–632. [Google Scholar] [CrossRef]
- Doell, P.; Siebert, S. Global modeling of irrigation water requirements. Water Resour. Res. 2002, 38, 1037. [Google Scholar] [CrossRef]
- Hoekstra, A.Y.; Mekonnen, M.M. The Water Footprint of Humanity. Proc. Natl. Acad. Sci. USA 2012, 109, 3232–3237. [Google Scholar] [CrossRef] [PubMed]
- Vieira, M.D.M.; Ponsioen, T.C.; Goedkoop, M.; Huijbregts, M.A.J. Surplus ore potential as a scarcity indicator for resource extraction. J. Ind. Ecol. 2016, 21, 381–390. [Google Scholar] [CrossRef]
- Jungbluth, N.; Frischknecht, R. Cumulative energy demand. In Implementation of Life Cycle Impact Assessment Methods; Hischier, R., Weidema, B., Eds.; Ecoinvent Centre: St Gallen, Switzerland, 2010; pp. 33–40. Available online: https://www.researchgate.net/publication/281199227_Cumulative_energy_demand (accessed on 27 August 2024).
- Helmes, R.J.K.; Huijbregts, M.A.J.; Henderson, A.D.; Jolliet, O. Spatially explicit fate factors of phosphorous emissions to freshwater at the global scale. Int. J. Life Cycle Assess. 2012, 17, 646–654. [Google Scholar] [CrossRef]
- Huijbregts, M.A.J.; Steinmann, Z.J.N.; Elshout, P.M.F.; Stam, G.; Verones, F.; Vieira, M.; Zijp, M.; Hollander, A.; vanZelm, R. ReCiPe2016: A harmonised life cycle impact assessment method at midpoint and endpoint level. Int. J. Life Cycle Assess. 2017, 22, 138–147. [Google Scholar] [CrossRef]
- Goedkoop, M.; Heijungs, R.; Huijbregts, M.; Schryver, A.D.; Struijs, J.; van Zelm, R. ReCiPe 2008. A Life Cycle Impact Assessment Method Which Comprises Harmonised Category Indicators at the Midpoint and the Endpoint Level, 1st ed.; Report I: Characterisation; Ministry of Housing, Spatial Planning and Environment (VROM): Amsterdam, The Netherlands, 2013; Available online: https://www.rivm.nl/sites/default/files/2018-11/ReCiPe%202008_A%20lcia%20method%20which%20comprises%20harmonised%20category%20indicators%20at%20the%20midpoint%20and%20the%20endpoint%20level_First%20edition%20Characterisation.pdf (accessed on 13 September 2024).
- Adamides, E.D.; Karacapilidis, N.; Pylarinou, H.; Koumanakos, D. Supporting collaboration in the development and management of lean supply networks. Prod. Plan. Control 2008, 19, 35–52. [Google Scholar] [CrossRef]
- Brenig-Jones, M.; Dowdall, J. Lean Six Sigma for Leaders: A Practical Guide for Leaders to Transform the Way They Run Their Organization; Wiley: Chichester, UK, 2018. [Google Scholar]
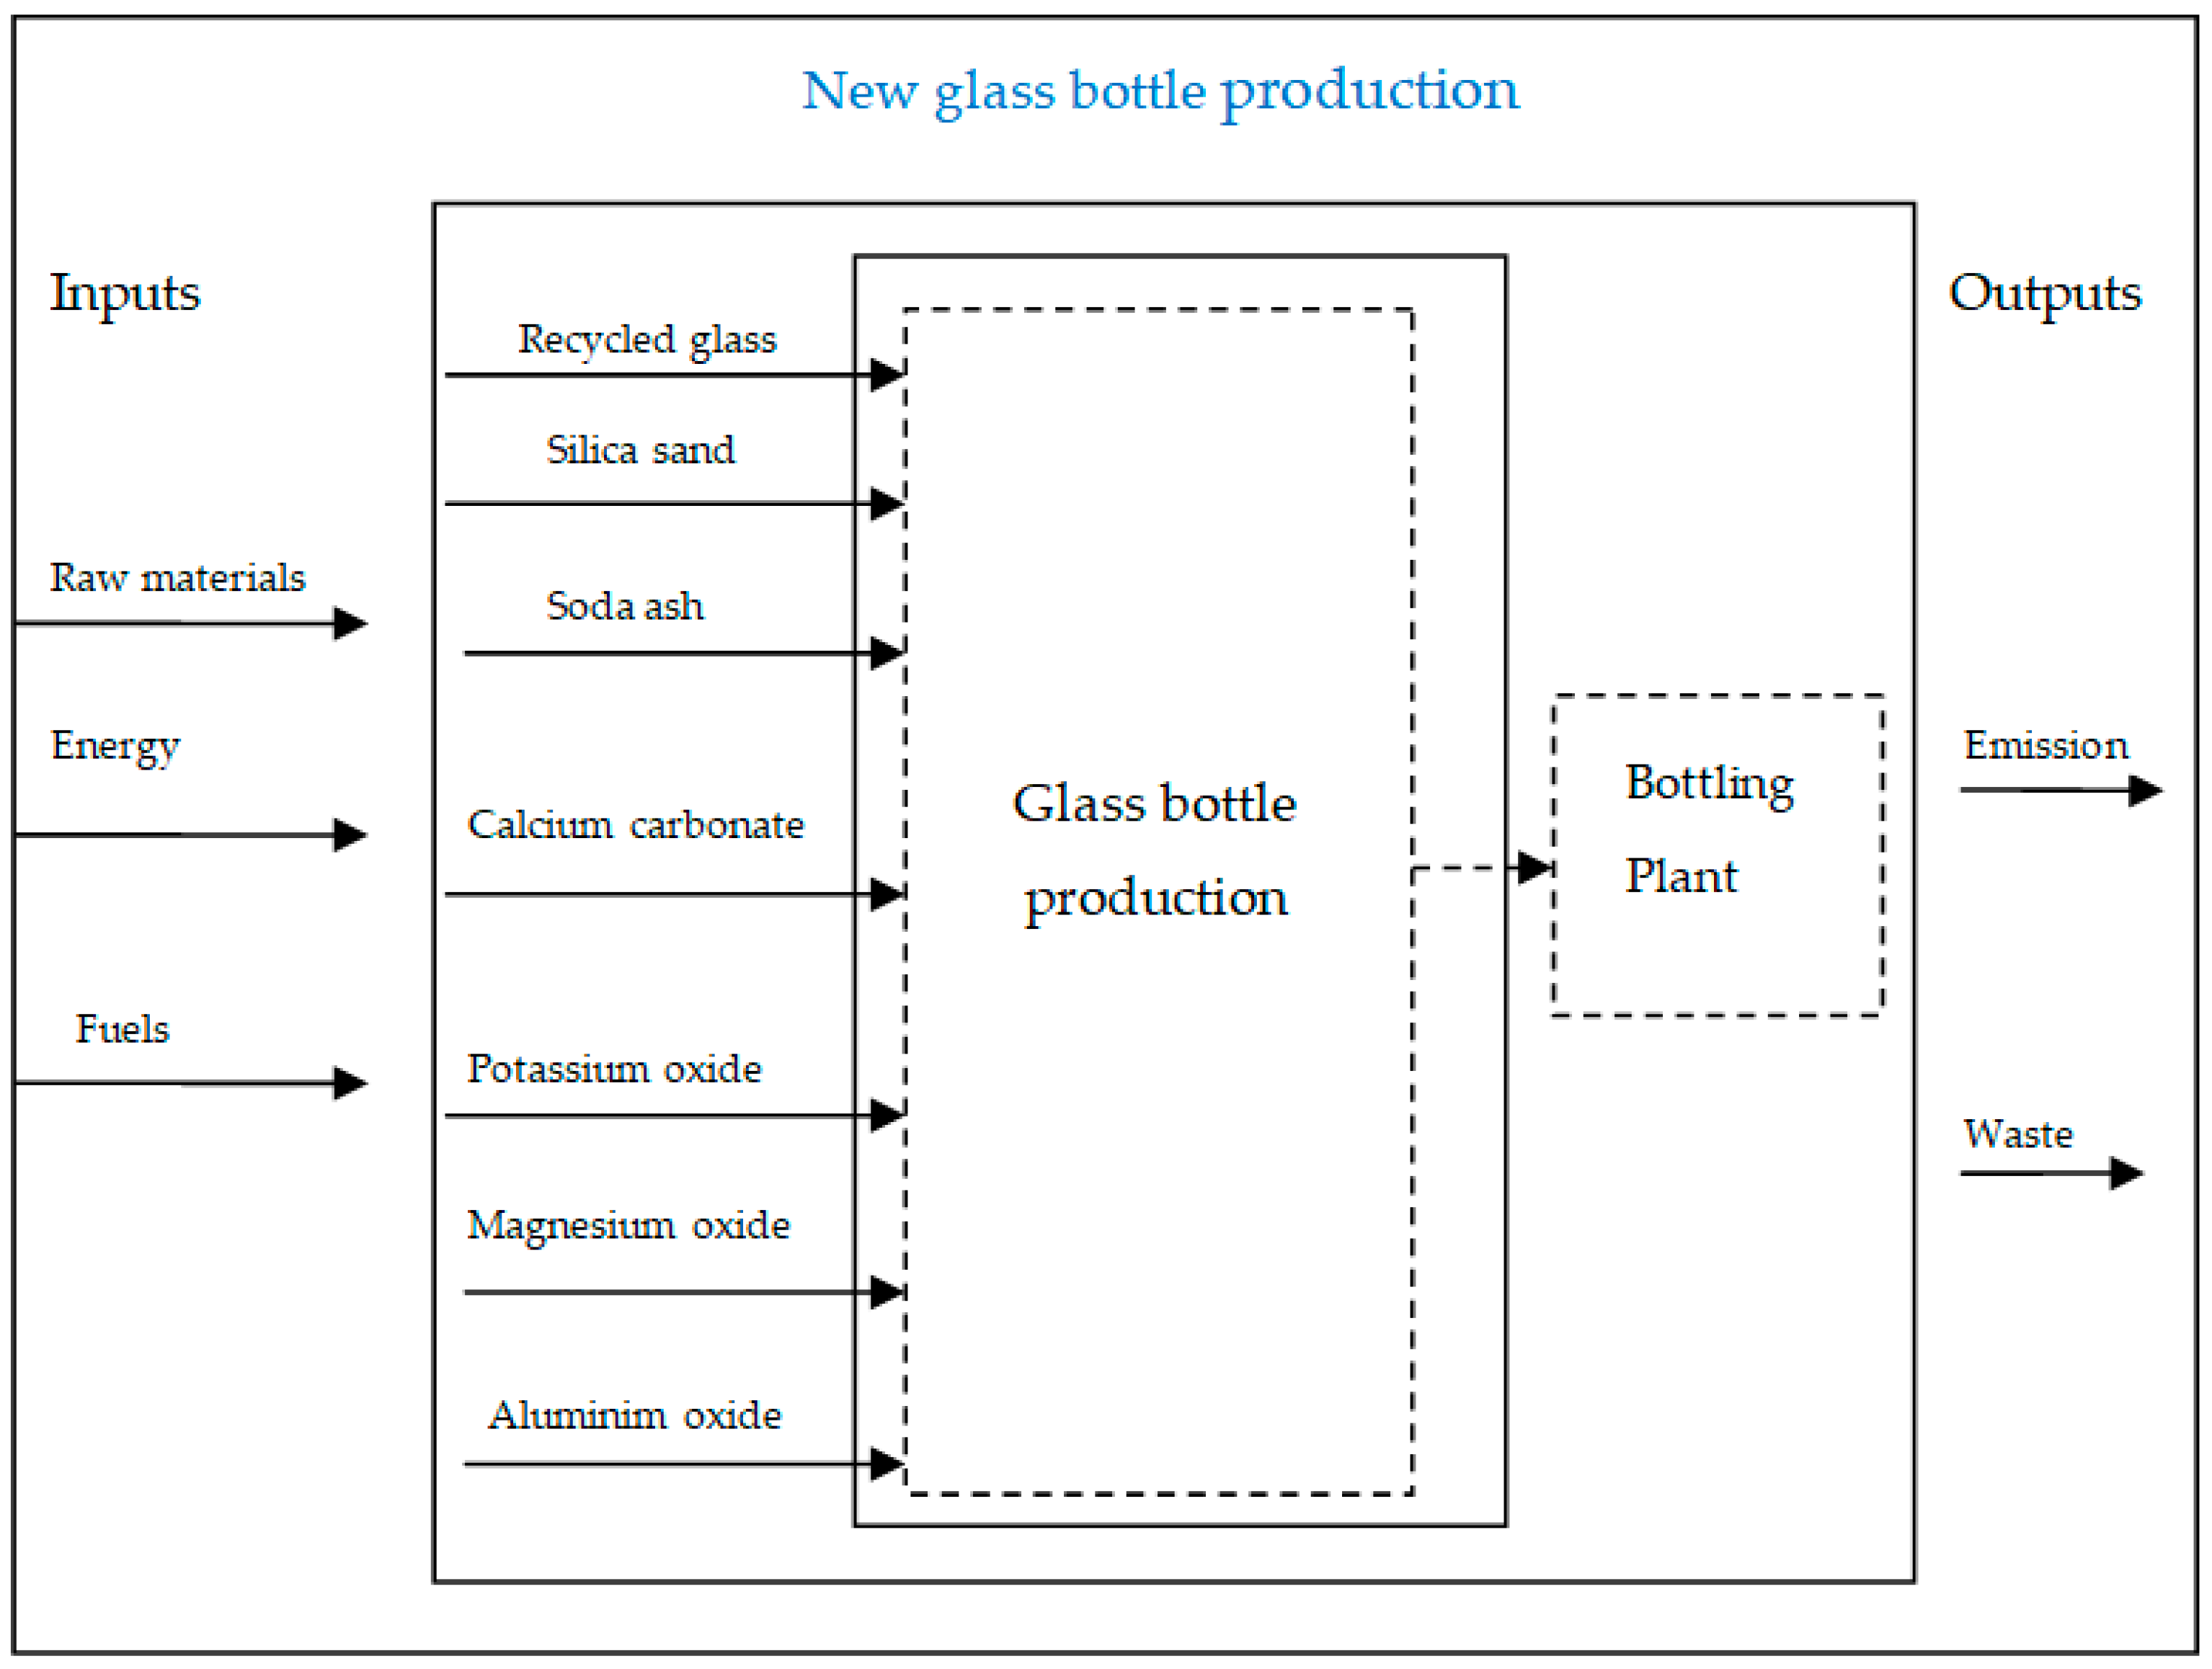
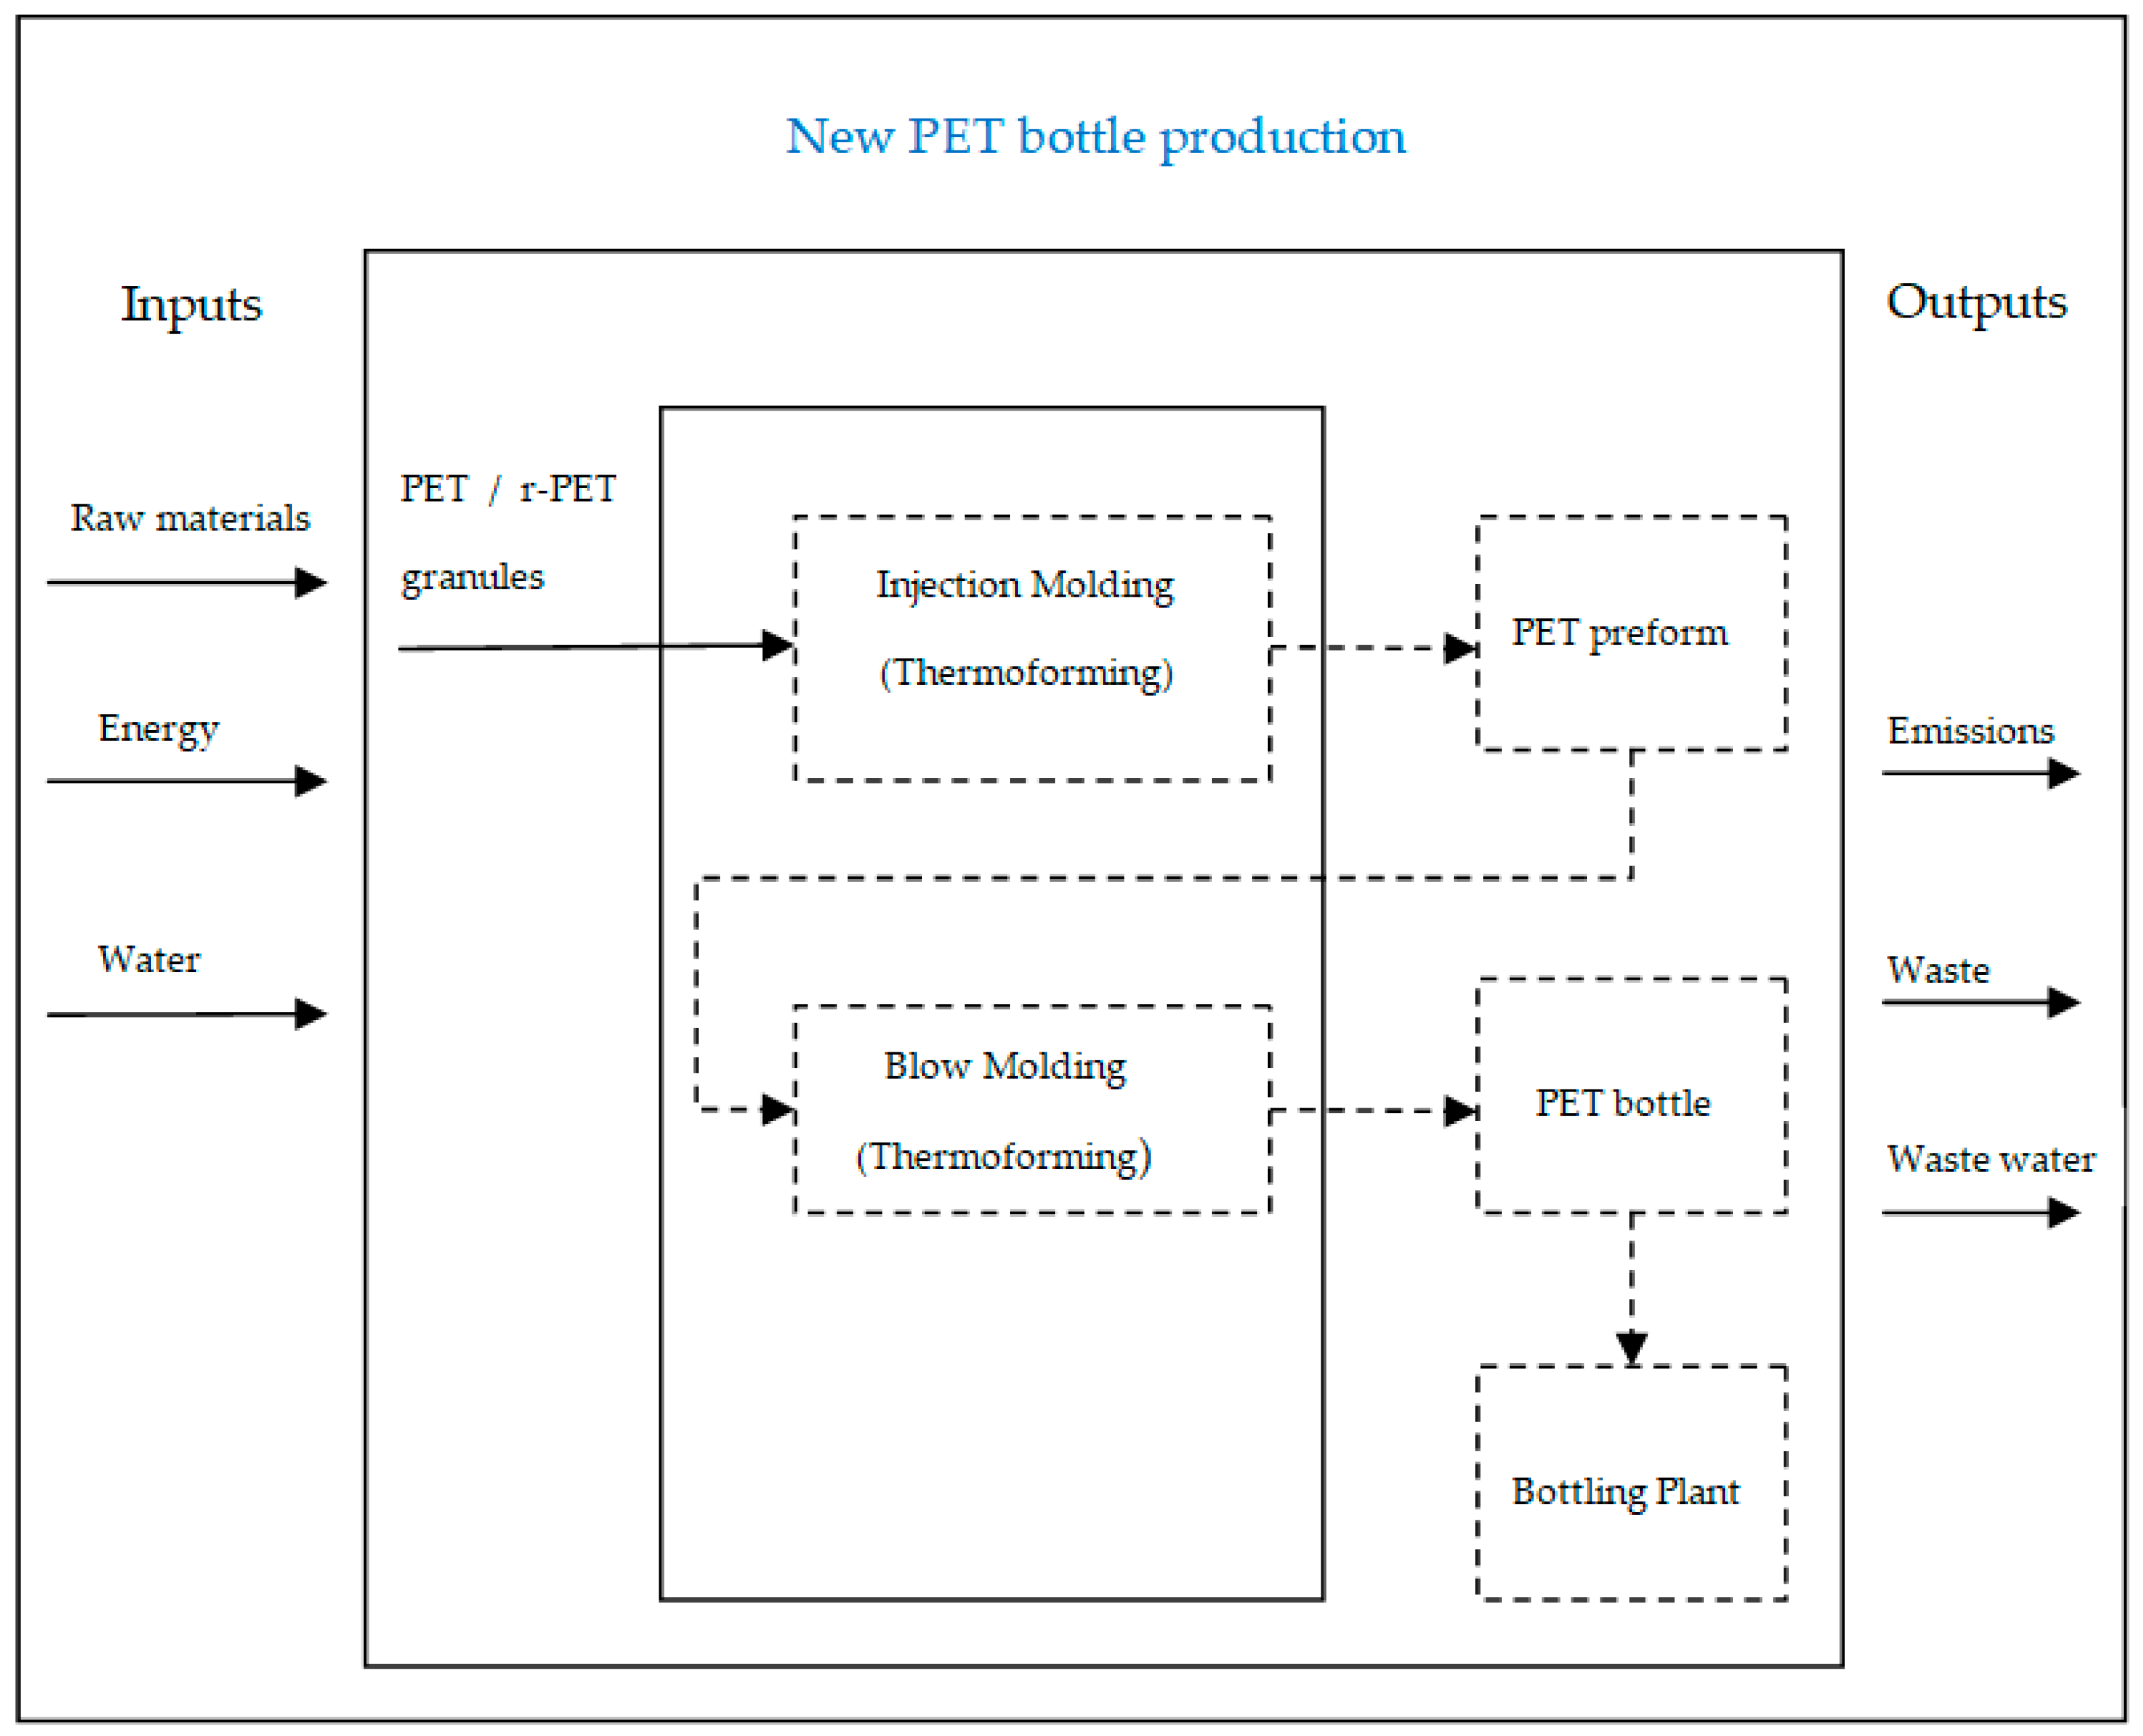
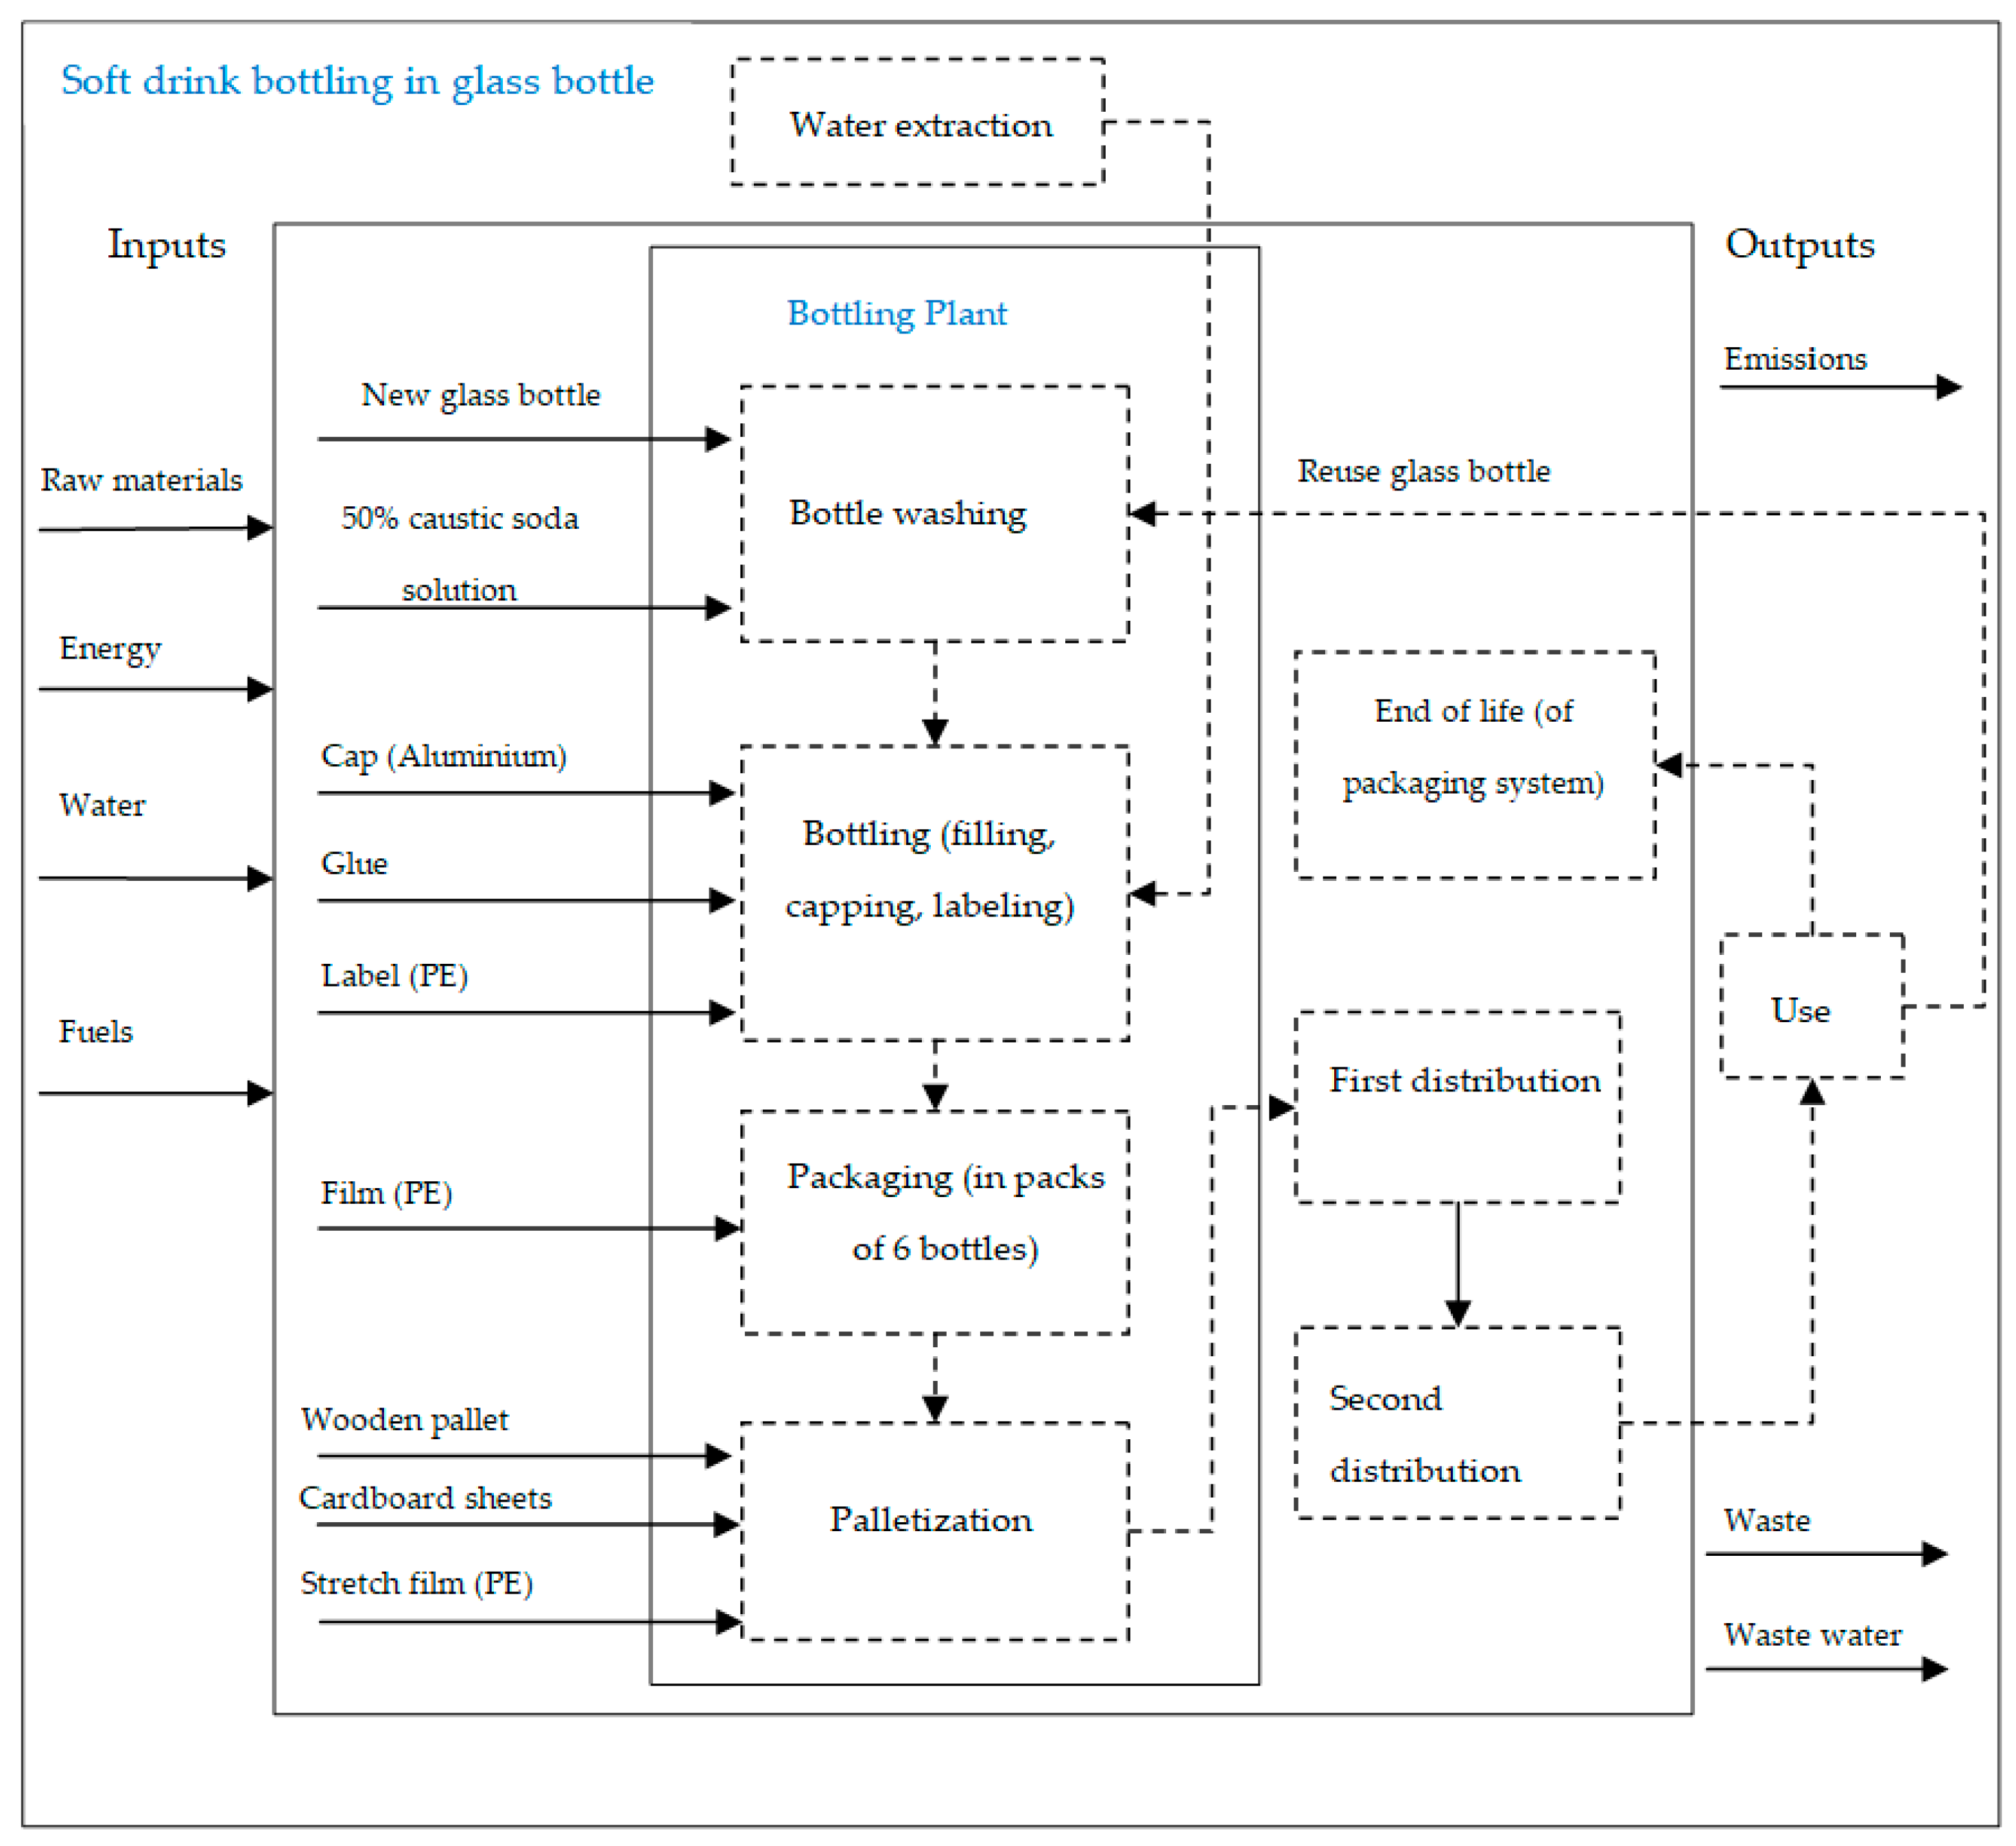

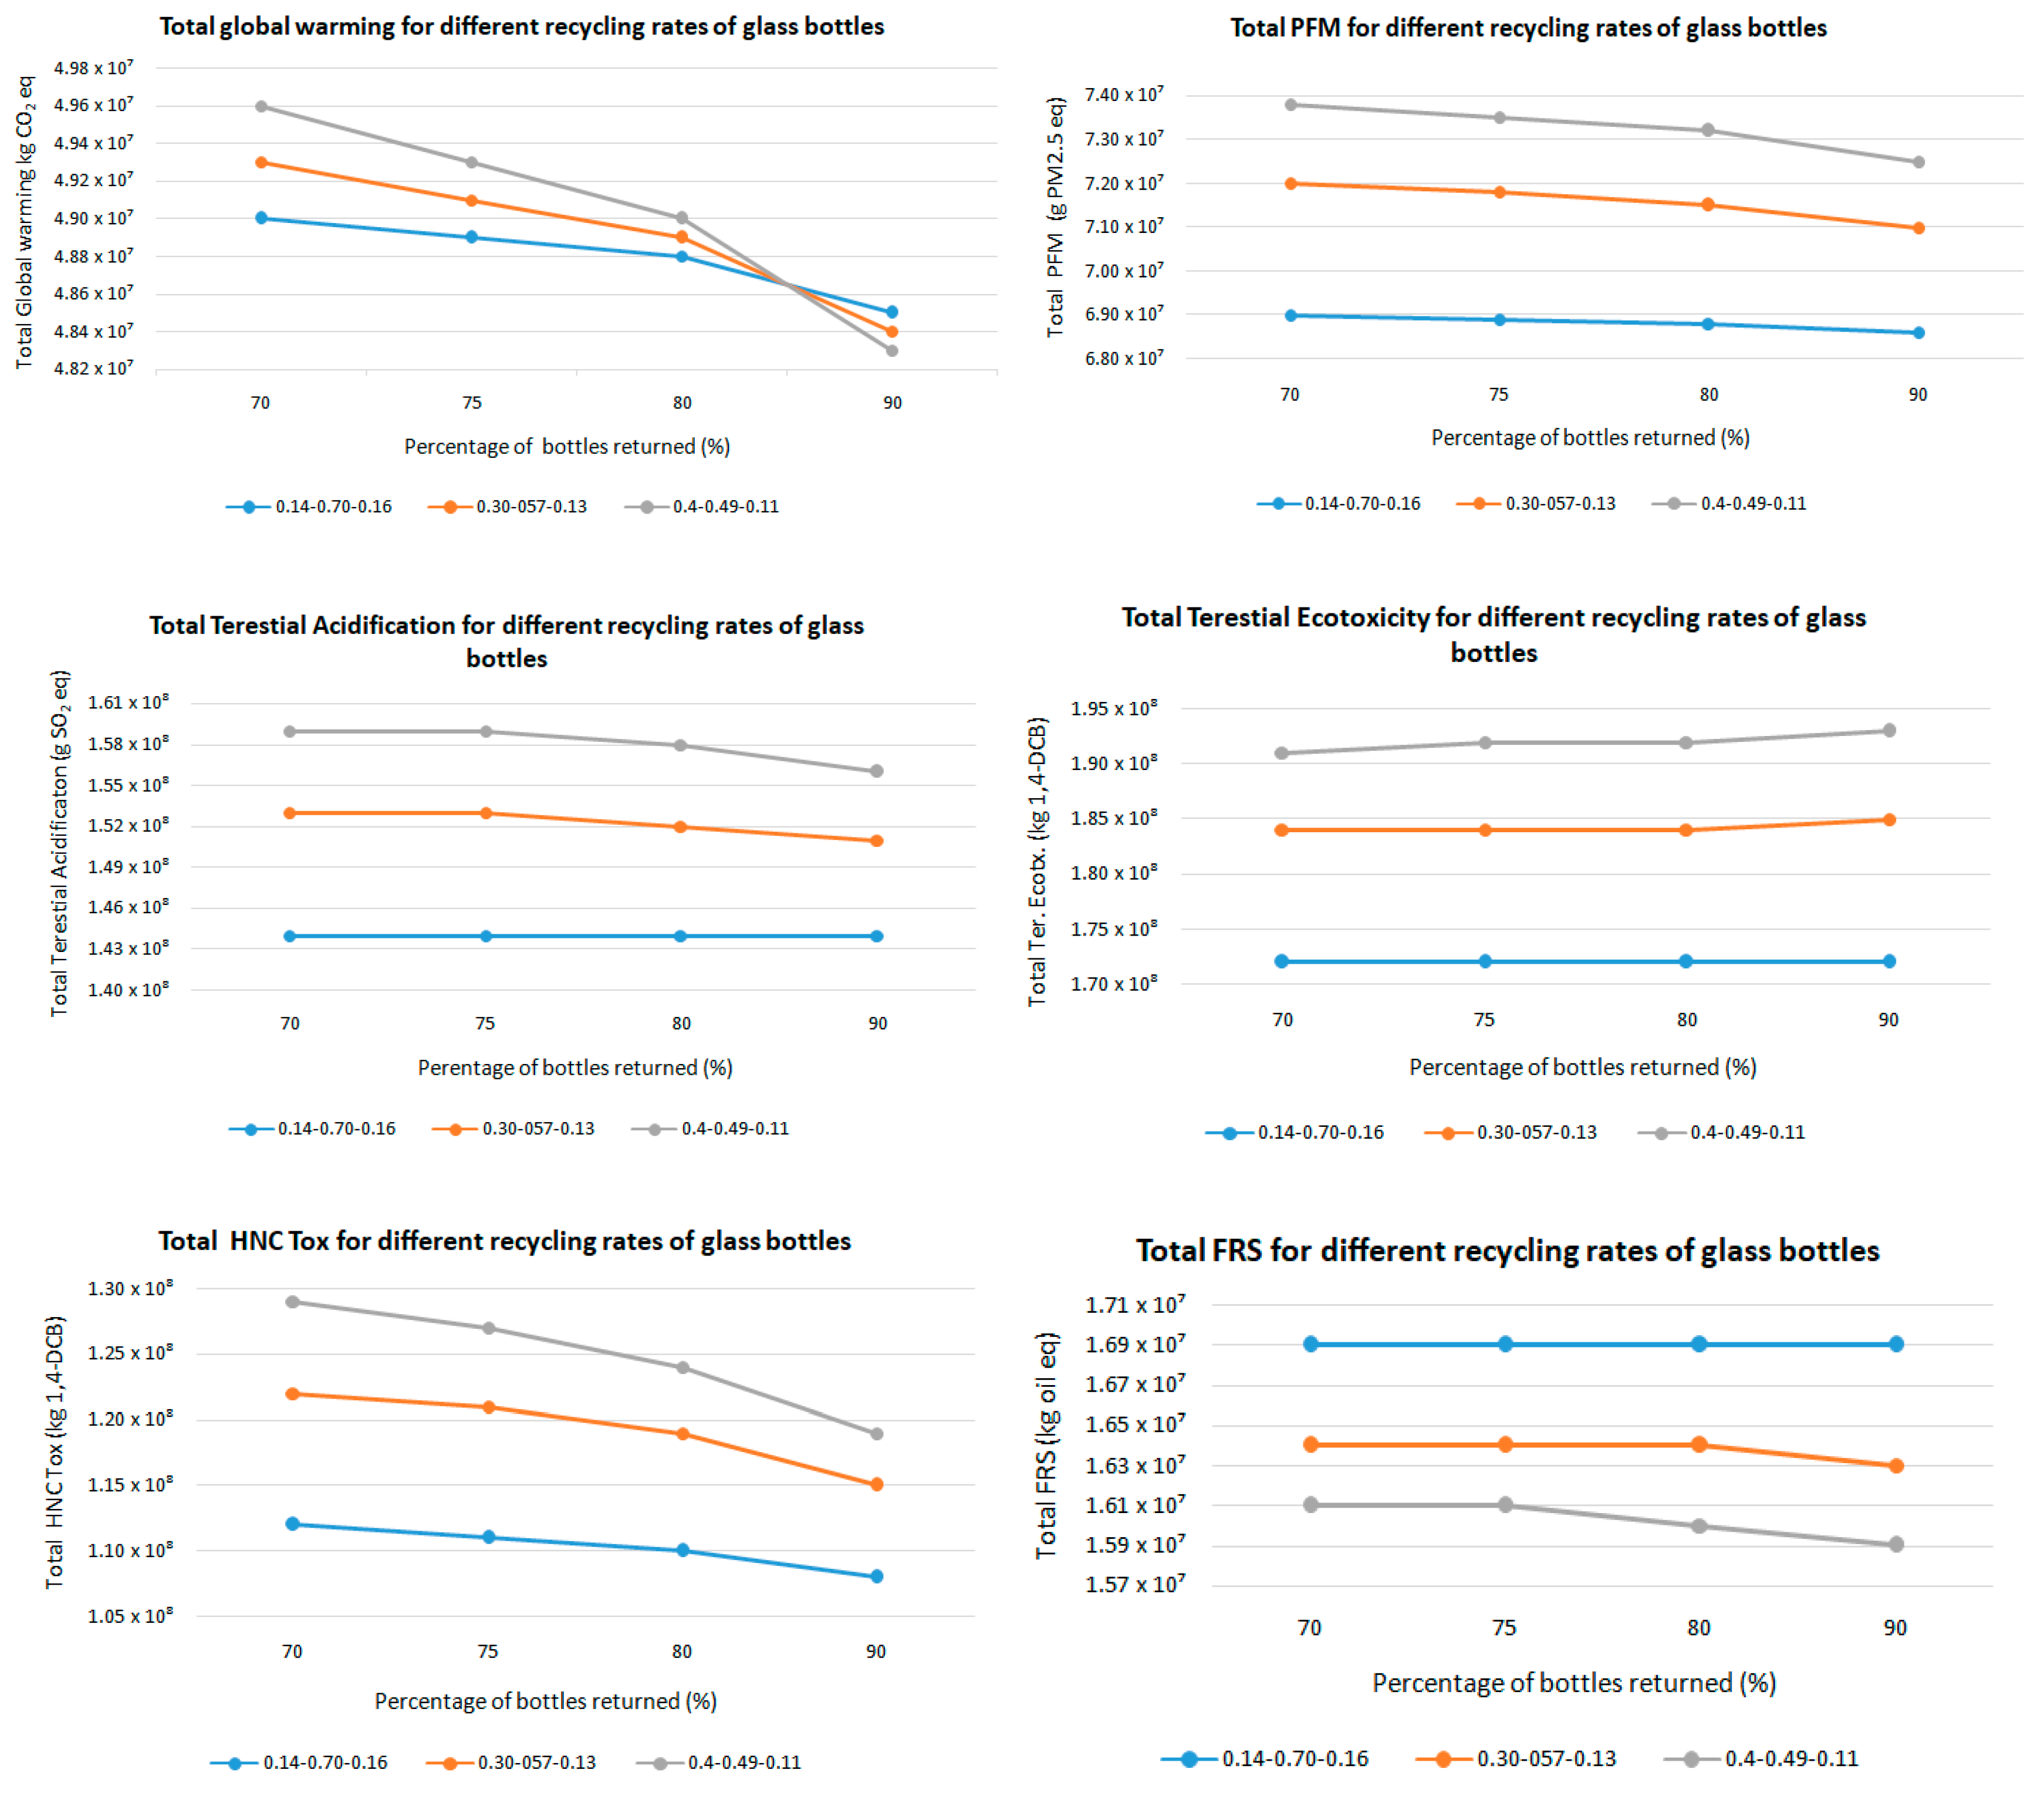
| Material | Type | Weight (g) |
|---|---|---|
| Silica sand | SiO2 | 144.45 |
| Soda ash | Na2CO3 | 31.36 |
| Calcium carbonate | CaCO3 | 10.19 |
| Potassium oxide | K2O | 0.98 |
| Magnesium oxide | MgCO3 | 7.06 |
| Aluminum oxide | Al2O3 | 1.96 |
| Total | 196.00 |
| Category | Quantity | Unit |
|---|---|---|
| Input | ||
| Electricity | 8.60 | Wh |
| Water | 0.30 | L |
| Detergent (50% caustic soda solution at 90 °C) | 8.60 | mL |
| Output | ||
| Effluent | 0.30 | L |
| Steps | Packaging Component | Weight (g) |
|---|---|---|
| 1st Packaging | Glass bottle | 196.00 |
| Aluminum cap | 1.59 | |
| PE label | 0.54 | |
| Glue | 2.00 | |
| 2nd Packaging | Film PE | 1.83 |
| 3rd Packaging | PE stretch film | 0.17 |
| Cardboard sheet | 1.63 | |
| Wood pallet | 11.32 | |
| Total | 215.1 |
| Steps | Packaging Component | PET Bottle for Carbonated Soft Drinks | PET Bottle for Non-Carbonated Soft Drinks |
|---|---|---|---|
| Weight (g) | Weight (g) | ||
| 1st Packaging | PET bottle | 23.30 | 18.90 |
| Cap HDPE | 2.35 | 2.05 | |
| PE label | 0.55 | 0.55 | |
| Glue | 2.00 | 2.00 | |
| 2nd Packaging | Film PE | 1.92 | 1.92 |
| 3rd Packaging | PE stretch film | 0.17 | 0.17 |
| Cardboard sheet | 1.63 | 1.63 | |
| Wood pallet | 11.32 | 11.32 | |
| Total | 43.20 | 38.50 |
| Packaging System | First Part of Distribution 1 | Second Part of Distribution 2 | Return of Used Bottles |
|---|---|---|---|
| kgkm | kgkm | kgkm | |
| Glass bottle | 81.8 | 19.1 | 39.8 |
| PET bottle for carbonated soft drinks | 56.0 | 13.1 | |
| PET bottle for non-carbonated soft drinks | 55.3 | 12.9 |
| Midpoint Category | Unit | Glass Bottle | PET Bottle for Carbonated Soft Drinks | PET Bottle for Non-Carbonated Soft Drinks |
|---|---|---|---|---|
| Global warming | g CO2 eq | 241.5 | 218.50 | 191.50 |
| Fine particulate matter formation | mg PM2.5 eq | 387.10 | 294.00 | 259.80 |
| Terrestrial acidification | mg SO2 eq | 872.30 | 605.50 | 536.50 |
| Terrestrial ecotoxicity | g 1.4-DCB | 1055.40 | 710.40 | 638.10 |
| Human non-carcinogenic toxicity | g 1.4-DCB | 878.50 | 461.90 | 403.40 |
| Fossil resource scarcity | g oil eq | 64.30 | 78.22 | 68.30 |
| Endpoint Category | Unit | Glass Bottle | PET Bottle for Carbonated Soft Drinks | PET Bottle for Non-Carbonated Soft Drinks |
|---|---|---|---|---|
| Human health | DALY | 7.25 × 10⁻⁷ | 5.53 × 10⁻⁷ | 4.87 × 10⁻⁷ |
| Ecosystems | species × yr | 1.28× 10⁻⁹ | 1.10 × 10⁻⁹ | 9.75 × 10⁻¹⁰ |
| Resources | USD2013 | 1.58× 10⁻² | 2.49 × 10⁻² | 2.15 × 10⁻² |
| Endpoint Category | Unit | Glass Bottle | PET Bottle for Carbonated Soft Drinks | PET Bottle for Non-Carbonated Soft Drinks |
|---|---|---|---|---|
| Human health | DALY | 6.08 × 10⁻⁷ | 5.53 × 10⁻⁷ | 4.87 × 10⁻⁷ |
| Ecosystems | species × yr | 1.09 × 10⁻⁹ | 1.10 × 10⁻⁹ | 9.75 × 10⁻¹⁰ |
| Resources | USD2013 | 1.50 × 10⁻² | 2.49 × 10⁻² | 2.15 × 10⁻² |
| Impact Category | Unit | Impact per Bottle Produced | |||||||||
|---|---|---|---|---|---|---|---|---|---|---|---|
| 0.14-0.7-0.16/ 4 Reuses/70% | 0.14-0.7-0.16/ 7 Reuses/70% | 0.14-0.7-0.16/ 7 Reuses/90% | 0.14-0.7-0.16/ 7 Reuses/70% rPET12% | 0.14-0.7-0.16/ 7 Reuses/70% rPET30% | |||||||
| Glass | PET | Glass | PET | Glass | PET | Glass | PET | Glass | PET | ||
| Global warming | kg CO2 eq | 458.23 | 414.56 | 434.70 | 414.67 | 407.32 | 414.67 | 432.93 | 399.01 | 433.33 | 331.02 |
| Fine particulate matter formation | kg PM2.5 eq | 747.56 | 566.60 | 722.56 | 566.60 | 695.12 | 566.60 | 719.51 | 546.78 | 720.00 | 455.50 |
| Terrestrial acidification | kg SO2 eq | 1687.20 | 1166.50 | 1635.37 | 1166.50 | 1576.22 | 1166.50 | 1628.66 | 1125.87 | 1629.70 | 937.66 |
| Terrestrial ecotoxicity | kg 1.4-DCB | 2007.93 | 1374.63 | 2014.63 | 1374.63 | 2042.07 | 1374.63 | 2006.71 | 1327.06 | 2006.67 | 1105.05 |
| Human non- carcinogenic toxicity | kg 1.4-DCB | 1601.22 | 875.61 | 1430.49 | 875.72 | 1217.68 | 875.72 | 1425.00 | 838.06 | 1427.88 | 666.50 |
| Fossil resource scarcity | kg oil eq | 124.15 | 148.46 | 120.30 | 148.46 | 116.22 | 148.46 | 119.82 | 142.12 | 119.88 | 112.88 |
| Impact Category | Unit | Production of PET Bottle Carbon | Bottle Plant Operation | Distribution | Disposal 12% Recycled | Disposal 20% Recycled | Disposal 30% Recycled |
|---|---|---|---|---|---|---|---|
| Global warming | kg CO2 eq | 311.04 | 71.54 | 35.38 | −11.68 | −48.60 | −94.87 |
| Fine particulate matter formation | kg PM2.5 eq | 0.48 | 0.11 | 0.03 | −0.07 | −0.12 | −0.18 |
| Terrestrial acidification | kg SO2 eq | 0.96 | 0.24 | 0.07 | −0.15 | −0.25 | −0.38 |
| Terrestrial ecotoxicity | kg 1.4-DCB | 865.08 | 152.22 | 482.11 | −178.46 | −299.38 | −449.06 |
| Human non-carcinogenic toxicity | kg 1.4-DCB | 318.82 | 82.04 | 28.58 | 429.62 | 351.86 | 254.66 |
| Fossil resource scarcity | kg oil eq | 122.28 | 31.49 | 11.08 | −19.40 | −32.66 | −49.18 |
| Impact Category | Unit | Production of PET Bottle Non-Carbon | Bottle Plant Operation | Distribution | Disposal 12% Recycled | Disposal 20% Recycled | Disposal 30% Recycled |
|---|---|---|---|---|---|---|---|
| Global warming | kg CO2 eq | 262.44 | 70.18 | 34.99 | −11.60 | −43.93 | −84.56 |
| Fine particulate matter formation | kg PM2.5 eq | 0.41 | 0.11 | 0.03 | −0.06 | −0.11 | −0.16 |
| Terrestrial acidification | kg SO2 eq | 0.82 | 0.24 | 0.06 | −0.13 | −0.22 | −0.33 |
| Terrestrial ecotoxicity | kg 1.4-DCB | 721.22 | 149.30 | 476.28 | −160.38 | −268.27 | −402.41 |
| Human non-carcinogenic toxicity | kg 1.4-DCB | 279.94 | 81.45 | 28.19 | 359.64 | 291.60 | 206.06 |
| Fossil resource scarcity | kg oil eq | 102.45 | 30.52 | 10.93 | −16.95 | −28.58 | −42.96 |
| Impact Category | Unit | Production of Glass | Bottle Plant Operation | Distribution (per km) | Disposal |
|---|---|---|---|---|---|
| Global warming | kg CO2 eq | 577.37 | 202.18 | 0.28 | −43.55 |
| Fine particulate matter formation | kg PM2.5 eq | 1152.79 | 394.63 | 0.23 | −466.56 |
| Terrestrial acidification | kg SO2 eq | 2546.64 | 861.19 | 0.52 | −1020.60 |
| Terrestrial ecotoxicity | kg 1.4-DCB | 1489.10 | 748.44 | 3.80 | −874.80 |
| Human non-carcinogenic toxicity | kg 1.4-DCB | 1146.96 | 495.72 | 0.23 | 2060.64 |
| Fossil resource scarcity | kg oil eq | 179.43 | 64.54 | 0.09 | −76.01 |
| Impact Category | Unit | Production of Glass | Bottle Plant Operation | Distribution per Km | Disposal |
|---|---|---|---|---|---|
| Global warming | kg CO2 eq | 0 | 246.89 | 0.28 | 23.52 |
| Fine particulate matter formation | kg PM2.5 eq | 0 | 542.38 | 0.23 | 1.28 |
| Terrestrial acidification | kg SO2 eq | 0 | 1246.10 | 0.52 | 3.17 |
| Terrestrial ecotoxicity | kg 1.4-DCB | 0 | 966.17 | 3.80 | 0.87 |
| Human non-carcinogenic toxicity (HNC) | kg 1.4-DCB | 0 | 559.87 | 0.23 | 295.49 |
| Fossil resource scarcity | kg oil eq | 0 | 77.95 | 0.09 | 0.22 |
| Month | Initial Demand | Increased Demand by 30% | Increased Demand by 30% in Summer |
|---|---|---|---|
| 1 | 0.01657 | 0.01159 | 0.01657 |
| 2 | 0.01583 | 0.01108 | 0.01583 |
| 3 | 0.00879 | 0.00615 | 0.00879 |
| 4 | 0.00781 | 0.00547 | 0.00781 |
| 5 | 0.00882 | 0.00617 | 0.00617 |
| 6 | 0.00694 | 0.00486 | 0.00486 |
| 7 | 0.00580 | 0.00406 | 0.00406 |
| 8 | 0.00702 | 0.00492 | 0.00492 |
| 9 | 0.00798 | 0.00559 | 0.00559 |
| 10 | 0.01171 | 0.00820 | 0.01171 |
| 11 | 0.01329 | 0.00930 | 0.01329 |
| 12 | 0.01245 | 0.00871 | 0.01245 |
Disclaimer/Publisher’s Note: The statements, opinions and data contained in all publications are solely those of the individual author(s) and contributor(s) and not of MDPI and/or the editor(s). MDPI and/or the editor(s) disclaim responsibility for any injury to people or property resulting from any ideas, methods, instructions or products referred to in the content. |
© 2024 by the authors. Licensee MDPI, Basel, Switzerland. This article is an open access article distributed under the terms and conditions of the Creative Commons Attribution (CC BY) license (https://creativecommons.org/licenses/by/4.0/).
Share and Cite
Adamides, E.D.; Syrigos, A.D. A Systems Firm-Centered Perspective on the Environmental Assessment of Recyclable PET and Glass Soft Drink Containers. Recycling 2024, 9, 78. https://doi.org/10.3390/recycling9050078
Adamides ED, Syrigos AD. A Systems Firm-Centered Perspective on the Environmental Assessment of Recyclable PET and Glass Soft Drink Containers. Recycling. 2024; 9(5):78. https://doi.org/10.3390/recycling9050078
Chicago/Turabian StyleAdamides, Emmanuel D., and Antonios D. Syrigos. 2024. "A Systems Firm-Centered Perspective on the Environmental Assessment of Recyclable PET and Glass Soft Drink Containers" Recycling 9, no. 5: 78. https://doi.org/10.3390/recycling9050078
APA StyleAdamides, E. D., & Syrigos, A. D. (2024). A Systems Firm-Centered Perspective on the Environmental Assessment of Recyclable PET and Glass Soft Drink Containers. Recycling, 9(5), 78. https://doi.org/10.3390/recycling9050078


