You are currently viewing a new version of our website. To view the old version click .
Recycling
  • Article
  • Open Access

27 November 2018

A Biowaste Treatment Technology Assessment in Malawi

,
,
and
1
Department of Environmental Health, University of Malawi—The Polytechnic, Chichiri, Blantyre 3, Malawi
2
Department of Sanitation, Water and Solid waste for Development (Sandec), Eawag: Swiss Federal Institute of Aquatic Science and Technology, 8600 Dübendorf, Switzerland
*
Author to whom correspondence should be addressed.
This article belongs to the Special Issue Waste Management Practices in Developing Countries

Abstract

In the city of Blantyre, much of the generated municipal waste is biowaste, typically mixed with other waste fractions and disposed at the city’s dumpsite. Energy and nutrients could be recovered; however, with many biowaste options available, choosing what technology to implement is difficult. Selecting Organic Waste Treatment Technology (SOWATT) is a tool that supports decision making for selecting a biowaste treatment option considering social, technical, and environmental aspects. SOWATT was used to evaluate options for Blantyre’s Limbe Market. Anaerobic digestion, black soldier fly processing, slow pyrolysis, in-vessel composting, windrow composting, vermicomposting, and wet-biomass-briquetting were considered as options. The performance of each alternative was assessed based on five objectives by government, NGO, and market-based stakeholders in order to determine the most acceptable option for the greatest number of people: something that is rarely done, or if it is the preferences are not rigorously quantified (e.g., stakeholder workshops) and/or weighted against specific objectives. However, given the novelty of the ranking-solicitation process, some participants struggled with the variety of options presented, and further iterations of SOWATT will address this limitation. Ultimately, vermicomposting scored highest of all alternatives and could best achieve the five objectives as prioritized by the stakeholders when implemented.

1. Introduction

Appropriate management of municipal solid waste is a crucial service to uphold public health and avoid environmental pollution. With increasing urban densification, the challenge and threat of unmanaged waste becomes more acute [1]. Biowaste, the biodegradable fraction in waste, is of particular importance as it amounts to more than 50% of the total waste generated [2]. Unmanaged, it may pose considerable health and environmental risks as it attracts insects, rodents, and other disease vectors; generates leachate-polluting groundwater [3]; and emits greenhouse gases.
Biowaste management challenges are also apparent in Blantyre, Malawi’s second largest city, located about 300 kilometres south of the capital, Lilongwe. As the capital of Malawi’s Southern Region, Blantyre is a major commercial hub with about 1 million inhabitants [4]. The Blantyre City Council (BCC) is responsible for waste collection (formal residential areas, markets, and some institutions), transport, and disposal. All the waste collected by BCC is transported to the Mzedi dumpsite, but it is not compacted there, and the dumpsite has already exceeded its design lifespan of 20 years. More than two thirds of Blantyre’s waste is organic; some materials like plastics, metals, and glass are picked up by scavengers for reselling, though the quantities are small [5].
Biowaste can be treated to recover valuable resources like energy and nutrients, thus presenting economic opportunities while reducing the negative environmental effects of open dumping and/or decomposition [6]. Biowaste management can also act as a driving force for overall waste management when, for instance, the economic value of biowaste-derived products incentivizes waste collection or new revenue opportunities enhance the financial sustainability of the waste management system [7].
Waste management-related decisions are, however, complex and must consider the many influencing factors and alternative solutions. Besides the tangible physical elements, waste management also comprises an array of “soft aspects”, also referred to as governance aspects including stakeholder preferences, financial mechanisms, policies, and institutional capabilities [8,9]. Many biowaste treatment initiatives have been unsuccessful, as such issues were not sufficiently considered [6,7]. To better evaluate the advantages and disadvantages of different biowaste treatment technologies with regard to set objectives, a decision support structure can significantly help take informed decisions. A review of decision support models by Karmperis et al. [10] shows that many decision support systems in waste management rely on Life Cycle Analysis (LCA) or Cost-Benefit Analysis [11] methods, while fewer use multi-criteria decision-making approaches. Güereca et al. [12] used LCA to evaluate two biowaste management systems; however, they limited their analysis to quantifying energy and water consumption emissions to the atmosphere, and water and space requirements. Importantly, most assessment methods are used exclusively by professionals working in evaluation or planning offices making use of existing data to generate optimized decisions, but the choices rarely, if ever, include the priorities or perspectives of more than a few decision makers, and rarely the beneficiaries or end users. As such, this study used the SOWATT tool that has previously been applied in the Philippines and Colombia [13,14] to solicit and amalgamate the preferences of a cross-section of stakeholders in the selection of an appropriate biowaste treatment technology. The methodology was designed specifically for biowaste treatment considering the technical, social, environmental, and economic aspects that influence long-term sustainability, especially in the sense that end-users and future maintenance workers are involved at each step of the decision-making process [13]. This study presents the outcomes of the assessment for biowaste treatment in Blantyre, Malawi, the first of its kind for an African context.

2. Materials and Methods

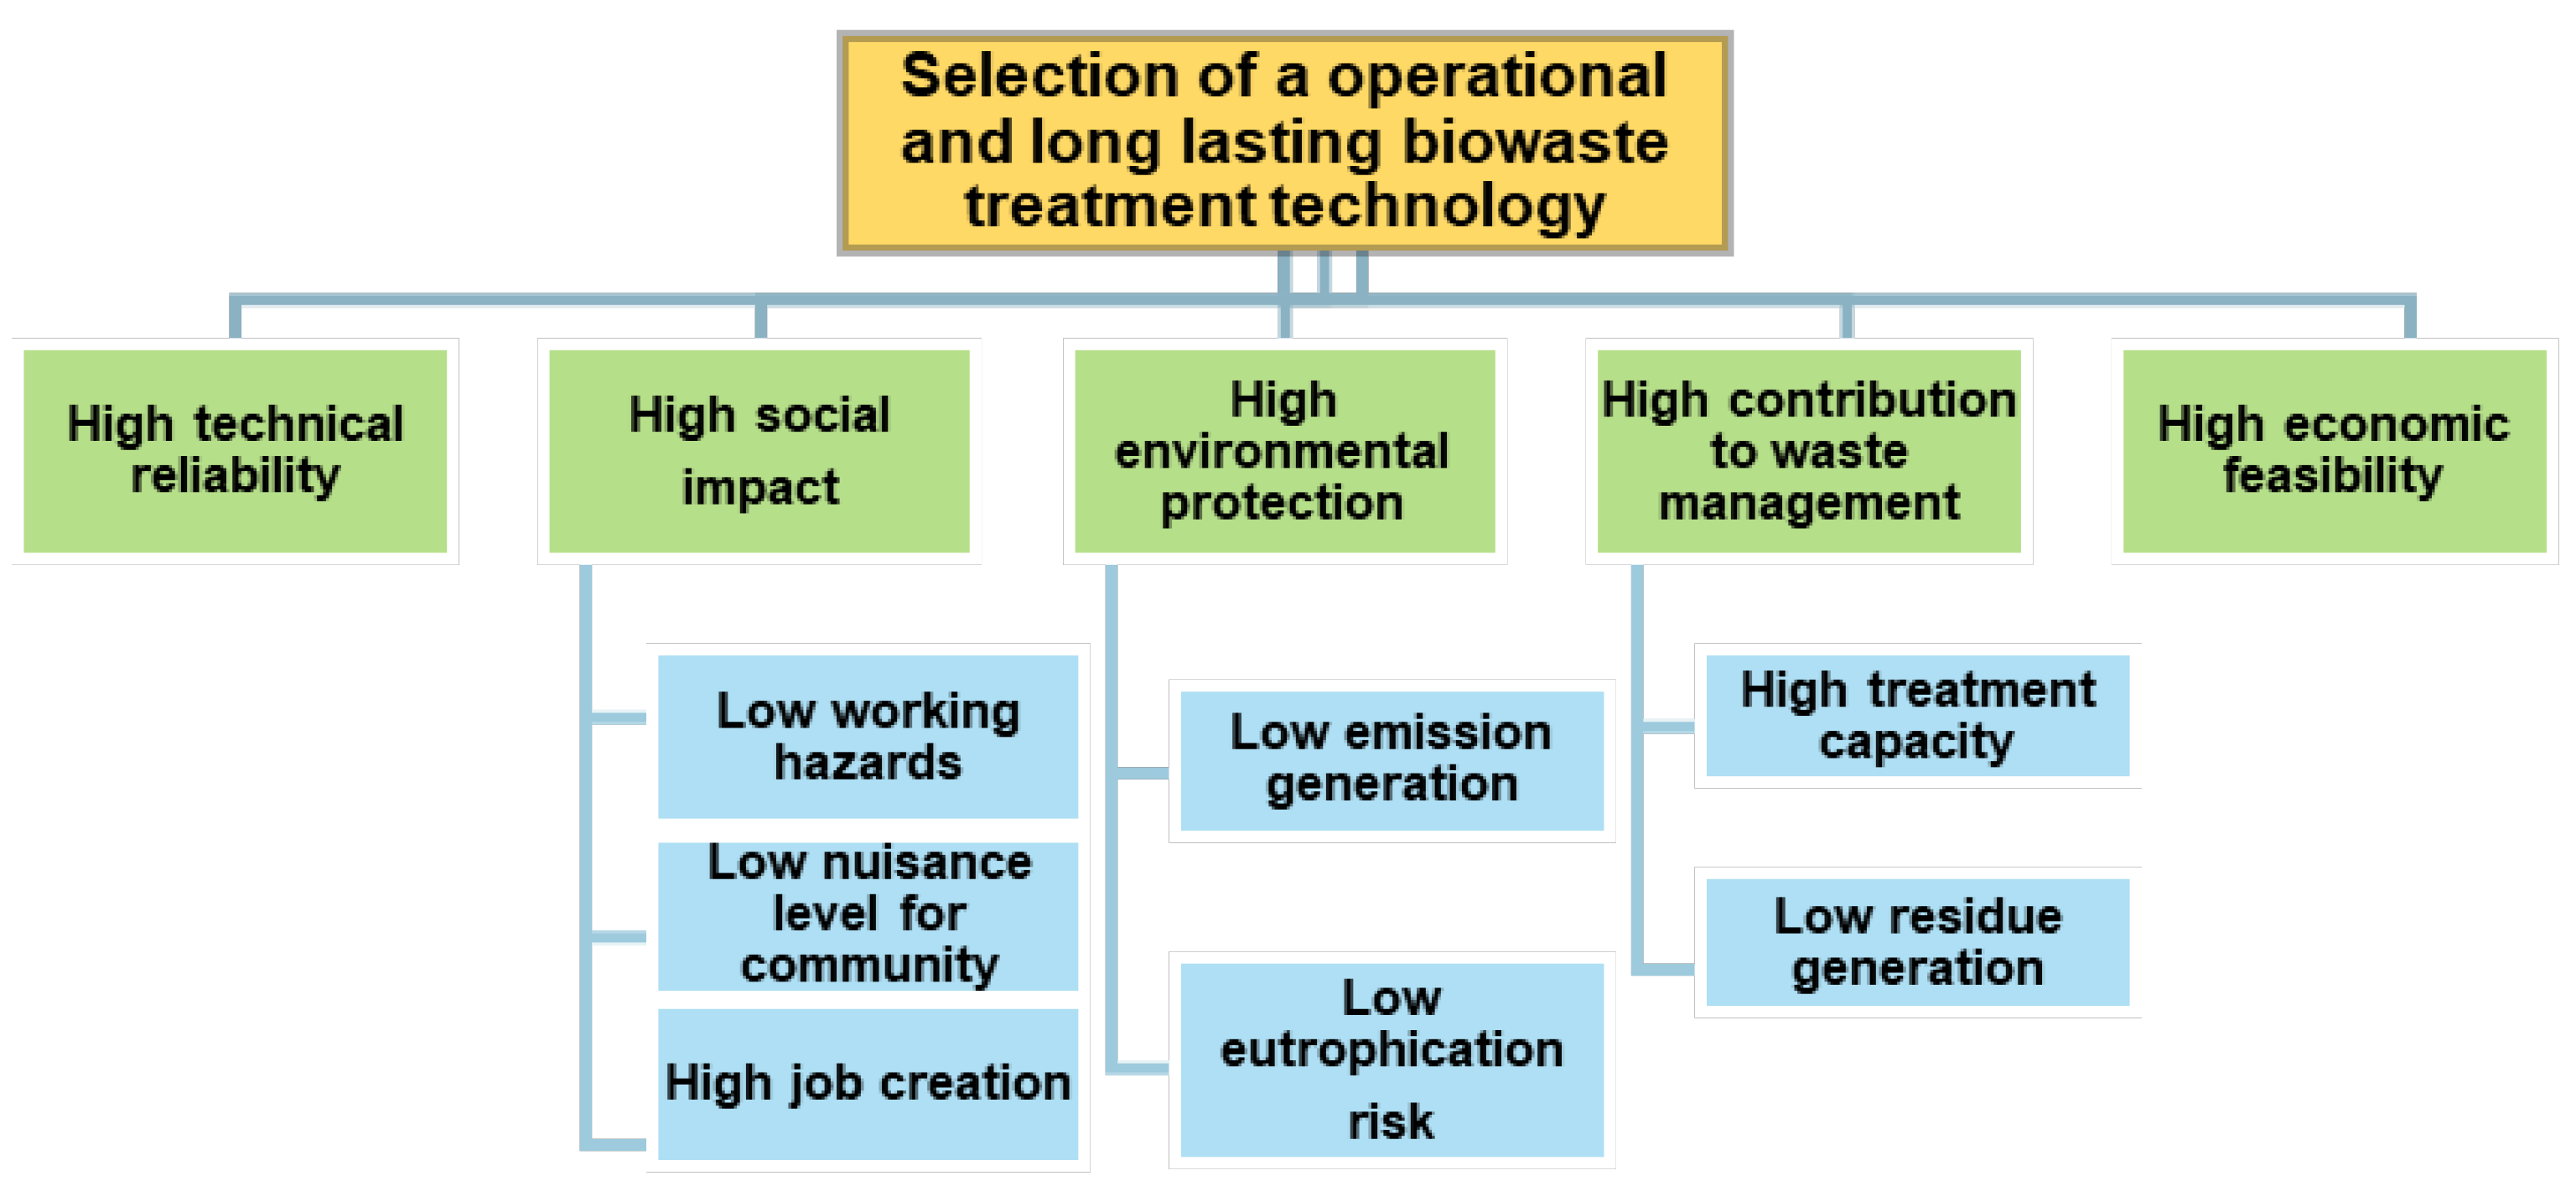
2.1. SOWATT Approach

The complexity of decisions often relies on uncertainty about the future, the fact of having a variety of conflicting objectives, the existence of too many or too few alternatives, or an overwhelming number of influencing factors [15]. Decision analysis, which maximizes the benefits that could be obtained from a decision, includes tools and methods that provide a structured process and recommends a course of action. Multi-Attribute Value Theory (MAVT) is a common multi-criteria decision analysis tool (MCDA) that has been often applied in environmental management choices [16,17,18,19]. This approach decomposes complex decision problems into several components: alternatives, uncertainties, consequences of alternatives, as well as the objectives and preferences of the decision maker.
The tool used in this study, called “Selecting Organic Waste Treatment Technology” (SOWATT), is based on the MAVT methodology and was designed to facilitate the selection of a sustainable biowaste treatment technology alternative [13,14]. SOWATT considers 5 different objectives that technologies should fulfil to ensure their long term sustainability: (1) ‘high technical reliability’, (2) ‘high social acceptance’, (3) ‘high environmental protection’, (4) ‘high hygiene and community health protection’, and (5) ‘high economic sustainability’. These objectives and their sub-objectives are shown in the objective-hierarchy (Figure 1). Following the SOWATT methodology, the preferences of relevant local stakeholders were assessed in order to determine the relative of importance of the objectives for the case study in Blantyre.
Figure 1. The default objective hierarchy defined by the SOWATT tool, adapted from [13].

2.2. Study Area

Limbe Market (LM), the largest market in Blantyre, was chosen as the focus area for the study due to the fact that biowaste was available in large, consistent quantities and was relatively pure (uncontaminated). We determined that approximately 1.1 tons of waste was generated by the market daily, of which 90% was biowaste. About 70% of the biowaste was wet fruit and vegetable waste such as banana peelings, tomatoes, leafy greens and onion leaves, while the rest was dry biowaste (15% vegetable waste and 15% paper and cardboard waste).

2.3. Biowaste Technology Options

Six technology alternatives provided by the SOWATT tool were considered in the Limbe Market study: windrow composting (WC), in-vessel composting (IC), vermicomposting (VC), anaerobic digestion (AD), slow pyrolysis (SP), and black soldier fly processing (BSF). A seventh technology, wet-biomass-briquetting (WBB), was also assessed in this case, as it is a common biowaste treatment technology in Blantyre. Of the seven technologies selected, five fall into the category of biological treatment processes, where a controlled conversion of waste is mainly driven by living organisms, either under aerobic [20,21] or anaerobic conditions [22], by bacteria and fungi or animals, i.e., worms in vermicomposting [23,24] or by insect larvae in Black Soldier Fly treatment [25]. The technology options were evaluated in terms of how they would perform if implemented at Limbe Market. The performance of the considered technologies was evaluated against 5 main objectives (Figure 1). These objectives were validated by the stakeholders during an objective validation exercise. The objectives and their attributes as provided by the SOWATT tool are presented in Table 1. The performance data (Table 2) were obtained from the SOWATT tool [13], which was established based on an extensive literature study [6,20,21,22,23,24,25], and through interviews with experts in Malawi.
Table 1. Definition and description of the evaluation objectives and their attributes (shaded objectives are main headings; unshaded objectives are sub-objectives).
Table 2. Estimated performance for the considered technology scenarios.
As there were no local experiences with IC, SP, or BSF, data related to sub-objective ‘high trust in technology’ were not available. Hence, two scenarios were included in the analysis for each of IC, SP, and BSF, one assuming no trust (NT) and the other high trust (HT) in the technology.

2.4. Stakeholders and Preferences

The SOWATT approach depends on stakeholder inputs (preferences) in order to calculate technology scores. Potential key stakeholder clusters were identified in this study as (1) BCC officials (because BCC owns LM), (2) LM chairpersons (since they are the governing authority in the market), (3) market vendors that generate biowaste, and (4) non-governmental organizations (NGOs) that support biowaste treatment initiatives in Blantyre. From these identified stakeholder clusters, individuals were interviewed to determine their relevance for the LM case. Interviewees were asked questions that aimed at understanding how the interviewee could influence biowaste treatment practices at LM. The interviewees also suggested other potential stakeholders (who they considered to have the same influence and explained why). The interviewees that indicated that they had influence on biowaste management practices at LM were chosen as relevant stakeholders. The stakeholders were further categorised into clusters based on how similar their level of influence was (Table 3).
Table 3. Four stakeholder clusters identified.
In order to elicit the preferences of the stakeholders, the “swing” weighting method was used [26]. In this method, hypothetical performance scenarios of a biowaste treatment technology implemented at LM were presented, and each respondent (stakeholder) was asked to rate every scenario presented between 0 (least preferable) and 100 (most preferable). Afterwards, the “reverse swing” method was used as a consistency check. The swing questionnaire (Appendix 1) first presented a hypothetical, worst-case scenario using the worst values for all attributes; subsequent hypothetical scenarios only had one best attribute. The reverse swing questionnaire (presented after the swing questionnaire) first presented a hypothetical best-case scenario using the best desired values for all attributes, then subsequent scenarios only had one worst attribute (Appendix 2). For example, for the attribute ‘levels of potential hazards’ (Table 2) (under objective high social acceptance and sub-objective high working safety), hazard level 2 was selected for the best-case scenarios (no technology had a hazard level of 1), while hazard level 10 was selected for the worst-case scenarios. The best- and worst-case scenarios used in the swing and reverse swing questionnaires are presented in Figure 2.
Figure 2. Best-case and worst-case scenarios of a hypothetical biowaste treatment technology at LM.
Each stakeholder’s rankings (extracted from the questionnaires) were converted into weights between 0 (low importance) and 1 (high importance) for every considered objective. The conversion to weights was achieved using the following equations:
Equation (1): Swing method equation:
  W x = t x i m t i  
Equation (2): Reverse swing method equation:
  W x = 100 t x i m ( 100 t i )  
in which
  • W x : weight of objective or sub-objective x;
  • t x : points given during the swing (in Equation (1)) or the reverse swing (in Equation (2)) method by the stakeholder to objective x; and
  • m: number of objectives to be considered: 5 main objectives, 4 sub-objectives for “social acceptance”, 2 sub-objectives for “hygiene and health protection” and 2 sub-objectives for “environmental protection”.
As a calculation example, in the swing questionnaire, the BCC Director of Health and Social Services rated ‘high technical reliability’ 80 points, ‘high social acceptance’ 50 points, ‘high hygiene and health protection’ 100 points, ‘high economic sustainability’ 40 points, and ‘high environmental protection’ 60 points. To calculate the Director’s weight of ‘high technical reliability’ using Equation (1), we divided the 80 points given to this objective by the sum of all the points given to the five main objectives as follows:
W h i g h   t e c h n i c a l   r e l i a b i l i t y = t x i m t i = 80 80 + 50 + 100 + 40 + 60 = 0.242
An average for the weights obtained from the swing method (Equation (1)) and reverse swing method (Equation (2)) was used as the stakeholder’s overall weight for the objective. The calculated values were averaged to take into account the framing of the questions; asking the same question in two different ways tests for and ensures understanding and consistency. An example of the weights obtained from a stakeholder’s ranking is presented in Table 4.
Table 4. BCC Director of Health and Social Services’ weights and ranking of objectives.
Notice that for this example, the weight given by the Director for Technical Reliability (first row) is the same regardless of how the question was asked (i.e., the swing and reverse swing methods both yielded 0.242). However, there were significant differences in the weights given to Treatment Capacity: the swing format yielded a weight of 0.556, while the reverse swing format yielded a weight of 0.833. It is not expected that each respondent will assign the exact same value to each objective through each method (which is why an average is taken), but significant, consistent differences can indicate a lack of understanding and help to identify respondents that may be struggling to conceptualize the questions. In each cluster, an average for the weights obtained from every stakeholder was used as the cluster’s weight (level of importance) for the respective objective (see results in Section 3.1, Figure 3).
Figure 3. Weights based on stakeholder preferences for the objectives.

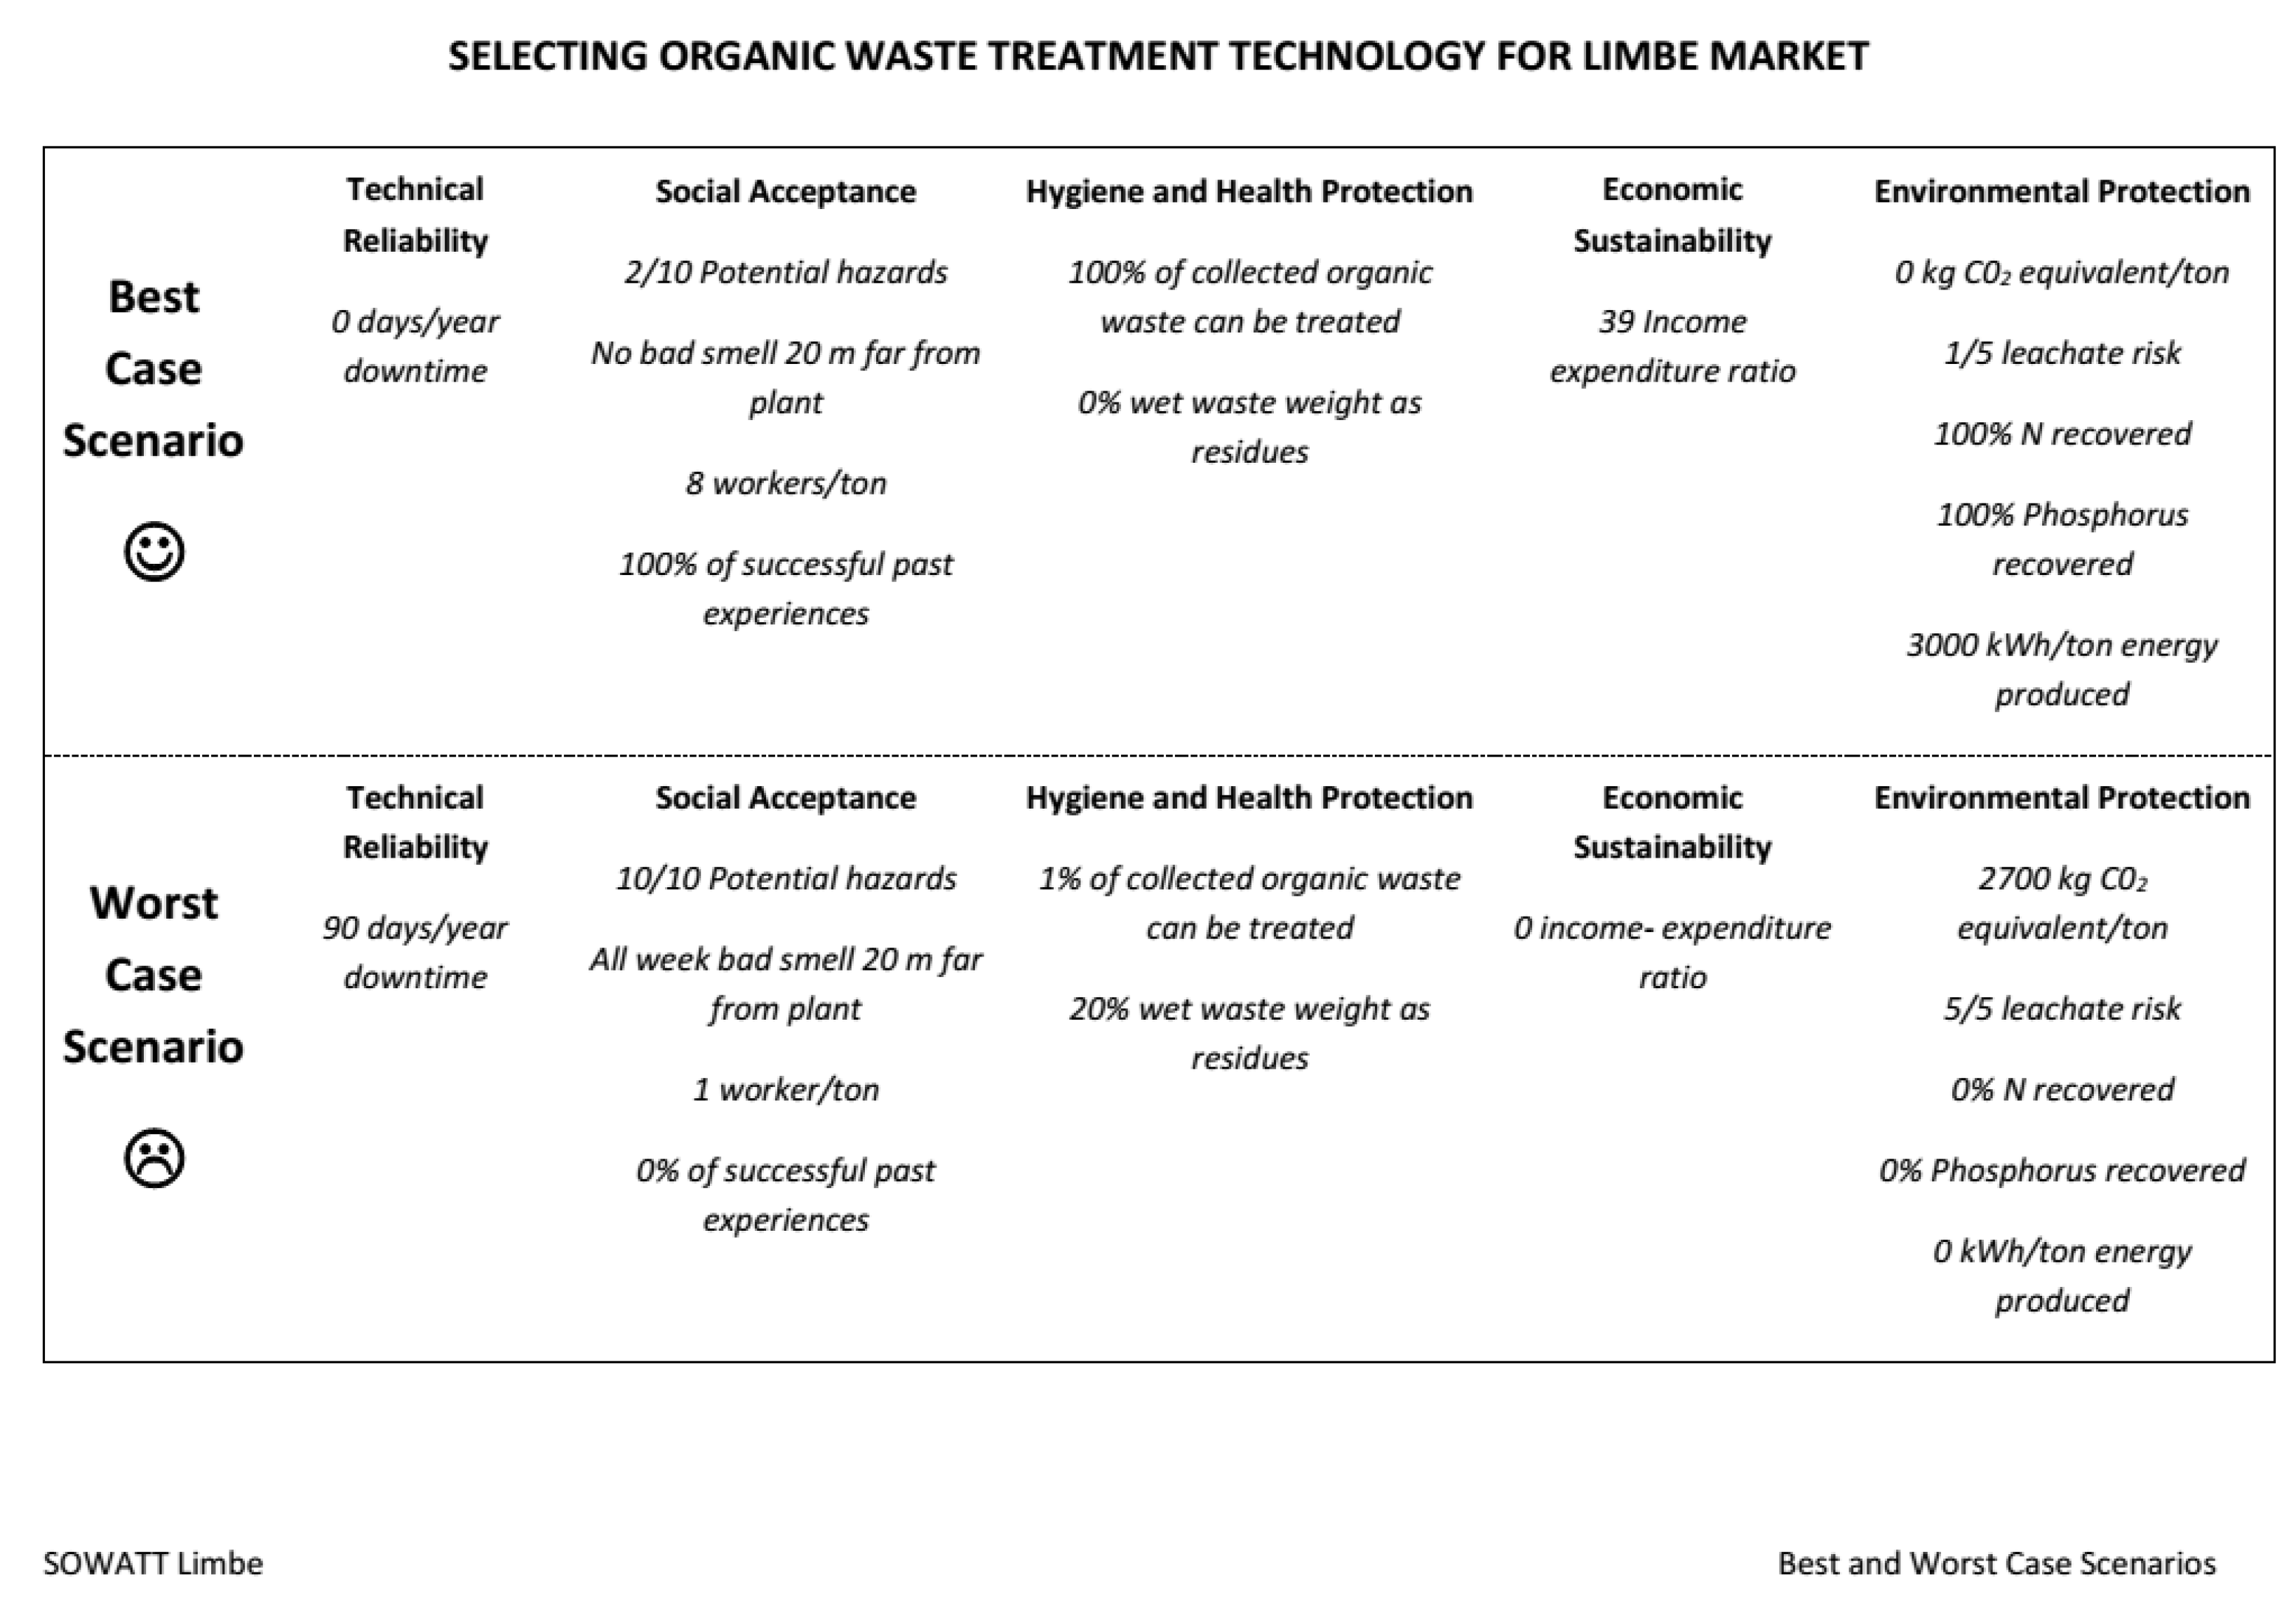
2.5. Technology Scoring

Scores for the technology options were calculated using the weights of the objectives (stakeholder preferences) and estimated performances for each of the technology alternatives (Table 2). The values for the estimated performances were firstly normalised to obtain values between 0 and 1 for all attributes. When normalizing the values for the estimated technology performances, we assigned the normalized value 1 to the best performance values, while the normalized value 0 was assigned to the worst performance values among the technology options for the considered objective. For the objectives with the direction ‘high’ such as ‘high economic sustainability’, the value 1 was assigned to the highest performance value of that objective among the technology options. Whereas for the objectives with the direction ‘low’ such as ‘low environmental pollution’, the value 1 was assigned to the smallest performance value of that technology among the technology options. For example, (Table 2) the value 1 was assigned for 100% for the sub-objective ‘high trust in technology’, and the value 1 was also assigned for the sub-objective ‘low leachate risk’. Where performance was estimated as a range of values, the average value was used during performance normalization. The following equations were used to normalize the estimated technology performances:
Equation (3) for “low direction” objectives:
  N x y = 1 C x y m x M x m x  
Equation (4) for “high direction” objectives:
  N x y = C x y m x M x m x  
in which
  • N x y : normalized value of the estimated performance of technology option Y for objective X;
  • C x y : the estimated performance of technology option Y for objective X;
  • m x : minimum value considered for objective X among all technology options; and
  • M x : maximum value considered for objective X among all technology options.
The additive model was then used to calculate the final score of each technology. Each normalized performance value of a technology was first multiplied by the weight given to its corresponding objective. Then, the outcome scores were summed to obtain the final score for that technology. The average values for the stakeholder weights for all clusters were used to calculate the final technology scores. The additive model determined the score of a technology alternative by the following equation:
Equation (5): Score of a technology alternative:
  v ( a ) = i m w r · N r
in which
  • v ( a ) : value (score) of the technology alternative A;
  • w r : weight of objective r;
  • N r : normalized value of the performance of technology alternative A for objective r; and
  • m : number of objectives.
For the objectives composed of sub-objectives, a different formula for the value of N r was used. The objectives of ‘high economic sustainability’ and ‘high technical reliability’ do not have any sub-objectives, and therefore the value of N r was obtained directly using Equation (4). However, for the other three objectives (‘high hygiene and health protection of community’, ‘high social acceptance’, and ‘high environmental protection’) the value of N r was calculated as follows:
Equation (6): normalized performance value for objectives with sub-objectives:
  N r = i m w x · n x
in which
  • N r : normalized value of the performance of alternative A for objective r;
  • w x : weight of sub-objective x;
  • nx: normalized value of the performance of alternative A for sub-objective x; and
  • m: number of sub-objectives.

3. Results

3.1. Stakeholder Preferences

The weights for the objectives determined by the BCC cluster were obtained as an average for the weights obtained from the four stakeholders in the cluster. For example, we determined the BCC Cluster’s weight for the objective ‘high technical reliability’ as 0.122, which is an average for the weights for the same objective as obtained from the Director of Health and Social Services (0.242), the Deputy Director (0.122), the Blantyre Cleansing Services Officer (0.095), and the Limbe Solid Waste Management Officer (0.027). The same approach was used to determine all stakeholder weights. The NGO’s cluster weights were determined as an average for the weights by the four NGO representatives. The Chair’s cluster weights were determined as an average for the weights by the three market chairs. The Vendors’ cluster weights were determined as an average of the weights from the 16 market vendors consulted.
BCC and the NGOs ranked ‘high environmental protection’ as their most important objective (Figure 3). Market vendors ranked ‘high hygiene and health protection’ as their main objective, which was not surprising considering that they are the ones affected when biowaste is poorly managed in the market. Chairpersons ranked ‘high economic sustainability’ as their main objective.

3.2. Technology Scores

The results of the normalised performance values multiplied by the weight of the respective objective and sum of all attribute scores for a specific technology option for the final score for that technology (Equation (5)) are shown in Figure 4. As a calculation example, for Vermicomposting (VC), the average weight (among all stakeholder clusters) for the objective ‘high economic sustainability’ (0.179) was multiplied by the normalised performance value for ‘high economic sustainability’ (0.981) to produce a ‘high economic sustainability’ score of 0.176 (0.179 × 0.981 = 0.176). The same approach produced scores for VC’s ‘high technical reliability’ (0.147), ‘high social acceptance’ (0.130), ‘high hygiene and community health protection’ (0.104), and ‘high environmental protection’ (0.111). These objective scores added up (0.176 + 0.147 + 0.130 + 0.104 + 0.111 = 0.668) to obtain VC’s overall score of 0.668.
Figure 4. Ranking of the final biowaste technology scores.
VC scored the highest overall and was thus considered the most appropriate technology to implement for LM (Figure 3). In-vessel composting (IC) was ranked as the second most suitable option. Finally, BSF ranked as the least suitable technology option to implement at LM.

4. Conclusions

The SOWATT tool was successfully used for the case of Limbe market in the city of Blantyre, Malawi. The structured decision support process involved participation of different local stakeholder groups to consider seven technology alternatives for biowaste treatment: windrow composting, in-vessel composting, vermicomposting, anaerobic digestion, slow pyrolysis, black soldier fly processing, and wet-biomass-briquetting. Together with the stakeholders, the main and sub-objectives were defined, preferences for each were elicited, and technology performances were assessed. Scores for the technology alternatives were then calculated using weights and performance indicators. The results provide an evidence base for the planning and implementation of a full-scale biowaste treatment facility at LM. The results indicate (without limiting the choice) that the most appropriate technology in this context is vermicomposting. While conducting the study, certain limitations of the process became evident: the SOWATT tool requires detailed cost and performance estimations for each of the alternatives, which, for Blantyre, proved difficult, as there was limited local evidence. Estimations had to be obtained through literature from applications in similar geographic and socio-economic conditions. Although such estimations were possible, the respondents felt insecure about how well to trust this information, as there were no local implementation experiences, and therefore they could not accurately judge how such technologies might perform in Blantyre. Going through all the steps of the SOWATT procedure in a structured way proved to be quite demanding for many of the stakeholders involved, who have very seldom been confronted with such methods of evaluation. Some stakeholders, mainly vendors, found the preference elicitation method (swing and reverse swing) to be complicated. Given this experience, we therefore suggest that further studies are necessary to determine how to simplify the preference elicitation exercise for non-experts. In spite of the limitations, the Limbe Market study stimulated the stakeholders to think about different alternatives. Conducting the study also triggered their involvement and the debate on biowaste management and gave them the opportunity to reflect on the challenges and opportunities in biowaste management in Blantyre in a structured way. This assessment is also an opportunity for stakeholders to reflect on technological attributes that they might otherwise overlook when making decisions.

Supplementary Materials

The following are available online at http://www.mdpi.com/2313-4321/3/4/55/s1, Table S1: The Swing Questionnaire: points given to each scenario were used in the calculation of the stakeholder’s preference weight for the objective pointed by an arrow in the respective scenario; Table S2: The Reverse Swing Questionnaire: points given to each scenario were used in the calculation of the stakeholder’s preference weight for the objective pointed by an arrow in the respective scenario.

Author Contributions

The following bullets specify the individual contributions of each author: Conceptualization: I.Z. and C.Z., E.T.; Methodology: I.Z. and C.Z.; Validation: W.M., E.T. and I.Z.; Formal Analysis: W.M. and E.T.; Investigation: W.M. and E.T.; Resources: E.T. and C.Z.; Data Curation: W.M. and E.T.; Writing-Original Draft Preparation: W.M.; Writing-Review & Editing: W.M., E.T., I.Z. and C.Z.; Visualization: W.M.; Supervision: E.T. and I.Z.; Project Administration: E.T. and C.Z.; Funding Acquisition: E.T. and C.Z.

Funding

This research was funded by the Swiss Agency for Development and Cooperation (grant no. 7F-04463.03.01) and Eawag: Swiss Federal Institute of Aquatic Science and Technology.

Acknowledgments

The study was accomplished through funding from Sandec/Eawag. Special thanks to the WASHTED Centre at University of Malawi’s Polytechnic for providing intellectual support and a workstation during the study. Utmost gratitude to the BCC officials, NGO representatives (CCODE, Crown, Water for People, and Pump Aid), and market chairpersons and vendors for dedicating their time by willingly participating in the study. Special recognition and thanks to the experts from Eawag, University of Malawi, Crown Financial Ministries, Malawi Industrial Research and Technology Development Centre, Green Malata, Saunders’ Estate, Sustainable Development Solutions Organisation, and other individuals for their input in the technology performance estimation phase.

Conflicts of Interest

The authors declare no conflict of interest.

References

  1. Guerrero, L.A.; Maas, G.; Hogland, W. Solid waste management challenges for cities in developing countries. Waste Manag. 2013, 33, 220–232. [Google Scholar] [CrossRef] [PubMed]
  2. Wilson, D.C.; Rodic, L.; Scheinberg, A.; Velis, C.A.; Alabaster, G. Comparative analysis of solid waste management in 20 cities. Waste Manag. Res. 2012, 30, 237–254. [Google Scholar] [CrossRef] [PubMed]
  3. Reddy, P.S.; Nandini, N. Leachate characterization and assessment of groundwater pollution near municipal solid waste landfill site. Nat. Environ. Pollut. Technol. 2011, 10, 415–418. [Google Scholar]
  4. National Statistical Office. Malawi in Figures 2016; Government Press: Zomba, Malawi, 2016; p. 2.
  5. Kasinja, C.; Tilley, E. Formalization of Informal Waste Pickers’ Cooperatives in Blantyre, Malawi: A Feasibility Assessment. Sustainability 2018, 10, 1149. [Google Scholar] [CrossRef]
  6. Lohri, C.R.; Diener, S.; Zabaleta, I.; Mertenat, A.; Zurbrügg, C. Treatment technologies for urban solid biowaste to create value products: A review with focus on low- and middle-income settings. Rev. Environ. Sci. Biotechnol. 2017, 2017 16, 81–130. [Google Scholar] [CrossRef]
  7. Zurbrügg, C. Assessment methods for waste management decision-support in developing countries. Ph.D. Thesis, Università degli Studi di Brescia, Brescia, Italy, 2013. [Google Scholar]
  8. Van de Klundert, A.; Anschütz, J. Integrated Sustainable Waste Management–The Concept. Waste Consultants: Gouda, The Netherlands, 2001; ISBN 9076639027. [Google Scholar]
  9. Wilson, D.C.; Rodic, L.; Cowing, M.J.; Velis, C.A.; Whiteman, A.D.; Scheinberg, A.; Vilches, R.; Masterson, D.; Stretz, J.; Oelz, B. ‘Wasteaware’ benchmark indicators for integrated sustainable waste management in cities. Waste Manag. 2015, 35, 329–342. [Google Scholar] [CrossRef] [PubMed]
  10. Karmperis, A.C.; Aravossis, K.; Tatsiopoulos, I.P.; Sotirchos, A. Decision support models for solid waste management: Review and game-theoretic approaches. Waste Manag. 2013, 2013. 33, 1290–1301. [Google Scholar] [CrossRef]
  11. Fiorucci, P.; Minciardi, R.; Robba, M.; Sacile, R. Solid waste management in urban areas: Development and application of a decision support system. Resour. Conserv. Recycl. 2003, 37, 301–328. [Google Scholar] [CrossRef]
  12. Güereca, L.P.; Gassó, S.; Baldasano, J.M.; Jiménez-Guerrero, P. Life cycle assessment of two biowaste management systems for Barcelona, Spain. Resour. Conserv. Recycl. 2006, 49, 32–48. [Google Scholar] [CrossRef]
  13. Zabaleta, I.; Scholten, L.; Zurbrügg, C. Selecting Appropriate Organic Waste Treatment Options in the Philippines. Sandec News 2015, 16, 4–5. [Google Scholar]
  14. Mertenat, A.; Zabaleta, I.; Zurbrügg, C. Appropriate Biowaste Treatment Technology for Aquitania, Colombia. Sandec News 2016, 17, 6–7. [Google Scholar]
  15. Eisenführ, F.; Weber, M.; Langer, T. Rational Decision Making; Springer: Berlin, Germany, 2010. [Google Scholar]
  16. Gregory, R.; Failing, L.; Harstone, M.; Long, G.; McDaniels, T.; Ohlson, D. Structured Decision Making. A Practical Guide to Environmental Management Choices. Wiley-Blackwell: Hoboken, NJ, USA, 2012; ISBN 978-1-4443-3341-1. [Google Scholar]
  17. Reichert, P.; Langhans, S.D.; Lienert, J.; Schuwirth, N. The conceptual foundation of environmental decision support. J. Environ. Manage. 2015, 154, 316–332. [Google Scholar] [CrossRef] [PubMed]
  18. Schuwirth, N.; Reichert, P.; Lienert, J. Methodological aspects of multi-criteria decision analysis for policy support: A case study on pharmaceutical removal from hospital wastewater. Eur. J. Oper. Res. 2012, 220, 472–483. [Google Scholar] [CrossRef]
  19. Scholten, L.; Scheidegger, A.; Reichert, P.; Mauer, M.; Lienert, J. Strategic rehabilitation planning of piped water networks using multi-criteria decision analysis. Water Res. 2014, 49, 124–143. [Google Scholar] [CrossRef] [PubMed]
  20. Cooperband, L. The Art and Science of Composting – A Resource for Farmers and Compost Producers. University of Wisconsin-Madison, Center for Integrated Agricultural Systems: Madison, WI, USA, 2002. [Google Scholar]
  21. Rothenberger, S.; Zurbrügg, C.; Enayetullah, I.; Sinha, A. Decentralized Composting for Cities of Low- And Middle-Income Countries—A User’s Manua; l. Swiss Federal Institute of Aquatic Science and Technology (Eawag), Dübendorf, Switzerland and Waste Concern: Dhaka, Bangladesh, 2006. [Google Scholar]
  22. Vögeli, Y.; Lohri, C.; Gallardo, A.; Diener, S.; Zurbrügg, C. Anaerobic Digestion of Biowaste in Developing Countries—Practical Information and Case Studies; Swiss Federal Institute of Aquatic Science and Technology (Eawag): Dübendorf, Switzerland, 2014. [Google Scholar]
  23. Munroe, G. Manual of On-Farm Vermicomposting and Vermiculture; Organic Agriculture Centre of Canada: Nova Scotia, Canada, 2007. [Google Scholar]
  24. Ali, U.; Sajid, N.; Khalid, A.; Riaz, L.; Rabbani, M.M.; Syed, J.H.; Malik, R.N. A review on vermicomposting of organic wastes. Environ Prog Sustain Energy 2015, 34, 1050–1062. [Google Scholar] [CrossRef]
  25. Dortmans, B.M.A.; Diener, S.; Verstappen, B.M.; Zurbrügg, C. Black Soldier Fly Biowaste Processing—A Step-by-Step Guide; Eawag-Swiss Federal Institute of Aquatic Science and Technology. Department of Sanitation, Water and Solid Waste for Development (Sandec): Dübendorf, Switzerland, 2017. [Google Scholar]
  26. Zheng, J.; Lienert, J. Stakeholder interviews with two MAVT preference elicitation philosophies in a Swiss water infrastructure decision: Aggregation using SWING-weighting and disaggregation using UTAGMS. Eur. J. Oper. Res. 2018, 267, 273–287. [Google Scholar] [CrossRef]

Article Metrics

Citations

Article Access Statistics

Multiple requests from the same IP address are counted as one view.