
Article

Mechanical Performance and Environmental Assessment of Hybrid Reinforced Gypsum Composites Incorporating Commercial and Recycled Fibers
by
Leonardo Lima
1,2,*,
Alicia Zaragoza-Benzal
3,
Daniel Ferrández
3,
Alberto Leal Matilla
3 and
Paulo Santos
1
1
University of Coimbra, ARISE, ISISE, Department of Civil Engineering, 3030-788 Coimbra, Portugal
2
Prefecture of University Campus, Federal University of Amazonas, Manaus 69067-005, Brazil
3
Departamento de Tecnología de la Edificación, Universidad Politécnica de Madrid, 28040 Madrid, Spain
*
Author to whom correspondence should be addressed.
Recycling 2026, 11(9), 159; https://doi.org/10.3390/recycling11090159
Submission received: 20 July 2026 / Revised: 17 August 2026 / Accepted: 20 August 2026 / Published: 1 September 2026

Abstract

The use of hybrid fiber reinforcement has been investigated to enhance the performance of gypsum-based materials, taking advantage of several types of fibers. This study develops hybrid fiber-reinforced gypsum composites (HFRGCs) incorporating sixteen combinations of recycled mineral wool (RMW) and polypropylene (PP) fibers, with contents ranging from 0.25 to 1.00 wt.%. The samples are mechanically characterized, and statistical analyses of the measured values are conducted. Moreover, a life cycle assessment (LCA) is also performed regarding their environmental impacts. The HFRGC containing 0.50 wt.% RMW fibers and 1.00 wt.% PP fibers exhibited the highest surface hardness, with a 5.5% increase compared with the reference. The highest flexural and compressive strengths were achieved by HFRGCs containing 0.50 wt.% PP fibers, reaching increases of 7.5% and 9.0%, respectively, with only a minor influence of RMW fibers, whose greatest contribution was reducing environmental impacts due to the low energy demand for recycling this industrial waste compared with the high emissions from PP fiber production. A statistical analysis revealed no significant differences in the mechanical properties of HFRGCs containing 0.50 and 1.00 wt.% PP fibers, suggesting that increasing the PP fiber content beyond 0.50 wt.% did not result in significant mechanical improvements. Therefore, considering both mechanical and environmental aspects, the HFRGC incorporating 1.00 wt.% RMW fiber and 0.50 wt.% PP fibers provided the most balanced overall performance.

1. Introduction

Recent advances in gypsum-based materials have focused on improving their performance through the incorporation of additives, aiming to meet the increasing demands for sustainability and multifunctionality in modern construction. Among these developments, the incorporation of fibers into gypsum matrices has emerged as a promising strategy [1]. Fiber reinforcement has enabled the expansion of applications for prefabricated gypsum panels, currently used in residential, commercial, and industrial buildings as walls and ceilings, offering an efficient and versatile solution for lightweight steel frame systems [2].
Various types of fibers have been used in gypsum composites (GCs), such as natural, synthetic, and recycled ones. Among synthetics, PP fibers are widely used due to their ability to enhance mechanical and hygrothermal resistances. Previous studies reported improvements in flexural strength and significant density reduction with the incorporation of PP fibers into GCs [3,4].
In order to improve sustainability and promote the circular economy, international initiatives such as the 2030 Agenda for Sustainable Development have encouraged the use of recycled fibers in new products [5]. In this context, the present study is primarily aligned with Sustainable Development Goal (SDG) 12—Responsible Consumption and Production, particularly through the valorization of waste materials and more efficient use of resources. It also contributes to SDG 9—Industry, Innovation and Infrastructure, by developing innovative HFRGCs for LSF construction systems; SDG 11—Sustainable Cities and Communities, by promoting more resource-efficient building solutions; and SDG 13—Climate Action, through the potential reduction in environmental impacts associated with construction materials.
Recycled fibers may originate from waste generated by society or from industrial production processes, thereby becoming a secondary raw material that contributes to reducing natural resource consumption and environmental pollution [6]. Park et al. [7] investigated the pull-out resistance of recycled fibers and confirmed their good adhesion to cement mortar, supporting their use as reinforcement. However, their effects on composite properties may vary depending on fiber material and geometry, as well as surface characteristics and, consequently, fiber–matrix bonding. Pedreño-Rojas et al. [8] reported improved mechanical performance in gypsum composites reinforced with recycled synthetic fibers, whereas del Rio Merino et al. [9] observed reductions in both flexural and compressive strength.
Moreover, one technology that has shown potential to improve the properties of GCs is hybrid fiber reinforcement, which promotes synergistic effects between fibers with complementary characteristics. Despite these potential advantages, studies addressing hybrid fiber reinforcement in GCs remain limited. The physical characteristics of the fibers and the fiber-to-gypsum ratios from some previous studies are shown in Table 1.
According to the studies in Table 1, the incorporation of hybrid fibers and industrial residues into GCs promoted significant improvements in mechanical, physical, and durability-related properties, along with reduced moisture absorption and excellent thermal resistance. Lv et al. [11] reported a 70% increase in flexural strength by combining 0.75 wt.% PVA and basalt fibers. Moreover, reducing the PVA fiber content to 0.50 wt.% resulted in a water absorption of only 11%. Similarly, Balti et al. [12] reported a 50% reduction in thermal conductivity by incorporating 0.50 wt.% recycled PS and paper fibers. Furthermore, the results also demonstrated that the combined use of the investigated wastes provided a balanced optimization of GC performance, including the sustainability-related aspects, supported by good interaction between the recycled fibers and the gypsum matrix.
Current investigations are increasingly focused on identifying optimal fiber-to-fiber ratios to achieve an effective balance between the properties of hybrid fiber-reinforced GCs (HFRGCs). However, few studies have investigated combinations of recycled fibers, and the literature is even more limited regarding hybrid reinforcement with recycled mineral wool (RMW) and polymeric fibers, which motivated the present study. PP fibers were selected for their favorable mechanical properties, whereas RMW fibers were primarily selected for their sustainable benefits, particularly their potential to contribute to the circular economy by recycling industrial waste and reduce environmental impacts. In addition, RMW fibers exhibit good dispersion and interfacial adhesion within the gypsum matrix [14]. Accordingly, this study aims to evaluate the influence of hybrid (RMW and PP) fibers on the mechanical and environmental performance of HFRGCs through experimental testing, statistical analysis, and life cycle assessment (LCA).

2. Results and Discussion

The results presented in Section 2.1 and Section 2.2 represent the average values of three samples (of each hybrid combination) obtained for the bulk density, surface hardness, flexural strength, and compression strength tests.

2.1. Bulk Density

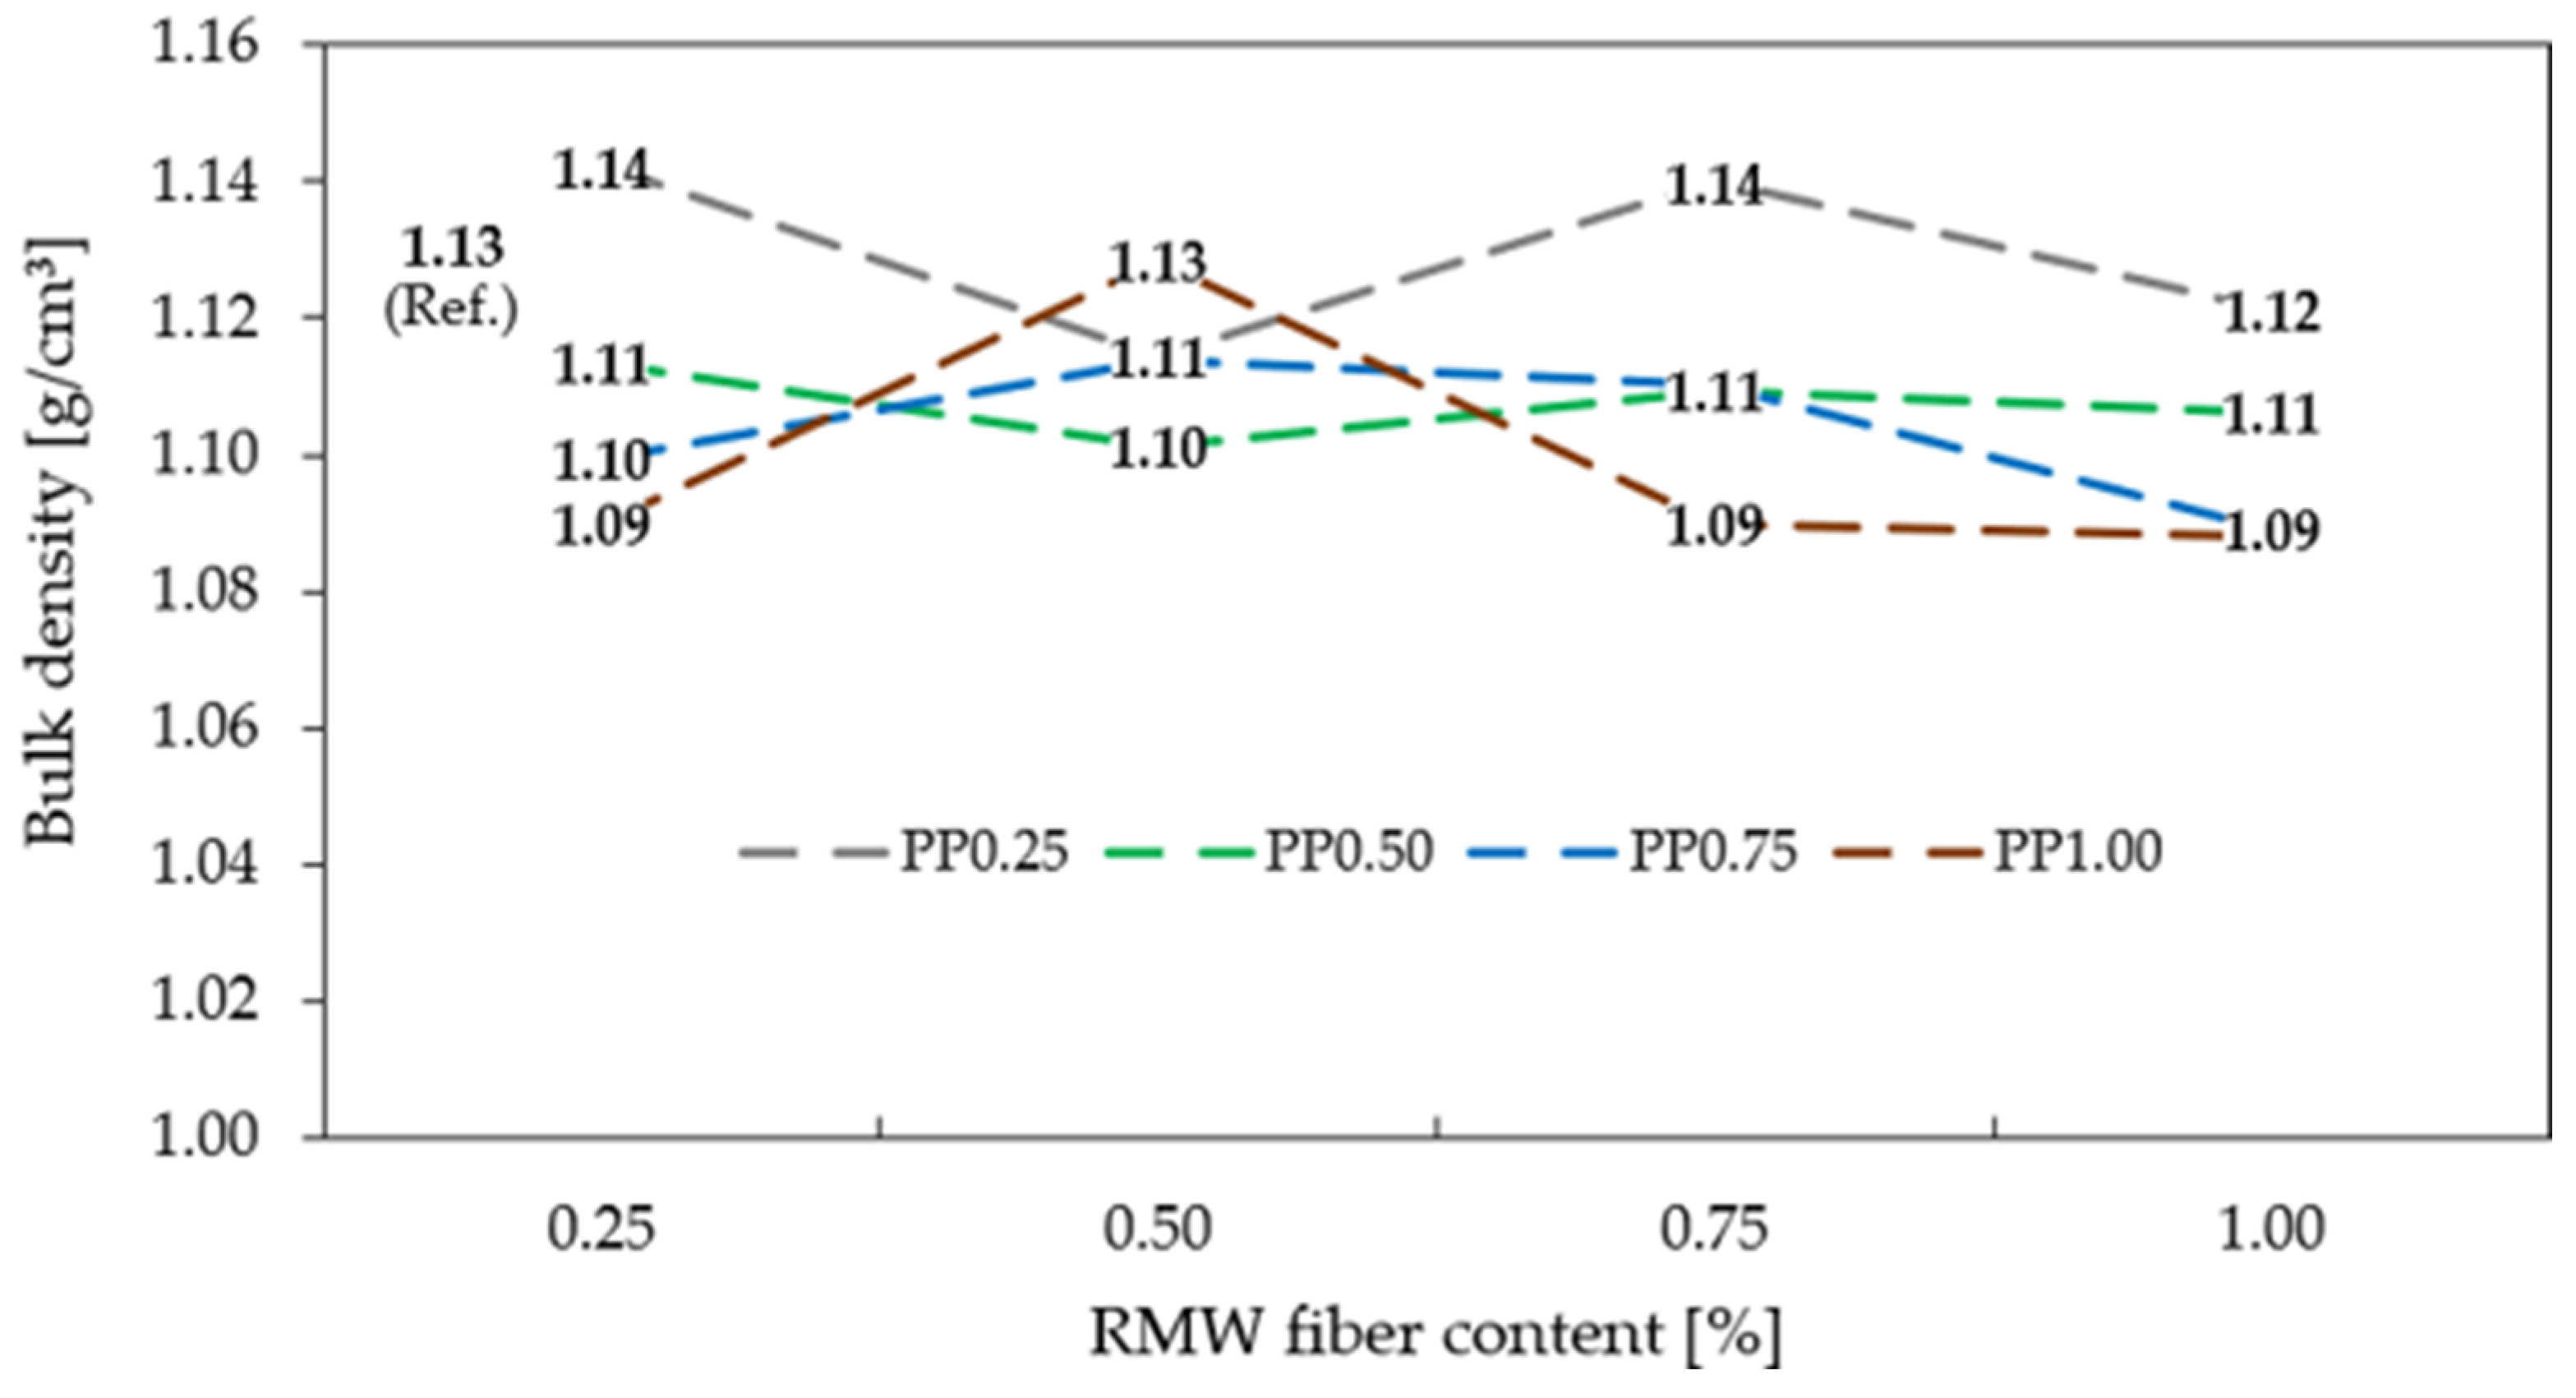
The bulk densities of the developed HFRGCs are presented in Figure 1. Except for the 0.50 wt.% group, bulk density generally decreased with increasing PP fiber content. However, incorporating 0.25 wt.% PP fibers slightly increased the bulk density compared with the fiber-free matrix. The lowest value was obtained for HFRGCs with 1.00 wt.% PP fibers (1.09 g/cm3), corresponding to a 3.5% reduction, consistent with previous studies on PP fiber-reinforced GCs [3].
Increasing the RMW fiber content produced negligible differences in bulk density. Nevertheless, Piñeiro [15] and Zaragoza-Benzal et al. [16] reported reductions in bulk density with RMW fiber incorporation, suggesting that, although increasing RMW content had little effect at a given PP fiber content, RMW fibers contributed to the overall reduction in bulk density.
The results obtained for the 0.50 wt.% RMW fiber group did not follow the trend observed for the other groups, possibly due to the limited number of samples (three per composition) and the inherent variability of fiber-reinforced composites, particularly those containing recycled fibers.

2.2. Mechanical Performance

2.2.1. Surface Hardness

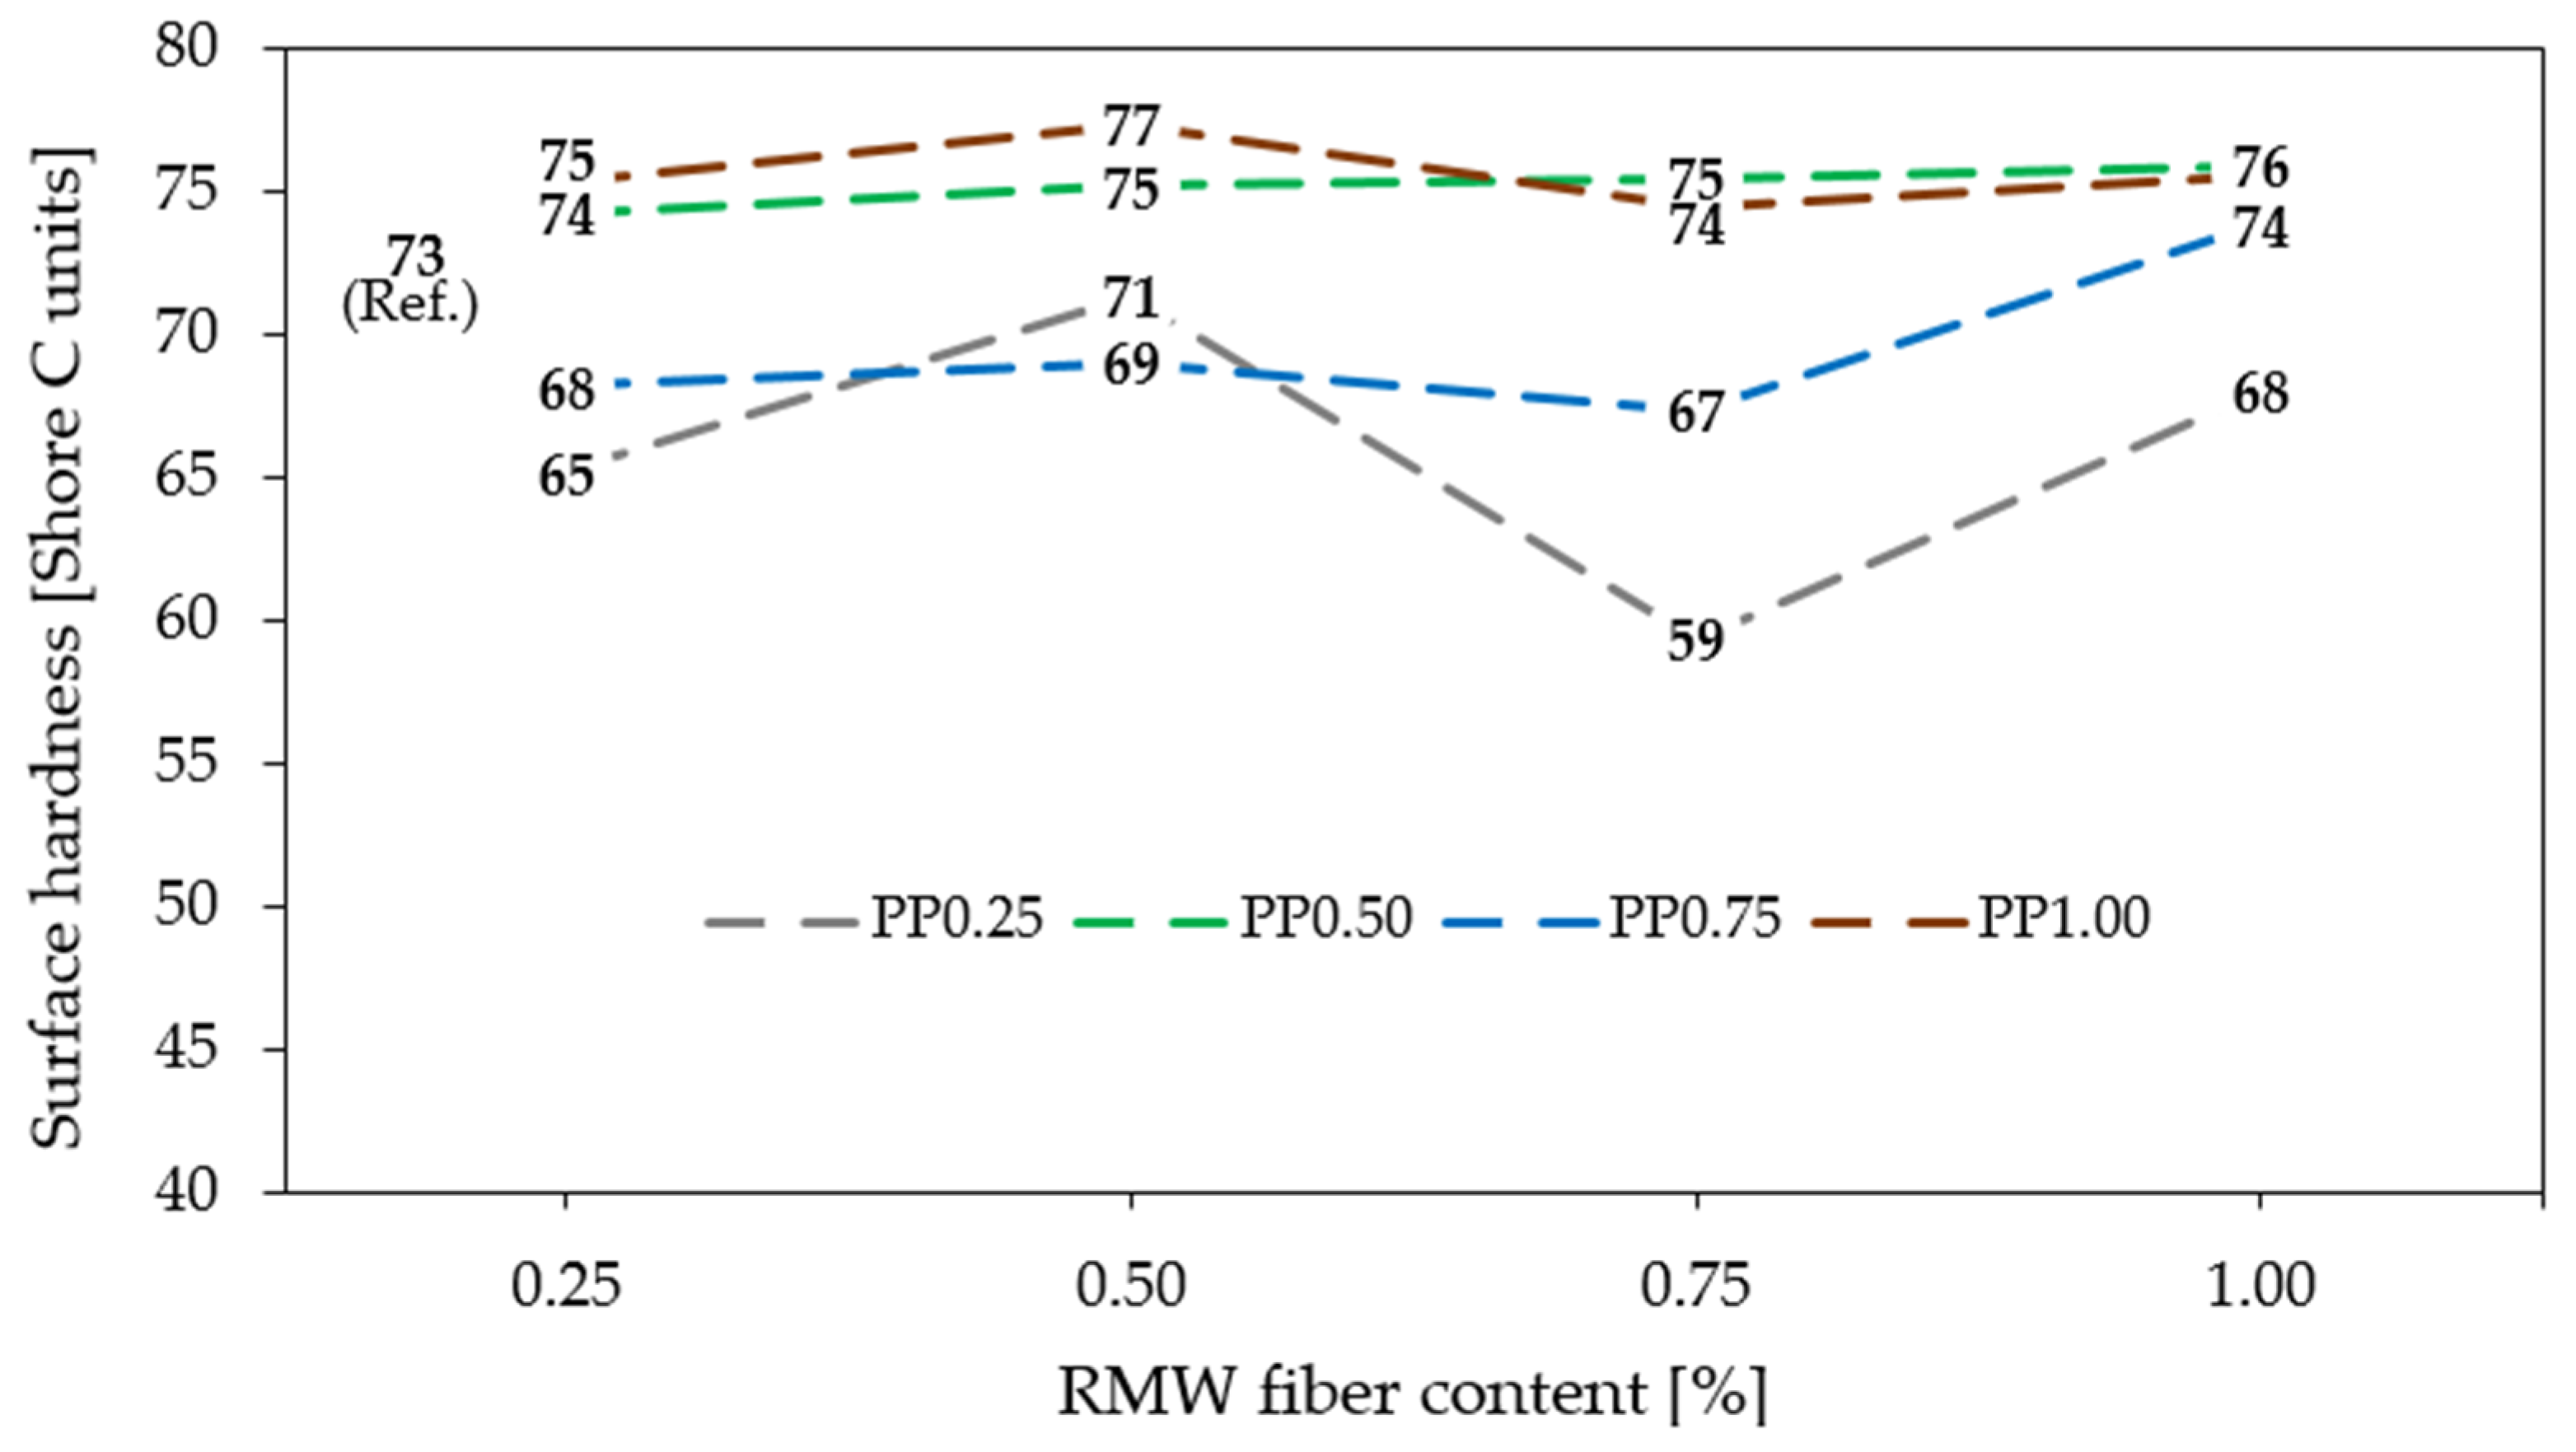
The surface hardness results are presented in Figure 2. The highest value was recorded for the HFRGC containing 0.50% RMW fibers and 1.00% PP fibers, reaching 77 Shore C units, corresponding to a 5.5% increase relative to the reference. Furthermore, although the measured values are consistent with findings reported in previous studies, hybrid fiber reinforcement was found to enhance surface hardness, contrary to the behavior observed in GCs reinforced with a single type of synthetic fiber [11,17]. This improvement may be attributed to the relatively low hybrid fiber content incorporated, with a maximum addition of 1.00 wt.% of each fiber type.
As can be seen in Figure 2, all compositions incorporating 0.50% and 1.00% PP fibers exhibited higher surface hardness than the reference, with limited sensitivity to changes in RMW fiber content. Nevertheless, the composites reinforced with 0.50% PP showed a clear increasing trend in surface hardness with increasing RMW content. A similar tendency was observed for the group containing 0.75% PP fibers, which exhibited the largest relative improvement, with surface hardness increasing by 9% between the formulations containing 0.25% and 1.00% RMW. In contrast, the lowest values were obtained for the composites with 0.25% PP fibers. Overall, the results indicate that increasing the RMW fiber content generally enhanced the surface hardness of HFRGCs. An exception was observed for the compositions containing 1.00% PP fibers, for which the optimum performance was achieved at 0.50% RMW, suggesting that excessive fiber incorporation may limit further hardness gains.

2.2.2. Flexural Strength

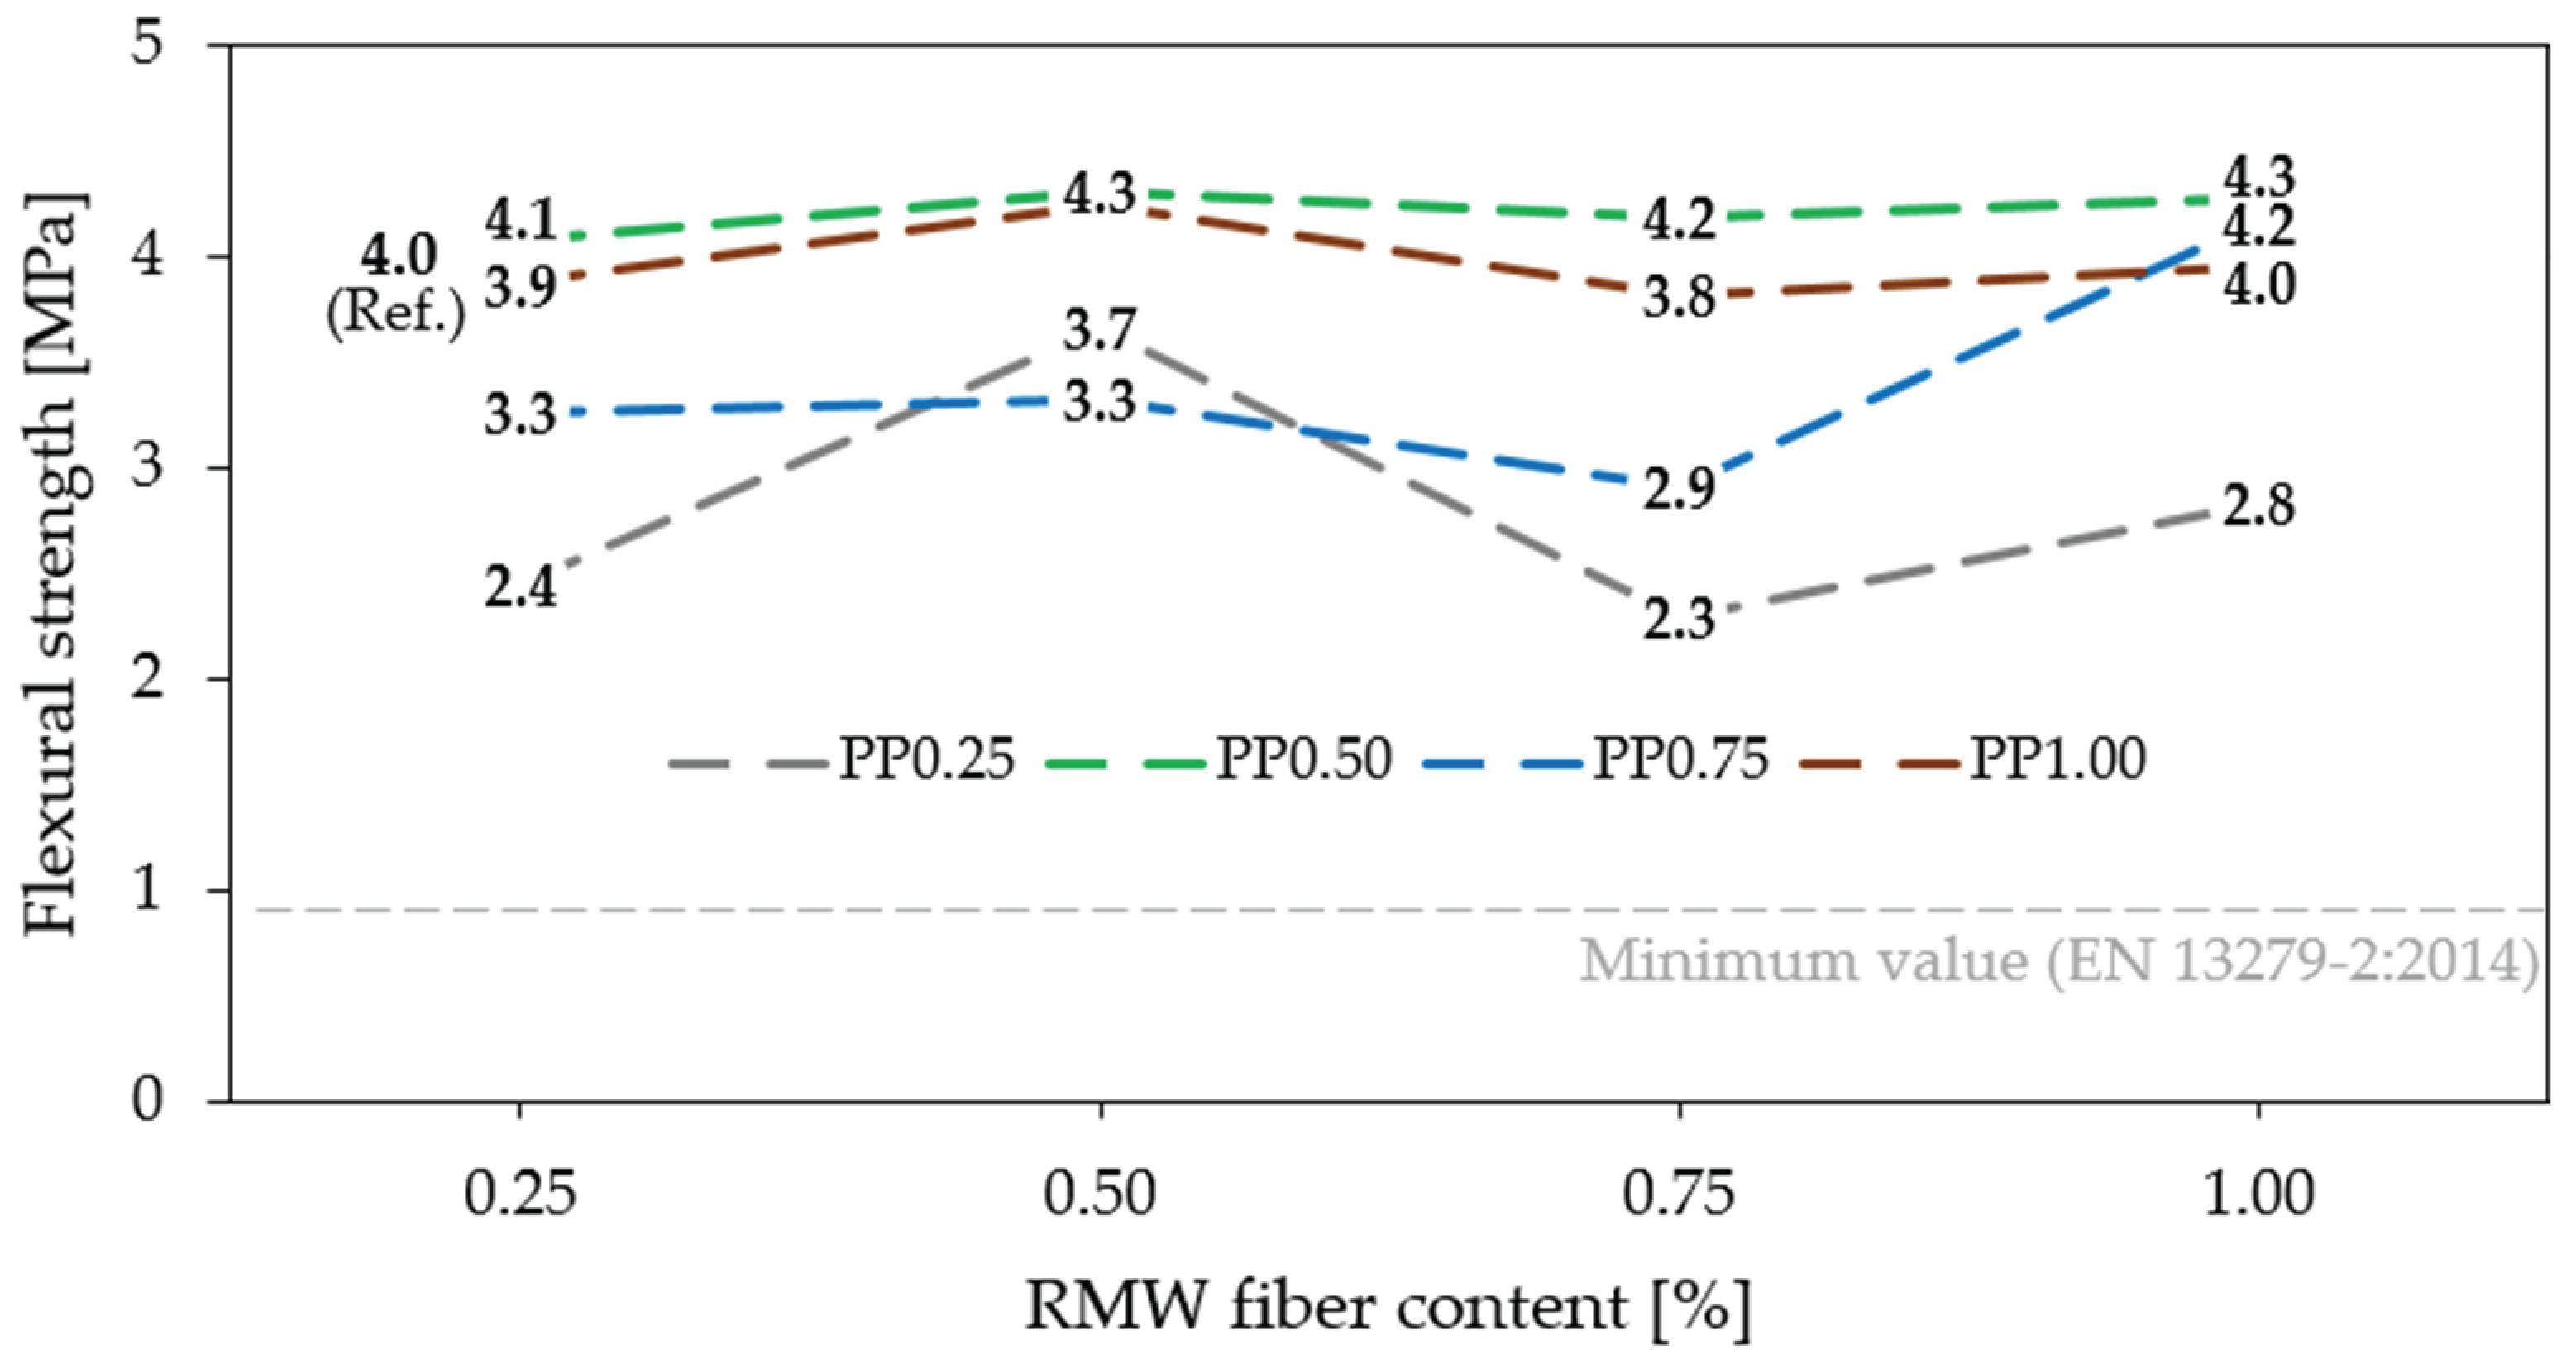
Figure 3 shows that HFRGCs containing 0.50% PP fibers exhibited higher flexural strength than the fiber-free samples, regardless of the RMW fiber content. The hybrid composites incorporating 0.50% of each reinforcement achieved the greatest improvement, with a 7.5% increase in flexural strength. Synthetic fibers tend to improve flexural strength when incorporated at low contents, as reported in previous studies with recycled PP and polycarbonate fibers [3,8]. This behavior is mainly attributed to the ability of the fibers (in this case, PP fibers) to act as bridging elements across cracks, reducing the brittleness of the matrix and enabling the development of microcracking prior to failure. Bertelsen et al. [18] reported a reduction in the flexural strength of gypsum composites reinforced with recycled polyethylene fibers, but also demonstrated load transfer from the matrix to the fibers, which enhanced the material’s post-cracking performance.
Variations in RMW fiber content had a more pronounced effect on flexural strength when combined with the lower PP fiber dosage (0.25 wt.%), whose values were the lowest. Although some values remained below the reference, all formulations exceeded the minimum standard requirement for flexural strength (1 MPa) by at least 2.3 times. The incorporation of RMW fibers alone enhances mechanical strength at low contents, up to 0.50 wt.%, whereas higher contents tend to reduce these values [15]. Zaragoza-Benzal et al. [16] reported reductions in flexural and compressive strength when combining RMW fibers with EPS waste, as well as when RMW fibers were combined with end-of-life tire fibers [14]. These findings suggest that the novel combination of RMW and PP fibers stands out among hybrid reinforcements reported in the literature by enhancing flexural strength.

2.2.3. Compression Strength

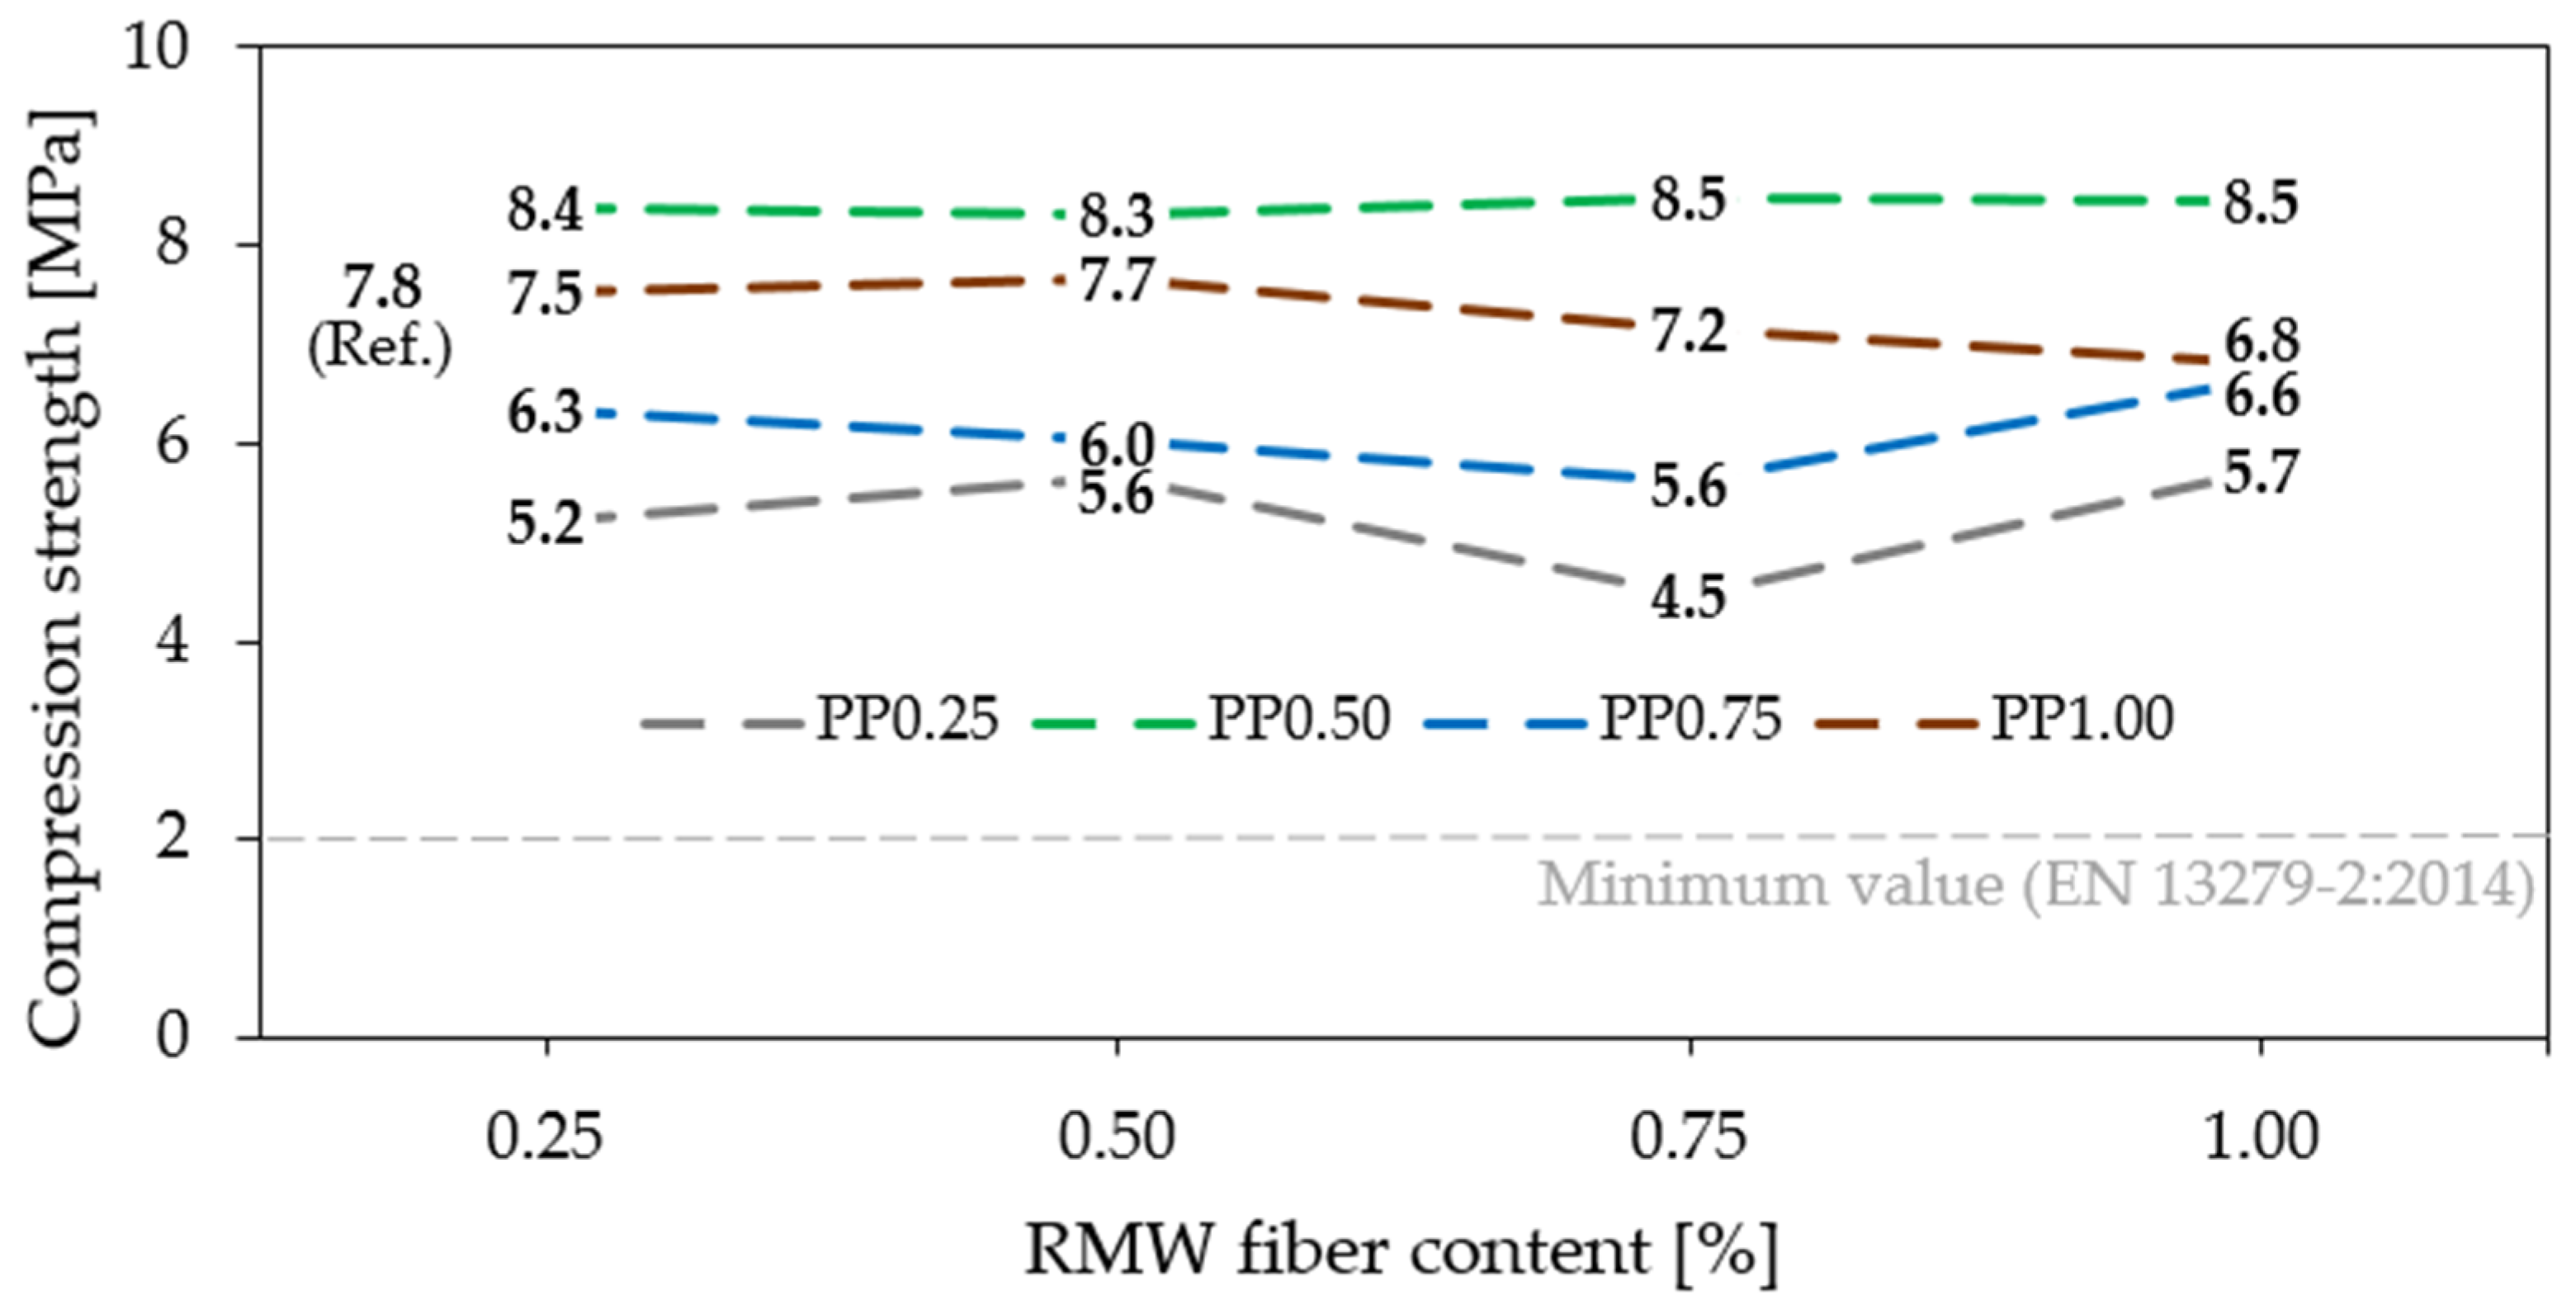
Similarly to the flexural strength results, HFRGCs containing 0.50% PP fibers achieved the highest compressive strength values (Figure 4). The compositions incorporating 0.75% and 1.00% RMW fibers reached the same maximum value of 8.5 MPa, corresponding to a 9% increase relative to the unreinforced matrix. Favorably, this increase in compressive strength contrasts with the findings reported in most studies on GCs reinforced with synthetic fibers, in which this property is generally reduced. Alyousef et al. [4] reported reductions in both compressive and flexural strength when recycled PP fibers were combined with textile mesh. Similarly, Balti et al. [19] reported a reduction in compressive strength when recycled PS was combined with recycled paper fibers.
In contrast, groups containing 0.75 wt.% and 1.00 wt.% PP fibers exhibited a decreasing trend with increasing RMW content, further suggesting that excessive fiber incorporation may adversely affect the mechanical performance of the composites. A consistent increasing trend was also observed in Figure 4 for the formulations with 0.25 wt.% PP fiber, excluding the combination with 0.75% RMW, which exhibited the lowest compressive strength values. Nevertheless, all tested HFRGCs exceeded the minimum compressive strength requirement specified by the standard (2 MPa) by at least twofold.
Although Figure 3 and Figure 4 show some fluctuations in the results with increasing fiber content, likely due to the limited number of specimens and the inherent heterogeneity of recycled fibers, overall trends in the behavior of the HFRGCs can still be identified.

2.3. Statistical Analysis

Table 2 presents the results of the Shapiro–Wilk normality test for measurements in mechanical tests. According to the Shapiro–Wilk test, most measurements did not exhibit statistically detectable departures from normality (p > 0.05); however, this result should be interpreted cautiously given the limited number of specimens per formulation. Nevertheless, as the p-values for samples 0 and 8 (surface hardness), 2 and 11 (flexural strength), and 0 (compression strength) were lower than 0.05, the null hypothesis was rejected, requiring the use of a non-parametric approach. Accordingly, the Kruskal–Wallis test was performed, and its results are presented in Table 3.
Table 3 shows that all the analyzed tests (surface hardness, flexural strength, and compressive strength) yielded p-values < 0.01 and were therefore considered statistically significant according to the Kruskal–Wallis test. Therefore, median values were compared to determine significant differences among the measurements. Table 4 summarizes the pairwise comparisons between samples whose measurements showed significant differences.
A clear pattern can be observed in Table 4. Except for the pairwise comparison between samples 2 and 3 for flexural strength, all statistically significant differences occurred between samples with different PP fiber contents. These results confirm that RMW fibers had a negligible effect on the mechanical properties, whereas PP fibers were the main factor influencing performance.
For surface hardness, the samples containing 1.00 wt.% PP fibers (samples 13–16), which exhibited the highest performance, as previously discussed, showed significant differences compared with the 0.25 and 0.75 wt.% PP fiber groups, but not with the 0.50 wt.% PP fiber group.
A similar trend was observed for both flexural and compressive strength. The specimens containing 0.50 wt.% PP fibers, which achieved the highest performance, differed significantly only from the 0.25 and 0.75 wt.% PP groups, with no significant differences relative to the 1.00 wt.% PP group. Samples 6 and 8 exhibited the greatest number of significant pairwise differences for flexural strength, whereas samples 7 and 8 did so for compressive strength.
The non-parametric statistical analysis indicated that the superior mechanical performance observed for the samples containing 0.50 and 1.00 wt.% PP fibers was statistically equivalent, suggesting that increasing the PP fiber content beyond 0.50 wt.% did not produce a significant mechanical improvement. In contrast, both groups differed significantly from the samples containing 0.25 and 0.75 wt.% PP fibers.

2.4. Environmental Performance

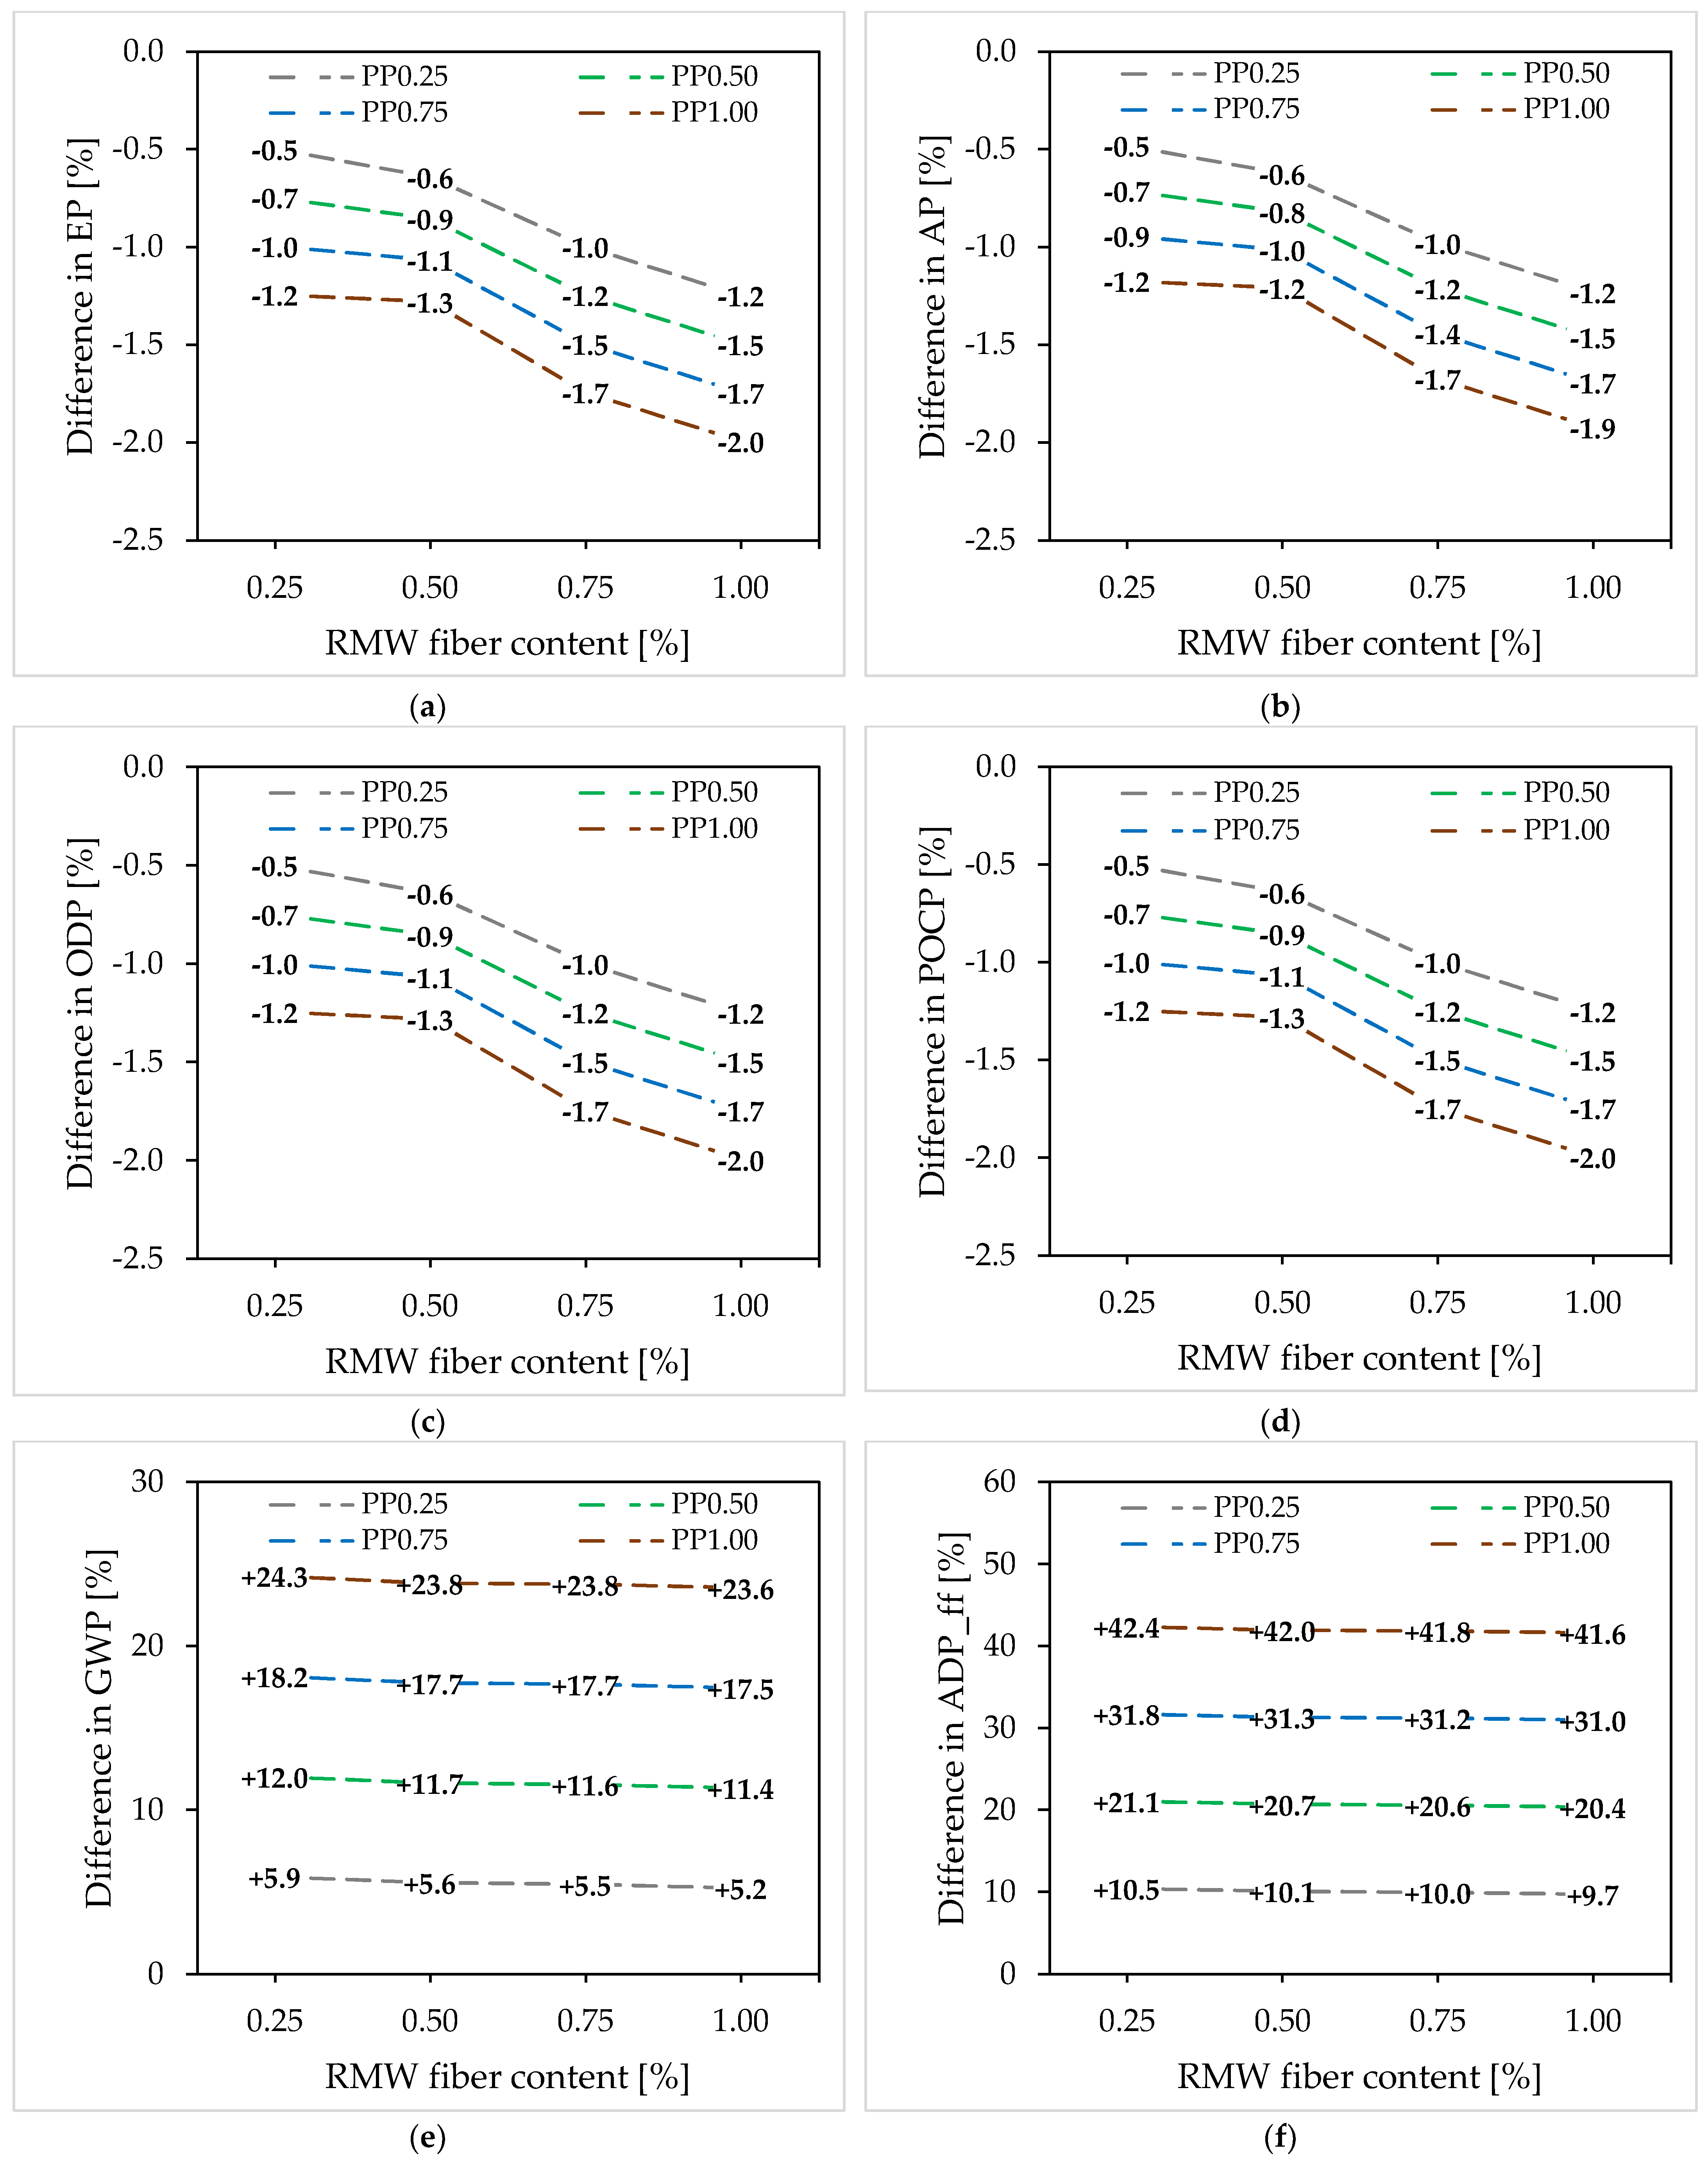
An LCA was conducted considering the production of gypsum panels measuring 1 m2 with a thickness of 12.5 mm, incorporating the sixteen combinations of RMW and PP fibers. As shown in Figure 5, which compares the environmental impacts of the hybrid gypsum panels with those of the fiber-free gypsum panel, slight reductions were observed in four impact categories: ozone depletion potential (ODP), acidification potential (AP), eutrophication potential (EP), and photochemical ozone creation potential (POCP). In these categories, the reductions were proportional to the increasing contents of both RMW and PP fibers. It should be highlighted that the main environmental benefits observed are related to the use of the recycled fibers, since the apparent decrease in environmental burdens associated with higher PP fiber content in these specific categories is primarily driven by the reduced consumption of gypsum and water in the composite matrix, rather than an inherent environmental benefit of the PP fibers. This aspect is evident in Figure 5e,f, where global warming potential (GWP) and abiotic depletion potential of fossil fuels (ADP_ff) increased with increasing PP fiber content. Although the replacement of gypsum with RMW fibers mitigated these increases, the environmental burdens associated with the petroleum-based PP fibers outweighed the benefits provided by RMW incorporation. Consequently, for a given PP fiber content, higher RMW contents resulted in lower environmental impacts, although they were insufficient to fully offset the impacts associated with PP fibers.
Therefore, all environmental impact categories evaluated decreased proportionally with increasing RMW fiber content. The recycling process of these fibers contributed only marginally to the overall impacts when compared with the production of gypsum powder and PP fibers. These results demonstrate the environmental relevance of RMW fibers as a sustainable reinforcement, since their incorporation not only reduces the environmental impacts of GCs but also promotes the recovery and valorization of industrial waste within a circular economy framework.

2.5. Overall Critical Analysis

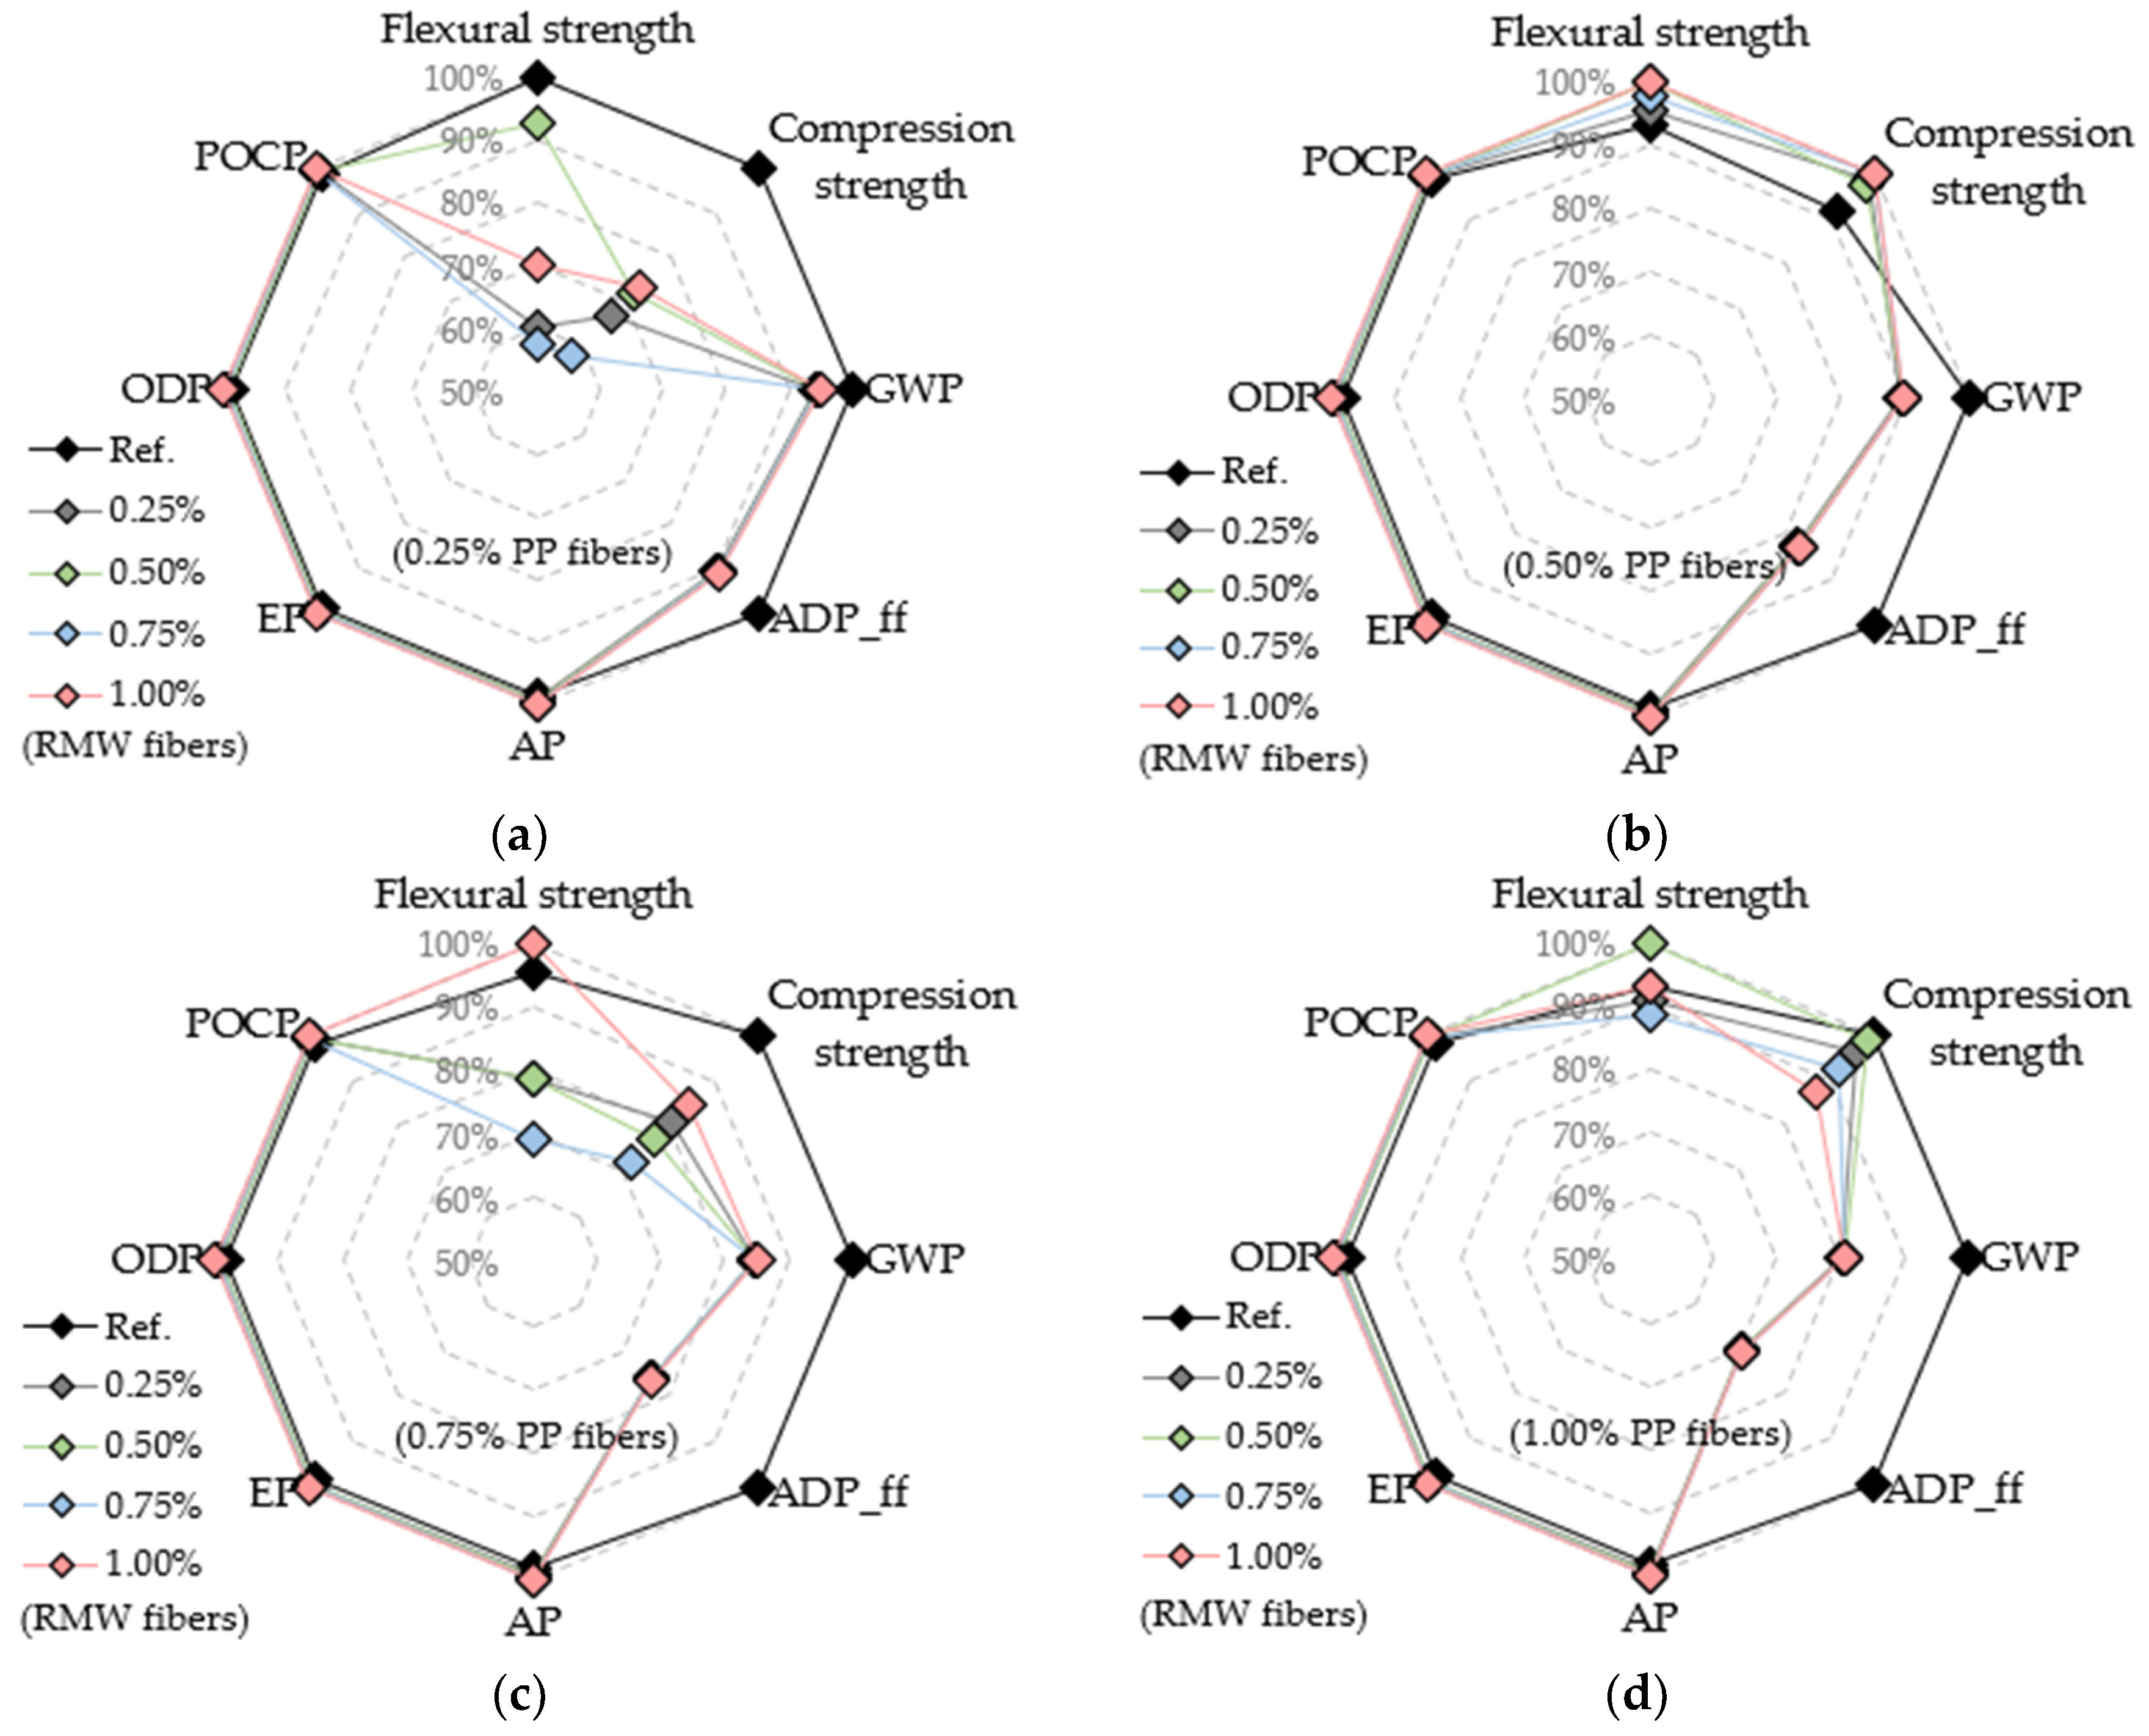
An overall critical analysis integrating the mechanical and environmental performances of the evaluated HFRGCs was conducted. The normalization of the values for the radar chart was first performed by assigning 100% to the highest values for the mechanical properties and to the lowest values for the environmental impact categories. Subsequently, the percentages corresponding to the lower values for the mechanical properties, or conversely for the environmental impacts, were calculated, resulting in the percentages presented in Figure 6, with all criteria given equal weight. For clarity, the HFRGCs were analyzed by comparing different RMW fiber contents within each PP fiber content group.
The radar chart analysis demonstrated that increasing the RMW fiber content had a more pronounced effect on the overall performance at lower PP fiber contents. As the PP content increased, the differences among the mixtures became progressively smaller, with the exception of GWP and ADP_ff. Taken together, the mixture containing 1.00 wt.% RMW fibers and 0.50 wt.% PP fibers, which simultaneously exhibited relative high mechanical performance and low environmental impacts, presented a qualitative compromise among the candidate mixtures.

3. Materials and Methods

3.1. Materials

In this study, the samples were prepared using the materials described as follows:
  • Calcium sulfate hemihydrate (CaSO4⋅0.5H2O) type A according to EN 13279-1:2008 [20], supplied by Sival (Leiria, Portugal).
  • Regular tap water (Coimbra, Portugal) in accordance with Council Directive 98/83/EC [21].
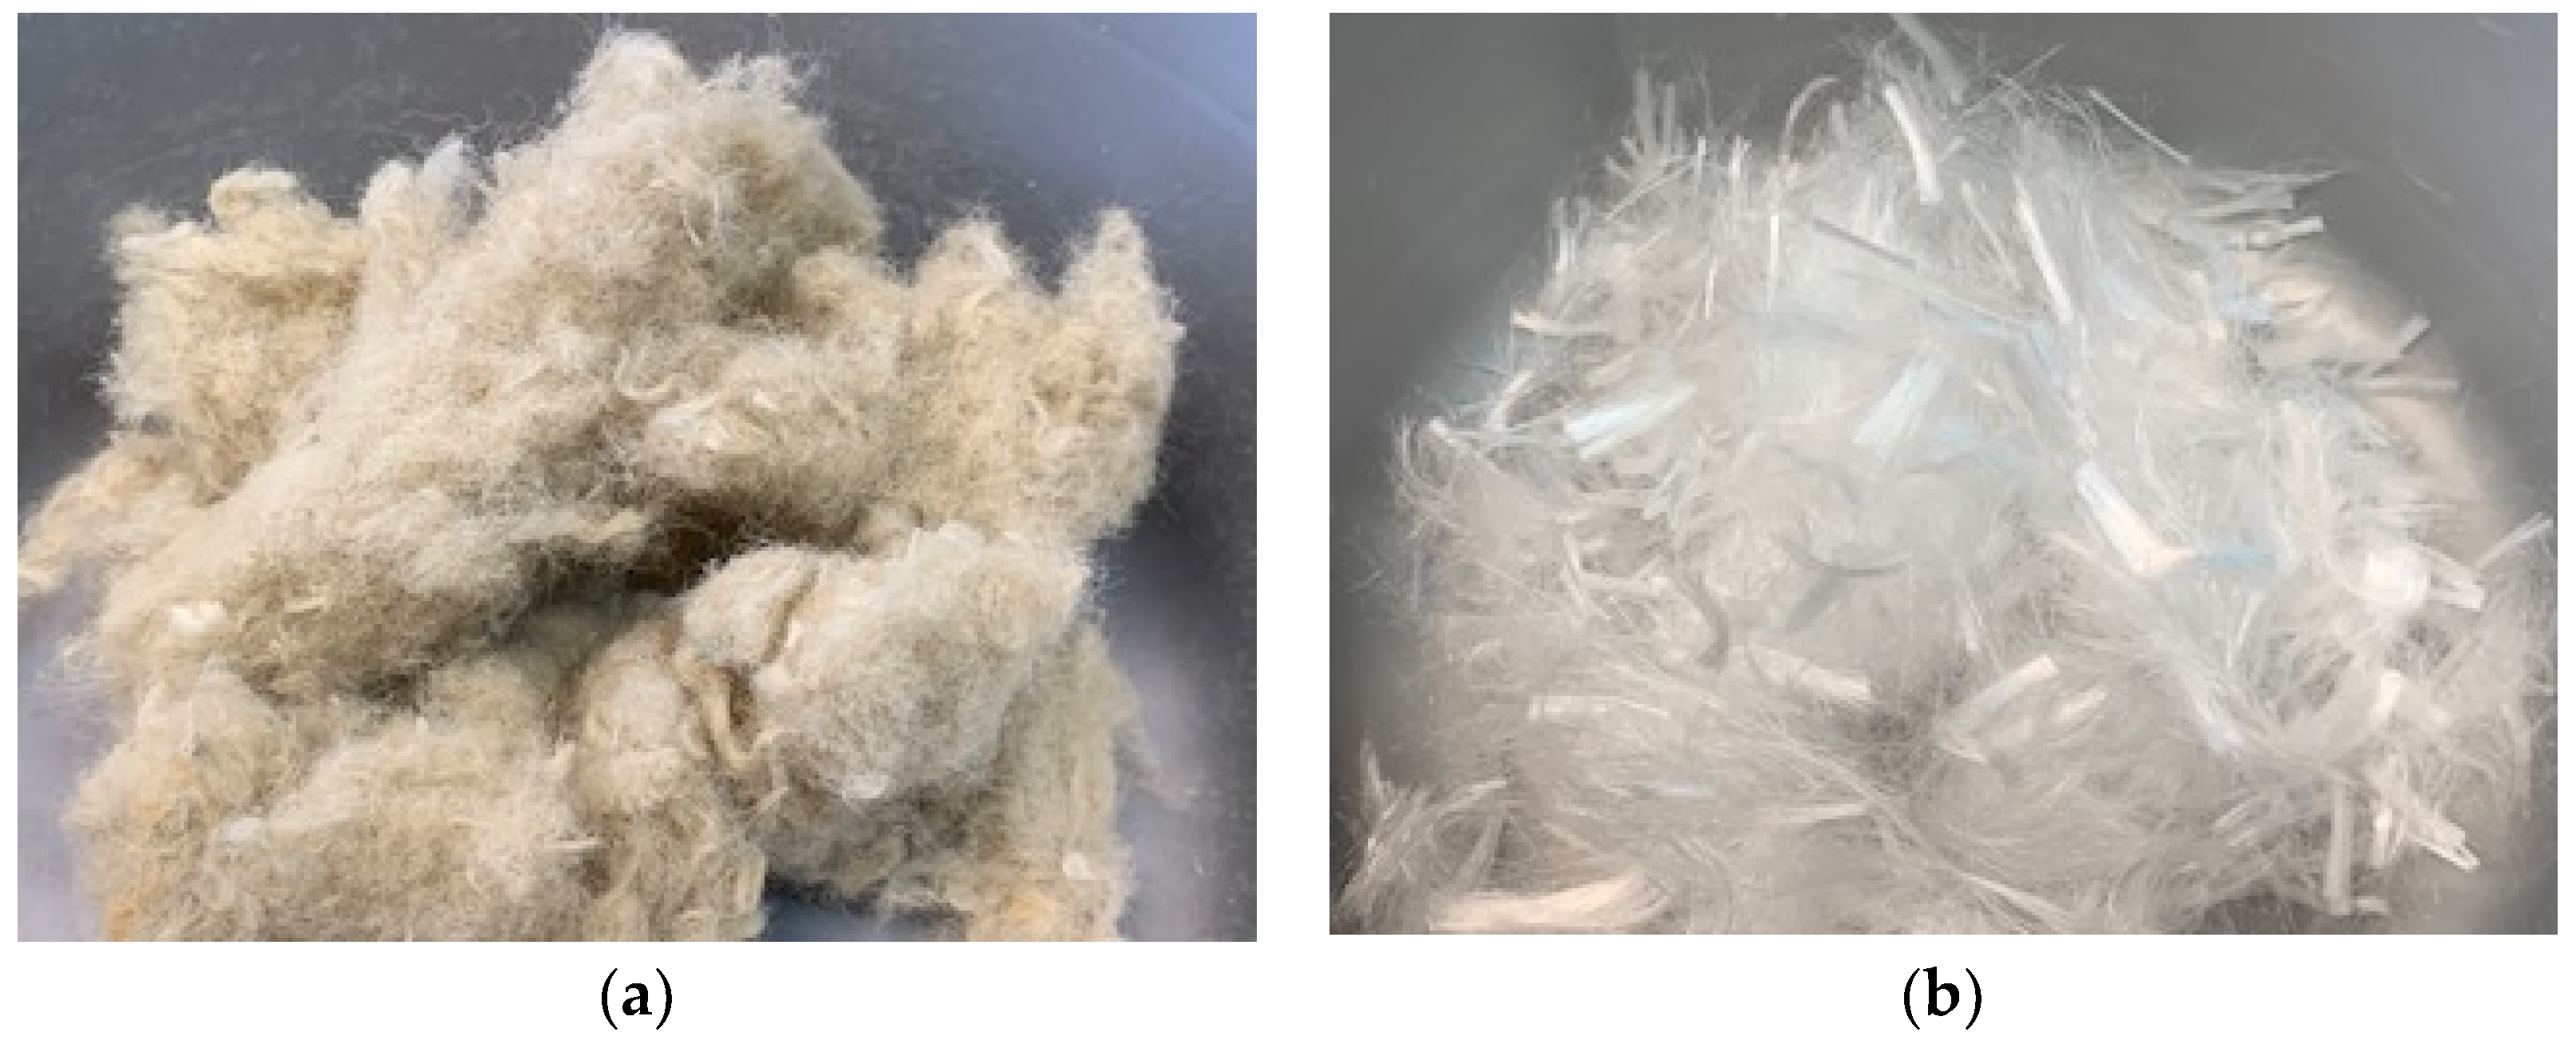
  • RMW monofilament fibers (Figure 7a); this material consisted of shredded industrial waste, supplied by Volcalis (Bustos, Portugal).
  • PP monofilament fibers (Figure 7b), supplied by Sika (Vila Nova de Gaia, Portugal).
The dimensions and physical properties of the studied fibers are presented in Table 5.

3.2. Sample Preparation

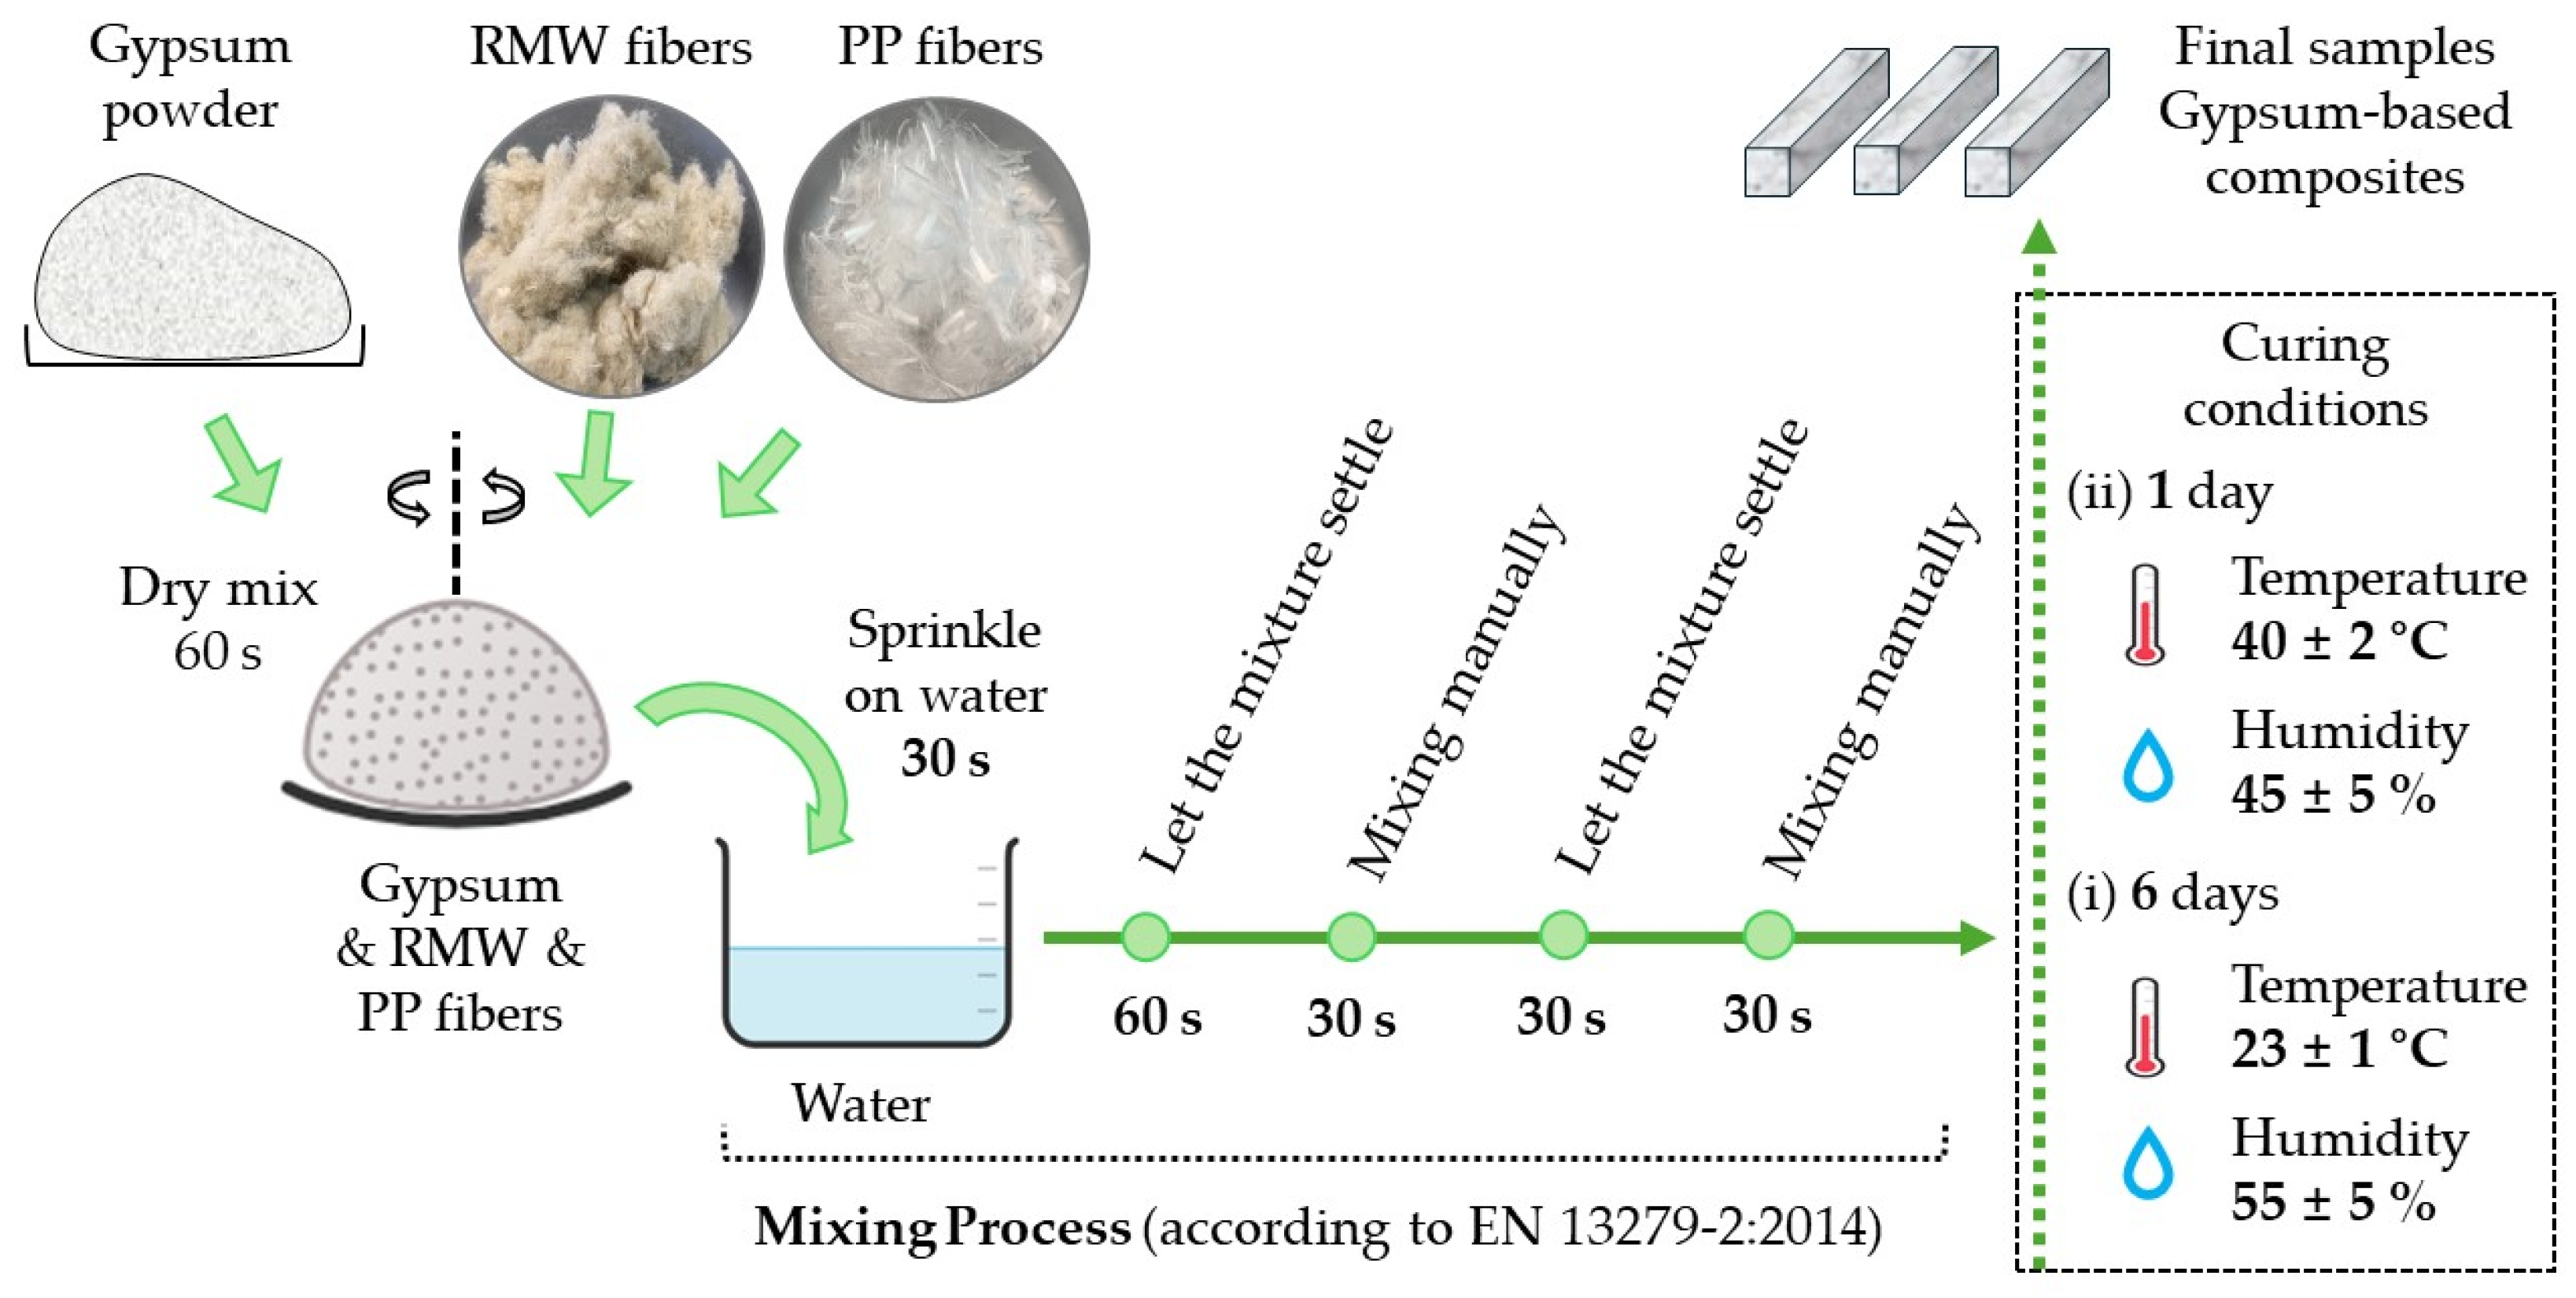
To evaluate the mechanical performance of the HFRGCs with RMW and PP fibers, samples were prepared with different fiber contents ranging from 0.25 to 1.00 wt.% of the gypsum mass (0.25 wt.% increments) for each fiber type. A constant water-to-gypsum ratio of 0.7 was adopted for all mixtures to ensure adequate fresh-state workability while minimizing the number of experimental variables. Three samples per hybrid formulation plus reference samples were prepared. Table 6 summarizes the sample compositions, whereas Figure 8 illustrates the sample preparation procedure, which followed Standard EN 13279-2:2014 [25].
Initially, the RMW and PP fibers were dry-mixed with the gypsum powder. Once the fibers were well dispersed, water was sprinkled into the mixture for 30 s, followed by a resting period of 60 s. Thereafter, the mixture was then mixed manually for 30 s, allowed to rest for an additional 30 s, and finally remixed for a further 30 s. The resulting HFRGCs were cast into molds with dimensions of 160 × 40 × 40 mm. After casting, the fifty-one samples were cured for 7 days under controlled environmental conditions (23 ± 1 °C and 55 ± 5% relative humidity). Subsequently, the samples were oven-dried at 40 ± 2 °C until constant mass was achieved.

3.3. Experimental Program

3.3.1. Mechanical Tests

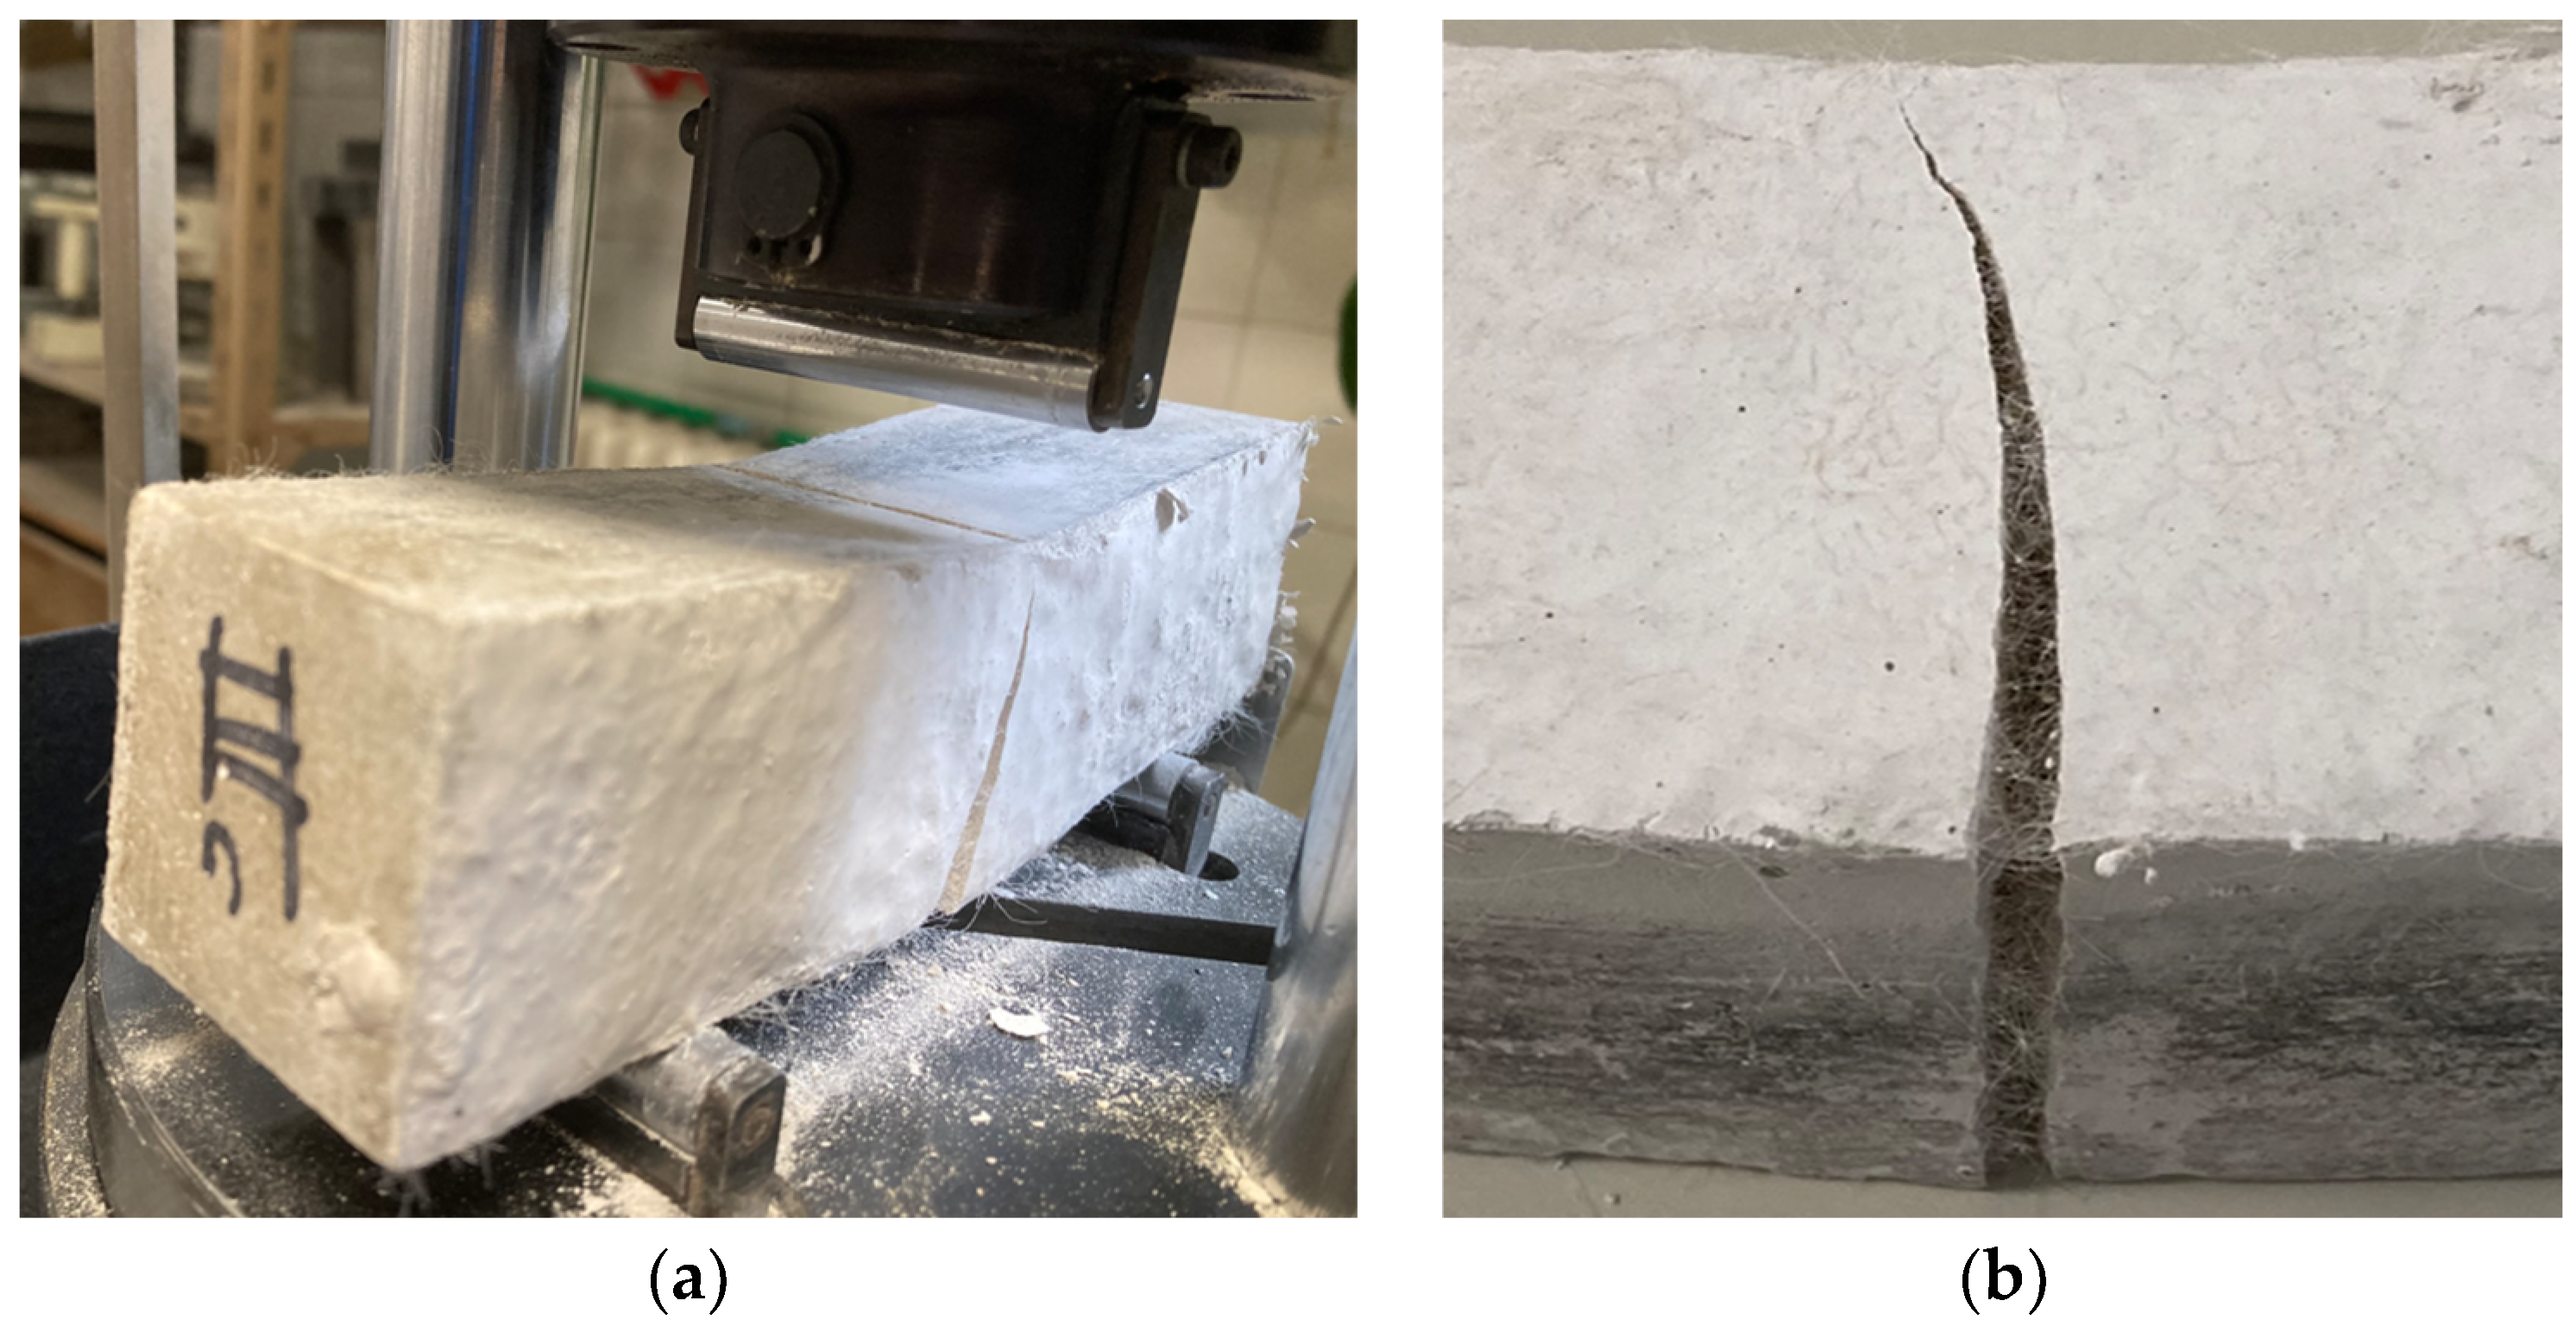
Surface hardness was determined according to Standard EN 12859:2011 [26] using a Shore C durometer 53505/C-U (Baxlo, Barcelona, Spain) with a resolution of 1 Shore degree. Five measurements were performed on each of two parallel faces of the samples, and the average value was reported; flexural and compressive strengths were determined according to Standard EN 13279-2:2014 [25] using a hydraulic press 200-10SW (S.A.E. Ibertest, Madrid, Spain). A progressive load was applied to the samples until failure at loading rates of 10 N/s for three-point flexural testing (Figure 9) and 20 N/s for compressive testing. In addition, bulk density was obtained by calculating the mass-to-volume ratio according to EN 12859:2011 [26].

3.3.2. Statistical Analysis

Statistical analyses were performed using Statistical Package for the Social Sciences, SPSS v29.0. In order to determine the effects of the incorporation of hybrid fibers on the mechanical properties of the GCs designed, an analysis of variance (ANOVA) was performed. The distribution of the measured values was preliminarily explored using the Shapiro–Wilk test. A conservative non-parametric approach based on the Kruskal–Wallis test was adopted for comparisons among formulations. The adopted significance level (α) was 5%.

3.3.3. Life Cycle Assessment

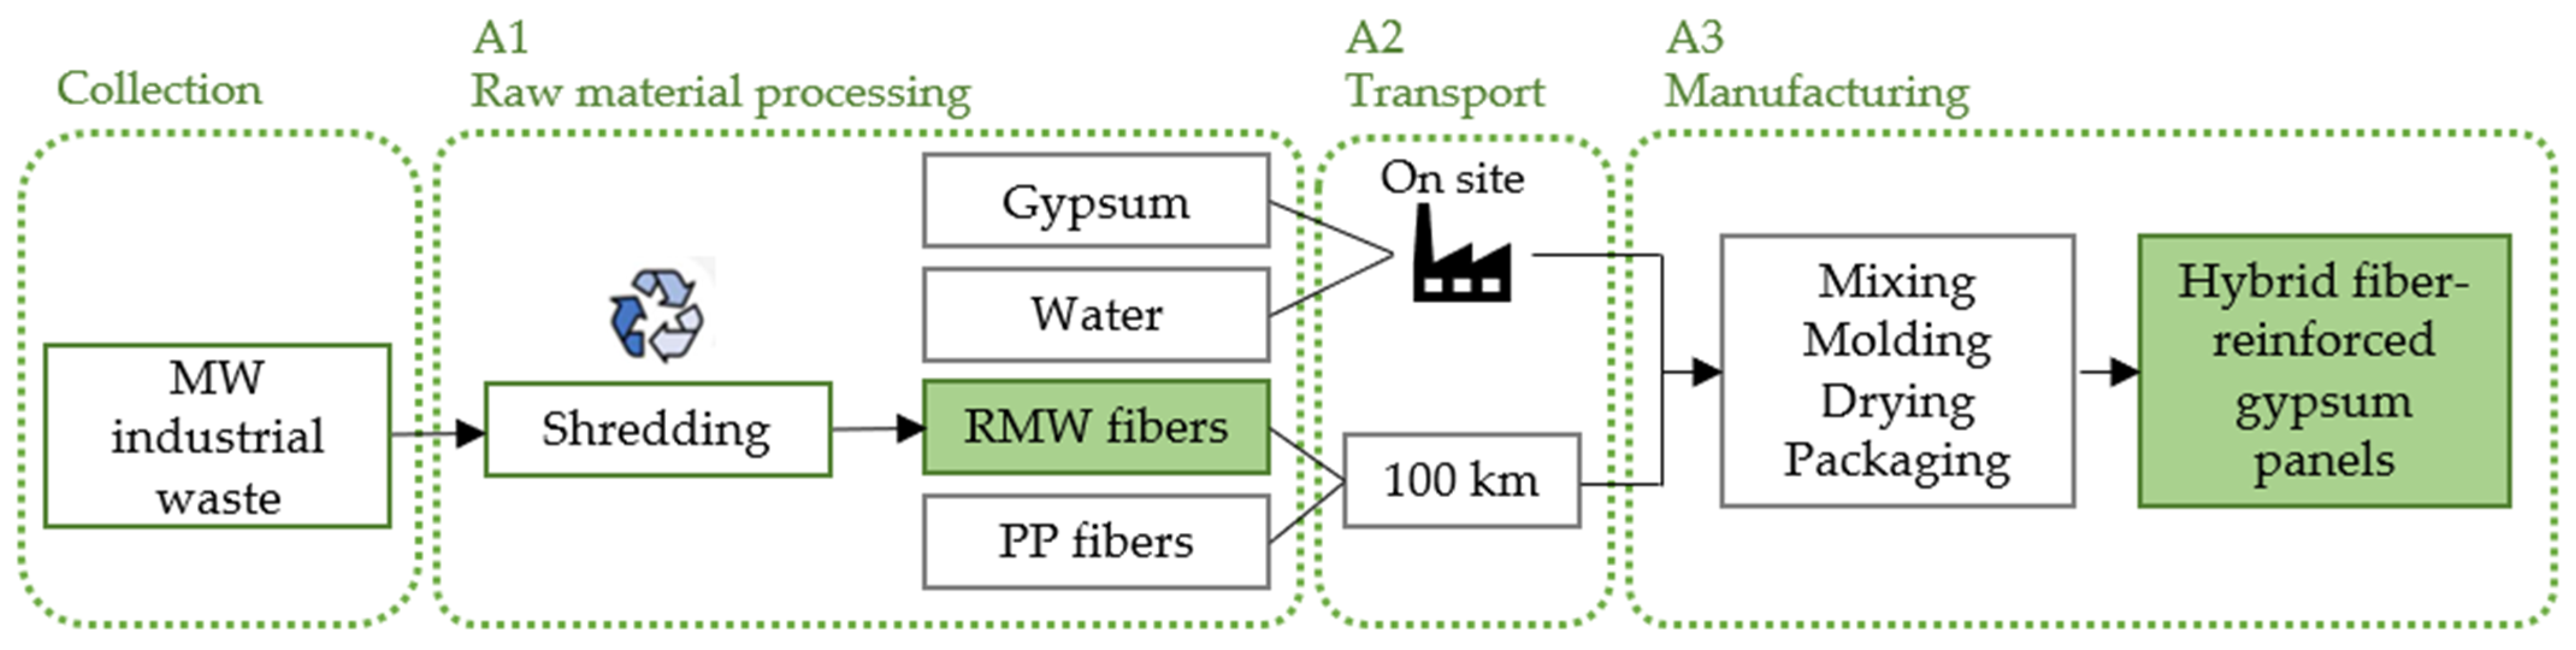
A life cycle assessment (LCA) was conducted in accordance with ISO 14040:1997 [27] and ISO 14044:2006 [28] to evaluate the environmental impacts of gypsum panels incorporating RMW and PP fibers for LSF wall applications. A functional unit of 1 m2 with a thickness of 12.5 mm was adopted, considering a cradle-to-gate system boundary, as shown in Figure 10.
For the life cycle inventory (LCI), the environmental product declarations for gypsum and PP fibers were considered, as well as the energy consumption of the RMW fiber shredding process [29]. It was assumed that the distances traveled by the fibers to the gypsum panel manufacturing facility were the same, 100 km. Table 7 summarizes the associated process inputs and energy consumption requirements, and the potential environmental impacts were quantified through life cycle impact assessment (LCIA) using the Environmental Footprint 3.1 v1.01 method [30].

4. Conclusions

In this study, sixteen HFRGCs with RMW and PP fibers were developed and evaluated to assess their mechanical and environmental performance. The main conclusions are summarized as follows.
  • The highest surface hardness was achieved by the HFRGC containing 1.00 wt.% PP and 0.50 wt.% RMW fibers, representing a 5.5% increase over the reference.
  • The highest flexural and compressive strengths were achieved with 0.50 wt.% PP fibers, showing increases of 7.5% and 9.0%, respectively.
  • Statistical analyses revealed that RMW fibers had a negligible effect on the mechanical properties, whereas HFRGCs reinforced with 0.50 and 1.00 wt.% PP fibers exhibited statistically equivalent performance, indicating that increasing the PP fiber content beyond 0.50 wt.% provided no significant mechanical benefit. From an environmental perspective, RMW fibers significantly improved the sustainability of the HFRGCs by reducing the environmental impacts while promoting the recovery and valorization of industrial waste within a circular economy framework.
  • The overall critical analysis identified the HFRGC containing 1.00 wt.% RMW and 0.50 wt.% PP fibers as the best evaluated formulation, providing the best balance between mechanical performance and environmental impacts.
It should be noted that the relatively limited number of independent samples per formulation (n = 3) restricts the statistical power of the analysis and may not fully capture the inherent variability of fiber-reinforced composites, particularly those incorporating recycled fibers. Therefore, the statistical outcomes should be interpreted primarily in terms of the comparative trends observed among the investigated formulations.
Future research should focus on a more comprehensive characterization of the HFRGC containing RMW and PP fibers, including hygrothermal and acoustic properties, long-term durability, moisture resistance, cyclic loading, freeze–thaw performance, fire resistance, fiber degradation, dimensional stability, recyclability and large-scale manufacturing feasibility, to further assess its suitability for gypsum panel applications. This proposal to broaden the characterization of the composites would facilitate expanding the scope of the LCA conducted (including use and end-of-life phases), which is key to understanding their overall environmental performance for industrial implementation. To improve sustainability by reducing the environmental impacts associated with panel production, future studies should investigate hybrid reinforcement systems combining two or more types of recycled fibers and natural additives such as dextrin, as potential alternatives to virgin raw PP fibers, while maintaining the mechanical performance of the HFRGCs.

Author Contributions

Conceptualization, D.F.; methodology, A.Z.-B.; software, A.L.M.; validation, P.S.; formal analysis, A.Z.-B.; investigation, L.L.; resources, P.S.; data curation, A.Z.-B.; writing—original draft preparation, L.L.; writing—review and editing, D.F. and P.S.; visualization, L.L.; supervision, P.S.; project administration, D.F.; funding acquisition, D.F. All authors have read and agreed to the published version of the manuscript.

Funding

This research was funded by the Madrid Government (Comunidad de Madrid, Spain) under the Multiannual Agreement 2023–2026 with Universidad Politécnica de Madrid, in Line A, Emerging Researchers, grant number DOCTORES-EMERGENTES-24-NZMO4U-16-3U7Z8W (Project name: Waste2BuildIns; OTT reference: M230020126A-DFV). This work was also partly financed by FCT/MCTES through national funds (PIDDAC) under the R&D Unit Institute for Sustainability and Innovation in Structural Engineering (ISISE), under reference UIDB/04029/2020 (doi.org/10.54499/UIDB/04029/2020), and under the Associate Laboratory Advanced Production and Intelligent Systems ARISE under reference LA/P/0112/2020.

Data Availability Statement

The original contributions presented in this study are included in the article. Further inquiries can be directed to the corresponding author.

Acknowledgments

The authors also want to acknowledge the support provided by the following companies: Sika, Volcalis and Stanley.

Conflicts of Interest

The authors declare no conflicts of interest.

Abbreviations

The following abbreviations are used in this manuscript:
HFRGCHybrid fiber-reinforced gypsum composite
RMWRecycled mineral wool
PPPolypropylene
LCALife cycle assessment
GCGypsum composite
LCILife cycle inventory
LCIALife cycle impact assessment
ODPOzone depletion potential
APAcidification potential
EPEutrophication potential
POCPPhotochemical ozone creation potential
GWPGlobal warming potential
ADP_ffAbiotic depletion potential of fossil fuels

References

  1. Yildizel, S.A.; Toktas, A.; Keskin, Ü.S. Enhancing Mechanical Performance of Glass Fiber Reinforced Gypsum Composites with Carbon Black and Magnetite: An Integrated Optimization Approach. J. Build. Eng. 2025, 108, 112962. [Google Scholar] [CrossRef] [Scilit]
  2. Mehtab, T.; Agrawal, R.; Kamal, M.A. Technological Appraisal of Prefabricated Glass Fibre Reinforced Gypsum (GFRG) Panels in Building Construction System. Archit. Eng. Sci. 2023, 4, 154. [Google Scholar] [CrossRef] [Scilit]
  3. Romero-Gómez, M.I.; Pedreño-Rojas, M.A.; Pérez-Gálvez, F.; Rubio-de-Hita, P. Characterization of Gypsum Composites with Polypropylene Fibers from Non-Degradable Wet Wipes. J. Build. Eng. 2021, 34, 101874. [Google Scholar] [CrossRef] [Scilit]
  4. Alyousef, R.; Abbass, W.; Aslam, F.; Shah, M.I. Potential of Waste Woven Polypropylene Fiber and Textile Mesh for Production of Gypsum-Based Composite. Case Stud. Constr. Mater. 2023, 18, e02099. [Google Scholar] [CrossRef] [Scilit]
  5. United Nations. Transforming Our World: The 2030 Agenda for Sustainable Development; UN: New York, NY, USA, 2015. [Google Scholar]
  6. Kubiczek, J.; Derej, W.; Hadasik, B.; Matuszewska, A. Chemical Recycling of Plastic Waste as a Mean to Implement the Circular Economy Model in the European Union. J. Clean. Prod. 2023, 406, 136951. [Google Scholar] [CrossRef] [Scilit]
  7. Park, J.K.; Kim, M.O.; Kim, D.J. Pullout Behavior of Recycled Waste Fishing Net Fibers Embedded in Cement Mortar. Materials 2020, 13, 4195. [Google Scholar] [CrossRef] [Scilit] [PubMed]
  8. Pedreño-Rojas, M.A.; Rodríguez-Liñán, C.; Flores-Colen, I.; de Brito, J. Use of Polycarbonate Waste as Aggregate in Recycled Gypsum Plasters. Materials 2020, 13, 3042. [Google Scholar] [CrossRef] [Scilit] [PubMed]
  9. del Rio Merino, M.; Villoria Sáez, P.; Longobardi, I.; Santa Cruz Astorqui, J.; Porras-Amores, C. Redesigning Lightweight Gypsum with Mixes of Polystyrene Waste from Construction and Demolition Waste. J. Clean. Prod. 2019, 220, 144–151. [Google Scholar] [CrossRef] [Scilit]
  10. Lu, Y.; Liu, X.; Li, Y.; Li, Z.; Liu, F. Effect of Ball Milling Time on Strengths of Hybrid Fiber-Reinforced. Int. J. Met. 2021, 15, 864–873. [Google Scholar] [CrossRef] [Scilit]
  11. Lv, F.; Wang, L.; An, H.; Chen, S.; Shu, J.; Kong, D. Effects of Hybrid Fibers on Properties of Desulfurized Gypsum-Based Composite Cementitious Materials. Constr. Build. Mater. 2023, 392, 131840. [Google Scholar] [CrossRef] [Scilit]
  12. Balti, S.; Boudenne, A.; Dammak, L.; Hamdi, N. Mechanical and Thermophysical Characterization of Gypsum Composites Reinforced by Different Wastes for Green Building Applications. Constr. Build. Mater. 2023, 372, 130840. [Google Scholar] [CrossRef] [Scilit]
  13. Aramwit, P.; Daniel Chin Vui Sheng, D.; Krishna Moorthy, G.; Guna, V.; Reddy, N. Rice Husk and Coir Fibers as Sustainable and Green Reinforcements for High Performance Gypsum Composites. Constr. Build. Mater. 2023, 393, 132065. [Google Scholar] [CrossRef] [Scilit]
  14. Zaragoza-Benzal, A.; Ferrández, D.; Santos, P.; Morón, C. Recovery of End-of-Life Tyres and Mineral Wool Waste: A Case Study with Gypsum Composite Materials Applying Circular Economy Criteria. Materials 2023, 16, 243. [Google Scholar] [CrossRef] [Scilit] [PubMed]
  15. Piñeiro, S.R. Refuerzo de La Escayola Mediante Fibras de Lana Mineral Del Reciclaje de RCD. Doctoral Thesis, Universidad Politécnica de Madrid, Madrid, Spain, 2016. [Google Scholar]
  16. Zaragoza-Benzal, A.; Ferrández, D.; Santos, P.; Atanes-Sánchez, E. Upcycling EPS Waste and Mineral Wool to Produce New Lightweight Gypsum Composites with Improved Thermal Performance. Constr. Build. Mater. 2024, 449, 138464. [Google Scholar] [CrossRef] [Scilit]
  17. Lima, L.; Zaragoza-Benzal, A.; Ferrández, D.; Santos, P. Eco-Gypsum Panels with Recycled Fishing NET Fibers for Sustainable Construction: Development and Characterization. Materials 2025, 18, 4305. [Google Scholar] [CrossRef] [Scilit] [PubMed]
  18. Bertelsen, I.M.G.; Ottosen, L.M. Recycling of Waste Polyethylene Fishing Nets as Fibre Reinforcement in Gypsum-Based Materials. Fibers Polym. 2022, 23, 164–174. [Google Scholar] [CrossRef] [Scilit]
  19. Balti, S.; Boudenne, A.; Yahya, K.; Hamdi, N. Advancing Reinforcement of Sustainable Gypsum Composites: High-Performance Design by Reusing Waste Materials. Mater. Today Sustain. 2024, 27, 100946. [Google Scholar] [CrossRef] [Scilit]
  20. EN 13279-1:2008; Gypsum Binders and Gypsum Plasters—Part 1: Definitions and Requirements. CEN—European Committee for Standardization: Brussels, Belgium, 2008.
  21. The Council of the European Union. Council Directive 98/83/EC. On the Quality of Water Intended for Human Consumption; The Council of the European Union: Strasbourg, France, 1998. [Google Scholar]
  22. Table of Thermal Conductivity of Building Materials. Available online: https://buildernow.decorexpro.com/pt/uteplenie/teploprovodnost-uteplitelej.html (accessed on 5 June 2026).
  23. Volcalis-Isolamentos Minerais, S.A. Technical Sheet. Available online: https://volcalis.pt/documentos/FichaTecnica_Volcalis_AlphaRolo.pdf (accessed on 28 February 2026).
  24. Sika® Ficha de Produto. Available online: https://prt.sika.com/pt/sika-produtos/producao-de-betao/fibras-para-betao/sikafiber-m-12.html (accessed on 28 February 2026).
  25. EN 13279-2:2014; Gypsum Binders and Gypsum Plasters—Part 2: Test Methods. CEN—European Committee for Standardization: Brussels, Belgium, 2014.
  26. EN 12859:2011; Gypsum Blocks—Definitions, Requirements and Test Methods. CEN—European Committee for Standardization: Brussels, Belgium, 2011.
  27. ISO 14040:1997; Environmental Management—Life Cycle Assessment—Principles and Framework. ISO—International Organization for Standardization: Geneva, Switzerland, 1997.
  28. ISO 14044:2006; Environmental Management—Life Cycle Assessment—Requirements and Guidelines. ISO—International Organization for Standardization: Geneva, Switzerland, 2006.
  29. Pasciucco, F.; Rossi, D.; Maccaferri, E.; Pecorini, I.; Giorgini, L.; Seggiani, M. Recycling Polyamide 6 Fishing Nets and Carbon Fibers for the Development of Novel Sustainable Composites: Properties and LCA Process Analysis. J. Clean. Prod. 2025, 486, 144634. [Google Scholar] [CrossRef] [Scilit]
  30. European Union Environmental Footprint 3.1. Available online: https://eur-lex.europa.eu/legal-content/EN/TXT/?uri=CELEX:32021H2279 (accessed on 21 April 2026).
  31. Romero-Gómez, M.I.; Silva, R.V.; de Brito, J.; Flores-Colen, I. Prototype of Alveolar Gypsum Blocks with Plastic Waste Addition for Partition Walls: Physico-Mechanical, Water-Resistance and Life Cycle Assessment. J. Clean. Prod. 2023, 432, 139810. [Google Scholar] [CrossRef] [Scilit]
Figure 1. Bulk density test results.
Recycling 11 00159 g001
Figure 2. Surface hardness test results.
Recycling 11 00159 g002
Figure 3. Flexural strength test results.
Recycling 11 00159 g003
Figure 4. Compression strength test results.
Recycling 11 00159 g004
Figure 5. LCA results for several environmental impact indicators: (a) EP; (b) AP; (c) ODP; (d) POCP; (e) GWP; (f) ADP_ff.
Recycling 11 00159 g005
Figure 6. Influence of RMW and PP fiber incorporation on mechanical and environmental performance of the developed HFRGCs. (a) 0.25% PP fiber; (b) 0.50% PP fiber; (c) 0.75% PP fiber; (d) 1.00% PP fiber.
Recycling 11 00159 g006
Figure 7. Evaluated fibers: (a) RMW fibers; (b) PP fibers.
Recycling 11 00159 g007
Figure 8. Flowchart of sample preparation.
Recycling 11 00159 g008
Figure 9. (a) Flexural strength test; (b) flexural fracture after testing.
Recycling 11 00159 g009
Figure 10. System boundaries of the gypsum panel production process considered for the LCA.
Recycling 11 00159 g010
Table 1. Types of hybrid reinforcements in GCs.
Fiber 1Fiber 2
Ref. (Year)Material L  1
[mm]
Ø  2
[µm]
δ  3 [g/cm3]Ratio [wt.%]Material L  1
[mm]
Ø  2
[µm]
δ  3
[g/cm3]
Ratio [wt.%]
[10] (2021)PP5–103–1060–800–0.5Aluminosilicate5–1060–800.91–0.930–0.5
[11] (2023)PVA 4-151.290–0.75Basalt12132.620–0.75
[12] (2023)Recycled PS 51502000-0–10Recycled paper-0–5-0–1
[13] (2023)Rice husk5-1.30–30Coir5–10-1.20–30
1  L —length; 2  Ø —diameter; 3  δ —density; 4 PVA—polyvinyl alcohol; 5 PS—polystyrene.
Table 2. Normality tests for measurements in mechanical tests.
Sample
Number
PP
Fiber
RMW
Fiber
Shapiro–Wilk
Surface HardnessFlexural StrengthCompression Strength
[wt.%][wt.%]Statisticp-ValueStatisticp-ValueStatisticp-Value
00.000.000.750<0.010.9500.5700.7590.021
10.250.250.9720.6790.9390.5240.7960.104
20.500.9230.4630.754<0.010.8650.280
30.750.9230.4630.9870.7800.7710.047
41.000.7970.1070.9790.7230.8590.266
50.500.250.9230.4630.9150.4351.0000.992
60.500.8930.3630.8590.2640.9910.815
70.750.7920.0940.9980.9150.8550.253
81.000.750<0.010.7770.0600.8540.252
90.750.250.9680.6560.9570.6030.9970.890
100.500.7780.0620.9590.6120.7890.089
110.750.8600.2660.7700.0440.9440.546
121.000.9930.8430.9320.4970.8430.221
131.000.250.8180.1570.9610.6200.9460.552
140.500.9640.6370.9990.9450.9800.728
150.750.9240.5400.9770.7450.9350.534
161.000.9920.8260.9710.6710.8790.322
Table 3. Kruskal–Wallis test for independent samples.
Surface HardnessFlexural StrengthCompression Strength
H42.30035.72544.682
p-value<0.01<0.01<0.01
Table 4. Pairwise comparisons between different significant samples’ results.
Surface HardnessFlexural StrengthCompression Strength
Samples I-IIStatisticp-ValueSamples I-IIStatisticp-ValueSamples I-IIStatisticp-Value
1-6−29.5000.0151-026.3330.0271-027.3330.024
1-7−29.8330.0141-5−29.6670.0131-5−35.3330.004
1-8−33.1670.0061-6−34.5000.0041-6−34.3330.005
1-13−28.8330.0171-7−31.5000.0081-7−37.3330.002
1-14−39.1670.0011-8−35.0000.0031-8−36.3330.003
1-15−24.0000.0481-12−27.1670.0221-14−24.6670.042
1-16−31.0000.0111-13−24.3330.0412-5−31.0000.011
2-14−28.5000.0191-14−34.6670.0042-6−30.0000.013
3-5−30.5000.0121-16−25.8330.0302-7−33.0000.007
3-6−36.1670.0033-028.3330.0172-8−32.0000.008
3-7−36.5000.0033-224.8330.0373-032.6670.007
3-8−39.8330.0013-5−31.6670.0083-5−40.6670.001
3-12−27.0000.0263-6−36.5000.0023-6−39.6670.001
3-13−35.5000.0033-7−33.5000.0053-7−42.667<0.01
3-14−45.833< 0.013-8−37.0000.0023-8−41.6670.001
3-15−30.6670.0113-12−29.1670.0143-13−29.0000.017
3-16−37.6670.0023-13−26.3330.0273-14−30.0000.013
4-6−25.8330.0333-14−36.6670.0023-15−25.6670.034
4-7−26.1670.0313-16−27.8330.0194-024.0000.048
4-8−29.5000.0154-5−24.8330.0374-5−32.0000.008
4-13−25.1670.0384-6−29.6670.0134-6−31.0000.011
4-14−35.5000.0034-7−26.6670.0254-7−34.0000.005
4-16−27.3330.0244-8−30.1670.0114-8−33.0000.007
9-625.8330.0334-14−29.8330.0129-527.0000.026
9-726.1670.0319-624.3330.0419-626.0000.032
9-829.5000.0159-824.8330.0379-729.0000.017
9-13−25.1670.0389-14−24.5000.0409-828.0000.021
9-14−35.5000.00310-623.8330.04510-531.0000.011
9-16−27.3330.02410-824.3330.04110-630.0000.013
10-724.1670.04610-14−24.0000.04410-733.0000.007
10-827.5000.02311-523.8330.04510-832.0000.008
10-14−33.5000.00611-628.6670.01611-026.0000.032
10-16−25.3330.03711-725.6670.03111-534.0000.005
11-627.5000.02311-829.1670.01411-633.0000.007
11-727.8330.02211-14−28.8330.01511-736.0000.003
11-831.1670.010 11-835.0000.004
11-13−26.8330.027 12-524.0000.048
11-14−37.1670.002 12-726.0000.032
11-16−29.0000.017 12-825.0000.039
Table 5. Dimensions and physical properties of the RMW and PP fibers.
Fiber L  1
[mm]
Ø  2
[µm]
δ  3
[g/cm3]
λ  4
[mW/(m·K)]
RMW1–106–9 [16]0.05 [22]32 [23]
PP12310 [24]0.91 [24]16–22 [22]
1  L : length; 2  Ø : diameter; 3  δ : density; 4  λ : thermal conductivity.
Table 6. Sample compositions.
SamplePP Fibers [%]RMW Fibers
[%]
Gypsum [g]Water
[g]
PP Fibers [g]RMW Fibers
[g]
00.000.001000.0700.00.00.0
10.250.25995.0696.52.52.5
20.50992.5694.82.55.0
30.75990.0693.02.57.5
41.00987.5691.32.510.0
50.500.25992.5694.85.02.5
60.50990.0693.05.05.0
70.75987.5691.35.07.5
81.00985.0689.55.010.0
90.750.25990.0693.07.52.5
100.50987.5691.37.55.0
110.75985.0689.57.57.5
121.00982.5687.87.510.0
131.000.25987.5691.310.02.5
140.50985.0689.510.05.0
150.75982.5687.810.07.5
161.00980.0686.010.010.0
Table 7. Inventory of processes and energy consumption inputs.
StageProcessConsumption
[kWh/ton]
Waste recyclingShredding10 [31]
Panel productionMixing, molding, drying
and packaging
4.71 [31]
Disclaimer/Publisher’s Note: The statements, opinions and data contained in all publications are solely those of the individual author(s) and contributor(s) and not of MDPI and/or the editor(s). MDPI and/or the editor(s) disclaim responsibility for any injury to people or property resulting from any ideas, methods, instructions or products referred to in the content.