Article

Silver Purification from Waste for Bio–Sonochemical Synthesis of Ag2O Nanoparticles Using Cannabis sativa Flower Extract

by
Sumita Chailoi
1,
Napat Mahiwan
1,
Chatisa Kansomket
1,
Thanapon Chandakhiaw
1,
Tapany Patcharawit
1,*,
Tanakorn Uthaiphetra
2,
Kiattisak Batsungnoen
2 and
Sakhob Khumkoa
1
1
School of Metallurgical Engineering, Suranaree University of Technology, Muang, Nakhon Ratchasima 30000, Thailand
2
School of Occupational Health and Safety, Institute of Public Health, Suranaree University of Technology, Muang, Nakhon Ratchasima 30000, Thailand
*
Author to whom correspondence should be addressed.
Recycling 2026, 11(7), 128; https://doi.org/10.3390/recycling11070128
Submission received: 4 April 2026 / Revised: 29 June 2026 / Accepted: 15 July 2026 / Published: 19 July 2026

Abstract

Rapidly increasing manufacturing waste intensifies the need for highly efficient and economically feasible waste-to-resource technologies. This research presented an upcycling strategy that transforms silver (Ag)-bearing waste into functional silver oxide nanoparticles (Ag2O NPs) for potential use in biomedical applications. A two-step process of silver purification and the bio–sonochemical synthesis of Ag2O NPs was employed. First, the sequential purification of Ag via melt-refining and electrorefining was utilized to efficiently achieve a silver purity of ≥99.90%. This purification encouraged the recycling of various forms of Ag-bearing waste. Subsequently, the purified Ag was prepared as the precursor for the bio–sonochemical synthesis of Ag2O NPs, using Cannabis sativa SUT CBD12 flower extract as a natural reducing agent. The optimal conditions were adapted from a preliminary test using AgNO3 as the precursor. At initial concentrations of 0.01 M Ag solution, 1 mM PVP solution, and 10 g dried weight of Cannabis sativa SUT CBD12 added to 100 mL DI water, the optimal condition was obtained at the capping agent:reducing agent:precursor volume ratio of 0.6:0.006:1, pH 10–12, under a short sonication time of 2 min. The purified Ag (waste-derived) and AgNO3-derived Ag2O NPs shared similar spherical shapes and sizes of ~100–130 nm. The Ag2O NPs showed antibacterial effectiveness against S. aureus (ZOI of 26–29 mm) and E. coli (ZOI of 16–20 mm). Preliminary observations into the incorporation of Ag2O NPs into polycaprolactone (PCL) to produce electrospun PCL/Ag2O NPs nano fabrics shows a bead-free morphology, raising the possibility of a potential use in wound dressing. Following these preliminary explorations into potential uses and emission controls, a circular design maximizing the use of recycled resources is emphasized.

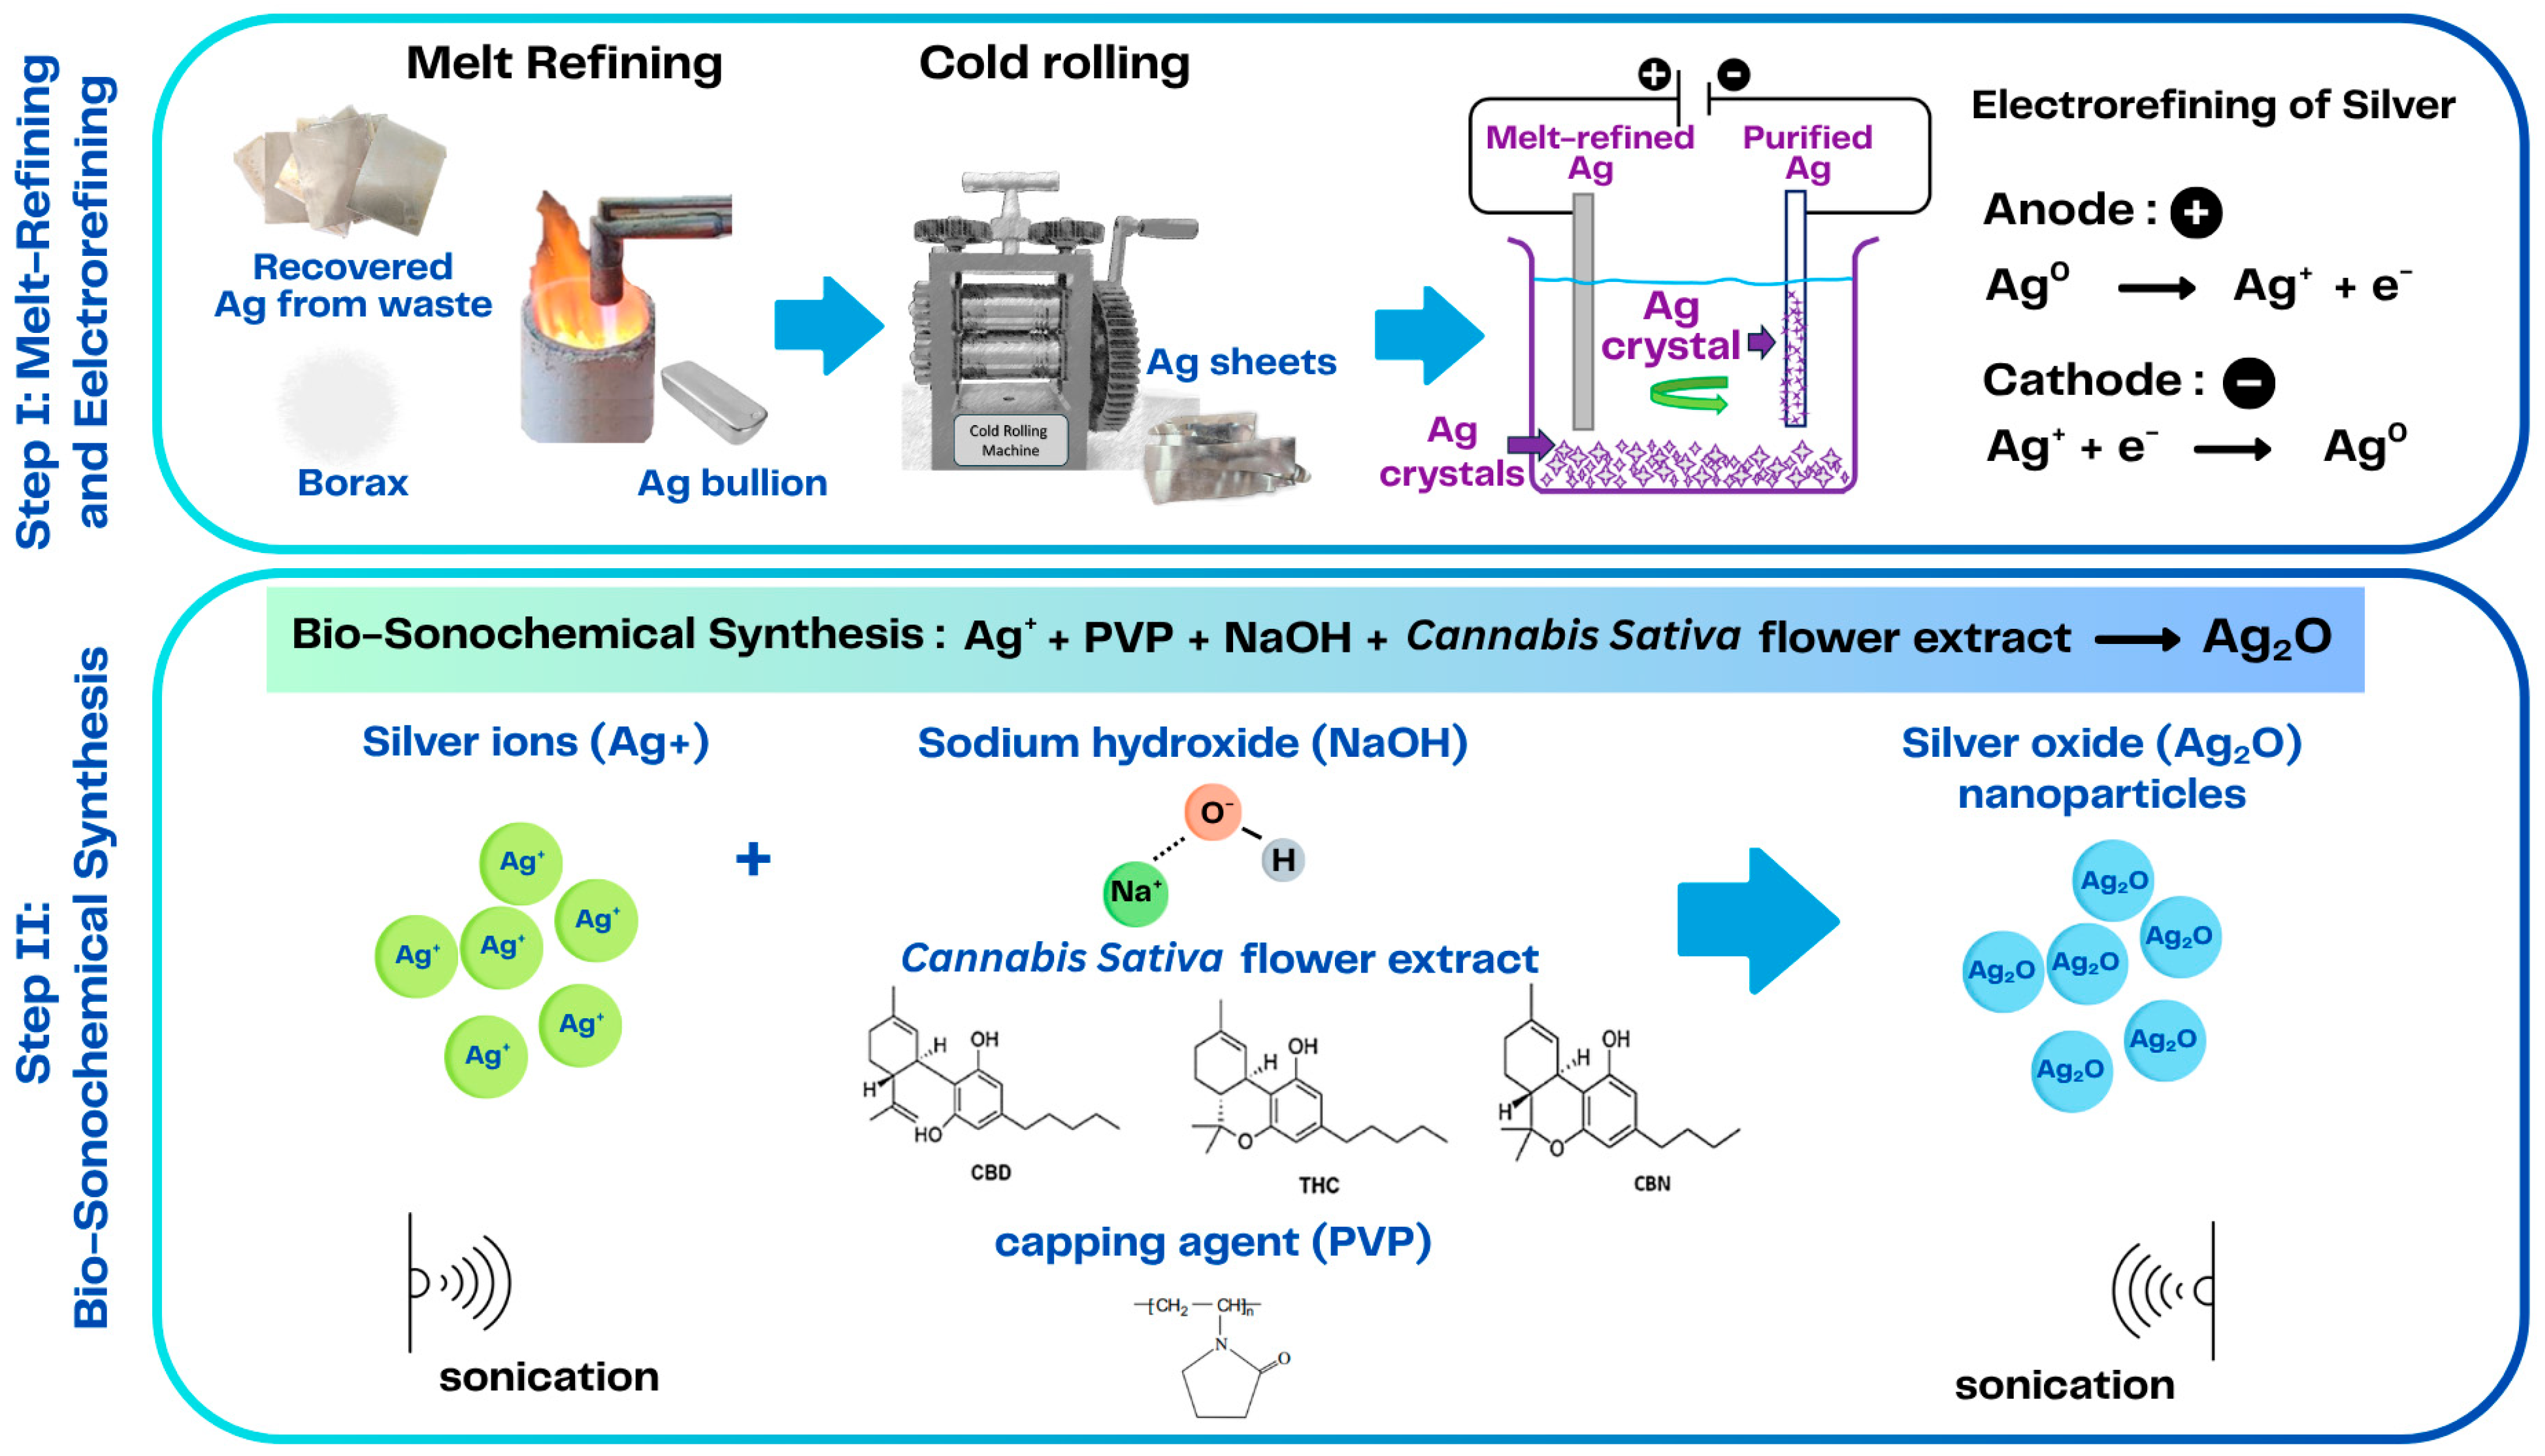
Graphical Abstract

1. Introduction

Silver plating is generally applied across multiple industries such, as electronics parts, automotive and jewelry production, to provide the aesthetic appeal of a bright, reflective finish, superior electrical and thermal conductivity, solderability, and cost-efficiency compared to gold. The waste generated is expected to increase dramatically, with metal containing E-waste valued at around USD 91 billion [1]. With the E-waste management practices reported in 2022, only 60% of the thirty-one billion kilograms of metals could be recovered. Silver as the major precious metal in E-waste accounted for 120,000 kg, while only 20% of the overall precious metals (Ag, Au, Pt, Pd, Rh and Ru) were reported to be recovered. Therefore, the waste generated in industries and end-of-life products containing high-grade secondary resources makes “urban mining” economic and environmentally essential. This leads to the proposition of the circular economy framework to transform these liabilities into challenging high-value products [2].
Generally, precious metals can be selectively recovered via hydrometallurgical processes, including leaching, solvent extraction, ion exchange and precipitation. The electrochemical process involves chemical reactions driven by electricity to recover metal from waste. Electrowinning and electrorefining could be effectively employed to impart a higher purity for greater-value products suitable for resale or further use. High purity is therefore important, especially for biomedical and electrical applications.
The upcycling of silver-containing waste to high-value products such as silver or silver oxide nanoparticles (Ag/Ag2O NPs) is of interest specifically in the context of antimicrobial wound dressings. Ag/Ag2O NPs could disrupt bacterial cell membranes and induce oxidative stress, providing broad-spectrum activity against multidrug-resistant pathogens [3,4]. Specifically, they exhibit a multi-target mechanism that lowers antibiotics resistance compared to conventional ones [5], preventing infection, accelerating healing, and reducing inflammation [6,7]. To ensure biocompatibility and prevent rapid aggregation, polyvinylpyrrolidone (PVP: ((C6H9NO)n) is utilized as a capping agent. PVP provides steric stabilization by forming protective polymeric layers around the silver nuclei, ensuring long-term colloidal stability, a prerequisite for clinical wound healing [8].
Plant-mediated synthesis offers sustainable chemical reduction alternatives via the phytochemicals in plant extracts, primarily phenolics, flavonoids, and terpenoids, which act as dual reducing, capping and stabilizing agents. The hydroxyl groups (-OH) in these compounds donate electrons to reduce silver ions (Ag+) into metallic silver (Ag0) or Ag oxide (Ag2O) [9,10]. This is followed by the nucleation phase, where atoms cluster to form nanoparticles and are subsequently capped by organic molecules to prevent further crystal growth. Cannabis sativa SUT CBD12 extract is particularly promising due to its high content of cannabinoids and polyphenols, providing a robust biochemical environment for high-yield reduction [11,12]. In this research, to achieve precise control over particle size and morphology, sonication assistance was integrated with biosynthesis. The sonication enables acoustic cavitation; the formation, growth, and subsequent implosive collapse of micro-bubbles in a liquid medium [13,14]. The reduction is promoted at the nanoscale, by breaking down molecular clusters and enhancing mass transfer [15]. This notably reduces the reaction time and gives more monodispersed nanoparticles compared to stirring [14].
Various plant-mediated processes of synthesis using clove, Aloe vera, Lantana camara L. Syzygium cumini and weed plant [16,17,18,19], with/without sonochemistry, have been studied. A significant gap remains in relation to synergy studies using Cannabis sativa flower extract as the reducing agent under sonication, which is now defined as a bio–sonochemical synthesis system. Cannabis sativa ‘CBD Suranaree 12’ (SUT CBD12) is a variety bred by Suranaree University of Technology (SUT) Farm for medical and therapeutic purposes. It contains 14–20% dry weight cannabinoid (CBD), which is a non-psychoactive compound, and strictly low levels of tetrahydrocannabinol (THC) of <0.1–0.5%. Its therapeutic properties such as pain relief, anti-inflammation, antioxidant and antimicrobial effects make it favorable for would healing, thus attracting great interest as a reducing agent. Another aspect is that analytical reagent (AR)-grade silver nitrate (AgNO3) is mostly used as the precursor, while recycled and purified silver has not been explored. With an effective Ag purification technique, this study provides a practical waste valorization pathway, unified with an optimized bio–sonochemical approach to give biomedical Ag2O NPs.
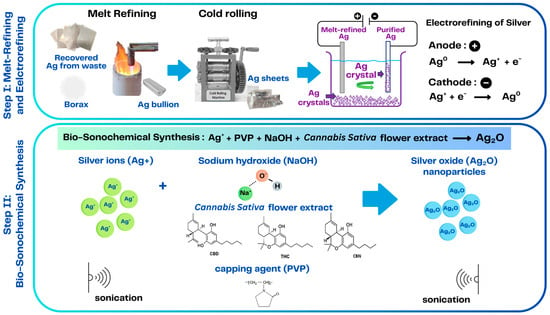
This research thus focuses on upcycling the silver recovered from manufacturing waste through purification followed by bio–sonochemical synthesis to produce Ag2O NPs potentially useful for biomedical ends, such as wound dressing. The electrowon silver recovered from the spent Ag plating solution obtained from a previous work [20] was the main source. It should be noted that Ag from other sources can also be used, such as that recovered from Ag fingers from EOL solar panels via pyro-hydrometallurgy processes [21,22]. The purification process started with melt-refining to allow the remelting and refining of Ag from all recoverable sources. This was followed by electrorefining to ensure high purity Ag as the starting material for the bio–sonochemical synthesis of Ag2O NPs. Pure Ag is highly expensive, and thus we could not use it for a direct comparison in the synthesis of Ag2O NPs using similar Ag metal sources. Therefore, a preliminary study was first conducted using AR-grade AgNO3 as a precursor. This allowed the determination of optimal synthesis conditions regarding the addition ratios of Cannabis sativa flower (SUT CBD12) extract and PVP, and the precursor pH. The synthesis of Ag2O NPs from Ag purified from waste under the optimal conditions could then be pursued.
The key benefits or novelty of this research involve providing an alternate pathway by turning Ag-containing waste into up-valued Ag2O NPs using the proposed two-step process. The first step was Ag purification via melt-refining plus electrorefining. The subsequent bio-sonochemcial synthesis was undertaken using Cannabis sativa flower extract integrated with bio-chemical reduction and sonication. Following these preliminary observations on potential use and emission control, the Ag2O NPs products could also find potential uses in other areas, to be further explored.

2. Results

2.1. Silver Purified by Melt-Refining and Electrorefining

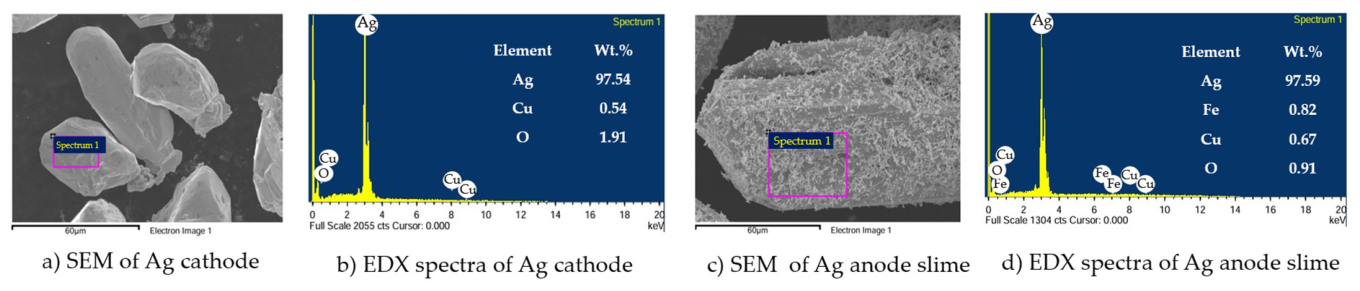
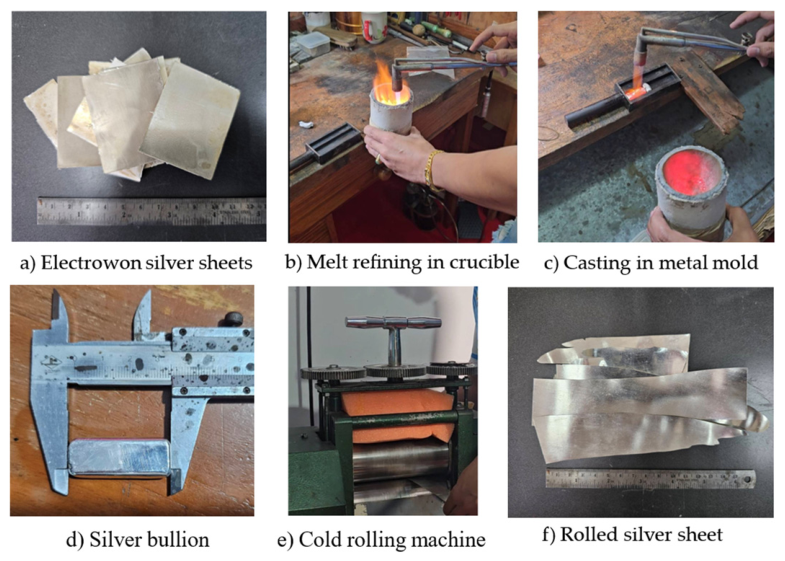
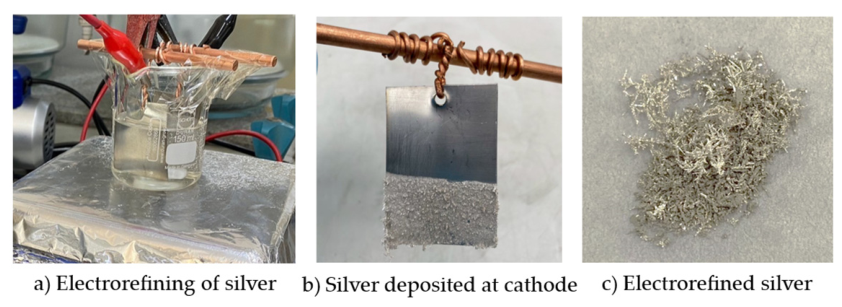
The electrowon Ag sheets used in this research were recovered from spent Ag plating solution [20], with an initial purity of 98.55%. When subjected to melt-refining, the Ag melt was wadded with 1 wt.% borax to actively scavenge oxides and contaminants while in the crucible. As demonstrated in Figure 1a–f, the solidified Ag bullion was removed from a rectangular metal mold and cold-rolled to produce 1 mm-thick Ag sheets. The purity increased to 99.93% after melt-refining, as shown in Table 1. For further purification, an electrorefining cell was set resembling the Moebius cell [23], using the cold-rolled Ag sheet as the anode. Under electrorefining, the Ag from the anode was dissolved in the electrolyte (120 g AgNO3/L concentration) [24] and deposited at the stainless steel cathode as the purified Ag, as shown in Figure 2a–c. Using stainless steel as the cathode sheet material allowed the readily retrieval of Ag deposited at the cathode. Observation by SEM revealed the morphology of the Ag cathode, as demonstrated in (Figure 3). EDS point analysis in some areas indicated Ag (97.54 wt.%) as the main element, with minor impurities, such as Cu (0.54 wt.%) and O (1.91 wt.%). The oxygen content may have been due to the oxidation of the Ag on its surface. The anode slime contained Ag with impurities such as iron (Fe), Cu and O. It is noted that the high Ag content (97.59 wt.%) detected from the anode slime also showed further recyclability potential. The quantitative analysis of the Ag purity of the Ag-containing products obtained from each step of the recovery and purification process can be found in Table 1, as derived via the ICP-OES technique.
The chemical compositions of Ag-containing products after electrowinning, melt-refining and electrorefining were quantitatively analyzed via ICP-OES, as compared in Table 1. The electrowon Ag contained 0.460 wt.% copper (Cu), 0.51 wt.% aluminum (Al) and 0.44 wt.% sodium (Na). The melt-refining reduced the Cu content to 0.072 wt.%, while Al and Na contents were reduced to less than the detection limit of the equipment. As a result, the melt-refining could increase the silver purity from 98.55% (after electrowinning) to 99.93% after melt-refining. Subsequently, electrorefining further reduced the Cu content from 0.072% (after melt-refining) to 0.062%, giving a silver purity of 99.94%.
The Ag after electrowinning is related to the initial sample prior to melt refining. The degree of Ag recovery after melt-refining was found to be 98.99%, according to Table 2 and Equation (1), where WAg (electrowinning) and WAg (melt-refining) are the weights of Ag after electrowinning and melt-refining, respectively.
%   R e c o v e r y   ( melt- r e f i n i n g ) = W A g   ( e l e c t r o w i n n i n g ) W A g   ( melt- r e f i n i n g ) × 100
For electrorefining, the process is relevant to the purification of the sample that has progressively been subjected to electrowinning, and melt-refining. In the electrorefining stage, the silver’s dissolution at the anode and the simultaneous reduction of silver at the cathode are expressed in Equations (2) and (3) [23], while the % recovery for electrorefining is addressed in Equation (4).
D i s s o l u t i o n   a t   a n o d e : A g 0 A g + + e
R e d u c t i o n   a t   c a t h o d e : A g + + e A g 0
%   R e c o v e r y   ( e l e c t r o r e f i n i n g ) = W A g   c a t h o d e   W A g   a n o d e   l o s s × 100
The recovery of the electrorefined silver is determined by the weight of the silver cathode (WAg cathode) relative to the weight of silver loss at the anode (WAg anode loss), according to Equation (4). The recovery was 97.30%, as shown in Table 3. With a satisfactory recovery rate and sufficiently high purity, the purified Ag was acceptable for precursor preparation in NP synthesis.

2.2. Ag2O NPs by Bio-Sonochemcimal Synthesis

2.2.1. Characterization of Cannabis sativa ‘CBD Suranaree 12’ (SUT CBD12) Flower Extract

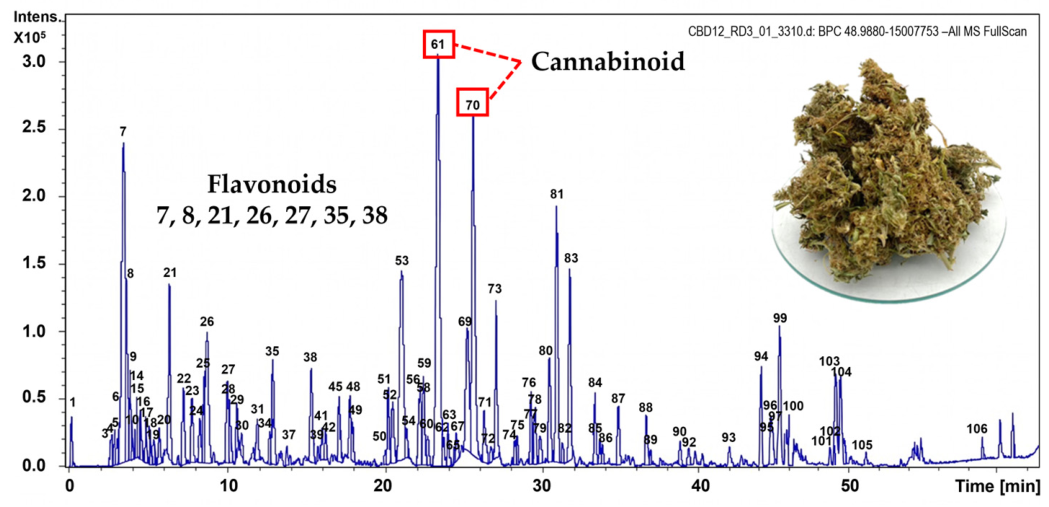
The SUT CBD12 flower extract used as the reducing agent tested via qualitative profiling via mass spectroscopy (Q-TOF MS) is shown in Figure 4. The base peak chromatogram (BCP) identified bioactive compounds of high concentrations of Cannabidiol (CBD), with other major constituents such as ∆9-THC, CBG, and key flavonoids including Quercitrin and Tiliroside. The high intensity of peaks 61 and 70, identified as cannabinoids, correlates with the extract’s reductive capacity. These phytochemical phenolic and cannabinoid groups could serve dual purposes in Ag2O NPs synthesis. They could act as reducing agents that convert Ag+ ions to Ag0/Ag2O and function as capping agents, giving steric stabilization. The synergistic interaction between cannabinoids and flavonoids might help to facilitate efficient reduction while preventing the aggregation of the synthesized Ag/Ag2O NPs [25,26,27].

2.2.2. Effects of Synthesis Variables on Ag2O Nanoparticle Synthesis

A preliminary investigation allowed the predetermination of synthesis parameters using the AN grade AgNO3 precursor (0.01 M AgNO3). The effects of PVP (1 mM concentration) and SUT CBD12 flower extract addition (10 g/100 DI water), and the precursor’s pH, on Ag2O NPs synthesis were first observed. The initial pH of the precursors was 0.3–0.4 and changed to ~0.5 after synthesis. The addition of PVP at (5–30 mL) to 25 mL AgNO3 precursors decreased the final concentration of AgNO3 in the mixed solution from 0.00833 M to 0.00455 M. The PVP concentration increased from 0.00017 M to 0.00055 M. Details are provided in Table A1, Appendix A. The PVP:AgNO3 precursor volume ratio increased from 0.2:1 to 1.2:1. The addition of SUT CBD12 flower extract to the AgNO3 precursor gave reducing agent to precursor ratios of 0.002:1, 0.004:1, 0.006:1, and 0.008:1, as listed in Table A2, Appendix A.
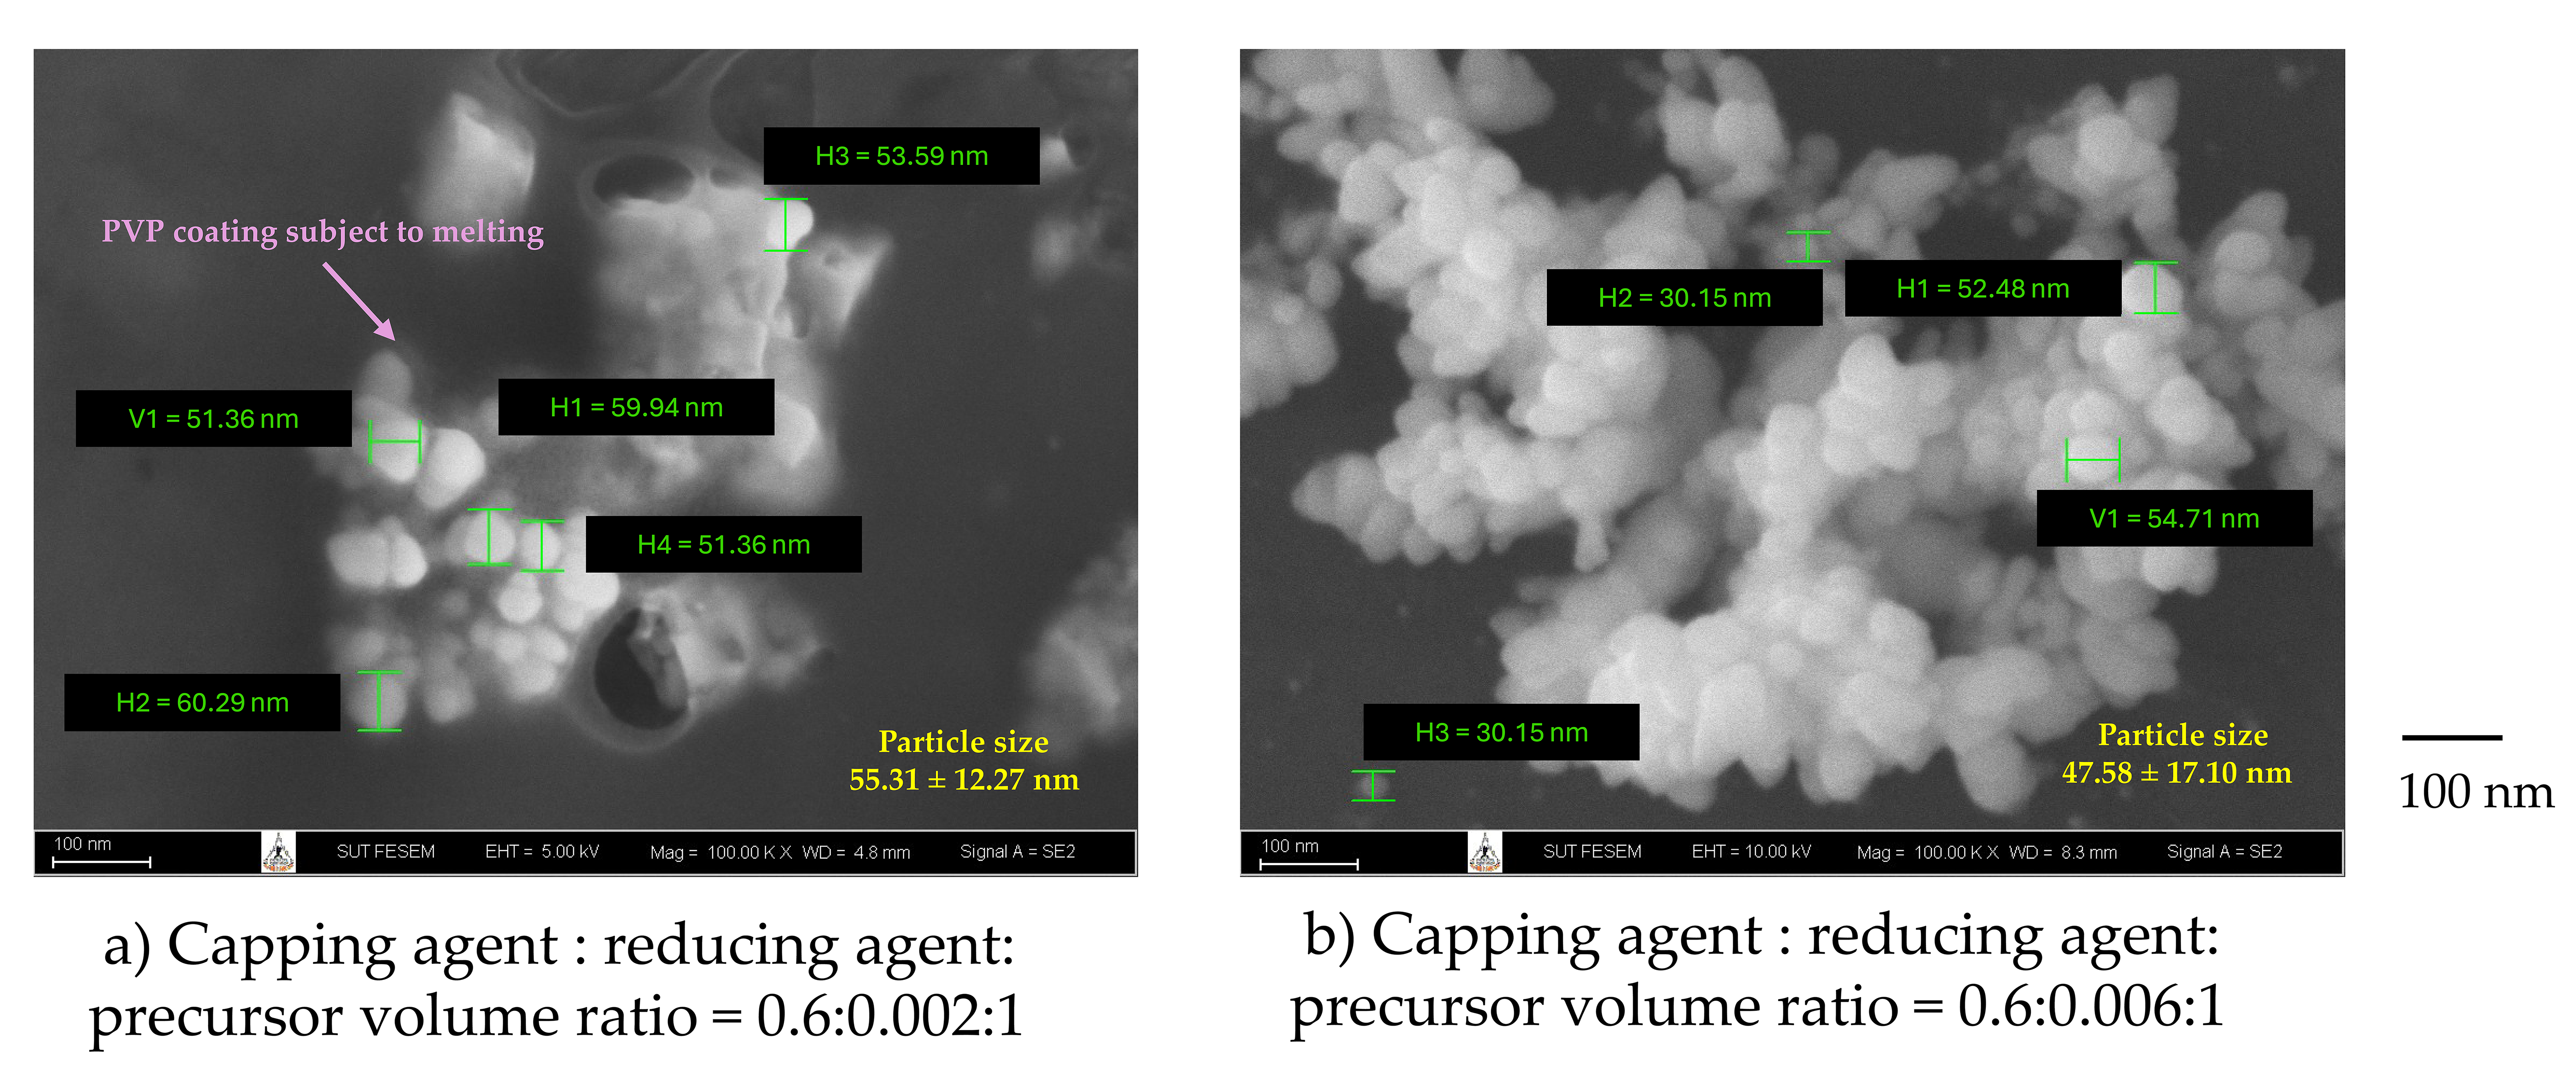
For preliminary results derived without precursor pH adjustment, variations in PVP and SUT CBD12 flower extract additions gave only small amounts of NPs, observed with irregular shapes. At a low pH, a level of reducing agent addition lower than the addition range could not induce Ag reduction. Within the addition range, only small amounts of NPs were observed, with sizes ranging from 34.12 ± 10.28 nm to 47.58 ± 17.10 nm. A thick PVP coating was observed at low reducing agent addition levels when the volume of 1 mM PVP was fixed (15 mL). At a capping agent to reducing agent to precursor ratio of 0.6:0.002:1, as shown in Figure 5a, the PVP coating on the NPs’ surfaces was observed starting to melt under FE-SEM. This led to undesirable agglomeration and cleaning difficulties for the NPs. As the amount of reducing agent increased, at the capping agent to reducing agent to precursor ratio of 0.6:0.006:1, clearer NP surfaces were observed, as shown in Figure 5b. Thereby, the capping agent to reducing agent to precursor volume ratio was set at 0.6:0.006:1 in order to study the effects of precursor pH on NP synthesis.
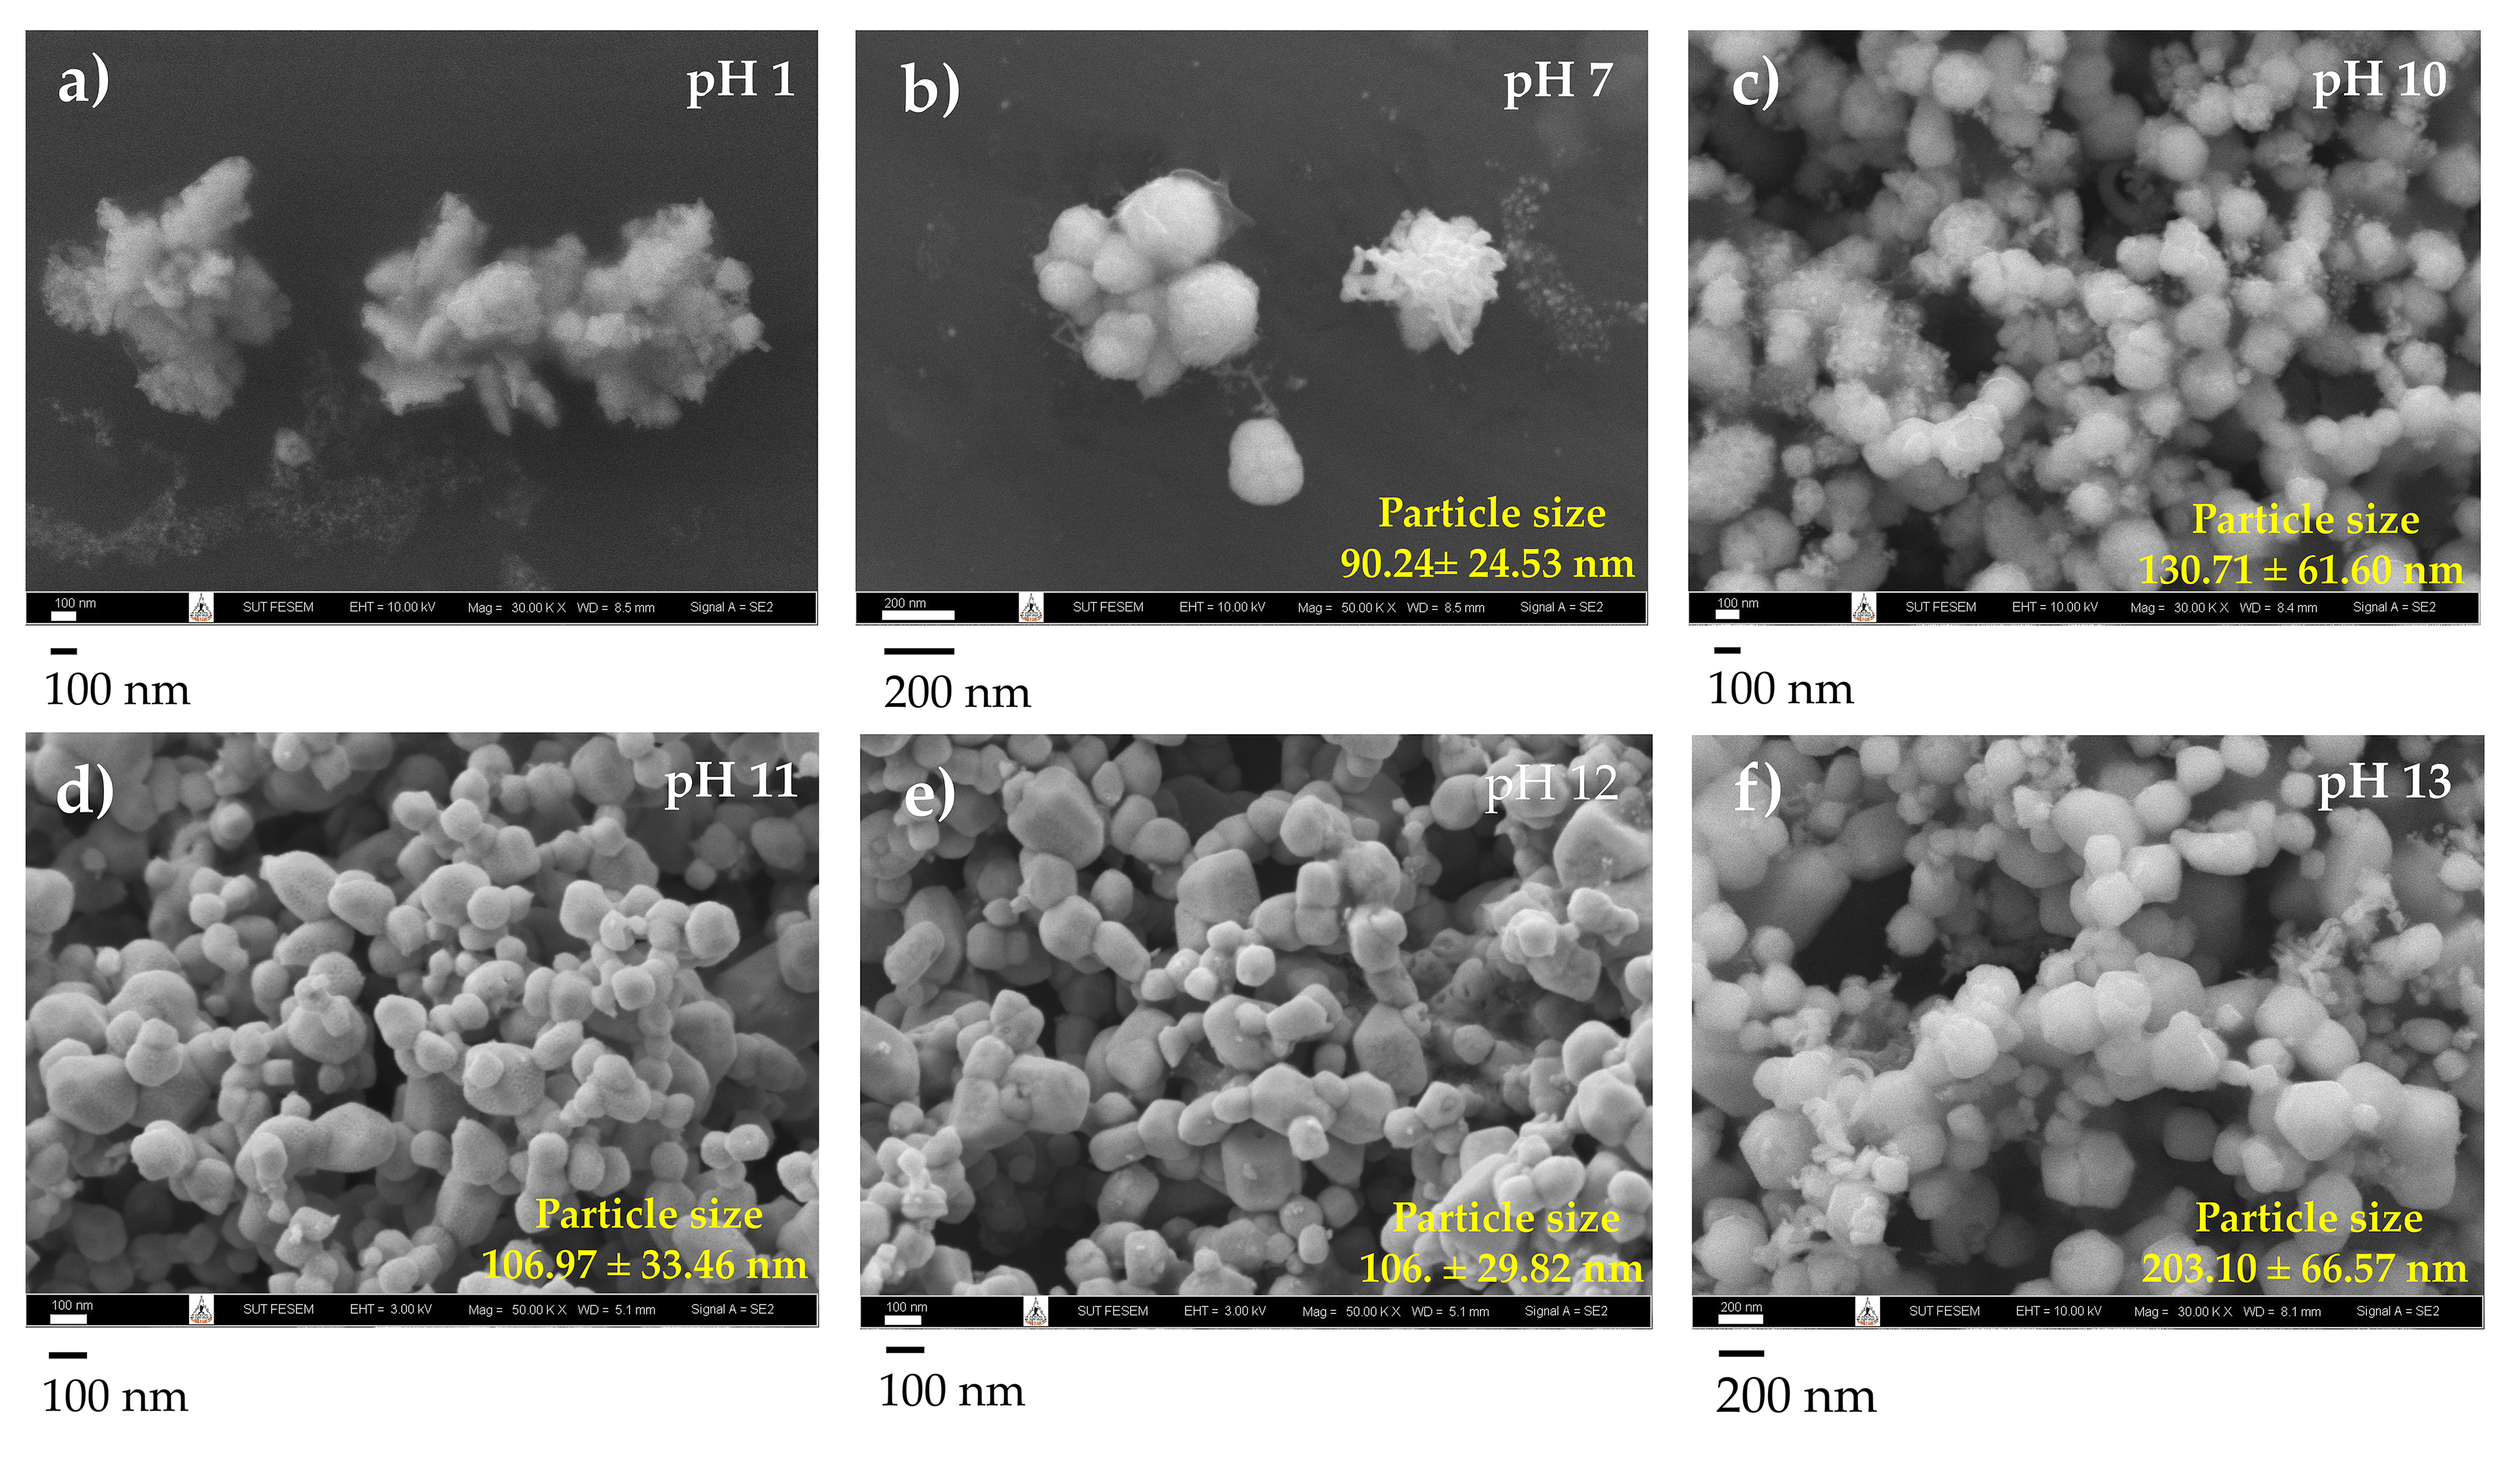
The precursors’ pH (1–14) has shown a critical role in Ag2O NPs formation, influencing the final size, morphology, and uniformity. As shown in Figure 6, after synthesizing at pH 1, the irregular structures were predominant, but in low amounts. An acidic medium might not help to facilitate the reduction n Ag+ ions, and might limit the nucleation. t pH 7–8, these neutral conditions slightly increased Ag reduction with increasing OH. The NPs appeared more spherical, at 80–90 nm in size. A strong alkaline (pH ≥ 10) context, however, enhanced the reduction in Ag+ ions, which promoted abundant nucleation. Prevalent amounts of Ag2O NPs were successfully derived with particle sizes of 100–130 nm in a pH range of 10–12. The Ag2O NPs reached excessively large sizes at pH 13–14. Therefore, a higher solution pH (10–12) promoted the reduction rate and yielded more uniform and spherical NPs of significantly larger sizes than those obtained at low pH (<7). Therefore, following the preliminary test, the optimal conditions were determined as a capping agent to reducing agent to precursor ratio of 0.6:0.006:1 at pH 10–12. This is based on the presence of high volumes of NPs with spherical shapes and minimal surface coating to prevent particle agglomeration.

2.2.3. Bio-Sonichemical Synthesis of Ag2O NPs Using Purified Silver from Waste

Since the high cost of pure Ag metal limits a direct comparison between pure Ag and purified Ag from waste as the precursor, the optimal conditions when using the AN-grade AgNO3 precursor from Section 2.2.2 were chosen. However, it should be noted that precursor preparation using the purified Ag from waste required greater HNO3 consumption to completely dissolve the solid Ag crystal (Figure 2c), as compared to the precursor prepared using AN-grade AgNO3. It therefore required more NaOH to reach the required pH of the precursor.
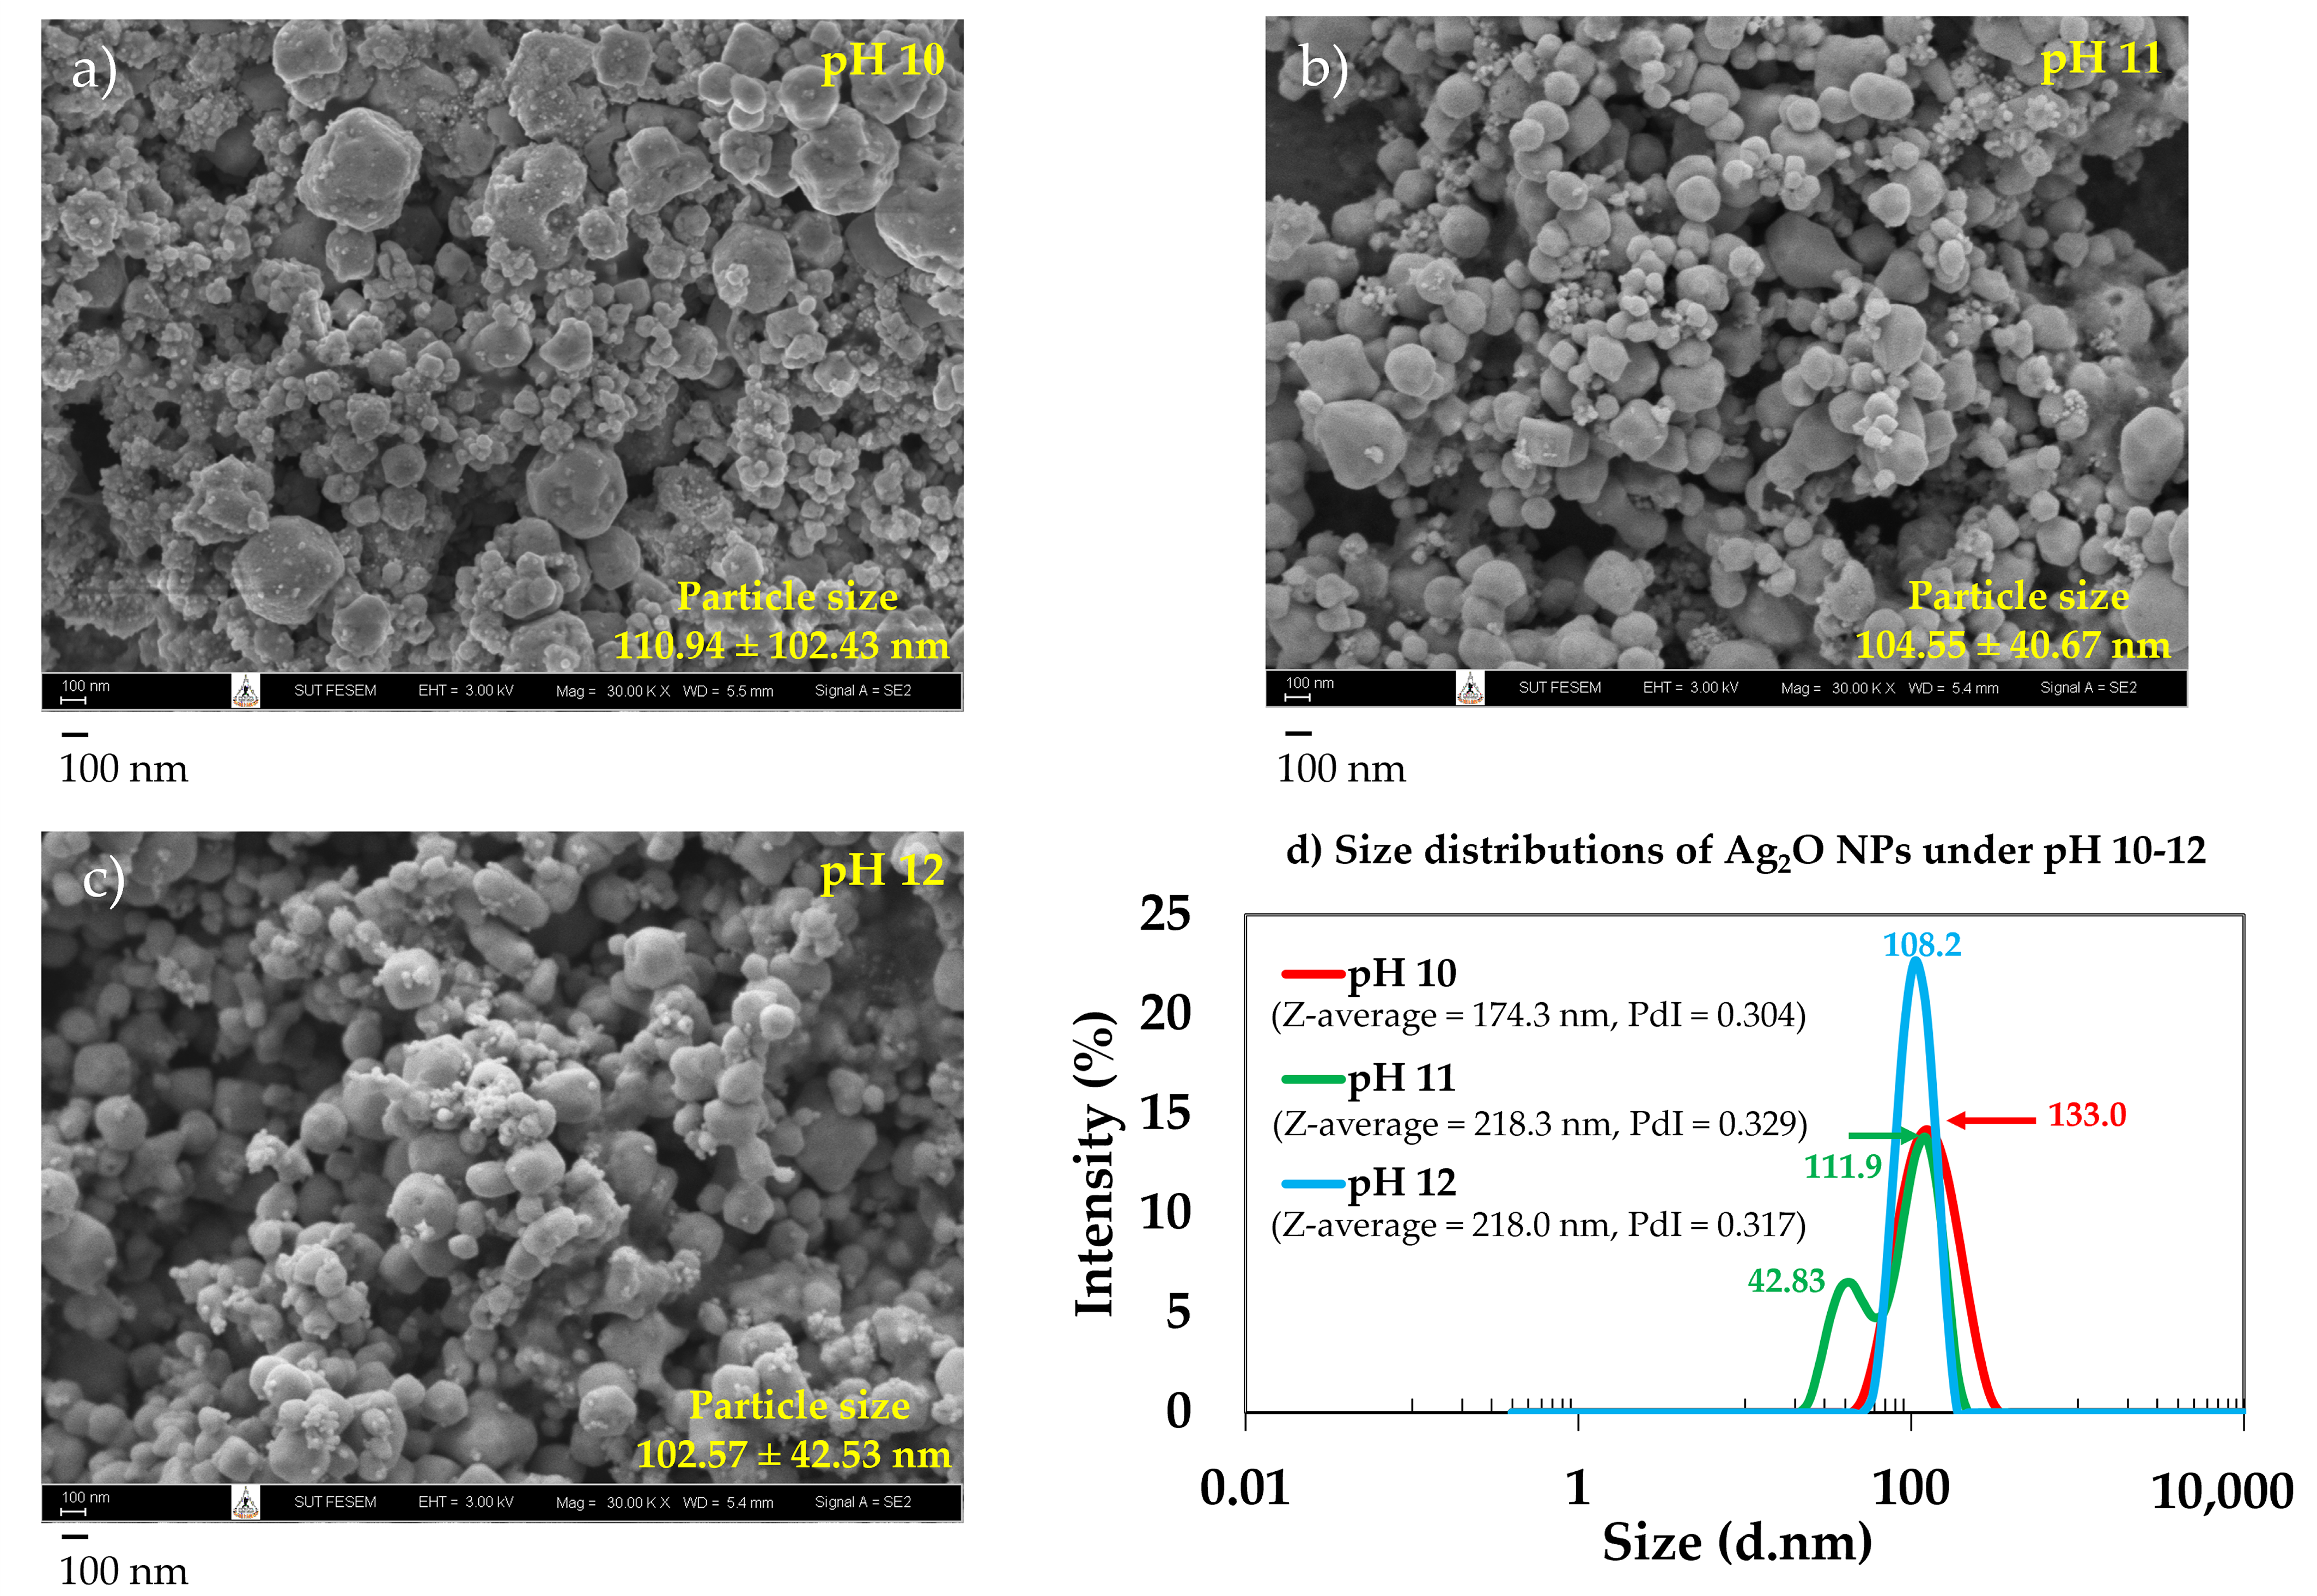
Upon bio–sonochemical synthesis at pH 10, 11, and 12, a similar capping agent to reducing agent to precursor ratio of 0.6:0.006:1 was employed for the waste-derived Ag2O NPs. This was based on optimal conditions obtained from the AR AgNO3-derived NPs. Similarly, earth brown nanoparticles were obtained after cleaning, and dried. Figure 7a–c illustrates the Ag2O NPs synthesized at pH 10, 11 and 12. The waste-derived Ag2O NPs exhibited near-spherical shapes, with sizes ranging from 102.57 ± 42.53 nm to 110.94 ± 102.43 nm. The measurements were taken from SEM images of at least 150 particle populations, using the ImageJ software.
Figure 7d illustrates the particle size distributions obtained using Dynamic Light Scattering (DLS) analysis. Similar particle sizes (peak size) were found of approximately 108.2–133 nm at pH 10–12. This result corresponds to the measurements taken from SEM images, which were 102.57 ± 42.53 nm to 110.94 ± 112.43 nm. A bimodal distribution of two distinct peaks (42.83 and 111.9 nm) was found, suggesting clusters of large and smaller Ag2O NPs, especially under pH 11. This corresponded to the SEM results. Small nanoparticles (~12 nm) were observed decorating the larger particles. The Z-average values of the Ag2O NPs, as detailed in Table A3, Appendix A, are larger than those indicated by SEM. This might be due to the agglomeration of particles with slightly low surface charges in the media solution [28,29]. However, the zeta potential has not been included in this research, which indicates colloidal stability. Future work might be required to confirm this explanation.
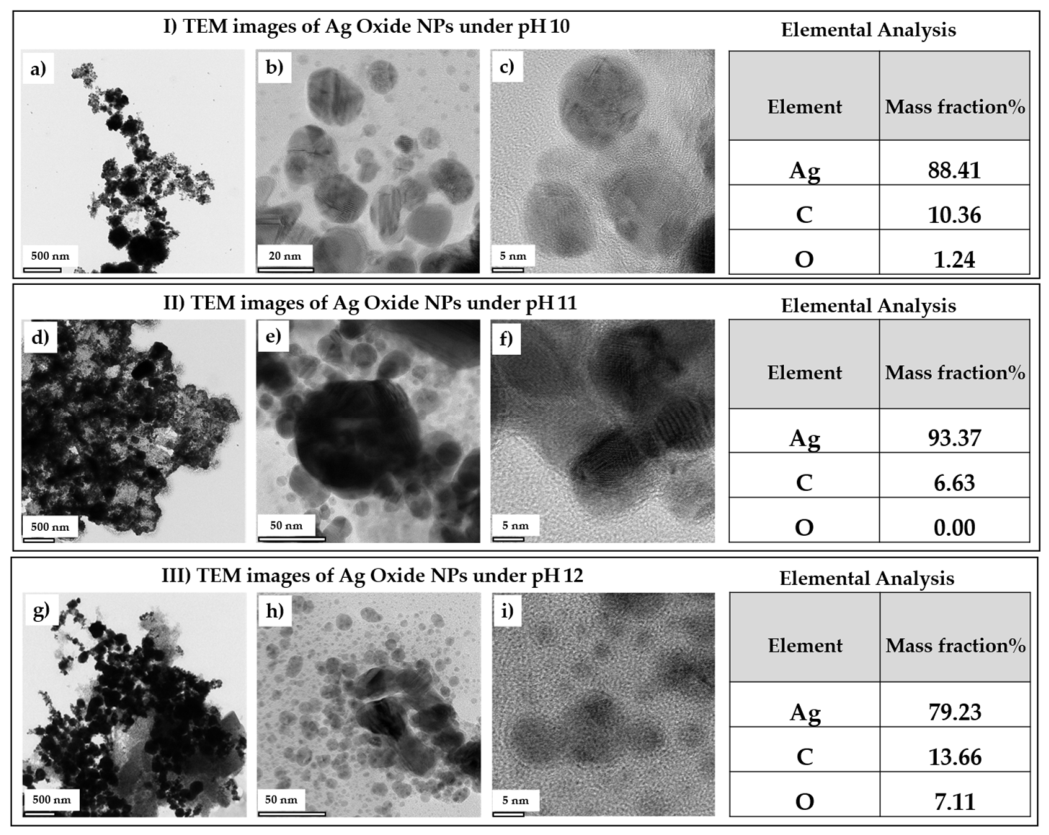
Figure 8 reveals TEM images of Ag2O NPs synthesized at pH 10, 11, and 12 at low to higher magnification. High magnification revealed small particles surrounding larger ones. The elemental analysis showed Ag contents of 79.23–88.41 wt.%. The minor elements were oxygen (O) and carbon (C), plausibly related to the oxide form and the capping agent that remained present on the surface, respectively. According to the SEM and TEM analysis, it might be that both the pH adjustments followed by reducing agent addition facilitated the Ag ion reduction. It is interesting to explore the synthesis mechanism of the Ag2O NPs derived in this research. However, more experimental work is required to quantify the reduction capabilities of the two. This could be explored in future work.
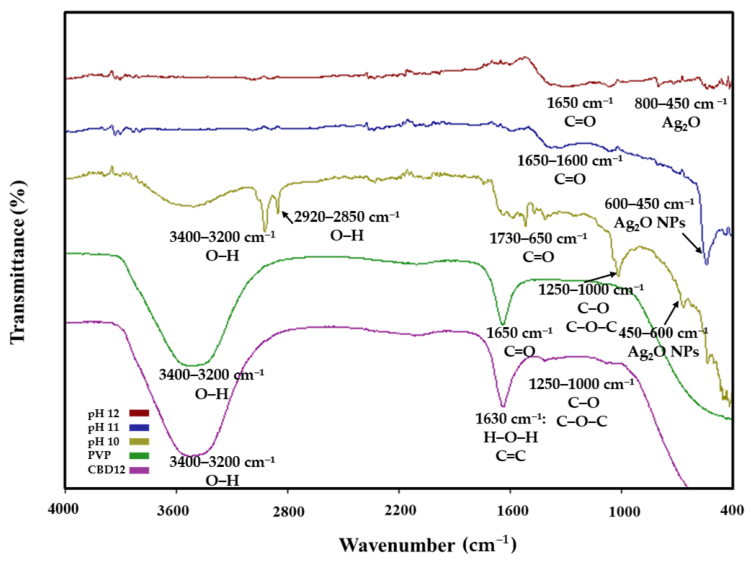
Figure 9 shows the FT-IR spectra of the synthesized Ag2O nanoparticles (Ag2O NPs) in comparison with the CBD12 reducing agent, PVP capping agent, and Ag2O NPs prepared at pH 10, 11, and 12. The broad absorption band observed at 3400–3200 cm−1 corresponds to the O–H stretching of hydroxyl groups. The distinct peaks at 2920–2850 cm−1 can be assigned to the O–H stretching vibrations of aliphatic groups. The bands at 1250–1000 cm−1 can be attributed to C–O stretching in aromatic rings for the CBD12 flower extract. The band at 1650–1630 cm−1 was assigned to the carbonyl (C=O) stretching of PVP overlapping with the bending vibration of adsorbed water (H–O–H) on the nanoparticle surface. Moreover, the retention of the carbonyl bands within 1730–1600 cm−1 indicates that PVP remained bound to the NPs surface, acting as a capping agent. Crucially, the appearance of the absorption bands at 600–450 cm−1 (for pH 10 and 11) and 800–450 cm−1 (for pH 12) was assigned to the metal–oxygen (Ag–O) stretching vibration, confirming the formation of Ag2O NPs.
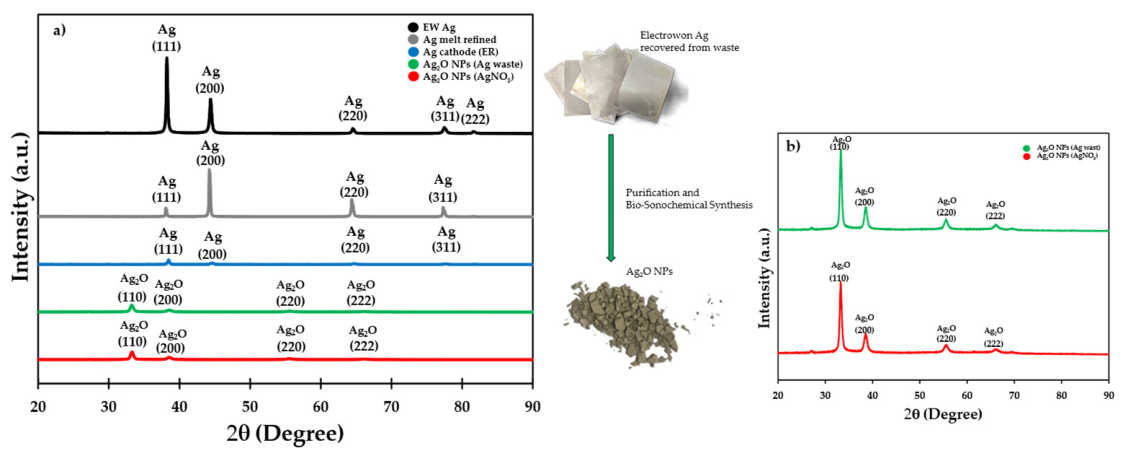
Finally, the XRD results also confirm Ag2O’s existence as the major phase, as shown in Figure 10a, with the separate XRD of Ag2O NPs shown in (b). The metallic silver (Ag0) phases including electrowon (EW) Ag (black), melt-refined Ag (grey), and Ag cathode (blue) samples exhibit sharp diffraction peaks at 2θ values of approximately 38.1°, 44.3°, 64.4°, 77.4°, and 81.5°, corresponding to the (111), (200), (220), (311), and (222) crystal planes, respectively. These diffraction peaks are characteristic of highly crystalline face-centered cubic (FCC) metallic silver (reference card 87-0720). The Ag2O NPs synthesized using Ag purified from waste (green) and AgNO3 (red) exhibit a distinct set of diffraction peaks at 2θ values of approximately 32.8°, 38.1°, 54.9°, and 65.5°, corresponding to the (110), (200), (220), and (222) planes of cubic Ag2O. The appearance of Ag2O diffraction peaks confirms the formation of the Ag2O NP phase (reference card 01-1041).

2.3. Potential Applications and Emission Control Aspects of Ag2O NPs

2.3.1. Antibacterial Efficacy of Ag2O NPs

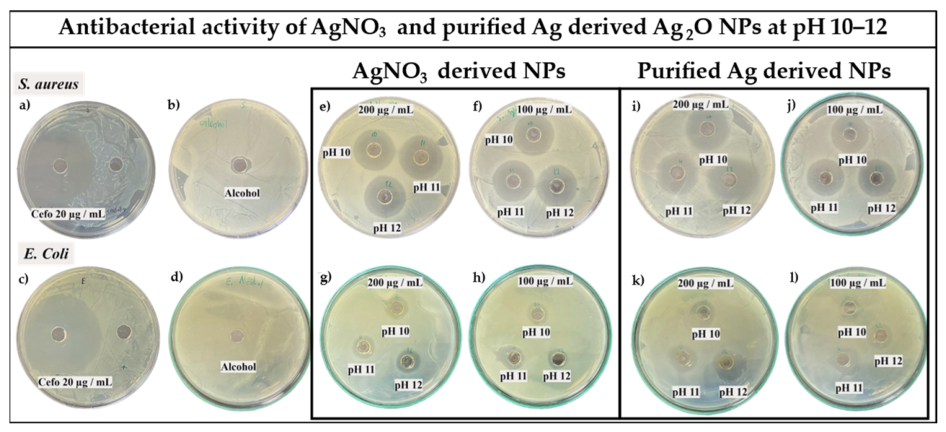
The Ag2O NPs, as shown in Figure 11, exhibited similar inhibitory effects over 6.25–200 µg/mL against S. aureus (+) and E. coli (−). At high concentrations (50–200 µg/mL), both yielded ZOIs of 26–29 mm for S. aureus and 16–20 mm for E. coli. As compared to previous reports [26], the ZOIs were 8–18 mm at 1 × 10⁸ CFU/mL, while the cannabis-derived Ag2O NPs in this study gave ZOIs of 16–20 mm against 106–107 CFU/mL. The lower susceptibility of E. coli compared to S. aureus might be due to the complex outer membrane barrier of Gram-negative bacteria, which regulates Ag+ ion penetration [30]. The ZOIs of Ag2O NPs tested against E. coli and S. aureus are detailed in Table A4, Appendix A.

2.3.2. Electrospun Wound Dressing Incorporated with Ag2O NPs

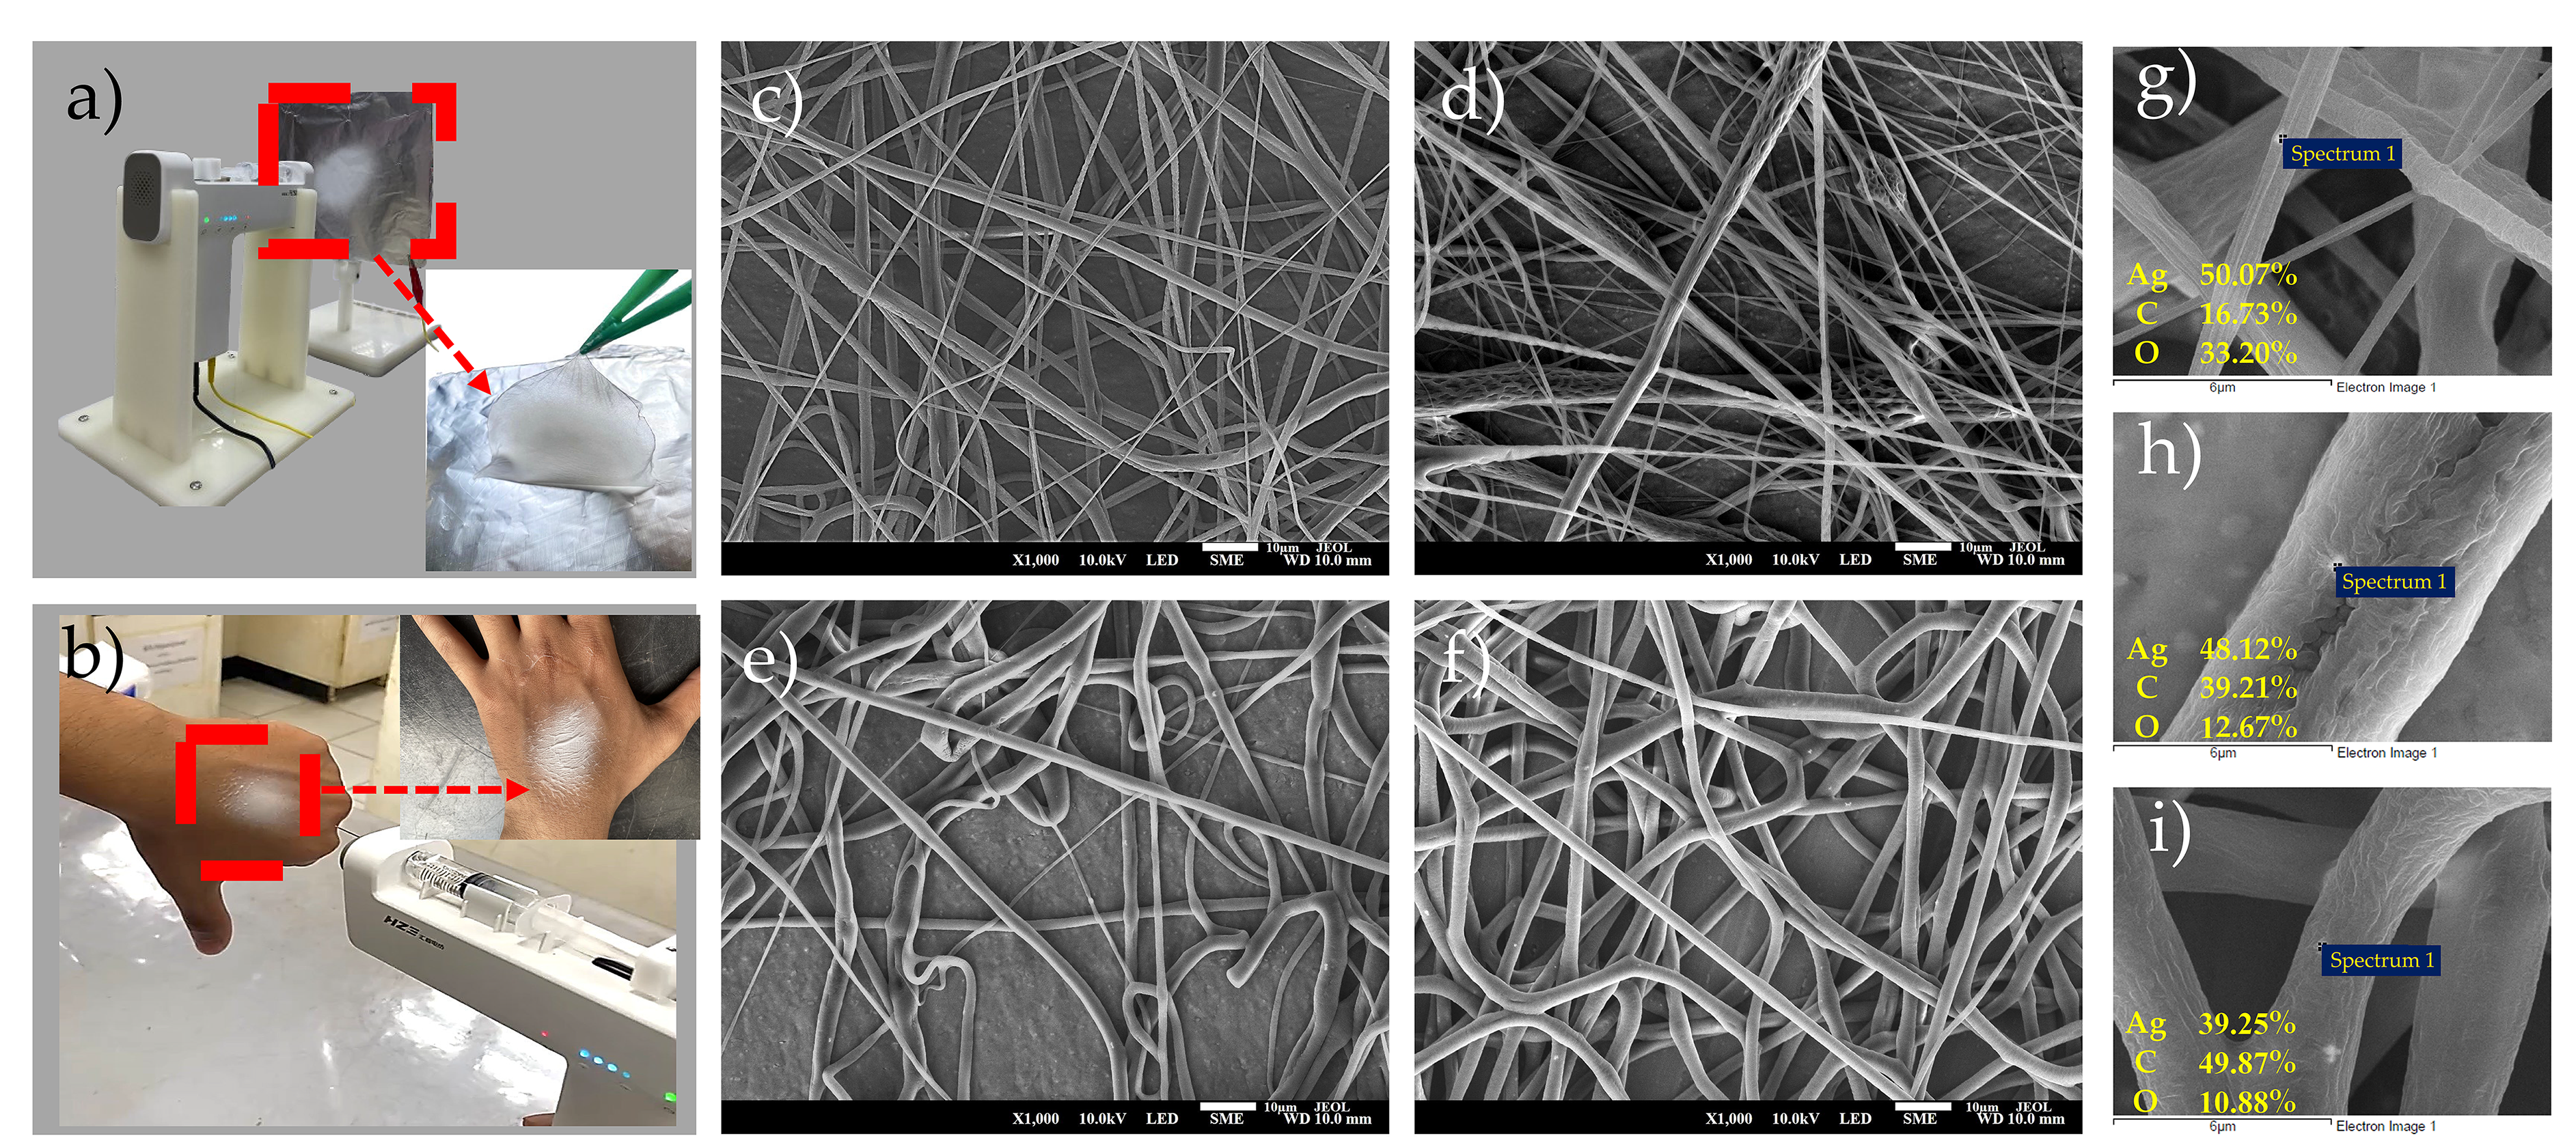
The electrospun PCL/Ag2O NP nanofibers revealed the influence of pH on fiber morphology. Neat PCL fibers (Figure 12c) and PCL/Ag2O NPs synthesized at pH 10 exhibited smooth, continuous, and bead-free structures with uniform diameters, indicating optimal solution viscosity and nanoparticle dispersion to give effective gas exchange while injecting [31]. However, increasing the pH to 11 and 12 (Figure 12e–f) led to larger and less uniform fiber diameters, localized swelling, and fiber fusion. All this might have affected the viscosity and electrical conductivity of the spinning solution, thereby reducing jet stretching efficiency. This is also consistent with the reports in [6,32]. The EDS analysis confirmed the presence of Ag, C, and O elements in particles observed on fabrics as shown in Figure 12g–i. More work is required for further improvement.

2.3.3. Emission Evaluation of Bio–Sonochemical Synthesis

According to real-time aerosol monitoring using a GRIMM 11-D Dust Decoder [33], the mass concentrations of PM10, PM2.5, and PM1 remained negligible (≈0 µg/m3) throughout the synthesis cycles, and were well below the instrument’s detection limit (0–100 mg/m3). The particle count analysis showed only baseline levels of sub-micron particles (<0.25 µm), which were within the instrument range (up to 5.3 × 10⁵ particles/L), and with no significant spikes indicating aerosolized Ag2O NPs. Additional nanoparticle sampling (NPS) using a 25 mm polycarbonate filter (0.8 µm pore size) at 0.3 L/min further confirmed that there was no airborne nanoparticle release. The findings suggest that liquid-phase synthesis, combined with effective PVP capping, retains Ag2O NPs within the suspension, and minimizes inhalation risks. This aligns with the reported safety advantages of plant-mediated synthesis [34].
Monitoring noise levels during sonication (45 kHz) revealed sound pressure levels ranging from 76.0 to 80.6 dBA, with a mean value of 78.4 dBA. These levels, quantified using a RION NL-42 sound level meter [35], remained well below the 90 dBA threshold for an 8 h workday, as regulated by the Department of Labor Protection and Welfare. The brief reaction time of only 2 min further limits cumulative noise exposure for operators, consistent with the efficient energy-saving aspects of sonochemistry [14]. However, given the high-frequency nature of sonication and the instrument’s measurement capability reaching up to 141 dB, the use of ear protection is recommended to prevent auditory fatigue during large-scale production.

3. Discussion

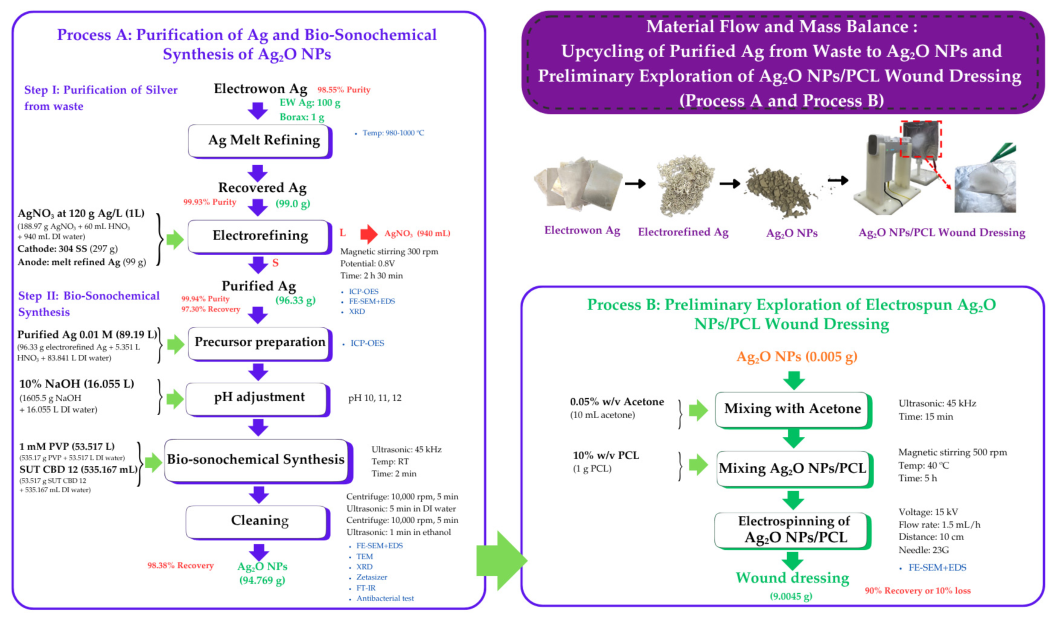
Figure 13 shows the upcycling of purified Ag from waste to Ag2O NPs, and the preliminary exploration of Ag2O NPs/PCL wound dressing. This consists of process A, the purification of Ag and bio–sonochemical synthesis, and process B, the preliminary exploration of the electrospinning of Ag2O NPs/PCL for wound dressing. The purification via melt-refining followed by electrorefining offered high recovery rates of 98.99% and 97.30%, respectively, based on the material flow and mass balance of 100 g of EW Ag. The Ag purity increased from 98.55% to 99.94%. This technique shows potential utility in recruiting various recyclable Ag-containing wastes such as jewelry, automotive parts and electronics. As waste can be derived from various sources and take many forms, melt-refining is considered practical. Multiple electrorefining can be employed in such a case, while the Ag content in the electrolytes has to be carefully monitored (120 g AgNO3/L) [24]). A high Ag purity could then be assured. For 100 g of the EW Ag, 96.33 g of the purified Ag will be obtained. This indicates the recyclability of Ag from waste as a second resource for nanoparticle synthesis. The waste-derived Ag2O NPs obtained were comparable to the AgNO3-derived NPs, as confirmed by the SEM + EDX and XRD results. However, the purified Ag required greater amounts of HNO3 (33.3 vol.%) for silver dissolution in precursor preparation, and consumed more NaOH (12.5 vol.%) for pH adjustment. This was included in the mass balance.
The purified Ag can be used for precursor preparation at a 0.01 M Ag concentration. The bio–sonochemical synthesis condition of a PVP to Cannabis saltiva SUT CBD 12 flower extract to precursor volume ratio of 0.6:0.006:1 was found effective. Near-spherical Ag2O NPs could be obtained under sonication at 45 Hz for 2 min. A size of approximately 100–130 nm could be achieved at the recovery rate of 98.38% (94.769 g). It could be that the flower extract and NaOH played important roles in Ag reduction at a controlled pH.
The Cannabis sativa SUT CBD12 flower extract aided Ag reduction. Its OH facilitated electron transfer from the antioxidants in the cannabis extract to the silver ions [36], enhancing the reduction to yield fine and dispersed Ag2O particles, as confirmed by the FE–SEM, TEM and XRD results. The PVP effectively acted as a steric stabilizer that prevented aggregation. Moreover, neutral to alkaline pH levels optimize the reducing and stabilizing capacity of phenolic and flavonoid compounds in plant extracts, leading to high-stability nanoparticles [27]. The essential synthesis parameter is the precursors’ pH, for which a basic environment is beneficial for deprotonation by increasing OH [37]. The observation of relatively smaller NPs surrounding larger ones in the TEM results suggests different nucleation and growth mechanisms, influenced by NaOH and Cannabis sativa SUT CBD12 flower extract. This could be explored further in future work. The Ag2O NPs are stable and reproducible, giving the same morphology and size of ~100–130 nm.
The preliminary antibacterial potential was addressed, but with further studies being necessary to confirm its effectiveness. The Ag2O NPs synthesized from purified Ag have shown comparable antibacterial test (ZOI) results to commercial Ag NPs assessed in the literature and those synthesized from other cannabis parts, such as roots, seeds, and leaves [27,38,39]. It has been reported [40] that cannabinoids have distinct antibacterial effects on Gram-positive bacteria. It might be that the negative charges produced by OH at the Ag2O NPs’ surfaces could attach to the thick cell wall and penetrate inside. The greater ZOIs tested against S. aureus compared to those of E. coli suggest a better antibacterial activity against Gram-positive bacteria in this case [13,14]. Although the overall performance remained lower than that of the antibiotic cefotaxime, the Ag2O NPs have shown their potential. These improved antibacterial properties could possibly be further explored via the control of Ag purity and synthesis conditions. This research shows that purified Ag could have potential use in up-valued products in not only biomedical but also electrical applications. Further work, such as zeta potential, colloidal stability, Ag ion release, cytotoxicity, hemocompatibility, MIC (Minimum Inhibitory Concentration) and MBC (Minimum Bactericidal Concentration) tests, is required. In addition, though Cu, which remained as the trace element (0.062 wt.%) in the purified Ag obtained, is known to have anti-bacterial effects, no systematic experimentation has been undertaken to clarify its specific effects. Future work might be required.
Moreover, the low emission profile of this bio–sonochemical route supports its use in occupational health and eco-efficiency. The ultrasonic-assisted and sonication-assisted techniques reduced the synthesis time from 2–24 h [41,42] to 2 min in this study, via acoustic cavitation. Though the technique itself yielded low NP emissions, minimizing hazardous chemical precursors could permit a safe working environment, as verified by high-precision monitoring using RION NL-42 and GRIMM 11-D [33]. This transforms hazardous E-waste into high-value medical materials without introducing secondary environmental pollutants, a strategy supported by the recent findings on circular economy potential [1].

4. Materials and Methods

The three main steps of the experiment include (i) the purification of Ag from waste, (ii) the bio–sonochemical synthesis of Ag2O NPs and (iii) the exploration of its use and emission control.

4.1. Purification of Silver

The purification of silver recovered from manufacturing waste was first carried out via melt-refining and electrorefining. The electrowon (EW) silver sheets recovered from the spent Ag plating solution in a previous work [20] were used as the main source. Traditional melt-refining was conducted in a crucible using a blow torch at 980–1000 °C. Commercial-grade borax (Na2B4O7·10H2O) from Krungthepchemi Company, Bangkok, Thailand, of 1 wt.% was added as a flux to prevent oxidation and trap surface impurities. After solidifying in a rectangular metal mold, the Ag bullion was cold-rolled into 1 mm-thick sheets and prepared as the anode with dimensions of 3.5 × 4 × 0.1 cm3 for another step of purification. The electrorefining cell was set resembling the Moebius cell [23], using a silver sheet as the anode, and a 304 stainless steel sheet as the cathode. A silver nitrate solution of 50 mL was prepared at 120 g AgNO3/L concentration [24] as the electrolyte. The electrorefining was operated at 0.8 V under 300 rpm magnetic stirring for 2 h 30 min, according to a previous study [20]. The silver cathode consisted of a silver crystal that was deposited at the cathode and fell into the electrolyte, which was retrieved after filtering. The purified Ag crystals were cleaned with DI water under sonication and characterized via SEM-EDS and XRD analysis. The SEM was JEOL/JSM-6010LV: Medance B.V., Maastricht, The Netherlands, operating at 15 kV in SEI mode coupled with EDS (X-Max, Oxford Instruments, Abingdon, UK). A Bruker model D2 PHASER X-ray generator, Germany, with Cu (WL = 1.54060 Å) 30 kV was utilized for XRD analysis. The chemical composition was assessed via ICP-OES (Optima 8000 ICP-OES Spectroscopy (PerkinElmer Inc., Shelton, CT, USA)), using the Custom-Designed SolidState Detector calibration curve at 0.05, 0.1, 1, 5, 8, and 10 ppm, with an argon gas flow rate at 15 L/min. The purified Ag was then used to prepare the precursor for nanoparticle synthesis.

4.2. Bio–Sonochemical Synthesis of Ag2O NPs

The plant extract was prepared using dried and chopped SUT CBD12 flower for a solid-to-liquid ratio (S/L) of 10 g:100 mL DI water. Heating was applied at 90 °C for 1 h. The solution was filtered and stored at 4 °C for NP synthesis. Quadrupole Time-Of-Flight Mass Spectroscopy (Q-TOF MS-Bruker/microTOF-Q II) Bruker, Bremen, MA, USA, was used to analyze the types and amounts of substances or biomolecules in the SUT CBD12 extract.
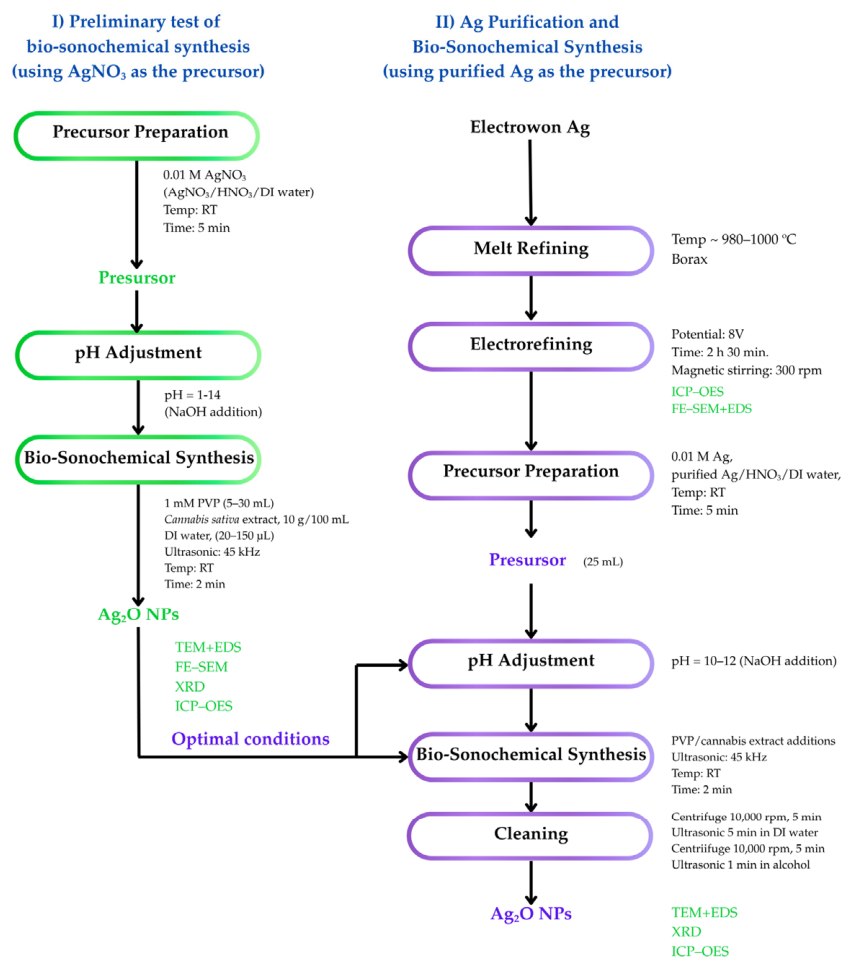
Two precursors were used for bio–sonochemical synthesis, namely, (i) the silver nitrate AgNO3 precursor to preliminarily determine the optimal conditions, and (ii) the purified Ag precursor using the predetermined optimal conditions. The 0.01 M AgNO3 precursor at 25 mL was prepared by dissolving analytical reagent (AN)-grade AgNO3 with 65% AN-grade nitric acid (HNO3) and DI water. Experimental flow chart is provided in Figure A1, Appendix A.
The solution’s pH was then adjusted using a 10% NaOH solution, and measured using a pH meter (Seven Direct SD20) with a pH sensor (InLab® Science Pro-ISM, Mettler-Toledo (Thailand) Limited, Bangkok, Thailand).
The PVP was first added as the capping agent and followed by Cannabis sativa extract as the reducing agent. It is noted that reversing the addition sequence led to ineffective capping, whereby excessively large particles were observed according to the preliminary tests. To determine the optimal conditions for bio–sonochemical synthesis, 25 mL of 0.01 M AgNO3 precursors were used. The additions of PVP (1 mM, 5–30 mL) and Cannabis sativa SUT CBD12 extract (50–150 μL) were varied. These included PVP addition at the capping agent to precursor ratios of 0.2:1, 0.4:1, 0.6:1, 0.8:1, 1.0:1 and 1.2:1. With these variations, the AgNO3’s concentration in the final solution volume decreased from 0.00833 M to 0.00455 M, while the PVP concentration increased from 0.00017 M to 0.0005 M. Details are provided in Table A1, Appendix A.
At PVP to precursor volume ratios of 0.6:1 and 1:1, the SUT-CBD12 flower extract was added at reducing agent to precursor volume ratios of 0.002:1, 0.004:1 and 0.006:1, as listed in Table A2, Appendix A. From the initial observation, we see that PVP addition exceeding the study range was ineffective, resulting in a thick surface coating on Ag2O NPs and large nanoparticle clusters. Further, the PVP provided better shape and size control of the NPs in comparison to ethylene glycol (EG:C2H6O2). The latter provided anisotropic crystal growth exhibiting shape irregularities, including flower-like, sheet-like and rod-like structures, and large polygons of >245 nm. The Cannabis sativa extract was selected to explore its potential use as a reducing agent and its antibacterial effects. The pH range was 1–14 pH, set in order to understand its effects on nanoparticle synthesis.
After achieving the optimal conditions in the preliminary test, they were then adapted for NP synthesis using the purified Ag precursor. The purified silver was completely dissolved in HNO3 and subsequently diluted with DI water to prepare 50 mL of the precursor of Ag at a 0.01 M concentration. A slightly greater amount of HNO3 was required in the latter case. Bio–sonochemical synthesis was conducted under sonication at 45 kHz for 2 min at room temperature. The short period was predetermined as 2–10 min sonication time led to no significant changes in nanoparticle size [43]. At least 2–3 tests of each condition were carried out to confirm reproducibility.
When the solution’s color turned from clear to dark brown, this indicated a successful NP formation. After synthesis, a 500 μL aliquot was collected and subjected to centrifugation (5452 Mini Spin; Eppendorf, Hamburg, Germany) at 10,000 rpm for 5 min, and this was followed by sonication washing in DI water and 99.9% AR grade alcohol (Q RëC™, Auckland, New Zealand). Characterization was undertaken via FE-SEM (JEOL/JSM-6010LV: Medance B.V., The Netherlands), operating at 15 kV in SEI mode, coupled with EDS (X-Max, Oxford Instruments, Abingdon, UK), field emission (FE)-SEM (Carl Zeiss Auriga, Carl Zeiss AG, Oberkochen, Germany), operating at 10 kV in SEI mode (8.5 mm WD), and TEM (Tecnai TM G220S-TWIN (FEI Company, Hillsboro, OR, USA)), operating at 200 kV in a bright field mode. SEM images were taken for morphology and particle size analysis using ImageJ software (version 1.54K) to obtain a particle population of at least 150 per condition. An average of 2 measurements for each particle was taken at right angles. ICP-OES was employed to give % purity and % recovery of the NPs. The functional groups on NP surfaces were analyzed via Fourier Transform Infrared (FT-IR) Microscope Spectrophotometry (TENSOR 27-Hyperion-2000, Bruker, Billerica, MA, USA). The particle sizes of NPs synthesized from purified Ag (or waste-derived Ag2O NPs) were measured via Dynamic Light Scattering (DLS) analysis (Malvern: Zetasizer-ZS, Malvern, UK).
All chemicals used were as follows. The PVP was from Sigma-Aldrich Inc., St. Louis, MO, USA. The AN-grade AgNO3 was from Thermo Fisher Scientific (Thailand) Co., Ltd., and 65% AN-grade HNO3 was provided by ANaPURE™ Company, New Zealand. The NaOH was from RCI Labscan Co., Ltd., Thailand, and was used for pH adjustment, while AR-grade alcohol (Q RëC™, New Zealand) of 99.9% was used for cleaning.

4.3. Preliminary Exploration of Potential Use and Emission Control of Ag2O NPs

4.3.1. Antibacterial Activity Test

Antibacterial activity was evaluated via agar well diffusion [44]. Escherichia coli and Staphylococcus aureus were cultured to 106–107 CFU/mL (Colony Forming Units) and inoculated onto Luria–Bertani (LB) agar plates. For both waste-derived and AgNO3-derived Ag2O NPs, a solution of 0.1 mL (in 99.9% AR grade alcohol) was filled into 9 mm wells in the agar. According to the serial dilutions, aliquots of 200, 100, 50, 25, 20, 12.5, and 6.25 µg/mL were introduced into the wells and incubated at 37 °C for 24 h. The measurement was reported in the form of the Zone of Inhibition (ZOI). Pure 99.9% AR-grade alcohol was also tested as the negative control. All experiments were performed in triplicate.

4.3.2. Incorporation of Ag2O NPs on Polycaprolactone Electrospun Wound Dressing

Electrospun wound dressing fabrics were prepared by incorporating Ag2O NPs into polycaprolactone (PCL: MW 80,000 g · mol−1, Sigma-Aldrich, MO, USA). The synthesized Ag2O NPs were dispersed in acetone to give a 0.05 wt./v% concentration under sonication for 15 min. The PCL was added to obtain 10 wt./v% under stirring at 40 °C for 5 h until homogeneous. An electrospinning gun (HED-03 handheld), MGSI Lab Equipment, China, with a 23G needle was operated at 15 kV, with a 1.5 mL/h flow rate and 10 cm needle-to-collector distance,0 to obtain the incorporated Ag2O NPs-PCL fabrics. Examination was undertaken via FE-SEM + EDS.

4.3.3. Evaluation of Emission from Bio–Sonochemical Synthesis of Ag2O NPs

Real time aerosol and particulate emission was monitored during bio–sonochemical synthesis through a portable GRIMM 11-D Dust Decoder aerosol spectrometer, DURAG GROUP, Hamburg, Germany, to ensure environmental safety. The light scattering detection covered 0.253 to 35.15 µm particle sizes, up to 5.3 × 10⁵ particles/L, and 0 to 100 mg/m3 dust mass concentrations. This enabled the characterization of multiple mass fractions, including inhalable, thoracic, respirable, PM10, PM4, PM2.5, and PM1, along with total particle counts and size distribution. Additionally, Ag2O NPs were collected using an NPS assembly using a 25 mm polycarbonate filter (0.8 µm pore size), at a 0.3 L/min flow rate.
Simultaneously, the noise emissions generated during sonication were quantified using a RION NL–42 sound level meter (RION, Kokubunji, Japan), a Class 2 standard instrument complying with IEC, ANSI/ASA, and JIS with a measuring range of 25 to 141 dB across 20 Hz–8 kHz spectrum. Measurements were conducted using A, C, and Z frequency weightings to ensure a comprehensive acoustic assessment. Sound pressure levels according to occupational health and safety guidelines were recorded via IP54-rated enclosure.

5. Conclusions

The Ag2O NPs were successfully synthesized via bio–sonochemical synthesis using purified Ag from waste. The overall process involved: (i) the purification of Ag via traditional melt-refining followed by electrorefining and (ii) bio–sonochemical synthesis. The first step of silver purification was found to be efficient, giving 97.30% recovery and an Ag purity of 99.94% for precursor preparation.
For the synthesis, a 0.01 M AgNO3 precursor, 1 mM PVP, and Cannabis sativa SUT CBD12 flower extract were prepared at 10 g dried weight to 100 mL DI water. The optimal conditions of a capping agent to reducing agent to precursor volume ratio of 0.6:0.006:1 and pH control at 10–12 were found to be effective. This could be applied to the purified Ag derived from waste at a 0.01 M Ag concentration. Spherical Ag2O NPs of ~100–130 nm could be achieved in both cases. Apart from the reducing effects of the cannabis-derived phytochemicals, enhanced nanoparticle nucleation through alkaline conditions (pH 10–12), along with controlled growth via PVP capping, facilitated the development of uniform, spherical NPs. The cannabis-derived phytochemicals under sonication enabled the rapid, eco-proof, and scalable bio–sonochemical synthesis of Ag2O NPs.
Preliminary investigations into antibacterial activity against both S. aureus and E. coli resulted in the ZOIs of 26–29 mm and 16–20 mm, respectively. These are, however, slightly inferior to the results for antibiotics. The integration of Ag2O NPs into Polycaprolactone (PCL) nanofibers via handheld electrospinning produced bead-free fabrics. A more uniform fiber morphology was obtained particularly when the Ag2O NPs were prepared at pH 10. The bio–sonochemical route also produced negligible aerosol emissions and noise levels (78.4 dBA) that were within occupational safety standards, following real-time monitoring.

6. Patents

The preliminary observation of the optimal conditions for the bio–sonochemical synthesis of silver nanoparticles using Cannabis sativa SUT CBD12 flower extract has been subjected to the patenting process [Petty Patent Application No.2503004365, date 10 November 2025].

Author Contributions

Conceptualization, S.K., T.P. and K.B.; methodology, T.P., S.C., N.M. and T.C.; validation, T.P. and S.C.; formal analysis, S.C., N.M., C.K. and T.U.; investigation, T.P., T.C. and C.K.; resources, S.K. and K.B.; writing—original draft preparation, S.C. and T.U.; writing—review and editing, T.P. and K.B.; visualization, T.P. and S.C.; supervision, T.P. and S.K.; project administration, T.P.; funding acquisition, T.P., S.K. and K.B. All authors have read and agreed to the published version of the manuscript.

Funding

This research was funded by a Fundamental Fund, with the funding number of 195677, from Suranaree University of Technology through the Thailand Science Research and Innovation (TSRI), and the National Science, Research and Innovation Fund (NSRF) for the Fiscal Year 2024, (date received: 3 July 2024).

Data Availability Statement

The original contributions presented in this study are included in the article. Further inquiries can be directed to the corresponding author(s).

Acknowledgments

Thanks are due to the Innovative Processing and Recycling of Metal Research Center (IPRMRC) and the Department of Primary Industries and Mine (DPIM), the Ministry of Industry, Thailand, for technical and waste support. The authors also would like to express their sincere gratitude to Namo Ban Chang Tong (Saraburi, Thailand) for their kind assistance and expertise in the silver melting and rolling processes.

Conflicts of Interest

The authors declare no conflicts of interest. The funders had no role in the design of the study; in the collection, analyses, or interpretation of data; in the writing of the manuscript; or in the decision to publish the results.

Abbreviations

The following abbreviations are used in this manuscript:
ARAnalytical grade
DI waterDeionized water
EGEthylene glycol
EWElectrowinning/Electrowon
EOLEnd-Of-Life
FE-SEMField Emission Scanning Electron Microscope
NPs Nanoparticles
PVPPolyvinylpyrrolidone
Q-TOF MSQuadrupole Time-of-Flight Mass Spectrometry
TEMTransmission Electron Microscope

Appendix A

Table A1. Concentrations of PVP and AgNO3 at the final solution volume, and PVP:AgNO3 volume ratio (preliminary test).
ConditionInitial Volume of
1 mM PVP Solution (mL)
Initial Volume of
0.01 M AgNO3 Solution (mL)
Final Solution
Volume
(mL)
PVP Concentration
at Final Solution
Volume (Molar)
AgNO3 Concentration at Final Solution
Volume (Molar)
PVP: AgNO3
Volume Ratio
1525300.000170.083330.2:1
21025350.000290.071430.4:1
31525400.000380.062500.6:1
42025450.000440.055560.8:1
52525500.000500.050001.0:1
63025550.000550.045451.2:1
Note: Synthesis was carried out using 150 μL of SUT-CBD12 flower extract.
Figure A1. Experimental flow chart detailing (I) the preliminary study of the bio–sonochemical synthesis of Ag2O NPs using AN-grade AgNO3 and (II) the purification of Ag from waste, as well as bio–sonochemical synthesis using purified Ag from waste under the optimal conditions defined by (I).
Recycling 11 00128 g0a1
Table A2. SUT-CBD12:AgNO3 volume ratio (preliminary test).
ConditionInitial Volume of
1 mM PVP Solution (mL)
Initial Volume of
SUT-CBD Solution (mL)
Initial Volume of
0.01 M AgNO3 Solution (mL)
PVP:SUT-CBD12: AgNO3
Volume Ratio
1150.050250.6:0.002:1
2250.050251.0:0.002:1
3150.100250.6:0.004:1
4250.100251.0:0.004:1
5150.150250.6:0.006:1
6250.150251.0:0.006:1
Table A3. Particle size analysis (by Dynamic Light Scattering—DLS) of waste-derived Ag2O NPs synthesized at pH 10, 11 and 12.
ConditionZ-Average (d.nm)Size (d.nm)Width (d.nm) PdI
pH 10174.3Peak1. = 133.050.080.304
pH 11218.3Peak1. = 111.932.460.329
Peak2. = 42.839.752
pH 12218Peak1. = 108.225.040.317
Table A4. ZOI (agar well diffusion) of Ag2O NPs tested against E. coli and S. aureus.
ConditionZone of Inhibition: ZOI (mm) Under Serial Dilution
200
(µg/mL)
100
(µg/mL)
50
(µg/mL)
25
(µg/mL)
20
(µg/mL)
12.5
(µg/mL)
6.25
(µg/mL)
S. aureus
CEFO20 (Antibiotics)51.94 ± 1.28
Ag2O NPs (AgNO3, pH 10)27.31 ± 0.6726.42 ± 0.3217.58 ± 0.6112.50 ± 0.4012.10 ± 0.2212.13 ± 0.5511.71 ± 1.64
Ag2O NPs (AgNO3, pH 11)26.75 ± 0.5325.79 ± 0.4027.65 ± 0.5013.01 ± 0.7112.72 ± 0.5311.67 ± 0.3812.26 ± 0.36
Ag2O NPs (AgNO3, pH 12)26.58 ±0.9026.01 ± 0.1126.52 ± 0.8016.84 ± 0.4613.31 ± 1.3313.45 ± 1.1311.34 ± 0.45
Ag2O NPs (purified Ag, pH 10)26.61 ± 0.0827.83 ± 0.3926.86 ± 0.5313.23 ± 0.3312.26 ± 0.3311.56 ± 0.2512.48 ± 0.56
Ag2O NPs (purified Ag, pH 11)28.50 ± 0.5427.92 ± 0.5326.63 ± 0.1812.13 ± 0.3812.18 ± 0.1612.49 ± 0.2912.39 ± 0.23
Ag2O NPs (purified Ag pH 12)27.16 ± 0.1427.77 ± 0.2927.33 ± 0.3014.22 ± 0.3511.55 ± 0.0512.40 ± 0.5413.48 ± 0.55
E. coli
CEFO20 (Antibiotics)51.02 ± 0.91
Ag2O NPs (AgNO3, pH 10)16.30 ± 0.1415.60 ± 1.0913.75 ± 0.4613.99 ± 0.2913.26 ± 0.5113.28 ± 0.5612.59 ± 0.05
Ag2O NPs (AgNO3, pH 11)18.52 ± 0.1917.41 ± 01614.34 ± 0.3016.30 ± 0.4613.47 ± 0.0813.17 ± 0.6112.949 ± 0.98
Ag2O NPs (AgNO3, pH 12)18.41 ± 1.0717.67 ± 0.4615.12 ± 2.3114.54 ± 0.5513.15 ± 0.4813.45 ± 0.6713.20 ± 0.72
Ag2O NPs (purified Ag, pH 10)17.07 ± 0.5815.98 ± 0.4718.10 ± 0.4915.08 ± 1.1915.90 ± 0.260.000.00
Ag2O NPs (purified Ag, pH 11)16.99 ± 0.1517.68 ± 0.619.90 ± 0.7214.49 ± 0.7917.68 ± 0.4413.55 ± 0.7612.88 ± 0.14
Ag2O NPs (purified Ag pH 12)16.30 ± 0.1415.60 ± 1.0913.75 ± 0.4613.99 ± 0.2913.26 ± 0.5113.28 ± 0.5612.59 ± 0.05

References

  1. Global e-Waste Monitor 2024: Electronic Waste Rising Five Times Faster than Documented E-waste Recycling|UNITAR. Available online: https://unitar.org/about/news-stories/press/global-e-waste-monitor-2024-electronic-waste-rising-five-times-faster-documented-e-waste-recycling (accessed on 10 December 2025).
  2. Cui, J.; Zhang, L. Metallurgical Recovery of Metals from Electronic Waste: A Review. J. Hazard. Mater. 2008, 158, 228–256. [Google Scholar] [CrossRef] [PubMed]
  3. Franci, G.; Falanga, A.; Galdiero, S.; Palomba, L.; Rai, M.; Morelli, G.; Galdiero, M. Silver Nanoparticles as Potential Antibacterial Agents. Molecules 2015, 20, 8856–8874. [Google Scholar] [CrossRef] [PubMed]
  4. Al-Asbahi, M.G.S.S.; Al-Ofiri, B.A.; Saad, F.A.A.; Alnehia, A.; Hadi, M. Ag-Ag2O Nanocomposite Biosynthesis by Mixed Bacterial Cultivation and Effect of the Ph on Size and Optical Properties of the Nanocomposite. J. Mater. Sci. Mater. Med. 2025, 36, 19. [Google Scholar] [CrossRef] [PubMed]
  5. Gong, P.; Li, H.; He, X.; Wang, K.; Hu, J.; Tan, W.; Zhang, S.; Yang, X. Preparation and Antibacterial Activity of Fe3O4@Ag Nanoparticles. Nanotechnology 2007, 18, 285604. [Google Scholar] [CrossRef]
  6. Augustine, R.; Kalarikkal, N.; Thomas, S. Electrospun PCL Membranes Incorporated with Biosynthesized Silver Nanoparticles as Antibacterial Wound Dressings. Appl. Nanosci. 2016, 6, 337–344. [Google Scholar] [CrossRef]
  7. Kalantari, K.; Mostafavi, E.; Afifi, A.M.; Izadiyan, Z.; Shameli, K.; Webster, T.J. Wound Dressings Functionalized with Silver Nanoparticles: Promises and Pitfalls. Nanoscale 2020, 12, 2268–2291. [Google Scholar] [CrossRef] [PubMed]
  8. Rónavári, A.; Bélteky, P.; Boka, E.; Zakupszky, D.; Igaz, N.; Szerencsés, B.; Pfeiffer, I.; Kónya, Z.; Kiricsi, M. Polyvinyl-Pyrrolidone-Coated Silver Nanoparticles—The Colloidal, Chemical, and Biological Consequences of Steric Stabilization under Biorelevant Conditions. Int. J. Mol. Sci. 2021, 22, 8673. [Google Scholar] [CrossRef] [PubMed]
  9. Baba, I.A.; Awe, O.B.; Mustapha, S.; Abubakar, M.A.; Abdulkareem, A.S.; Tijani, J.O.; Obayomi, K.S. Influence of Plant-Derived Extracts on the Synthesis, Physicochemical Properties, and Applications of Metal and Metal Oxide Nanoparticles. Hybrid Adv. 2026, 13, 100666. [Google Scholar] [CrossRef]
  10. Danish, M.S.S.; Estrella-Pajulas, L.; Alemaida, I.; Grilli, M.; Mikhaylov, A.; Senjyu, T. Green Synthesis of Silver Oxide Nanoparticles for Photocatalytic Environmental Remediation and Biomedical Applications. Metals 2022, 12, 769. [Google Scholar] [CrossRef]
  11. Andre, C.M.; Hausman, J.-F.; Guerriero, G. Cannabis Sativa: The Plant of the Thousand and One Molecules. Front. Plant Sci. 2016, 7, 19. [Google Scholar] [CrossRef] [PubMed]
  12. Şentürk, İ.; Alzein, M. Adsorptive Removal of Basic Blue 41 Using Pistachio Shell Adsorbent-Performance in Batch and Column System. Sustain. Chem. Pharm. 2020, 16, 100254. [Google Scholar] [CrossRef]
  13. Devos, C.; Bampouli, A.; Brozzi, E.; Stefanidis, G.D.; Dusselier, M.; Gerven, T.V.; Kuhn, S. Ultrasound Mechanisms and Their Effect on Solid Synthesis and Processing: A Review. Chem. Soc. Rev. 2025, 54, 85–115. [Google Scholar] [CrossRef] [PubMed]
  14. Bang, J.H.; Suslick, K.S. Applications of Ultrasound to the Synthesis of Nanostructured Materials. Adv. Mater. 2010, 22, 1039–1059. [Google Scholar] [CrossRef] [PubMed]
  15. Yusof, N.S.M.; Anandan, S.; Sivashanmugam, P.; Flores, E.M.M.; Ashokkumar, M. A Correlation between Cavitation Bubble Temperature, Sonoluminescence and Interfacial Chemistry–A Minireview. Ultrason. Sonochem. 2022, 85, 105988. [Google Scholar] [CrossRef] [PubMed]
  16. Enad, A. Baida Anti-Cancer Activity of a Mixture of Ag Nanoparticles and Clove Extract Synthesized by DC Sputtering and Cold Plasma Techniques Versus Breast Cancer Cells. J. Nano Mater. Impact 2025, 1, 33–43. [Google Scholar] [CrossRef]
  17. Vanlalveni, C.; Lallianrawna, S.; Biswas, A.; Selvaraj, M.; Changmai, B.; Rokhum, S.L. Green Synthesis of Silver Nanoparticles Using Plant Extracts and Their Antimicrobial Activities: A Review of Recent Literature. RSC Adv. 2021, 11, 2804–2837. [Google Scholar] [CrossRef] [PubMed]
  18. de Bernardo, W.L.C.; Boriollo, M.F.G.; Tonon, C.C.; da Silva, J.J.; Oliveira, M.C.; de Moraes, F.C.; Spolidorio, D.M.P. Biosynthesis of Silver Nanoparticles from Syzygium Cumini Leaves and Their Potential Effects on Odontogenic Pathogens and Biofilms. Front. Microbiol. 2022, 13, 995521. [Google Scholar] [CrossRef] [PubMed]
  19. Manjamadha, V.P.; Muthukumar, K. Ultrasound Assisted Green Synthesis of Silver Nanoparticles Using Weed Plant. Bioprocess Biosyst. Eng. 2016, 39, 401–411. [Google Scholar] [CrossRef] [PubMed]
  20. Patcharawit, T.; Kansomket, C.; Kritsarikun, W.; Taseela, K.; Paernaphan, C.; Laphosin, T.; Tannukit, T.; Khumkoa, S. Recovery of Pure Silver from Spent Silver Electroplating Solutions via Electrochemical Process and Zinc Cementation. J. Met. Mater. Miner. 2023, 33, 14–20. [Google Scholar] [CrossRef]
  21. Patcharawit, T.; Kansomket, C.; Wongnaree, N.; Kritsrikan, W.; Yingnakorn, T.; Khumkoa, S. Hybrid Recovery of Copper and Silver from PV Ribbon and Ag Finger of EOL Solar Panels. Int. J. Energy Power Eng. 2022, 16, 89–99. [Google Scholar]
  22. Wongnaree, N.; Kritsarikun, W.; Ma-ud, N.; Kansomket, C.; Udomphol, T.; Khumkoa, S. Recovery of Silver from Solar Panel Waste: An Experimental Study. Mater. Sci. Forum 2020, 1009, 137–142. [Google Scholar] [CrossRef]
  23. Mooiman, M.B.; Simpson, L. Refining of Gold- and Silver-Bearing Doré. In Gold Ore Processing; Elsevier: Amsterdam, The Netherlands, 2016; pp. 595–615. [Google Scholar] [CrossRef]
  24. Maurell-Lopez, A.-K.; Friedrich, B.; Koch, W. Challenges in the Electrolytic Refining of Silver—Influencing the Co-Deposition Through Parameter Control. In Rare Metal Technology; Springer International Publishing: Cham, Switzerland, 2017. [Google Scholar] [CrossRef] [PubMed]
  25. Górski, K.; Kowalczyk, T.; Gładys, A.; Glica, M.; Muskała, M.; Picot, L.; Mori, M.; Hatziantoniou, S.; Sitarek, P. Industrial Applications of Cannabis Sativa (L.): Exploring Its Biological and Nanotechnological Potential. Ind. Crops Prod. 2025, 225, 120566. [Google Scholar] [CrossRef]
  26. Suman, S.; Loveleen, L.; Bhandari, M.; Syed, A.; Bahkali, A.H.; Manchanda, R.; Nimesh, S. Antibacterial, Antioxidant, and Haemolytic Potential of Silver Nanoparticles Biosynthesized Using Roots Extract of Cannabis sativa Plant. Artif. Cells Nanomed. Biotechnol. 2022, 50, 343–351. [Google Scholar] [CrossRef] [PubMed]
  27. Yontar, A.K.; Çevik, S. Bio-Synthesized Silver Nanoparticles Using Cannabis sativa Seed Extracts and Its Anticancer Effects. Plasmonics 2023, 19, 2031–2043. [Google Scholar] [CrossRef]
  28. Liga, S.; Vodă, R.; Lupa, L.; Moacă, E.-A.; Muntean, D.; Barbu-Tudoran, L.; Suciu, M.; Socoliuc, V.; Péter, F. Synthesis of Ag2O/Ag Nanoparticles Using Puerarin: Characterization, Cytotoxicity, In Ovo Safety Profile, Antioxidant, and Antimicrobial Potential Against Nosocomial Pathogens. J. Funct. Biomater. 2025, 16, 258. [Google Scholar] [CrossRef] [PubMed]
  29. Elyamny, S.; Eltarahony, M.; Abu-Serie, M.; Nabil, M.M.; Kashyout, A.E.-H.B. One-Pot Fabrication of Ag @Ag2O Core–Shell Nanostructures for Biosafe Antimicrobial and Antibiofilm Applications. Sci. Rep. 2021, 11, 22543. [Google Scholar] [CrossRef] [PubMed]
  30. Dakal, T.C.; Kumar, A.; Majumdar, R.S.; Yadav, V. Mechanistic Basis of Antimicrobial Actions of Silver Nanoparticles. Front. Microbiol. 2016, 7, 1831. [Google Scholar] [CrossRef] [PubMed]
  31. Bosworth, L.A.; Downes, S. Acetone, a Sustainable Solvent for Electrospinning Poly(e-Caprolactone) Fibres: Effect of Varying Parameters and Solution Concentrations on Fibre Diameter. J. Polym. Environ. 2012, 20, 879–886. [Google Scholar] [CrossRef]
  32. Alfalluji, A.L.; Kadhim, Q.S.; Mahdi, A.A. Electrospun Poly(ε-Caprolactone)/Silver Nanoparticle Nanofibrous Scaffolds with Antibacterial Activity for Wound-Dressing Applications. RSC Adv. 2025, 15, 37899–37907. [Google Scholar] [CrossRef] [PubMed]
  33. AG, D.H.|Durag GROUP. Available online: https://www.durag.com/en/product-filter-837.htm?productID= (accessed on 13 March 2026).
  34. Ahmed, S.; Ahmad, M.; Swami, B.L.; Ikram, S. A Review on Plants Extract Mediated Synthesis of Silver Nanoparticles for Antimicrobial Applications: A Green Expertise. J. Adv. Res. 2016, 7, 17–28. [Google Scholar] [CrossRef] [PubMed]
  35. Class 2 Sound Level Meter NL-42A. Available online: https://rion-sv.com/products/unavailable/NL-42A.html (accessed on 13 March 2026).
  36. Abdelkader, H. Green Synthesis, Characterization And Antimicrobial Activity Of Biosynthesized Silver Nanoparticles Using Ziziphusspina-Christi Leaf Extracts. Adv. Microbiol. Res. 2019, 3, 1–7. [Google Scholar] [CrossRef] [PubMed]
  37. Sati, A.; Ranade, T.N.; Mali, S.N.; Ahmad Yasin, H.K.; Pratap, A. Silver Nanoparticles (AgNPs): Comprehensive Insights into Bio/Synthesis, Key Influencing Factors, Multifaceted Applications, and Toxicity─A 2024 Update. ACS Omega 2025, 10, 7549–7582. [Google Scholar] [CrossRef] [PubMed]
  38. Mandal, S.; Marpu, S.B.; Hughes, R.; Omary, M.A.; Shi, S.Q. Green Synthesis of Silver Nanoparticles Using Cannabis sativa Extracts and Their Anti-Bacterial Activity. Green Sustain. Chem. 2021, 11, 38–48. [Google Scholar] [CrossRef]
  39. Serventi, L.; Angeles Flores, G.; Cusumano, G.; Barbaro, D.; Tirillini, B.; Venanzoni, R.; Angelini, P.; Acquaviva, A.; Di Simone, S.; Orlando, G.; et al. Comparative Investigation of Antimicrobial and Antioxidant Effects of the Extracts from the Inflorescences and Leaves of the Cannabis sativa L. Cv. Strawberry. Antioxidants 2023, 12, 219. [Google Scholar] [CrossRef] [PubMed]
  40. Wieczerza, C.; Zhai, H.; Askar, M.; Zhou, Z.; Paurazas, S. Antibacterial Effect of Cannabinoids on Bacteria Associated with Persistent Endodontic Infections. Int. J. Mol. Sci. 2025, 26, 11936. [Google Scholar] [CrossRef] [PubMed]
  41. Laouini, S.E.; Bouafia, A.; Soldatov, A.V.; Algarni, H.; Tedjani, M.L.; Ali, G.A.M.; Barhoum, A. Green Synthesized of Ag/Ag2O Nanoparticles Using Aqueous Leaves Extracts of Phoenix dactylifera L. and Their Azo Dye Photodegradation. Membranes 2021, 11, 468. [Google Scholar] [CrossRef] [PubMed]
  42. Rokade, A.A.; Patil, M.P.; Yoo, S.I.; Lee, W.K.; Park, S.S. Pure Green Chemical Approach for Synthesis of Ag2O Nanoparticles. Green Chem. Lett. Rev. 2016, 9, 216–222. [Google Scholar] [CrossRef]
  43. Patcharawit, T.; Kansomket, C.; Mahiwan, N.; Chailoi, S.; Chandakhiaw, T.; Yingnakorn, T.; Tunnukij, T.; Khumkoa, S. Upcycling of Cupric Chloride Waste Solution from PCB Manufacturing for Antibacterial Copper Nanoparticles. Recycling 2025, 10, 97. [Google Scholar] [CrossRef]
  44. Urnukhsaikhan, E.; Bold, B.-E.; Gunbileg, A.; Sukhbaatar, N.; Mishig-Ochir, T. Antibacterial Activity and Characteristics of Silver Nanoparticles Biosynthesized from Carduus Crispus. Sci. Rep. 2021, 11, 21047. [Google Scholar] [CrossRef] [PubMed]
Figure 1. Melt-refining (ad) and cold-rolling of silver from electrowon silver (e,f).
Recycling 11 00128 g001
Figure 2. Purification of silver via electrorefining; (a) electrorefining of silver, (b) silver deposited at cathode, and (c) electrorefined silver.
Recycling 11 00128 g002
Figure 3. SEM + EDS analysis of (a,b) electrorefined silver and (c,d) anode slime.
Recycling 11 00128 g003
Figure 4. Base peak chromatogram of SUT CBD12 flower extract revealed by Q-TOF MS analysis.
Recycling 11 00128 g004
Figure 5. Effects of SUT CBD12 flower extract (10 g/100 mL DI water) and 1 mM PVP additions to 0.01 M AgNO3 precursor on the synthesis of Ag2O NPs, at capping agent to reducing agent to precursor ratios of (a) 0.6:0.002:1 and (b) 0.6:0.006:1.
Recycling 11 00128 g005
Figure 6. SEM images of Ag2O NPs synthesized at (a) pH 1 and (b) pH 7; (ce) spherical and uniformly dispersed Ag2O NPs at pH 10–12 and (f) pH 13, synthesized using AgNO3 precursor.
Recycling 11 00128 g006
Figure 7. SEM images of Ag2O NPs synthesized at (ac) a pH range of 10–12, using a purified Ag (waste-derived) precursor, and (d) size distributions of Ag2O NPs.
Recycling 11 00128 g007
Figure 8. TEM images of Ag2O NPs at low to higher magnification with respective elemental analysis; synthesized (ac) at pH 10, (df) at pH 11, and (gi) at pH 12.
Recycling 11 00128 g008
Figure 9. FT-IR spectra of SUT CBD12 flower extracts, PVP, and Ag2O NPs synthesized under pH 10, 11, and 12.
Recycling 11 00128 g009
Figure 10. XRD spectra of (a) electrowon Ag, melt-refined Ag, Ag cathode, and Ag2O NPs synthesized at pH 10, 11, and 12 and (b) separated XRD results for purified Ag derived and AgNO3 derived Ag2O NPs.
Recycling 11 00128 g010
Figure 11. Antibacterial activity of AgNO3 and Ag waste-derived NPs against S. aureus at pH range 10–12; (a,c) positive control (cefotaxime, 20 µg/mL); (b,d) alcohol control; and (e,g,i,k) at 200 µg/mL, and (f,h,j,l) 100 µg/mL.
Recycling 11 00128 g011
Figure 12. Electrospinning for wound dressing; (a,b) portable devices and in situ application; (cf) FE-SEM images of PCL/Ag2O NPs nanofibers synthesized at pH 10, 11, and 12; (gi) EDX elemental analysis.
Recycling 11 00128 g012
Figure 13. Materials flow and mass balance of step I (Ag2O NPs via bio–sonochemical synthesis using purified Ag from waste) and step II (electrospinning of Ag2O NPs/PCL wound dressing fabric).
Recycling 11 00128 g013
Table 1. Chemical composition of silver before and after electrorefining by ICP-OES.
ConditionMetal Concentration (wt.%) in Solution % Purity 1
CuAlNaSOther 2
Electrowon Ag 0.4600.510.43<limit0.0598.55
Melt-refined Ag (anode)0.072<limit<limit<limit<limit99.93
Purified Ag (cathode)0.062<limit<limit<limit<limit99.94
1 % Purity is calculated by subtracting the total concentration of all impurities from 100%. 2 Other elements such as sulfur (S) and chlorine (Cl) are included too.
Table 2. Percent recovery of silver after melt-refining.
WAg (electrowon) (g)WAg (melt-refined) (g)% Recovery 1
30.5830.2798.99
1 % Recovery (melt-refining) is calculated according to Equation (1).
Table 3. Percent recovery of silver after electrorefining.
WAg anode loss (g)WAg cathode (g)% Recovery 1
1.481.4497.30
1 % Recovery (electrorefining) is calculated according to Equation (4).
Disclaimer/Publisher’s Note: The statements, opinions and data contained in all publications are solely those of the individual author(s) and contributor(s) and not of MDPI and/or the editor(s). MDPI and/or the editor(s) disclaim responsibility for any injury to people or property resulting from any ideas, methods, instructions or products referred to in the content.