Article

Research on the Method of Near-Infrared Hyperspectral Classification of Cotton-Polyester Blended Waste Fabric Based on Deep Learning

1
School of Mechanical Engineering, Zhejiang Sci-Tech University, Hangzhou 310018, China
2
Taizhou Vocational & Technical College, Taizhou 318000, China
3
Zhejiang Institute of Quality Sciences, Hangzhou 310018, China
*
Author to whom correspondence should be addressed.
Recycling 2026, 11(2), 42; https://doi.org/10.3390/recycling11020042
Submission received: 18 January 2026 / Revised: 14 February 2026 / Accepted: 17 February 2026 / Published: 19 February 2026

Abstract

Despite the enormous amounts of waste textiles produced by the world’s textile industry’s explosive growth, resource utilization rates are still poor. Cotton/polyester blended waste fabrics make up a sizable share, and sorting them precisely is essential to increasing recycling value and promoting the circular economy in the textile industry. Traditional mechanical and human sorting techniques are ineffective and inaccurate; current spectral analysis algorithms mainly concentrate on quantitative composition prediction and are insufficiently capable of differentiating between waste fabrics with comparable content gradients. To address these challenges, this paper proposes an improved 1DCNN model (Dual-1DCNN-Residual-SE) integrated with Near-Infrared (NIR) hyperspectral imaging technology. This model takes raw spectral data and Savitzky-Golay (SG) smoothing data as dual-channel inputs, introducing residual connections to capture subtle spectral differences between similar fabric categories, and employs SE attention mechanisms to adaptively enhance key features. Comparative experiments with four traditional algorithms—KNN, RF, SVM, and PLS—demonstrate that the proposed model achieves a classification accuracy of 95.94%, surpassing the best traditional algorithm SVM (88.12%) by 7.82%. Ablation experiments confirm each enhanced module’s efficacy. This study achieves high-precision classification of cotton/polyester blended waste fabrics, providing technical support for intelligent sorting of industrial waste fabrics.

1. Introduction

The rapid development of the global textile industry, coupled with the widespread adoption of fast fashion consumption patterns, has led to a continuous reduction in the lifecycle of textiles. This trend has resulted in the generation of substantial amounts of textile waste, which poses a significant challenge for solid waste management [1]. Statistics reveal that China alone produces over 20 million tons of textile waste each year, yet the overall recycling rate remains below 20% [2]. This figure is markedly lower than the 25% target set for 2025 in the “Implementation Opinions on Accelerating the Recycling of Waste Textiles” [3]. A considerable volume of unused textiles is relegated to landfills or incinerators, leading to considerable resource wastage and environmental pollution. Therefore, achieving efficient and precise sorting of waste textiles—especially blended fabrics such as cotton and polyester—constitutes a crucial prerequisite for enhancing their resource value and promoting a circular economy within the textile sector [4].
In contemporary industrial contexts, the mainstream methods for sorting waste textiles still rely on manual sorting guided by experience or mechanical sorting that utilizes basic optical properties. Although commercial textiles are generally labeled with clear fiber composition ratios, such label information is completely inadequate for sorting in actual waste textile sorting scenarios, and is even inaccessible in many cases [5]. Post-consumer waste textiles, including used garments and bed linens, have labels that are prone to blurring, abrasion or complete loss after long-term use, washing and wearing. In contrast, industrial waste textiles like production leftovers and defective products, unified and standardized labeling is usually lacking, and even existing labels are easily mixed into the waste stream and difficult to trace. Manual label verification is not only time-consuming and labor-intensive but also inefficient, resulting in a high error rate that hinders the large-scale resource utilization of waste textiles [6]. This issue is particularly prominent for cotton/polyester blended waste fabrics with similar content ratios, because the difference in cotton-polyester blend ratios directly determines the recycling pathways, processing efficiency, and quality of recycled products. This challenge represents a fundamental research difficulty, however, with the increasing demand field of waste textile recycling. From the perspective of recycling processes, the pathways for pure cotton and pure polyester fabrics are well established and efficient. Pure cotton fabrics can be regenerated through mechanical crushing, biodegradation and other processes; pure polyester fabrics can be recycled through melt spinning. However, cotton-polyester blended fabrics with different ratios require tailored separation and purification processes; improper classification may result in the failure of subsequent procedures [7,8]. Due to the similar cotton and polyester content in blended waste fabrics, their chemical properties have slight differences, making it difficult for traditional sorting methods to achieve accurate composition identification and classification. Consequently, the development of automated and intelligent identification technologies is not only the key to breaking the bottleneck of waste textile sorting, but also an inevitable trend [9]. In this context, NIR hyperspectral imaging technology exhibits great potential in the non-destructive and rapid identification of material composition. This technology can simultaneously capture spatial and spectral information of the target object, enabling the detection of subtle spectral differences between materials and facilitating high-precision classification [10], thus providing a novel and reliable technical solution for the intelligent sorting of cotton-polyester blended waste fabrics and other solid wastes.
In recent years, component identification schemes combining spectral detection technology with algorithms have been extensively investigated in the field of resource recovery from waste textiles, owing to their non-destructive nature, efficiency, and cost-effectiveness. Within machine learning methodologies, Partial Least Squares (PLS) has emerged as a prominent algorithm for quantitative spectral analysis and is widely utilized for detecting blended content in textiles. Paz and Sousa [11] utilized Partial Least Squares (PLS) to quantitatively predict cotton/polyester blend ratios. However, this approach demonstrates limited capacity for fitting nonlinear features in NIR hyperspectral data, leading to increased errors among samples with similar fiber compositions. Liu et al. [12] and Rashed et al. [13] applied Support Vector Machine (SVM) and Random Forest (RF) algorithms, respectively. Although they attempted qualitative classification and robust optimization, they encountered difficulties in accurately extracting subtle differential features from NIR hyperspectral data, ultimately failing to satisfy the requirements for industrial-level content classification. Deep learning has demonstrated excellent feature learning and nonlinear fitting capabilities in various research fields. For instance, in image dehazing, Zhang et al. proposed a wavelet-based physics guided normalization network (WBPGNDN), which demonstrated excellent haze removal performance in real-time traffic [14]. In medical image analysis, segmentation technologies utilizing deep convolutional neural networks have emerged as a focal point in computer vision, significantly advancing the field of smart healthcare [15]. In intelligent detection, U-Net and YOLOv4 models based on deep neural networks have been effectively employed for detecting steel surface defects, thereby enhancing the accuracy and efficiency of industrial assessments [16]. As a typical representative of deep learning, Convolutional Neural Networks (CNNs) are feedforward neural networks with specific depths that optimize parameters through gradient descent algorithms [17]. Traditional CNNs are mostly used for processing two-dimensional and three-dimensional image data. However, with the integration of deep learning and spectral technology, 1D-CNNs have gained prominence in the analysis of one-dimensional NIR hyperspectral data [18]. By leveraging their local receptive fields and weight-sharing properties, 1D-CNNs efficiently extract spectral features and process nonlinear NIR hyperspectral data, showcasing significant application potential in agriculture, medicine, food, and other fields. In textile inspection, various models reveal considerable differences in design objectives and technical approaches, resulting in varying degrees of adaptation to the recycling and classification requirements of blended waste fabrics. Huang et al. [19] utilized a traditional 1D CNN for the regression prediction of blended compositions and assessed the influence of various preprocessing methods on the 1D CNN model. Their primary aim was to accurately determine blend ratios, which contrasts sharply with the classification and sorting focus of the present study. In a different approach, Chen et al. [20] developed a dual-input multi-scale 1D CNN model for predicting cashmere-wool fiber content. They constructed dual input features from both raw spectral data and dimension-reduced data to validate multi-channel feature fusion. However, their reliance on only raw spectral data limited the full utilization of spectral information. Qiu et al. [21] sought to introduce a residual module into the 1D CNN to address the vanishing gradient problem. Nonetheless, their single-channel input architecture was restricted to extracting features from preprocessed NIR hyperspectral data, resulting in a limited feature representation dimension. Additionally, it did not effectively enhance key spectral features sensitive to variations in cotton/polyester content, leading to inadequate model discrimination capability for cotton/polyester blended waste fabrics with similar content gradients.
This paper integrates NIR hyperspectral imaging technology with deep learning techniques to propose an enhanced dual-input 1DCNN model (Dual-1DCNN-Residual-SE). The model generates input features by concatenating dimensions of raw NIR hyperspectral data with SG-smoothed NIR hyperspectral data. It addresses gradient vanishing issues during deep network training through a residual module and improves the weighting of key spectral features using the SE attention mechanism, ultimately achieving high-precision classification of five categories of cotton/polyester blended waste fabrics. To further assess the optimization effects of the attention mechanism, comparative experiments involving various attention mechanisms (e.g., CBAM, ECA) were conducted to systematically evaluate the influence of different attention modules on spectral feature extraction. Ablation experiments examined the individual contributions of dual-channel input, the residual module, and the SE attention mechanism, thereby providing technical support for the intelligent sorting of industrial waste fabrics.

2. Results and Discussion

2.1. Sample Division

This experiment used 80 independent cotton/polyester blended fabric samples, which were stratified into training, validation, and test sets at a ratio of 6:1:1 per group. Subsequently, a total of 14,116 near-infrared hyperspectral data points were collected from the divided samples for model training and evaluation. The training set was used for parameter iteration and feature learning within the neural network model. The validation set served to monitor overfitting during model training and to select optimal parameters based on accuracy. The test set consisted of samples that were independent of the training process, thereby verifying the model’s actual classification prediction performance. The dataset division ensures consistent category distribution across subsets, avoiding the impact of sample imbalance on model training. The division of the near-infrared hyperspectral dataset for cotton/polyester blended waste fabrics is shown in Table 1.

2.2. Model Training for Classification Prediction

Model training utilizes a cross-entropy loss function with class weights to balance the training weights of samples exhibiting varying cotton/polyester content ratios. The Adam optimizer is employed to iteratively update the network parameters. The learning rate is established at 0.01, with a batch size of 32 and a maximum training iteration limit of 50 epochs. To mitigate ineffective iterations and prevent overfitting, an early stopping strategy is implemented (Patience = 10): training halts and the current optimal model parameters are saved if the weighted F1 score on the validation set does not improve over 10 consecutive iterations.
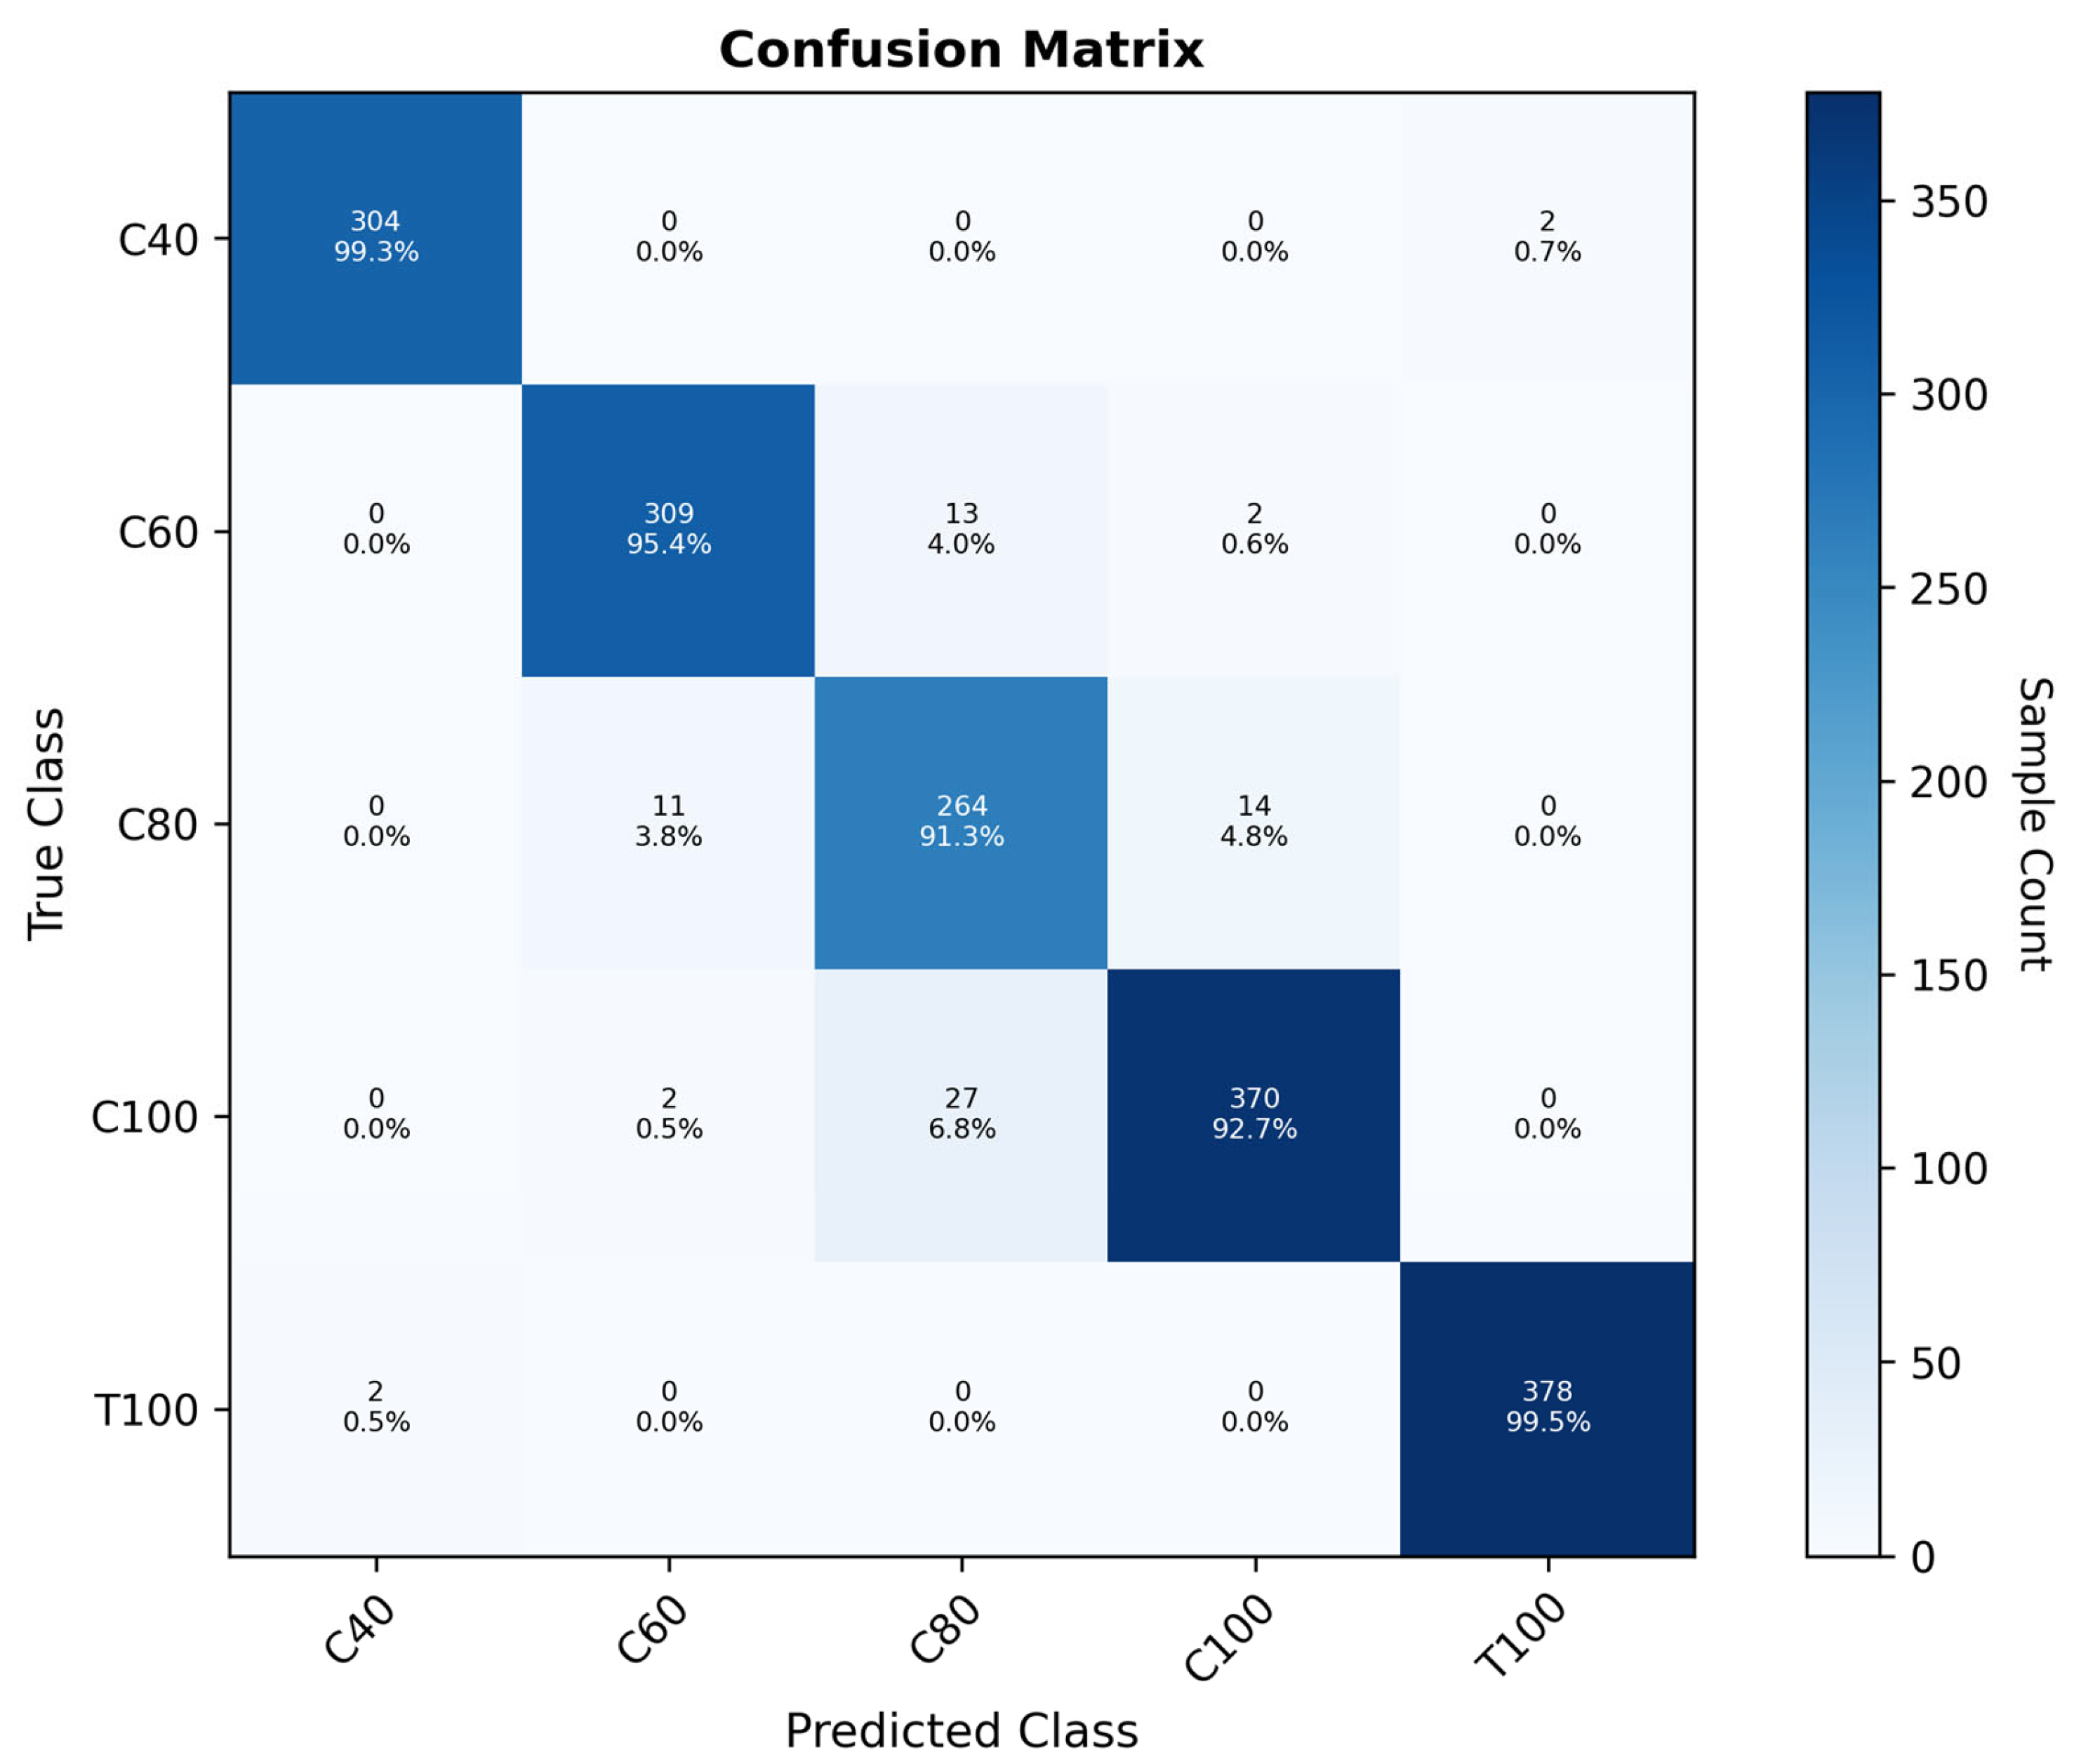
The confusion matrix of the Dual-1DCNN-Residual-SE model on the test set is presented in Figure 1. Each cell displays the sample count and classification percentage. The total number of C40 samples is 306, with 304 correctly predicted (99.3%). For C60 samples, the total is 324, with 309 correctly predicted (95.4%). The C80 category consists of 289 samples, with 264 correctly predicted (91.3%), while the C100 category includes 399 samples, with 370 correctly predicted (92.7%). Lastly, the T100 category has 380 samples, with 378 correctly predicted (99.5%). Notably, the C80 and C100 sample categories demonstrate some degree of mutual misclassification with the C80 and C60 categories. This misclassification is caused by the similar spectral absorption characteristics of C60, C80 and C100 in the near-infrared region, which leads to overlapping feature distributions. The recognition performance for the remaining categories is satisfactory, suggesting that the model can effectively differentiate among various cotton/polyester blended fabrics.

2.3. Comparative Experiment

In order to assess the classification performance of the Dual-1DCNN-Residual-SE model introduced in this study, K-nearest neighbors (KNN) [22], Random Forest (RF) [23], Support Vector Machine (SVM) [24], and Partial Least Squares (PLS) [25] were utilized as baseline models for comparative analysis with the Dual-1DCNN-Residual-SE model. To ensure a fair comparison, all models utilized consistent input data: raw NIR hyperspectral reflectance (RAW) and SG-smoothed NIR hyperspectral data (SG) were used as input features. Model training and evaluation followed a 6:1:1 training-validation-test dataset split. The classification outcomes for the various models are detailed in Table 2.
As shown in Table 2, compared with the RAW input, the SG preprocessing improves the classification accuracy of KNN, RF, and the Dual-1DCNN-Residual-SE model. In particular, the Dual-1DCNN-Residual-SE model achieves an accuracy improvement of 1.48% (from 92.34% to 93.82%) after SG smoothing. This finding confirms that SG preprocessing effectively mitigates noise in NIR hyperspectral data, reduces the impact of redundant information, and improves the expression of spectral features. Under SG preprocessing, the Dual-1DCNN-Residual-SE model achieves a classification accuracy of 93.82%, which is 11.96% higher than the KNN algorithm and significantly outperforms traditional machine learning methods such as SVM and PLS. This improvement can be attributed to the residual connections in the proposed model, which preserve shallow-layer features while strengthening the reuse of deep features, thus addressing the vanishing gradient problem in deep networks. Meanwhile, the SE channel attention mechanism adaptively assigns weights to different spectral channels, enhancing the response of key feature bands, further improving the classification accuracy of the model. In summary, the Dual-1DCNN-Residual-SE model combined with SG preprocessing, effectively achieves high-precision classification of cotton/polyester blended waste fabrics.

2.4. Comparative Experiment of Attention Mechanisms

To further verify the adaptability and superiority of the SE attention mechanism for spectral classification tasks, a series of controlled comparison experiments were designed. The Dual-1DCNN-Residual baseline was employed, maintaining a consistent dual-channel input structure, residual modules, and all training hyperparameters, including learning rate, batch size, and early stopping strategy. The only variable was the attention module; the original SE module was substituted with two widely utilized attention mechanisms: the ECA lightweight channel attention and the CBAM convolutional block attention. All models were evaluated on the same test set, using classification accuracy and F1-score as the primary metrics. As shown in Table 3, incorporating any of the three attention mechanisms leads to a significant performance improvement. Compared with the non-attention baseline model (87.99%), the accuracy of the models with ECA, CBAM, and SE attention is increased by more than 6%, demonstrating the effectiveness of attention mechanisms in enhancing spectral feature learning. Among them, the Dual-1DCNN-Residual-SE model achieves the highest accuracy of 95.94% and the best F1-score of 95.71%, outperforming both the ECA and CBAM variants. These results indicate that the SE attention mechanism can more effectively weight and enhance critical spectral channels, making it more suitable for the near-infrared hyperspectral classification task in this study.

2.5. Ablation Experiment

To assess the impact of each module and input pattern on the classification performance of Dual-1DCNN-Residual-SE, a series of ablation experiments were conducted on the self-built dataset. Several control models were established for comparison: a dual-channel model without the residual module (No_Residual), a dual-channel model without the attention module (No_attention), a traditional 1DCNN model with dual-channel input, and the complete Dual-1DCNN-Residual-SE model. The results of the ablation experiments are presented in Table 4.
The results in Table 4 (combined with Table 2) show that the Dual-1DCNN-Residual-SE model achieves a classification accuracy of 95.94%, representing a 3.6% increase over the single-channel RAW input and a 2.12% increase over the single-channel SG input. This confirms that the dual-channel input strategy can effectively integrate complementary spectral information and improve feature representation. Compared with the model without the residual module, the full model improves accuracy by 5.25%, while it outperforms the model without the attention module by 7.95%. In addition, compared with the traditional 1DCNN baseline, the proposed model increases accuracy by 11.11%, demonstrating the significant contributions of the residual and attention modules to performance improvement. In conclusion, the Dual-1DCNN-Residual-SE model significantly improves classification accuracy in the recognition of cotton/polyester blended waste fabric.

2.6. t-SNE Visualization and Dimensionality Reduction Analysis

t-Distributed Stochastic Neighbor Embedding (t-SNE) is a nonlinear dimensionality reduction and visualization algorithm introduced by van der Maaten and Hinton in 2008 [26]. The primary aim of t-SNE is to map samples from high-dimensional data spaces to low-dimensional representations while preserving local structural features to the greatest extent possible. This approach facilitates intuitive visualization, aiding in the analysis of distribution patterns and intrinsic relationships within high-dimensional data. In this study, t-SNE is used for qualitative interpretability to explain misclassification patterns. Prior to t-SNE visualization, PCA was applied to reduce the dimensionality of high-dimensional spectral data, retaining 95% of the cumulative variance. The critical hyperparameters for t-SNE were configured as: n_components = 2, perplexity = 30, learning_rate = 200, n_iter = 1000, and random_state = 42 to ensure the repeatability of the visualization results.
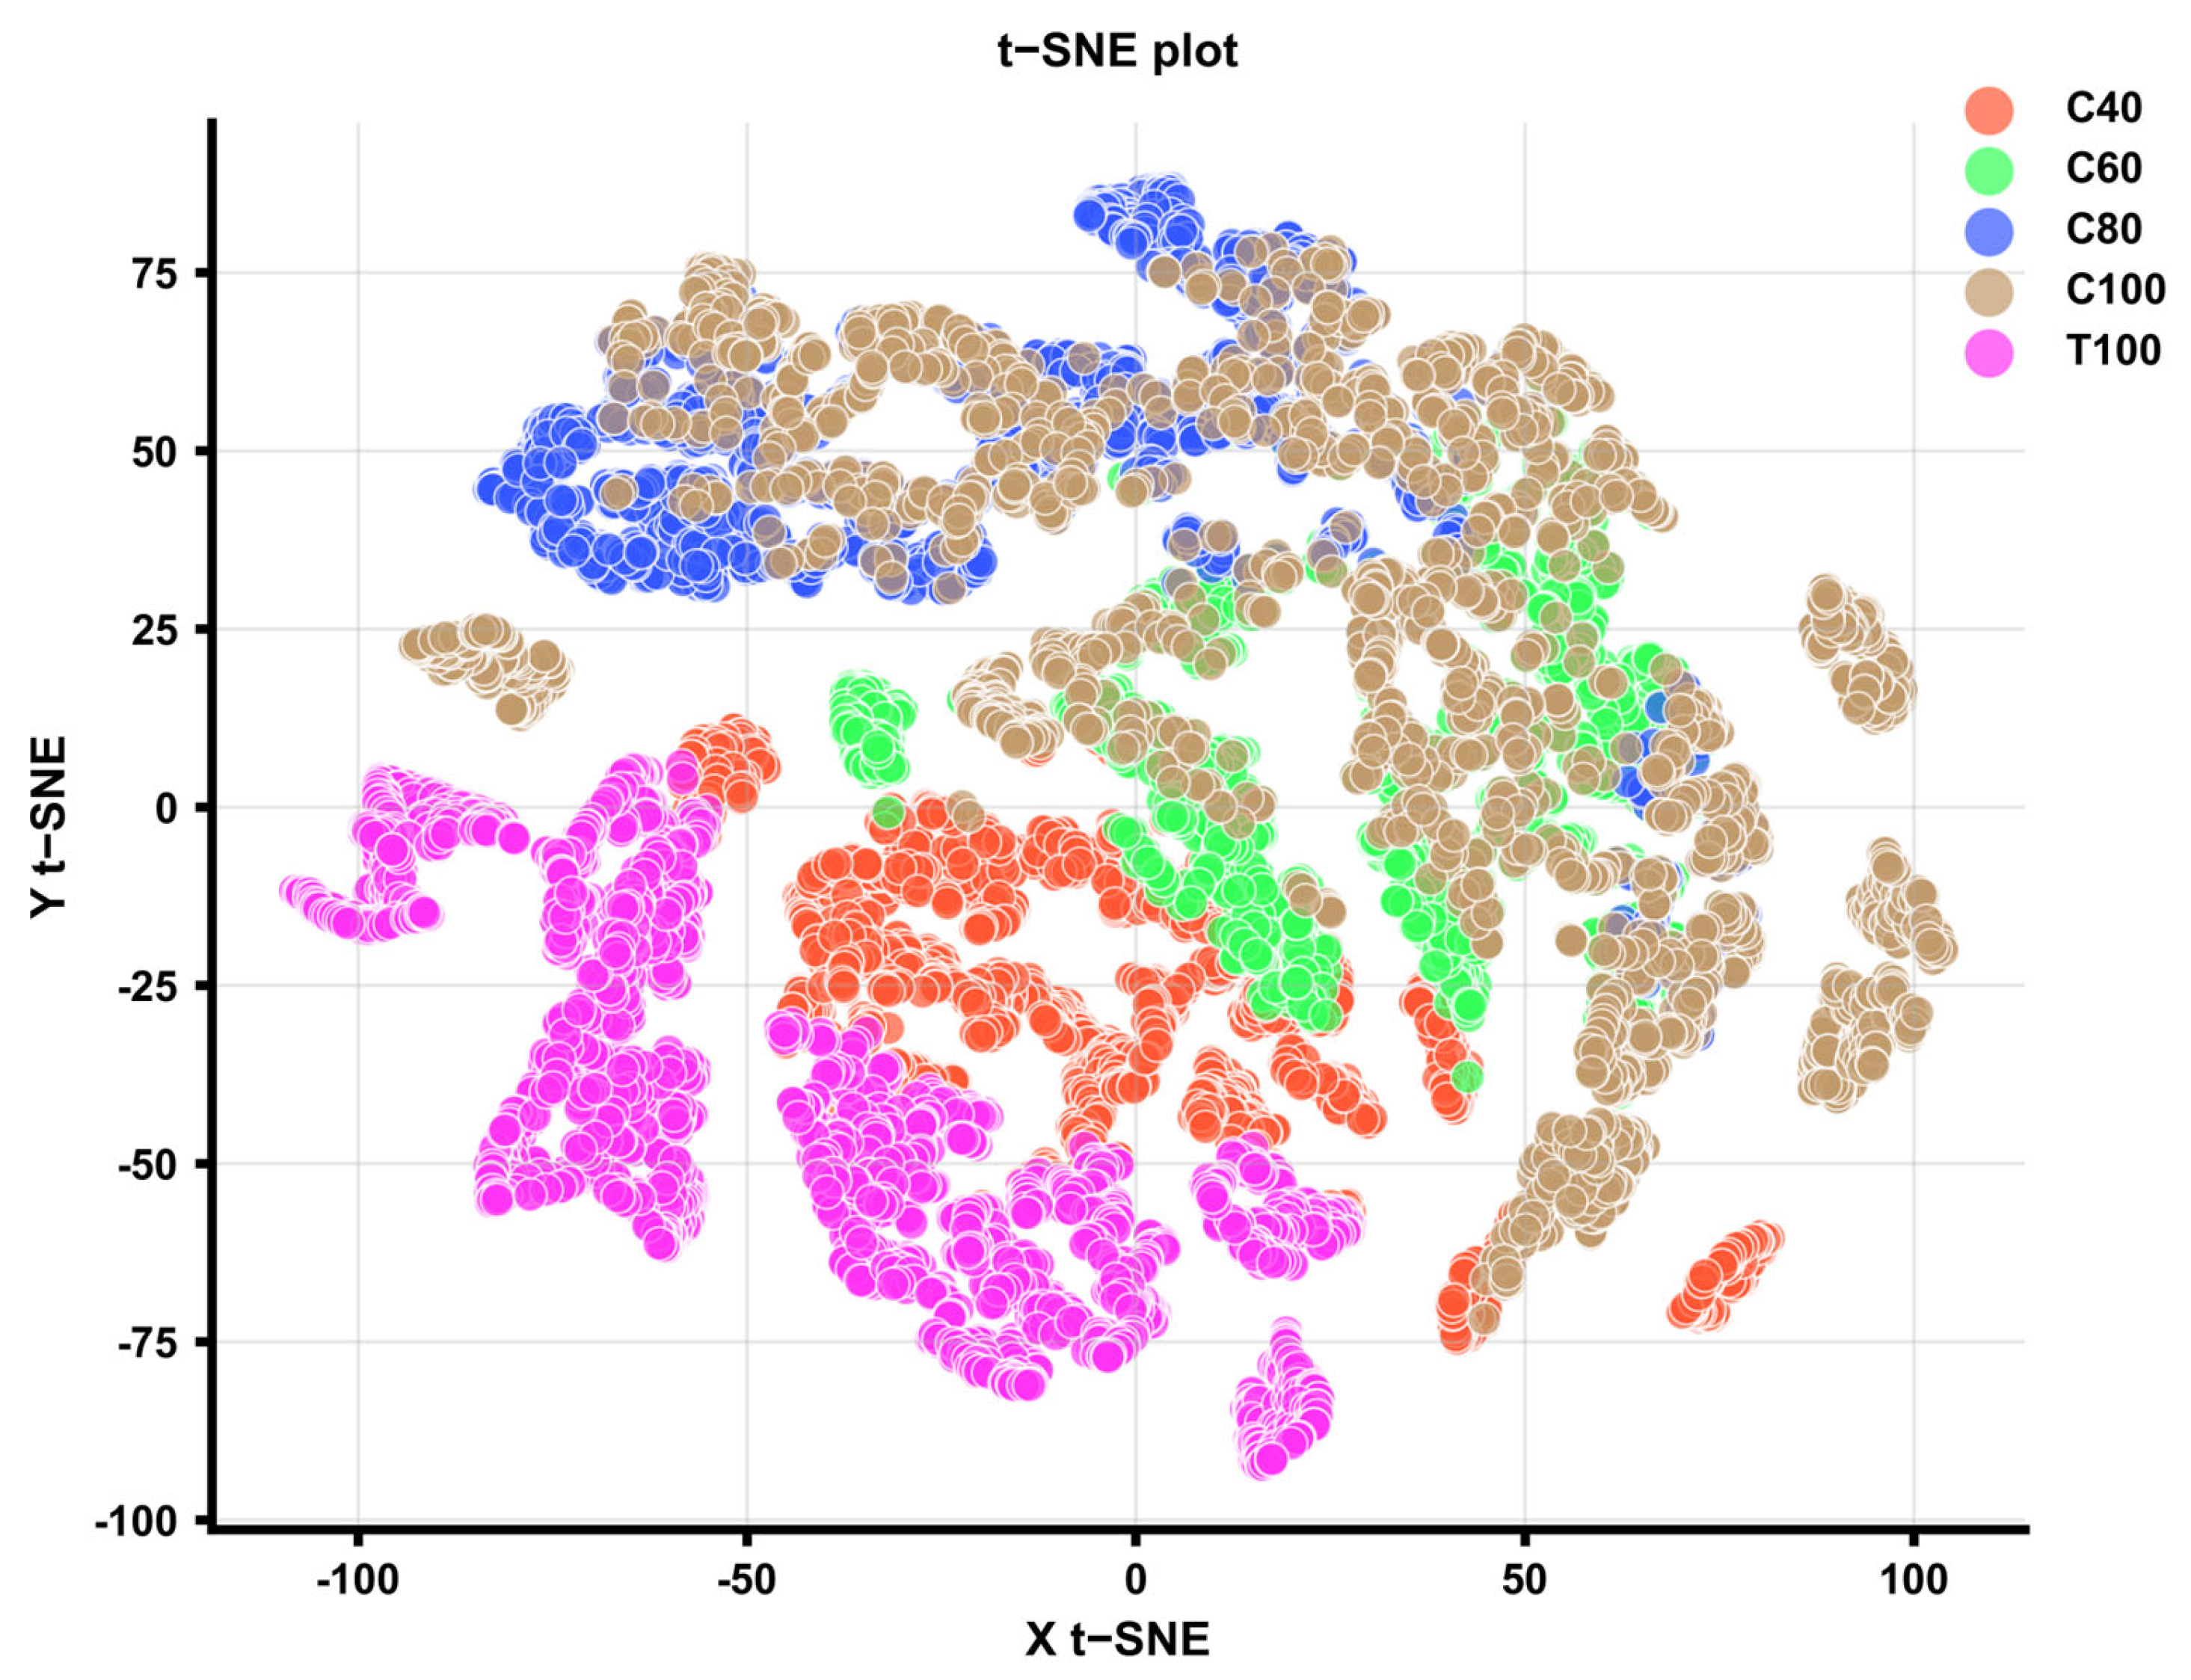
The t-SNE visualization and dimensionality reduction analysis of five groups cotton/polyester blends are depicted in Figure 2. In the figure, C40 is represented by red, C60 by green, C80 by blue, C100 by brown, and T100 by pink. The visualization shows partial overlap between the brown (C100) and blue (C80) regions, with minor overlap with the green (C60) region; the pink (T100) region also exhibits slight intersection with the red (C40) region. This cluster overlap reflects the intrinsic spectral similarity between these categories rather than indicating limitations of the classification model, which aligns with the misclassification patterns observed in the confusion matrix (Figure 1). The overlap between C100 and C80 clusters corresponds to their mutual misclassification, which is attributed to the similar hydroxyl group absorption characteristics in their NIR spectra. Pure polyester fabrics, having a distinct chemical composition from pure cotton, markedly differ from fabrics with higher cotton content. These findings are consistent with the conclusions drawn from the average curve of the NIR hyperspectral data discussed earlier. They also explain the lower accuracy of the C100 group in the confusion matrix compared to other groups, as the C100 group is often misclassified as either the C80 or C60 group. Additionally, mutual misclassification is observed between the T100 group and the C40 group.

3. Materials and Methods

3.1. Experimental Instruments and Samples

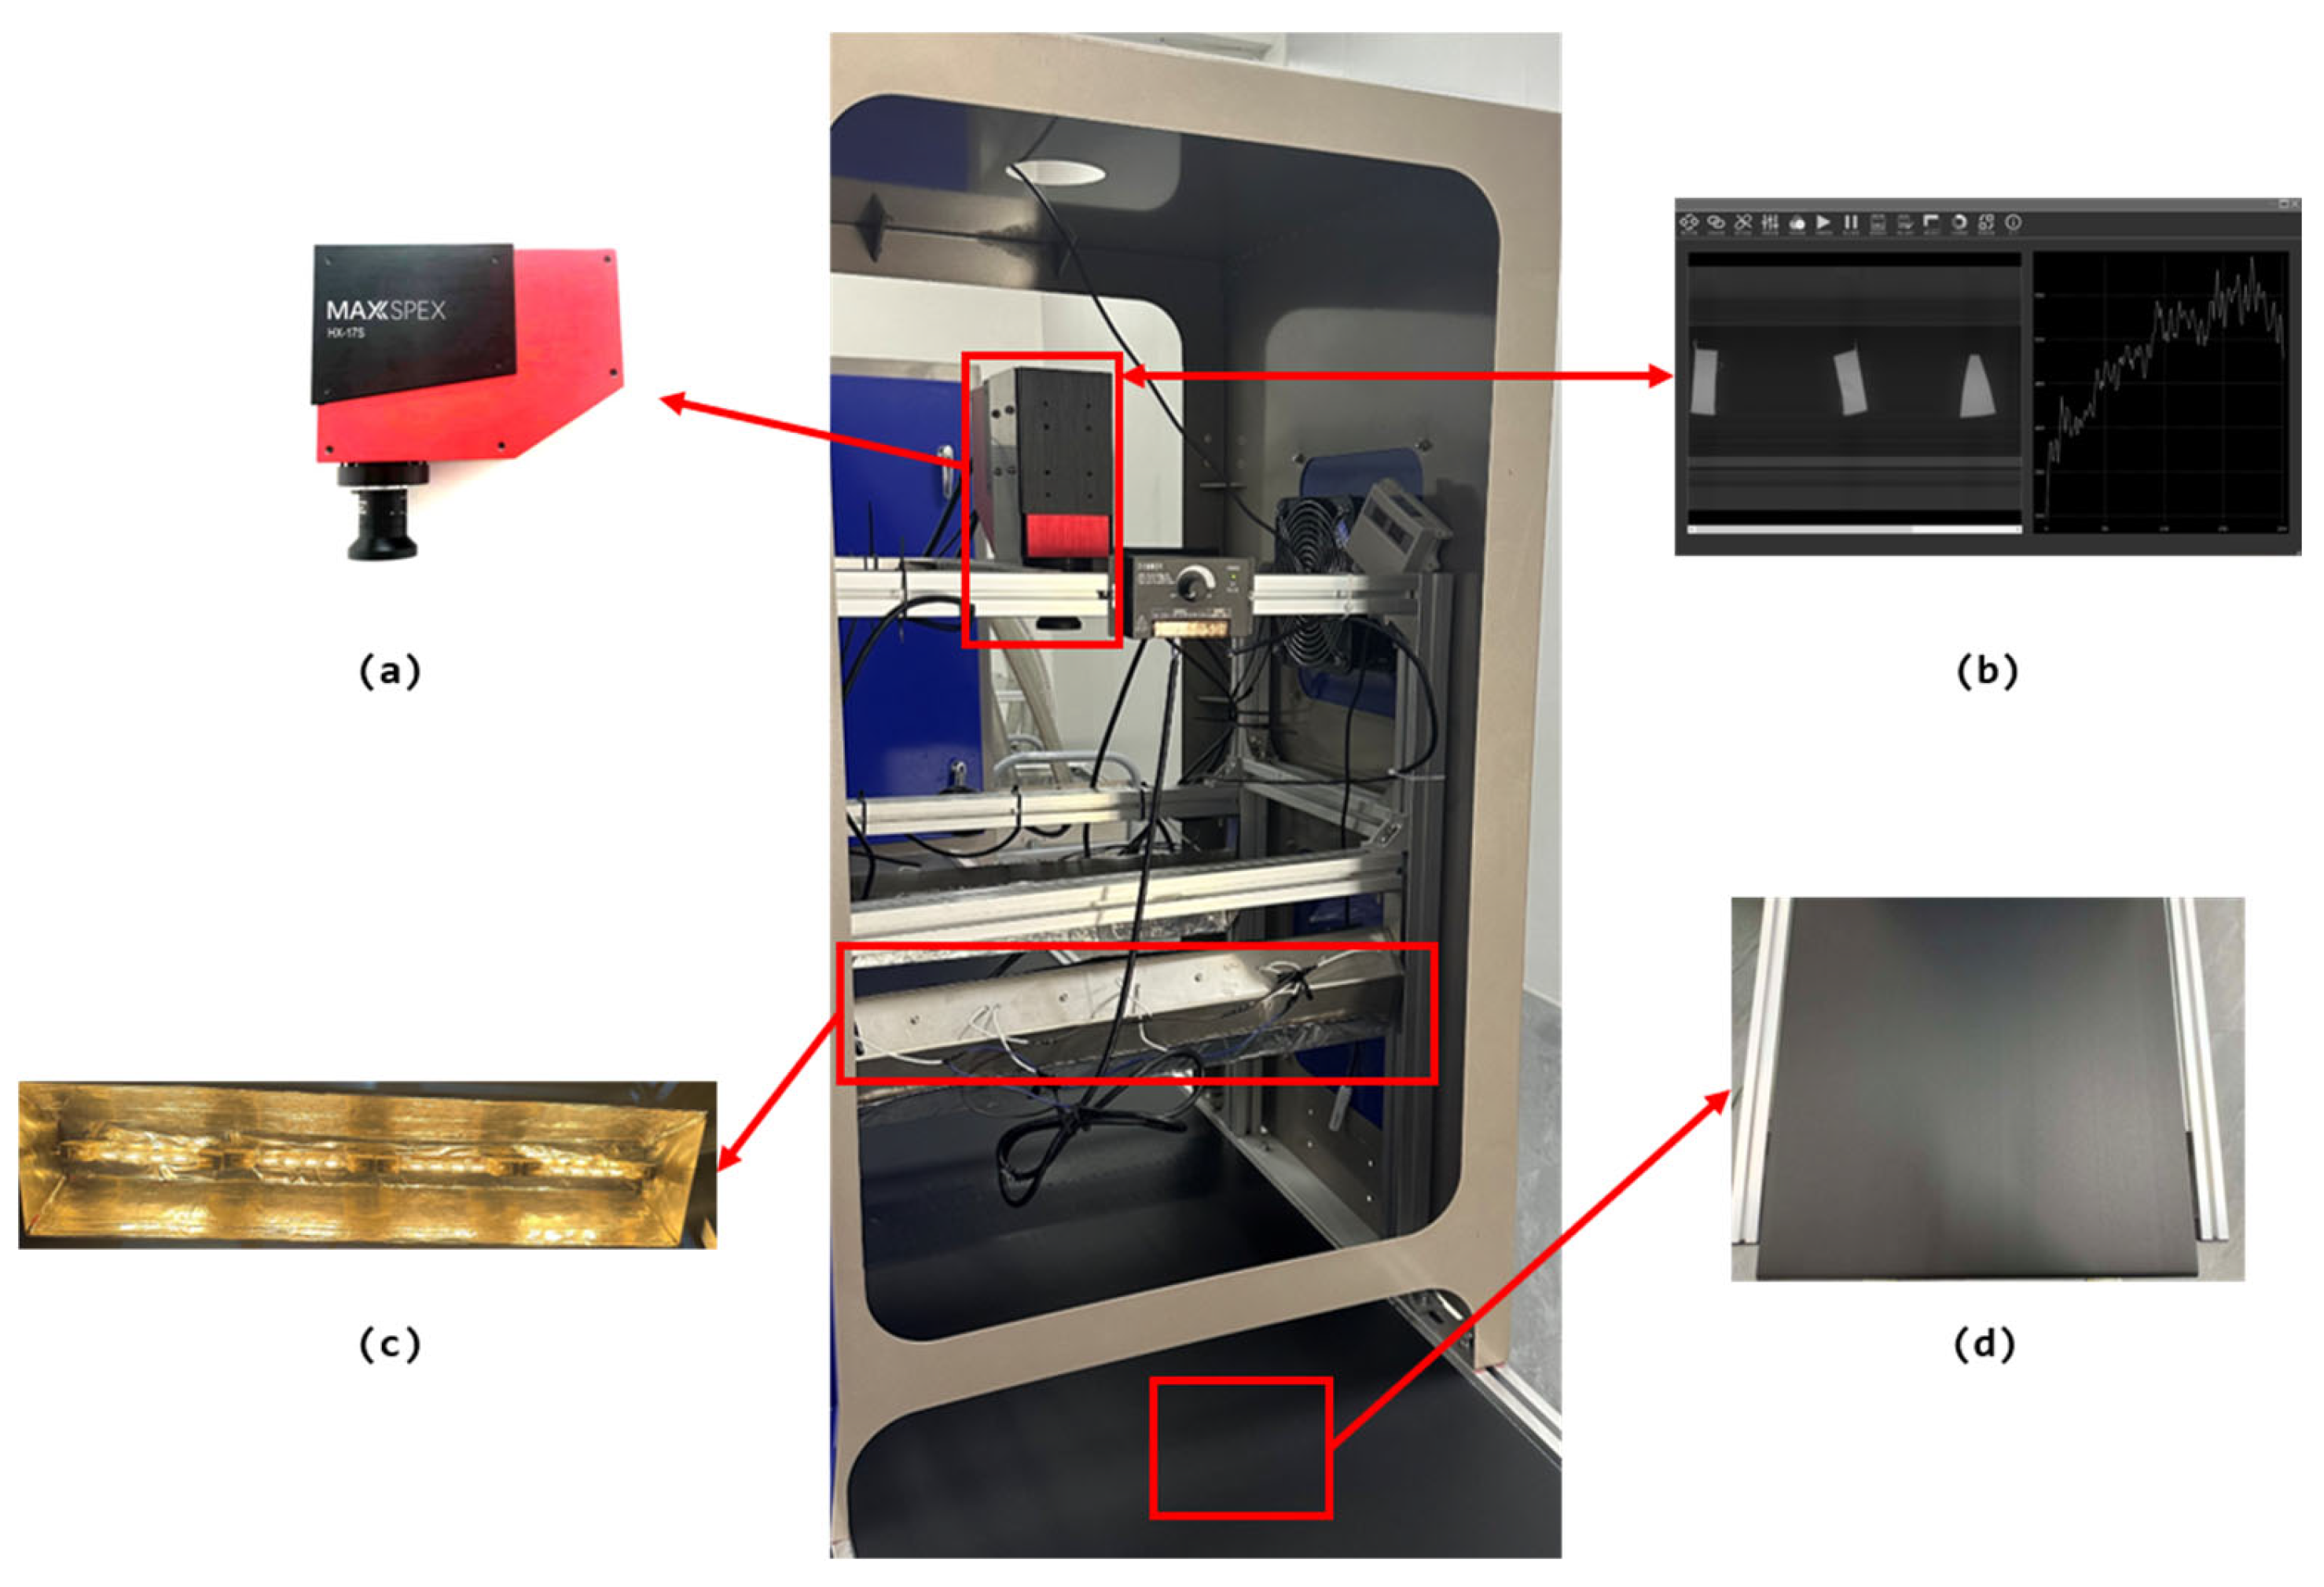
The experimental platform includes a NIR hyperspectral camera, a light source, a conveyor belt (Figure 3d), and an industrial control computer (Figure 3b), as illustrated in Figure 3, which depicts the NIR hyperspectral acquisition and sorting system. The HX-17S NIR hyperspectral camera, manufactured by Hangzhou Gaopu Imaging Technology Co., Ltd., Hangzhou, China (Figure 3a), was employed to capture NIR hyperspectral images of waste fabrics with varying cotton/polyester content. The distance between the lens and the fabric was maintained at 70 cm, while the platform moved at a speed of 1 m/s. Detailed parameters, including the spectral range, are provided in Table 5. The light source consisted of two rows of eight 100 W adjustable-power halogen bulbs (Figure 3c).
The experiment utilized 80 samples of waste cotton/polyester blended fabrics with varying content ratios, provided by the Zhejiang Institute of Quality Sciences (ZIQS). Each fabric sample was labeled to indicate its quantitative composition. Before the experiment commenced, all samples were documented. The fabrics were then categorized into five groups based on their cotton/polyester content ratios, as detailed in Table 6 (where C represents cotton and T represents polyester). The interval classification of cotton content simulates the actual composition gradient of industrial cotton/polyester blended waste fabrics, and the sample quantity is determined based on the actual proportion of waste fabrics in industrial recycling. The total number of experimental samples is 80.

3.2. Black-and-White Correction

In the RGB color system, a standard photograph consists of three channels, each representing a grayscale image. Each pixel is associated with three brightness values, typically ranging from 0 to 255. In contrast, NIR hyperspectral images comprise 512 bands, with each band serving as a grayscale image that contains brightness information. Each pixel within these bands corresponds to a brightness value, which reflects the radiation captured by the camera’s internal sensor. In the context of NIR hyperspectral data, this brightness value is designated as a Digital Number (DN). These DN values are obtained using a NIR hyperspectral camera.
To mitigate the effects of environmental factors, such as dark current and unstable light sources, on NIR hyperspectral images during data acquisition, it is essential to apply black-and-white correction when converting DN values into more physically meaningful reflectance values. Initially, raw NIR hyperspectral data of the sample are obtained using the camera’s built-in software. Following this, raw NIR hyperspectral data of a standard white plate and a black background are collected to facilitate the black-and-white calibration. The calibration formula is represented as Equation (1):
R = D D d c D r f D d c R r f
In the equation, R represents the corrected reflectance value of the sample; D denotes the corrected DN value of the sample; D d c   indicates the DN value of the black background; D r f signifies the DN value of the corrected whiteboard; ⨀ denotes bitwise multiplication; R r f represents the reflectance value of the corrected whiteboard.

3.3. Data Analysis

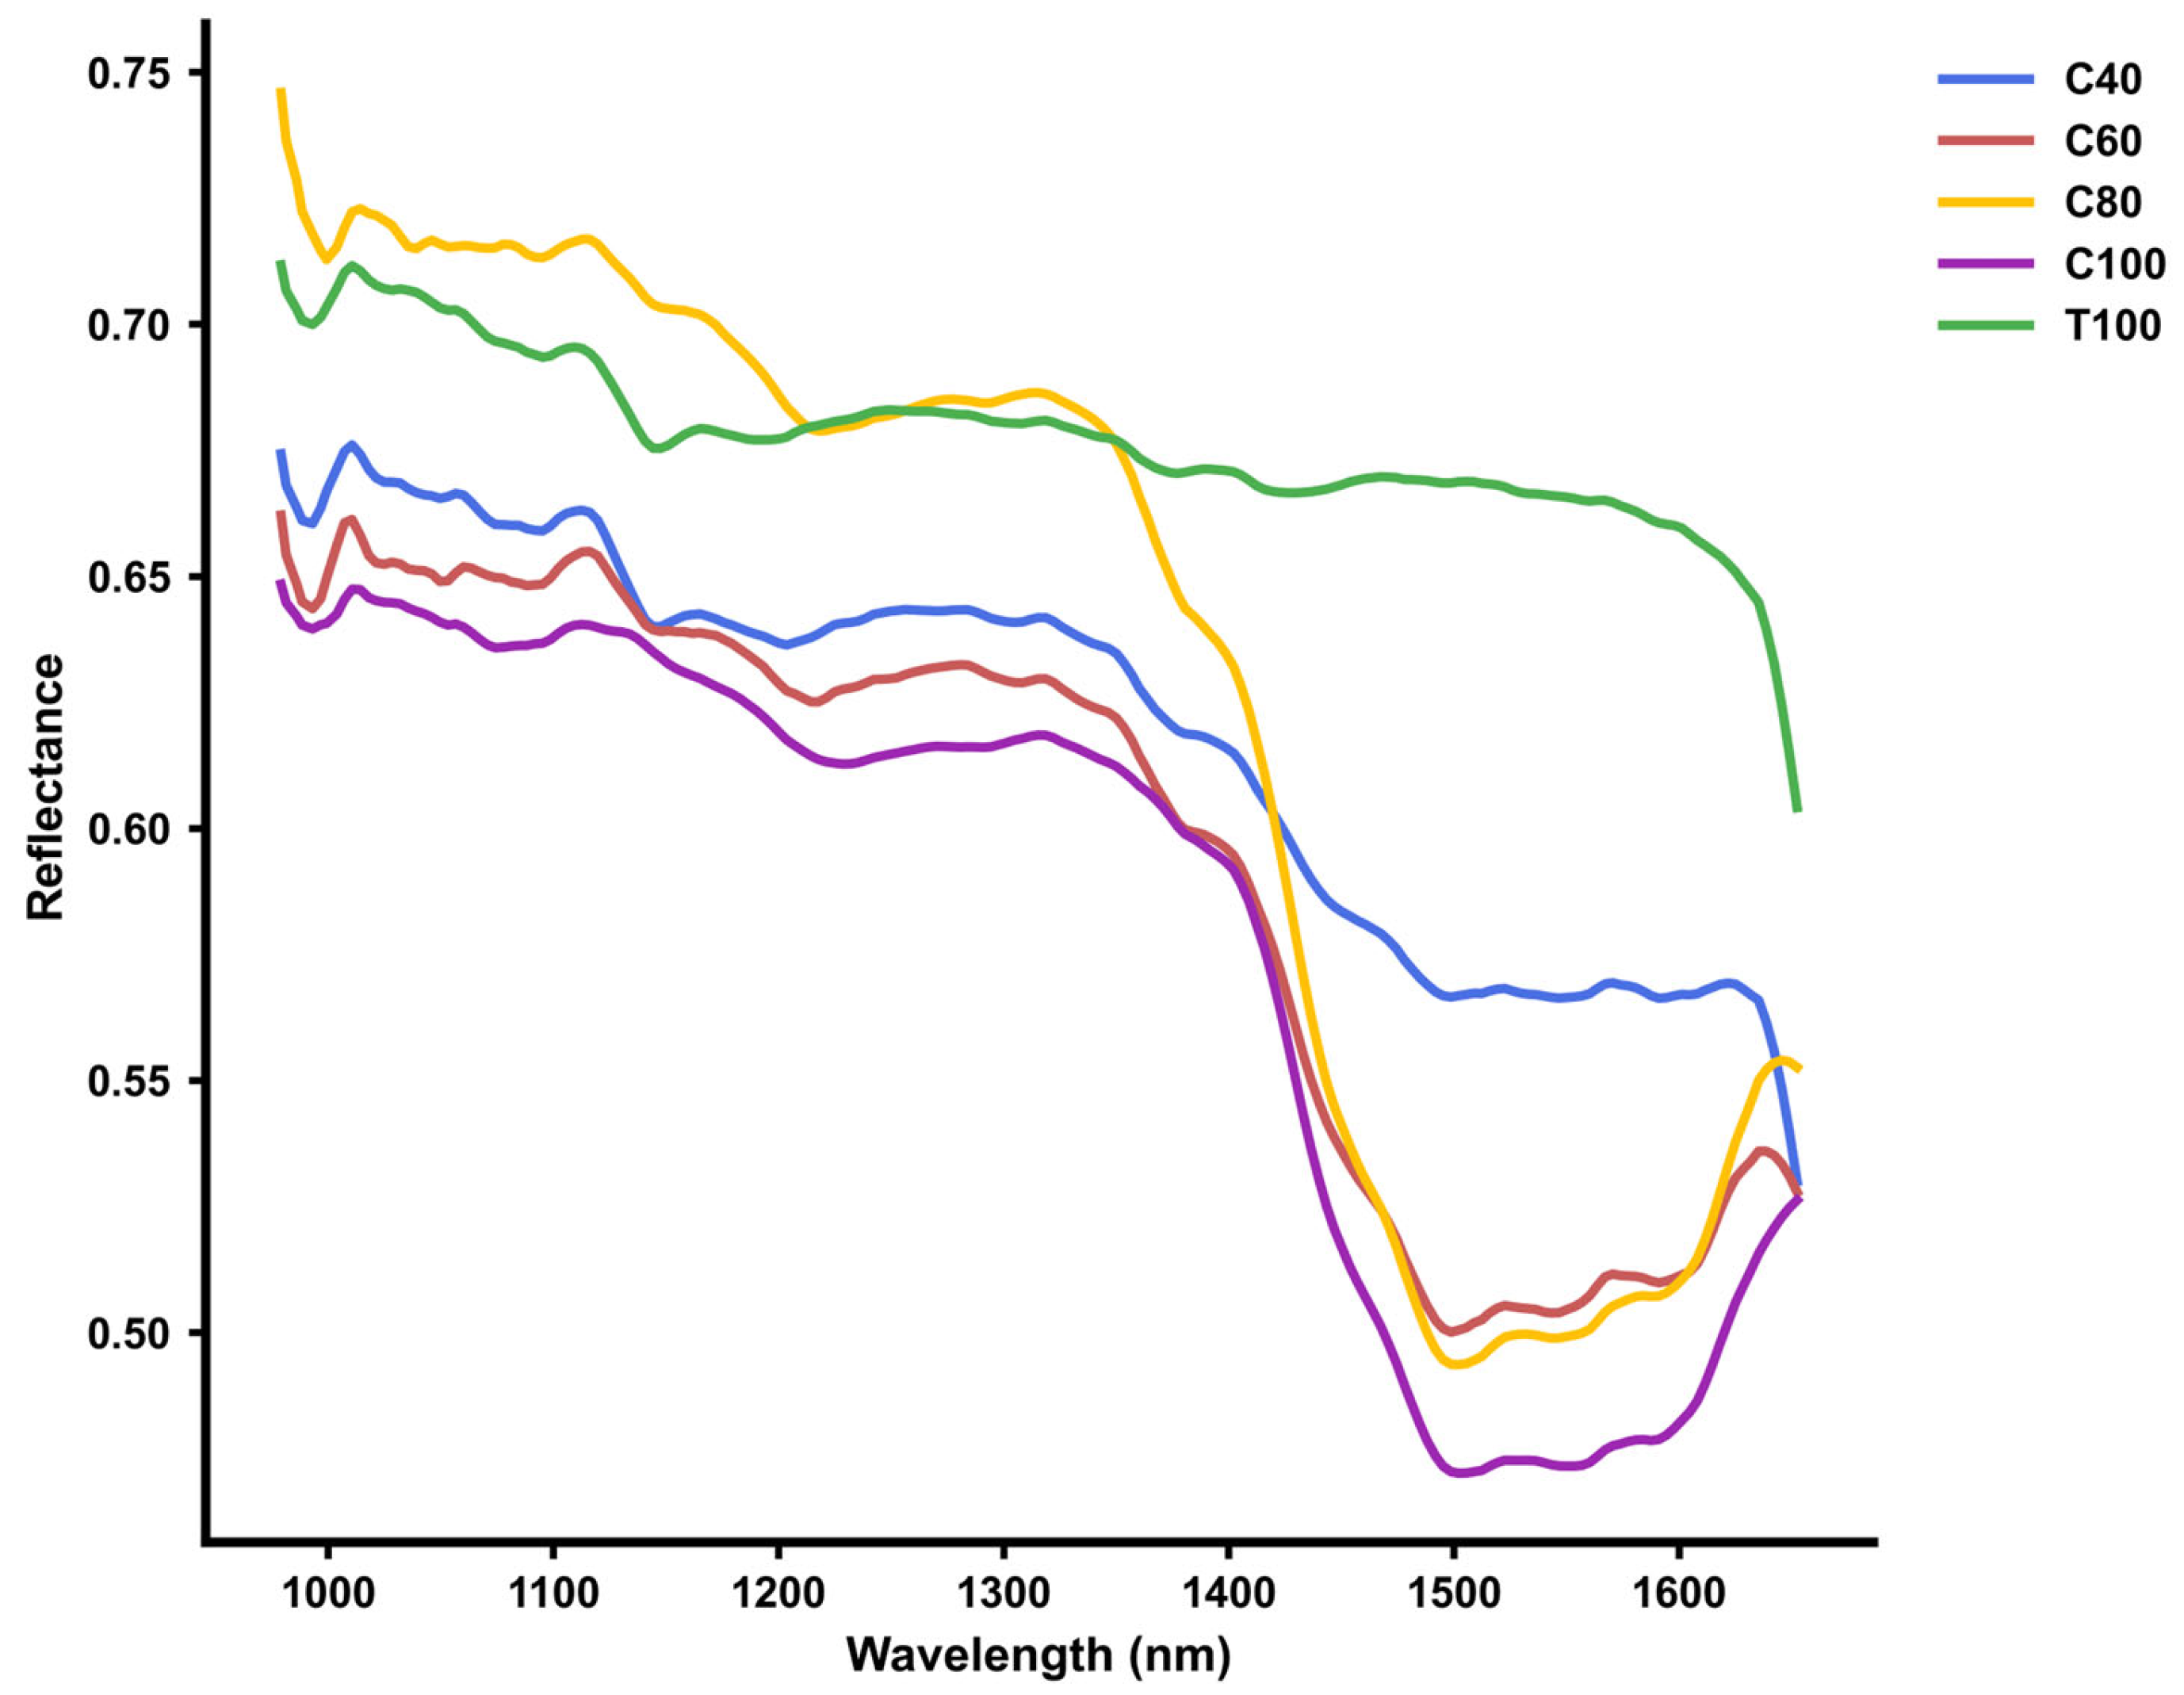
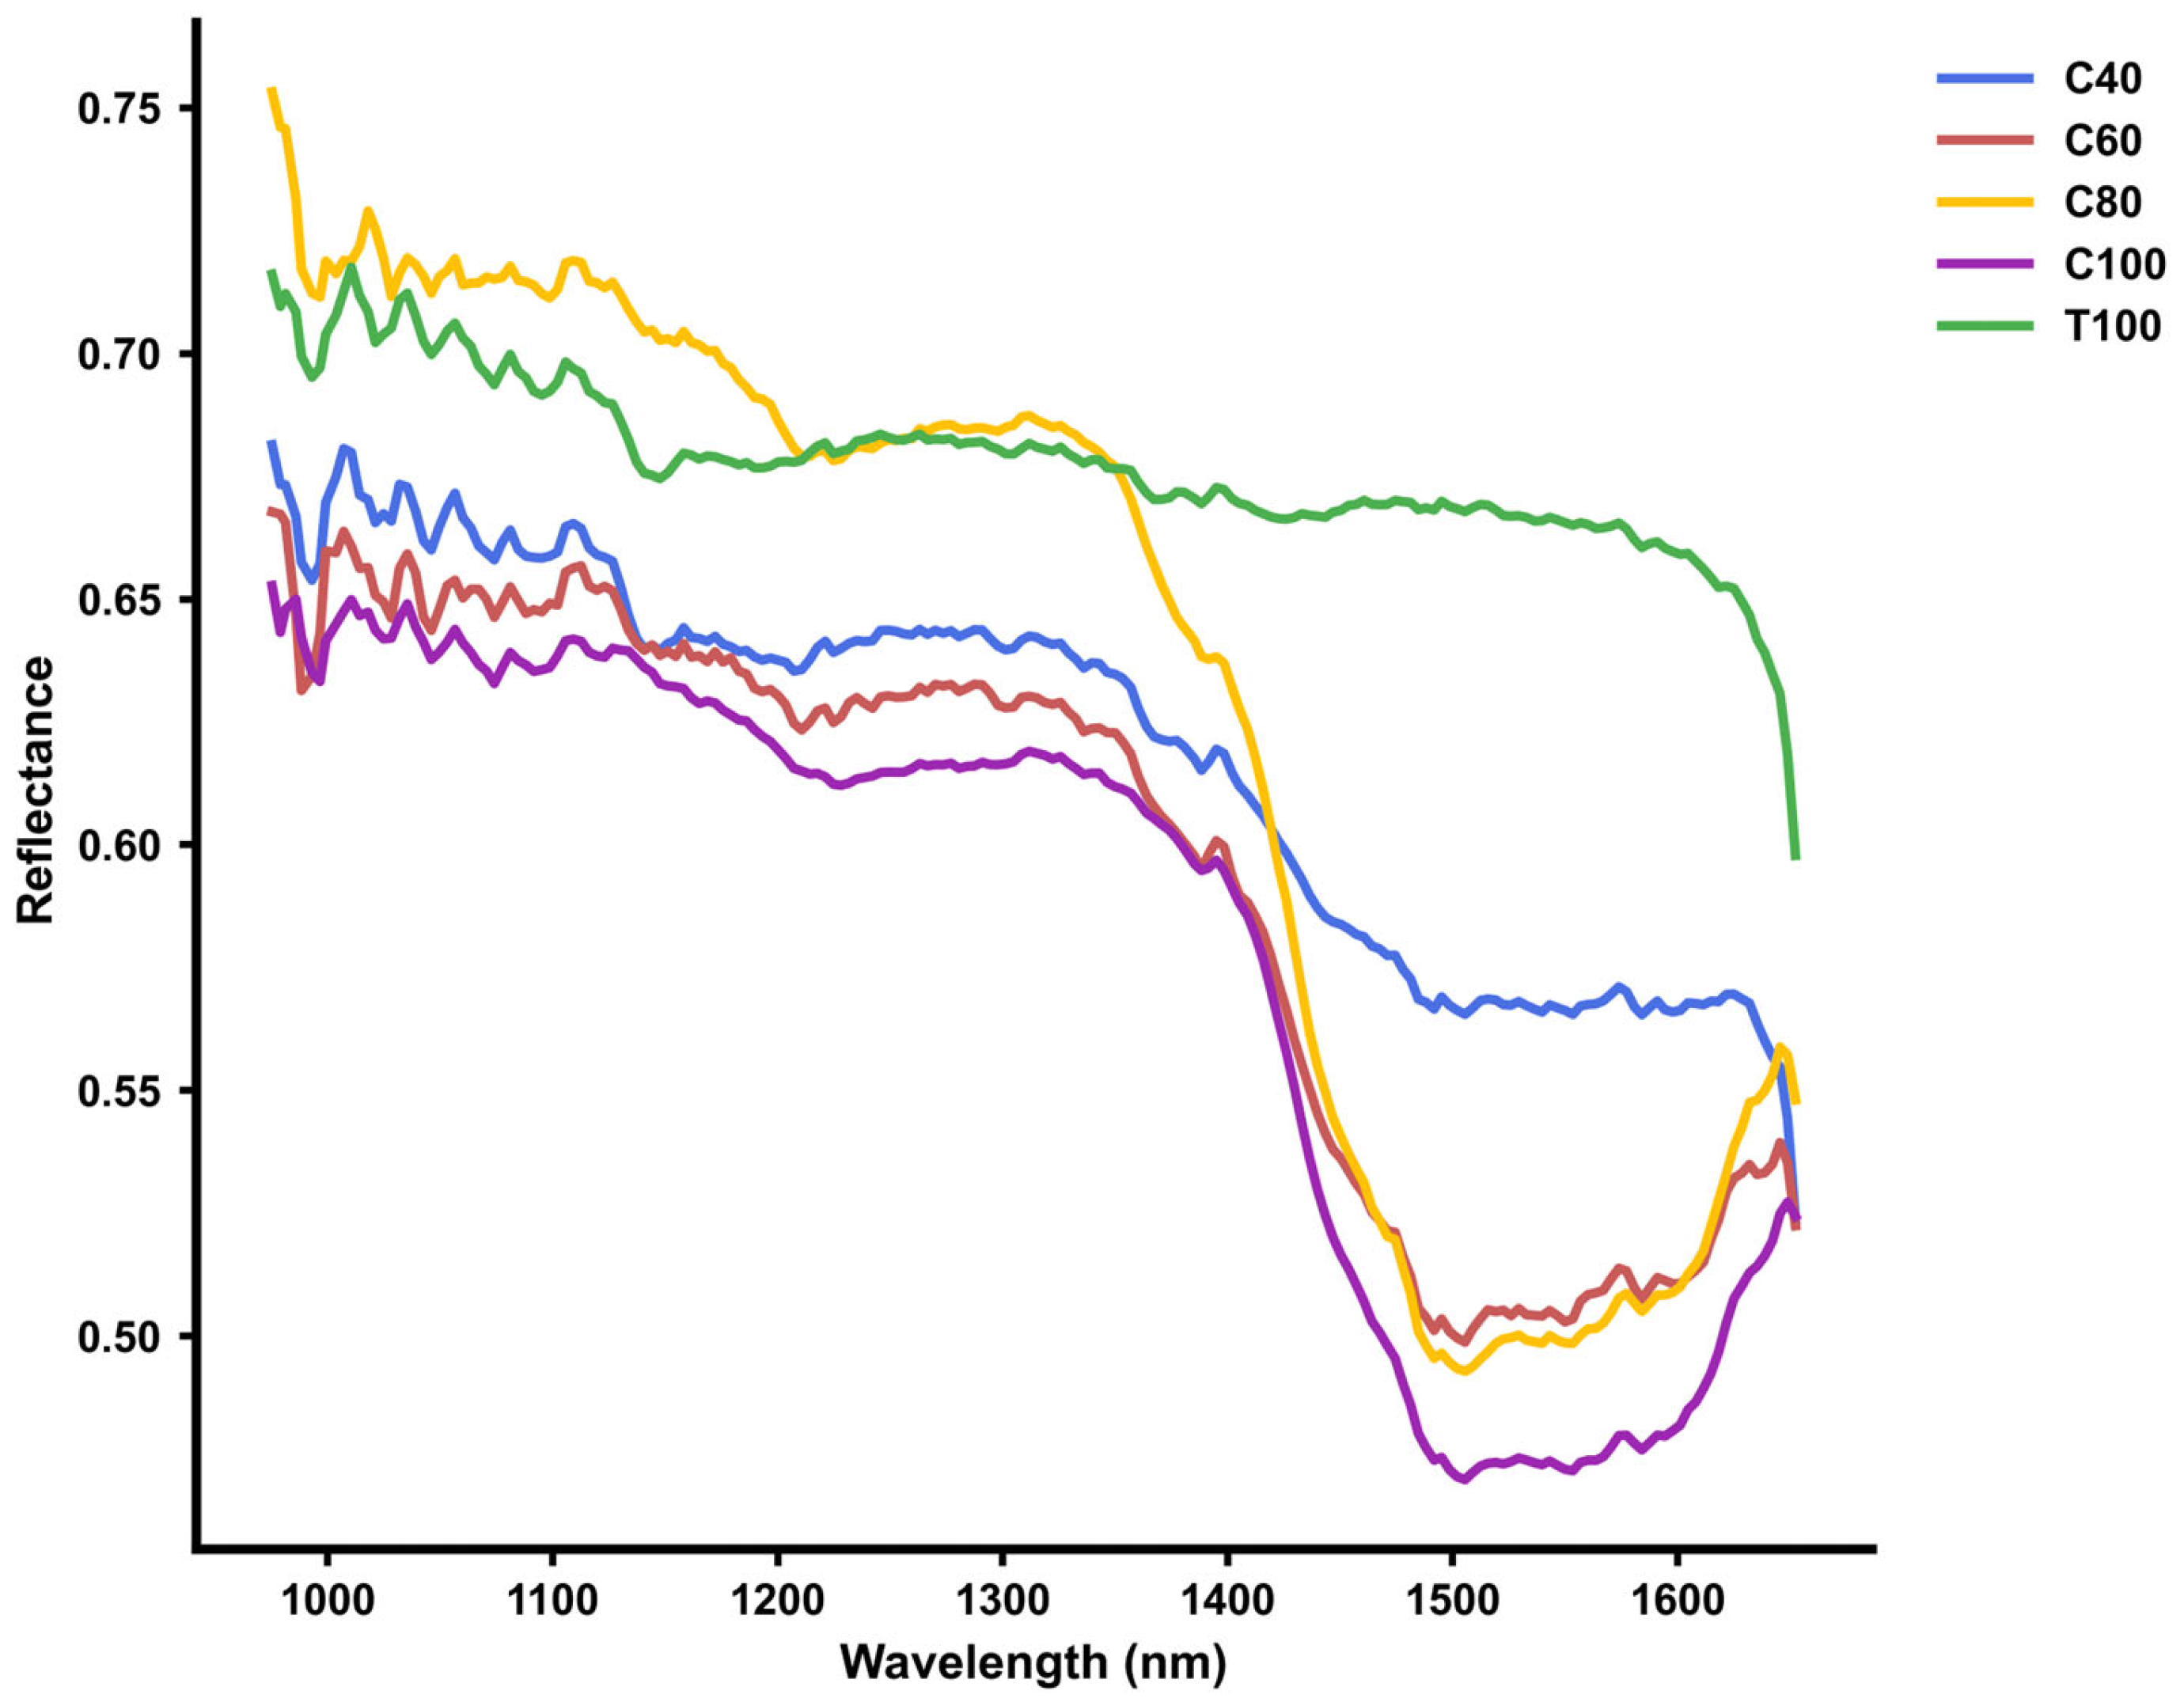
Figure 4 shows the average NIR hyperspectral curves of the five sample groups. Notably, pure cotton (C100), pure polyester (T100), and cotton/polyester blended fabrics with different ratios (C40, C60, and C80) exhibit distinct reflectance characteristics in the 1400–1500 nm wavelength range. Pure cotton shows the most pronounced reflectance trough in this band, with a significantly lower reflectance intensity than the other groups. In contrast, pure polyester has the shallowest trough and maintains a relatively high reflectance level. The blended fabrics (C40, C60, C80) display intermediate reflectance values, forming a clear gradient with increasing cotton content. As the proportion of cotton rises, the reflectance trough deepens and the overall reflectance intensity decreases gradually. This difference is mainly caused by the distinct molecular structures and hydrophilic/hydrophobic properties of cotton and polyester. Cotton’s main component, cellulose, contains numerous polar hydroxyl groups (-OH) that readily form hydrogen bonds with water molecules in the 1400–1500 nm region. This interaction leads to strong near-infrared absorption and thus low reflectance. Conversely, polyester exhibits weak polarity and strong hydrophobicity, which limits its interaction with water molecules. Consequently, its absorption in this wavelength range is weak, resulting in higher reflectance.
In general, higher cotton content strengthens the absorption of near-infrared light through hydroxyl groups, leading to deeper reflectance troughs. This trend forms a clear spectral differentiation feature in the 1400–1500 nm band that is closely related to the cotton/polyester blending ratio.

3.4. Preprocessing of Spectral Data

Preprocessing of NIR hyperspectral data is essential before model training to minimize noise interference on experimental results. Common preprocessing methods for NIR hyperspectral data include Savitzky-Golay (SG) smoothing [27], Multiplicative Scatter Correction (MSC) [28], Standard Normal Variate Transformation (SNV) [29], as well as first-order and second-order derivatives [30].
Different preprocessing methods are suited to specific application scenarios: MSC and SNV are particularly effective for eliminating baseline drift resulting from sample particle size and uneven surface scattering. In contrast, first and second derivatives enhance spectral feature resolution but may also amplify high-frequency noise. The primary objective of this study is to effectively suppress random noise while preserving the spectral details related to fibers in cotton/polyester blended fabrics. This goal aligns well with the benefits of Savitzky-Golay (SG) smoothing. Consequently, SG smoothing was employed to preprocess five sets of NIR hyperspectral data. The resulting preprocessed hyperspectral data maps are presented in Figure 5. SG smoothing, a widely utilized preprocessing technique, reduces noise while maintaining overall spectral trends and characteristic details. Its fundamental approach involves a sliding window strategy that performs local polynomial fitting on NIR hyperspectral data. When compared to the original NIR hyperspectral data curves, the SG-smoothed data clearly demonstrate diminished high-frequency fluctuations while retaining reflectance trends and differences across the entire wavelength range for each group. The overall smoother curves effectively suppress various interference signals.

3.5. Model Establishment

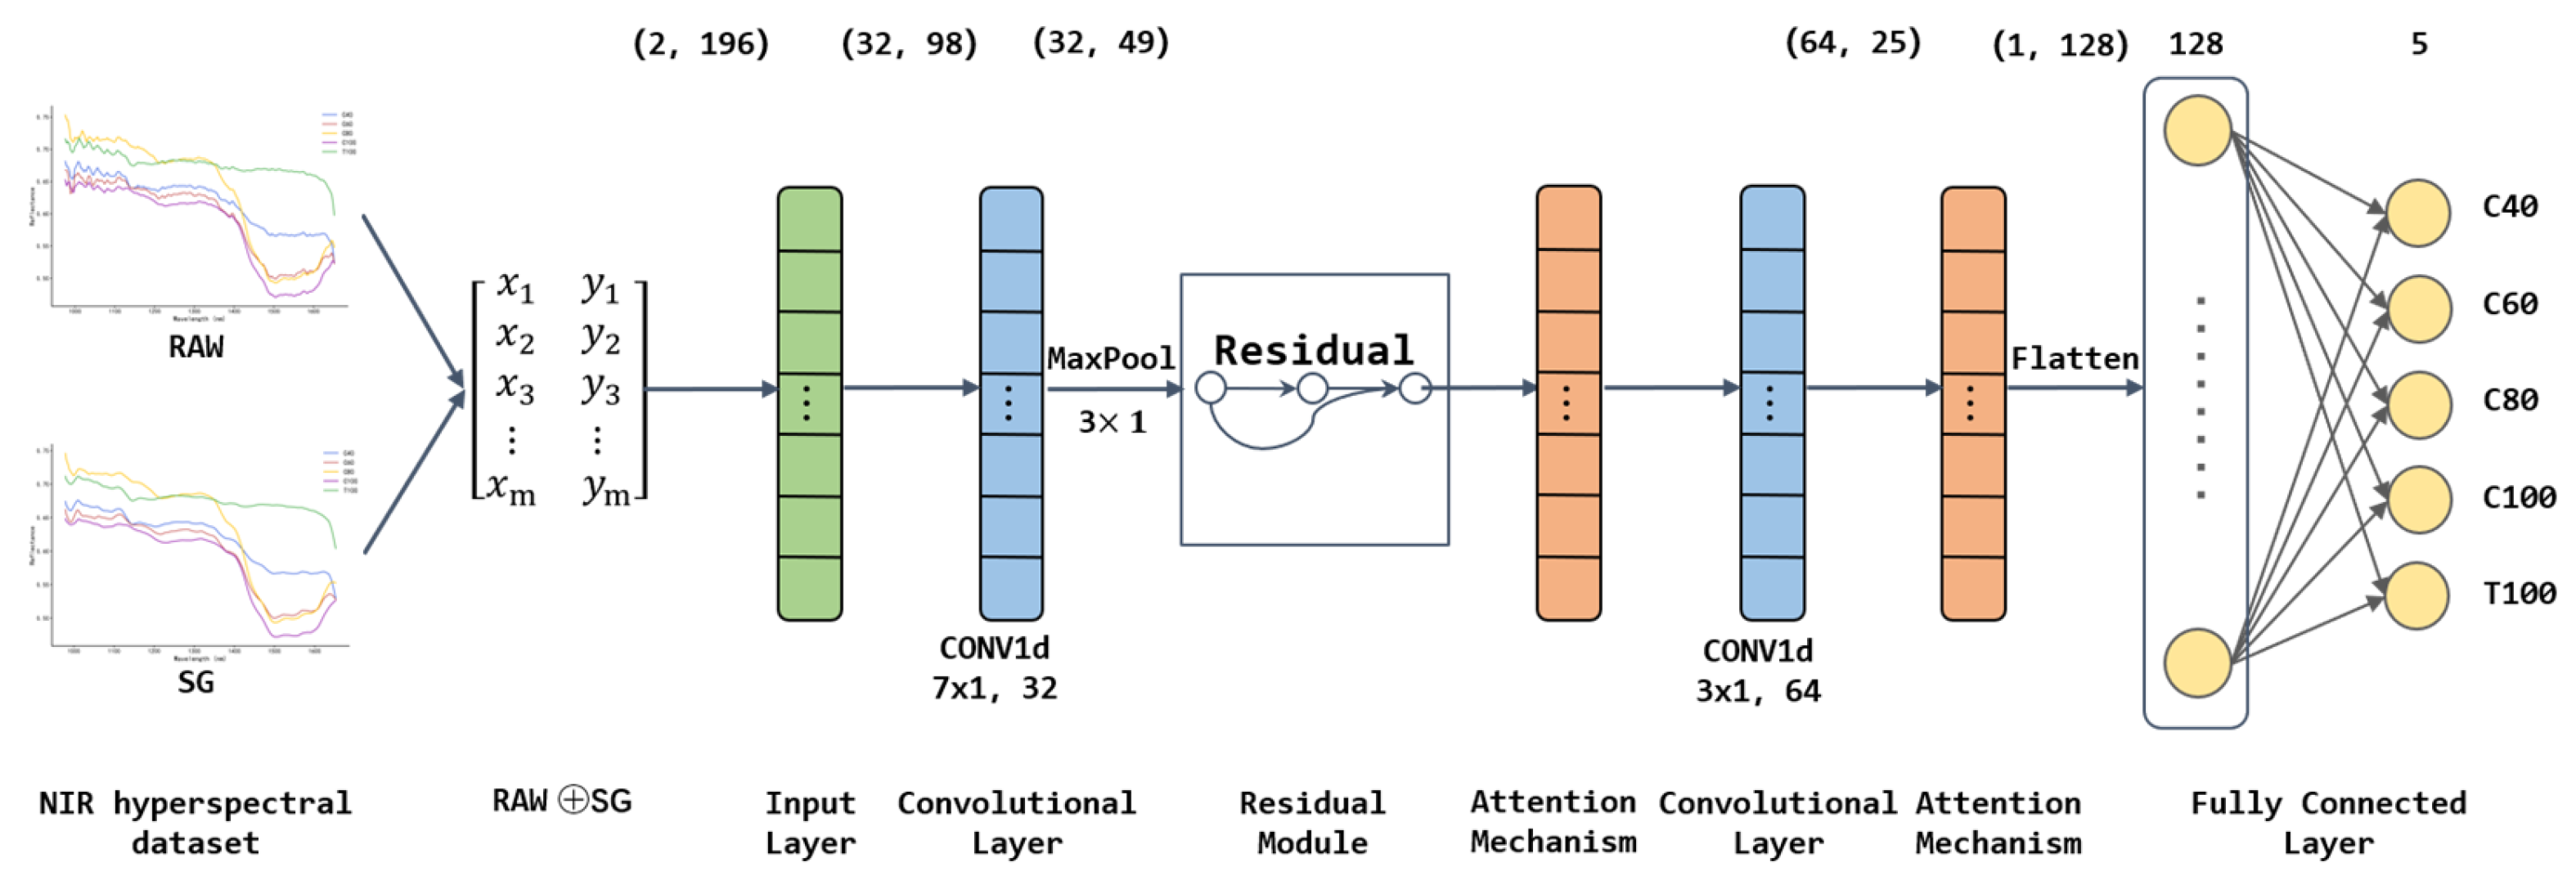
When analyzing NIR hyperspectral data from cotton/polyester blended waste fabrics, traditional 1D-CNN models often face challenges such as vanishing gradients in deep networks, uniform treatment of all spectral channels, and limitations from single-channel input. These issues make it difficult to accurately distinguish subtle spectral differences between categories with similar compositions. To address these problems, this paper proposes a dual-channel spectral feature fusion one-dimensional convolutional neural network (Dual-1DCNN-Residual-SE) based on the conventional 1DCNN framework. The network structure is illustrated in Figure 6.
First, the raw NIR hyperspectral data and the SG-smoothed NIR hyperspectral data are concatenated along the channel dimension to from a dual-channel spectral feature matrix of size (2, 196). Here, 2 denotes the two channels—raw NIR hyperspectral data and SG-smoothed NIR hyperspectral data—while 196 indicates the number of spectral wavelength points. Subsequently, this feature matrix is fed into the network’s initial convolutional module. This module increases the number of channels to 32 by employing 32 one-dimensional convolutional kernels of size 7 × 1. It then reduces the dimensionality further through a 3 × 1 max-pooling layer, ultimately producing a feature map of size (32, 49). This procedure facilitates the preliminary extraction of local spectral band features while maintaining a balance between feature retention and computational efficiency.
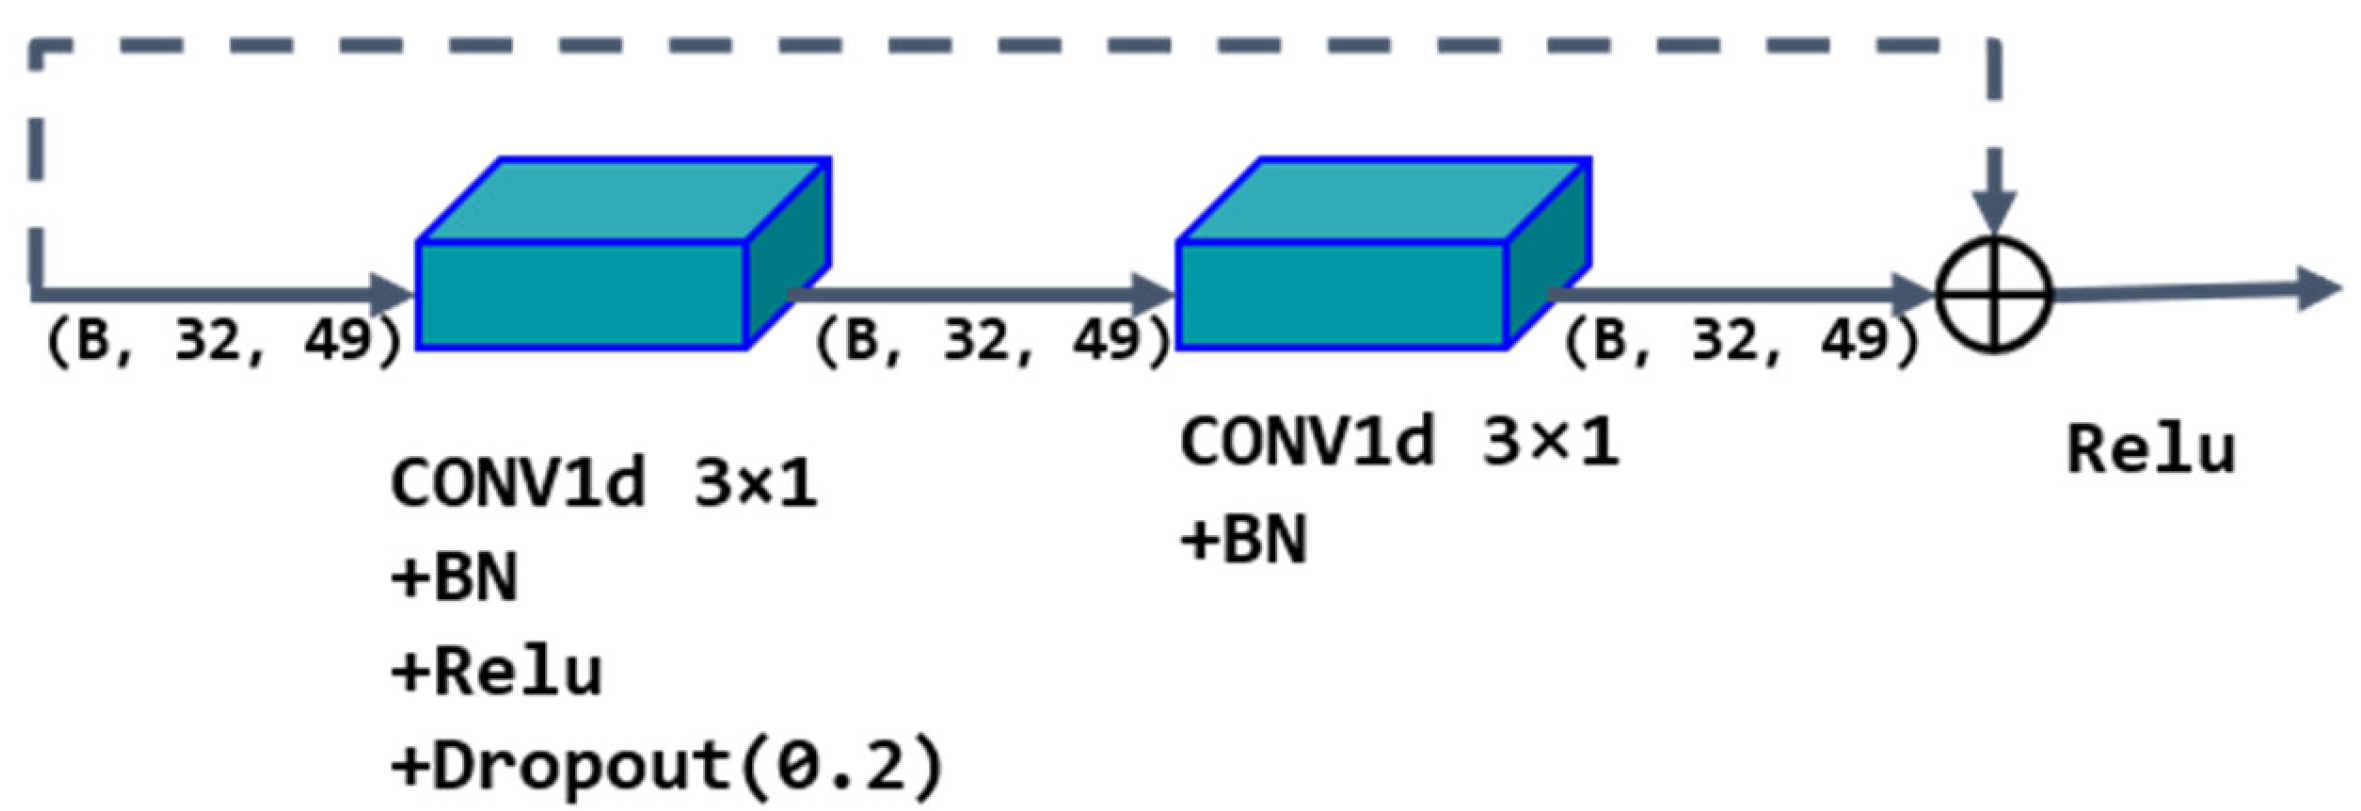
Second, to mitigate the vanishing gradient problem and to enhance feature reuse, the (32, 49) feature map is input into the residual module, as depicted in Figure 7. This module comprises two stacked one-dimensional convolutional layers, each with a kernel size of 3 × 1, each followed by batch Normalization and a ReLU activation function are applied. A shortcut connection is incorporated to directly sum the input and output features of the module, maintaining the output size at (32, 49). This residual structure allows the network to learn both the original shallow features and the transformed deep features concurrently, thereby effectively capturing subtle spectral differences among similar categories.
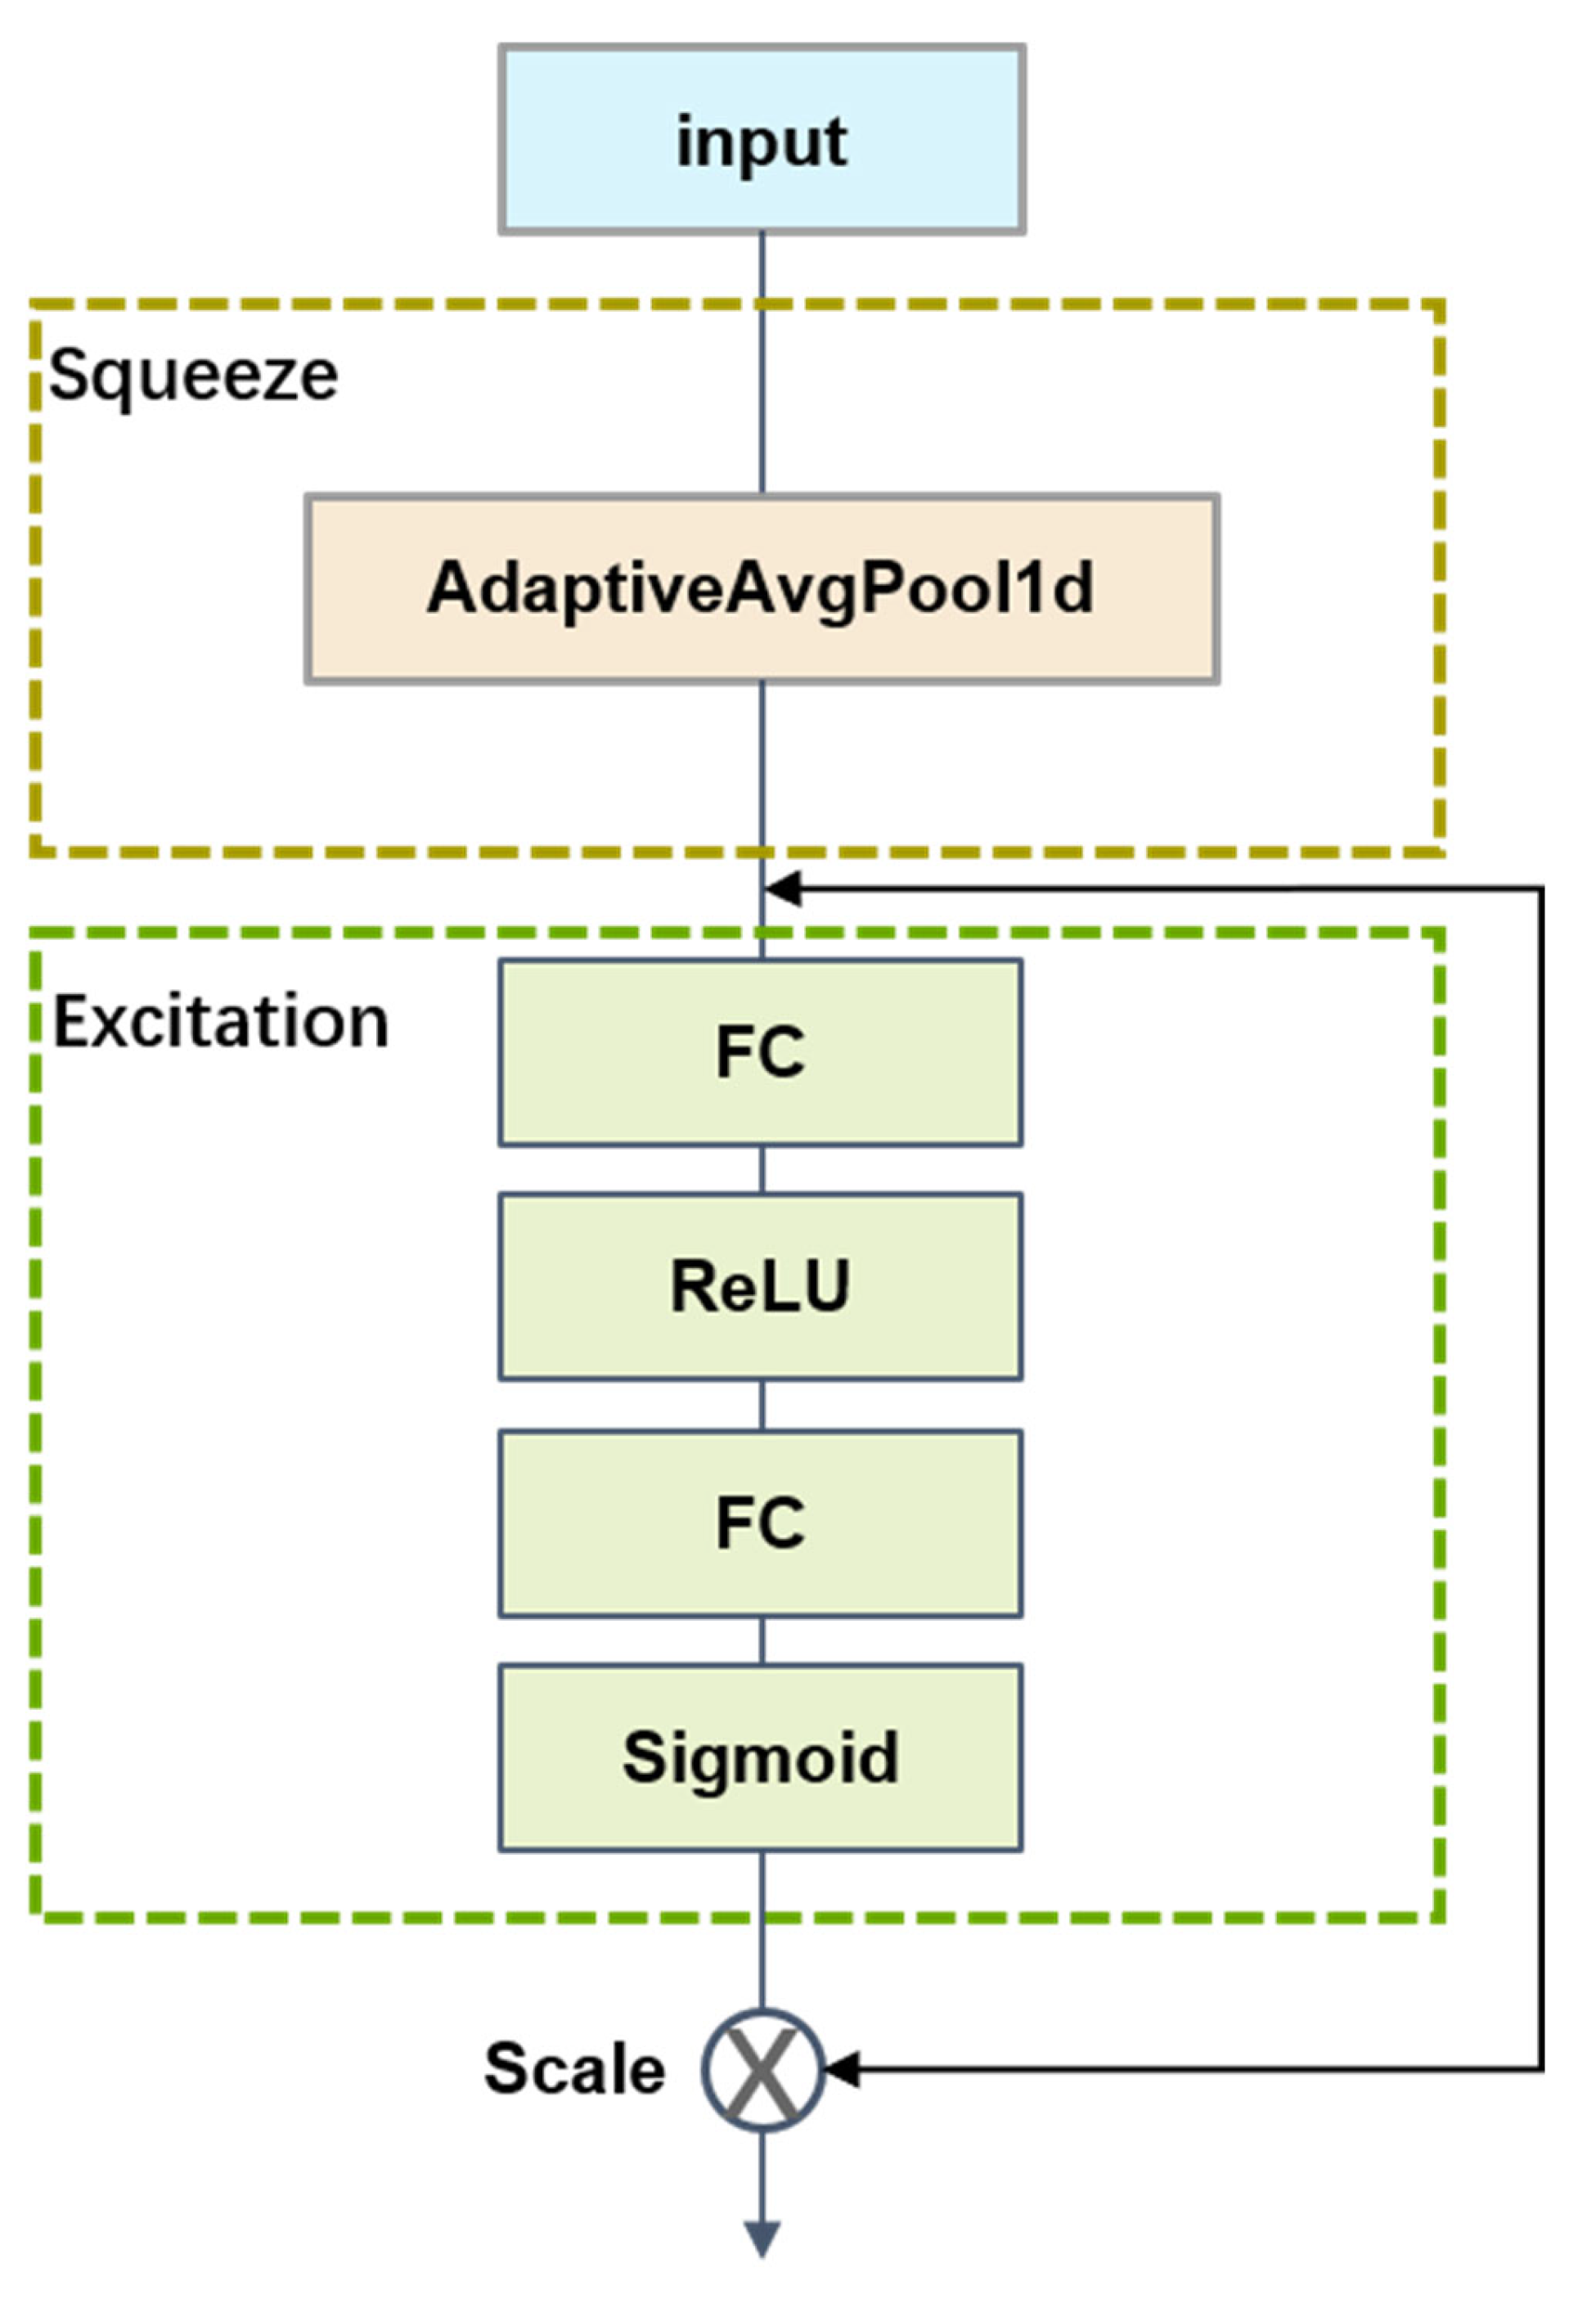
Based on the residual features, the residual module’s feature maps are utilized to pinpoint crucial spectral channel characteristics for the adaptive focus classification of cotton/polyester blended waste fabrics while suppressing redundant noise channels. To achieve this, the feature maps are inputted into the channel attention module, which is structured based on the SE (Squeeze-and-Excitation) attention mechanism [31] as depicted in Figure 8. Initially, adaptive global average pooling compresses the 49-dimensional local features of each channel into 1-dimensional global features. Subsequently, a fully connected layer with a dimension reduction factor of 16 (dimension transformation: 32 → 2 → 32) learns dependencies between channels, producing channel weight coefficients ranging from 0 to 1. By matching these coefficients to the original feature map’s dimensions and conducting per-channel multiplication, the mechanism enhances spectral feature bands based on their weights. The resulting attention-weighted feature map maintains a size of (32, 49), allowing the model to selectively amplify core spectral features and improve its capability to differentiate between similar categories of cotton/polyester blended waste fabrics.
The attention-weighted feature map (32, 49) is subsequently processed by the convolution and attention fusion module. A 3 × 1 one-dimensional convolution layer increases the number of channels from 32 to 64 while reducing the spectral length to 25, resulting in a high-dimensional feature map of size (64, 25). To emphasize critical information within these deep, high-dimensional features, the feature map is further processed through a second SE channel attention module, which shares the same structure as the preceding attention module. This step generates channel weight coefficients and performs weighted enhancement, keeping the output size at (64, 25).
Finally, adaptive average pooling converts the feature map into a 128-dimensional global feature vector. After Dropout regularization with a probability of 0.3, the vector is fed into a fully connected classification layer to complete the five-category classification of cotton/polyester blended waste fabrics.

3.6. Model Evaluation

To evaluate model performance, accuracy and F1-score serve as the primary evaluation metrics. The formulas for calculating these metrics are as follows:
A c c u r a c y = T P + T N T P + T N + F P + F N
In these formulas, TP represents the number of samples predicted as positive that are indeed positive; TN indicates the number of samples predicted as negative that are actually negative; FP refers to the number of samples predicted as positive but are actually negative; and FN denotes the number of samples predicted as negative that are, in fact, positive.

4. Conclusions

This paper focuses on the sorting and recycling of industrial cotton/polyester blended waste fabrics, and solves the key problems including the low efficiency of traditional sorting methods, difficulty in distinguishing cotton/polyester blended waste fabrics with similar blending ratios due to their similar chemical compositions, and limited feature extraction capabilities of existing models. Different from most existing studies that focus on quantitative composition prediction, this work realizes high-precision classification identification of cotton-polyester blended fabrics with five typical content gradients, which is more in line with the actual needs of industrial waste textile sorting. By combining near-infrared hyperspectral imaging technology with deep learning, we propose an enhanced 1DCNN model (Dual-1DCNN-Residual-SE) with dual-channel input, residual structure, and SE attention mechanism. This model accurately classifies five cotton/polyester blending ratios. Compared with methods based on visual or physical/chemical sensing, our approach is less affected by fabric appearance and achieves non-destructive, high-precision recognition, making it more suitable for industrial recycling scenarios.
Experimental results indicate that the Dual-1DCNN-Residual-SE model achieves a classification accuracy of 95.94%, significantly surpassing traditional machine learning algorithms including K-Nearest Neighbors (KNN), Random Forest (RF), Support Vector Machine (SVM), and Partial Least Squares (PLS). Comparison of three common attention mechanisms—SE, ECA, and CBAM—reveals that the SE attention mechanism exhibits superior performance and is better suited for this model. Ablation experiments confirmed the performance advantage of dual-channel NIR hyperspectral input compared to single-channel input, as well as the optimization effects of the residual and attention modules on the model. Additionally, t-SNE dimensionality reduction visualization analysis elucidates the reasons behind the model’s misclassification of categories with similar cotton/polyester blend ratios.
In the future, we plan to further integrate the method proposed in this study into the intelligent sorting assembly line for industrial waste textiles. Following near-infrared hyperspectral acquisition, real-time classification output will be achieved through model inference and be seamlessly incorporated into subsequent recycling processes to provide practical support for efficient industrial sorting. Meanwhile, future work will expand the dataset size and explore the use of Generative Adversarial Networks (GANs) to expand spectral samples, thereby enhancing the model’s generalization capability in complex scenarios. In addition, the model will be expanded to classify and identify other common blended textile materials, thereby further improving the technical system for the resource recycling of waste textiles.


Author Contributions

Conceptualization, Y.X. and W.S.; methodology, Y.X.; software, Y.X.; validation, Y.X., C.X. and Z.Y.; formal analysis, Y.X.; investigation, Y.X. and C.W.; resources, W.S., C.W. and H.Z.; data curation, Y.X.; writing—original draft preparation, Y.X.; writing—review and editing, W.S.; visualization, Y.X.; supervision, W.S.; project administration, W.S.; funding acquisition, W.S. and C.W. All authors have read and agreed to the published version of the manuscript.

Funding

This research was funded by the Zhejiang Provincial Leading Project for Leading Geese Plan, grant number 2024SJCZX0027; the Zhejiang Provincial Special Support Program for High-Level Talents, grant number 2023R5212. The APC (Article Processing Charge) funding status is pending.

Data Availability Statement

The data presented in this study are available on request from the corresponding author due to raw data protection restrictions.

Acknowledgments

The authors would like to express their gratitude to Zhejiang Sci-Tech University for providing technical support, and to all members of the research team for their assistance in the experiments. Additionally, the authors acknowledge Zhejiang Provincial Institute of Quality and Technology Supervision for kindly providing the experimental samples. During the preparation of this manuscript, no Generative Artificial Intelligence (GenAI) tools were used for generating text, data, graphics, study design, data collection, analysis, or interpretation of data. All content was independently prepared and reviewed by the authors.

Conflicts of Interest

The authors declare no conflicts of interest. The funders (Zhejiang Provincial Leading Project for Leading Geese Plan and Zhejiang Provincial Special Support Program for High-Level Talents) had no role in the design of the study; in the collection, analyses, or interpretation of data; in the writing of the manuscript; or in the decision to publish the results.

Abbreviations

The following abbreviations are used in this manuscript:
NIRNear-Infrared
SGSavitzky-Golay
1DCNNOne-Dimensional Convolutional Neural Network
SESqueeze-and-Excitation
KNNK-Nearest Neighbors
RFRandom Forest
SVMSupport Vector Machine
PLSPartial Least Squares
CBAMConvolutional Block Attention Module
ECAEfficient Channel Attention
t-SNEt-Distributed Stochastic Neighbor Embedding
DNDigital Number
FPSFrames Per Second
ZIQSZhejiang Institute of Quality Sciences

References

  1. Shen, Y.L.; Lan, D.Y.; He, P.J.; Qi, Y.P.; Peng, W.; Lue, F.; Zhang, H. Nondestructive optical and spectroscopic techniques combined with machine learning for identifying solid waste: A review. Trends Anal. Chem. 2025, 186, 118195. [Google Scholar] [CrossRef]
  2. Du, W.; Zheng, J.; Li, W.; Liu, Z.; Wang, H.; Han, X. Efficient recognition and automatic sorting technology of waste textiles based on online near infrared spectroscopy and convolutional neural network. Resour. Conserv. Recycl. 2022, 180, 106185. [Google Scholar] [CrossRef]
  3. National Development and Reform Commission; Ministry of Commerce; Ministry of Industry and Information Technology of the People’s Republic of China. Implementation Opinions on Accelerating the Recycling of Waste Textiles; Central People’s Government of the People’s Republic of China: Beijing, China, 2022. [Google Scholar]
  4. Wang, Y.; Zhang, L.; Li, X. A review on textile solid waste management: Disposal and recycling. J. Clean. Prod. 2022, 345, 131024. [Google Scholar]
  5. Ndagano, U.N.; Cahill, L.; Smullen, C.; Gaughran, J.; Kelleher, S.M. The Current State-of-the-Art of the Processes Involved in the Chemical Recycling of Textile Waste. Molecules 2025, 30, 299. [Google Scholar] [CrossRef]
  6. Clark, J.H. Textile waste—An opportunity as well as a threat. Green Carbon 2023, 1, 8–11. [Google Scholar] [CrossRef]
  7. Wang, S.H.; Yu, X.Y.; Chen, X.G.; Hou, W.S.; Niu, M. Recycling of cotton fibers separated from the waste blend fabric. J. Nat. Fibers 2020, 17, 520–531. [Google Scholar]
  8. Navone, L.; Moffitt, K.; Hansen, K.A.; Blinco, J.; Payne, A.; Speight, R. Closing the textile loop: Enzymatic fibre separation and recycling of wool/polyester fabric blends. Waste Manag. 2020, 102, 149–160. [Google Scholar] [CrossRef]
  9. Balsi, M.; Moroni, M.; Chiarabini, V.; Tanda, G. High-resolution aerial detection of marine plastic litter by hyperspectral sensing. Remote Sens. 2021, 13, 1557. [Google Scholar] [CrossRef]
  10. Kramell, A.E.; García-Altares, M.; Pötsch, M.; Kluge, R.; Rother, A.; Hause, G.; Hertweck, C.; Csuk, R. Mapping natural dyes in archeological textiles by imaging mass spectrometry. Sci. Rep. 2019, 9, 2331. [Google Scholar] [CrossRef]
  11. Paz, M.L.; Sousa, C. Discrimination and quantification of cotton and polyester textile samples using near-infrared and mid-infrared spectroscopies. Molecules 2024, 29, 3667. [Google Scholar] [CrossRef]
  12. Liu, Y.; Zhou, S.; Liu, W.; Yang, X.; Luo, J. Least-squares support vector machine and successive projection algorithm for quantitative analysis of cotton-polyester textile by near infrared spectroscopy. J. Near Infrared Spectrosc. 2018, 26, 34–43. [Google Scholar] [CrossRef]
  13. Stipanovic, H.; Koinig, G.; Fink, T.; Schimper, C.B.; Lilek, D.; Egan, J.; Tischberger-Aldrian, A. Quantifying cotton content in post-consumer polyester/cotton blend textiles via NIR spectroscopy: Current attainable outcomes and challenges in practice. Recycling 2025, 10, 152. [Google Scholar] [CrossRef]
  14. Zhang, S.D.; Zhang, X.Q.; Shen, L.L.; Wan, S.H.; Ren, W.Q. Wavelet-based physically guided normalization network for real-time traffic dehazing. Pattern Recognit. 2026, 172, 112451. [Google Scholar] [CrossRef]
  15. Liu, X.; Song, L.; Liu, S.; Zhang, Y. A Review of Deep-Learning-Based Medical Image Segmentation Methods. Sustainability 2021, 13, 1224. [Google Scholar] [CrossRef]
  16. Ashrafi, S.; Teymouri, S.; Etaati, S.; Khoramdel, J.; Borhani, Y.; Najafi, E. Steel surface defect detection and segmentation using deep neural networks. Results Eng. 2025, 25, 103972. [Google Scholar] [CrossRef]
  17. Krizhevsky, A.; Sutskever, I.; Hinton, G.E. ImageNet classification with deep convolutional neural networks. Adv. Neural Inf. Process. Syst. 2012, 25, 1097–1105. [Google Scholar] [CrossRef]
  18. Wu, T.W.; Zhang, H.; Peng, W.; Lü, F.; He, P.J. Applications of convolutional neural networks for intelligent waste identification and recycling: A review. Resour. Conserv. Recycl. 2023, 190, 106813. [Google Scholar] [CrossRef]
  19. Huang, M.Q.; Kuang, W.J.; Liu, X.; He, L. Research on quantitative analysis method of cotton/polyester/wool blended fiber content based on 1D-CNN and near-infrared spectroscopy. Spectrosc. Spectr. Anal. 2023, 43, 3489–3495. [Google Scholar]
  20. Chen, J.N.; Tian, G.F.; Li, Y.H.; Zhu, Y.L.; Chen, X.; Men, Y.L.; Wei, X.S. A near-infrared spectroscopy prediction model for cashmere and wool fibers based on dual-path multi-scale convolution. J. Xi’an Polytech. Univ. 2025, 39, 1–8. [Google Scholar]
  21. Qiu, X.; Liu, Y.Y.; Guo, S.C.; Liu, D.Z.; Wang, C.; Liu, J.; Xu, S.; Yang, L.; Gong, Y. Qualitative analysis of wool-blended waste textiles based on near-infrared spectroscopy and deep learning algorithms. J. Text. Res. 2023, 44, 58–65. [Google Scholar]
  22. Cover, T.; Hart, P. Nearest neighbor pattern classification. IEEE Trans. Inf. Theory 1967, 13, 21–27. [Google Scholar] [CrossRef]
  23. Breiman, L. Random forests. Mach. Learn. 2001, 45, 5–32. [Google Scholar] [CrossRef]
  24. Cortes, C.; Vapnik, V. Support-vector networks. Mach. Learn. 1995, 20, 273–297. [Google Scholar] [CrossRef]
  25. Wold, S.; Sjöström, M.; Eriksson, L. PLS-regression: A basic tool of chemometrics. Chemom. Intell. Lab. Syst. 2001, 58, 109–130. [Google Scholar] [CrossRef]
  26. Van der Maaten, L.; Hinton, G. Visualizing data using t-SNE. J. Mach. Learn. Res. 2008, 9, 2579–2605. [Google Scholar]
  27. Savitzky, A.; Golay, M.J.E. Smoothing and differentiation of data by simplified least squares procedures. Anal. Chem. 1964, 36, 1627–1639. [Google Scholar] [CrossRef]
  28. Isaksson, T.; Næs, T. The effect of multiplicative scatter correction (MSC) and linearity improvement in NIR spectroscopy. Appl. Spectrosc. 1988, 42, 1273–1284. [Google Scholar] [CrossRef]
  29. Barnes, R.J.; Dhanoa, M.S.; Lister, S.J. Standard normal variate transformation and de-trending of near-infrared diffuse reflectance spectra. Appl. Spectrosc. 1989, 43, 772–777. [Google Scholar] [CrossRef]
  30. Ritchie, G.E.; Morris, M.D. Differentiation of infrared spectra using the Savitzky-Golay algorithm. Appl. Spectrosc. 1985, 39, 637–640. [Google Scholar]
  31. Hu, J.; Shen, L.; Sun, G. Squeeze-and-excitation networks. In Proceedings of the IEEE Conference on Computer Vision and Pattern Recognition, Salt Lake City, UT, USA, 18–23 June 2018; pp. 7132–7141. [Google Scholar]
Figure 1. Confusion matrix on the test set.
Recycling 11 00042 g001
Figure 2. t-SNE visualization dimensionality reduction analysis results.
Recycling 11 00042 g002
Figure 3. NIR hyperspectral acquisition and sorting system: (a) HX-17S; (b) host computer; (c) light source; (d) conveyor belt.
Recycling 11 00042 g003
Figure 4. Average NIR hyperspectral curves of five groups.
Recycling 11 00042 g004
Figure 5. The average NIR hyperspectral curves of five groups by SG.
Recycling 11 00042 g005
Figure 6. Network structure diagram of Dual-1DCNN-Residual-SE.
Recycling 11 00042 g006
Figure 7. Residual connection module.
Recycling 11 00042 g007
Figure 8. SE attention mechanism module.
Recycling 11 00042 g008
Table 1. Division of NIR hyperspectral dataset for cotton/polyester blended waste fabric.
GroupTotal Spectral Data PointsTraining SetValidation SetTest Set
C402521(14)1891(10)324(2)306(2)
C602574(18)1926(14)324(2)324(2)
C802795(16)2198(12)308(2)289(2)
C1003087(16)2308(12)380(2)399(2)
T1003139(16)2360(12)399(2)380(2)
The numbers in parentheses represent the number of independent fabric samples.
Table 2. Comparative experimental results.
PreprocessingModelAcc/%F1-Score/%
RAWKNN79.2177.92
RF78.8677.81
SVM88.1287.49
PLS87.6987.35
1DCNN-Residual-SE92.3492.27
SGKNN81.8680.99
RF82.6981.13
SVM88.0787.43
PLS87.4086.92
1DCNN-Residual-SE93.8293.82
Table 3. Comparative experimental results of attention mechanisms.
ModelAcc/%F1-Score/%
Dual-1DCNN-Residual-No_attention87.9987.52
Dual-1DCNN-Residual-ECA94.3594.01
Dual-1DCNN-Residual-CBAM95.1295.12
Dual-1DCNN-Residual-SE95.9495.71
Table 4. Ablation experiment results.
ModelAcc/%
Dual-1DCNN-Residual-SE95.94
No_Residual90.69
No_attention87.99
1DCNN84.83
Table 5. NIR hyperspectral camera parameters.
ComponentParameters
Lens8 mm
Resolution8 nm
FPS200 fps
Range975.39–1652.48 nm
Band196
Spectral sampling Interval3.45 nm
Table 6. Classification of experimental samples.
LabelCotton ContentSample Quantity
C100Cotton 100%14
C8070% < Cotton < 90%18
C6050% < Cotton < 70%16
C4030% < Cotton < 50%16
T100Cotton 0% (Polyester)16
Disclaimer/Publisher’s Note: The statements, opinions and data contained in all publications are solely those of the individual author(s) and contributor(s) and not of MDPI and/or the editor(s). MDPI and/or the editor(s) disclaim responsibility for any injury to people or property resulting from any ideas, methods, instructions or products referred to in the content.