Article

Integrated Circuits from Lighting Equipment: Presence and Characterisation of Precious Metals (Ag, Au, Pd, and Pt)

by
Konstantinos M. Sideris
1,2,*,
Konstantinos A. Liogas
3,4,
Dimitrios Fragkoulis
5,
Vassilis N. Stathopoulos
5 and
Panagiotis Sinioros
1
1
Department of Electrical & Electronic Engineering, University of West Attica, 122 44 Egaleo, Greece
2
Department of Electrical and Electronic Engineering Educators, School of Pedagogical and Technological Education, 151 22 Marousi, Greece
3
Department of Engineering Science, University of Oxford, Parks Road, Oxford OX1 3BH, UK
4
School of Electrical and Electronic Engineering, Nanyang Technological University, 50 Nanyang Avenue, Singapore 639798, Singapore
5
Department of Agricultural Development, Agrifood and Natural Resources Management, National and Kapodistrian University of Athens, Psachna Campus, 344 00 Psachna, Greece
*
Author to whom correspondence should be addressed.
Recycling 2025, 10(5), 175; https://doi.org/10.3390/recycling10050175
Submission received: 1 August 2025 / Revised: 2 September 2025 / Accepted: 10 September 2025 / Published: 12 September 2025

Abstract

To reduce energy consumption in buildings and to maintain comfortable conditions, lighting equipment that includes light-emitting diode (LED) lamps and lighting management equipment is utilised. In this study, integrated circuits detached from lighting equipment were characterised for the presence of precious metals (silver, gold, palladium, and platinum). Their digestion was carried out with HNO3 and aqua regia solution on a hot plate and characterised using inductively coupled plasma optical emission spectroscopy (ICP-OES). The concentration of each element as a function of the type and origin of the integrated circuits varied as follows: silver, 652–3876 mg/kg; gold, 0–993 mg/kg; palladium, 0–74 mg/kg; and platinum was detected at a concentration below the quantification limit. These results indicate the need for selective removal and separate recycling processes for integrated circuits from the lighting equipment.

Graphical Abstract

1. Introduction

Generally, preserving life is inextricably linked to energy consumption. However, preserving the quality of life requires proper energy management, as energy production and conversion have a significant impact on the environment. Therefore, transitioning from reckless to rational energy use is essential for preserving natural resources and the quality of life on our planet. Depending on the age and construction specifications of buildings, as well as environmental conditions, a significant portion of the available energy is spent on achieving and maintaining internal comfortable conditions [1].
Various strategies are selected on a case-by-case basis to reduce energy consumption while maintaining comfortable conditions. These include ‘passive’ strategies, such as daylighting and solar shading, as well as ‘active’ strategies, including more efficient lighting technologies. Lighting equipment (LE), which forms part of a building’s electrical installation and may include light-emitting diode (LED) lamps and lighting management equipment (LME), also contributes to achieving the above objectives [2]. LE contributes to energy savings in buildings by synergising various parameters in each application. In the case of LED lamps, this is achieved through their combination of high energy efficiency and low heat emission. In the case of LME, it is achieved by monitoring environmental conditions and human presence.
Electrical and electronic equipment (EEE) is classified as waste electrical and electronic equipment (WEEE) when it reaches the end of its functional life. LED lamps fall under ‘CAT 3’ of WEEE by Directive 2012/19 of the European Union (EU), and LME under ‘CAT 5’ [3].

1.1. WEEE Recycling

Many chemical elements in WEEE are important technological parameters that distinguish urban mining from natural mining [4]. As a result, WEEE recycling has not been standardised [5]. The presence of valuable and precious metals in EEE [6] makes WEEE a special and interesting waste category with significant and dynamic economic value. During WEEE recycling, particularly during pre-treatment, separating them according to the presence and concentrations of these metals contributes to their optimal recovery [7], consequently increasing the protection of natural reserves [8] and offsetting the operating costs of recovering low-value critical raw materials [7]. It is worth noting that recovering these metals from urban mines requires significantly less energy (85–90%) than natural mining [7], leading to increased environmental protection.
Identifying and quantifying precious metals (PMs) in WEEE is critical in the recycling sector [9]. This information is utilised in the pre-treatment of this type of waste [10] and aids in creating recycling streams with high concentrations of these metals [11]. These metals are typically present in the electrical contacts and interconnections of the individual components and structures of EEE [12], with the elemental composition of these points varying significantly depending on the economic and technical parameters [13,14] of each application. The potential synergy between economic and technical parameters, such as the annual increase in WEEE [15], targeted recycling, dynamic metal prices, and energy gains associated with urban mining [7], is expected to offset the gradual decrease in the presence of precious metals in EEE [16,17] and maintain high interest in recovering these metals from urban mines [18].
When dismantling WEEE, the typical fractions obtained depends on the type of equipment and corresponds to basic materials, such as metals, plastics, glass, and ceramics, as well as specific sub-structures, including screens, LED modules, and drivers. It should be noted that the percentage of each sub-structure [19,20] and its elemental composition [21] vary significantly depending on the type, electrical characteristics, and specifications of the equipment.

1.2. Driver Structure

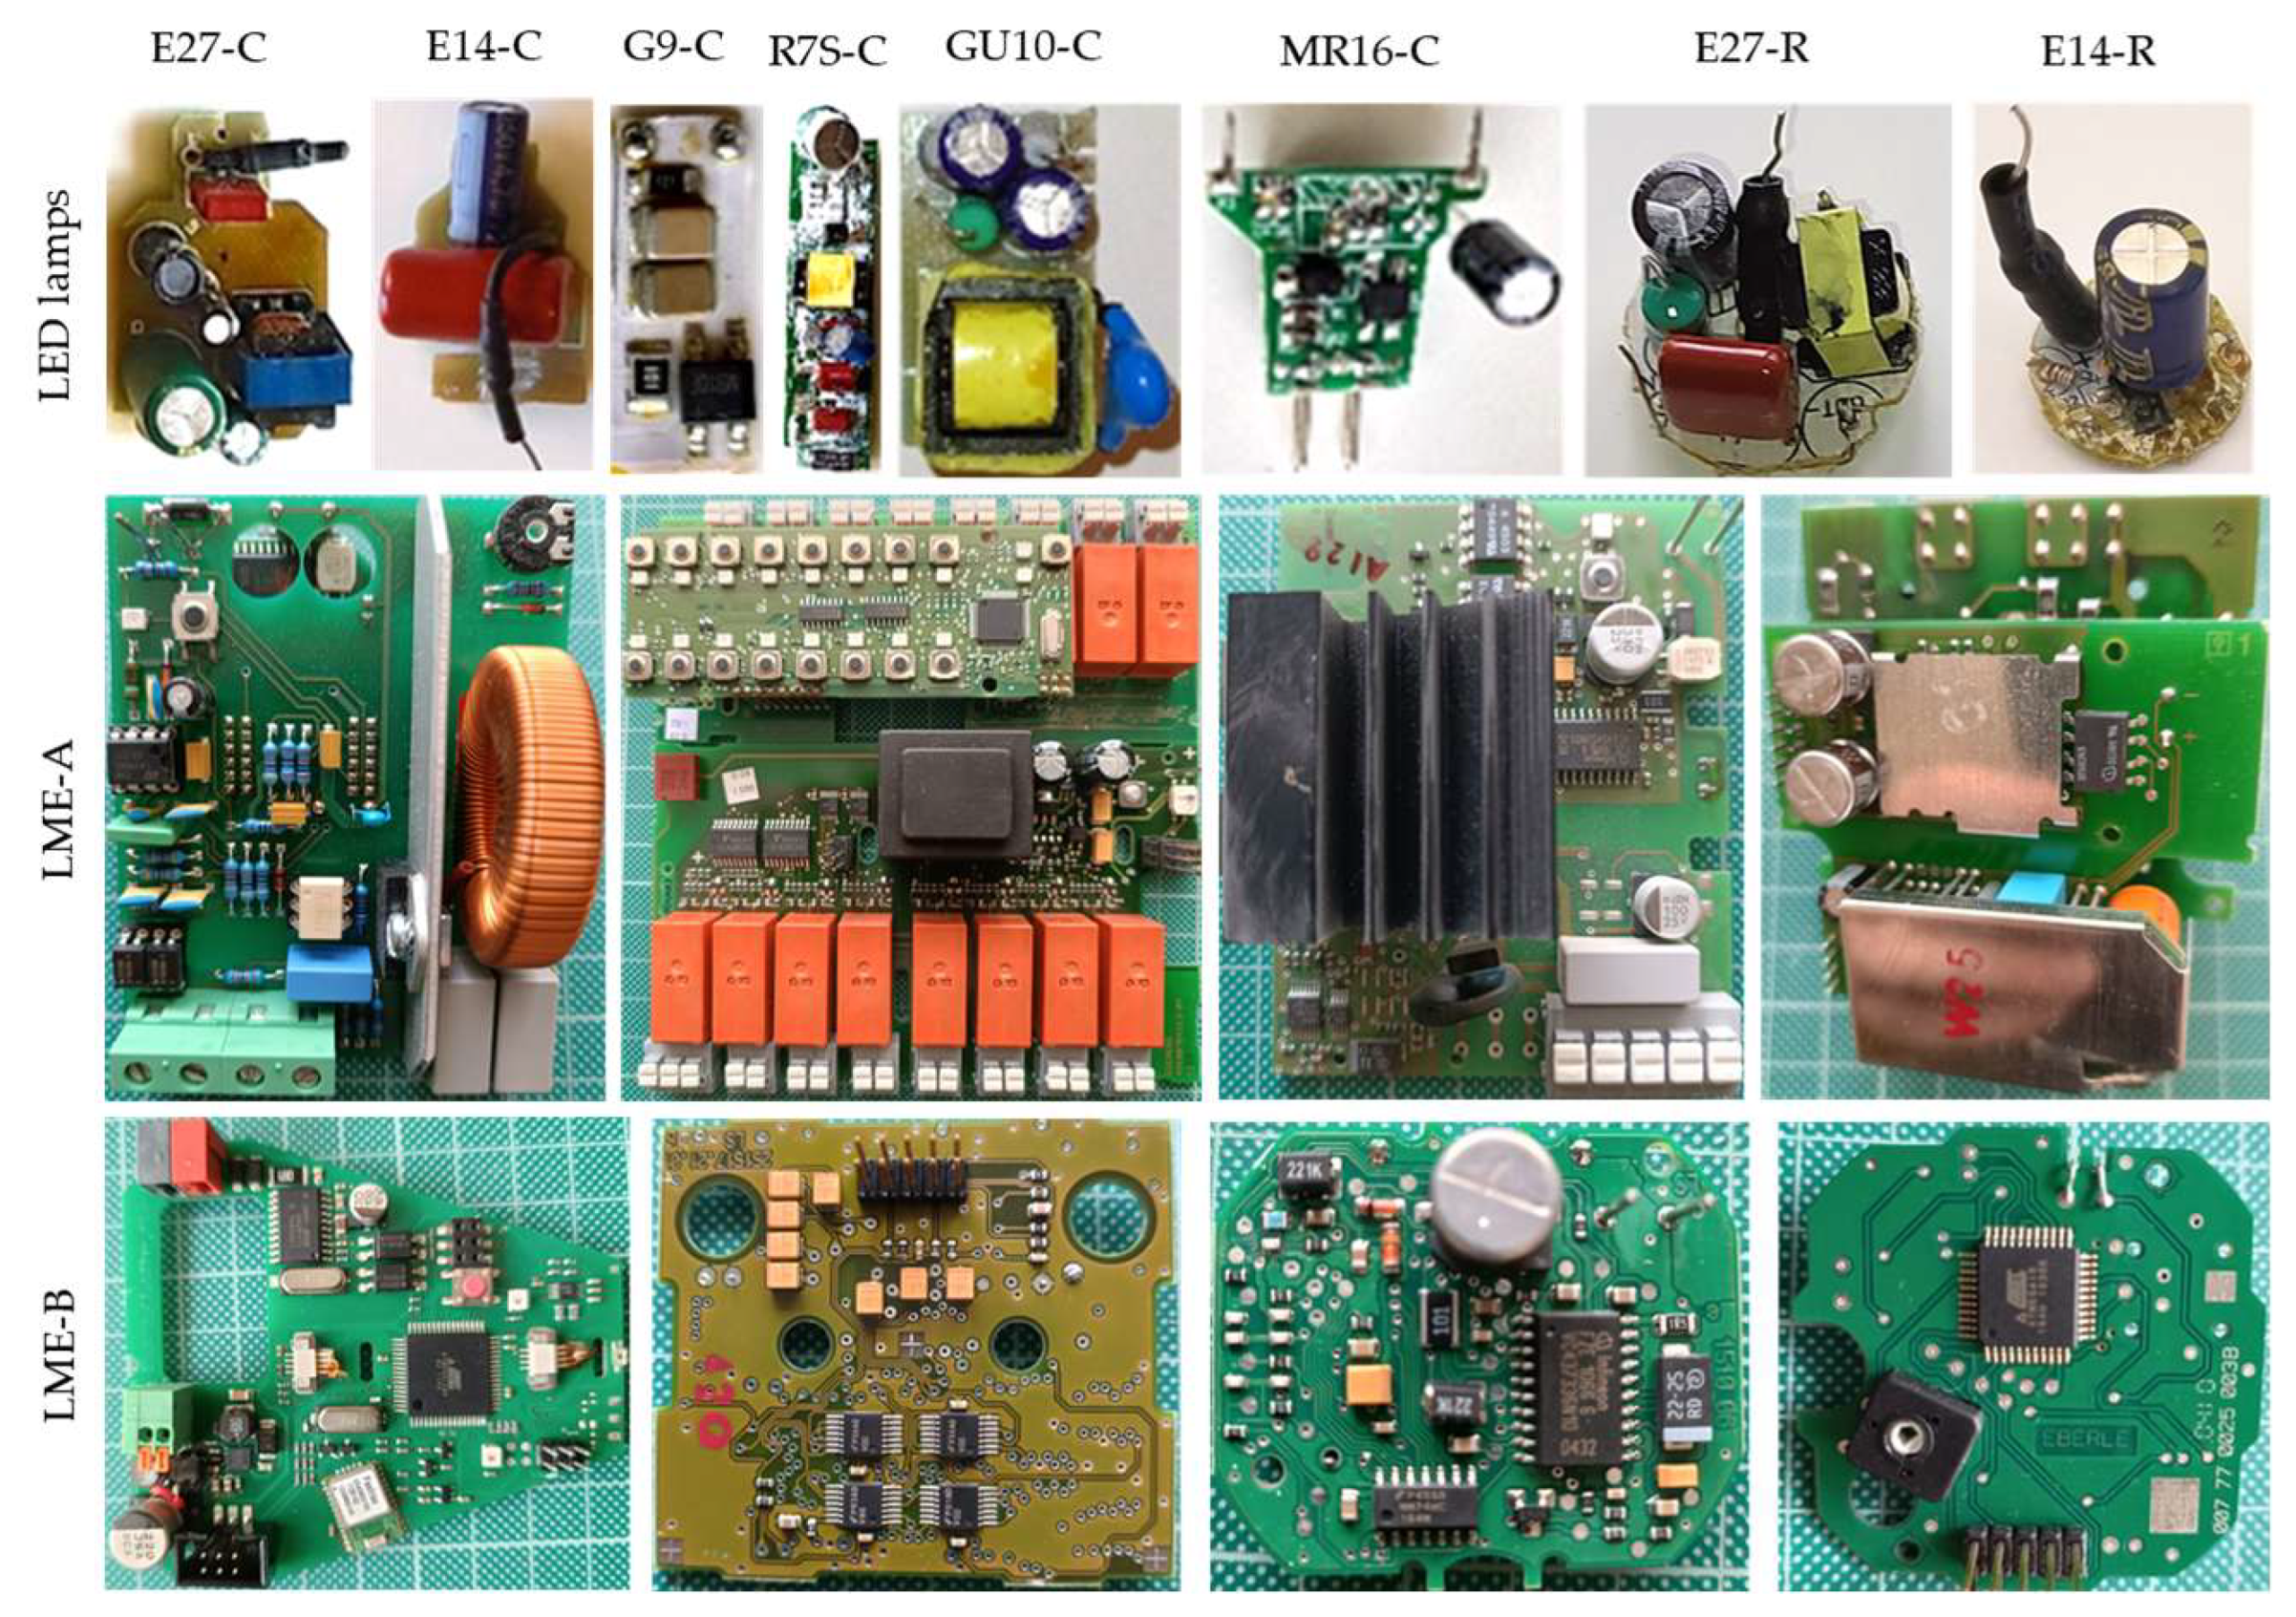
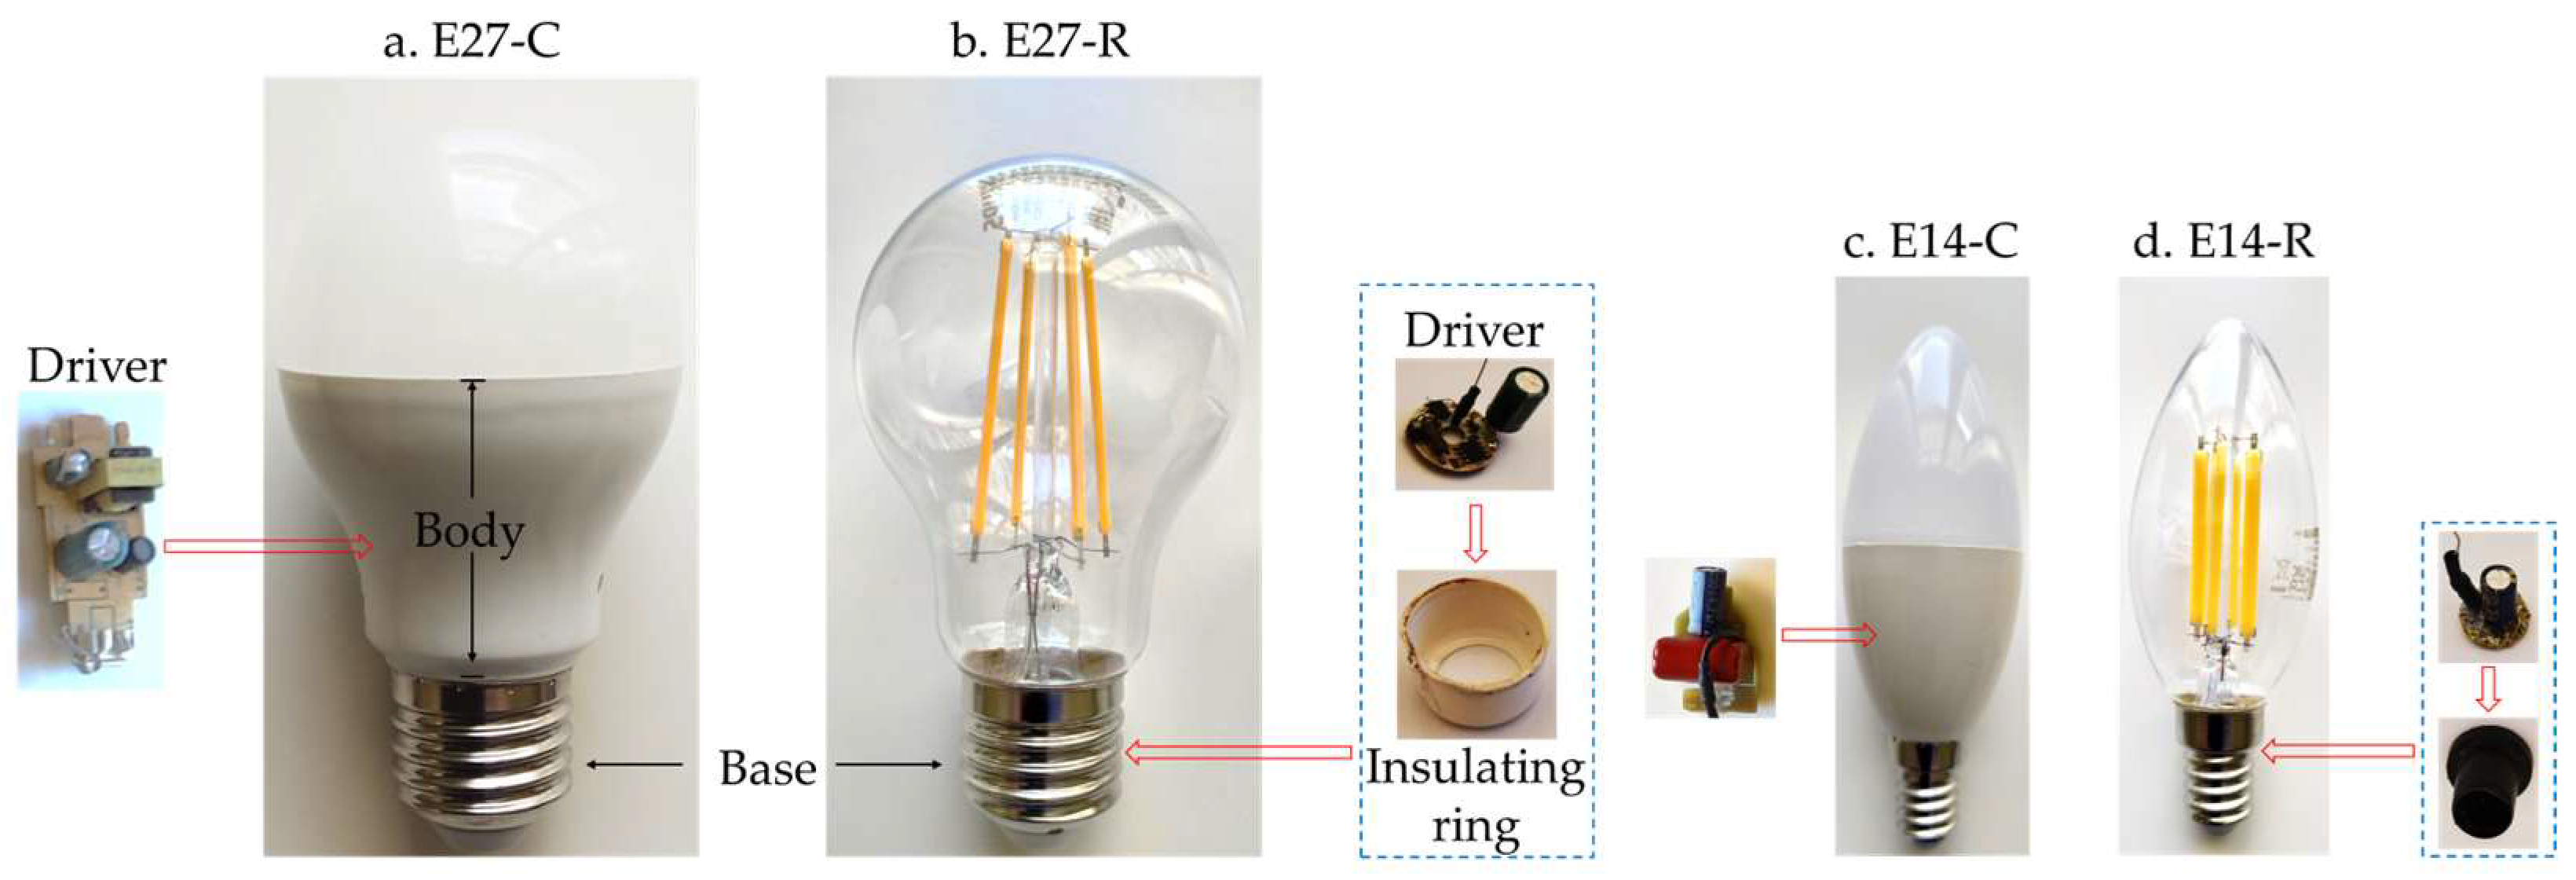
The driver typically constitutes 4–7 wt% of the equipment’s total mass [22] and facilitates the two-way ‘coupling’ between software and hardware [23], ensuring the equipment operates smoothly and safely. In general, a driver consists of electrical and electronic components (EECs), electrical insulation materials (EIMs), and printed circuit board (PCB) (Figure 1a). Depending on the type of equipment and its electrical characteristics, it may also include structures for managing the heat generated during operation, such as heatsinks (Figure 1b).

1.2.1. Valuable and Precious Metals in Drivers

The presence of valuable and precious metals in drivers [24,25,26] makes them valuable components of WEEE [27,28], given that approximately 40% of the value recovered from WEEE recycling is due to these metals [26]. According to Hadi et al. (2015), recovering these metals from drivers is considered more advantageous than primary extraction, both economically and environmentally [29].
The elemental composition and concentrations of drivers vary significantly depending on the type and specifications of the equipment, as well as the design technology and environmental requirements in force at the time of manufacture. According to Andooz et al. (2022), knowledge of the elemental composition of drivers is crucial for their separate sorting during the pre-treatment phase of WEEE, thereby contributing to the more effective and environment-friendly design of their recycling streams [11]. However, it is worth noting that, according to Anshu Priya and Hait (2018), there is currently no detailed or complete information available on driver characterisation. This results in the loss of specific metals during drivers’ recycling, particularly in cases where these metals are present in low concentrations [30].

1.2.2. Drivers’ Recycling

During the pre-treatment phase of WEEE, drivers are removed from the equipment for separate, specialised recycling [31,32] using a combination of physical and chemical methods [33]. The removal and dismantling of drivers contribute to preserving the stored potential of their metals [34], particularly by avoiding the airborne and non-airborne losses generated during the shredding of WEEE [35].
The complex structure of the drivers makes standardising a recycling process, particularly in the event of their recycling as a single structure, difficult; therefore, automatic or manual dismantling [36] and separating their components are standard practices [37]. Driver ECs can be classified according to the following: (a) their operating principle (active, passive, or electromechanical) [38]; (b) macroscopic criteria (type, colour, and geometric dimensions) [39]; and (c) the concentrations of precious metals [40], especially Au, since it accounts for approximately 80% of the total recovered value from drivers [38].
In targeted recycling, characterising EECs in terms of the concentrations of specific chemical elements in their structure is considered an essential process. The results will be used to optimise their recycling flows [27,41,42]. According to Maurice et al. (2021), targeted recycling of ECs may raise expectations for the recovery of high-value metals that are less common and found in lower concentrations in EECs than in commonly used precious metals (Ag, Au, Pd, and Pt) [43].
It is worth noting that combining the functional assessment of electrical and electronic components [44] and their potential reuse [34] will contribute more to environmental, human, and natural resource protection [37] than recovering the stored potential of valuable and critical raw materials from these [45,46,47].

1.3. Integrated Circuits

Integrated circuits (ICs) belong to the “active” and “precious” categories of driver components. ICs are of particular interest from technological and recycling perspectives due to their utilisation of microelectronics and nanotechnology [48], as well as the significant concentrations of precious metals in their structure [49,50,51,52,53]. Precious metals are used in IC structures as contact or plating materials [36] due to their high conductivity and chemical stability, which contributes to the creation of durable and, therefore, reliable ICs [54].
Integrated circuits mainly consist of a microelectronic structure (die or chip), a housing, and internal conductive interconnections [55]. Electronic packaging typically involves integrating a microelectronic structure into a specialised housing to protect it from environmental conditions, and establishing conductive connections (wire) between the die’s contacts (pads) and the housing’s pins (lead frame) to supply power to the structure and enable communication with the physical world [56].

The Literature Review

The literature review identified 50 studies on the characterisation of EECs in terms of the presence and concentrations of PMs in their structure. Specifically, four for resistors [39,50,51,52], three for inductors [40,51,57], three for diodes [39,51,58], two for transistors [40,51], three for capacitors [40,52,59], and three for varistors and ceramic capacitors [49,50,52]. Ten studies concerned tantalum capacitors [8,40,51,52,60,61,62,63,64,65], fourteen concerned multi-layer ceramic capacitors [19,39,40,47,49,52,66,67,68,69,70,71,72,73], and eight studies concerned integrated circuits, which are listed below.
Before presenting these studies, it is worth noting that, despite the widespread use of ICs in EEE drivers and the expected increase in demand resulting from the development of artificial intelligence [15], the presence of precious metals in their structure [74] and their high degree of recoverability [75], the number of studies presenting data on precious metal concentrations in ICs is relatively small. This finding is confirmed by Li et al. (2019) [74] and Liu et al. (2024) [71].
Delfini et al. (2011) [49] studied the drivers of personal computers, monitors, and TVs. Among other results, they present the characterisation results of the ICs from these three cases, particularly about PMs (Au, Pd) [49]. Lee et al. (2011) studied 22 different types of integrated circuits derived from scrap ICs of an unknown origin. Among other data, they provided results characterising the ICs in terms of the presence and concentrations of silver (Ag) and gold (Au) [74]. Jung et al. (2017) studied EECs derived from waste PCBs of the memory type. Among their results, they present the characterisation of ICs, particularly PMs (Ag, Au) [50]. Among the results of their study of the ICs, Liu et al. (2018) report that Ag is involved in the primary synthesis of the ICs [55] (Li et al., 2019). Also, they confirm the involvement of Ag in the main synthesis of ICs from computers [76]. Monneron-Enaud et al. (2020) studied the electronic components of medical equipment. Among their findings, they present the characterisation of ICs according to their surface area (i.e., small or large ICs), with a particular focus on PMs (Ag, Pd) [39]. Among other ECs, Panda et al. (2021) [53] studied ICs from personal computers. They presented characterisation results corresponding to the naturally enriched sample of ICs (the metal fraction of ICs), particularly about Ag, Au, Pd, and Pt [53]. Liu Xia et al. (2024) studied waste ICs that were removed from waste PCBs using an automated process. Among their characterisation results concerning the main composition of the ICs, they present data on Ag and Au [15].
According to the literature mentioned above, the analytical methods used to characterise ICs are as follows: (a) atomic absorption spectrometry (AAS) [53,74]; (b) inductively coupled plasma atomic emission spectrometry (ICP-AES) [15]; (c) inductively coupled plasma optical emission spectroscopy (ICP-OES) [49,50,53]; and (d) inductively coupled plasma mass spectrometry (ICP-MS) [39,55,76]. It is worth noting that, in terms of measurement methodology, there is no substantial difference between ICP-AES and ICP-OES, except that, as in the case of AAS, the elements of the periodic table to be analysed are examined one by one in the former. In contrast, in the latter, they are examined simultaneously. In general, ICP-OES has lower detection limits than ICP-AES. The above methods differ in terms of detection limits. In order of detection limit, they are classified as follows: (a) AAS (sub-ppb to ppm level), (b) ICP-AES (1–10 ppb for most elements, and sub-ppb for some), (c) ICP-OES (similar to ICP-AES), (d) ICP-MS (ppt for most elements) [77].
Due to the presence of various elements in the periodic table with concentrations ranging from ‘major’ to ‘ultra-trace’, choosing the most appropriate method for each case of analysis is challenging [78]. This is a multifactorial function that takes into account the following: (a) the purpose of the analysis, (b) sample properties, (c) detection limit requirements, (d) measurement accuracy, (e) the speed of analysis and performance, (f) the operating cost [77]. Targeted characterisation of electronic components is the precursor to targeted recycling and contributes to making the optimal economic and technical choice of analysis method for future samples.
The novelty of this study concerns the collection of waste ICs from lighting equipment (LED lamps and LME), separating them according to their origin and placement (through-hole or surface mount) on the aforementioned equipment’s PCBs, and characterising them in terms of the presence and concentrations of the elements Ag, Au, Pd, and Pt.

2. Materials and Methods

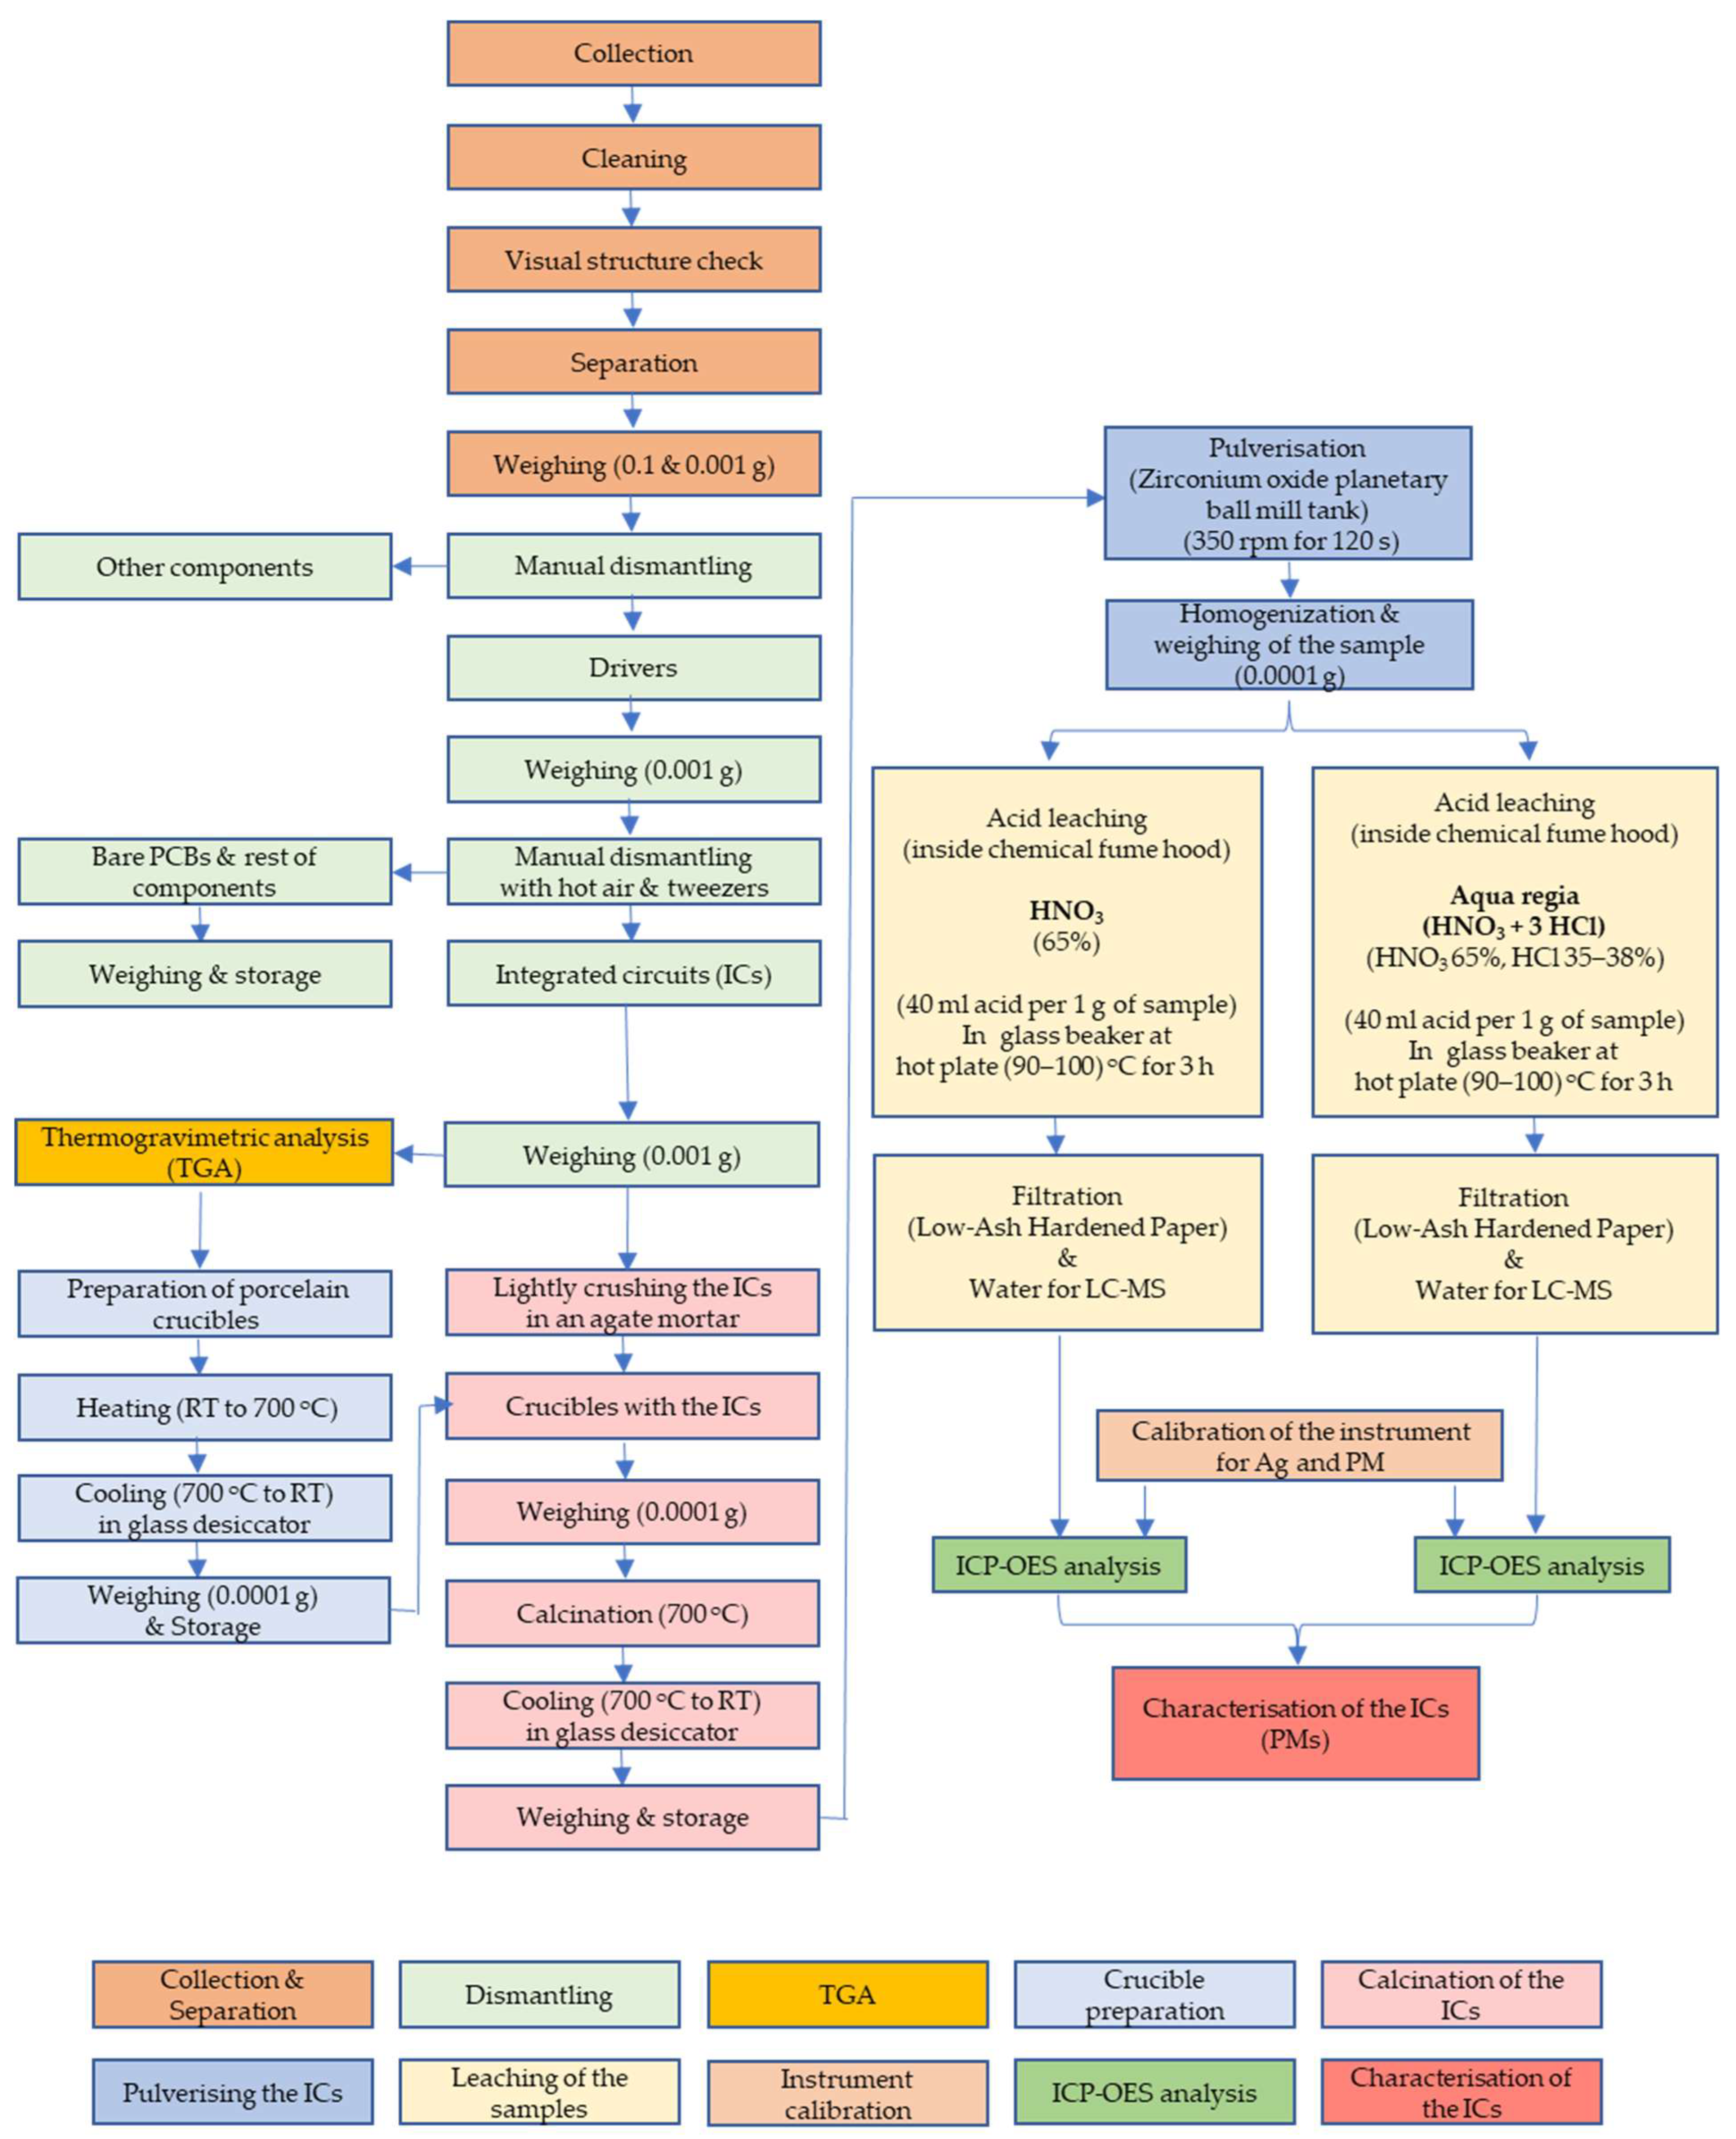
The lighting equipment (LE) used in this study was collected in Greece and consisted of the following: (a) a random sample of 10.017 kg of LED lamps for domestic lighting applications (consisting of 219 pieces) provided by Aegean Recycling-Foundries SA; and (b) building energy management equipment (specifically, natural and artificial lighting management equipment capable of supporting the operational needs of a modern 240 m2 residence) provided by Siemens Greece and ABB Greece. According to Sideris et al. (2023) [19] estimated that the lamps were produced between 2016 and 2021, whereas the LME sponsors stated that they were produced between 2012 and 2020. The experimental process included the following stages, from equipment collection to integrated circuit characterisation. These stages are summarised in the step-by-step flow chart in Figure A1.

2.1. Collection and Separation

The first stage included the following: collection, cleaning, macroscopic integrity check, separation, selection of unique lamps and units of LME in terms of electrical characteristics, weighing using balance (brand: KERN, model: EHA 1000-1, precision: 0.1 g), and precision balance (brand: KERN, model: EWJ-300-3, precision: 0.001 g).

2.2. Select Unique LE Units

Unique units were selected for investigation from the initial random sample of LE. These differed in either their technical characteristics or brand name (BN).

2.3. Dismantling and Separation

The second stage included the following: (a) manually dismantling the equipment into its basic components (mainly the body, LED module, filament LEDs, and driver) using basic tools, such as screwdrivers and cutters; (b) grouping the basic materials (metals, plastics, glass, ceramics, etc.) and functional units (LED modules, filament LEDs, drivers, etc.); (c) completely dismantling the drivers using special tools, such as a magnifying glass, tweezers, and a hot air gun with a temperature rating (brand: BOSCH (Robert Bosch GmbH, Stuttgart, Germany), model: GHG 20-60), and the necessary personal protective equipment (gloves, protective goggles, and an activated carbon mask); (d) identification and separation of indistinguishable EECs in the drivers using a magnifying glass and a digital instrument to identify surface-mount device components (brand: Mastech, model: MS8910); and (e) weighing all of the above mass fractions of the equipment using a precision balance (brand: KERN (KERN & SOHN GmbH, Balingen, Germany), model EWJ-300-3, precision: 0.001 g.

2.4. Preparing Porcelain Crucibles and Calcination of ICs

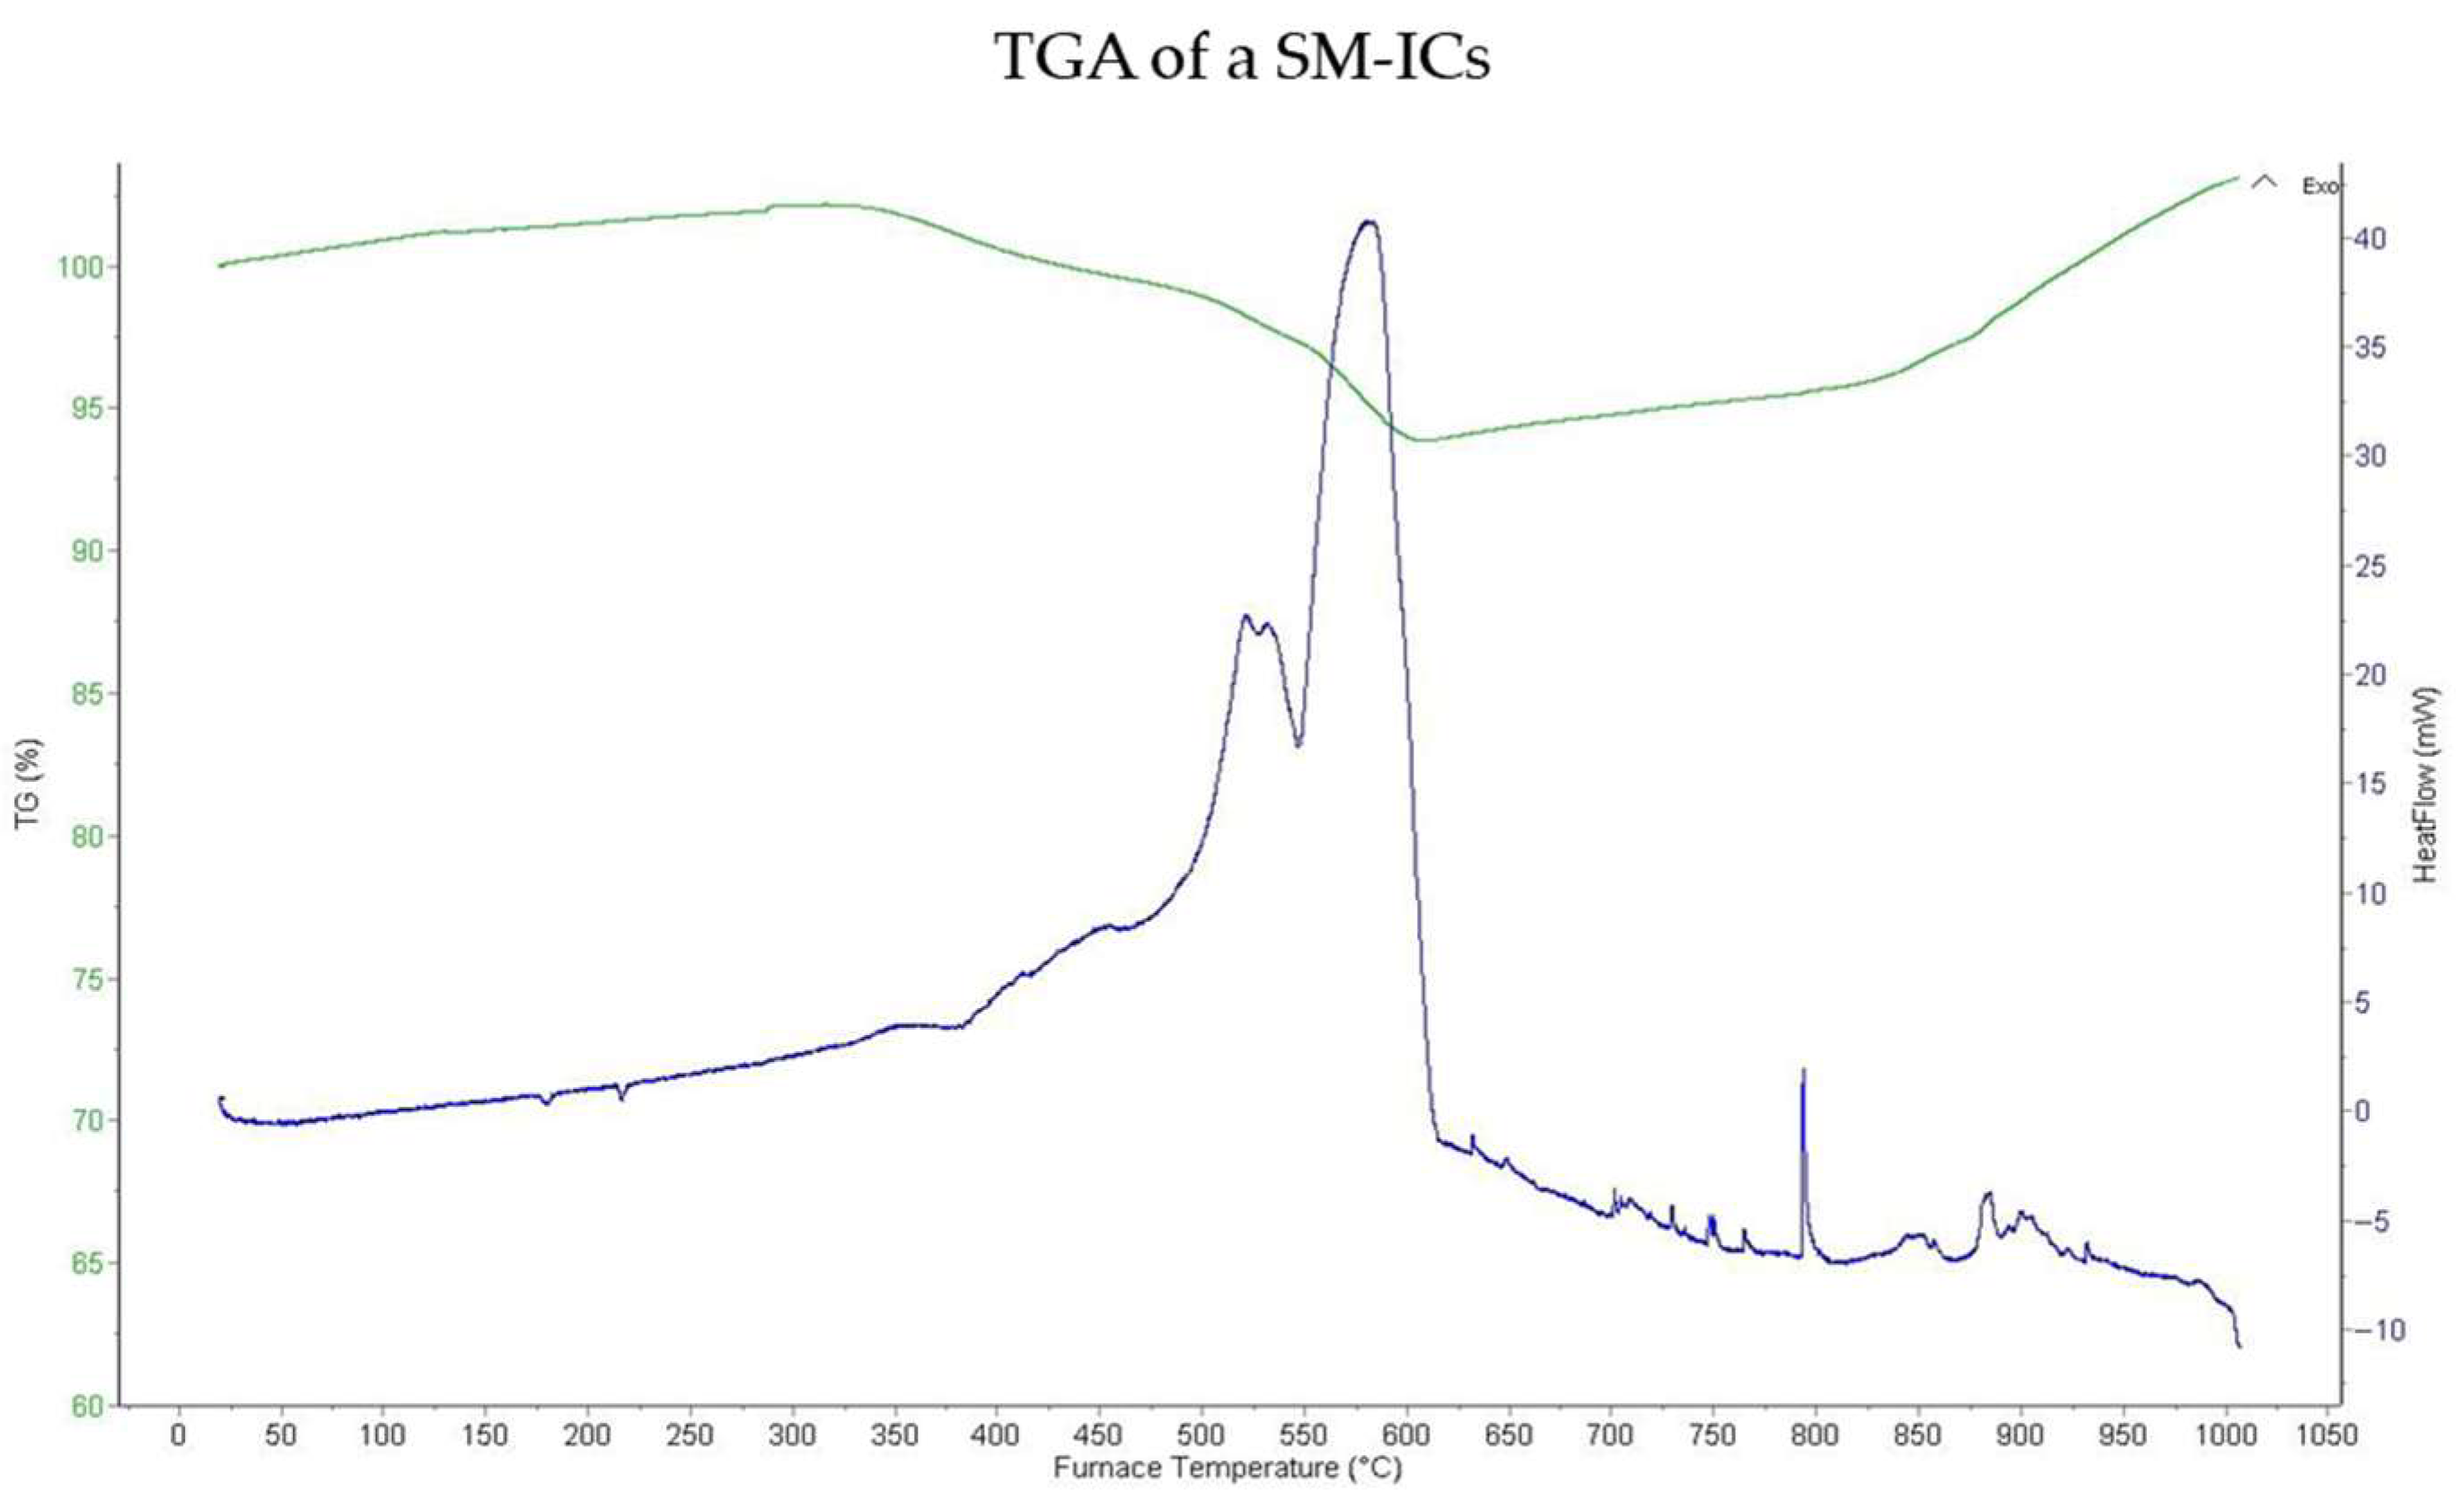
The calcination temperature of the plastic ICs was selected, and the porcelain crucibles were prepared based on the thermogravimetric analysis (TGA) results of an IC (Figure 2), performed with a thermogravimetric analyser (brand: Setaram (Setaram Research Services, Geneva, Switzerland), Model: TG DTA DSC +1600 °C. A temperature of 700 °C was selected.
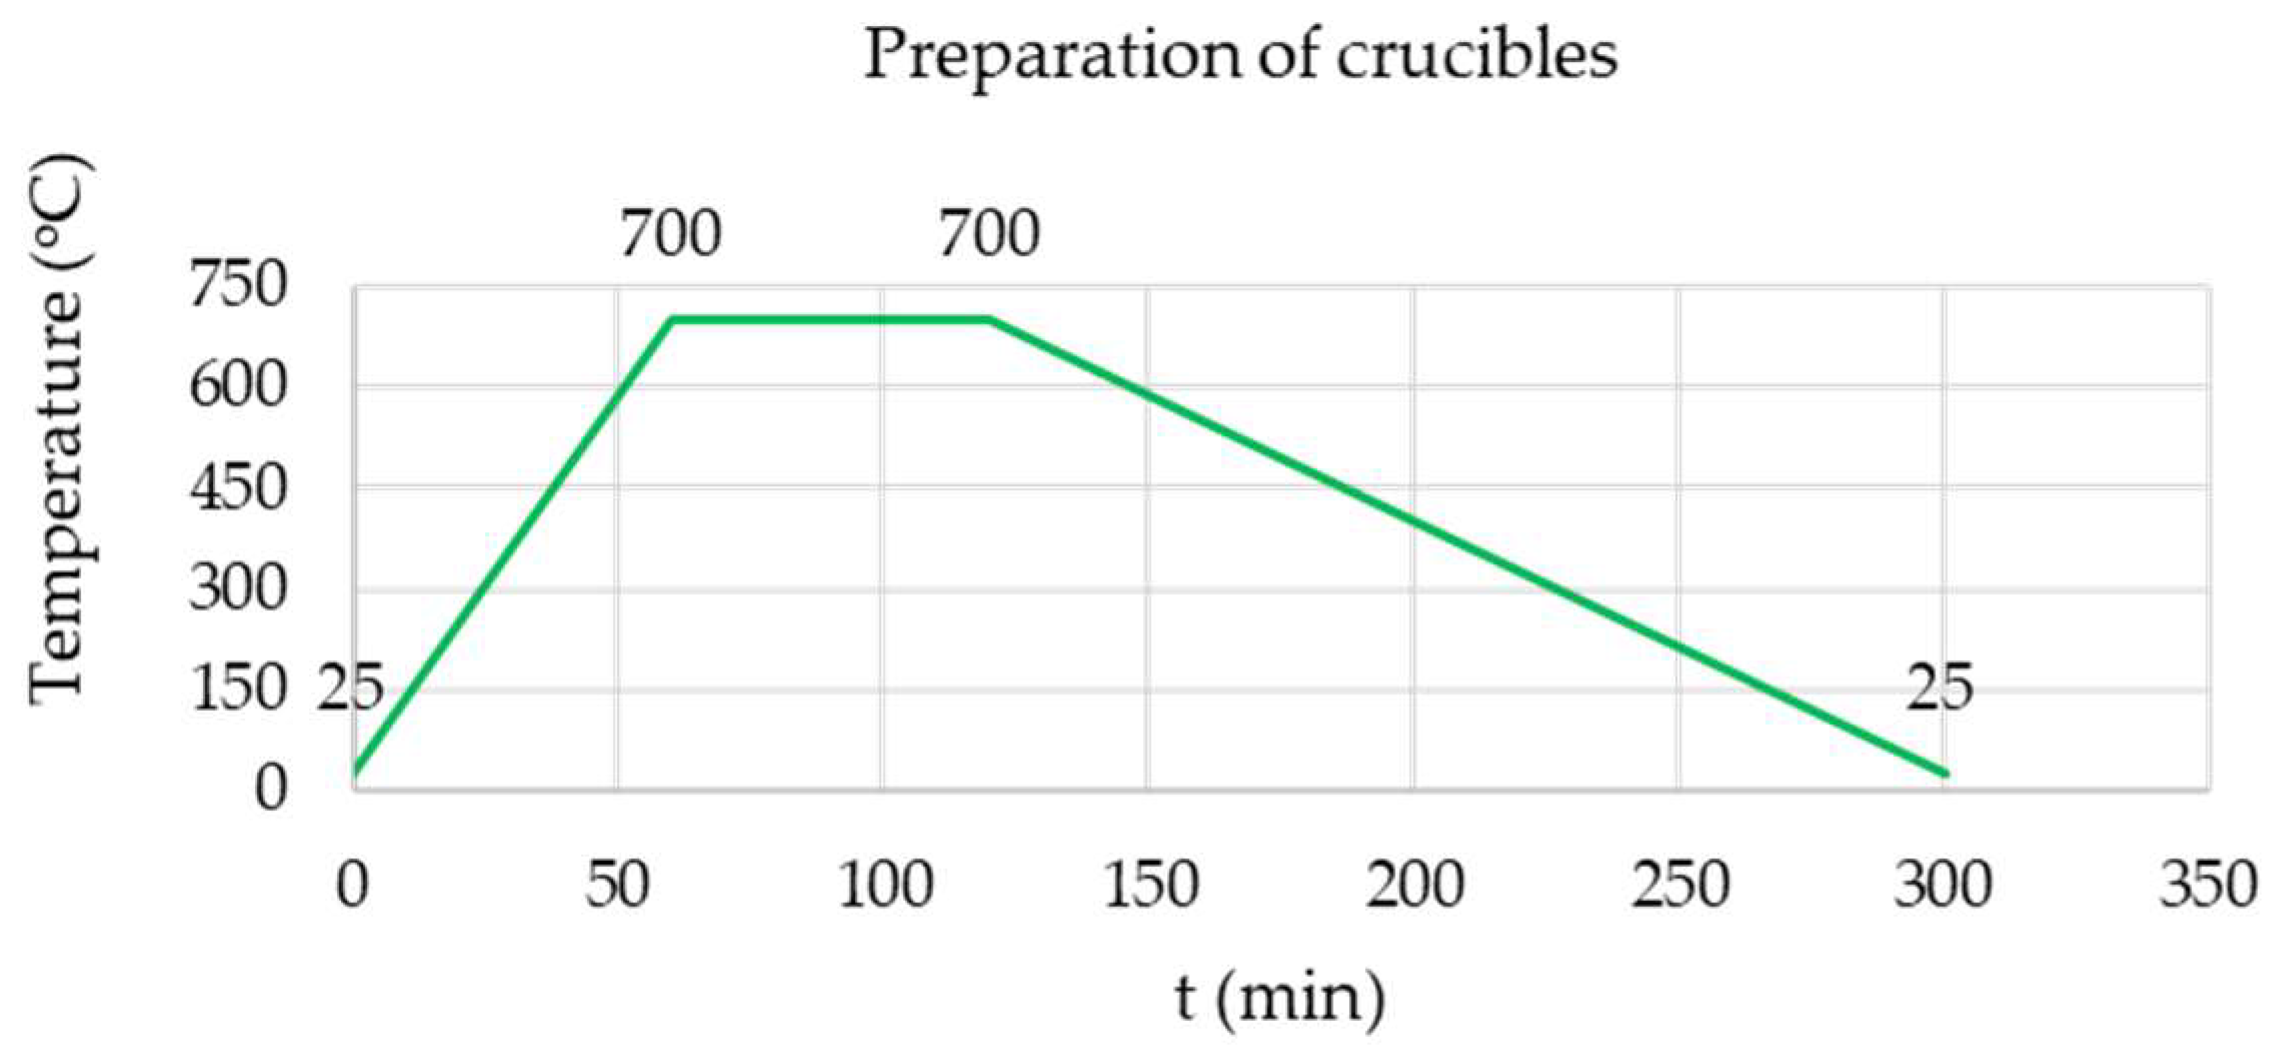
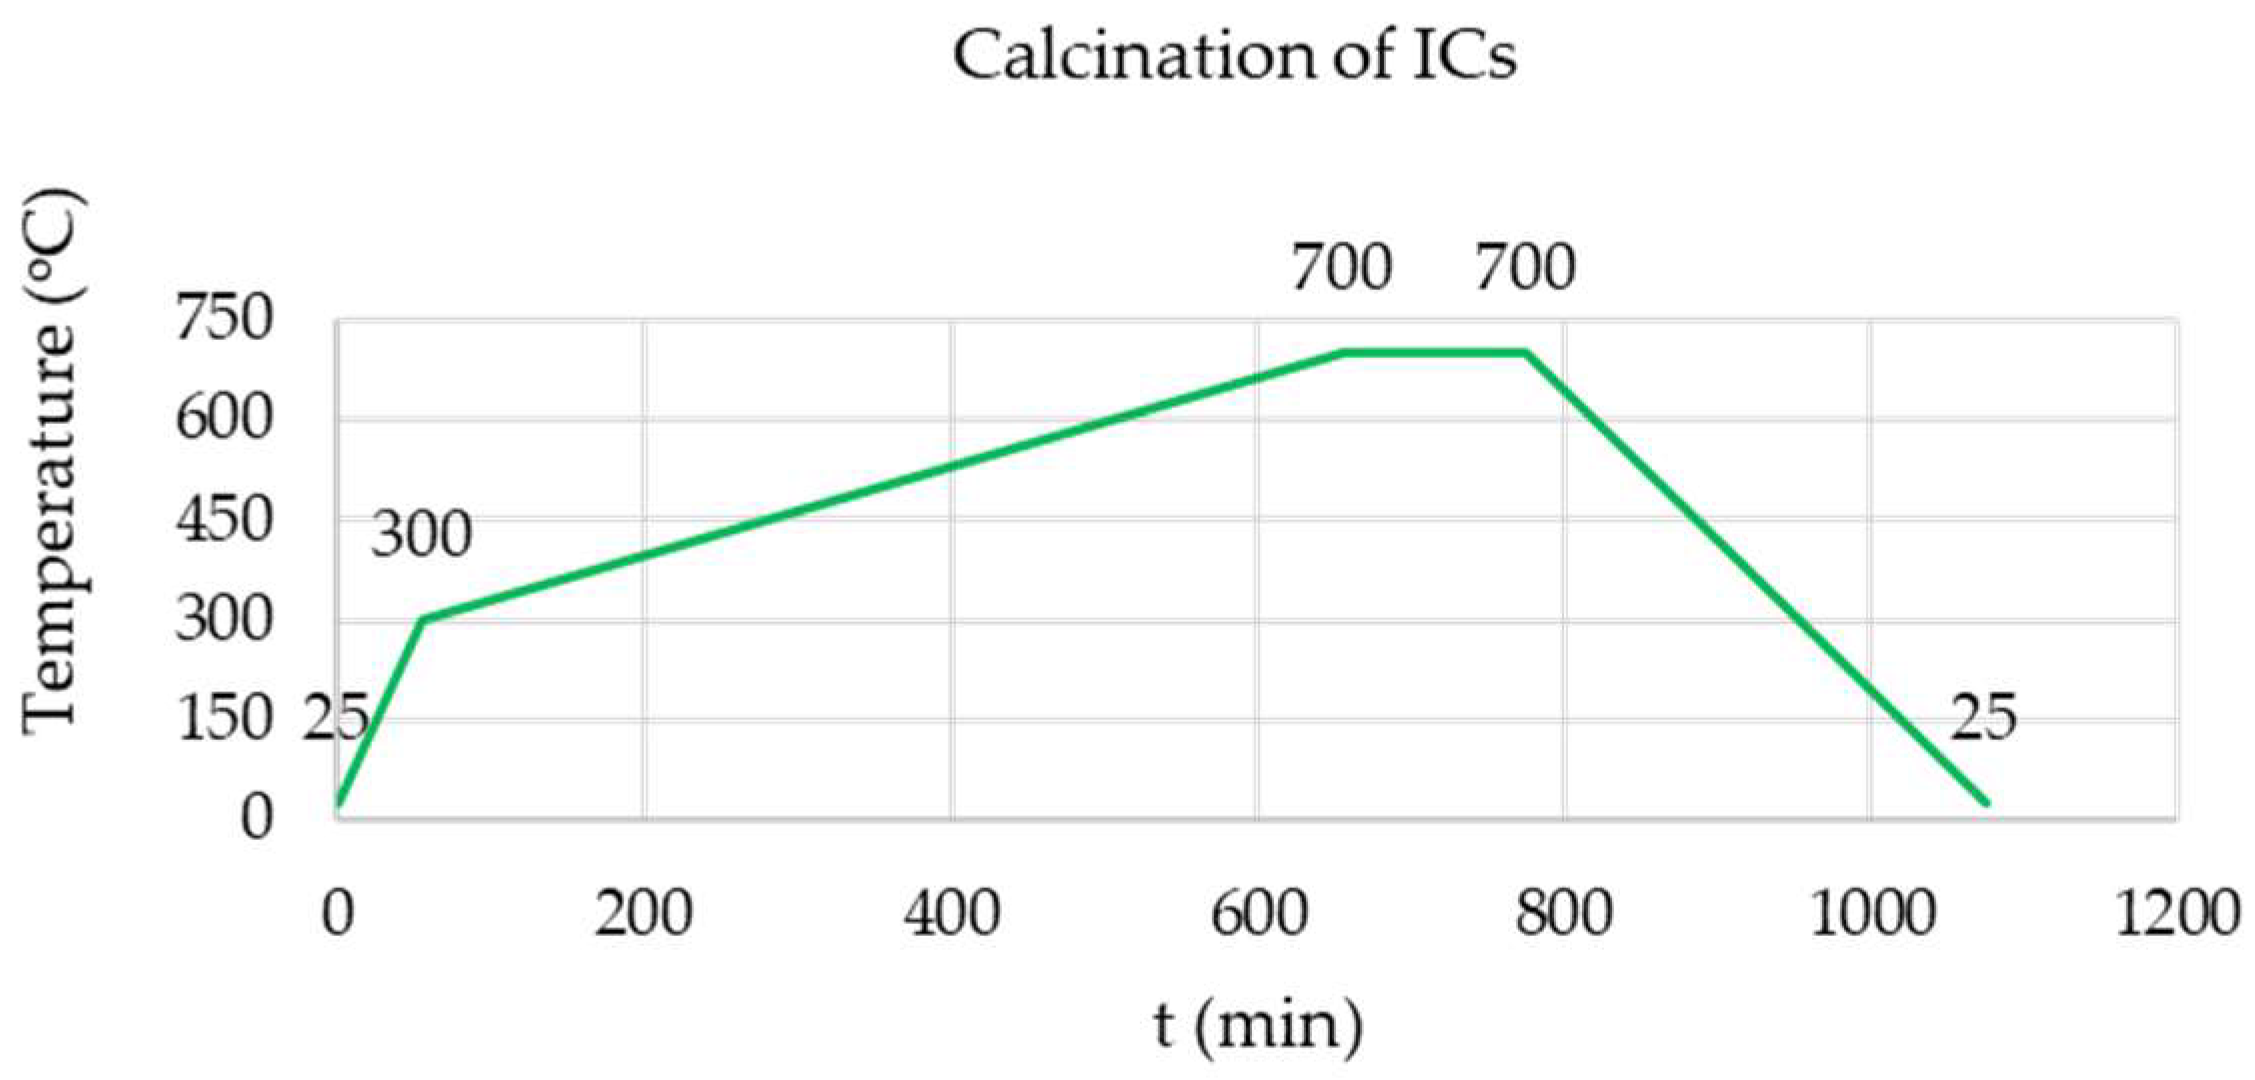
The porcelain crucibles (brand: JIPO (Jizerská porcelánka s.r.o., Desná v Jizerských horách I, Desna, Czech Republic) with a middle form), were prepared, including cleaning, initial weighing, heating, and natural cooling in a desiccator according to the heating–cooling profile shown in Figure 3, final weighing, and careful storage.
Before calcination (Figure 4), the plastic ICs were lightly broken in an agate mortar to achieve more efficient combustion of their encapsulation material [55] and optimal release of their sub-structures [74] (die, solder wires, and pins) during pulverisation. According to Nieberl et al. (2023) [8], thermal methods can increase the energy consumption of the aforementioned experimental process. However, they can also achieve the good decomposition of epoxy resin and other plastic encapsulation materials used in the electronics industry. This contributes to releasing the IC internal structure for recycling [8]. The above laboratory steps were carried out using the following: (a) an analytical balance (brand: KERN (KERN & SOHN GmbH, Balingen, Germany), model: ABP 200-4M, precision: 0.0001 g) and a laboratory furnace (brand: THERMOLYNE (THERMOLYNE–ThermoFisher Scientific, Waltham, MA, USA), model: 30400).

2.5. Creation of Laboratory Samples

After calcination of the plastic ICs for the creation of laboratory samples and to maximise the effectiveness of the acids (HNO3 and aqua regia) on them [68,69,79], they were pulverised using a ball mill (Brand: FRITSCH, model Pulverisette 6, Idar-Oberstein, Germany), with a zirconium oxide planetary ball mill tank (FRITSCH, volume 80 mL). Then, after quartering, a mass of ~1 g per sample was selected using an analytical balance (brand: SHIMADZU; model: AUX320; precision: 0.0001, Kyoto, Japan).

2.6. Dissolution of Samples

Taking into account the studies by Zamprogno, Rebello et al. (2020) [80] and Wu et al. (2022) [40], the samples were dissolved in HNO3 and aqua regia. The samples were placed in glass beakers with a solid-to-liquid ratio of 1:40 on a thermostatic heating plate at 90–100 °C and stirred manually until complete dissolution (~3 h). The following additional parameters were taken into account: (a) Ag determination is recommended in HNO3 to avoid the formation of silver chloride (AgCl) [81]; (b) Au and Pt can only be dissolved in aqua regia; and (c) Pd can be dissolved in aqua regia and concentrated HNO3 [82]. All processes were carried out in a fume hood, with all appropriate measures taken to protect humans and the environment. The concentrated acids (HNO3 65%; HCl 35–38%) used either directly, or for preparing fresh aqua regia (HCl: HNO3 ratio 3:1), were all analytical grade (brand MACRON, Avantor, Radnor, PA, USA) and supplied by Chemix SA (Athens, Greece).

2.7. ICP-OES Analysis

To determine the precious metals (Ag, Au, Pd, and Pt) in the solution, the ICP-OES instrument (brand: Agilent; model: 5110) was first calibrated using five aqueous standard solutions: 0.5, 2, 4, 10, and 20 mg/L, as well as calibration standards for Ag (brand: HPS, name: ICP-AM-MISA6–27 components) and the PMs (brand: CPA Hem, name: MISA Standard 2–Precious Metals–6 components). To protect the instrument, the initial solutions were filtered using filter paper (brand: Ahlstrom-Munksjö; type: hardened low-ash; grade: 391) and ultrapure water (brand: PanReac; type: LC-MS) until the solution volume reached 100 mL. The operating parameters of the instrument were the same for both acids: (a) Radio frequency (RF) power: 1300 W; (b) Auxiliary gas flow: 0.2 L/min; (c) Nebulisation gas flow: 0.8 L/min; (d) Plasma gas flow: 15 L/min; and (e) Torch configuration: Axial, (f) Sample aspiration rate: 1.5 L/min

3. Results and Discussion

3.1. Separation and Participation of LE

Figure 5 shows the mass percentage of lamps for each base type found in the random sample examined in this study. The percentage ranged from 1.68 to 61.33 wt%, with MR16 lamps having the lowest representation and E27 lamps having the highest.
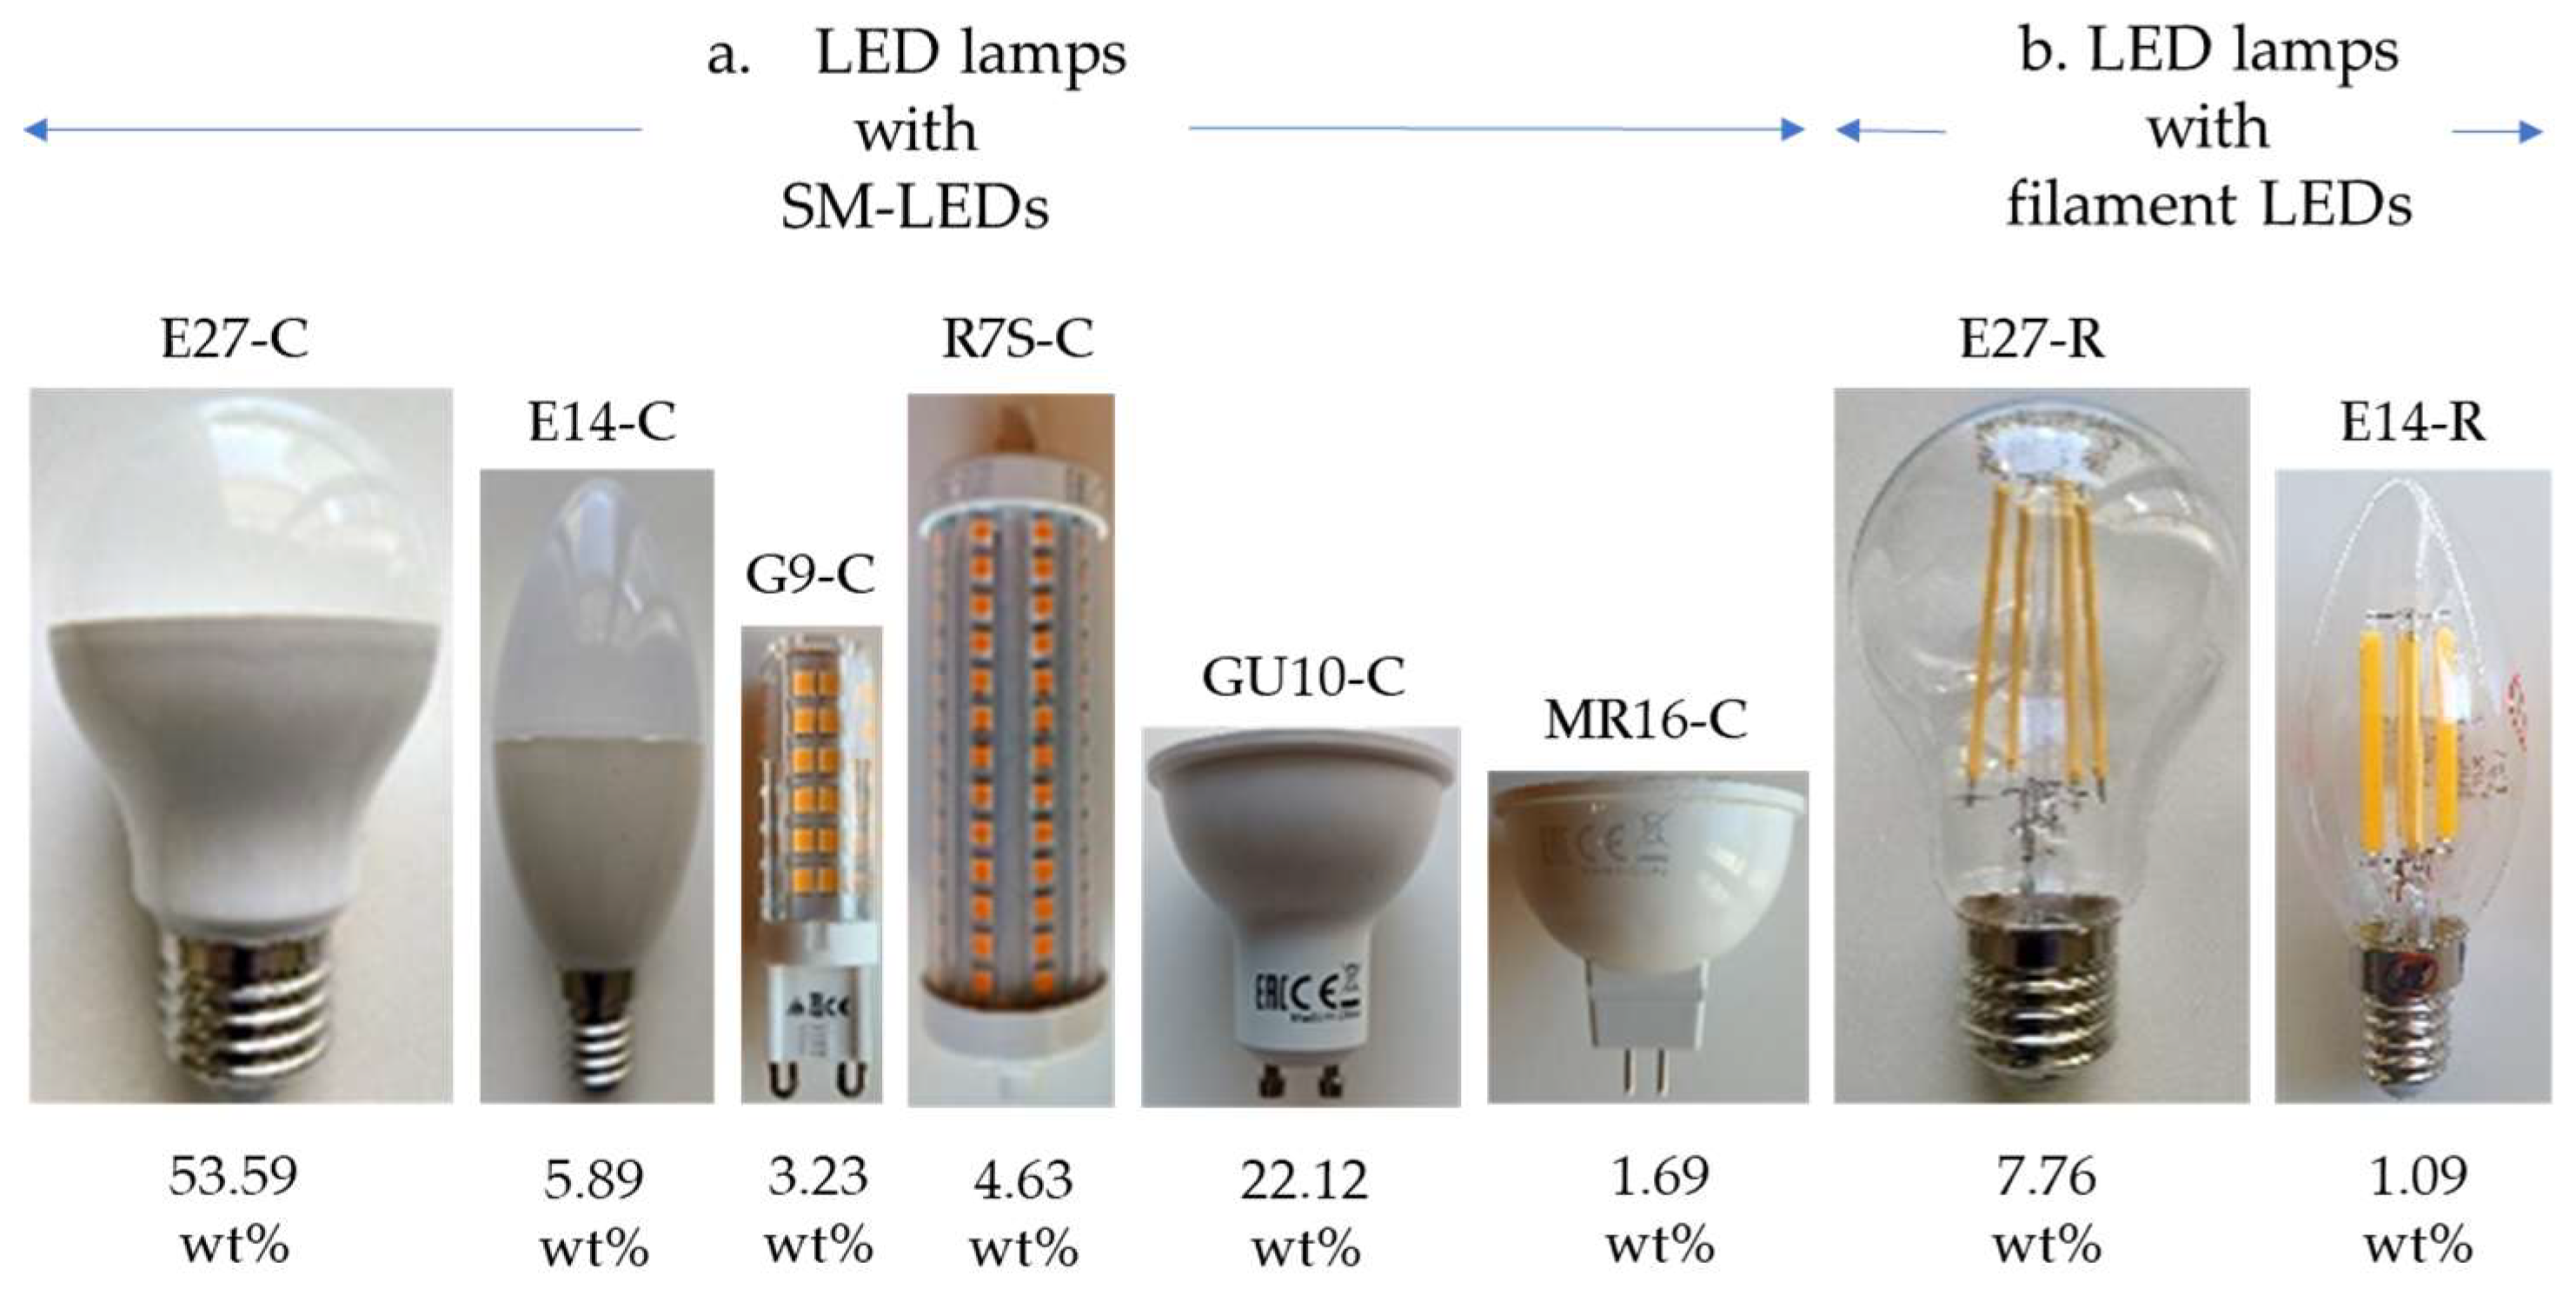
Additionally, the addition of the indicator (C) “classic” or (R) “retro” to the lamp base type denotes lamps with surface mount (SM) or filament LEDs, respectively. Figure 6 shows the mass percentage of each lamp type, based on its base and LED technology (surface mount or filament), is about the mass of the random sample in this study. The percentage ranged from 1.09 to 53.59 wt%, with E14 lamps with filament LEDs having the lowest participation and E27 lamps with surface mount LEDs (SM-LEDs) having the highest.
In the random sample of this study, the percentage (%) of numerical participation of lamps, depending on the type of base, shows a tiny absolute difference compared to the corresponding average percentage obtained from the studies by Mizanur Rahman et al. (2019) [83], Benmamas et al. (2022) [84] and Wehbie & Semetey (2022) [85]: E27 (0.25%), E14 (3.48%), R7S (0.72%), GU10 (7.72%), and MR16 (3.53%). The most commonly used lamp types (E27, E14, and GU10) accounted for 84.02% of the present study sample, which is comparable to the 93.35% reported by Mizanur Rahman et al. (2019) [83]. Notably, lamps with a ‘bayonet’ B22 base type were only reported in the study by Benmamas et al. (2022) [84], while the G9 type was only present in the present study. According to Wehbie and Semetey (2022), the presence and percentage of each lamp type in a random sample depends on geographical area, climatic conditions, and the specific knowledge and culture of the population [85].
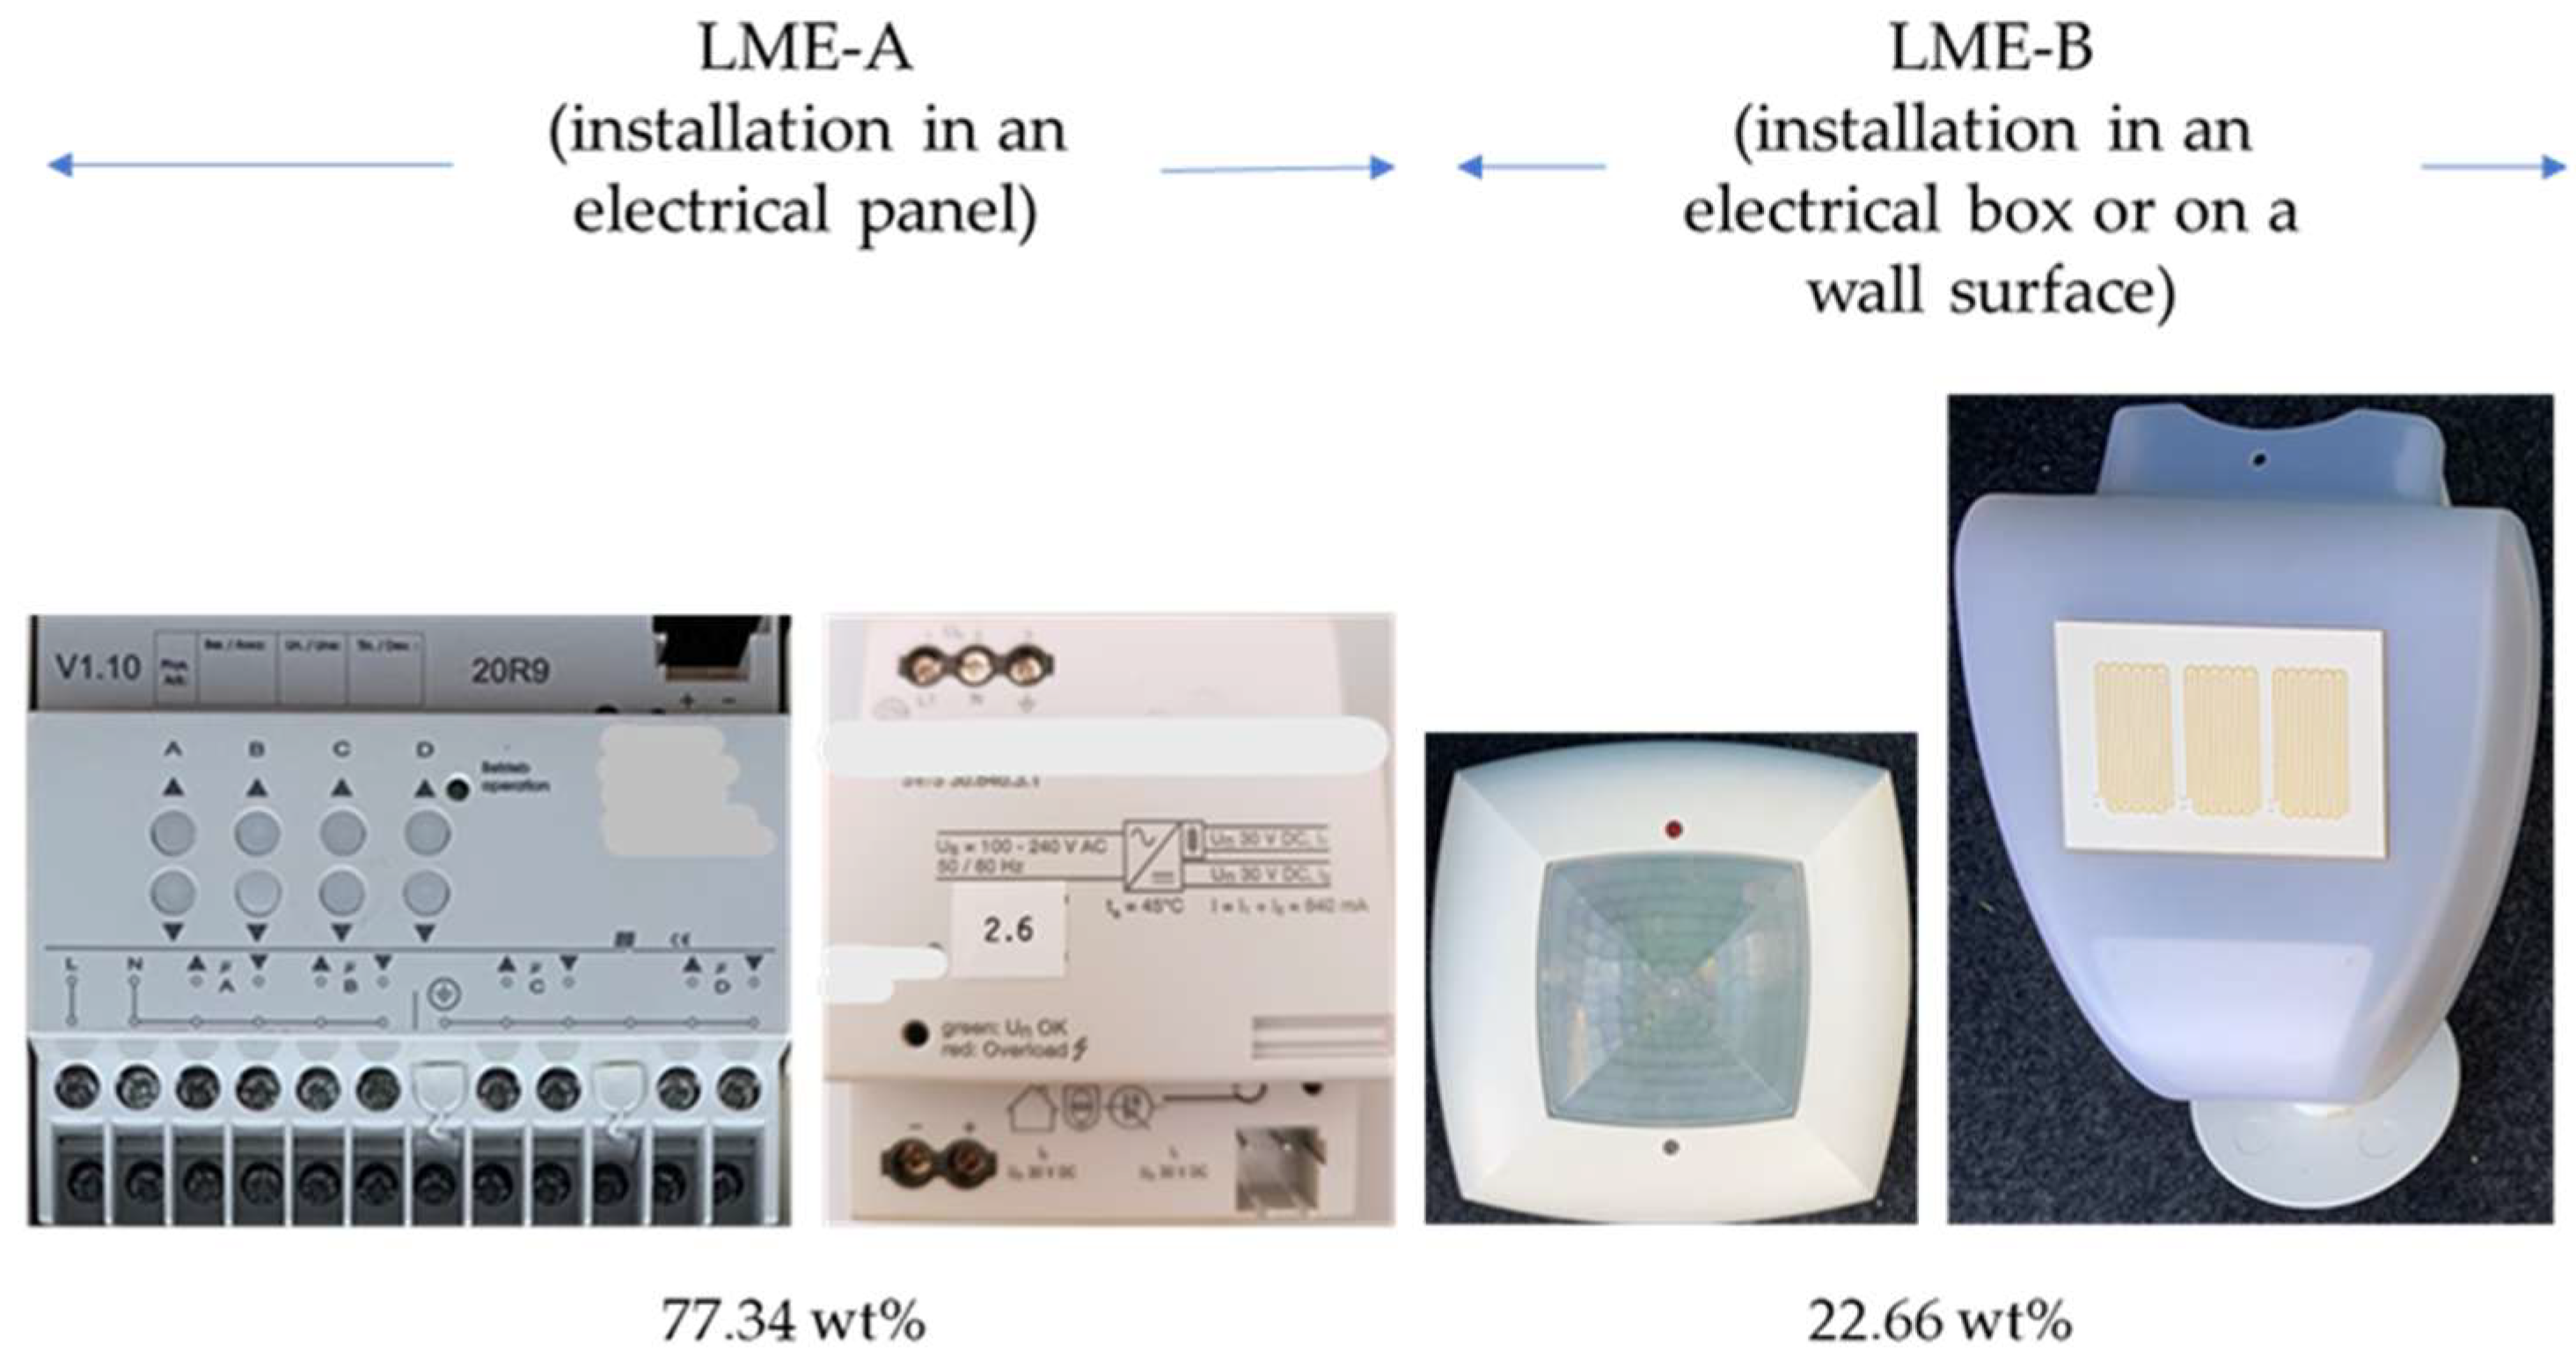
Depending on how the LME is installed in buildings, it is divided into two groups, LME-A and LME-B. Adding the indicator (A) or (B) to the abbreviation ‘LME’ indicates whether the equipment is installed: in an electrical panel (A), an electrical box, or mounted on a wall (B). Figure 7 indicates these cases and their percentage of the total mass of the equipment examined in this study, highlighting the predominance of LME-A (77.34 wt%) over LME-B.

3.2. Selection of Lighting Equipment with Unique Technical Features

To investigate the masses of individual lighting equipment, particularly the presence of integrated circuits in its structure, equipment unique in terms of its technical characteristics or brand name was selected from the initial random sample for investigation.
Specifically, the lamps were selected based on their base type, electrical power, luminous flux, LED technology, and brand name. Figure A2a shows the variation in the electrical power of the lamps, and Figure A2b shows the variation in their luminous flux. Based on the above parameters, the final configuration of the sample of lamps to be tested was as follows: E27-C (59 pieces/28 brands), E14-C (23 pieces/6 brands), G9-C (6 pieces/4 brands), R7S-C (3 pieces/2 brands), GU10-C (24 pieces/14 brands), MR16-C (5 pieces/2 brands), E27-R (11 pieces/7 brands), and E14-R (8 pieces/3 brands).
The selection of LME units with unique technical characteristics was based on the type of equipment, its electrical power, and its location within the electrical installations of the buildings. The composition of the LME sample under consideration was determined by the above parameters as follows: a) LME-A (9 units), including a switching actuator, dimmers, a motor control relay, and a power supply; and b) LME-B (6 units), including a presence detector, a weather station, an information control unit, a push button, a bus coupler, and a room temperature controller.
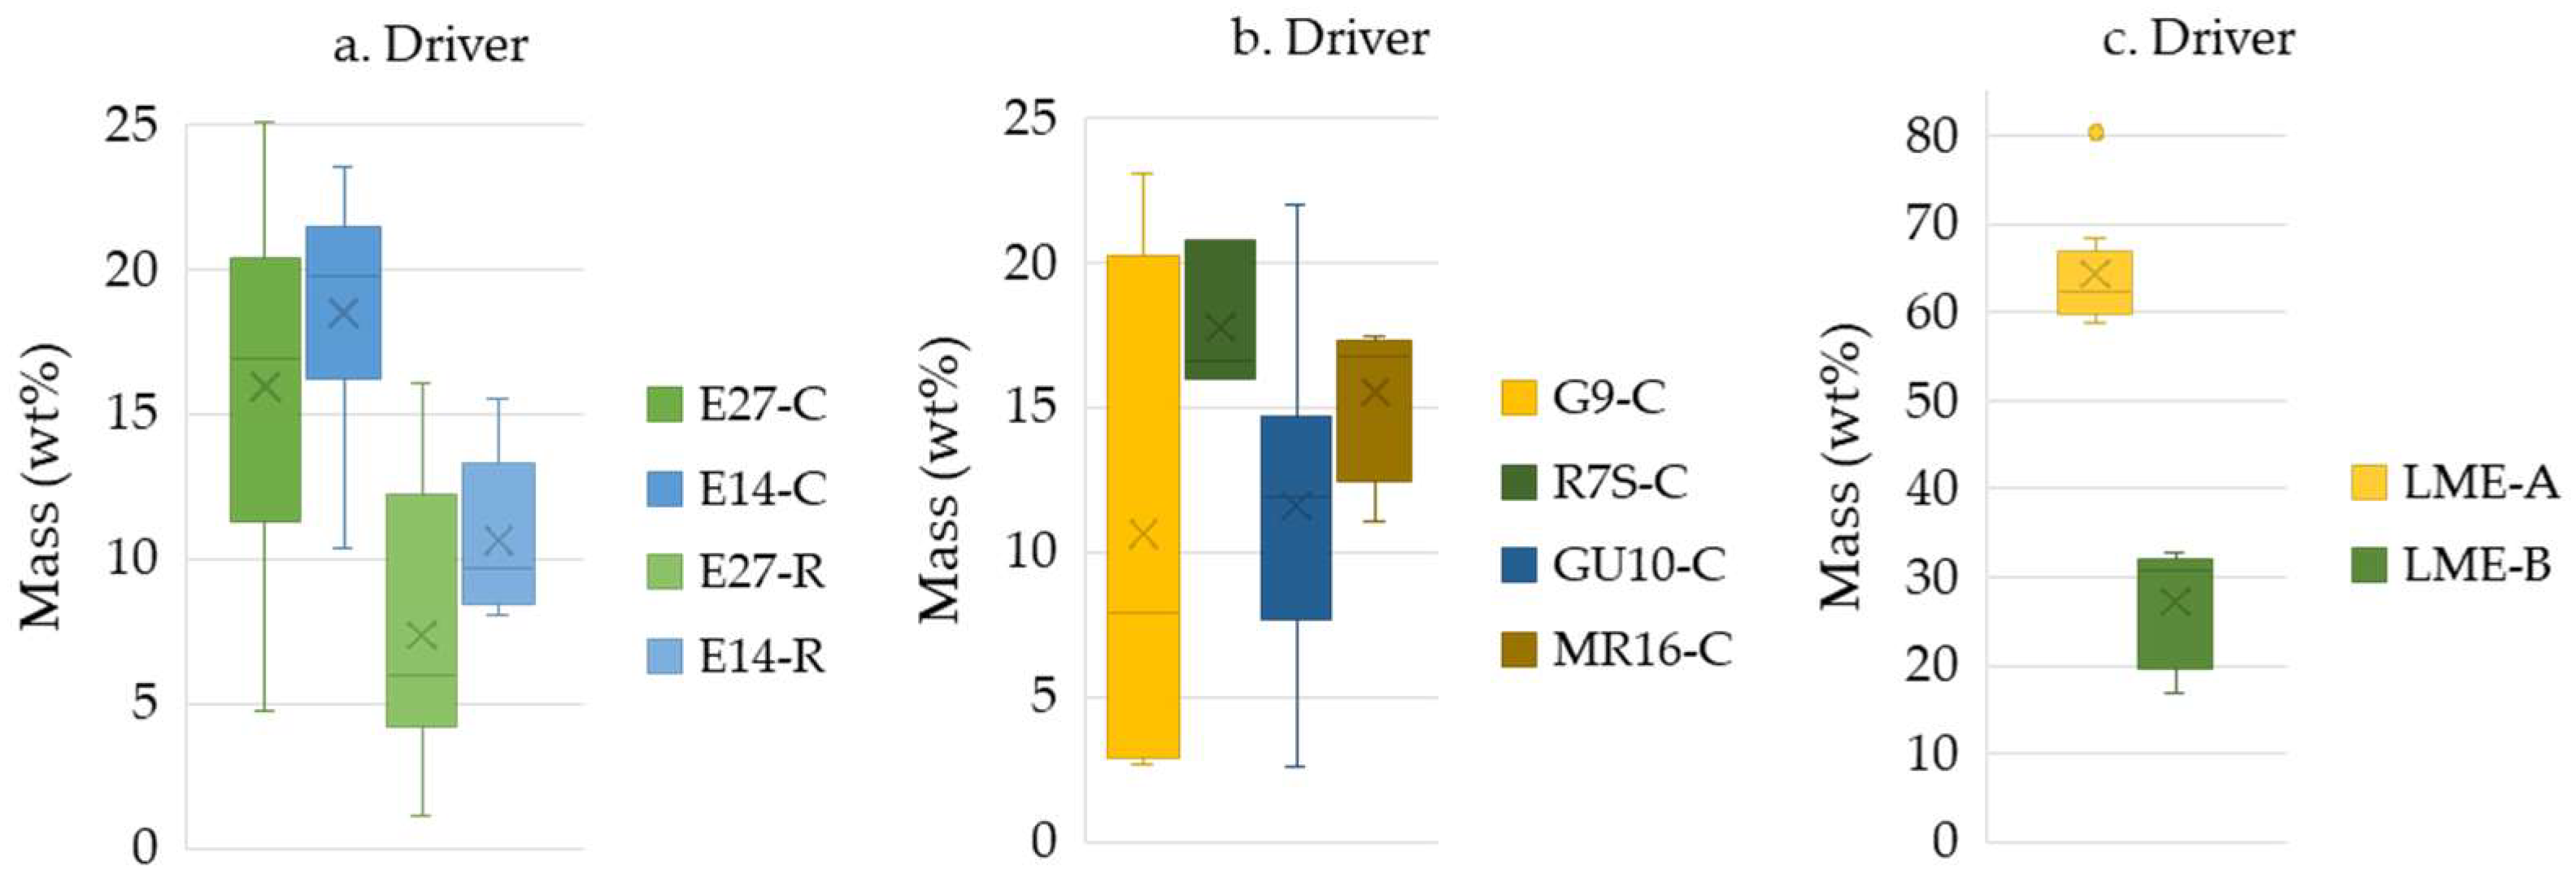
As shown in Figure 8, the mass of LE varies significantly depending on its type and technology. Specifically, Figure 8a illustrates the variation in mass of Edison-type lamps, highlighting the significant difference in mass depending on the LED technology used. Figure 8b illustrates the variation in mass among other lamps with the same LED technology, which also varies significantly depending on the lamp’s type and specifications. Figure 8c illustrates the mass difference between LME-A and LME-B, highlighting the significant variation in mass depending on the type of equipment.

3.3. Individual Structures of LE

During the dismantling of the equipment, three categories of fractions were created. The first category, or ‘basic’, includes structures and components that are separated based on their raw material, such as metal, plastic, glass, and ceramic. The second category, or ‘occasional’, corresponds to other materials (OMs), such as sealant, welding silicone, and driver encapsulation material. The third category, or ‘special’, comprises special components, such as the LED module of non-retro-style lamps, the filament LED of retro-style lamps, and the driver commonly found in all types of lighting equipment examined in this study.
The variation in the percentage of materials and structures was included in the first and third fraction categories and, in cases where these were part of the equipment structure, was as follows: Metals: (2.34–55.77) wt%, plastics (1.59–74.09) wt%, glass (50.14–97.33) wt%, ceramics (15.82–64.14) wt%, LED module (1.23–18.13) wt%, filament LEDs (0.81–9.96) wt%, and driver (1.16–80.39) wt%. It should be clarified that the basic metals of the equipment’s special components (Figure 9) are expected to constitute a secondary basic metal fraction during their specialised recycling.

3.4. Driver

The design of the driver (Figure A3) and its percentage of the equipment’s mass (Figure 10) differed significantly depending on the type and specifications of the equipment. For lamps, using SM-LEDs, the percentage ranged from 2.58 to 25.09 wt%, with the lowest percentage found in the GU10-C type and the highest in the E27-C type. For lamps using filament LEDs, the percentage ranged from 1.16 to 16.07 wt%, with the minimum and maximum percentages found in the same lamp type (E27-R). The driver in LME-A showed an incomparably high percentage (58.74–80.39) wt% compared to all other lighting equipment examined in this study. Finally, in the case of LME-B, the driver’s percentage ranged from 16.83 to 32.69 wt%.
The noticeable difference in the percentage of the driver’s mass about the lamp’s mass, for lamps with the same base type (E27 or E14) but different LED technology (SMD or filament), is due to differences in lamp construction and, in particular, the position of the driver within each lamp. In lamps with SM-LEDs, the driver is located inside the lamp body; in lamps with filament LEDs, it is located inside the lamp base (Figure 11).
The literature review identified 11 studies concerning the percentage of driver mass in lamps containing SM-LEDs. No studies were identified for lamps containing filament LEDs or for LME cases. The data from the literature review, along with the corresponding results of the present study—particularly, for cases where this was feasible based on sample composition—are presented in Table 1 for quantitative comparison. It is noted that Dzombak et al. (2017) present data on encapsulated driver lamps [86].
In this study, as well as in the few cases of encapsulated drivers, such as those presented in Figure A4, the mass of the encapsulation material ranged from 23.704 to 51.495 g, with an average of 38.499 g. This corresponds to the percentage of encapsulated drivers, which ranges from 64.29 to 81.08 wt%, with an average of 71.26 wt%. It is worth noting that, in some cases, the presence of the encapsulation material posed a significant challenge to driver release (Figure A5(a1–a3)), whereas, in others, the driver was released without difficulty (Figure A5(b1–b4)) due to the type of encapsulation material.

3.4.1. Dismantling of Drivers

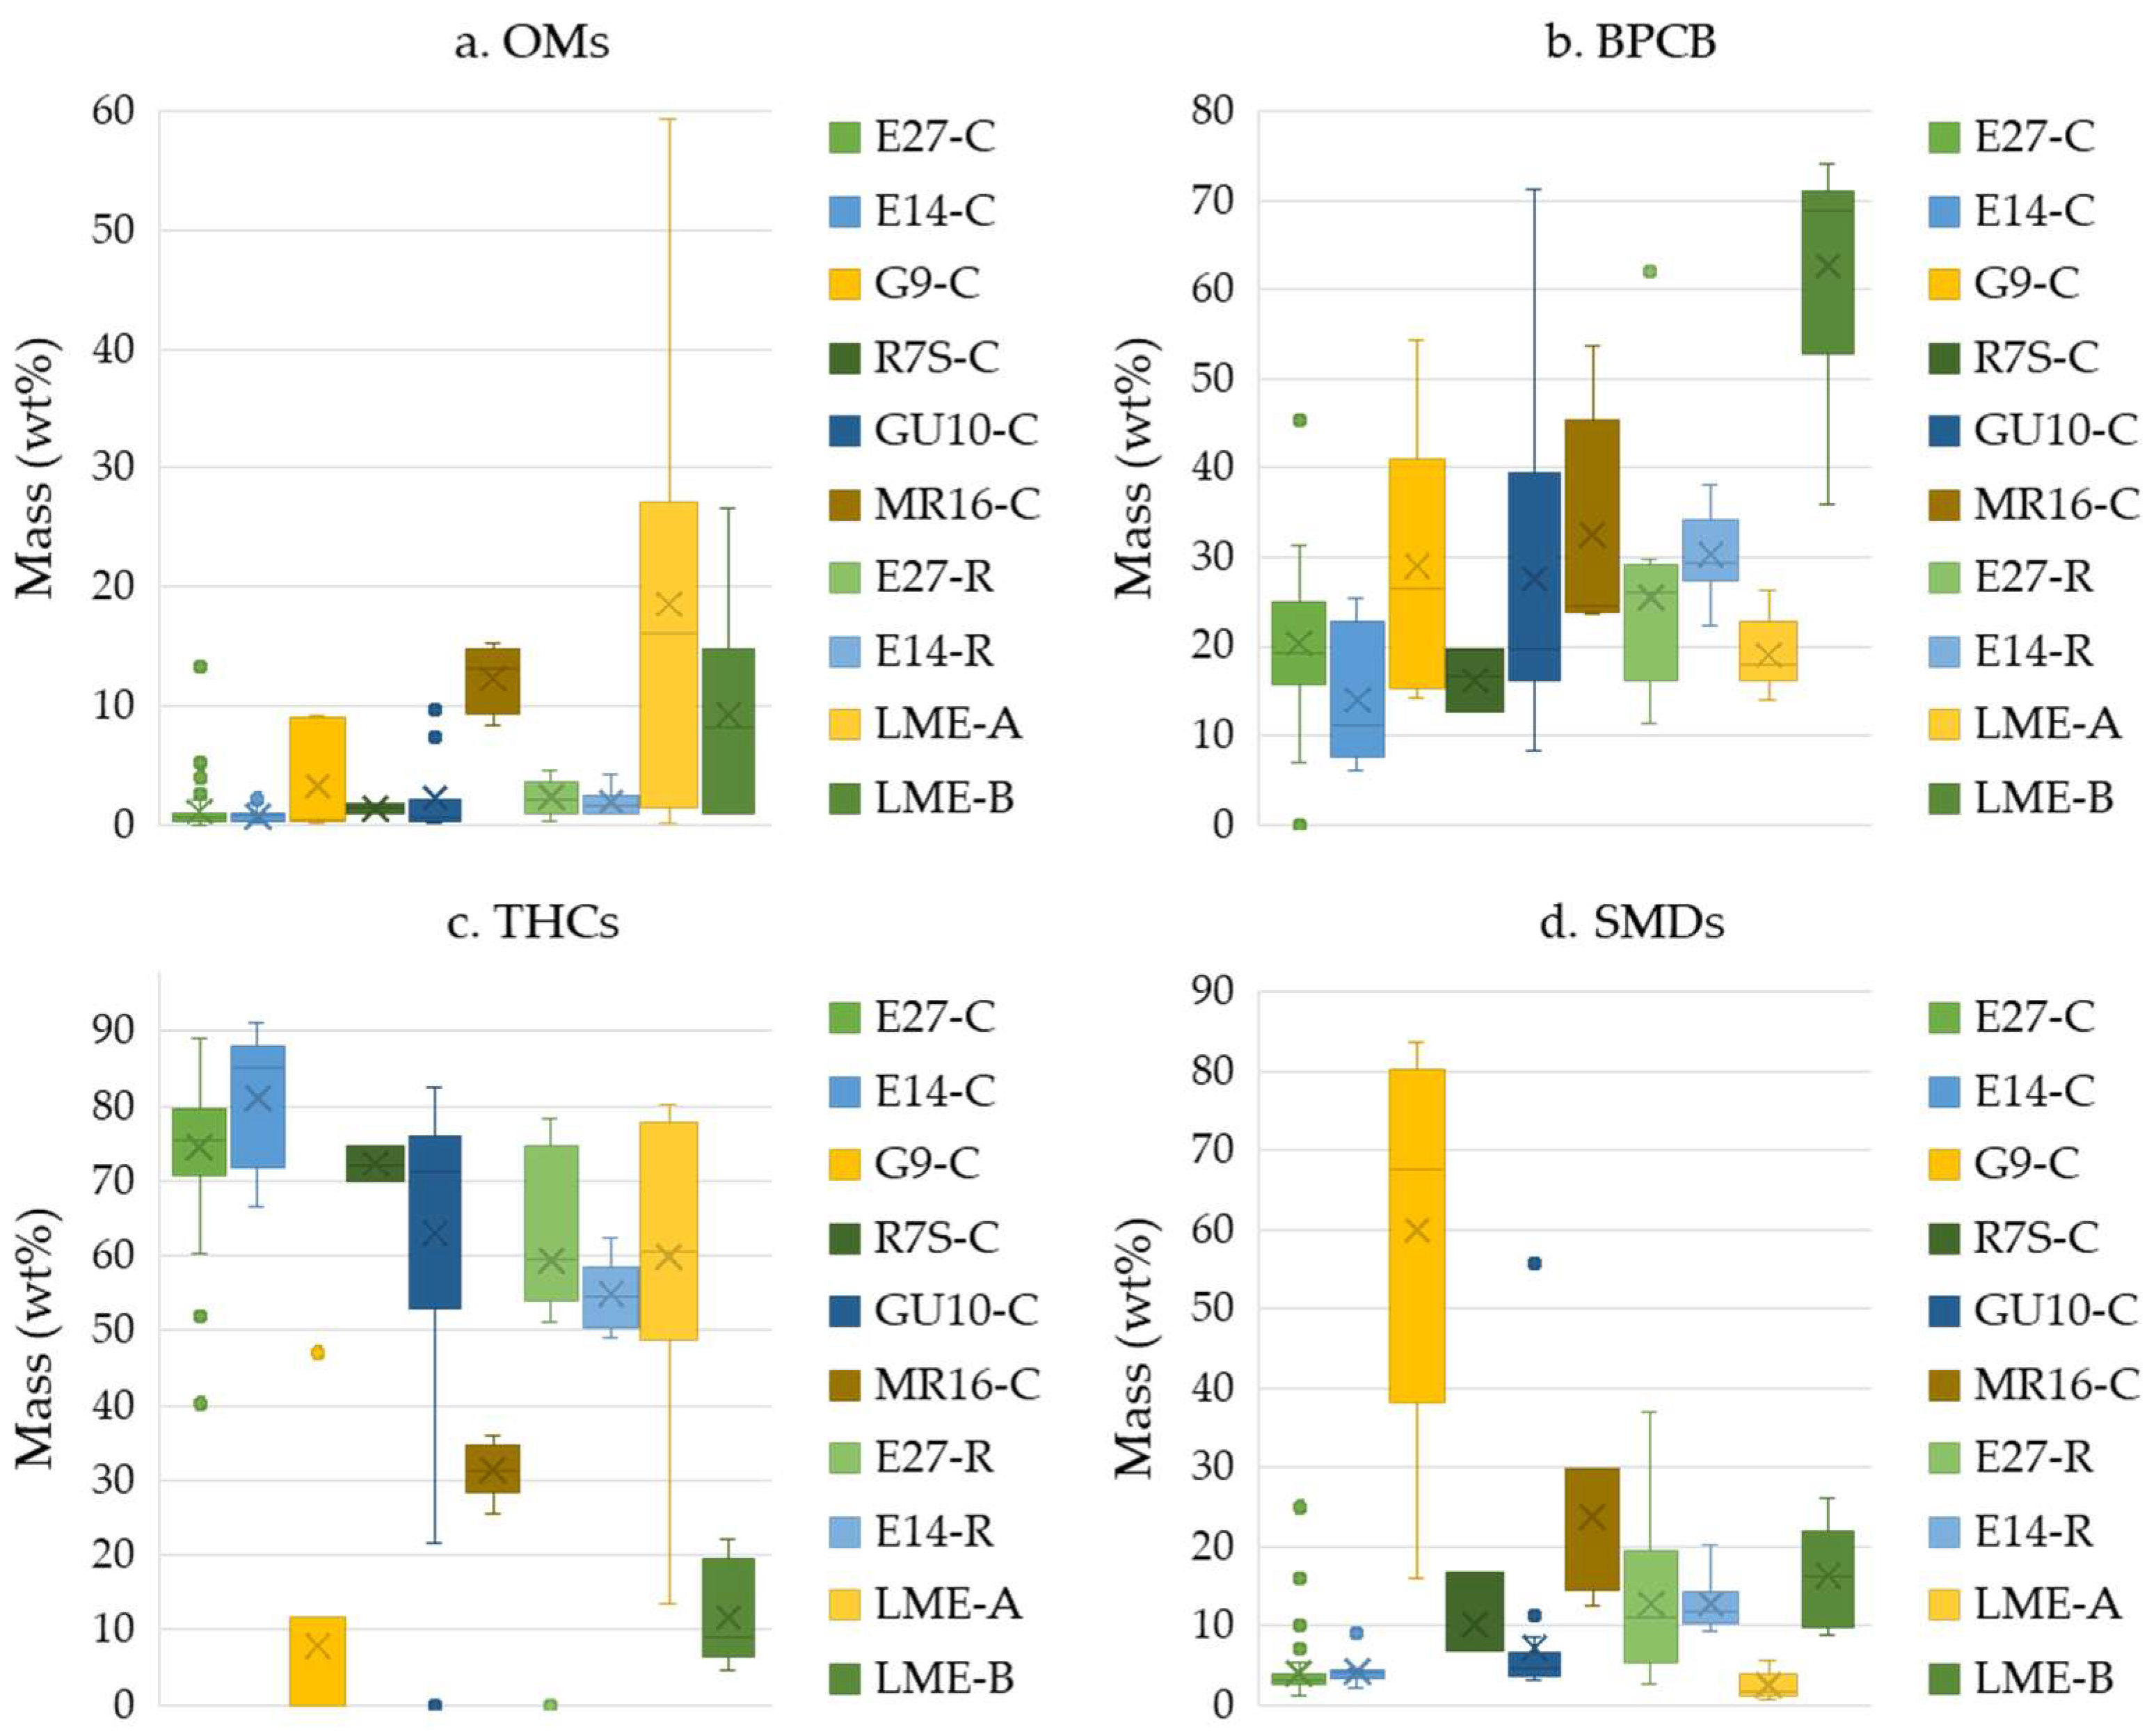
After manually dismantling the drivers, separating their components resulted in four fractions: other materials (OMs), a bare printed circuit board (BPCB), through-hole components (THCs), and surface-mount devices (SMDs). Figure 12, for example, shows the results of dismantling a driver from a GU10-C lamp, which contained no OMs.
In the case of lamps, OMs consisted mainly of heat-shrinkable materials (HSMs). In contrast, OMs in LME consisted of various components, including heat sinks, electromagnetic interference (EMI) shielding, screws, electrical contacts, and various plastic structures. As shown in Figure 13a, the percentage of OMs varied significantly depending on the equipment, ranging from 0.01 to 59.45 wt%. For lamps in particular, the range was 0.01–15.23 wt%, with an average of 1.88 wt%. For LMEs, the range was 0.14–59.45 wt%, with an average of 14.81 wt%.
As shown in Figure 13b, the percentage of BPCB varied significantly depending on the equipment used, ranging from 0.00 to 74.02 wt%. This finding is consistent with those of Işıldar et al. (2018) [3]. It should be noted that this range also includes lamps with SM-LEDs, where the LED module and driver are integrated into a single structure. For lamps, the BPCB percentage ranged from 0.00 to 71.18 wt%, with an average of 22.24 wt%. This is comparable to Mir and Dhawan’s (2022) finding that the average BPCB percentage in the total mass of the driver is 23 wt% [93]. For LME, the BPCB percentage ranged from 13.89 to 74.02 wt%, with an average of 36.51%, which is higher than that found in the aforementioned study.
As shown in Figure 13c, the percentage of THCs varied significantly depending on the equipment, ranging between 0.00 and 91.13 wt%. In the case of lamps, the range was 0.01–91.13 wt%, with an average of 66.86 wt%. For LME, the range was 4.49–80.15 wt%, with an average of 40.65 wt%. THCs consist of various electrical and electronic components. The presence of each component in the equipment drivers varied significantly depending on the equipment and is presented in Table A1.
As shown in Figure 13d, the percentage of SMDs varied significantly depending on the equipment, ranging from 0.76 to 83.68 wt%. In particular, the percentage of SMDs in lamps ranged from 1.12 to 83.68 wt%, with an average of 9.02 wt%. In the case of LME, the percentage of SMDs ranged from 0.76 to 26.04 wt%, with an average of 8.03 wt%. The SMDs consisted of various electrical and electronic components. The presence of each component in the equipment drivers varied significantly depending on the equipment and is presented in Table A2.

3.4.2. Integrated Circuits (ICs)

Through-Hole Integrated Circuits (TH-ICs)
Through-hole integrated circuits (TH-ICs) were only present in LME-A (Figure 14a). Their average mass participation was relative to the following: (a) the equipment ranged from 0.00 to 0.62 wt%, with an average of 0.20 wt%; (b) the driver ranged from 0.00 to 1.03 wt%, with an average of 0.33 wt%; and (c) the THCs ranged from 0.00 to 7.59 wt%, with an average of 1.19 wt%.
Surface Mount Integrated Circuits (SM-ICs)
In contrast to TH-ICs, SM-ICs were present in all types of equipment (Figure 14b,c). Depending on the type of lighting equipment, their share of the equipment’s mass ranged from 0.04 to 1.90 wt%. The average percentage of the equipment’s mass for lamps was 0.09 wt%, ranging from 0.04 to 0.17 wt%. For LME, the average percentage of the equipment’s mass was 1.22 wt%, ranging from 0.55 to 1.90 wt%. In particular, and in descending order, their average percentage of the equipment mass was as follows: LME-B (1.90 wt%), LME-A (0.55 wt%), E14-R and MR16-C (0.16 wt%), G9-C (0.10 wt%), E27-C (0.09 wt%), GU10-C and R7S-C (0.07 wt%), E27-R (0.06 wt%), and E14-C (0.04 wt%).
Depending on the type of lighting equipment, the average proportion of SM-ICs in the driver mass ranged from 0.23 to 6.7 wt%. For lamps, the range was (0.23–1.62) wt%, with an average of 0.79 wt%. This is comparable to the percentage reported by Mir and Dhawan (2023) [75] for drivers in general (less than 1 wt%) and to the percentage reported by Li et al. (2019) [76] for drivers in general (more than 1 wt%). For LME, the range was (0.87–6.70) wt%, with an average of 3.79 wt%. This is significantly higher than the corresponding percentages in the aforementioned studies. In descending order of equipment, the average percentage of SM-ICs in the driver mass was as follows: LME-B (6.70 wt%), E14-R (1.62 wt%), MR16-C (0.96 wt%), G9-C (0.94 wt%), E27-R (0.90 wt%), LME-A (0.87 wt%), E27-C and GU10-C (0.63 wt%), R7S-C (0.38 wt%), and E14-C (0.23 wt%).

3.5. Characterisation of ICs from LE via ICP-OES Analysis

ICP-OES analysis of the waste-ICs in this study detected Ag, Au, Pd, and Pt. The presence of these metals, either individually or in combination, in waste-ICs is supported by the following studies: Delfini et al. (2011) [49]; Lee et al. (2011) [74]; Jung et al. (2017) [50]; Liu et al. (2018) [55]; Li et al. (2019) [76]; Monneron-Enaud et al. (2020) [39]; Panda et al. (2021) [53]; and Liu Xia et al. (2024) [15]. Additionally, the following studies report on the potential use of the aforementioned precious metals in ICs and microelectronic technology in general. Panda et al. (2020b) report the presence of gold in ICs [94]. Mir and Dhawan (2022) report the presence of Ag and Au in ICs [93]. Silva et al. (2021) report that Ag, Au, and Pd are used in IC manufacturing processes as contact or plating materials [36]. An et al. (2023) report the use of platinum (Pt) as a percentage of the wire alloy used in the internal conductive connections of EECs [16]. Marwede et al. (2012) report the potential presence of Ag in the adhesive used for conductive bonding and mechanical support of EECs on PCBs [95].
The presence and concentration of each of the aforementioned PMs in the waste ICs of this study varied significantly depending on the type and origin of the samples. Table 2 presents the results of precious metal concentrations in the waste ICs of this study, along with the relevant literature results for comparison. These differences may arise from the origin of the ICs, their specifications, the composition of the adhesive, and the mass of adhesive residue on the pins of the examined ICs. Table 3, in particular, shows the concentrations of precious metals detected in the metal fraction (MF) of ICs from computers examined in the study by Panda et al. (2021) [53].

3.5.1. Presence per Element

Silver (Ag)
The detection of silver (Ag), in all cases in the present study, is consistent with the findings of two previous studies. The first study, Lee et al. (2011), examined a large number of different integrated circuits and found continuous Ag presence [74]. The second study, Charles et al. (2020), examined ICs from ‘large’ WEEE and also found Ag in all cases [51].
According to Mir and Dhawan (2022), ICs contain Ag [93], while Silva et al. (2021) state that Ag is used in IC manufacturing processes, specifically as a contact or plating material [36]. Based on the literature, the presence of Ag in waste ICs can potentially be found in the following locations: (a) in the wire used for the electrical connection between the die contacts (pads) and the pins of the IC package, in both “multi-layer” [13] and alloy [16] wires; (b) in the silver paste used between the die and its substrate [55]; and (c) in the solder residue [95], as Mori de Oliveira et al. (2022) state, the adhesive used after the RoHS directive (2006) consists mainly of Ag, Sn, and Cu [45].
In this study, the concentration of Ag in waste ICs ranged from 652 to 3876 mg/kg, with an average value of 1897 mg/kg. The lowest concentration was found in TH-ICs from LME, and the highest in SM-ICs from LED lamps. The Ag concentration was found to be as follows: (a) significantly lower than the Ag concentration (7480 mg/kg) in the naturally enriched sample (metal fraction of ICs) in the study by Panda et al. (2021) [53]; (b) comparable to the values reported in the literature review, which range between 35 and 7200 mg/kg with an average of 2321 mg/kg; and (c) incomparably higher than the concentration in the Earth’s crust (0.075 mg/kg) [96]. It is worth noting that the potential contribution of adhesive residue to the concentration of Ag in waste ICs also applies to TH-ICs soldered directly to PCB holes. However, there is no such contribution when TH-ICs are placed in the circuit via their special bases.
Gold (Au)
According to Mir and Dhawan (2022), ICs contain gold (Au) [93], while Sheel and Pant (2018) state that the use of gold in ICs contributes to their reliability [54]. Silva et al. (2021) state that Au is used in IC production processes as a contact or plating material [36], while, according to Alim et al. (2021) and Sheel & Pant (2018), gold is found in electrical contacts and internal conductive interconnections between the die pads and the pins of the IC package [13,54].
The detection of gold, in all cases in the present study, is consistent with the studies by Delfini et al. (2011) [49], who examined ICs from personal computers, monitors, and TVs, and by Lee et al. (2011) [74] and Charles et al. (2020) [51]. Gold was quantified only in LME cases because its concentration in the IC solution (0.056 mg/L) from the lamps was lower than the limit of quantification (0.1 mg/L).
The concentration of gold in ICs from the LME ranged from 194 to 993 mg/kg, with an average value of 594 mg/kg. The highest concentration was found in SM-ICs. The gold concentration in the ICs in the present study is as follows: (a) significantly lower than the gold concentration (5880 mg/kg) in the naturally enriched IC sample in the Panda et al. (2021) study [53]; (b) slightly lower than, or comparable to, the gold concentration in ICs based on the literature data, which range between 101 and 3386 mg/kg with an average of 959 mg/kg; and (c) incomparably higher than the gold concentration in the Earth’s crust (0.0032 mg/kg) [96].
Palladium (Pd)
The detection of palladium (Pd), in all cases of integrated circuits (ICs) examined in the present study, agrees with studies by Delfini et al. (2011) [49] and Monneron-Enaud et al. (2020) [39]. Additionally, Pd was reported to be present in ICs by Vermeşan et al. (2020) [52], while Charles et al. (2020) [51] reported its occasional presence in the ICs they examined.
Based on the literature, the presence of palladium in ICs has been detected in the wires [13,16,97], as it is used for conductive connections between the contacts of the die and the pins of integrated circuit packages, as well as in the coating of the pins [98,99].
The concentration of palladium in the TH-ICs solution (0.074 mg/L) was lower than the quantification limit (0.1 mg/L). Its concentration in SM-ICs ranged from 49 to 74 mg/kg, with an average value of 62 mg/kg, and the highest value was found in SM-ICs collected from lamps. The Pd concentration in SM-ICs in the present study is characterised as follows: (a) lower than the Pd concentration in small ICs from medical equipment (339 mg/kg) in the study by Monneron-Enaud et al. (2020) [39]; (b) comparable to the Pd concentration (110 mg/kg) in the naturally enriched sample by Panda et al. (2021) [53]; (c) higher than the Pd concentration in big ICs (1 mg/kg) in the Monneron-Enaud et al. (2020) study [39]; (d) higher than the Pd concentration (12–18 mg/kg) in ICs examined by Delfini et al. (2011) [49]; and, finally, significantly higher than the Pd concentration in the Earth’s crust (0.0082 mg/kg) [96].
Platinum (Pt)
Pt was only detected in lamp SM-ICs, but it was not quantified as its concentration in the SM-ICs solution (0.007 mg/L) did not exceed the quantification limit (0.1 mg/L). The presence of platinum (Pt) in ICs is reported by Vermeşan et al. (2020) [52], while Panda et al. (2021) report a concentration of Pt equal to 4 mg/kg in the naturally enriched sample of their study [53]. For the sake of this study’s completeness, platinum is found in microelectronic technology either as platinum foil [100] or as a coating for electrical contacts [101].
We believe that the combination of the commercial value of Pt (EUR 43.15/g) on 18 July 2025 [102], the ever-increasing presence of ICs in EEE due to the widespread use of artificial intelligence [15], and targeted recycling at the component level can create the right conditions for the Granados-Fernández et al. (2021) recommendation for Pt recycling from urban mines [103] to be applied to ICs, despite their negligible Pt content.

3.5.2. Targeted Recycling

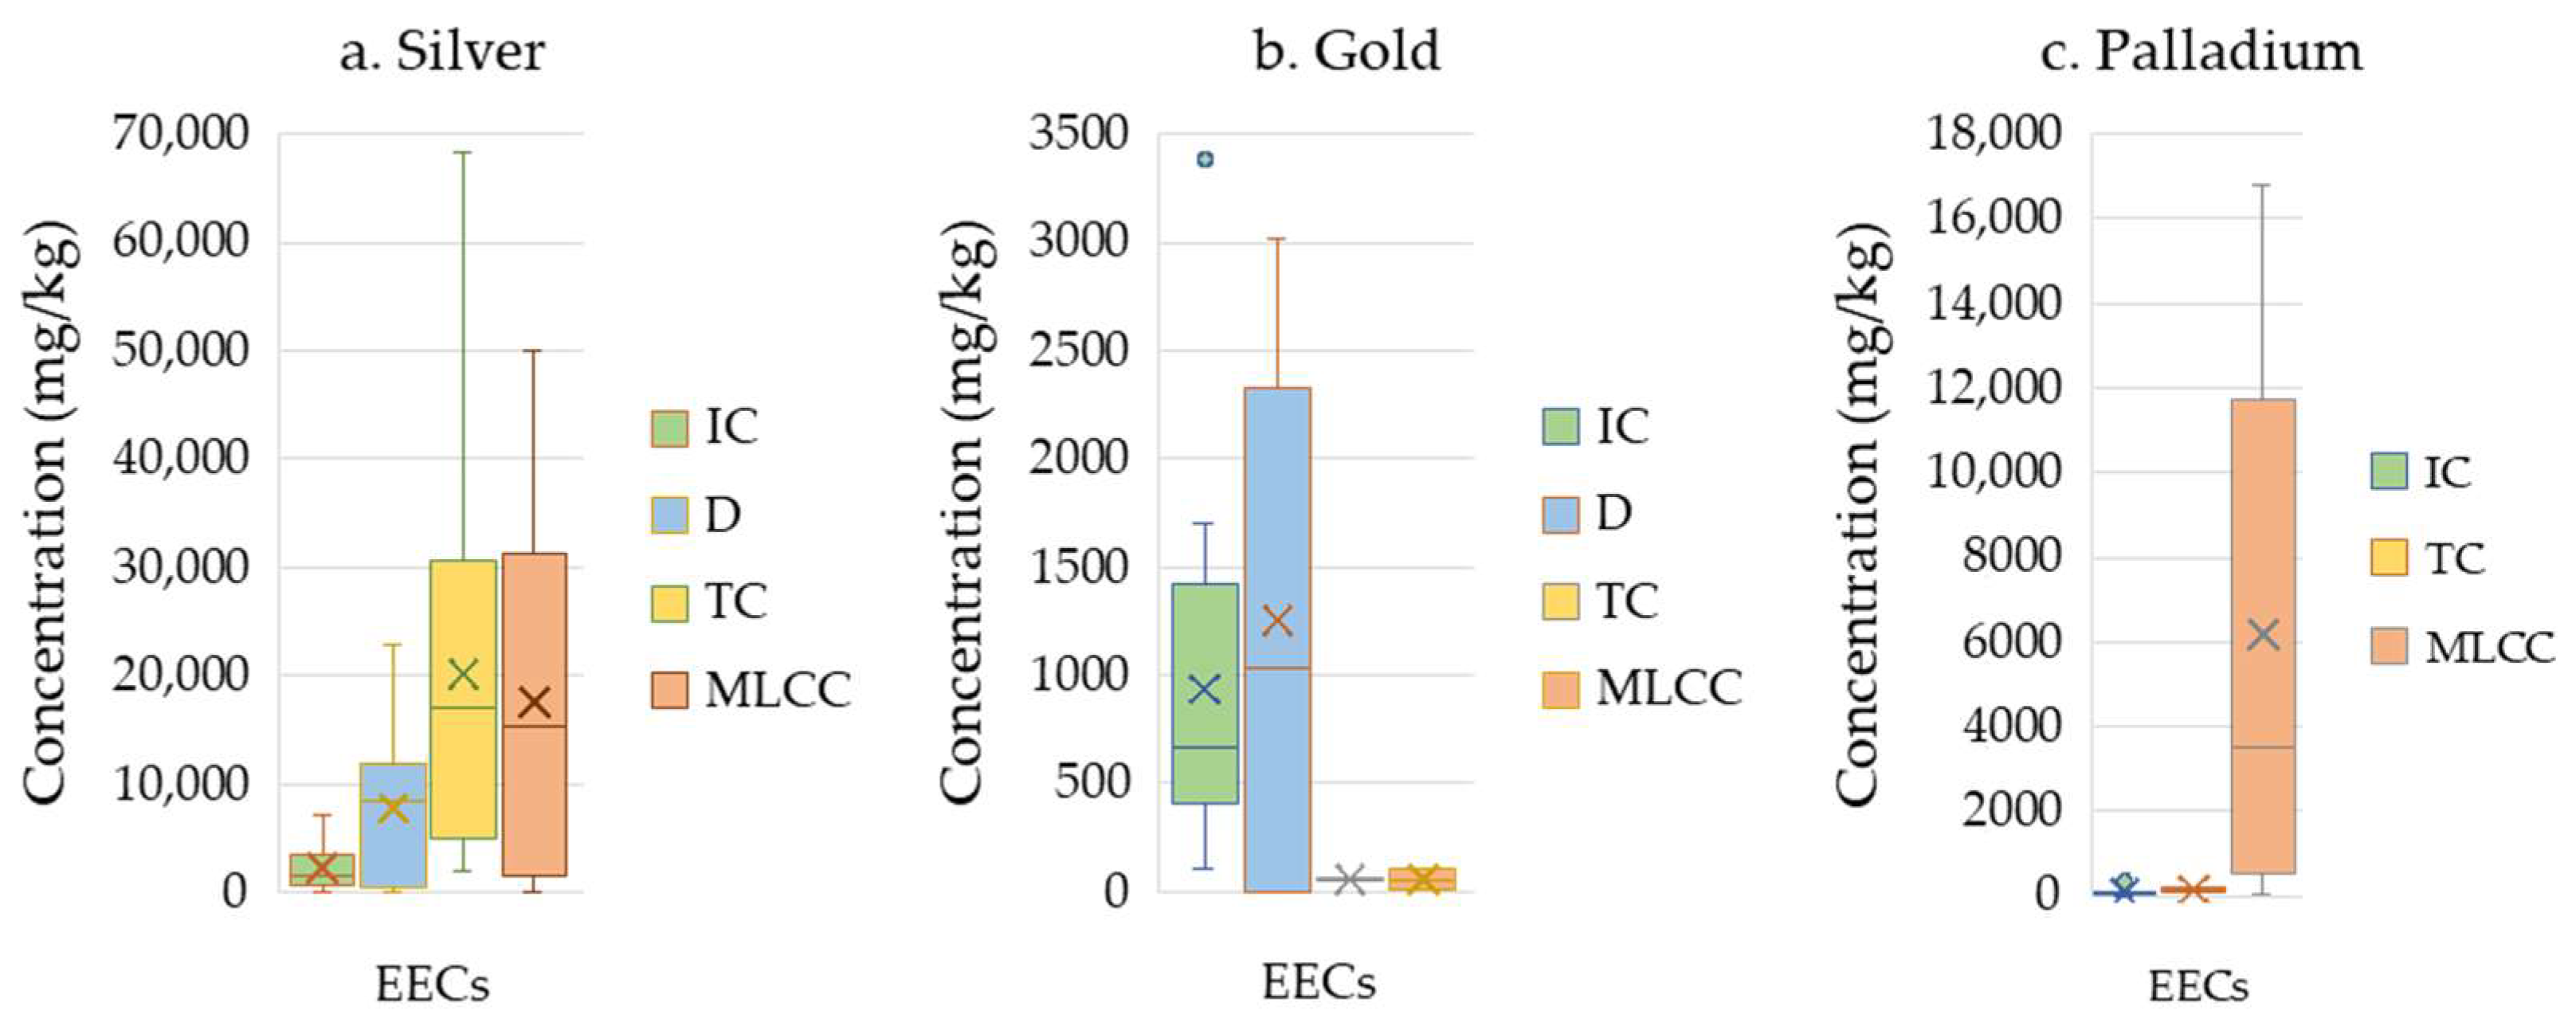
Silver concentration in SM-ICs (3876 mg/kg) from LED lamps is much higher than the Ag concentration in E27-C LED lamp drivers (50 mg/kg) and tubes (140 mg/kg), as reported by Cenci et al. (2020) [81]. The outcome of this comparison supports the idea of targeted recycling at the component level, making the effort to recover Ag from ICs particularly worthwhile. In the context of targeted recycling at the component level, Figure 15a presents the variation in Ag concentration in various EECs based on the results of this study and the aforementioned literature. It highlights the low concentration of Ag in integrated circuits (ICs) (35–7200 mg/kg) with an average value of 2280 mg/kg compared to other EECs such as follows: (a) diodes (D) (0–22,800 mg/kg) with an average value of 7774 mg/kg; (b) tantalum capacitors (TCs) (2000–68,300 mg/kg) with an average value of 20,102 mg/kg; and (c) multi-layer ceramic capacitors (MLCCs) (41–50,100 mg/kg) with an average value of 17,611 mg/kg.
Figure 15b illustrates the variation in gold concentration in ICs (101–3386 mg/kg) with an average value of 933 mg/kg obtained from this study and the literature data. This is compared to the gold concentration in other components used in drivers, such as diodes (0–3020 mg/kg) with an average value of 1256 mg/kg, tantalum capacitors—probably TCs with gold plated terminals—(50–60 mg/kg) with an average value of 55 mg/kg, and multi–layer ceramic capacitors with gold plated terminals (10–100 mg/kg) with an average value of 55 mg/kg. Comparing these components reveals that the gold concentration in ICs is significantly lower than in diodes, and incomparably higher than in TCs and MLCCs.
Given that the presence of palladium (Pd) in EEE drivers is associated with the presence of MLCCs [104,105,106], the variation in Pd concentration in integrated circuits (ICs) (1–339 mg/kg) with an average value of 72 mg/kg (combining the results of this study and data from the literature) is incomparably lower than the variation in Pd concentration in TCs—probably wet tantalum capacitors—and MLCCs (Figure 15c). According to the aforementioned literature, the variation in Pd concentration in MLCCs ranges from 21 to 16,808 mg/kg, with an average value of 6190 mg/kg.

3.5.3. The Presence and Stored Value of PMs in ICs

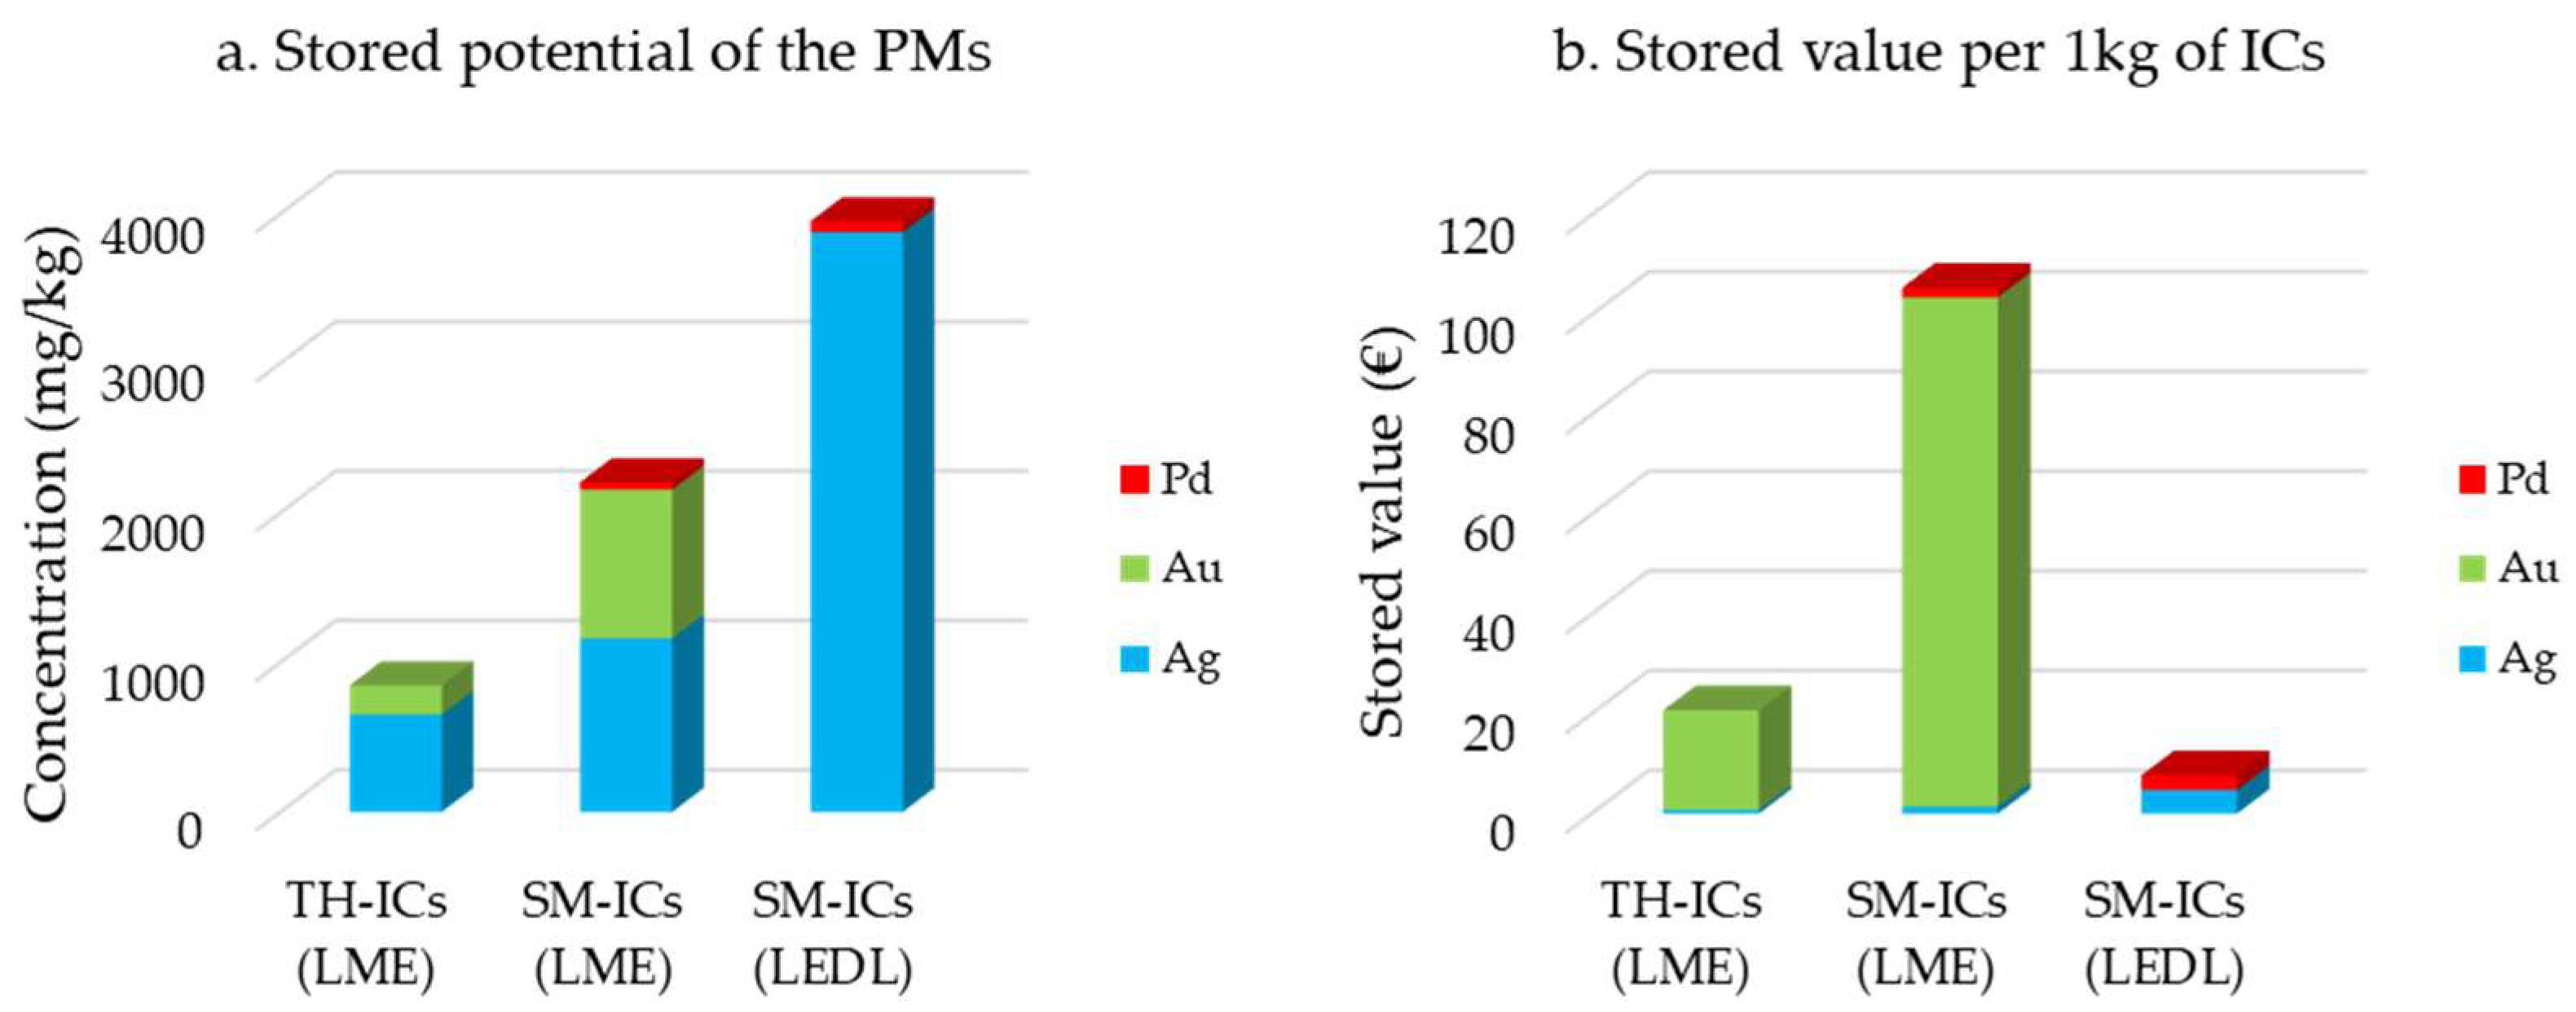
Figure 16a shows the stored potential of PMs (mg/kg) in the ICs examined in this study, highlighting the significant variation depending on the type and origin of the ICs: TH-ICs (846.017 mg/kg), SM-ICs from LME (2203.870 mg/kg), and SM-ICs from LED lamps (3949.608 mg/kg). The percentage of each element in the stored potential of the PMs varied significantly depending on the type and origin of the ICs examined. Specifically, the following: (a) in the case of TH-ICs: Ag (77.09 wt%) and Au (22.91 wt%); (b) SM-ICs from the LME: Ag (52.73 wt%), Au (45.07 wt%) and Pd (2.21 wt%); and (c) SM-ICs from LED lamps: Ag (98.13 wt%) and Pd (1.87 wt%).
Despite the apparent predominance of precious metals in lamp ICs, the economic value stored in waste ICs in each application case was essentially determined by the presence of gold (Figure 16b). This was due to its high price (EUR 102.77/g on 18 July 2025 (“UMICORE” [102])), compared to silver (EUR 1.23/g on 18 July 2025 (“UMICORE”)) and palladium (EUR 39.65/g on 18 July 2025 (“UMICORE”)), as well as the low proportion of palladium.
The stored economic value in euros per 1 kg of ICs highlights the superiority of SM-ICs from the LME (EUR 105.43/kg), followed by TH-ICs (EUR 20.72/kg) and SM-ICs from LED lamps (EUR 7.69/kg). The percentage contribution of each metal to the stored economic value in each application case was as follows: (a) TH-ICs (LME): Ag (3.87%) and Au (96.13%); (b) SM-ICs (LME): Ag (1.36%), Au (96.82%), and Pd (1.83%); and c) SM-ICs (LED lamps): Ag (61.99%) and Pd (38%).
Considering that the degree of gold recovery from ICs ranges between 90 and 100% [75], the percentage of gold in stored economic value in ICs presents an increase in approximately 16% for the percentage of gold in the recovered economic value from equipment drivers reported by D. Xia et al. (2024) [38]. This increase could be explained by targeted recycling at the component level as opposed to targeted recycling at the individual structure level of WEEE.

3.5.4. The Stored Potential of PMs in EEE

Taking into account the following parameters, (a) the concentrations (mg/kg) of Ag, Au and Pd in the integrated circuits of this study, (b) the percentage contribution (wt%) of each lamp in the random sample, and (c) the average percentage contribution (wt%) of ICs in lighting equipment, the contribution of each type of lighting equipment (LED lamps, LME-A, and LME-B) to the stored potential of precious metals in each application case is calculated (Figure 17). Figure 17a illustrates the contribution of each lamp type to the stored potential of Ag and Pd. It highlights the clear superiority of E27-C lamps, which account for 59.07 wt% of the total, followed by GU10-C lamps, which account for 18.98 wt%. The contribution of the other lamp types was low, ranging from 2.14 to 5.70 wt%. Figure 17b illustrates the contribution of each type of integrated circuit (TH-ICs and SM-ICs) to the stored potential of precious metals (Ag, Au, and Pd) in LME-A. It highlights the clear superiority of SM-ICs in Ag and Au due to their higher presence (wt%) in LME-A and higher concentrations (mg/kg) in integrated circuits. Notably, Au is present in significant quantities (5.855 g), in contrast to its complete absence in lamps. Finally, Figure 17c illustrates the tripling of the stored potential of PMs in LME-B compared to LME-A. This significant increase is due to the higher percentage of SM-ICs in LME-B, which creates a substantial stored value in the ICs of the equipment solely due to the presence of gold (Au), equivalent to EUR 1939 per tonne of equipment.

4. Conclusions

Given that the number and type of ICs in EEE drivers, as well as the presence of precious metals in their structure, depend on the type of equipment, its specifications, and its date of manufacture, this study investigated the concentrations of precious metals (Ag, Au, Pd, and Pt) in waste ICs removed from drivers of equipment that contributes to energy saving and maintaining comfortable conditions in buildings, such as LED lamps and LME.
The integrated circuits were removed from the lighting equipment and separated based on their origin (lamps, LME-A, or LME-B) and the type of IC installation in the equipment drivers (through-hole or surface-mount). The presence of ICs in the equipment varied significantly depending on the equipment’s subcategory. In particular, the presence of TH-ICs ranged from 0.00 to 0.62 wt%, while the presence of SM-ICs ranged from 0.04 to 1.90 wt%.
The concentrations of precious metals in integrated circuits varied significantly depending on the type and origin of the samples. In particular, the concentrations of Ag, Au, Pd, and Pt were found to be (652–3876) mg/kg, (0–993) mg/kg, (0–74) mg/kg, and not quantified (due to concentrations below the quantification limit), respectively. These concentrations create significant stored value in the examined ICs, ranging from EUR 7.69 to EUR 105.43 per kilogram (calculation date: 16 August 2025). The contribution of each precious metal to this value is as follows: Ag: 1.36–61.99%, Au: 96.15–96.82%, and Pd: 1.83–38.00%.
The average stored potential of PMs in a 1 t assumed mass of lighting equipment, calculated as a function of the aforementioned PM concentrations, ranged from 3.164 to 22.078 g/t for Ag, from 0 to 18,867 g/t for Au, and from 0.059 to 0.931 g/t for Pd.
Given the following: (a) approximately 40% of the economic value recovered from WEEE is due to the presence of precious metals in them; (b) the complexity of driver structures has prevented the creation of a standardised recycling process for them as single structures; (c) approximately 80% of the economic value recovered from drivers is due to the presence of gold in their structures; (d) Gold was only detected in LME ICs; (e) the gold concentration varies significantly between TH-ICs and SM-ICs collected by the LME; and (f) the percentage of SM-ICs in the driver mass varies significantly depending on the type of equipment and how it is separated, with a significantly higher presence in LME-B; we, therefore, consider these data to provide valuable information for the recycling sector, strongly supporting targeted recycling.
The findings of this study provide an incentive to eliminate the phenomenon of WEEE remaining in buildings and to transfer it to urban mines. Unlike natural deposits in the Earth’s crust, urban mines offer an extensive and concentrated number of chemical elements in a limited space. Furthermore, unlike natural mining, which has a high environmental impact and irreversibly depletes natural reserves, recovering high-value metals from urban mines protects the environment and natural resources and reduces the cost of recovering low-value critical raw materials from WEEE.
In addition, the results of this study support the need for the separation and dismantling of WEEE during the pre-treatment phase, as well as targeted recycling at the component level. This will further contribute to the recovery of specific metals from waste electrical and electronic components.

Author Contributions

Conceptualization, K.M.S. and P.S.; methodology, K.M.S., D.F. and V.N.S.; validation, K.A.L., V.N.S. and D.F.; formal analysis, K.M.S.; investigation, K.M.S.; resources, D.F. and V.N.S.; data curation, K.M.S. writing—original draft preparation, K.M.S. writing—review and editing, P.S., K.A.L., D.F. and V.N.S.; visualisation, K.M.S.; supervision, P.S. and V.N.S.; project administration, P.S. All authors have read and agreed to the published version of the manuscript.

Funding

This research received no external funding, and the APC was funded by the Special Account for Research of ASPETE through the funding programme “Strengthening ASPETE’s research”.

Data Availability Statement

Data are contained within the article: The original contributions presented in this study are included in the article. Further inquiries can be directed to the corresponding author.

Acknowledgments

Special thanks go to the following: 1. The recycling company “AEGEAN RECYCLINGFOUNDRIES S.A.” for supplying LED lamps; Nikolaos Spanidis, ABB Greece, and Evangelos Vasilopoulos, SIEMENS Greece, for their contribution to the supply of LME materials; 2. Ioanna Kyriopoulou from the Laboratory of Materials and Environmental Chemistry P.P.C. S.A. for assistance with the use of equipment and useful discussions; 3. Ioannou-Sougleridis Vassilios, Nikolaos Xirokostas, Olga Chalkiadaki, and Vassilis Orfanos, for useful discussions. Authors K. Sideris, K. Liogas, D. Fragkoulis, V. Stathopoulos, and P. Sinioros acknowledge the financial support for the dissemination of this work from the Special Account for Research of ASPETE through the funding programme “Strengthening ASPETE’s research”.

Conflicts of Interest

The authors declare that they have no known competing financial interest or personal relationships that could have influenced the work reported in this study.

Abbreviations

The following abbreviations are used in this manuscript:
AASAtomic absorption spectrometry
ADTAdditional technical details
BPCBsBare printed circuit boards
BTBase type
CCCorresponding case
DDiodes
DAData adaption
EECsElectrical and electronic components
EEEElectrical and electronic equipment
EIMsElectrical insulation materials
EUEuropean Union
ICsIntegrated circuits
ICP-AESInductively coupled plasma atomic emission spectrometry
ICP-MSInductively coupled plasma mass spectrometry
ICP-OESInductively coupled plasma optical emission spectroscopy
LELighting equipment
LEDLight-emitting diode
LEDLLight-emitting diode lamps
LMELighting management equipment
MCMass comparison
MFMetal fraction
MLCCsMulti-layer ceramic capacitors
n/aNot available
NDNot detected
OMsOther materials
OoQLOut of quantification limit
PCPersonal computer
PCBPrinted circuit board
PMsPrecious metals
PSPresent study
SMSurface mount
SMDSurface mount devices
SM-LEDsSurface mount light-emitting diodes
SM-ICsSurface mount integrated circuits
SOSample origin
TCsTantalum capacitors
THTrough-hole
THCsThrough-hole components
TH-ICsThrough-hole integrated circuits
WEEEWaste electrical and electronic equipment

Appendix A

Figure A1. Experimental flow chart from the collection of lighting equipment to the characterisation of ICs.
Recycling 10 00175 g0a1
Figure A2. Variation in the electrical and photometric characteristics of the tested lamps.
Recycling 10 00175 g0a2
Figure A3. Lighting equipment drivers. Their design varies depending on the application (authors’ images).
Recycling 10 00175 g0a3
Figure A4. Examples of encapsulated drivers found in the examined lighting equipment (authors’ images).
Recycling 10 00175 g0a4
Figure A5. Challenges (a1a3) and non-challenges (b1b4) encountered during the release of the lighting equipment’s encapsulated driver (authors’ images).
Recycling 10 00175 g0a5
Table A1. Presence of through-hole components in the drivers of the lighting equipment examined.
THCE27-CΕ14-CG9-CR7S-CGU10-CMR16-CΕ27-RΕ14-RLME-ALME-B
TF(x)(x) (x)(x) (x) (x)
Coil(x)(x) (x)(x) (x) (x)
AEC(x)(x)(x)(x)(x)(x)(x)(x)(x)(x)
MPFC(x)(x)(x)(x)(x) (x)
CC (x)
TRs (x)
RES(x)(x)(x)(x)(x) (x)(x)(x)
FWBR (x) (x)
RoCs(x)
CONN (x) (x)(x) (x)(x)
Relay (x)
TB (x)
Button (x)(x)
PFC (x)
P-TR (x)
Varistor (x)
Diode (x)
IC (x)
Abbreviations: (TF) transformer, (AEC) aluminium electrolytic capacitor, (MPFC) metallized polyester film capacitor, (CC) ceramic capacitor, (TRs) transistors, (RES) Resistor, (FWBR) full wave bridge rectifier, (RoCs) rest of components, (CONN) connector, (TB) terminal block, (PFC) polypropylene film capacitor, (P-TR) power transistor, (IC) integrated circuit, (x) presence in LE.
Table A2. Presence of surface mount devices in the drivers of the lighting equipment examined.
SMDE27-CΕ14-CG9-CR7S-CGU10-CMR16-CΕ27-RΕ14-RLME-ALME-B
IC(x)(x)(x)(x)(x)(x)(x)(x)(x)(x)
FWBR(x)(x)(x)(x)(x)(x)(x)(x)(x)(x)
Resistor(x)(x)(x)(x)(x)(x)(x)(x)(x)(x)
Diode(x)(x) (x)(x)(x)(x)(x)(x)(x)
TR(x)(x)(x)(x)(x) (x)(x)(x)(x)
Inductor (x) (x) (x)(x)
MLCC(x)(x)(x)(x)(x)(x)(x)(x)(x)(x)
TC (x)(x)
Z-diode (x)(x)
LED (x)(x)
Button (x)(x)
Abbreviations: (IC) integrated circuit, (FWBR) full wave bridge rectifier, (TR) transistors, (MLCC) multi-layers ceramic capacitor, (TC) tantalum capacitor, (Z-diode) Zener diode, and (LED) light emitting diode, (x) presence in LE.

References

  1. Oh, S.T.; Lim, J.H. Natural light adaptive context lighting system that provides a lighting environment tailored to the User’s objectives. Heliyon 2025, 11, e42064. [Google Scholar] [CrossRef]
  2. Lee, S.H.; Oh, S.T.; Lim, J.H. Fade Lighting Control Method for Visual Comfort and Energy Saving. Proc. Eng. Technol. Innov. 2023, 25, 54–62. [Google Scholar] [CrossRef]
  3. Işıldar, A.; Rene, E.R.; van Hullebusch, E.D.; Lens, P.N.L. Electronic waste as a secondary source of critical metals: Management and recovery technologies. Resour. Conserv. Recycl. 2018, 135, 296–312. [Google Scholar] [CrossRef]
  4. Bookhagen, B.; Bastian, D.; Buchholz, P.; Faulstich, M.; Opper, C.; Irrgeher, J.; Prohaska, T.; Koeberl, C. Metallic resources in smartphones. Resour. Policy 2020, 68, 101750. [Google Scholar] [CrossRef]
  5. Diaz, F.; Florez, S.; Friedrich, B. Mass Flow Analysis and Metal Losses by the Degradation Process of Organic-Containing WEEE Scraps. Chem. Ing. Tech. 2015, 87, 1599–1608. [Google Scholar] [CrossRef]
  6. Dias, P.; Palomero, J.; Cenci, M.P.; Scarazzato, T.; Bernardes, A.M. Electronic waste in Brazil: Generation, collection, recycling and the covid pandemic. Clean. Waste Syst. 2022, 3, 100022. [Google Scholar] [CrossRef]
  7. Holgersson, S.; Steenari, B.M.; Björkman, M.; Cullbrand, K. Analysis of the metal content of small-size Waste Electric and Electronic Equipment (WEEE) printed circuit boards—Part 1: Internet routers, mobile phones and smartphones. Resour. Conserv. Recycl. 2018, 133, 300–308. [Google Scholar] [CrossRef]
  8. Nieberl, M.; Hornung, A.; Sajdak, M.; Majewski, A.J.; Ouadi, M. Application and recycling of tantalum from waste electric and electronic equipment—A review. Resour. Conserv. Recycl. 2023, 190, 106866. [Google Scholar] [CrossRef]
  9. Sahan, M.; Kucuker, M.A.; Demirel, B.; Kuchta, K.; Hursthouse, A. Determination of metal content of waste mobile phones and estimation of their recovery potential in Turkey. Int. J. Environ. Res. Public Health 2019, 16, 887. [Google Scholar] [CrossRef]
  10. Liu, W.; Ford, P.; Uvegi, H.; Margarido, F.; Santos, E.; Ferrão, P.; Olivetti, E. Economics of materials in mobile phone preprocessing, focus on non-printed circuit board materials. Waste Manag. 2019, 87, 78–85. [Google Scholar] [CrossRef]
  11. Andooz, A.; Eqbalpour, M.; Kowsari, E.; Ramakrishna, S.; Cheshmeh, Z.A. A comprehensive review on pyrolysis of E-waste and its sustainability. J. Clean. Prod. 2022, 333, 130191. [Google Scholar] [CrossRef]
  12. Cayumil, R.; Khanna, R.; Rajarao, R.; Mukherjee, P.S.; Sahajwalla, V. Concentration of precious metals during their recovery from electronic waste. Waste Manag. 2016, 57, 121–130. [Google Scholar] [CrossRef]
  13. Alim, M.A.; Abdullah, M.Z.; Aziz, M.S.A.; Kamarudin, R. Die attachment, wire bonding, and encapsulation process in LED packaging: A review. Sens. Actuators A Phys. 2021, 329, 112817. [Google Scholar] [CrossRef]
  14. Chen, K.J.; Hung, F.Y.; Chang, C.Y. A study of the sulfidation behavior on palladium-coated copper wire with a flash-gold layer (Pca) after wire bonding. Electronics 2019, 8, 792. [Google Scholar] [CrossRef]
  15. Xia, L.; Liu, Y.; Xu, Z. Simultaneous utilization of copper and non-metals from waste integrated circuits for precious metal melting capture and organics thermal detoxification. J. Hazard. Mater. 2024, 479, 135689. [Google Scholar] [CrossRef] [PubMed]
  16. An, B.; Zhou, H.; Cao, J.; Ming, P.; Persic, J.; Yao, J.; Chang, A. A Review of Silver Wire Bonding Techniques. Micromachines 2023, 14, 2129. [Google Scholar] [CrossRef] [PubMed]
  17. Muß, D.; Koch, R. Bonding wire characterization using non-destructive X-ray imaging. Microelectron. Reliab. 2023, 148, 115177. [Google Scholar] [CrossRef]
  18. Akcil, A.; Erust, C.; Gahan, C.S.; Ozgun, M.; Sahin, M.; Tuncuk, A. Precious metal recovery from waste printed circuit boards using cyanide and non-cyanide lixiviants—A review. Waste Manag. 2015, 45, 258–271. [Google Scholar] [CrossRef]
  19. Sideris, K.M.; Fragoulis, D.; Stathopoulos, V.N.; Sinioros, P. Multi-Layer Ceramic Capacitors in Lighting Equipment: Presence and Characterisation of Rare Earth Elements and Precious Metals. Recycling 2023, 8, 97. [Google Scholar] [CrossRef]
  20. Sideris, K.M.; Katsiris, I.; Fragkoulis, D.; Stathopoulos, V.N.; Sinioros, P. Waste SMD LEDs from End-of-Life Residential LED Lamps: Presence and Characterisation of Rare Earth Elements and Precious Metals as a Function of Correlated Colour Temperature. Recycling 2024, 9, 128. [Google Scholar] [CrossRef]
  21. Oke, E.A.; Potgieter, H. Discarded e-waste/printed circuit boards: A review of their recent methods of disassembly, sorting and environmental implications. J. Mater. Cycles Waste Manag. 2024, 26, 1277–1293. [Google Scholar] [CrossRef]
  22. Li, H.; Eksteen, J.; Oraby, E. Hydrometallurgical recovery of metals from waste printed circuit boards (WPCBs): Current status and perspectives—A review. Resour. Conserv. Recycl. 2018, 139, 122–139. [Google Scholar] [CrossRef]
  23. Lu, Y.; Xu, Z. Precious metals recovery from waste printed circuit boards: A review for current status and perspective. Resour. Conserv. Recycl. 2016, 113, 28–39. [Google Scholar] [CrossRef]
  24. Debnath, B.; Roychowdhury, P.; Kundu, R. Electronic Components (EC) Reuse and Recycling—A New Approach towards WEEE Management. Procedia Environ. Sci. 2016, 35, 656–668. [Google Scholar] [CrossRef]
  25. Martinez-Ballesteros, G.; Valenzuela-García, J.L.; Gómez-Alvarez, A.; Encinas-Romero, M.A.; Mejía-Zamudio, F.A.; de Jesús Rosas-Durazo, A.; Valenzuela-Frisby, R. Recovery of ag, au, and pt from printed circuit boards by pressure leaching. Recycling 2021, 6, 67. [Google Scholar] [CrossRef]
  26. Fazari, J.; Hossain, M.Z.; Charpentier, P. A review on metal extraction from waste printed circuit boards (wPCBs). J. Mater. Sci. 2024, 59, 12257–12284. [Google Scholar] [CrossRef]
  27. Kaya, M. Recovery of metals and nonmetals from electronic waste by physical and chemical recycling processes. Waste Manag. 2016, 57, 64–90. [Google Scholar] [CrossRef]
  28. D’Adamo, I.; Rosa, P.; Terzi, S. Challenges in waste electrical and electronic equipment management: A profitability assessment in three European countries. Sustainability 2016, 8, 633. [Google Scholar] [CrossRef]
  29. Hadi, P.; Xu, M.; Lin, C.S.K.; Hui, C.W.; McKay, G. Waste printed circuit board recycling techniques and product utilization. J. Hazard. Mater. 2015, 283, 234–243. [Google Scholar] [CrossRef] [PubMed]
  30. Priya, A.; Hait, S. Comprehensive characterization of printed circuit boards of various end-of-life electrical and electronic equipment for beneficiation investigation. Waste Manag. 2018, 75, 103–123. [Google Scholar] [CrossRef] [PubMed]
  31. Kumari, A.; Jha, M.K.; Lee, J.C.; Singh, R.P. Clean process for recovery of metals and recycling of acid from the leach liquor of PCBs. J. Clean. Prod. 2016, 112, 4826–4834. [Google Scholar] [CrossRef]
  32. Szalatkiewicz, J. Metals recovery from artificial ore in case of printed circuit boards, using plasmatron plasma reactor. Materials 2016, 9, 683. [Google Scholar] [CrossRef]
  33. Oliveira, J.S.S.; Hacha, R.R.; D’almeida, F.S.; Almeida, C.A.; Moura, F.J.; Brocchi, E.A.; Souza, R.F.M. Electronic waste low-temperature processing: An alternative thermochemical pretreatment to improve component separation. Materials 2021, 14, 6228. [Google Scholar] [CrossRef] [PubMed]
  34. Paola, M. Recycling of Printed Circuit Boards. In Integrated Waste Management—Volume II; IntechOpen: London, UK, 2011. [Google Scholar] [CrossRef]
  35. Cesaro, A.; Gallo, M.; Moreschi, L.; Del Borghi, A. The hydrometallurgical recovery of critical and valuable elements from WEEE shredding dust: Process effectiveness in a life cycle perspective. Resour. Conserv. Recycl. 2024, 206, 107609. [Google Scholar] [CrossRef]
  36. Silva, L.H.d.S.; Júnior, A.A.F.; Azevedo, G.O.A.; Oliveira, S.C.; Fernandes, B.J.T. Estimating recycling return of integrated circuits using computer vision on printed circuit boards. Appl. Sci. 2021, 11, 2808. [Google Scholar] [CrossRef]
  37. Zhao, W.; Xu, J.; Fei, W.; Liu, Z.; He, W.; Li, G. The reuse of electronic components from waste printed circuit boards: A critical review. Environ. Sci. Adv. 2023, 2, 196–214. [Google Scholar] [CrossRef]
  38. Xia, D.; Lee, C.; Charpentier, N.M.; Deng, Y.; Yan, Q.; Gabriel, J.C.P. Drivers and Pathways for the Recovery of Critical Metals from Waste-Printed Circuit Boards. Adv. Sci. 2024, 11, e2309635. [Google Scholar] [CrossRef] [PubMed]
  39. Monneron-Enaud, B.; Wiche, O.; Schlömann, M. Biodismantling, a Novel Application of Bioleaching in Recycling of Electronic Wastes. Recycling 2020, 5, 22. [Google Scholar] [CrossRef]
  40. Wu, C.; Awasthi, A.K.; Qin, W.; Liu, W.; Yang, C. Recycling value materials from waste PCBs focus on electronic components: Technologies, obstruction and prospects. J. Environ. Chem. Eng. 2022, 10, 108516. [Google Scholar] [CrossRef]
  41. Hadi, P.; Ning, C.; Ouyang, W.; Xu, M.; Lin, C.S.K.; McKay, G. Toward environmentally-benign utilization of nonmetallic fraction of waste printed circuit boards as modifier and precursor. Waste Manag. 2015, 35, 236–246. [Google Scholar] [CrossRef]
  42. Hao, J.; Wang, Y.; Wu, Y.; Guo, F. Metal recovery from waste printed circuit boards: A review for current status and perspectives. Resour. Conserv. Recycl. 2020, 157, 104787. [Google Scholar] [CrossRef]
  43. Maurice, A.A.; Dinh, K.N.; Charpentier, N.M.; Brambilla, A.; Gabriel, J.C.P. Dismantling of printed circuit boards enabling electronic components sorting and their subsequent treatment open improved elemental sustainability opportunities. Sustainability 2021, 13, 10357. [Google Scholar] [CrossRef]
  44. Huang, C.M.; Romero, J.A.; Osterman, M.; Das, D.; Pecht, M. Life cycle trends of electronic materials, processes and components. Microelectron. Reliab. 2019, 99, 262–276. [Google Scholar] [CrossRef]
  45. Mori de Oliveira, C.; Bellopede, R.; Tori, A.; Marini, P. Study of Metal Recovery from Printed Circuit Boards by Physical-Mechanical Treatment Processes. Mater. Proc. 2021, 5, 121. [Google Scholar] [CrossRef]
  46. Canal Marques, A.; Cabrera, J.-M.; de Fraga Malfatti, C. Printed circuit boards: A review on the perspective of sustainability. J. Environ. Manag. 2013, 131, 298–306. [Google Scholar] [CrossRef]
  47. Agrawal, M.; Singh, R.; Ranitović, M.; Kamberovic, Z.; Ekberg, C.; Singh, K.K. Global market trends of tantalum and recycling methods from Waste Tantalum Capacitors: A review. Sustain. Mater. Technol. 2021, 29, e00323. [Google Scholar] [CrossRef]
  48. Yin, Y.; Yang, Y. Sustainable Transition of the Global Semiconductor Industry: Challenges, Strategies, and Future Directions. Sustainability 2025, 17, 3160. [Google Scholar] [CrossRef]
  49. Delfini, M.; Ferrini, M.; Manni, A.; Massacci, P.; Piga, L.; Scoppettuolo, A. Optimization of Precious Metal Recovery from Waste Electrical and Electronic Equipment Boards. J. Environ. Prot. 2011, 2, 675–682. [Google Scholar] [CrossRef]
  50. Jung, M.; Yoo, K.; Alorro, R.D. Dismantling of electric and electronic components from waste printed circuit boards by hydrochloric acid leaching with stannic ions. Mater. Trans. 2017, 58, 1076–1080. [Google Scholar] [CrossRef]
  51. Charles, R.G.; Douglas, P.; Dowling, M.; Liversage, G.; Davies, M.L. Towards Increased Recovery of Critical Raw Materials from WEEE–evaluation of CRMs at a component level and pre-processing methods for interface optimisation with recovery processes. Resour. Conserv. Recycl. 2020, 161, 104923. [Google Scholar] [CrossRef]
  52. Vermeşan, H.; Tiuc, A.-E.; Purcar, M. Advanced recovery techniques for waste materials from IT and telecommunication equipment printed circuit boards. Sustainability 2020, 12, 74. [Google Scholar] [CrossRef]
  53. Panda, R.; Dinkar, O.S.; Kumari, A.; Gupta, R.; Jha, M.K.; Pathak, D.D. Hydrometallurgical processing of waste integrated circuits (ICs) to recover Ag and generate mix concentrate of Au, Pd and Pt. J. Ind. Eng. Chem. 2021, 93, 315–321. [Google Scholar] [CrossRef]
  54. Sheel, A.; Pant, D. Recovery of gold from electronic waste using chemical assisted microbial biosorption (hybrid) technique. Bioresour. Technol. 2018, 247, 1189–1192. [Google Scholar] [CrossRef]
  55. Liu, Y.; Li, K.; Guo, J.; Xu, Z. Impact of the operating conditions on the derived products and the reaction mechanism in vacuum pyrolysis treatment of the organic material in waste integrated circuits. J. Clean. Prod. 2018, 197, 1488–1497. [Google Scholar] [CrossRef]
  56. Datta, M. Manufacturing processes for fabrication of flip-chip micro-bumps used in microelectronic packaging: An overview. J. Micromanufacturing 2020, 3, 69–83. [Google Scholar] [CrossRef]
  57. Qazi, J.; Ikeda, M. Failure Analysis of Capacitors and Inductors. In Microelectronics Failure Analysis: Desk Reference; ASM International: Almere, The Netherlands, 2019; pp. 587–602. [Google Scholar] [CrossRef]
  58. Pina, C.; Elduque, D.; Gómez, P.; Sarasa, J.; Javierre, C. Influence of the Material Composition SMD Diodes on Their Environmental Impact. Electronics 2021, 10, 1033. [Google Scholar] [CrossRef]
  59. Niu, B.; Xu, Z. From Waste Metallized Film Capacitors to Valuable Materials: Hexagonal Flake-Like Micron Zinc Powder, Copper-Iron Electrodes, and an Energy Resource. ACS Sustain. Chem. Eng. 2018, 6, 12281–12290. [Google Scholar] [CrossRef]
  60. Niu, B.; Chen, Z.; Xu, Z. Method for recycling tantalum from waste tantalum capacitors by chloride metallurgy. ACS Sustain. Chem. Eng. 2017, 5, 1376–1381. [Google Scholar] [CrossRef]
  61. Niu, B.; Chen, Z.; Xu, Z. Application of pyrolysis to recycling organics from waste tantalum capacitors. J. Hazard. Mater. 2017, 335, 39–46. [Google Scholar] [CrossRef] [PubMed]
  62. Niu, B.; Chen, Z.; Xu, Z. Recovery of Valuable Materials from Waste Tantalum Capacitors by Vacuum Pyrolysis Combined with Mechanical-Physical Separation. ACS Sustain. Chem. Eng. 2017, 5, 2639–2647. [Google Scholar] [CrossRef]
  63. Chen, Z.; Niu, B.; Zhang, L.; Xu, Z. Vacuum pyrolysis characteristics and parameter optimization of recycling organic materials from waste tantalum capacitors. J. Hazard. Mater. 2018, 342, 192–200. [Google Scholar] [CrossRef]
  64. Sikander, A.; Kelly, S.; Kuchta, K.; Sievers, A.; Willner, T.; Hursthouse, A.S. Chemical and Microbial Leaching of Valuable Metals from PCBs and Tantalum Capacitors of Spent Mobile Phones. Int. J. Environ. Res. Public Health 2022, 19, 10006. [Google Scholar] [CrossRef]
  65. Choi, B.; Domínguez, B.; D’Souza, A.; Khadse, H.; Kunkel, A.; Nagarajan, S.; Necke, T.; Peche, R.; Revello, M.; Rossa, J.; et al. Sustainable recycling process for tantalum recovery from printed circuit boards. Resour. Conserv. Recycl. 2023, 198, 107201. [Google Scholar] [CrossRef]
  66. Prabaharan, G.; Barik, S.P.; Kumar, B. A hydrometallurgical process for recovering total metal values from waste monolithic ceramic capacitors. Waste Manag. 2016, 52, 302–308. [Google Scholar] [CrossRef]
  67. Niu, B.; Xu, Z. Application of Chloride Metallurgy and Corona Electrostatic Separation for Recycling Waste Multilayer Ceramic Capacitors. ACS Sustain. Chem. Eng. 2017, 5, 8390–8395. [Google Scholar] [CrossRef]
  68. Niu, B.; Xu, Z. Innovating e-waste recycling: From waste multi-layer ceramic capacitors to Nb–Pb codoped and ag-Pd-Sn-Ni loaded BaTiO3 nano-photocatalyst through one-step ball milling process. Sustain. Mater. Technol. 2019, 21, e00101. [Google Scholar] [CrossRef]
  69. Panda, R.; Dinkar, O.S.; Jha, M.K.; Pathak, D.D. Hydrometallurgical processing of waste multilayer ceramic capacitors (MLCCs) to recover silver and palladium. Hydrometallurgy 2020, 197, 105476. [Google Scholar] [CrossRef]
  70. Liu, Y.; Song, Q.; Zhang, L.; Xu, Z. Behavior of enrichment and migration path of Cu–Ag–Pd–Bi–Pb in the recovery of waste multilayer ceramic capacitors by eutectic capture of copper. J. Clean. Prod. 2021, 287, 125469. [Google Scholar] [CrossRef]
  71. Liu, Y.; Zhang, L.; Song, Q.; Xu, Z. Recovery of palladium and silver from waste multilayer ceramic capacitors by eutectic capture process of copper and mechanism analysis. J. Hazard. Mater. 2020, 388, 122008. [Google Scholar] [CrossRef] [PubMed]
  72. Liu, Y.; Song, Q.; Zhang, L.; Xu, Z. Separation of metals from Ni-Cu-Ag-Pd-Bi-Sn multi-metal system of e-waste by leaching and stepwise potential-controlled electrodeposition. J. Hazard. Mater. 2021, 408, 124772. [Google Scholar] [CrossRef]
  73. Liu, Y.; Song, Q.; Zhang, L.; Xu, Z. Novel approach of in-situ nickel capture technology to recycle silver and palladium from waste nickel-rich multilayer ceramic capacitors. J. Clean. Prod. 2021, 290, 125650. [Google Scholar] [CrossRef]
  74. Lee, C.H.; Tang, L.W.; Popuri, S.R. A study on the recycling of scrap integrated circuits by leaching. Waste Manag. Res. 2011, 29, 677–685. [Google Scholar] [CrossRef] [PubMed]
  75. Mir, S.; Dhawan, N. Investigation of Pyrolysis Followed by Leaching for Metal Recovery from Integrated Circuits. JOM 2023, 75, 3467–3479. [Google Scholar] [CrossRef]
  76. Li, K.; Zhang, L.; Xu, Z. Decomposition behavior and mechanism of epoxy resin from waste integrated circuits under supercritical water condition. J. Hazard. Mater. 2019, 374, 356–364. [Google Scholar] [CrossRef]
  77. Drawell. Available online: https://www.drawellanalytical.com/ (accessed on 28 August 2025).
  78. Barua, S.; Rahman, I.M.M.; Miyaguchi, M.; Mashio, A.S.; Maki, T.; Hasegawa, H. On-site analysis of gold, palladium, or platinum in acidic aqueous matrix using liquid electrode plasma-optical emission spectrometry combined with ion-selective preconcentration. Sens. Actuators B Chem. 2018, 272, 91–99. [Google Scholar] [CrossRef]
  79. Birloaga, I.; Coman, V.; Kopacek, B.; Vegliò, F. An advanced study on the hydrometallurgical processing of waste computer printed circuit boards to extract their valuable content of metals. Waste Manag. 2014, 34, 2581–2586. [Google Scholar] [CrossRef]
  80. Zamprogno Rebello, R.; Lima, M.T.W.D.C.; Yamane, L.H.; Siman, R.R. Characterization of end-of-life LED lamps for the recovery of precious metals and rare earth elements. Resour. Conserv. Recycl. 2020, 153, 104557. [Google Scholar] [CrossRef]
  81. Cenci, M.P.; Berto, F.C.D.; Schneider, E.L.; Veit, H.M. Assessment of LED lamps components and materials for a recycling perspective. Waste Manag. 2020, 107, 285–293. [Google Scholar] [CrossRef] [PubMed]
  82. Chen, Y.; Qiao, Q.; Cao, J.; Li, H.; Bian, Z. Precious metal recovery. Joule 2021, 5, 3097–3115. [Google Scholar] [CrossRef]
  83. Mizanur Rahman, S.M.; Kim, J.; Lerondel, G.; Bouzidi, Y.; Clerget, L. Value retention options in circular economy: Issues and challenges of LED lamp preprocessing. Sustainability 2019, 11, 4723. [Google Scholar] [CrossRef]
  84. Benmamas, L.; Bouzidi, Y.; Houset, G.; Nomenyo, K.; Bru, K.; Beaulieu, M.; Leclere, P.; Clerget, L.; Lerondel, G. Selective separation of plastic LED lamp components using electrodynamic fragmentation for material recovery. Waste Manag. 2022, 144, 210–220. [Google Scholar] [CrossRef] [PubMed]
  85. Wehbie, M.; Semetey, V. Characterization of end-of-life LED lamps: Evaluation of reuse, repair and recycling potential. Waste Manag. 2022, 141, 202–207. [Google Scholar] [CrossRef] [PubMed]
  86. Dzombak, R.; Padon, J.; Salsbury, J.; Dillon, H. Assessment of end-of-life design in solid-state lighting. Environ. Res. Lett. 2017, 12, 084013. [Google Scholar] [CrossRef]
  87. Tuenge, J.R.; Hollomon, B.; Dillon, H.E.; Snowden-Swan, L.J. Life-Cycle Assessment of Energy and Environmental Impacts of LED Lighting Products, Part 3: LED Environmental Testing; Pacific Northwest National Laboratory (PNNL): Richland, WA, USA, 2013. [Google Scholar] [CrossRef]
  88. Sangwan, K.S.; Bhakar, V.; Naik, S.; Andrat, S.N. Life cycle assessment of incandescent, fluorescent, compact fluorescent and light emitting diode lamps in an Indian scenario. Procedia CIRP 2014, 15, 467–472. [Google Scholar] [CrossRef]
  89. Cenci, M.P.; Berto, F.C.D.; Castillo, B.W.; Veit, H.M. Precious and critical metals from wasted LED lamps: Characterization and evaluation. Environ. Technol. 2020, 43, 1870–1881. [Google Scholar] [CrossRef]
  90. Dodbiba, G.; Oshikawa, H.; Ponou, J.; Kim, Y.; Haga, K.; Shibayama, A.; Fujita, T. Treatment of Spent LED Light Bulbs for Recycling of Its Components: A Combined Assessment in the Context of LCA and Cost-Benefit Analysis. Resour. Process. 2019, 66, 15–28. [Google Scholar] [CrossRef]
  91. Martins, T.R.; Tanabe, E.H.; Bertuol, D.A. Innovative method for the recycling of end-of-life LED bulbs by mechanical processing. Resour. Conserv. Recycl. 2020, 161, 104875. [Google Scholar] [CrossRef]
  92. Balinski, A.; Recksiek, V.; Stoll, M.; Christesen, C.; Stelter, M. Liberation and Separation of Valuable Components from LED Modules: Presentation of Two Innovative Approaches. Recycling 2022, 7, 26. [Google Scholar] [CrossRef]
  93. Mir, S.; Dhawan, N. A comprehensive review on the recycling of discarded printed circuit boards for resource recovery. Resour. Conserv. Recycl. 2022, 178, 106027. [Google Scholar] [CrossRef]
  94. Panda, R.; Dinkar, O.S.; Jha, M.K.; Pathak, D.D. Recycling of gold from waste electronic components of devices. Korean J. Chem. Eng. 2020, 37, 111–119. [Google Scholar] [CrossRef]
  95. Marwede, M.; Chancerel, P.; Deubzer, O.; Jordan, R.; Nils, F. Mass Flows of Selected Target Materials in LED Products Project Introduction—Cycling Resources Embedded in Systems Containing Light-emitting Diodes (CycLED). In Electronics Goes Green 2012+; Institute of Electrical and Electronics Engineers (IEEE): New York, NY, USA, 2012. [Google Scholar]
  96. Laurent, A. Commodities at a Glance: Special Issue on Rare Earths; United Nations (UN): New York, NY, USA; Geneva, Switzerland, 2014; p. 48p. [Google Scholar]
  97. Mazloum-Nejadari, A.; Khatibi, G.; Czerny, B.; Lederer, M.; Nicolics, J.; Weiss, L. Reliability of Cu wire bonds in microelectronic packages. Microelectron. Reliab. 2017, 74, 147–154. [Google Scholar] [CrossRef]
  98. SHINKO. Available online: https://www.shinko.co.jp/english/ (accessed on 4 June 2025).
  99. TEXAS INSTRUMENT. Available online: https://www.ti.com/ (accessed on 23 March 2025).
  100. AZO MATERIALS. Available online: https://www.azom.com/ (accessed on 13 February 2025).
  101. ThermoFisher SCIENTIFIC. Available online: https://jobs.thermofisher.com/global/en (accessed on 25 April 2025).
  102. Umicore. Available online: https://pmm.umicore.com/en/prices/ (accessed on 18 July 2025).
  103. Granados-Fernández, R.; Montiel, M.A.; Díaz-Abad, S.; Rodrigo, M.A.; Lobato, J. Platinum recovery techniques for a circular economy. Catalysts 2021, 11, 937. [Google Scholar] [CrossRef]
  104. Smith, L.; Ibn-Mohammed, T.; Koh, S.C.L.; Reaney, I.M. Life cycle assessment and environmental profile evaluations of high volumetric efficiency capacitors. Appl. Energy 2018, 220, 496–513. [Google Scholar] [CrossRef]
  105. Bourgeois, D.; Lacanau, V.; Mastretta, R.; Contino-Pépin, C.; Meyer, D. A simple process for the recovery of palladium from wastes of printed circuit boards. Hydrometallurgy 2020, 191, 105241. [Google Scholar] [CrossRef]
  106. Andrade, D.F.; Castro, J.P.; Garcia, J.A.; Machado, R.C.; Pereira-Filho, E.R.; Amarasiriwardena, D. Analytical and reclamation technologies for identification and recycling of precious materials from waste computer and mobile phones. Chemosphere 2022, 286, 131739. [Google Scholar] [CrossRef] [PubMed]
Figure 1. Indicative driver structures: (a) LED lamp driver; (b) LME driver (authors’ images).
Recycling 10 00175 g001
Figure 2. Thermogravimetric analysis of a plastic SM-ICs.
Recycling 10 00175 g002
Figure 3. Temperature and time profiles for crucibles’ preparation.
Recycling 10 00175 g003
Figure 4. Temperature and time profiles for ICs’ calcination.
Recycling 10 00175 g004
Figure 5. The basic types of lamp bases used for residential lighting (authors’ images).
Recycling 10 00175 g005
Figure 6. Classification of the main types of lamps used for residential lighting, based on their base and LED technology (authors’ images).
Recycling 10 00175 g006
Figure 7. The LME separation depends on how it is installed in buildings (authors’ images).
Recycling 10 00175 g007
Figure 8. The variation in the mass of the lighting equipment was tested ((a) LED).
Recycling 10 00175 g008
Figure 9. Indicative cases of secondary base metal fractions (authors’ images).
Recycling 10 00175 g009
Figure 10. The variation in the mass of the driver relative to the mass of the tested lighting equipment.
Recycling 10 00175 g010
Figure 11. The design and placement of the driver depend on the LED technology used for the lamps (authors’ images).
Recycling 10 00175 g011
Figure 12. Basic fractions from dismantled drivers (authors’ images).
Recycling 10 00175 g012
Figure 13. The variation in the mass of the main fractions of the driver from the lighting equipment tested.
Recycling 10 00175 g013
Figure 14. Integrated circuits on the PCBs of lighting equipment were tested (authors’ images).
Recycling 10 00175 g014
Figure 15. Variation in the concentration of precious metals in integrated circuits compared to other driver components.
Recycling 10 00175 g015
Figure 16. The stored potential of precious metals in the examined integrated circuits (a), andOK the stored value due to the presence of these precious metals in the examined integrated circuits (b).
Recycling 10 00175 g016
Figure 17. Distribution of average stored potential (g) of precious metals—due to the presence of integrated circuits—in the lighting equipment examined (made at SankeyMatic.com).
Recycling 10 00175 g017
Table 1. Percentage of drivers in the lighting equipment: A comparison between the literature and the present study.
Literature ReviewPresent Study
Driver Mass (wt%) Driver Mass (wt%) MC
LEBTATDVariationAvg.Ref.CCVariationAvg.ATDLCH
Mix (a) 13[80]n/a
Lamps 8.02–22.43 [83]DA2.58–25.0915.32(g) (x)
E27 5–6.96.1[87] 4.77–25.0915.93 (x)
18.84[88] (x)
9.36[81] (x)
12.97–22.716.71[89] (x)(x)
12[84] (x)
(b) 13[90]n/a
(c) 16.02[91]DA4.64–25.0917.02(h) (x)
E14–E27(d) 19[92]4.77–25.0916.37 (x)
E27(e), (f)10.61–49.9628.92[86] 28.51–55.5947.14 (x)(x)
(LE) lighting equipment, (BT) base type, (ADT) additional technical details, (CC) corresponding case, (n/a) not available, (DA) data adaption, (MC) mass comparison, (x) presence in the classification, (L) lower, (C) comparable, (H) higher, (a) various types of lamps and luminaires, (b) 30 W, (c) same type and brand, (d) E14 and E27, (e) bulb shape A19 (Classic-A60), (f) encapsulated driver, (g) lamps with SM-LEDs, (h) data is provided for lamps of one type (Classic-A60), but from various brands, (″) like the previous one.
Table 2. Concentration (mg/kg) of precious metals in integrated circuits.
IC TypeSOATAgAuPdPtRef.
n/aPCICP-OES 70118 [49]
Monitor 15414 [49]
TV 31512 [49]
n/aAAS868289 [74]
14941365 [74]
65901435 [74]
18301317 [74]
3410414 [74]
353199 [74]
471101 [74]
1304490 [74]
870407 [74]
29801393 [74]
26451247 [74]
41883386 [74]
10361678 [74]
656504 [74]
617636 [74]
20671525 [74]
533560 [74]
514496 [74]
4325844 [74]
18281546 [74]
3167581 [74]
25581699 [74]
MemoryICP-OES8501640 [50]
n/aICP-MS7200 [55]
PC7200 [76]
SmallMedical211 339 [39]
Big35 1 [39]
n/an/aICP-AES
ICP-MS
5200179 [15]
THLMEICP-OES652194BLOQNDPS
SM116299349
LED lamps3876BLOQ74BLOQ
(IC) integrated circuit, (LME) lighting management equipment, (SO) sample origin, (″) like the previous one, (AT) analytical technique, (AAS) atomic absorption spectroscopy, (TH) through-hole, (SM) surface mount, (PC) personal computer, (n/a) not available, (ND) not detected, (BLOQ) below the limit of quantification, and (PS) present study.
Table 3. Concentration (mg/kg) of precious metals in metal fraction of integrated circuits.
MFSOATAgAuPdPtRef.
SM-ICsPCAAS
ICP-OES
748058801104[53]
(SO) sample origin, (PC) personal computer, (MF) metal fraction, (SM-ICs) surface mount integrated circuits, and (AT) analytical technique. (AAS) atomic absorption spectroscopy.
Disclaimer/Publisher’s Note: The statements, opinions and data contained in all publications are solely those of the individual author(s) and contributor(s) and not of MDPI and/or the editor(s). MDPI and/or the editor(s) disclaim responsibility for any injury to people or property resulting from any ideas, methods, instructions or products referred to in the content.