Abstract
Additive manufacturing (AM) is an Industry 4.0 technology that assists or replaces the conventional manufacturing (CM) of complex geometries in various sectors, including transport, steel, aerospace, military, and architecture. The aim is to improve processes, reduce energy consumption, atmospheric emissions, and solid waste, and streamline stages while complying with the new environmental regulations. The main objective of this work was to carry out a cradle-to-gate Life Cycle Assessment (LCA), considering the raw material extraction, pre-processing, manufacturing, and post-processing stages, comparing two manufacturing methods for the same ER-90 metal flange part, conventional forging and wire and arc additive manufacturing (WAAM), all following the requirements and operations proposed by the ISO 14040/44 standard. WAAM is a Directed Energy Deposition (DED) technology that uses welding techniques to produce 3D objects with more complex geometries. Compared to the forging industry, which requires a lot of heat and kinetic energy in its metal part production stages, WAAM is a more sustainable and modern alternative because it does not require high temperatures and energy to produce the same parts. The environmental indicators compared in the process stages were energy consumption, greenhouse gas (GHG) emissions, and solid waste. The total energy consumption in AM was 18,846.61 MJ, the GHG emissions were 864.49 kgCO2-eq, and the solid waste generated was 142.34 kg, which were 63.8 %, 90.5%, and 31.6% lower than the environmental indicators calculated for CM, respectively.
1. Introduction
The automation of the system and the exchange and accumulation of data in the production stages make 4.0 industry more productive and efficient, as well as reducing energy cost, emissions, and waste, towards a more sustainable model [1,2,3,4,5]. Additive manufacturing (AM), a relatively new concept compared to other traditional processes, has proven essential in supporting this transformation of production in the industry, utilising various types of materials. The Committee on Testing and Materials of the American Society F42 (ASTM) has defined AM as a process of joining materials from 3D model data, usually layer-by-layer, as opposed to conventional methodologies, thus obtaining a geometry that is closer to the final piece in the first instance [6,7,8].
Among the various AM processes, Wire and Arc Additive Manufacturing (WAAM) stands out in the production of metal parts, with the aim of reducing production time and costs by reducing raw material waste and energy consumption, as well as making the production process more sustainable [9]. WAAM is a new technology that belongs to the Directed Energy Deposition (DED) category. It is increasingly being applied in various areas and allows components to be constructed layer-by-layer using welding wire as the filler material and an electric arc as the heat source [10]. The process is well-structured and complex, involving an induction-heated torch that is continuously fed wire to deposit the base material [11,12,13]. The advantages include lower equipment costs, material versatility, and efficient weld layer production, and the robotic equipment occupies relatively less space compared to some conventional manufacturing processes, such as forging [14,15]. These characteristics make WAAM particularly suitable for producing large structures [16,17].
Its effectiveness can be demonstrated by conducting a Life Cycle Assessment (LCA), a method of analysing the environmental impacts of a product, process, service, or other economic activity throughout its life cycle [18,19,20,21,22,23]. It is an important tool for evaluating the performance inputs of the stages of a process and identifying environmental impacts, which can help with decision-making, control measures, and quantifying emissions to the atmosphere, soil, and effluents during the life cycle of a process or production [24,25]. Many projects portray WAAM as a sustainable alternative to CM because of the results of its processes. However, compared with the norms of an LCA, the results of the processes are more detailed and can be analysed and corroborated for application in projects [26].
Despite the many applications of LCA, the methodology has limitations in the manufacturing sector that should be taken into account in the studies and in the evaluation of their results. In Brazil, the main limitation of LCA studies is the unavailability of national databases, and uncertainty regarding the results suitability for decision-making purposes, difficulties in collecting primary data, the complexity of the life cycle inventory (LCI) phase, the difficulty of comparing the quantitative results of studies with the same focus, and the high cost and time required to conduct an LCA [27].
The novelty of this research lies in its application of a systemic and quantitative approach to analyse two structurally distinct manufacturing methods that have not been extensively examined from an environmental perspective. Integrating real data on energy consumption, emissions, and material usage throughout the entire life cycle of a product provides valuable insight into the environmental advantages and limitations of WAAM compared with traditional manufacturing. For countries investing in Industry 4.0 technologies that comply with environmental guidelines, the LCA is a valuable addition to the academic literature and a tool for improving industrial processes.
In the environmental context of high emissions, waste, resource depletion, and environmental degradation, it is increasingly necessary to change production processes and for industries to invest in these changes. For the final printing of the parts, four factors were taken into account in the manufacturing process: the energy source, the material used, the layering process, and the final geometry of the product. These are important stages that affect the CAD model created in the software, the choice of robot that translates the programme, the amount of raw material needed for printing, and the quality of the surface finish of the part produced using the two manufacturing methods.
By means of standards, bibliographical research, and experimental data collection, this work proposes, in a cradle-to-gate life cycle analysis, to calculate the energy demand, greenhouse gas (GHG) emissions, and waste generated during the manufacture of a metal piece, comparing them with the conventional manufacturing method of forging (CM) and WAAM, in order to contribute to the understanding of current manufacturing practices and to justify WAAM as a more sustainable and mainstream technology than CM.
2. Results and Discussion
2.1. Energy Demand Calculation
2.1.1. From the Cradle to Factor’s Gate (Stage 1 and 2)
The energy consumption in stage 1 (mineral extraction) was the same for both manufacturers, as the same metal produced was used in the next process (stage 2). The calculation was performed using the components of the ECOINVENT 3.11 library, considering half of the mass produced by the Oxygen Blast Furnace (BOF) and half by the Electric Arc Furnace (EAF), and the value obtained was 4694.624 MJ.
As described in the methodology, the AWS ER90S-B3 material, also known as ER-90, is a steel with carbon in its composition that requires the addition of iron ore. In this way, the EAF manages to produce a percentage of metal from its scrap and recycled materials, while the BOF synthesises the ore and the WSA [28], in its energy and emissions calculation, considers both furnaces as contributors to the environmental indicators.
In stage 2 (hot rolling), the energy required to produce slabs in conventional manufacturing (CM) and bars in additive manufacturing (AM) was different. Due to the smaller geometry and volume of the bars, they did not have to undergo more reheating processes than the slabs, reducing the energy required to reheat the metal. For the production of slabs, the SIMAPRO 10.2 software was used for conventional production, and a value of 6801.87 MJ was obtained. For the AM, furnaces requiring an energy consumption for reheating between 15% and 20% and 70% of the energy consumption for hot rolling were considered [29,30]. Considering the 30% energy reduction for reheating in the hot rolling, which is necessary to find the percentage above the energy value of the slabs (6801.87 MJ), the energy consumption of the bars is 4761.309 MJ.
This study determined that 11,496.494 MJ of energy was required for the cradle stages. For comparison, SWORD [31] found an energy requirement of approximately 15,400.00 MJ in similar extraction and hot rolling stages. The difference is that the metal used was titanium, which requires more treatment processes than the low-alloy ER-90, requiring more energy. The updated figures from the ECOINVENT 3.11 library show that the comparison with the previous reference and the calculations performed in the software are also in agreement.
2.1.2. From Gate-to-Gate (Stages 3 to 7)
In stage 3 (forging) of the CM, the YUSUF [32] model was used, and the amount spent on production per 1 kg was 45.01 kWh/kg, as presented in the methodology for calculating environmental indicators. The energy for heating the stages (430 °C, 480 °C, and 530 °C), applying pressure in each stage (350 KN), and the idle mode of the machines, the consumption for 227.0 kg of material for production was 36,782.17 MJ. In order to confirm the high value of 36,782.172 MJ, a similar process was carried out in the SIMAPRO software using the casting library of ECOINVENT 3.11 with a similar low-alloyed metal composition [19]. The value found also showed a close energy expenditure (38,601.0 MJ), which was slightly higher because the foundry prioritises heating energy over kinetic energy.
In stages 4 (CM) and 7 (AM) of post-processing, the energy demand calculation was based on the PRIARONE model [33], where the parts were placed in the turning and drilling equipment with different dimensions due to the amount of material loss in the respective manufacturers. This justification is presented in the waste generation calculations. The value found for CM was 3832.0 MJ, while that for wire-arc DED was 957.10 MJ. It can be observed that the post-processing of CM (stage 4) was higher because a lot of energy was required to use the computerised numerical control (CNC) for turning and drilling the piece, owing to the more inconsistent geometry presented. This demand was converted, in the same volume, into the desired final part for use according to its specifications.
In stage 5 (wire drawing) of additive manufacturing, only physical deformation of the metal occurs, and the heating that occurs is very low or non-existent, and naturally requires less energy than the other processes. The LCA SIMAPRO 10.2 software with the same library was used for the calculus as a reference [19], and with the same amount of 227.0 kg of metal, the energy requirement in this stage was 3541.2 MJ.
In stage 6 (Wire-arc DED), the calculations were based on the PRIARONE [33] Equations (4) and (5), as presented in the Materials and Methods section. The primary data were supplied directly by the KUKA robotic equipment, and the modelling of the piece was performed using Solid Works 3D 2025 software from the LNTSOLD welding laboratory at the Federal University of Rio de Janeiro (UFRJ)/COPPE. The total energy consumption used in CM and AM is shown in Figure 1, as it can be seen that the energy demand required to produce the flange was 52,110.7 MJ and 18,846.6 MJ, respectively. This statement highlights the novelty of using AM instead of CM, showing that AM processes can be used almost three times (2.77) instead of one CM at approximately the same energy cost.
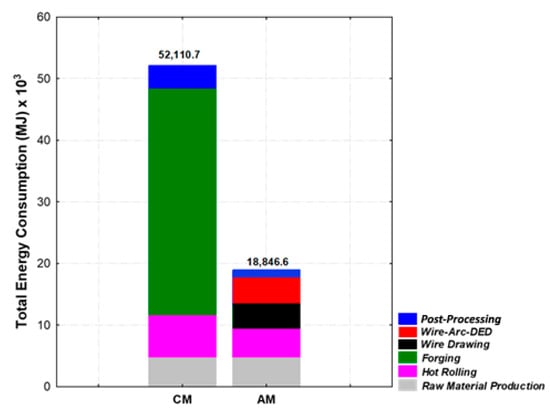
Figure 1.
Total energy consumed in the Life Cycle Assessment from cradle-to-gate during Conventional Manufacturing (CM) and Additive Manufacturing (AM) method.
The LCA results showed that the gate-to-gate process accounted for around 78% of the total energy consumption in conventional production, with the forging stage (stage 3) being the most energy-intensive. This high value compared to the previous stages is due to the higher heating requirement and pressure exerted by the equipment to form the part in a closed mould for a period of 6 h. The second most energy-consuming stage (hot rolling) involves heating and forming the material to be moulded into the desired shape, which is then reheated and pressed, but without the same level of force and prolonged temperature.
The gate-to-gate energy consumption of the AM was 50% of the total, with Wire-Arc DED being the most energy-intensive stage. The WAAM and subsequent post-processing consumed 5849.48 MJ per piece. Referencing a similar study using the best-case scenario of those stages [13], the value found was 5552.136 MJ using the same amount of mass, confirming the effectiveness of the value found in the study.
When the main manufacturing stages of AM and CM were compared, it was found that forging (stage 3) consumed 86.7% more energy than Wire-arc DED (stage 6). The LCA justified this result by referring to the higher heating rate and kinetic force applied to the quill in the forge compared to WAAM, thus demonstrating that AM aims to save more energy by using the precision of layer-by-layer deposition rather than the use of furnaces and presses. The wire is deposited in the print using a focused heat source at the tip of the torch; therefore, there is no need to heat the entire surface area of the wire. In addition, since CM required the initial block to be cut and AM only printed with minimal cutting (generating less waste of material), and only polished when necessary, it resulted in lower energy consumption.
The LCA of this environmental factor revealed that AM’s energy consumption was reduced by 63.8% compared with that of CM, thus confirming the choice of AM. In other words, the greater the energy consumption, the greater the fuel usage, and consequently, the greater the cost of supplying this energy to manufacturing processes. Another impact is the generation of GHG pollutants that are emitted into the atmosphere, as described in the following section and its mitigation measures.
2.2. CO2 Equivalent Emissions Calculation (CO2-eq)
To validate the results, two methodologies were used for atmospheric emissions in stage 1 (material extraction): the first was the data from ECOINVENT 3.11 [19] and the second was the WSA, 2023 Steel Production Sustainability Indicators report [28]. Using the same mass of material for both methods, the value found was the same 509.47 kgCO2-eq, demonstrating the accuracy of the proposed method. This stage involves the use of equipment that requires fossil fuels, such as excavators, tractors, drills, and ore transport trucks. The ore was then transported to the processing plants, where it went through the BOF and EAF furnaces and on to the flotation, crushing, and screening processes, among others. At this stage, it was also considered that the plants required energy for lighting, running sheds, and ancillary equipment, and according to the library consulted, natural gas was used.
In stage 2 (hot rolling), the SIMAPRO library [19] was used, and 82.1 kgCO2-eq was found for the CM by the inputs in the software. Considering the 20% less energy for reheating in AM because of the bar geometry [29,30], the emission value was 65.68 kgCO2-eq for AM. This stage requires more energy because the equipment used in the rolling mill consumes a lot of energy to heat the metal to its deformation temperature.
The methodology of YUSUF [32] was used to calculate the emissions in stage 3 (CM). In the data collected from the forging experiments, the average CO2 emissions per kilogram were used. To conduct the experiments, the author employed statistical software using the ANOVA method [34], which is commonly applied to assess differences between two or more means. This approach was adopted to ensure the reliability and consistency of the results obtained for the forging process. Based on the calculated average, the resulting value was 35.59 kg CO2-eq/kg.
Considering that the mass of the material at this stage was 227.0 kg, the emission load was 8078.93 kgCO2-eq. Initially, this value would have been considered an outlier in relation to the other emissions found, but by running simulations in SIMAPRO with values close to those in the available libraries, it was observed that the emission rate was indeed high. In stage 4 of the CM (post-processing), the calculations proposed by PRIARONE [33] were used, and the values obtained were 383.2 kgCO2-eq. The results obtained for the CO2-eq emissions from CM and AM are shown in Figure 2.
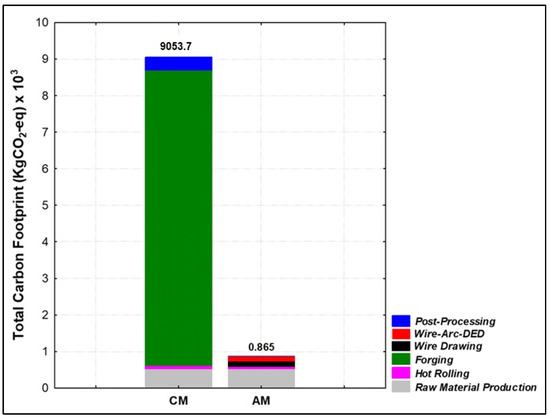
Figure 2.
Total carbon footprint in the cradle-to-gate Life Cycle Assessment during production using conventional manufacturing (CM) and additive manufacturing (AM) methods.
In stage 5 (wire drawing), the calculation in the software for 227.0 kg resulted in an emission of 75.4 kgCO2-eq. The equipment and facilities used natural gas to operate, and this value was also added to the production of the bar. For stages 6 (Wire-Arc DED) and 7 (post-processing) of the AM, the equation of PRIARONE [33] was used, which resulted in 193.75 kgCO2-eq (stage 6) and 20.19 kgCO2-eq (stage 7).
The CO2-eq results of the CM show that the forging stage (stage 3) had the largest carbon footprint, around 89.23% of the total emissions during production. The heating processes at this stage were more intense than those in the combined cradle-to-gate stages. Compared with WAAM, emissions were 97.60% higher, demonstrating the viability of AM without direct fuel use.
The results obtained in the AM showed that the largest carbon footprint during the production of the part was from cradle-to-gate, with the production of the raw material (stage 1) being responsible for 58.93% of all CO2-eq emissions. As mentioned before, the initial stages of AM generate higher emissions because they use only electrical energy and induction for their processes. When evaluated gate-to-gate, Wire-arc DED (stage 6) was found to be the main contributor to CO2-eq emissions in AM, primarily due to equipment components, particularly the shielding gas cylinders used. Six cylinders were used, each containing a mixture of argon and carbon dioxide (92% and 8% v/v, respectively). Although argon is not a greenhouse gas (GHG), the value found refers not only to the processing of argon but also to the process of producing it as a shielding gas.
It is important to bear in mind that, when calculating the emissions values using the software library as a reference, not only were the materials and methodology taken into account, but also the constants of the global energy network, particularly with regard to the use of thermal power plants. The study considered global averages; however, if the calculations had been performed in a country with a predominantly renewable energy grid (such as Brazil), the GHG emissions values of both manufacturers would have been lower.
The main GHG pollutants emitted during manufacturing that contribute to CO2 equivalence are carbon monoxide (CO), nitrogen oxides (NOx), sulphur oxides (SOx), and fine and coarse particulate matter (PM2.5 and PM10). Some of these compounds contribute to the acceleration of the greenhouse effect, depletion of the ozone layer, and formation of secondary pollutants that are harmful to humans and the environment [35].
These emissions can be reduced through mitigation measures, particularly regarding CM. Examples include using filters in furnaces (glass fiber or high-purity silica recommended for CO2) [36], changing the fuel used in furnaces and forges (for example, replacing diesel oil or coal with natural gas, which is a less polluting alternative), and carrying out modifications and maintenance on the equipment itself. The reduction would be more relevant in CM because furnaces use fuels such as coal, gas, and oil for operation and heating. If these fuels cannot be changed, improving thermal insulation and controlling the fuel/air ratio could reduce their impact on the atmosphere [37].
In the primary phase of material extraction, heavy vehicles such as excavators, crushers, dump trucks, and backhoes use fossil fuels such as biodiesel, ethanol, biogas, and possible blends of biodiesel in diesel and ethanol in petrol are viable alternatives for emerging projects in Brazil and around the world. Following the idea of a sustainable energy transition, hot rolling, wire drawing, electric-arc DED, and both post-processing stages would benefit from GHG reductions as they use direct energy or induction heating. The impact of significant changes in the extraction and forging phases depends on the fuel used in the equipment.
According to the results presented in the topics of the LCA study, while these mitigating measures are effective in reducing emissions, implementing AM by CM is the most viable option because it uses direct energy and induction for all gate-to-gate processes without burning fossil fuels. This is reflected in the 90.5% reduction in emissions generated by AM in the context of the LCA. Adding these filtering and fuel-switching measures to the “cradle” stages of AM (extraction and hot rolling) would further reduce emissions, but changing the country of origin’s electricity grid would be even more effective.
2.3. Solid Waste Generation Calculation
2.3.1. Solid Waste Generation from Cradle-to-Gate (Stages 1 and 2)
In stage 1 (material extraction), waste generation was not considered for the two manufacturers, as the software only considers the emissions and energy of the part that will be used, and the surplus material will be used in other processes. Even if the software assumes that waste is generated, it would be recycled or reused in a new extraction, as the extracted material is not lost for reuse. Using SWORD [15] and PRIARONE [33] as examples, they stated that even if emissions and/or waste are generated in the initial stage of raw material production, they are not lost. In this LCA, any mass of material discarded throughout the processes is considered waste.
During data collection, the amount of material used by the manufacturers was 227.0 kg. To understand the amount of metal prior to these stages, SIMAPRO was used to calculate the waste of 1.0 kg of AWS ER90S-B3 metal, also known as ER-90. For every 1.0 kg of metal produced in the hot-rolling mill, 0.149 kg was lost. Therefore, the remaining metal required to produce the remaining 227.0 kg at the end of this stage, as calculated by the program, was 266.74 kg. Applying this value to the loss of 0.149 kg per kilo, a loss of 39.74 kg was obtained at this stage.
2.3.2. Solid Waste Generation from Gate-to-Gate (Stages 3 to 7)
According to the studies by RAJ [38] and ASM [39], the average metal loss in the CM forging process (stage 3) is between 10 and 15%. Considering that the mass in this stage is 227.0 kg and the average loss percentage assumed by ASM is 12.5%, the percentage was applied to the initial mass and was found to be 28.375 kg remaining, leaving 198.63 kg. As this is an estimate, it is possible that the loss will tend to be higher or lower by the percentage considering the value found, but during this and other stages, the metal can always be easily reused or recycled.
In the post-processing of the CM (stage 4), the forged part was used for milling, and the sum of the CNC machining processes was taken into account to determine the waste generated. With an initial value of 198.63 kg in this stage, 140.03 kg of chips were removed by turning and drilling the part, resulting in a final value of 58.6 kg. The total material lost during the CM process from gate-to-gate was 168.405 kg.
In stage 5 (wire drawing) of the AM, the mass was considered to be the same at the start of both processes, which made it easier to visualise waste generation from gate-to-gate in CM and AM. The software using the same library mentioned above was 34.0 kg, and this stage resulted in 193.0 kg of wire available for the next stage.
In step 6 (Wire-arc DED) of AM, the substrate value of 30.9 kg and wire mass of 95.8 kg were used for printing, yielding a total of 126.7 kg. The absence of 66.3 kg of the 193.0 kg generated by wire drawing was noted. The equipment calculated that only 126.7 kg was required to assemble the part; therefore, this “missing” material was considered surplus and not waste.
The difference between the surplus and waste is due to the fact that the latter must be recycled or reused and must undergo new heating and forming processes to be reintroduced into metal production, whereas the former can be reused at this stage without undergoing the previous processes. The deposition of AM had a small loss compared to all other processes, where only 2.6 kg of waste material was generated. This loss took into account both the substrate and the mass of the wire used.
Stage 7 (post-production) of the AM, according to the laboratory data, showed a loss of 66.0 kg with a final weighed mass of 58.1 kg. This value was lower than that for stage 4 of the CM, justifying the amount of waste generated compared to the CM and the sum of the loss values for drawing and manufacturing. Figure 3 shows the waste generated by the two manufacturing operations from cradle-to-gate.
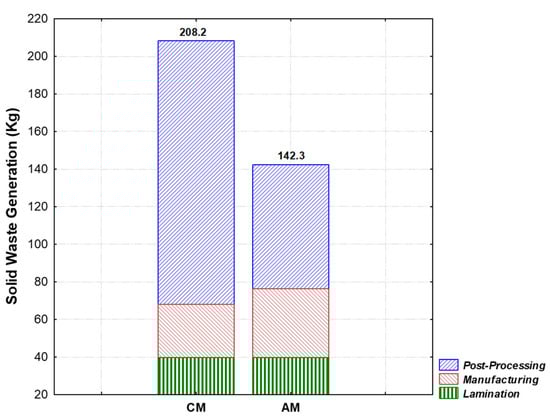
Figure 3.
Waste generated in the cradle-to-gate Life Cycle Assessment of conventional (CM) and additive (AM) manufacturing.
The amount of waste generated during rolling was the same for both manufacturers, as there were no significant losses when forming the same mass of bars and slabs. In manufacturing processes, AM produced 22.74% more waste than CM. The LCA study identified a value of 34 kg for wire drawing, exceeding the values for forging (28.375 kg) and WAAM (2.6 kg). Material loss during wire drawing was due to the friction generated by the process and the correction of oxidised areas during WAAM printing. However, the difference in waste generation between stage 4 of CM and stage 7 of AM is 52.86%, which supports the use of AM. This was because the deformation of the part surface after forging (stage 3) required additional removal processes by turning, generating more waste.
As the ER-90 low-alloy metal contains heavy metals in its composition, improper disposal of its waste can reduce porosity and contaminate soil and water, posing a risk to the region’s biodiversity. The LCA results showed that the focus of mitigation was on the post-processing stages, where the most waste was produced owing to cuts made to the piece. The three most effective mitigation measures are recycling, reintroducing the material into the production chain, and using waste in another process [40].
The metal can be recycled and reused in other stages. If they fall into the category of recycled metal, they are sent to the EAF reactor to be reintroduced into the life cycle. The study of the LCA of the part showed that the possibility of using less initial metal in the production stages could reduce the generation of waste and, consequently, the energy requirements and emissions of the processes studied. Factors to be taken into account in the consumption of materials used in AM include the fact that not all the materials are found at the final stage of the process, and that part of the printing of the piece is the support for it, where it is removed or dissolved manually, leading to a loss of resources.
However, the residual metal obtained from the two manufacturing processes could be used in two models of material reuse: the Circular Economy (CE) and Environmental Symbiosis (ES). CE is based on the extraction, production, use, and disposal phases, with the aim of reusing waste from a production process by reintroducing it into the system and recycling it to avoid further waste [2]. All residual metal generated so far can be reintroduced into the BOF and EAF furnaces in stage 1 before being crushed and cleaned.
The other model is the ES, which seeks cooperation between companies so that the waste produced by one company can serve as a raw material for another. The aim of these measures is to almost completely reduce the waste generated at each stage and save energy and costs by reusing as much metal as possible [41].
3. Materials and Methods
3.1. Definition and Scope
The main objective of this work was to carry out a Life Cycle Assessment (LCA) comparing two manufacturing methods for the same part, namely Conventional Forging Manufacturing (CM) and Wire and Arc Additive Manufacturing (WAAM). WAAM is a Directed Energy Deposition (DED) technology that uses welding techniques to produce 3D objects. Wire-arc DED has many advantages, in particular its relatively high deposition rate [42,43]. The LCA was developed based on the environmental impact indicators of energy consumption, solid waste generation, and atmospheric emissions during the raw material extraction, pre-processing, manufacturing, and post-processing stages. All of them followed the requirements and operations proposed by the ISO 14044 standard [24].
The part produced in this work was an API 6A BX169 metal flange used in the marine sector of the oil and gas industry for applications such as sealing, pressurising, and routing viscous fluids such as oil in pipelines. The forming material was AWS ER90S-B3, also known as ER-90, which is traditionally forged from ASTM A182 F22 tube fittings [44]. Its conical trunk shape had initial dimensions of a 38 by 38 by 20 cm block, a weight of 227.0 kg, and a density of 7860 kg/m3.
3.2. System Boundaries
The stages of production and the flow of the product from the start of extraction and production to completion are shown in Figure 4. The stages have been divided into blocks, where the production of the metal is the same for both, differing in the metal processing stage, where it is transformed into slabs for CM and bars for Wire-arc DED by the foundry, known as hot rolling.
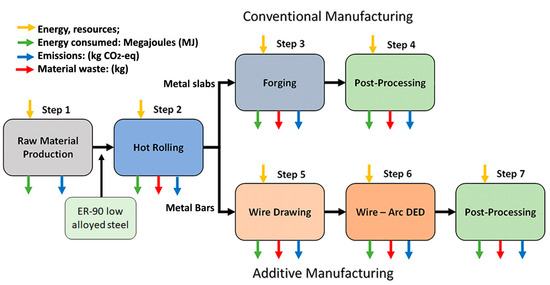
Figure 4.
Flowchart comparing CM and AM processes with input and output flows.
The CM includes the forging and post-processing stages, and for additive manufacturing, the drawing stage, Wire-arc DED, and post-processing were added. The method chosen to analyse the final production of the part in the LCA was cradle-to-gate. The midpoint of all stages from cradle-to-gate was used as the assessment level, as this identifies specific environmental problems instead of the endpoint. The European ReCiPe 2016 v 1.11 model was used, with a hierarchical path representing the outcome of the impacts in a 100-year forecast window (medium term). For this study, energy data (in megajoules —MJ), climate change (in kgCO2-EQ), and metal depletion (in kg) were obtained from the software library.
SIMAPRO software was chosen to carry out the LCA with the other bibliographical references. The software has the flexibility to adapt to imported libraries and change the input and output data of the evaluated processes. It also has a user-friendly interface that allows for a quick understanding of how to structure an evaluation of the study and integrates well with various libraries. The ECOINVENT 3.11 library works very well with the software and is constantly updated in terms of reference values, which demonstrates its reliability in the market. In an LCA study, diverse data add value to the results, particularly in cradle-to-grave evaluations. For more information about the software is in the Supplementary Materials file, in the topic S1.
The limitation of the study was based on the so-called “grave”, which includes the stages of transport, use, and disposal of the product. Transport was excluded because of the distance that would be travelled to deliver the part, the possible means of transport used, and their respective fuels. The study aimed to compare the manufacturing process during the production of the part, where any change in its characteristics could be calculated. However, its use was intended to be static, without having more than one use. Its disposal would only be the complete burning of the part in a blast furnace, generating an impact but not adding any significant variation in the comparison of the final result, as it is almost the same value.
3.3. Data Quality and Collection
This work was conducted at the National Laboratory of Welding Technology (LNTSold) and the Air Pollution Control Laboratory (LCPA), both located at the Technology Centre of the Federal University of Rio de Janeiro, Brazil. The experimental data on the production of the part using the additive manufacturing method were obtained at the LNTSold, and the secondary data were obtained through bibliographical research, the collection provided by the software [19], calculations, and models carried out in the LCPA using ISO 14044 [24] as a reference.
AWS ER90S-B3 (ER-90) carbon steel is a low-alloy metal and was chosen for its high structural resistance to pressure and high temperatures, as well as its ability to be used in various combinations with other steels, such as chromium-molybdenum steel (2.25% Cr–1% Mo) and carbon steel. According to the American Welding Society (2005) Standard A5.28/A5.28M [45], the composition of the welding material must be specified as a percentage of the metal constituent materials. The chemical composition determines whether a material has the characteristics required for use in certain industrial processes. The metal was purchased from American Lincoln Electric© (Cleveland, OH, USA) [46], and its composition is in Table 1.

Table 1.
Chemical composition of ER-90 supplied by Lincoln Electric Global, Inc.
3.3.1. Material Extraction (Stage 1)
In stage 1, data from the ECOINVET 3.11 library were used, and calculations were performed using SIMAPRO software. When defining a process in the software, it was necessary to enter values for each input stream, and the output streams were provided by the program itself. The libraries referenced for the production of ER-90 were ‘Low Alloy {RoW} Steel Production, Electric, Low Alloy Allocation Default, Unit’ and ‘Low Alloy {RoW} Steel Production, Converter, Low Alloy Default, Unit’, adding the components described in Table 1. The inputs for the Electric Production and Combustion libraries were obtained from the ECOINVENT 3.11 library [19].
Two distinct furnace types are employed during the metal production process: The Electric Arc Furnace (EAF) and the Blast Oxygen Furnace (BOF). The BOF is used for the smelting of metal ore, recycled materials, and scrap, whereas the EAF is exclusively applied to recycled metal and scrap [47]. It was considered that each contributed equally, with 0.5 kg of metal produced per furnace for every 1.0 kg of total metal output.
The energy consumption per kilogram, as determined by SIMAPRO, was approximately 17.6 MJ/kg. There was no material loss at this stage, as all the raw metal extracted was transported to the next stage. The atmospheric emissions generated were calculated by the program, taking into account the initial weight of the material. The value for greenhouse gas (GHG) emissions was obtained from the World Steel Association’s 2023 Steel Industry Performance Sustainability Indicators report, with an average value of 1.91 tonnes of CO2 per tonne of crude steel castings produced by the industries [28]. Conversion to kilograms gives a 1:1 ratio of 1.91 kg CO2 equivalent per kg of crude steel.
The global average calculation performed by the WSA is based on the sum of the CO2 emission intensities, taking into account the intensity of gas production from the processing of iron in BOFs, scrap, and recycled metal in EAFs, with their respective percentages of total production. Equation (1) shows how the emissions in the three processes were calculated, and Table 2 shows the corresponding parameters [28].
where:
Table 2.
Parameters of global CO2 emissions obtained from the WSA [28].
- EMCO2 = Intensity of global CO2 emissions (kg CO2-eq);
- BFCO2 = CO2 intensity of steel in the BOF (CO2-eq);
- PBOF = Share of steel in global BOF production (%);
- SpCO2 = Scrap CO2 intensity in the EAF (CO2-eq);
- PSP = Share of EAF steel scrap in global production (%);
- DRICO2 = CO2 intensity of recycled metal in the EAF (CO2-eq);
- PDRI = Share of recycled metal in EAF steel in global production (%).
Even using the WSA report, the emissions calculations were carried out by SIMAPRO for all stages 1 and 2. The WSA reference served as a real proof of the results obtained by the author when entering the data into the software for the metal extraction stage, where hot rolling and wire drawing were later performed using the data provided by the software.
3.3.2. Hot Rolling (Stage 2)
Once the material is extracted, the next stage is hot rolling. In this stage, the LCA considered using the same software and library to calculate the environmental impact factors and their respective magnitude, with the reference “Hot rolling, steel/hot rolling, steel/Cut-off, Unit”. As in the previous stage, the relevant values for each operation were used based on the concepts of ISO 14044. These values were then converted from the library inputs to the functional units to simplify the calculation of results and present the environmental impacts studied more clearly.
The energy consumed by the software was about 25.5 MJ/kg. PRIARONE [33] found a value close to 20.7 MJ/kg using the proprietary library (CES Selector v.17.2.0) of another software known as GRANTA Design. KHALID [48] carried out studies at the rolling stage and found approximately 25.3 MJ/kg, confirming the reliability of this study. These values were also confirmed in the previous extraction stage.
Regarding the 227.0 kg functional unit used in the subsequent manufacturing stages, the software showed a loss of residue in its calculations. Therefore, when this value reached the next stage, it suffered a loss of mass. To determine this loss, SIMAPRO calculated 1.0 kg of metal and obtained a loss of 0.149 kg. Taking into account this loss of 1.0 kg, 39.74 kg was found for the 227.0 kg.
Therefore, the weight used as a reference for the impacts in the extraction (where there were no losses) and rolling stages was 266.74 kg, considering the initial weight of the material. As there was no data on the initial extraction weight, only on when the material was acquired by the laboratory, the value was calculated using the software.
3.3.3. Conventional Manufacture
Forging (Stage 3)
The aim of stage 3 of the CM forging process was to change the shape of the material into an ingot by applying pressure to its surface at a certain temperature. The hot forging process was used not only because of the physical properties of low-alloy metals but also because of their mass use in production [49].
The environmental impact of producing a closed-die mould is significant. It is necessary to consider the extraction of the material from the mould, it’s possible rolling processes, and the CNC machining to define its shape, categorising a new LCA. Its impact is applied to the first part produced, as there is no need to make new moulds for the other parts unless the part requires a different or adapted geometry. Therefore, there is no need to calculate the impact of the mould. The mould used in the study was not assessed in terms of its manufacture, as it was not adapted for the production of the part in question. Another factor is the lack of data on its manufacture, which makes it difficult to predict its impact. This is due to the fact that a lot of closed forging data is usually kept private at the behest of the companies.
It is important to note that in some works, such as SWORD [31], where the environmental impact generated by the mould is translated into a new cycle, the author uses references to moulds from other bibliographies, but from an open forge. This does not rule out the possible environmental impacts generated by the mould, which would increase energy costs, emissions, and, above all, the waste generated by CM.
Environmental Indicators Calculation
The data and methods used to perform the CM energy calculations were obtained from the experiments performed by YUSUF [32]. The forging data collected by the author were obtained from the UM-7001-LS hydraulic press, which records the variations in temperature, time, and forces applied during the manufacturing process. The procedure involved heating the ingot to 430 °C, then to 480 °C, and finally to 530 °C, at intervals of 60, 90, and 120 min, respectively.
The energy consumption of chemical reagents for drying, degreasing, and conventional recycling processes was obtained from the ECOINVENT 3.11 database, as confirmed by the software in this study. The other measures found relate to five energy processes: furnace (operating at 240 volts); forging (operating at 415 volts); heating (5.337 kWh); hot pressing (6.683 kWh); and equipment in standby mode (0.592 kWh) [19]. Based on this data, the energy consumed per unit mass produced was 45.01 kWh/kg. The weight of the material after losses in the previous rolling process was around 227.0 kg. Since the energy consumed is 45.01 kWh/kg, this value is simply multiplied by the weight at the manufacturing stage, and the result is then converted from kilowatts per hour (kW/h) to megajoules (MJ).
To calculate the waste generated, the amount of waste produced during the conventional forging processes in kg was taken into account. The formula for the waste generated at the end of the process was defined as the initial amount of material produced in stage 2, reduced by the final mass after the manufacturing processes. The formula and methodology for calculating the waste were the same for the CM and AM, and the post-processing of both manufacturers is represented by Equation (2).
where:
- R = Waste generated (kg);
- MF = Final mass (kg);
- MI = Initial mass (kg).
Greenhouse gas (GHG) emissions were calculated using the references from YUSUF [32]. The author measured the Global Warming Potential (GWP) of the CM as a function of temperature and operating time. Subsequently, the statistical software Design-Expert v. 8.0 was used to simulate the emissions using the operating and temperature data to confirm the emissions value in kgCO2-eq/kg.
Using the analysis of variance (ANOVA) model, the author carried out a comparison of the predicted emissions from the CM, relating specific measured GWP values with predictions from the statistical software. The idea behind the experiment was to optimise the GHG emissions, with the values from the experiments being close to the optimised value from the software. The values were close to the stipulated average of 35.59 kg CO2-eq/kg. In this work, the average of the results in kgCO2-eq/kg was used. To calculate the CM emissions, the mass of 227.0 kg was multiplied by the average of the results, as shown in Equation (3), and the collected values are shown in Table 3.
where:
Table 3.
Forging stage emission parameters.
- EMMC = GHG emissions from conventional manufacturing (kgCO2-eq);
- X = GWP experiment value (kgCO2-eq/kg);
- n = Number of trials;
- M = Mass of metal to be manufactured (kg).
3.3.4. Additive Manufacturing Data
Wire Drawing (Stage 5)
After the hot-rolling stage, the diameter of the bars was reduced to the ideal size for the chosen structure in the wire-drawing stage. At this point, the 3D printing process begins using arc welding and shielding gas to melt the metal and deposit it layer-by-layer according to the software specifications. The final stage involves CNC machining to remove imperfections in the part structure and polishing to produce the final part. Before entering the welding machine, the ER-90 wire undergoes a wire-drawing process by pulling the bar created in the hot-rolling stage through a die with a smaller orifice to reduce its thickness to 1.2 mm. Its AWS A5-2B classification, properties, supplier, and format are shown in Figure 5.
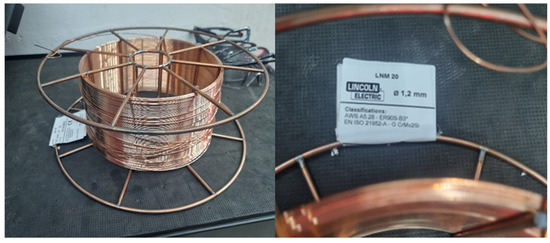
Figure 5.
Er-90 wire produced after the drawing stage reduces the diameter of the Stage 2 bar.
The drawing impact data were calculated using the SIMAPRO software with the corresponding base library “Wire drawing, steel {RoW} | Alloc Def, Unit”. The reference used takes into account the substitution of the standard metal for the ER-90 values previously calculated and is based on the evaluation of the corresponding mass, energy used (15.6 MJ/kg presented by the software), and emission categories [46].
Wire-Arc Directed Energy Deposition (DED) (Stage 6)
After stage 5 of the drawing process, the metal was sent to the WAAM. Before being deposited in the printing equipment, it was configured in Solid Works 3D software, defining the dimensions of the part in CAD format. The software was selected because it offers specific functions for metal sheets and moulds, providing a seamless integrated workflow for the robot. The file was sent to the KUKA KR 210 R2700 jointed-arm robot to initiate the printing commands with an operating power of 3.5 kW and an idle power of 42.6 W. The robotic equipment used is illustrated in Figure 6.
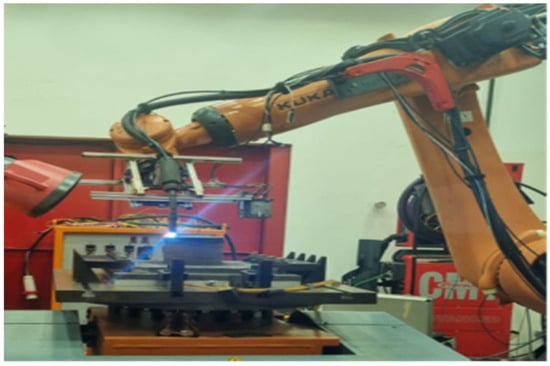
Figure 6.
Welding robot used in deposition layer-by-layer in the WAAM process, KUKA model.
The KUKA robot is an articulated spherical model with rotating joints and respective degrees of freedom. It was chosen for welding due to its mobility, which is similar to that of a human arm. This allows for flexibility in printing complex parts and positioning, as well as good integration with Solid Works 3D. The robot was fuelled with ER-90 wire and cylinders of shielding gas with concentrations of 92% argon and 8% CO2. Six 10 m3 cylinders were used with a pressure of 190 bar, an outlet pressure of 10 bar, and a tank temperature of 21 °C. The GHG emission factor for CO2 was obtained from the software data [19]. For argon, although it is an inert gas and not considered a GHG, an emission factor was applied to its production. The machine specifics and stages before the final print can be seen in the Supplementary Materials file in the topic S2.1 [50].
Environmental Indicators Calculation in Stage 6
To determine the primary energy value for the process, it was assumed that the equipment supplied the energy used during the idle time, deposition time, and dwell time, as well as the energy from consumables such as shielding gas.
The energy calculation equation took into account a constant from the energy network of the distribution network (N = 0.34), as well as the energy consumed by the machinery, heating system, protection gas, and the time of use and standby. Equation (4) shows the components required to obtain the primary energy consumed.
where:
- EWAAM = Primary energy from the WAAM process (MJ);
- N = Primary electrical energy conversion coefficient;
- Pstb = Standby energy from the WAAM process of the energy cell (robotic arm and the welder’s power source) (kW);
- tstb = Standby time and shutdown of the WAAM process component (h);
- SEC = Specific energy consumed during deposition (kWh/kg);
- Mwire = Mass of the wire and its material to be deposited (kg);
- Parc = Wire and arc process energy (kWh/kg);
- tarc = Operating time of the WAAM process component (h);
- Egas = Primary energy of the shielding gas (MJ/l);
- tgas = Protective gas flow time (h);
- qgas = Shielding gas flow rate (L/h).
The parameters considered are primary data from the experiment and refer to the equipment shown in Figure 6. The values obtained by the software provided by the equipment and applied to the energy calculation formula are shown in Table 4 and Table 5, which show the calculations during the equipment’s idle period.
Table 4.
Parameters obtained for energy calculation.
Table 5.
Parameters of the idle periods considered.
To obtain the primary energy of the shielding gas, the formula for the internal energy of a system was used, which is equal to 1.5 multiplied by the pressure (Pa) and volume (m3). With a pressure of 190 bar (19,000,000 Pa) and a tank volume of 10 m3, this results in 258.0 MJ, which is converted to 0.0285 MJ/L.
The CO2 release equation for the system was quantified by first converting the energy consumption found in Equation (4) from MJ to kWh, multiplying the value by the conversion factor (0.2778), multiplying this consumption by the value of the Carbon Emitted Signature (CES) of the electricity grid, and adding the total carbon footprint factor produced by the shielding gas. The calculation for the GHG emissions generated in the DED wire-arc stage is shown in Equation (5).
where:
- EWAAM = Primary energy of WAAM process (MJ);
- CES = Carbon footprint emission factor (kgCO2-eq/kWh);
- CFCO2 = Protective gas GHG emission factor (CO2-eq/kg).
To calculate the carbon footprint, the 2023 Brazilian report by the Ministry of Science and Technology and Innovation (MCTI) [52] was used, taking into account the average of the annual emission factors from 2018 to 2022. Using the terms of the formulae presented and considering that 5.5 cylinders of 10 m3, it was possible to realise the effects of the atmospheric emissions of WAAM (DED). The values for Equation (5) are listed in Table 6.
Table 6.
Parameters used to calculate GHG emissions in WAAM.
3.3.5. Post-Processing of Data from Both Manufacturers
The surface finish of stages 4 and 7 guarantees the quality of the mechanical properties and ease of assembly of the part for its final use. Processes such as electronic polishing, tumbling, sandblasting, and CNC machining are used, depending on the material, to guarantee the quality of the part. The post-processing stage aims to eliminate any imperfections that could affect the properties of the part in use and any wear on its geometry.
In this work, the laboratory chose to use CNC turning to finish the surface of the metal flange. Turning consists of linear and rotational movements of the workpiece, turning it to the chosen diameter and facing it to the desired length. Figure 7 shows the flange on the workpiece during deposition (a) and after machining (b).
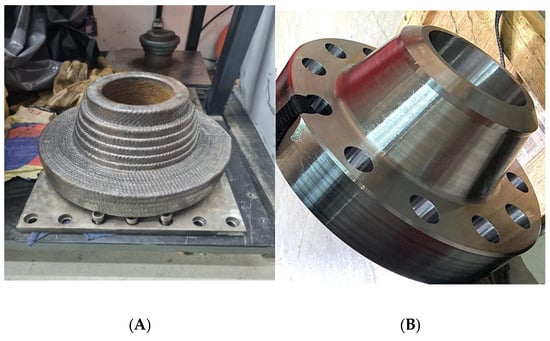
Figure 7.
Flange at the end of MA production (A) and the same piece after post-processing by turning and drilling (B).
Two machines were used to finish the part: the CENTUR 50 for turning and the D-1250 for making the slots, both from ROMI S.A [53]. Both machines offer high flexibility for machining, different geometries, and can be adapted according to the material. Both can change their revolutions per minute (RPM) depending on the application and required precision of the workpiece. Both machine specifics can be seen in the Supplementary Materials file in the topic S2.2 and S2.3.
When the workpiece came out of the forging or deposition stage, it was supported on a plate with four locks, where the head rotated and turned the workpiece. The other stage of drilling the fittings was carried out by the D-1250, which was also used in both factories, after the CENTUR 50. Some values for the calculations include the voltage, current, and RPM of the machines per piece [53].
Post-Processing Environmental Indicator Calculations
For the substrate stage and the post-processing unit, 3 (three) equations are used, based on the methodology proposed by PRIARONE [33]: the electrical energy demanded by the equipment in the standby, cut-off, and operational mode change phases, the energy consumed by the process, and the CO2 produced by the equipment during use.
In order to calculate the energy consumed, it was necessary to determine the specific energy consumed (SEC) and energy demand. The SEC was obtained from the equipment, and Equation (6) was used to calculate the energy demand [33].
where:
- Pstb: Power consumption of the machine in standby mode (kW);
- Ts: Part preparation, clamping, and unloading time (h);
- SEC: Specific energy consumption during cutting (kWh/kg);
- MCi: Mass of material to be removed (kg);
- ttc: Time to change tools (h);
- tc: Cutting time (h);
- T: Tool lifespan (h).
The fraction tc/Ti quantifies the number of changes that need to be made when the equipment is on standby, i.e., the time was calculated in relation to each change made to the equipment. With the energy demand calculated, it was applied to the energy demand equation in order to determine the final value of the energy spent on all post-processing stages. The values for the turning and drilling processes were primarily collected by the LNTSold laboratory, which was responsible for additive manufacturing in this work. Equation (7) shows the energy requirements of the process in MJ.
where:
- EMT: Energy demand (kWh);
- N: Coefficient of conversion of electrical energy to primary energy
- Etool: Embodied energy of the cutting tool (MJ);
- Elub: Embodied energy of the cutting fluid (MJ/kg);
- qL: Cutting fluid consumption rate (kg/h);tc: Cutting time (h).
Equation (7) has a factor of 3.6/N, which is used to convert the energy demand of the equipment from kilowatts per hour (kW/h) to primary energy in megajoules (MJ). Using the energy demand (EMT) calculated in Equation (6), the CO2 (or carbon footprint) was calculated using Equation (8).
where:
- CES: Carbon footprint of the cutting fluid of the electrical grid system(kgCO2/kWh);
- CO2tool: Carbon footprint of the cutting tool (kgCO2);
- CO2lub: Carbon footprint of cutting fluid (kgCO2/kg).
4. Conclusions
This study provided results on the feasibility of using additive manufacturing compared to conventional manufacturing in terms of energy, air pollutants, and waste. The LCA compared both manufacturing processes, from material extraction to production (cradle-to-gate), and showed the impact of the environmental indicators calculated at each stage, which can be reduced or mitigated by considering new proposals in their phases.
New industries have been automating their processes with robotic equipment that promotes speed, cost-effectiveness, and better performance in the production of parts with complex geometries. Life cycle methodologies help in the selection of equipment and processes to suggest improvements from CM to AM. The use of an LCA is encouraged as measuring the magnitude of short- and long-term impacts and visualising a flowchart of all the stages and their respective inputs and outputs will be critical for better decision-making and ensuring that the end product is viable for use and commercialisation.
The primary data reported by the LNTSOLD used a CNC robot, following the vision of technological advancement in the manufacturing industries. The bibliographic reference data of YUSUF and PRIARONE were selected based on modern equipment and calculations that take into account all the stages of 3D printing equipment. The ECOINVENT 3.11 libraries and SIMAPRO lifecycle software make it possible to carry out simulations of the subjects studied, with quality assurance of the questions related to the same subjects.
In terms of energy consumption and atmospheric emissions, the justification for CM being higher than AM is that the processes that use fossil fuels to power the machinery and equipment require high temperatures and kinetic force to form the material into the desired part. Replacing these fuels with biofuels, controlling air pollutants, replacing the power grid, and using additive manufacturing methods would mitigate measures to reduce both energy consumption and emissions.
In terms of waste, ER-90, being a low-alloy metal, can be fully reintroduced into the production line by feeding its residues and chips (from the post-processing stage) into a blast furnace at the initial stage. This concept promotes the Circular Economy and Environmental Symbiosis mentioned in the discussions, offering a sustainable alternative and cooperation between companies in different industries that agree to use the same material.
This study demonstrated the impact of AM on advancing processes that require complexity in the manufacture of different products, especially those carried out in these works. AM has qualities such as flexibility in the material used, greater affordability, and optimisation of manufacturing time, as well as occupying a reduced space with an articulated robot, especially when compared to CM. However, an important negative point related to the production quantity is that a high demand for parts could make the use of CM preferable due to the demand time.
This case study demonstrates how a life cycle assessment can be used to determine which parts of a cradle-to-gate process can be optimised to improve performance and reduce environmental impacts. This assessment considers each input and output of the conventional and additive manufacturing stages. The field of additive manufacturing requires further study in order to continue optimising industrial processes in line with current sustainability concepts.
In addition to showing good results in terms of mechanical properties and corrosion resistance to conventional manufacturing methods, due to the greater microstructural refinement obtained through layer-by-layer production with controlled cooling rates during deposition, additive manufacturing has provided components with a geometry close to the design of the final format, with a reduction in post-processing stages, low solid waste generation, reduced electrical energy and lower GHG emissions throughout the production chain, showing itself to be a promising alternative for sustainable development.
Supplementary Materials
The following supporting information can be downloaded at: https://www.mdpi.com/article/10.3390/recycling10040163/s1, Supplement S1: SIMAPRO software methodology; Supplement S2: Equipment used on stages.
Author Contributions
F.N.C. carried out the calculations, modelling and analysis of experimental data and wrote the manuscript; C.d.S.G. performed the modelling, analysed the results and wrote the manuscript; M.N.d.S.L. carried out the literature review and calculated the results; J.d.C.P.F. obtained the experimental results and revised the manuscript. All authors have read and agreed to the published version of the manuscript.
Funding
This research received no external funding.
Data Availability Statement
Data are available upon request from the authors.
Acknowledgments
All authors of this article acknowledge scholarship support from the Environmental Engineering Program in the Oil, Natural Gas and Biofuels Industry (PRH-17/ANP) and Diego Russo Juliano (senior subsea research engineer) and Shell Brazil Petroleum Ltd. for his invaluable contributions to this work.
Conflicts of Interest
The authors declare no conflict of interest.
References
- Huanga, K.; Wanga, K.; Leec, P.K.C.; Yeung, A.C.L. The impact of industry 4.0 on supply chain capability and supply chain resilience: A dynamic resource-based view. Int. J. Prod. Econ. 2023, 262, 108913. [Google Scholar] [CrossRef]
- Karmakera, C.L.; Al Aziza, R.; Ahmed, T.; Misbauddinc, S.M.; Moktadird, M.A. Impact of industry 4.0 technologies on sustainable supply chain performance: The mediating role of green supply chain management practices and circular economy. J. Clean. Prod. 2023, 419, 138249. [Google Scholar] [CrossRef]
- Rahman, M.S.; Ghoshb, T.; Aurna, N.F.; Kaiser, M.S.; Anannya, M.; Hosend, A.S. Machine learning and internet of things in industry 4.0: A review. Meas. Sens. 2023, 28, 100822. [Google Scholar] [CrossRef]
- Javaid, M.; Haleem, A.; Singh, R.P.; Suman, R. An integrated outlook of Cyber–Physical Systems for Industry 4.0: Topical practices, architecture, and applications. Green Technol. Sustain. 2023, 1, 1000001. [Google Scholar] [CrossRef]
- Hajoarya, P.K. Industry 4.0 Maturity and Readiness—A case of a Steel Manufacturing Organization. Procedia Comput. Sci. 2023, 217, 614–619. [Google Scholar] [CrossRef]
- ASTM F42/ISO TC 261; Develops Additive Manufacturing Standards. ASTM International: West Conshohocken, PA, USA, 2021. Available online: https://www.astm.org/COMMIT/F42_AMStandardsStructureAndPrimer.pdf (accessed on 13 June 2025).
- ASTM F2792-12a; Standard Terminology for Additive Manufacturing Technologies. ASTM International: West Conshohocken, PA, USA, 2012. Available online: https://www.astm.org/f2792-12a.html (accessed on 16 June 2025).
- ASTM International. Committee F42 on Additive Manufacturing Technologies. 2021. Available online: https://www.astm.org/COMMITTEE/F42.htm (accessed on 12 June 2025).
- Ding, D.; Pan, Z.; Cuiuri, D.; Li, H. Wire-feed Additive Manufacturing of Metal Components: Technologies, Developments and Future Interests. Int. J. Adv. Manuf. Technol. 2015, 81, 465–481. [Google Scholar] [CrossRef]
- Xian, G.; Pan, J.; Li, Q. A Comparative Study of Two WAAM Patterns for Structures with Grid Fin Characteristics. Materials 2025, 18, 219. [Google Scholar] [CrossRef]
- Vimal, K.E.; Naveen Srinivas, M.; Rajak, S. Wire arc additive manufacturing of aluminium alloys: A review. Mater. Today Proc. 2020, 41, 1139–1145. [Google Scholar] [CrossRef]
- Kokare, S.; Oliveira, J.P.; Godina, R. A LCA and LCC analysis of pure subtractive manufacturing, wire arc additive manufacturing, and selective laser melting approaches. J. Manuf. Process 2023, 101, 67–85. [Google Scholar] [CrossRef]
- Pusateri, V.; Olsen, S.I. LCA and LCC of wire arc additively manufactured and repaired parts compared to conventional fabrication techniques. Procedia CIRP 2024, 122, 491–496. [Google Scholar] [CrossRef]
- Pusicha, J.; Stromberg, H.; Quanz, M.; Lohrengel, A. Towards an Automated Design Evaluation Method for Wire Arc Additive Manufacturing. Appl. Sci. 2025, 15, 938. [Google Scholar] [CrossRef]
- Sword, J.; Galloway, A.; Toumpis, A. Analysis of Environmental Impact and Mechanical Properties of Inconel 625 Produced Using Wire Arc Additive Manufacturing. Sustainability 2024, 16, 4178. [Google Scholar] [CrossRef]
- Wang, P.; Zeng, J.; Lou, D.; Zheng, W.; Zheng, S.; Chen, B.; Gao, Z. Nonlinear Ultrasonic Characterization of Processing Defects in Arc Additive Manufacturing 316L Stainless Steel. Materials 2025, 18, 805. [Google Scholar] [CrossRef]
- O’Neill, F.; McLaughlin, E.; Ermakova, A.; Mehmanparast, A. Influence of Overloading on Residual Stress Distribution in Surface-Treated Wire Arc Additive-Manufactured Steel Specimens. Materials 2025, 18, 1551. [Google Scholar] [CrossRef]
- Khanna, N.; Wadhwa, J.; Pitroda, A.; Shah, P.; Schoop, J.; Sarıkaya, M. Life cycle assessment of environmentally friendly initiatives for sustainable machining: A short review of current knowledge and a case study. Sustain. Mater. Technol. 2022, 32, e00413. [Google Scholar] [CrossRef]
- Ecoinvent.org. Available online: https://ecoinvent.org/ecoinvent-v3-10/ (accessed on 17 June 2025).
- Mohammed, R.K.; Farzaneh, H. Life Cycle Environmental Impacts Assessment of Post-Combustion Carbon Capture for Natural Gas Combined Cycle Power Plant in Iraq, Considering Grassroots and Retrofit Design. Energies 2022, 16, 1545. [Google Scholar] [CrossRef]
- Meshalkin, V.P.; Zharov, V.P.; Leontiev, L.I.; Nzioka, A.M.; Belozersky, A.Y. Sustainable Environmental Impact Assessment Using Indicators for Sustainable Energy-Intensive Industrial Production. Energies 2023, 16, 3172. [Google Scholar] [CrossRef]
- Silva, M.P.; González, J.; Costa, B.B.F.; Garrido, C.; Soares, C.A.P.; Haddad, A.N. Environmental Impacts of Rainwater Harvesting Systems in Urban Areas Applying Life Cycle Assessment—LCA. Eng 2023, 4, 1127–1143. [Google Scholar] [CrossRef]
- Tasiopoulou, T.; Katsourinis, D.; Giannopoulos, D.; Founti, M. Production-Process Simulation and Life-Cycle Assessment of Metakaolin as Supplementary Cementitious Material. Eng 2023, 4, 761–779. [Google Scholar] [CrossRef]
- ISO 14044:2006-en; Environmental Management—Life Cycle Assessment—Requirements and Guidelines. ISO—International Organization Standardization: Geneva, Switzerland, 2006. Available online: https://www.iso.org/obp/ui/#iso:std:iso:14044:ed-1:v1:en (accessed on 5 August 2025).
- Nuttah, M.M.; Roma, P.; Nigro, G.L.; Perrone, G. Understanding blockchain applications in Industry 4.0: From information technology to manufacturing and operations management. J. Ind. Inf. 2023, 33, 100456. [Google Scholar] [CrossRef]
- Segovia-Guerrero, L.; Baladés, N.; Gallardo-Galán, J.J.; Gil-Mena, A.J.; Sales, D.L. Additive vs. Subtractive Manufacturing: A Comparative Life Cycle and Cost Analyses of Steel Mill Spare Parts. J. Manuf. Mater. Process. 2025, 9, 138. [Google Scholar] [CrossRef]
- de Eicker, M.O.; Hischier, R.; Hurni, H.; Zah, R. Using non-local databases for the environmental assessment of industrial activities: The case of Latin America. Environ. Impact Assess. Rev. 2010, 30, 145–157. [Google Scholar] [CrossRef]
- Worldsteel.org. Available online: https://worldsteel.org/wp-content/uploads/Sustainability-indicators-report-2023.pdf (accessed on 22 January 2025).
- Guangjun, C. The problem and energy-saving of reheating furnace. Energy Metall. Industry 2008, 27, 32–35. [Google Scholar]
- Ke, H.L.; Dong, B.; Ye, B. Research and application of slab heating curve in reheating furnace. Metall. Ind. Autom. 2014, 38, 50–55. [Google Scholar]
- Sword, J.I.; Galloway, A.; Tompis, A. An environmental impact comparison between wire+ arc additive manufacture and forging for the production of a titanium component. Sustain. Mater. Technol. 2023, 36, e00600. [Google Scholar] [CrossRef]
- Yusuf, K.; Lajus, M.; Ahmad, A. Multiresponse Optimization and Environmental Analysis in Direct Recycling Hot Press Forging of Aluminium AA6061. Materials 2019, 12, 1918. [Google Scholar] [CrossRef]
- Priarone, P.C.; Campatelli, G.; Montevecchi, F.; Venturini, G.; Settineri, L. A modelling framework for comparing the environmental and economic performance of WAAM-based integrated manufacturing and machining. CIRP Ann. 2019, 68, 37–40. [Google Scholar] [CrossRef]
- O’brien, R.G. A general ANOVA method for robust tests of additive models for variances. J. Am. Stat. Assoc. 1979, 74, 877–880. [Google Scholar] [CrossRef]
- Seinfeld, J.H.; Pandis, S.N. Atmospheric Chemistry and Physics: From Air Pollution to Climate Change, 3rd ed.; John Wiley & Sons: Hoboken, NJ, USA, 2016; pp. 18–264. [Google Scholar]
- Chen, M.; Zeng, Y.; Wang, H. PTFE foam coating ultrafine glass fibber composite filtration material with Ultra-Clean emissions. Sep. Purif. Technol. 2025, 352, 128219. [Google Scholar] [CrossRef]
- Bourtsalas, A.C.; Papadatos, P.E.; Kiskira, K.; Kalkanis, K.; Psomopoulos, C.S. Ecodesign for industrial furnaces and ovens: A review of the current environmental legislation. Sustainability 2023, 15, 9436. [Google Scholar] [CrossRef]
- Raj, M.P.; Kumar, M.; Pramanick, A.K. Yield improvement in hot forging of differential spider. Mater. Today Proc. 2020, 26, 3107–3115. [Google Scholar]
- Davis, J.R. (Ed.) ASM Specialty Handbook: Cast Irons; ASM International: Almere, The Netherlands, 1996. [Google Scholar]
- Bello, K.A.; Maladzhi, R.W. Innovative and Best Practices in Sustainable Strategies for Waste Reduction in Additive Manufacturing. Hybrid. Adv. 2025, 11, 100527. [Google Scholar] [CrossRef]
- Ferreira, I.A.; Godina, R.; Carvalho, H. Waste valorisation through additive manufacturing in an industrial symbiosis setting. Sustainability 2020, 13, 234. [Google Scholar] [CrossRef]
- Kieback, B.; Neubrand, A.; Riedel, H. Processing techniques for functionally graded materials. Mater. Sci. Eng. A 2003, 362, 81–106. [Google Scholar] [CrossRef]
- Dass, A.l.; Moridi, A. State of the art in directed energy deposition: From additive manufacturing to materials design. Coatings 2019, 9, 418. [Google Scholar] [CrossRef]
- ASTM A182/A182M-21; Standard Specification for Forged or Rolled Alloy and Stainless-Steel Pipe Flanges, Forged Fittings, and Valves and Parts for High-Temperature Service. West Conshohocken, PA, USA: ASTM International, 2021.
- AWS A5.18/A5.18M Specification for Carbon Steel Electrodes and Rods for Gas Shielded Arc Welding; An American National Society; American Welding Society: Miami, FL, USA, 2005; Available online: https://www.webstore.ansi.org/standards/aws/AWSa51818m2005 (accessed on 14 June 2025).
- Lincolnelectric.com. Available online: https://www.lincolnelectric.com/en/Products/er90sb3_gmaw (accessed on 15 June 2025).
- Odabasi, M.; Bayram, A.; Elbir, T.; Seyfioglu, R.; Dumanoglu, Y.; Bozlaker, A.; Demircioglu, H.; Altiok, H.; Yatkin, S.; Cetin, B. Electric arc furnaces for steel-making: Hot spots for persistent organic pollutants. Environ. Sci. Technol. 2009, 43, 5205–5211. [Google Scholar] [CrossRef] [PubMed]
- Khalid, Y.; Wu, M.; Silaen, A.; Martinez, F.; Okosun, T.; Worl, B.; Low, J.; Zhou, C.; Johnson, K.; White, D. Oxygen enrichment combustion to reduce fossil energy consumption and emissions in hot rolling steel production. J. Clean. Prod. 2021, 320, 128–714. [Google Scholar] [CrossRef]
- Ettore, B.F.; Silva, I.B.; Batalha, G.F.; Button, S.T. Plastic Forming of Metals, 6th ed.; EPUSP: São Paulo, Brazil, 1997; pp. 77–87. [Google Scholar]
- Gibson, I.; Rosen, D.; Stucker, B.; Khorasani, M. Binder jetting. In Additive Manufacturing Technologies, 2nd ed.; Springer: Cham, Switzerland, 2021; pp. 237–252. [Google Scholar]
- Jeswiet, J.; Kara, S. Carbon emissions and CESTM in manufacturing. CIRP Ann. 2008, 57, 17–20. [Google Scholar] [CrossRef]
- MCTI gov. Available online: https://www.gov.br/mcti/pt-br/acompanhe-o-mcti/sirene/publicacoes/relatorios-bienais-de-transparencia-btrs/BRA_BTR1_2024_ENG.pdf (accessed on 14 June 2025).
- ROMI. Available online: https://www.romi.com/produtos/tornos-cnc-romi-centur/ (accessed on 28 January 2025).
Disclaimer/Publisher’s Note: The statements, opinions and data contained in all publications are solely those of the individual author(s) and contributor(s) and not of MDPI and/or the editor(s). MDPI and/or the editor(s) disclaim responsibility for any injury to people or property resulting from any ideas, methods, instructions or products referred to in the content. |
© 2025 by the authors. Licensee MDPI, Basel, Switzerland. This article is an open access article distributed under the terms and conditions of the Creative Commons Attribution (CC BY) license (https://creativecommons.org/licenses/by/4.0/).