Article

Selective Ammonium Recovery from Livestock and Organic Solid Waste Digestates Using Zeolite Tuff: Efficiency and Farm-Scale Prospects

1
Department of Environmental and Prevention Science, University of Ferrara, Via Luigi Borsari 46, 44121 Ferrara, Italy
2
Department of Chemical, Pharmaceutical and Agricultural Sciences, University of Ferrara, Via Luigi Borsari 46, 44121 Ferrara, Italy
3
Department of Chemical and Geological Sciences, University of Modena and Reggio Emilia, Via Giuseppe Campi 103, 41125 Modena, Italy
*
Author to whom correspondence should be addressed.
Recycling 2025, 10(4), 137; https://doi.org/10.3390/recycling10040137
Submission received: 28 April 2025 / Revised: 12 June 2025 / Accepted: 4 July 2025 / Published: 8 July 2025

Abstract

Implementing efficient strategies for the circular recovery and reuse of nutrients from wastewaters is mandatory to meet the Green Deal objectives and Sustainable Development Goals. In this context we investigated the use of zeolitic tuff (containing chabazite and phillipsite) in the selective recovery and reuse of N from various anaerobic liquid digestates in view of their implementation in farm-scale treatment plants. We tested the method on three livestock digestates and two municipal organic solid waste digestates. Adsorption isotherms and kinetics were assessed on each digestate, and a large set of parameters, including (i) contact time, (ii) initial NH4+ concentration, (iii) presence of competing ions, (iv) total solids content, and (vi) separation methods (microfiltration and clarification), were considered in the experimental design. Our results showed that the adsorption mechanism can be explained by the Freundlich model (R2 up to 0.97), indicating a multilayer and heterogeneous adsorption, while the kinetic of adsorption can be explained by the pseudo-second-order model, indicating chemical adsorption and ion exchange. The efficiency in the removal of NH4+ was indirectly related to the K+ and total solids content of the digestate. Maximum NH4+ removal exceeded 90% in MSW-derived digestates and 80% within 60 min in livestock-derived digestates at a 5% solid/liquid ratio. Thermodynamic parameters confirmed favorable and spontaneous adsorption (ΔG up to −7 kJ⋅mol−1). Farm-scale projections estimate a nitrogen recovery potential of 1.2 to 16 kg N⋅day−1, depending on digestate type and process conditions. These findings support the application of natural zeolitic tuffs as a low-cost, chemical-free solution for ammonium recovery, contributing to sustainable agriculture and circular economy objectives.

1. Introduction

The world population is expected to reach 10 billion by 2050, with a consequent increase in the food demand and a greater need for fertilizers to sustain crop production [1]. At the same time, the volume of wastewater produced from domestic, industrial, and agricultural sources will also rise [2,3] with an augmented risk of nutrient losses and environmental pollution, which is in contrast to the EU objectives set in the Green Deal. Among these matrices, anaerobic liquid digestates, which are byproducts from biogas production through anaerobic digestion, are a strategic resource with high potential for nutrient recovery and reuse for agricultural purposes [4]. The anaerobic digestion process produces both a liquid and a solid fraction, with both rich in organic compounds and nutrients, such as ammonium (NH4+), phosphorus, and potassium [5,6,7]. The composition of digestates varies greatly, depending on the raw materials used in the anaerobic digestion process. For example, digestates can originate from livestock effluents or from the organic fraction of municipal solid waste (MSW). Among the digestates derived from livestock effluents, their composition can vary depending on the animal species, their diet, breeding techniques, and how the manure is collected and handled. For instance, digestates derived from cattle slurry tend to contain less NH4+ compared to those from pig slurry [8]. When correctly distributed, digestates can serve as organic fertilizers in agricultural soils, enhancing crop yields and reducing the need for synthetic fertilizers, helping farmers to decrease fertilizer costs and improve soil fertility [9,10,11]. Despite their agronomic value, digestates (both from livestock and MSW) pose several environmental challenges [10], including eutrophication caused by nitrogen and phosphorus leaching into water bodies [9,12,13]. Their high carbon and nitrogen content also leads to greenhouse gas (CH4, CO2, and N2O) and ammonia (NH3) emissions, which impairs air quality and ecosystem functioning [14,15,16,17,18]. Additionally, the presence of pathogens in these effluents can contaminate water supplies. To address these issues, the European Union (EU) implemented nitrogen application limits through the Nitrates Directive (91/676/EEC) in 1991, and more recently, the EU-27 introduced some practices and rules for improving water quality and prompting large agricultural enterprises to adopt technologies that mitigate the environmental impact of digestates [19].
Therefore, it is crucial to develop technologies that aim to reduce the nutrient loads before these digestates are released into the environment, mitigating nutrient pollution and its associated environmental impacts [20]. The EU Green Deal aims to reduce nitrogen concentrations in effluents and digestates, limiting NH3, CH4, CO2, and N2O emissions during storage and agricultural distribution, and preventing soil and water contamination [21]. In this context, it becomes crucial to invest in “green” methods that not only reduce nutrient loads but also allow for their recovery and reuse, thus contributing to a circular economy [9,22]. Numerous technologies have been proposed to reduce the nitrogen content in digestates, including vacuum evaporation, ammonia stripping, membrane filtration, biological treatment and adsorption techniques [10]. Although biological nitrification and denitrification can be effective for ammonia removal, their use is limited by the high operational costs required for oxygen supply during the nitrification phase and the need for an external carbon source for denitrification. Furthermore, biological nitrogen removal processes also produce N2O, a particularly potent greenhouse gas, as a by-product [23]. These challenges highlight the need to develop new treatment technologies for wastewater that combine effective nutrient management with nitrogen recovery. A promising methodology proposed for the reduction and recycling of N in these matrices consists of the so-called “Integrated Zeolitite Cycle” (IZC) [24,25]. This method is well known in the scientific literature, and it is based on the use of rocks, specifically volcanic tuffs rich in zeolite minerals, to trap the NH4+ in the effluents [9], separate it from the liquid, and reuse the N-enriched zeolitic tuffs as a soil amendment and slow-release N source for crops in agriculture [26]. Many studies have demonstrated that, once added to the soil, these rocks improve its chemical–physical properties, enhance crop growth, reduce various forms of agricultural pollution, and increase the fertilizer use efficiency [27,28,29,30,31,32,33].
Zeolites are aluminosilicate minerals with an open 3D structure formed by linked tetrahedra of [SiO4]4− and [AlO4]5−, which constitute their primary building units [34]. The replacement of Si4+ by Al3+ induces a negative charge in the zeolite framework, which is compensated by the presence of extra-framework cations (counterions) [34]. These cations can be exchanged by other cationic species present in the surrounding aqueous solution through ion exchange processes [35].
Given that wastewaters are highly heterogeneous matrixes, many studies on NH4+ adsorption focused on synthetic solutions while real wastewaters have been rarely used [36,37,38,39]. In addition, in these studies, zeolitic tuffs, mainly clinoptilolite [39] or chabazite [20], are utilized, while studies using tuffs rich in chabazite and phillipsite are lacking.
Based on the above, to implement the IZC at an industrial scale for the recovery and reuse of nitrogen, it is mandatory to better characterize the behavior of the zeolitic tuff in the specific digestates and determine their ammonium adsorption capacity and adsorption kinetics.
In this paper, we present a series of experiments aiming to characterize the performances of a chabazite–phillipsite zeolitic tuff in the removal of nitrogen from five different liquid digestates, namely raw and clarified MSW, separated and microfiltered swine livestock digestates, and separated cattle livestock digestates. Adsorption isotherms and kinetics have been addressed in each digestate to determine the optimal process parameters and estimate a potential rate of N recovery in a model farm-scale treatment plant, considering the effect of varying the initial NH4+-N concentrations, total solids content, and concentrations of the main competing cations (Na+, K+, Mg2+, and Ca2+).
Despite the growing body of research on ammonium removal from digestates using zeolitic materials, significant gaps remain in understanding the performance of zeolitic tuffs rich in chabazite and phillipsite minerals when applied to real, complex digestate matrices. Moreover, the influence of different pre-treatment methods on adsorption efficiency and kinetics has been scarcely investigated. This study aims to fill these gaps by systematically evaluating the ammonium adsorption capacity and kinetics of a chabazite–phillipsite-rich zeolitic tuff across five different types of livestock and municipal solid waste digestates, including raw and clarified or microfiltered variants. The innovative aspect of this research lies in its comprehensive approach, combining laboratory adsorption experiments with a farm-scale nitrogen recovery estimation, considering competing cations and solids content. The outcomes will provide crucial insights for scaling up the IZC and enhancing sustainable nutrient recovery from diverse digestates.
Besing on the actual knowledge, we hypothesize the following:
(i)
Faster NH4+ adsorption kinetics in digestates with a higher initial NH4+ concentration.
(ii)
A negative effect of total solids content and other ions present in the digestates on the NH4+ adsorption process.
(iii)
A greater reduction in NH4+ in digestates that have undergone preliminary treatment processes, such as clarification and microfiltration.
(iv)
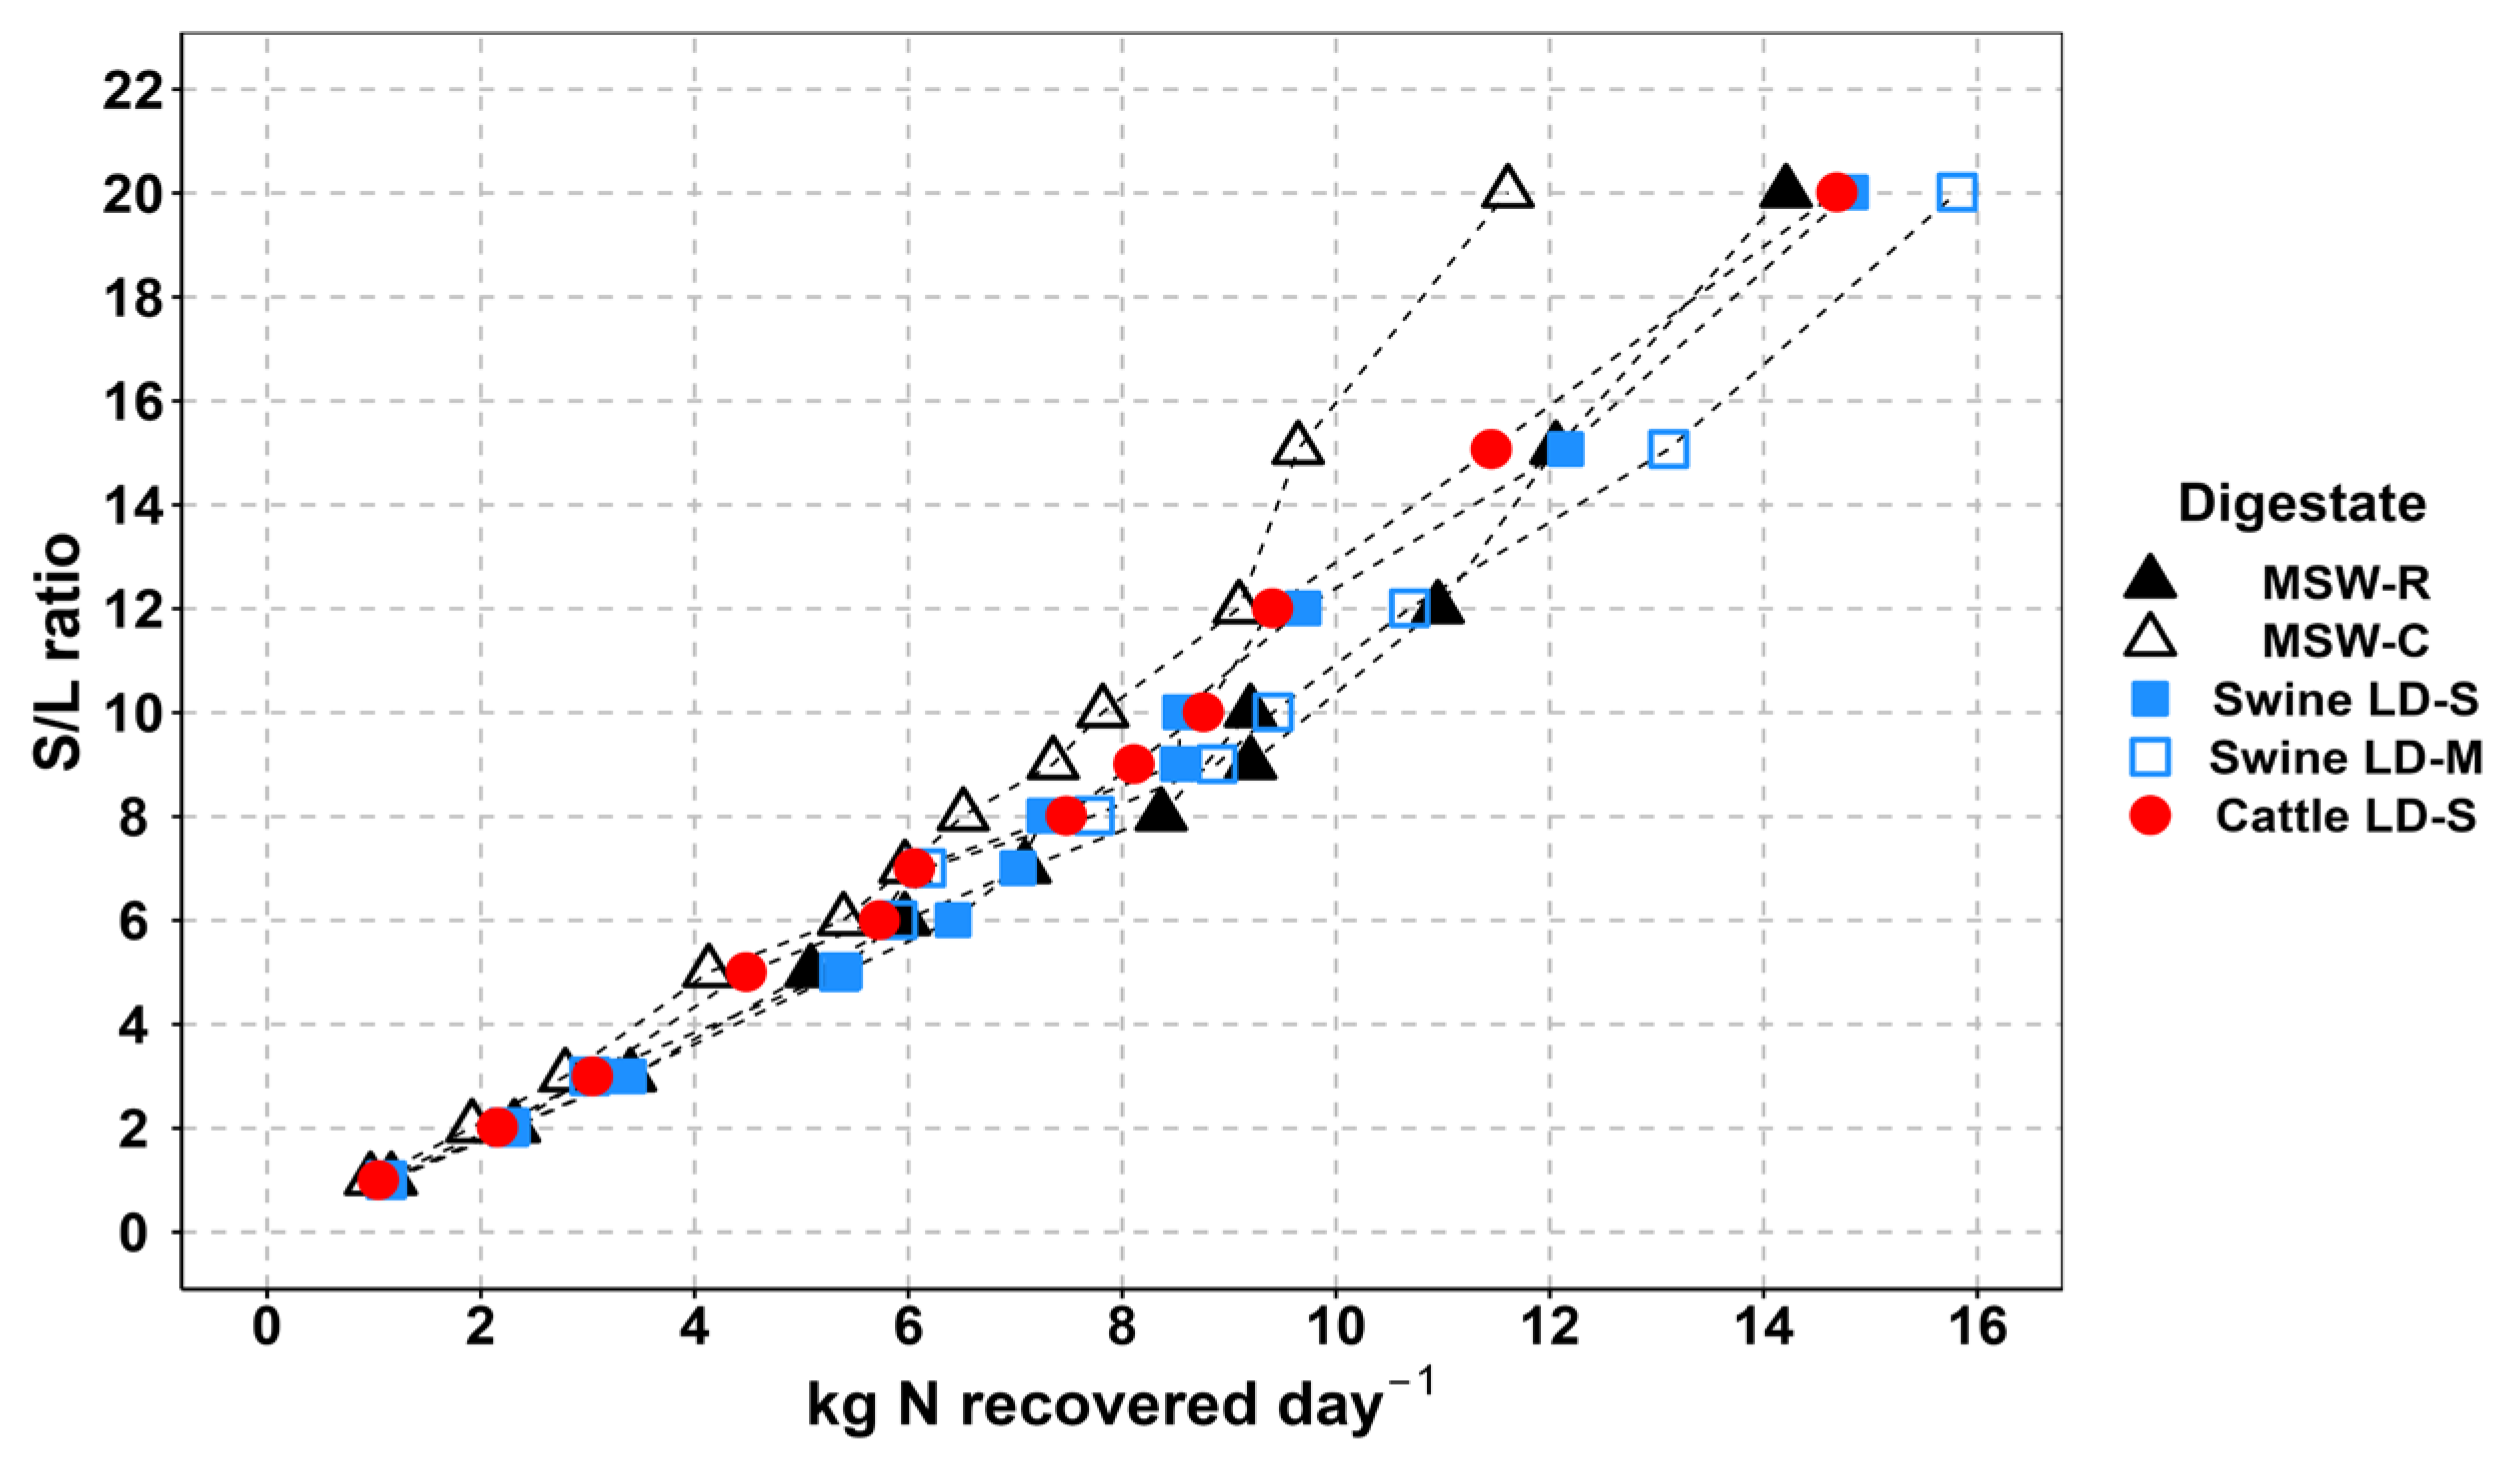
Higher daily nitrogen recovery in digestates with a higher initial NH4+ concentration.

2. Materials and Methods
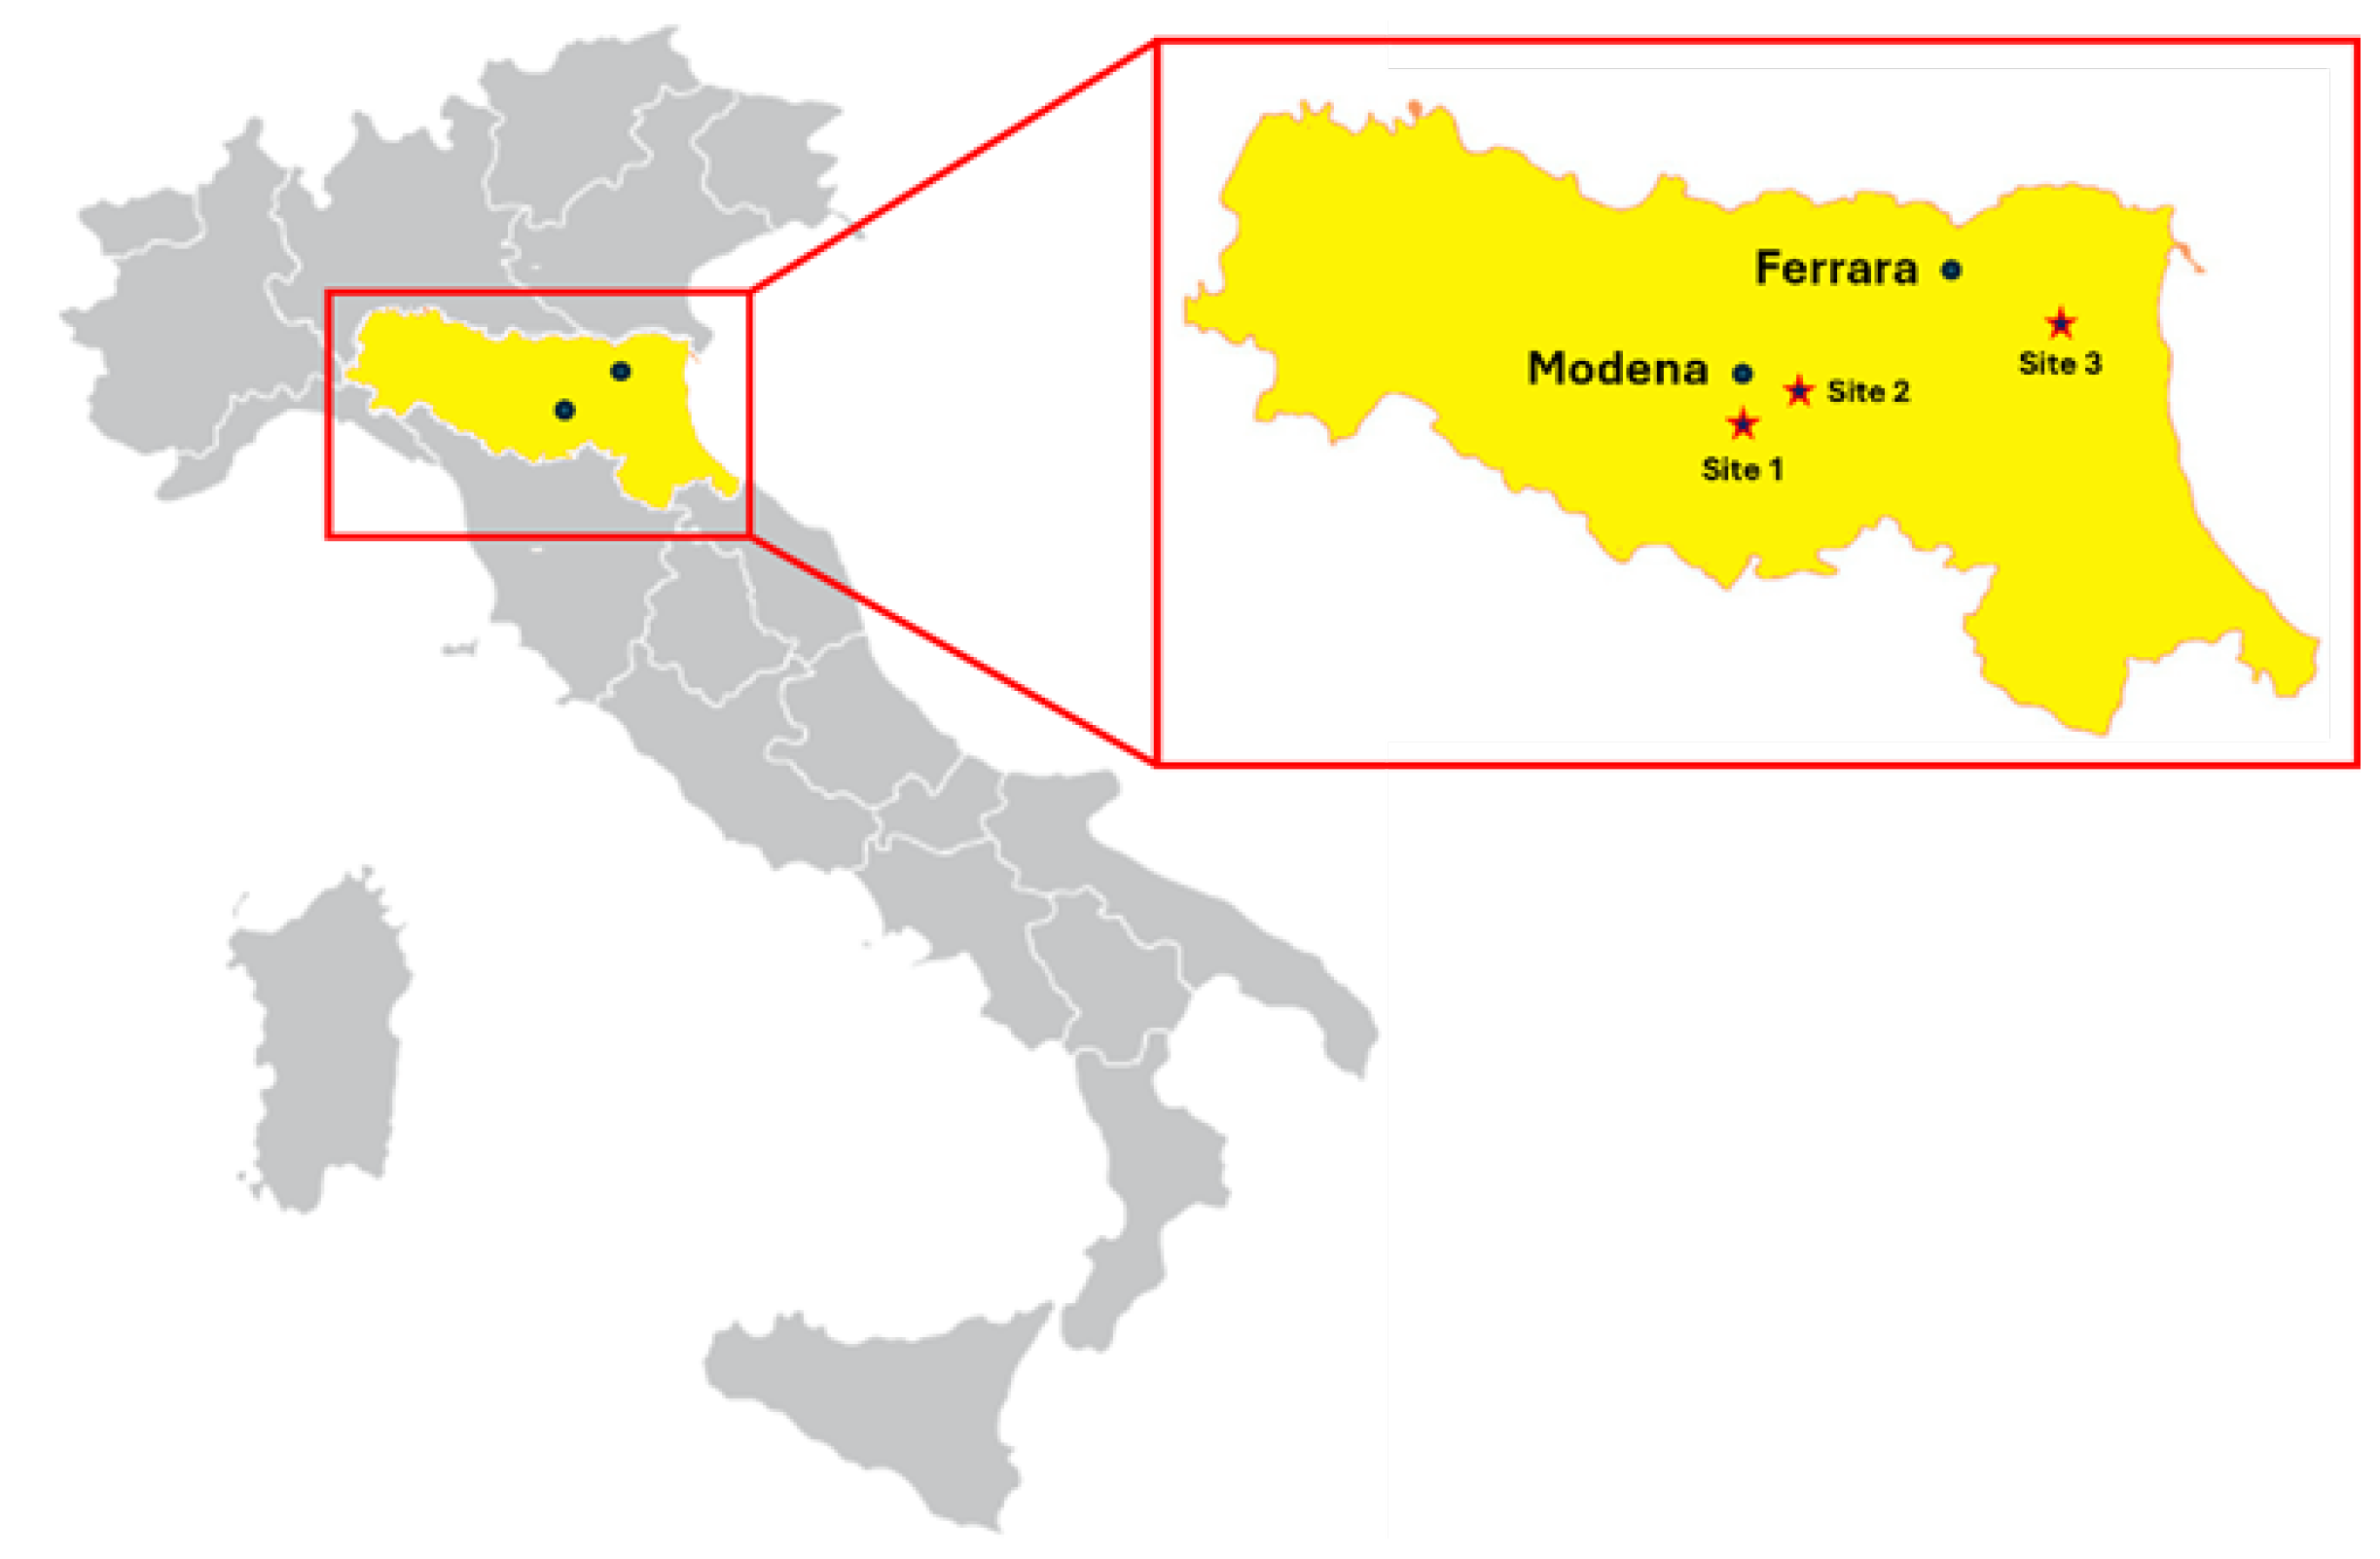
2.1. The Digestate

The chemical characteristics of the digestates used in the experiment are reported in Table 1. Digestates derived from the anaerobic digestion of MSW were sampled near Spilamberto (Modena province, Italy) (Figure 1, Site 1). Two distinct fractions were sampled, namely the raw fraction (MSW-R), corresponding to the liquid phase directly exiting the digester, and the clarified fraction (MSW-C), which underwent a clarification process. This process involved centrifugation, resulting in a final liquid with a reduced concentration of suspended solids. The first livestock-derived digestate was sampled from a swine livestock located near Formigine (Modena province, Italy) (Figure 1, Site 2). Two variants were sampled, namely the separated fraction (Swine LD-S), obtained through a screw press, and the microfiltered fraction (Swine LD-M), which underwent additional microfiltration following the screw compression. Microfiltration was carried out using a 40 MFT SAVECO filter (WAM Group S.p.A., Modena, Italy). The cattle-based digestate, only available in the separated form (Cattle LD-S), was sampled in a biogas plant near San Biagio (Ferrara province, Italy) (Figure 1, Site 3). All digestates exhibited high concentrations of NH4+-N and total solids, particularly those derived from livestock manure. In these digestates—especially the cattle-derived one—a high concentration of K+ was also observed.

2.2. The Zeolitic Tuff

The zeolitic tuff used in this study was sourced from an Italian supplier and commercially marketed as phillipsite, with a particle size range between 0.7 and 2 mm. Its main physicochemical properties were analyzed and are reported in Table 2. Quantitative phase analysis revealed a relatively low total zeolite content of approximately 30%, with a significant presence of amorphous (i.e., glassy) or semi-crystalline phases. Prior to the experiment, the zeolitic tuff was rinsed multiple times with Milli-Q water and dried at 105 °C for 48 h to eliminate residual moisture.

2.3. Analytical Techniques

Electrical conductivity (EC) was measured in digestate samples diluted 1:10 (w/v) using a RS 180-7127 probe (Hanna Instrument, Woonsocket, RI, USA), while pH was measured in undiluted samples using an electrode connected to an 877 Titrino plus (Methrom, Origgio, Italy) automatic titration unit in undiluted samples. Total Kjeldahl N (TKN) was determined after sample digestion with 98% H2SO4 and catalysts tablets (containing TiO2, CuSO4, and K2SO4) using an IR Digester K-425 (Büchi, Flawil, Switzerland). Following digestion, samples were distilled using a K-360 unit (Büchi, Flawil, Switzerland). Ammonia (NH3) was captured in a 4% H3BO3 solution pre-buffered at pH 4.65 ± 0.01. NH4+ was then quantified by endpoint titration using an automatic titrator (877 Titrino Plus, Metrohm, Origgio, Italy) with 0.25 M H2SO4. For direct determination of NH4+-N, the distillation was performed without the digestion step.
Major cations (Na+, K+, Ca2+, and Mg2+) in the digestates were measured by inductively coupled plasma–mass spectrometry (ICP-MS) using a Thermo Electron Corporation X series mass spectrometer (Thermo Fisher Scientific, Bremen, Germany) Samples were diluted 1:500, filtered through 0.45 μm PTFE syringe filters, and stabilized with 2% HNO3 to pH < 2. Total solids (TS) content was determined gravimetrically by measuring the weight loss of a known sample volume after overnight drying at 105 °C.
The chemical composition of the zeolitic tuff was determined by X-ray fluorescence (XRF) on pressed powder pellets using a wavelength-dispersive automated ARL Advant’X spectrometer (Thermo Scientific, Waltham, MA, USA). The accuracy and precision for major elements were better than 3% for Si, Ti, Fe, Ca, and K, and within 7% for Mg, Al, Mn, and Na. For trace elements (above 10 ppm), accuracy and precision were within 10%.
The mineralogical composition of the zeolitic tuff was determined by X-ray diffraction (XRD) using a Philips X’Pert PRO diffractometer (Panalytical, Malvern, UK) equipped with a first-generation real-time multiple strip detector. The incident beam used a Cu anode with Kα radiation at 40 kV and 40 mA; Soller slits were set at 0.02 rad, and both anti-scatter and divergence slits were set at 1/4°. The diffracted beam path included a 5.0 mm anti-scatter mask and 0.02 rad Soller slits, with an integration time of 240 s in continuous scan mode (a scan length of 2.12° 2θ, corresponding to a step size of 0.0170° 2θ per second). Data were collected over a 5–90° 2θ range. Quantitative phase analyses were performed using the Rietveld method implemented in the GSAS software with the EXPGUI interface, following the protocol described in [41]. NIST SRM 676a (alumina powder, corundum structure) was used as the internal standard and for instrument calibration.

2.4. Experimental Setup

2.4.1. NH4+-N Adsorption Isotherm

To evaluate the NH4+-N equilibrium adsorption properties in the different digestates, isotherms were conducted at 25 °C. Sixteen different solid-to-liquid (w/v S/L) ratios—defined as the percentage of zeolitic tuff relative to the digestate volume—were tested, ranging from 1% to 50%. For each test, different amounts of zeolitic tuff were added to 80 mL of digestate in closed 100 mL plastic bottles, which were shaken at 200 rpm in an orbital shaker for 24 h to ensure equilibrium. To account for possible ammonia stripping or NH4+ adsorption onto the plastic surfaces, blank samples (digestate only) were prepared and treated under the same conditions. After shaking, NH4+-N concentrations were immediately measured in the liquid phase. The equilibrium adsorption capacity of NH4+-N (qe, mg⋅g−1) was calculated using the following Equation (1) [39]:
q e = C 0 C 0 C b C e × V m
where C0 (mg⋅L−1) is the initial NH4+-N concentration, Cb (mg⋅L−1) is the NH4+-N concentration in blanks after 24 h, Ce (mg⋅L−1) is the equilibrium concentration, V (L) is the volume of digestate, and m (g) is the mass of zeolitic tuff.
The NH4+-N removal efficiency (RE%) was determined using the following Equation (2) [42]:
R E % = ( C 0 C e ) C 0 × 100
where C0 (mg⋅L−1) is the initial NH4+-N concentration and Ce (mg⋅L−1) is the equilibrium concentration.
As widely reported, NH4+ adsorption by zeolites is generally unaffected by pH in the range of 2–8 but decreases significantly at pH values above 9 [20,43]. Since the pH of all the investigated digestates was in the range of 7.7–8.5, the effect of pH was not investigated in this study to minimize chemical inputs and maintain process scalability.
Various isotherm models have been proposed in the literature to describe NH4+-N adsorption on zeolites [20,39,43,44,45,46,47,48,49,50]. Among them, the Langmuir and Freundlich models have been most commonly used and were, therefore, selected for this analysis. Isotherm data were fitted using R Studio software (version 2023-3.0-386) [51] with the PUPAIM package (version 0.3.1) [52]. Model performance was evaluated based on the coefficient of determination (R2), Akaike information criterion (AIC), and p-values [20]. As noted by [53], nonlinear models provide more accurate parameter estimates; therefore, the parameters of both models were determined using their nonlinear forms.
The Freundlich model describes the equilibrium relationship in the case of multilayer adsorption with heterogeneous materials [54] and is expressed by the following Equation (3) [53]:
q e = K F C e 1 / n
where KF is the Freundlich constant (mg⋅g−1⋅ L⋅g−1)1/n), Ce is the equilibrium concentration (mg⋅L−1), and n is a constant that depends on the nature of the adsorbate, the adsorbent, and the temperature.
The Langmuir model, on the other hand, assumes monolayer adsorption on a surface with a finite number of identical and energetically uniform sites. Its nonlinear form is given by the following Equation (4) [53]:
q e = q m a x K L C e 1 + K L C e
where qe is the equilibrium adsorption capacity (mg⋅g−1), KL is the Langmuir constant (L⋅mg−1), Ce is the concentration at equilibrium (mg⋅L−1), and qmax is the maximum adsorption capacity (mg g−1).
To assess the favorability of adsorption, the separation factor (RL) was calculated using the following Equation (5) [55]:
R L = 1 1 + K L C 0
If RL > 1, adsorption is unfavorable; if RL = 1, adsorption is linear; if 0 < RL < 1, adsorption is favorable; and if RL = 0, adsorption is irreversible. In summary, the lower the value, the more favorable the adsorption.
As reported by [20,39,49,56], to determine whether the adsorption process is spontaneous, the Gibbs free energy (ΔG, kJ⋅mol−1) was calculated using Equation (6) [57]. Negative ΔG values indicate a spontaneous and energetically favorable process. Equation (6) is as follows:
G = R T l n K e
where R is the gas constant (8.314 J⋅mol−1⋅K−1), T is the temperature (K), and Ke is the thermodynamic equilibrium constant, calculated using the following Equation (7) [58]:
lim C e 0 ( q e C e ) = K e
This value is obtained by plotting qe/Ce against Ce and extrapolating the intercept as Ce approaches zero.

2.4.2. NH4+-N Adsorption Kinetics

The aim of this test was to evaluate the adsorption kinetics of NH4+-N on zeolitic tuff at 25 °C in each of the investigated digestates. Understanding adsorption kinetics is crucial for the design of practical treatment systems. For each test, a specific amount of zeolitic tuff (corresponding to 5% w/v S/L ratio) was added to 500 mL of digestate and shaken in an orbital shaker at 25 °C at a speed of 200 rpm for 420 min. A 10 mL aliquot was sampled at fixed time intervals (2, 5, 10, 15, 30, 45, 60, 90, 120, 180, 270, 360, and 420 min) and immediately analyzed for NH4+-N concentrations. The cumulative volume loss from sampling was accounted for in subsequent calculations of adsorption capacity over time. A blank test (without zeolitic tuff) was also conducted to evaluate the effect of ammonia volatilization. The time-dependent NH4+-N adsorption capacity (qt, mg⋅g−1) was calculated using Equation (1), replacing qe and Ce with qt and Ct, respectively.
Several kinetic models have been proposed in the literature to describe NH4+-N adsorption kinetics on zeolitic tuff, including the pseudo-first order (PFO), pseudo-second order (PSO), and Elovich models [20,23,39,42,44,45,49,50,56]. Based on previous studies, PFO and PSO models have been found to most effectively describe experimental data and were, thus, selected for this analysis. As suggested by [59], accurate kinetic modeling requires data points significantly before equilibrium; therefore, only data with a fractional uptake F(t) ≤ 0.90 were considered. F(t) was calculated using the following Equation (8):
F ( t ) = q t q e
Experimental data were processed in R Studio (version 2023-3.0-386) using the PUPAK package (version 0.1.1) [60]. Model fitting was evaluated through several statistical indicators, namely root mean square error (RMSE), mean squared error (MSE), Akaike information criterion (AIC), and Bayesian information criterion (BIC). Lower values of these metrics indicate a better model fit.
The nonlinear form of the pseudo-first-order (PFO) model proposed by Lagergren [61] is described by the following Equation (9):
q t = q e 1 e k 1 t
where qe and qt are the adsorption capacities at equilibrium and time t (mg⋅g−1); t is the contact time (min) and k1 is the PFO rate constant (min−1).
The nonlinear form of the pseudo-second-order (PSO) model is given by the following Equation (10):
q t = ( q e ) 2 k 2 t 1 + q e k 2 t
where qe, qt, and t are the same as above, and k2 is the PSO rate constant (g·mg−1·min−1).
Since the PFO and PSO models do not provide information about the diffusion mechanism, the intraparticle diffusion (ID) model [62] was also applied. It is expressed by the following Equation (11):
q t = k I D T 0.5 + C
where qt (mg⋅g−1) is the adsorption capacity at time t (min), kID (mg⋅g−1⋅min0.5) is the intraparticle diffusion rate constant, and C is the intercept of the slope of the curve which is related to the boundary layer thickness. If the line obtained from plotting qt versus T0.5 passes through the origin (C ≈ 0), intraparticle diffusion is considered the rate-controlling step [39]. The appearance of multiple linear regions in the plot indicates a multi-stage diffusion process, where the initial linear portion corresponds to external surface adsorption or macropore diffusion [45,49].

3. Results and Discussions

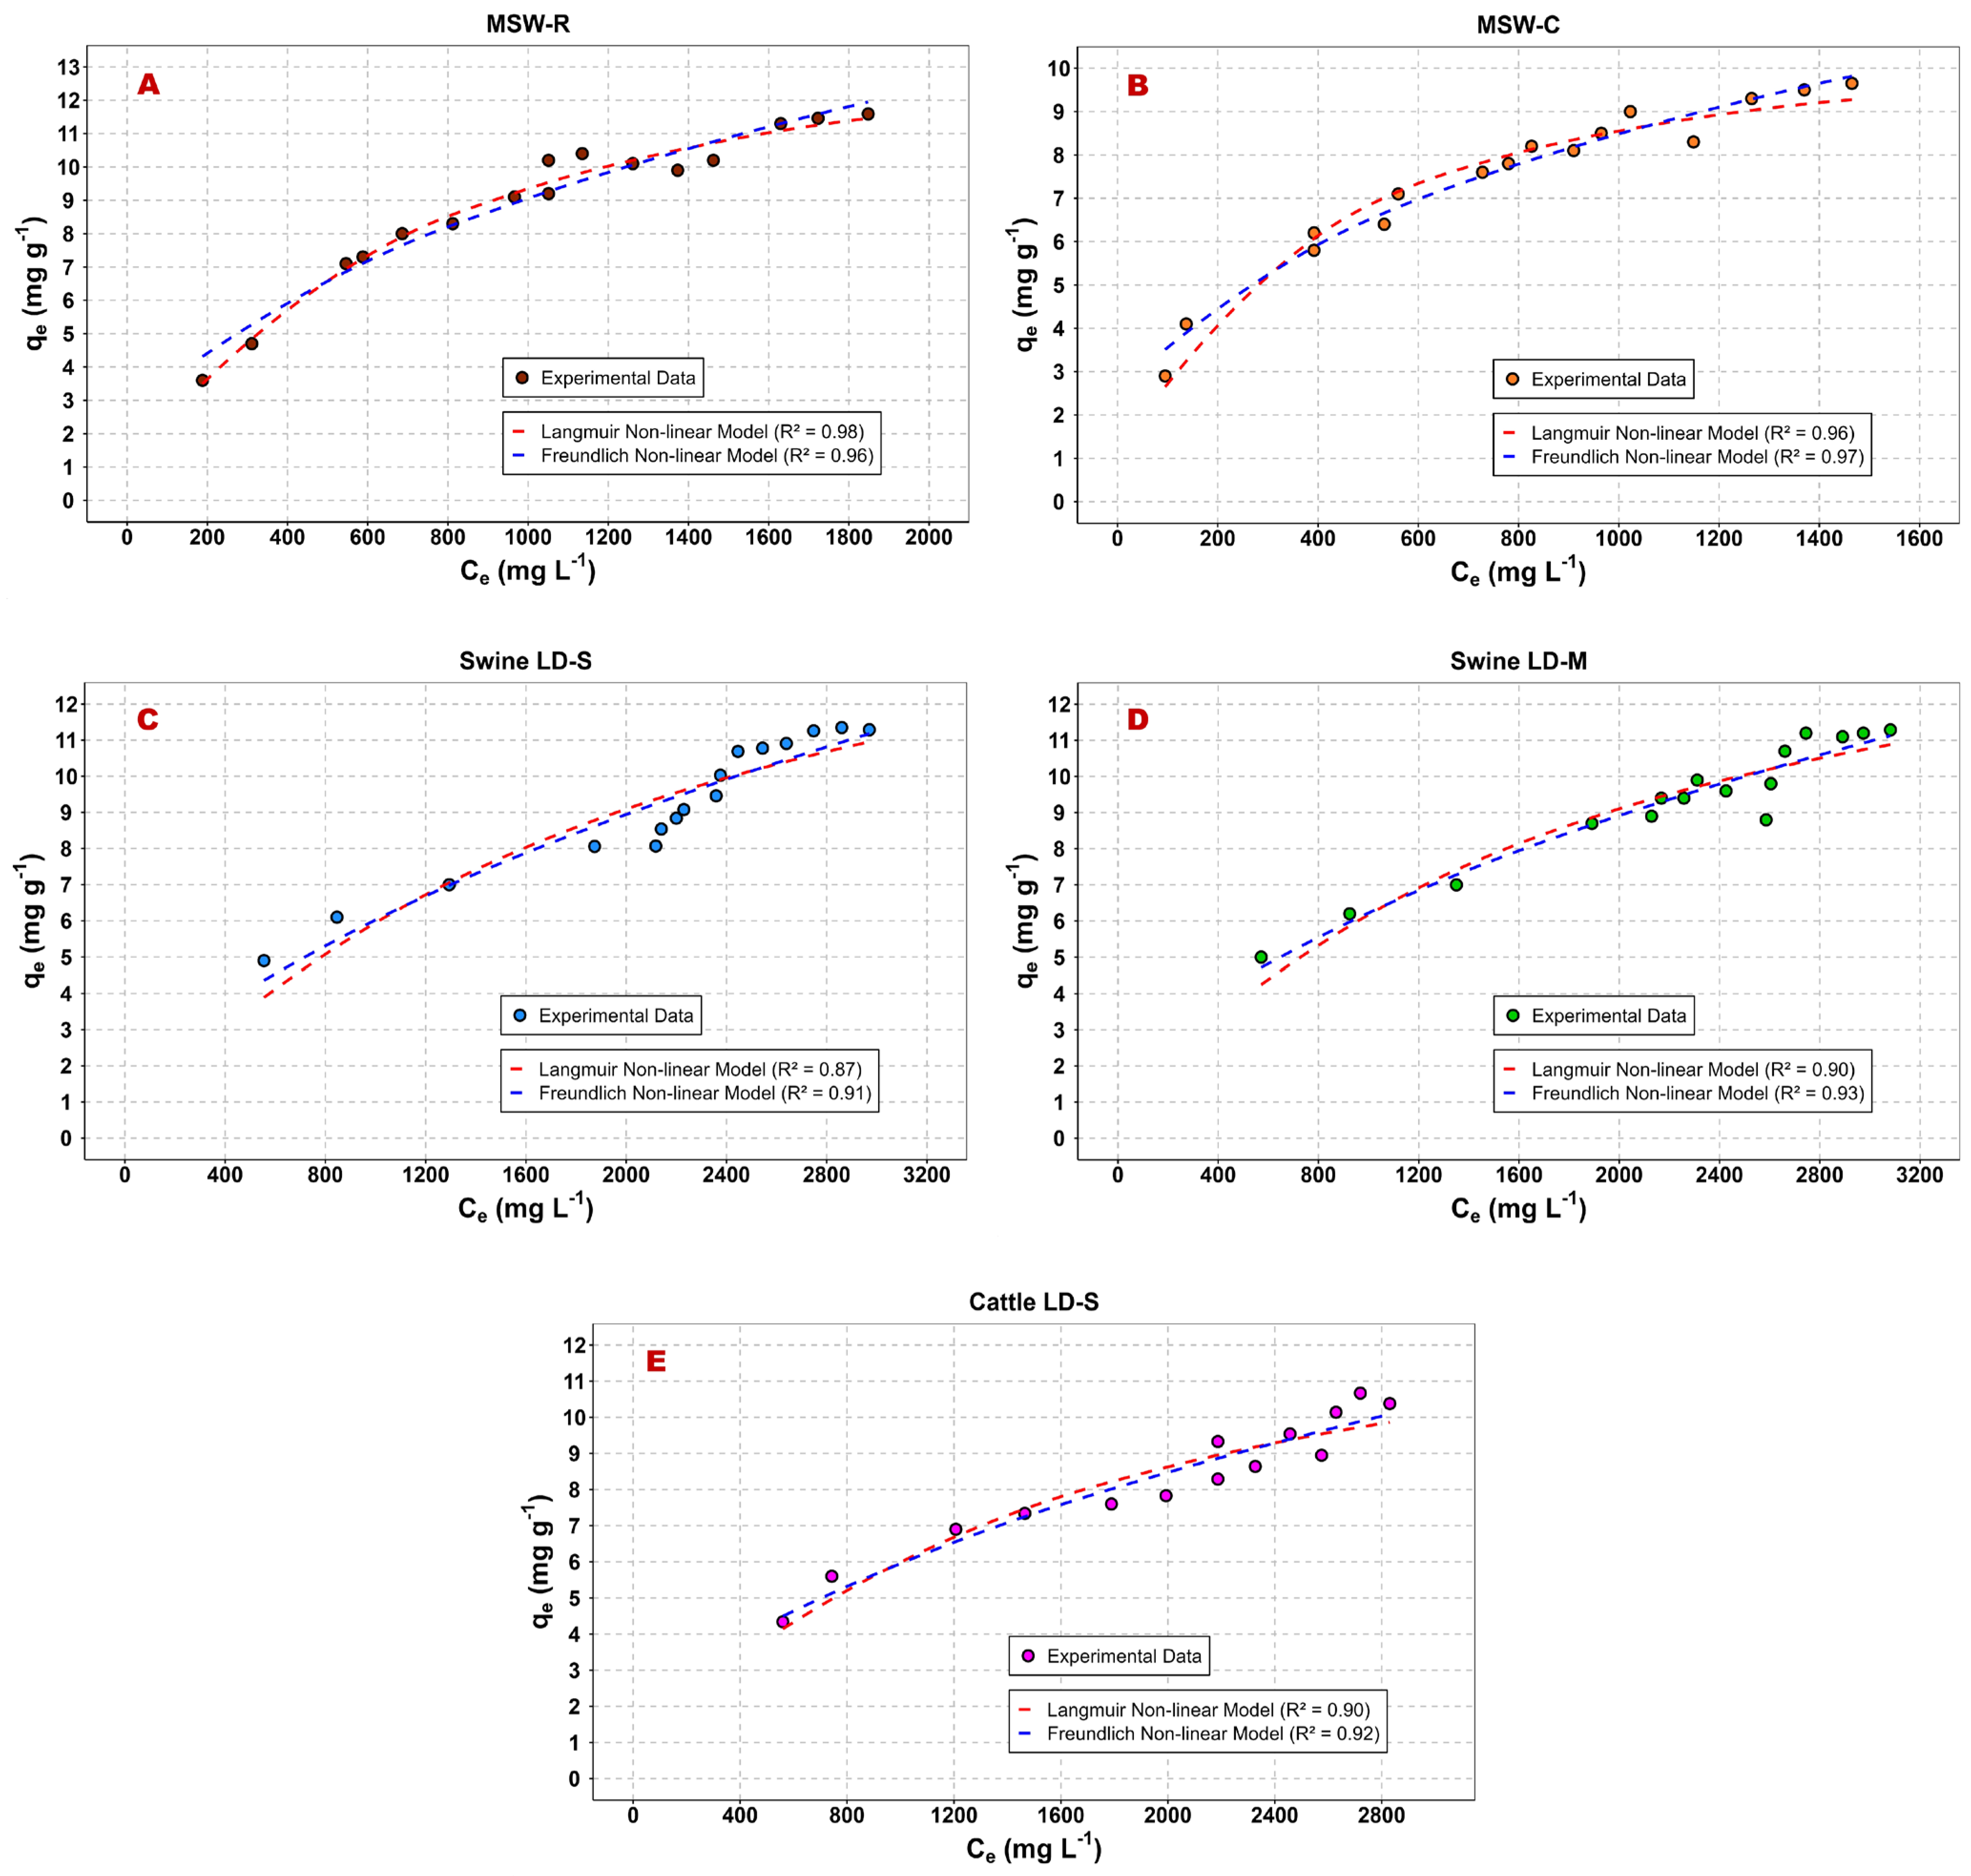
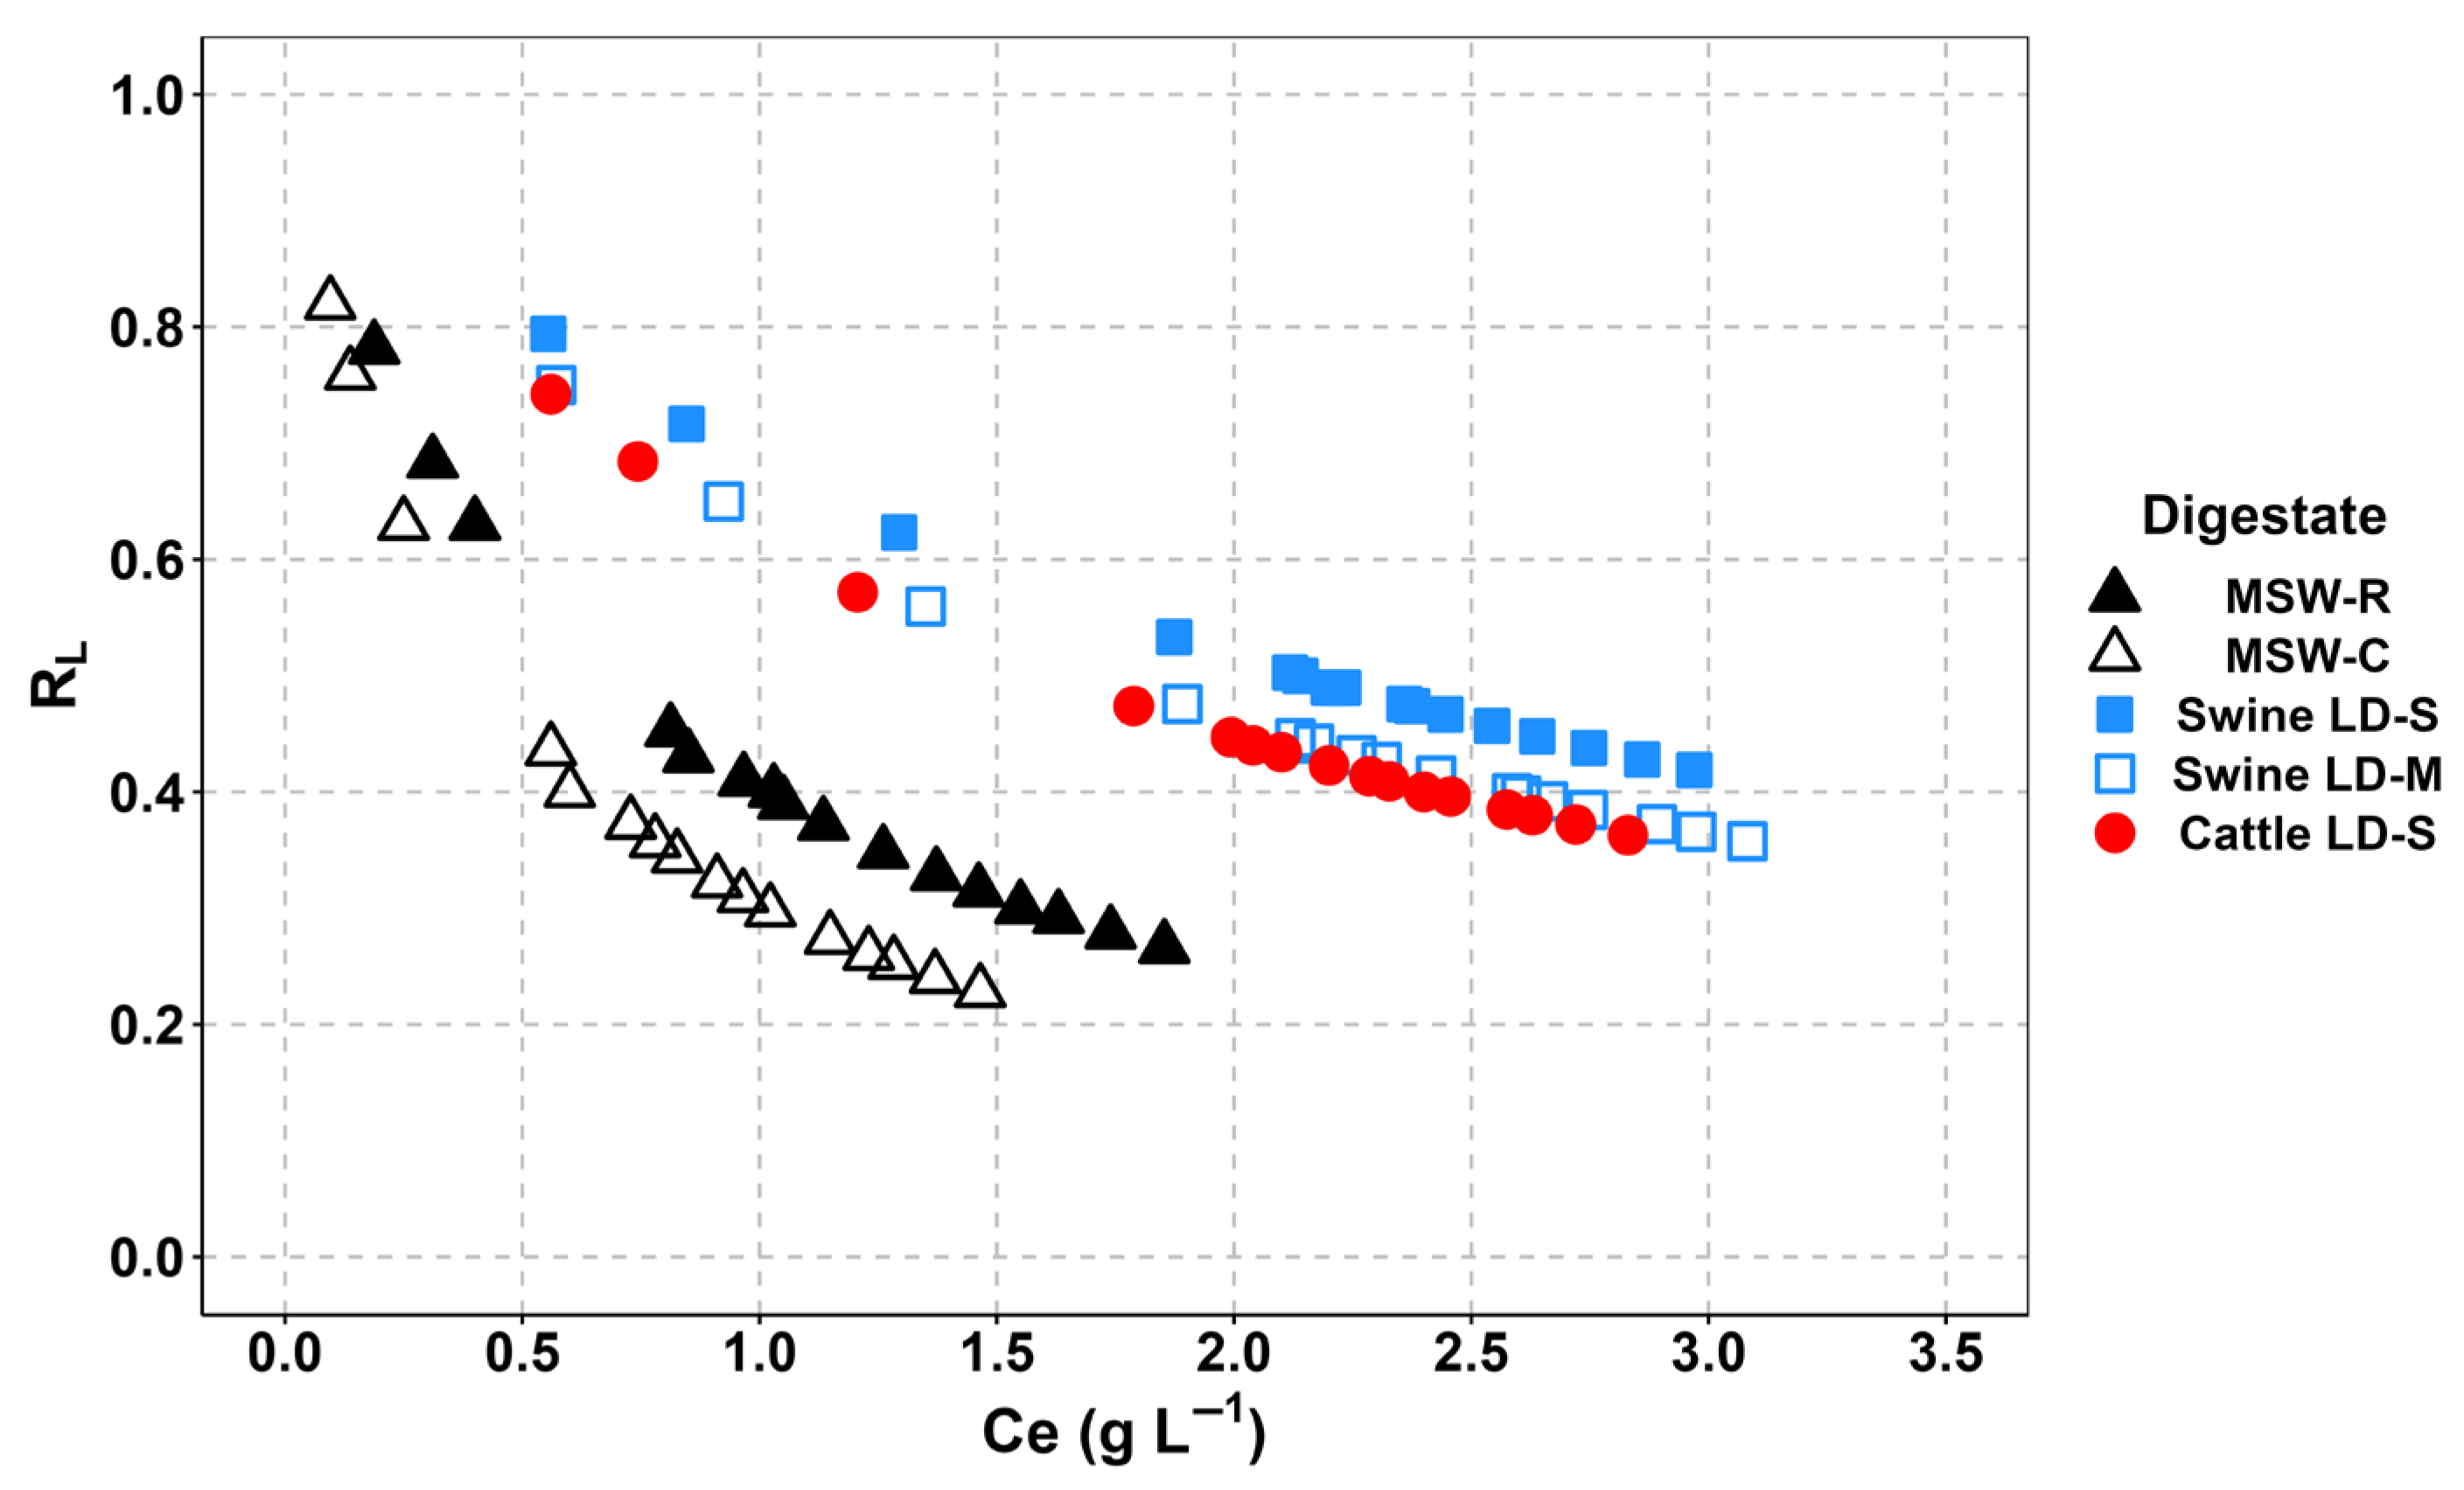
3.1. Equilibrium Adsorption Isotherms

To understand the adsorption mechanisms underlying ammonium removal with this specific zeolitic tuff, Langmuir and Freundlich isotherm models were fitted to the experimental data (Figure 2). All parameters related to the Freundlich and Langmuir models are reported in Table 3. The adsorption mechanism is a complex process and cannot be simply described as “homogeneous” or “heterogeneous,” nor can it be solely attributed to either chemical or physical adsorption mechanisms [44]. Different studies have proposed the Langmuir model as the one that better describes the mechanism of ammonium removal by zeolite [44,45,47,50], while others have highlighted that the Freundlich model is more suitable [37,39,46,48,63].
As shown by the R2 and AIC values (Table 3), the experimental data fit well with both tested isotherm models, but the Freundlich model shows slightly higher values in most of the tested scenarios. This suggests the complex nature of the adsorption, aligning with prior observations and studies, such as [44,48,64], and that the adsorption process can be better described as multilayer and heterogeneous, likely due to the heterogeneous nature of the zeolitic tuff. This suggests that the adsorption process on this specific type of zeolitic tuff results from multiple mechanisms. While chemical adsorption serves as the primary driver of ammonium removal, physical interactions and diffusion mechanisms also enhance ammonium adsorption on the zeolitic tuff. This is further supported by the 1/n value for the different digestates, which is always less than 1, suggesting that other processes, in addition to chemical mechanisms, may contribute to ammonium removal, particularly at high ammonium concentrations [48]. As reported by [65], 1/n also indicates the degree of process homogeneity: the closer this value is to 1, the more homogeneous the process is, i.e., more likely to be described by the Langmuir model. In this study, 1/n values range from 0.3 to 0.5, which is indicative of heterogeneous adsorption, aligning it more with the Freundlich model. Our results are very similar to those obtained by [63,66], where the 1/n values were 0.5 and between 0.24 and 0.38, respectively.
The n value also provides insight into how favorable the adsorption process could be (1 < n < 10). The zeolitic tuff exhibited favorable ammonium adsorption, with n values between 1.77 and 2.59 across all digestate types (Table 3). Based on their n values, MSW-R and MSW-C display the most favorable digestates for ammonium adsorption, as also indicated by the separation factor RL. As shown in Figure 3, for all tested digestates, the RL values are consistently between 0 and 1, indicating that the adsorption process is favorable [67]. These data are in agreement with those obtained by [48]. As the ammonium concentration decreases, the RL value approaches 1, suggesting that adsorption becomes less favorable. A noticeable difference emerges between the RL values measured in digestates derived from MSW and those derived from livestock manure with lower values measured in MSW-R and MSW-C, indicating a more favorable adsorption in these digestates [68].
The fact that the adsorption process is more favorable in MSW digestates is confirmed by the ΔG values (Table 4). Indeed, MSW-R and MSW-C exhibit more negative values, indicating greater spontaneity in the process, particularly in MSW-C, which also agrees with the calculated n values. The values of Ke and ΔG align with those obtained by [20] for the adsorption of NH4+ onto a chabazite-rich tuff.

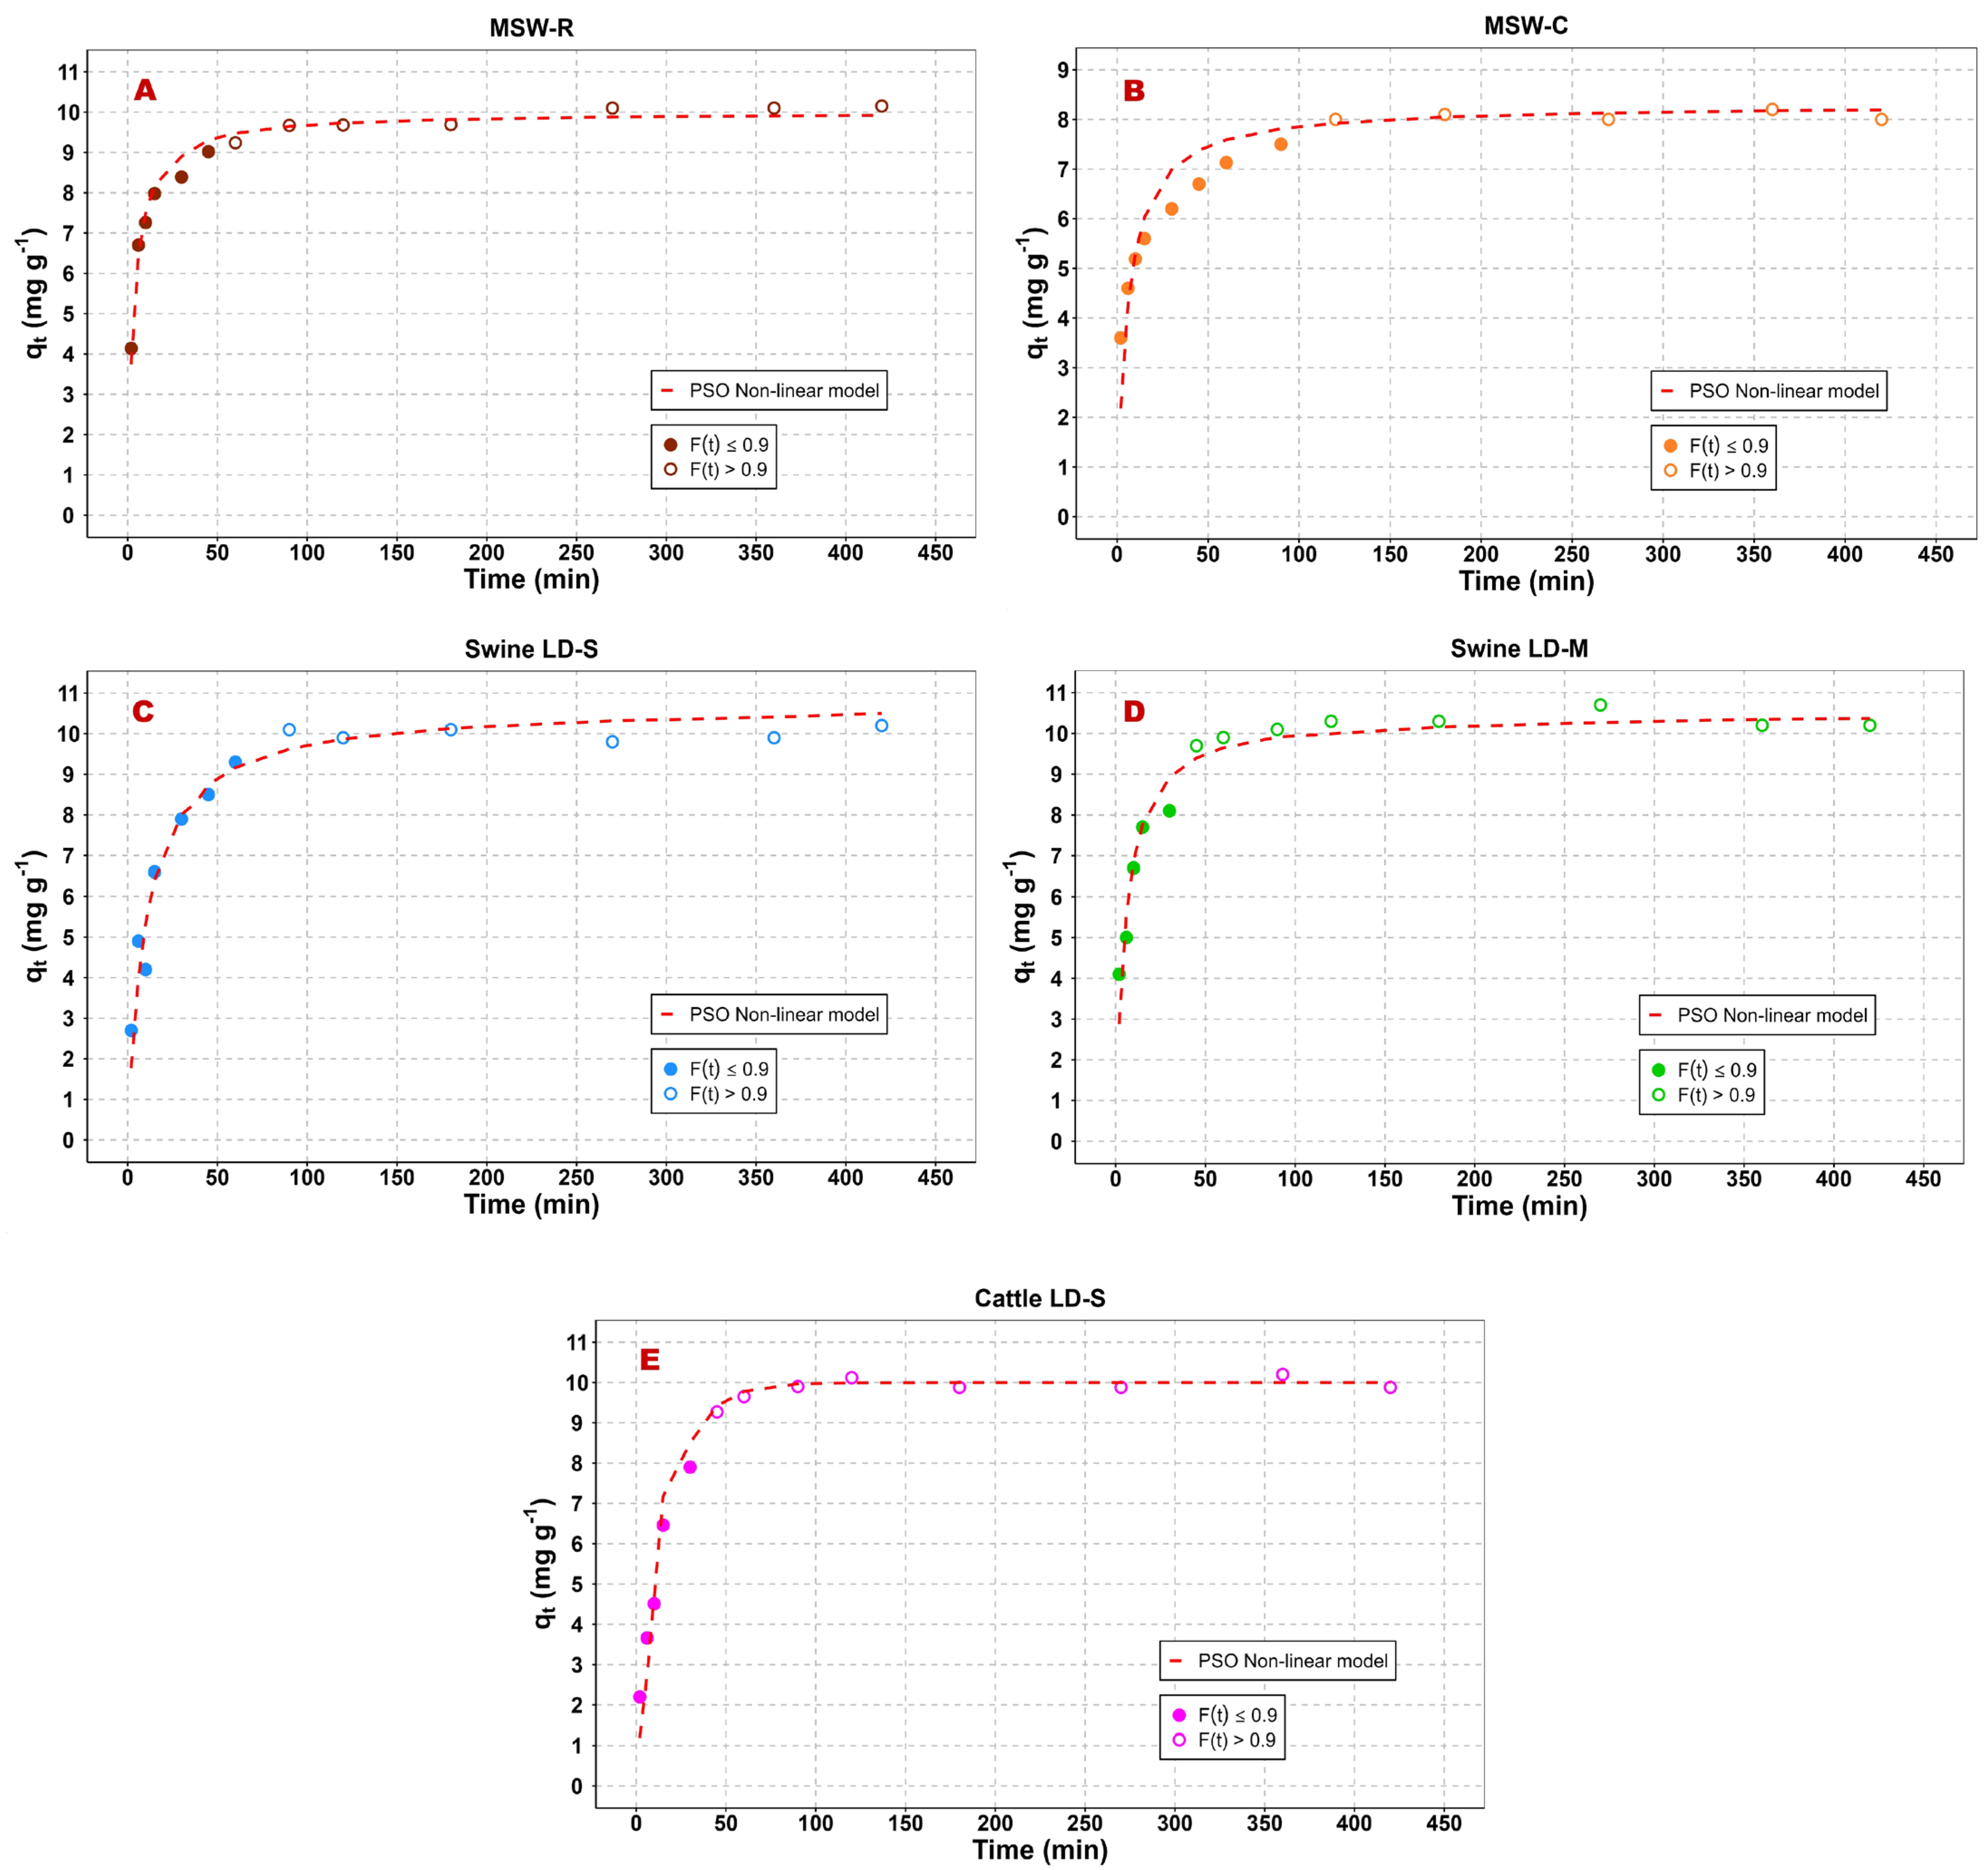
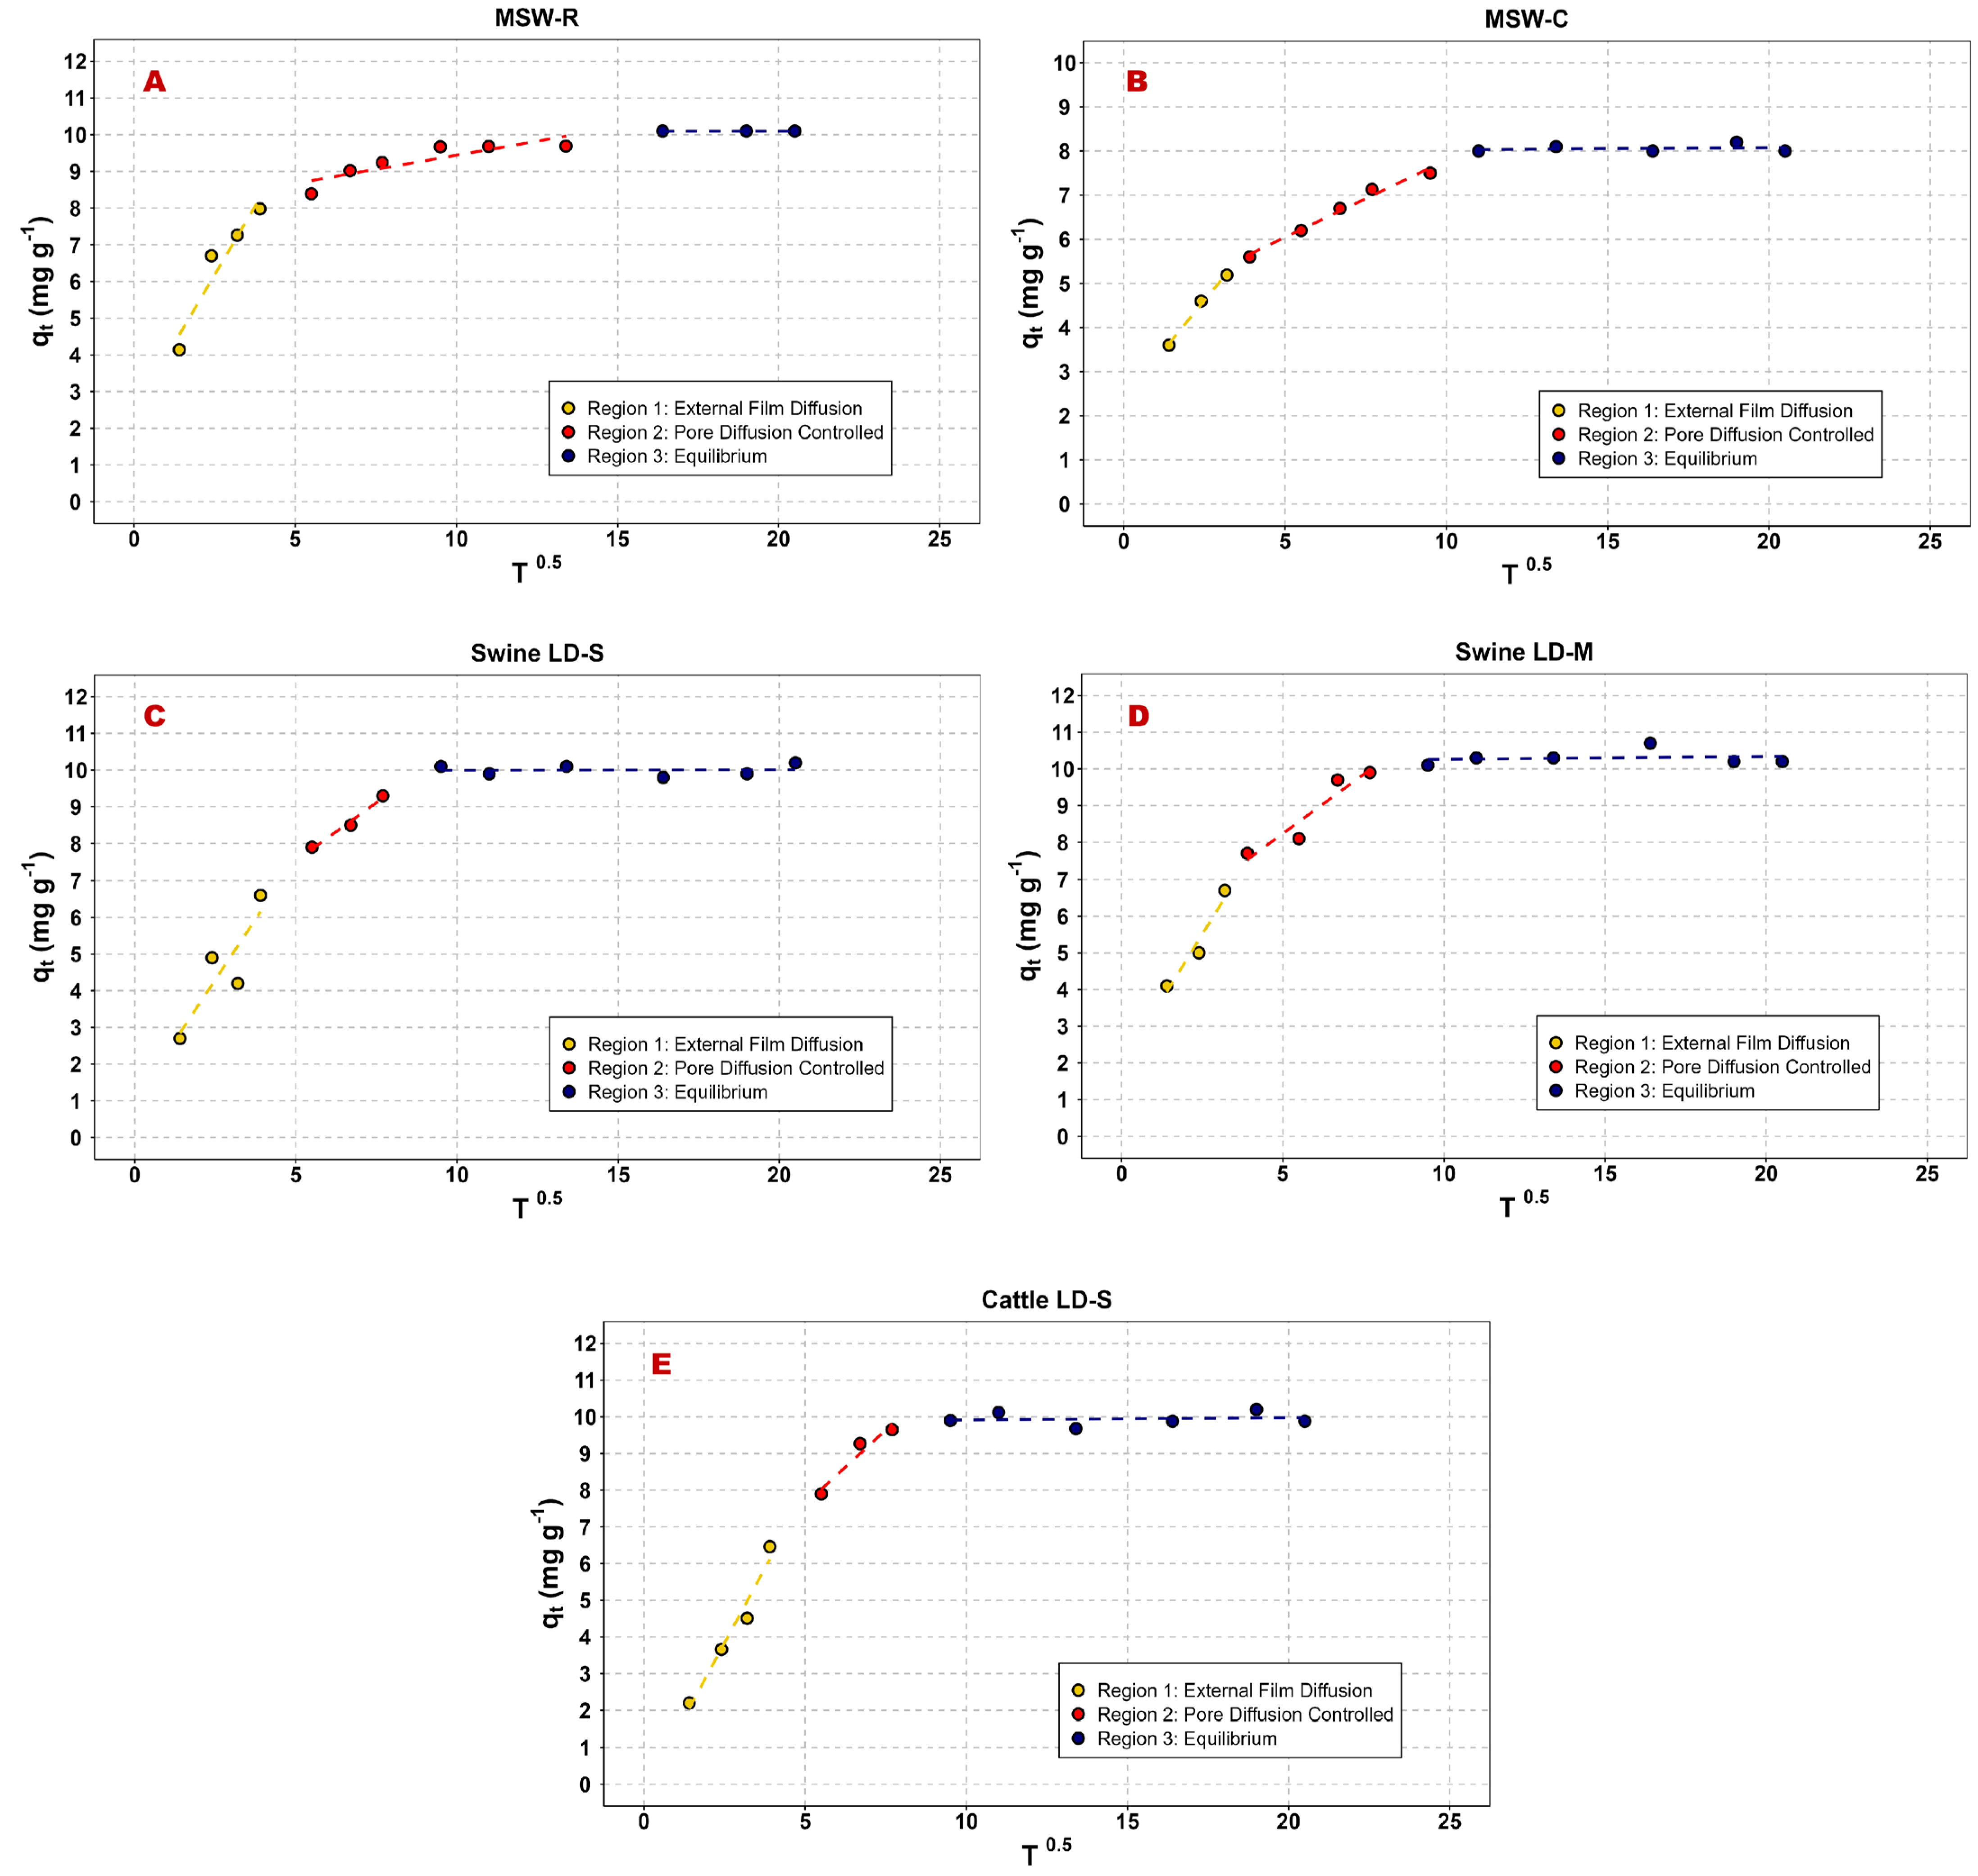
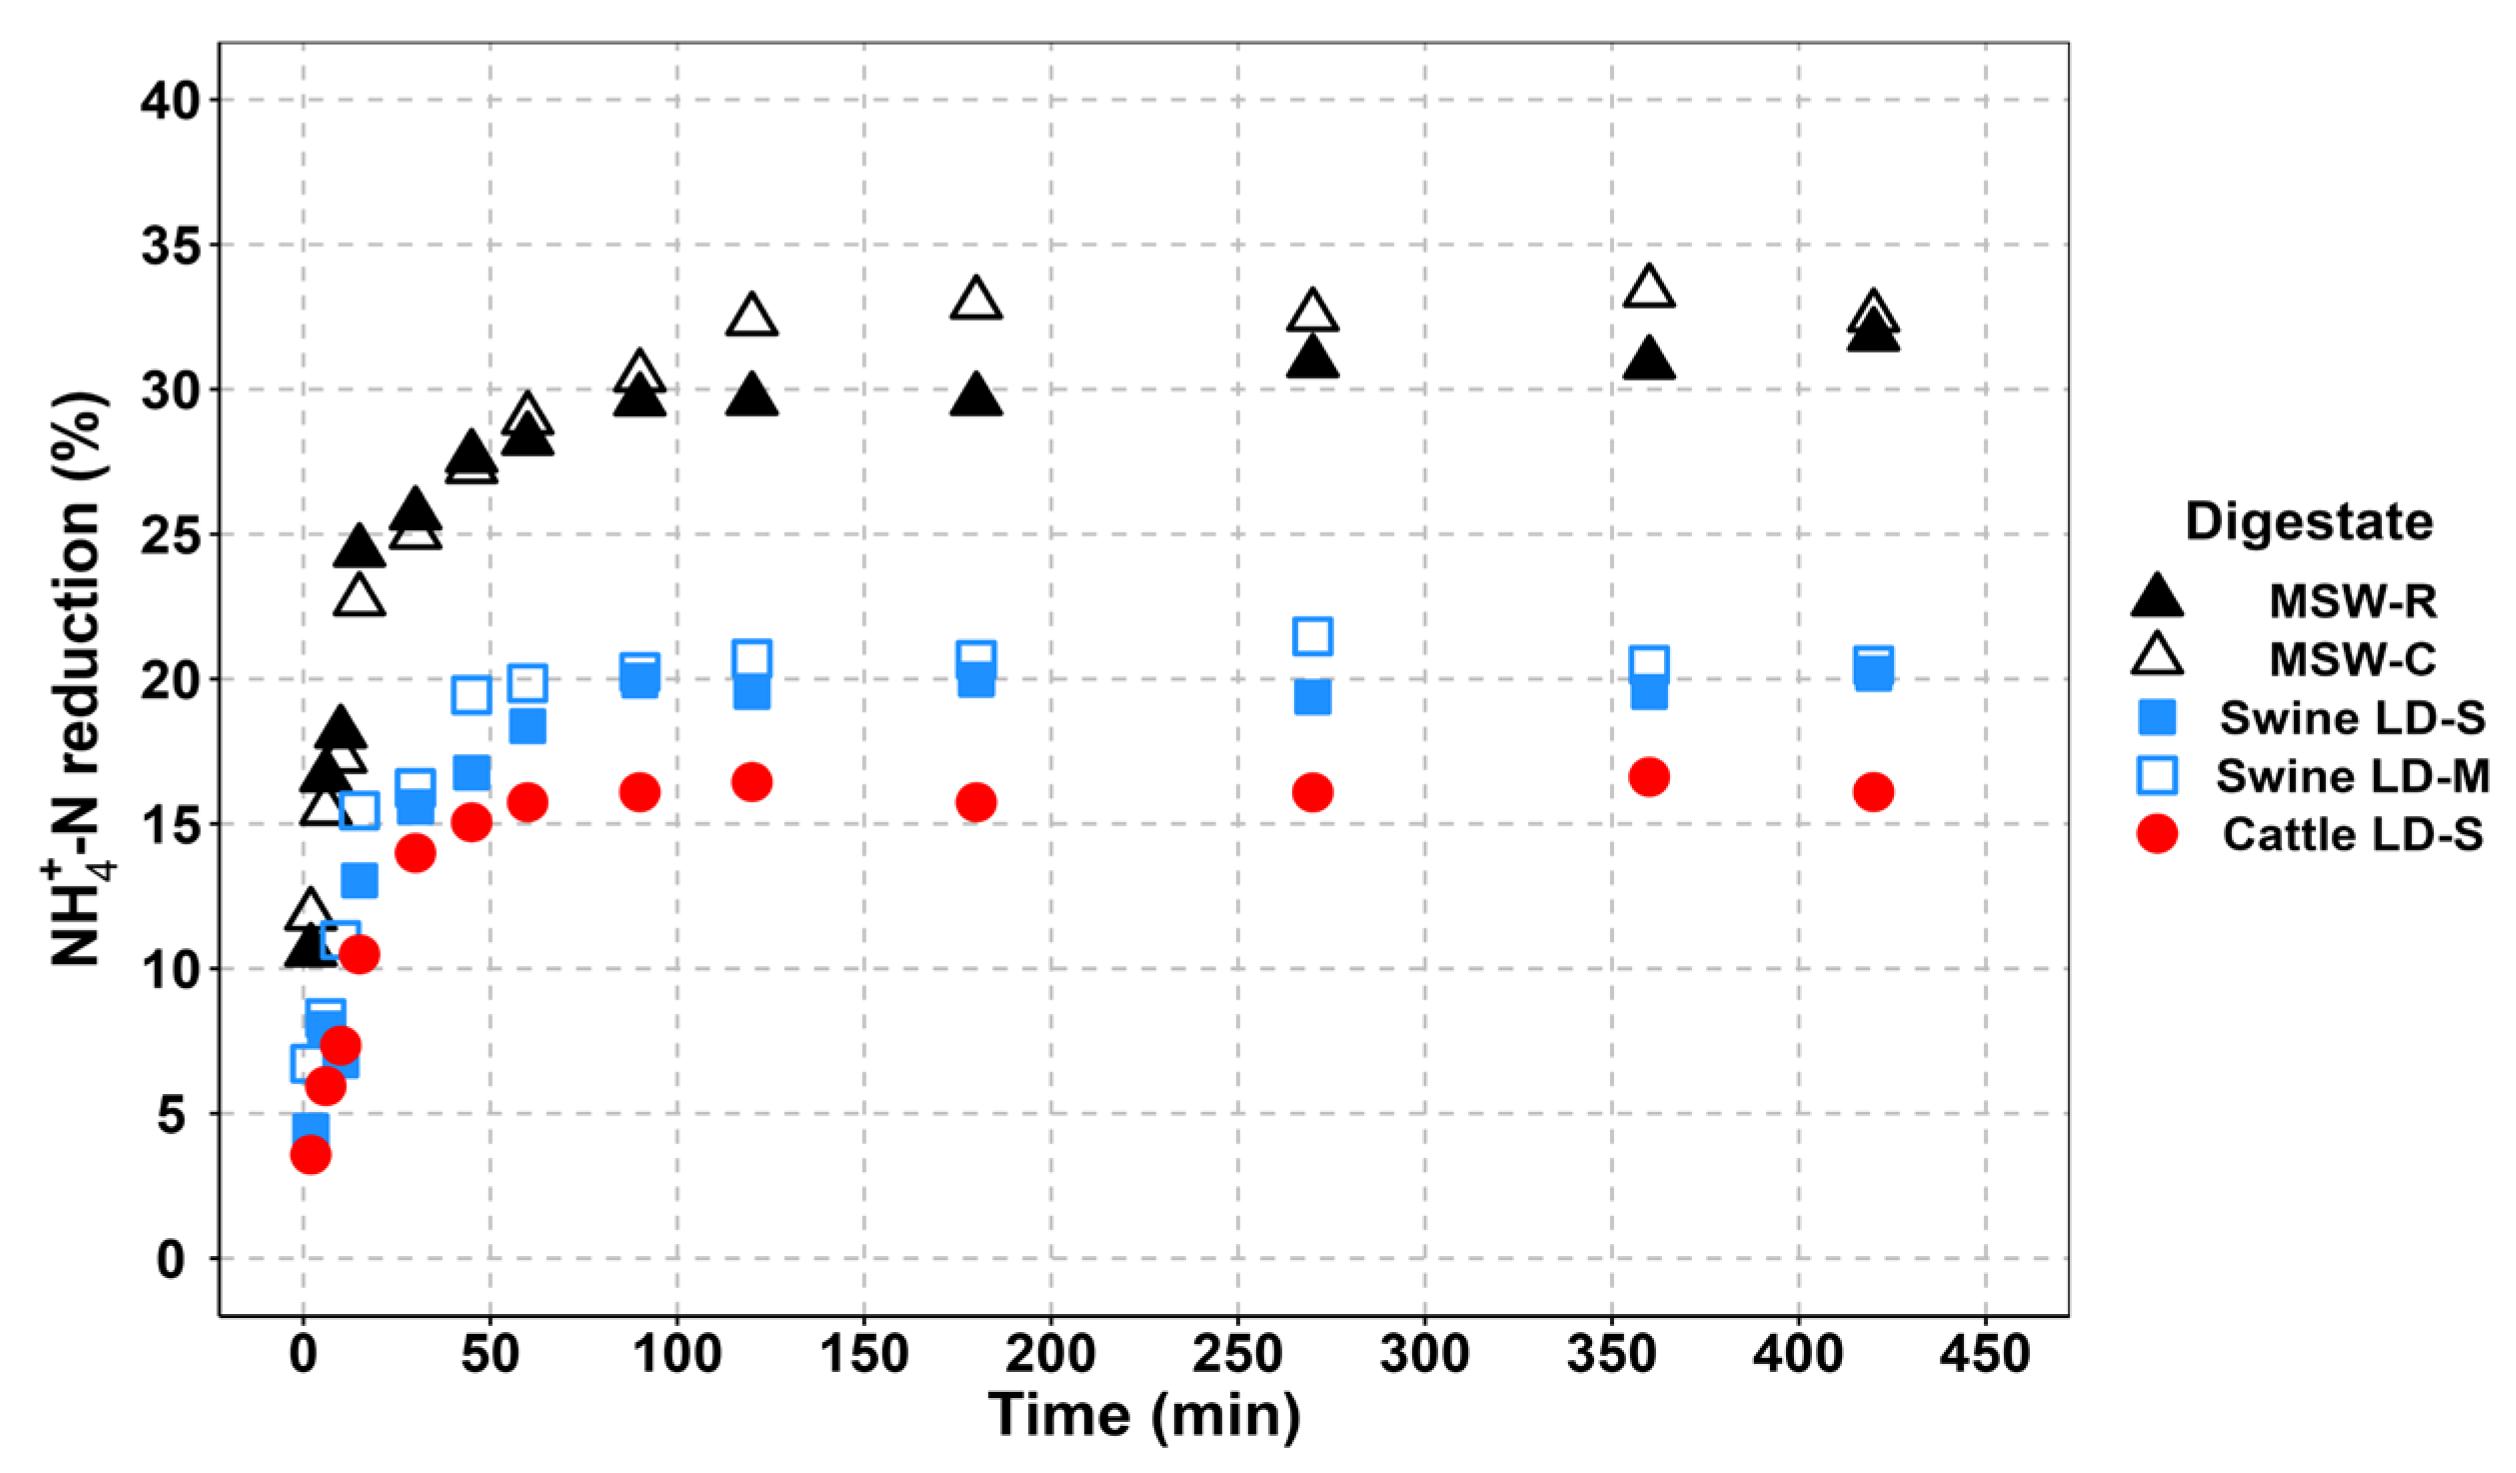
3.2. Adsorption Kinetics

The statistical and kinetic parameters calculated for PFO and PSO are displayed in Table 5, while the graphs of qt as a function of contact time are shown in Figure 4. For all types of digestates, the different statistical parameters showed lower values for the PFO compared to PSO. Therefore, the PSO is the model that best describes the NH4+ adsorption kinetics in these types of digestates using this specific zeolitic tuff. This is consistent with findings from other studies on NH4+ adsorption kinetics using other zeolitic tuffs, where PSO has proven to best fit the experimental data [23,37,39,45,49,57,64,69]. The better fit with PSO over PFO suggests that NH4+ adsorption by the zeolitic tuff is governed by chemisorption and ion exchange mechanisms, depending on both the adsorbent (zeolitic tuff) and the adsorbate (NH4+) [48], and that the adsorption capacity of the zeolitic tuff is proportional to the number of available exchange sites. The best fit with the PSO model indicates that the adsorption process involves the following three stages: (i) diffusion from the liquid phase to the liquid–solid interface, (ii) the movement of ammonium ions toward the solid surface, and (iii) the transport of ammonium ions into the pores and channels of the zeolite [45,70].
As pointed out in Section 2.4.2, the PFO and PSO models do not provide any insights into the NH4+ diffusion mechanism. Moreover, as reported by [48], the fact that the 1/n value for all digestates is <1 suggests that diffusion mechanisms may also occur during the adsorption process. For these reasons, the intraparticle diffusion (ID) model was tested. Figure 5 shows the plots of qt versus T0.5 for the different types of digestates, while Table 6 reports the parameters calculated for the ID model.
The data on qt versus Time0.5 (T0.5) do not show a linear relationship starting from the origin, indicating that the adsorption process is governed by multiple sequential processes [23,50]. The data were separated into three distinct regions (Figure 5A–E): Region 1 (with a steep slope) represents the external film diffusion-controlled adsorption, Region 2 is likely controlled by pore diffusion, and Region 3 corresponds to the equilibrium stage. The adsorption rate constant for the first region (KID1) is consistently higher than that of the second region (KID2), and the diffusion boundary layer thickness in Region 1 (C1) is smaller than in Region 2 (C2). These findings are consistent with those of [23,50], indicating that, after an initial phase of rapid chemisorption and ion exchange driven by the high concentration of NH4+, additional mechanisms, such as intraparticle physical interactions or diffusion, become dominant until reaching an equilibrium condition. As shown in Figure 5, equilibrium is reached more quickly in livestock digestates than in MSW, corroborating the previous observations. The identification of distinct regions further supports the findings from the isotherm study, where the good fit with the Freundlich model indicated a multilayer, heterogeneous adsorption process [48].

3.3. Parameters Affecting Ammonium Adsorption

3.3.1. Mineralogical Composition

As reported in Table 2, the CEC of the tuff is 233 cmol+·kg−1. However, given the low content of zeolitic minerals, the expected CEC should be approximately half this value. A possible explanation for the observed good affinity of the tuff for NH4+ may be attributed to the presence of nanoscale or semi-crystalline domains. In fact, in certain contexts, the secondary formation of zeolites in volcanic rocks involves the transformation of the amorphous phase (glass) [71], leading to the formation of nanoscale crystalline or semi-crystalline domains. As the size of these crystallites decreases, X-ray diffraction peaks broaden, causing signal overlap and intensity reduction, to the point where distinct peaks may no longer be visible [72]. This suggests that the components identified as “amorphous” or “glass” in QPAs may include undetected nanocrystalline phases. If these phases have a zeolitic nature, they may exhibit some of the typical properties of zeolitic minerals, such as selective CEC. Consequently, the observed NH4+ removal efficiency, despite the mineralogical composition of the tuff, could be explained by this phenomenon, although it has not been directly verified in this study.

3.3.2. Contact Time

Figure 6 shows the trend of NH4+−N reduction as a function of increased contact time, with an S/L ratio of 5%. As shown, NH4+−N removal by the zeolitic tuff occurred rapidly within the first 15 min, especially for Swine LD-S, Swine LD-M, and Cattle LD-S, with more than 80% of NH4+−N reduced within the first 60 min. Afterward, increasing the contact time resulted in a significant decrease in the removal rate, reaching a plateau after 120 min. The rapid initial adsorption can be attributed to the high availability of adsorption sites [73]; as the process progresses, the number of available sites decreases, approaching zero as equilibrium is reached. A near-equilibrium condition was reached after 90 min for Cattle LD-S, after 120 min for Swine LD-S and Swine LD-M, and after 180 min for MSW-R and MSW-C. This is likely due to the different initial ammonium concentrations in the different digestates. Higher concentrations can lead to quicker saturation of exchange sites and, consequently, faster attainment of equilibrium conditions. This trend in the experimental data is similar to that reported by several other authors [37,43,44,46,48,49,64,66,74]. For example, in an adsorption batch experiment, Ref. [46] also observed that ammonium adsorption by zeolite occurred very rapidly within the first 60 min, with a near-equilibrium condition reached within the first 180 min.
This observation is crucial for the industrial implementation of the process, where a shorter contact time is essential to reduce the economic and energy impact of digestate treatment.

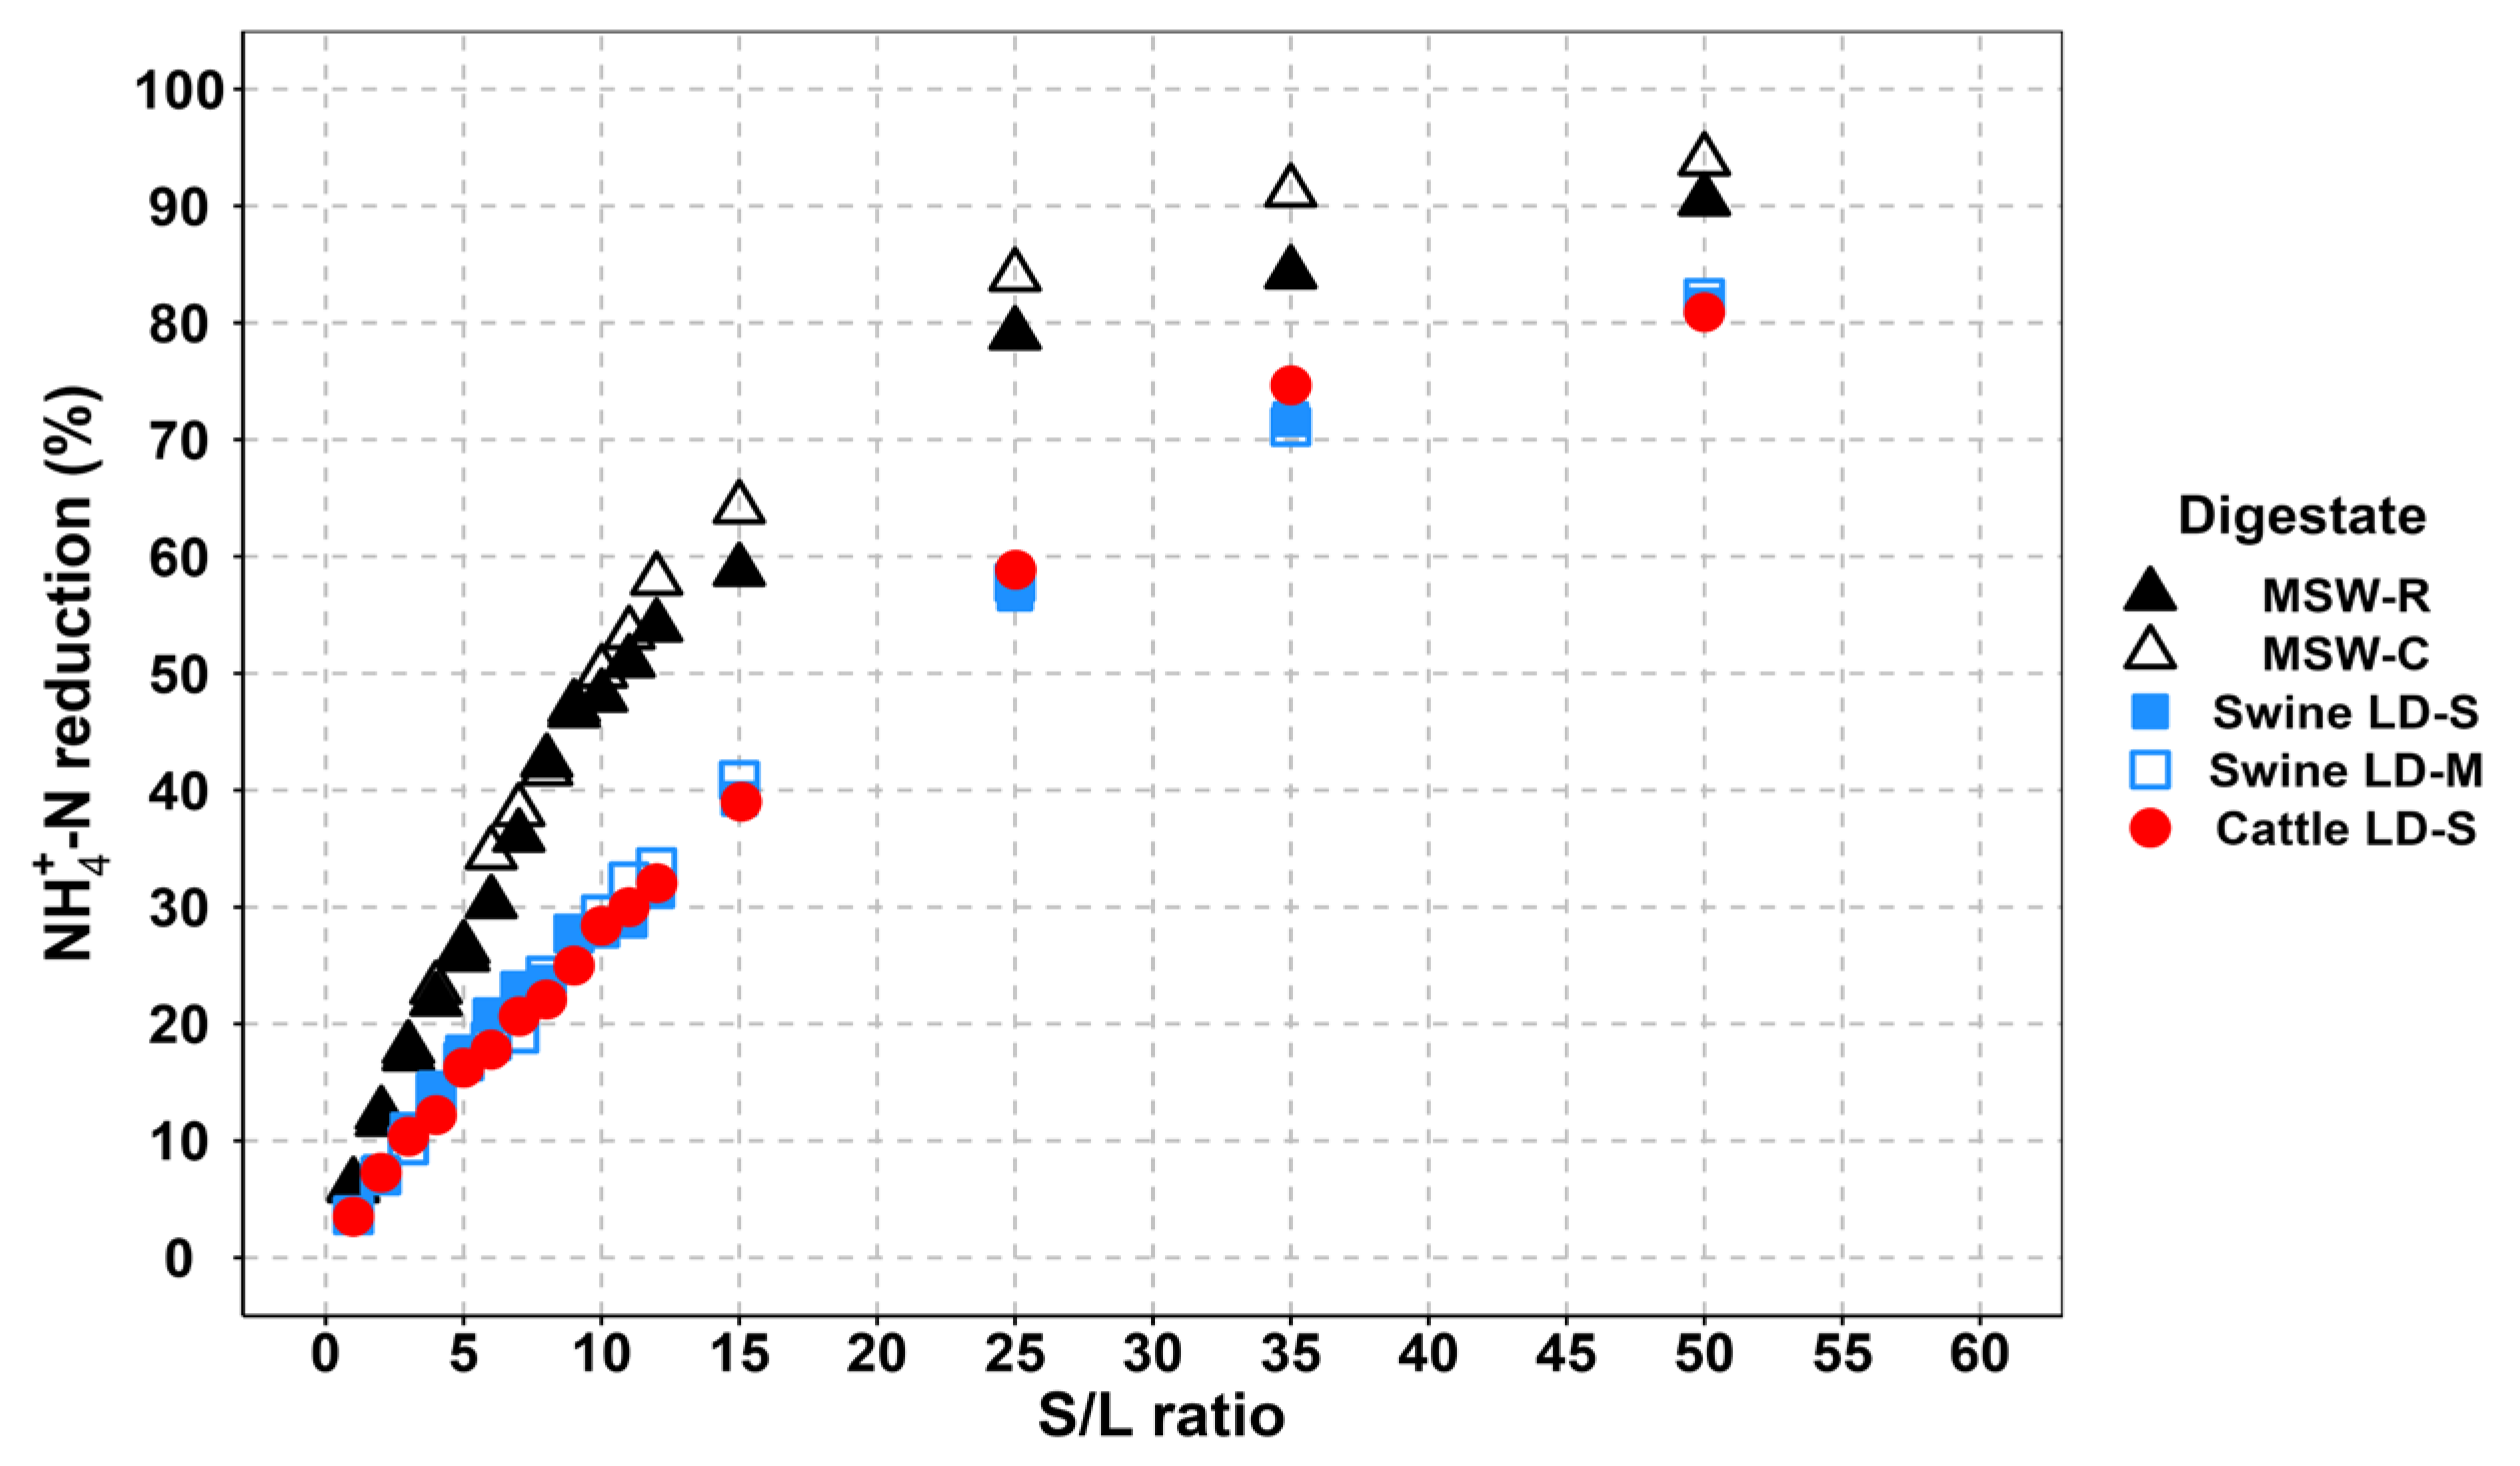
3.3.3. Solid–Liquid Ratio

Figure 7 shows the ammonium reduction as a function of the S/L ratio. It can be observed that increasing the S/L ratio results in a higher % reduction in NH4+-N as expected, but concomitantly to lower qe. This increase is due to the greater surface area available for adsorption as the amount of zeolitic tuff increases, thereby also increasing the number of exchange sites. Interestingly, the % reduction increases rapidly with the initial rise in the amount of tuff used, then reaches a plateau at higher S/L ratio values. This suggests a near-equilibrium state, indicating that almost all available ammonium has been exchanged with cations in the zeolite itself. This aspect should be considered for the industrial application of the process, where achieving greater ammonium removal using a smaller amount of zeolitic tuff would be optimal for reducing process costs. Our results are consistent with previous observations and align with findings from [44,48]. In their study, they observed that at a 40% S/L ratio, the percentage of ammonium removal decreased significantly.

3.3.4. Digestate Composition: NH4+ Initial Concentration, Total Solids Content, and Competing Ions

A common feature in Figure 6 and Figure 7 is the clear difference in the % reduction in NH4+-N observed between digestates derived from MSW and those derived from livestock manure. If we consider only the initial ammonium concentration (Table 1), we find that the digestates from the highest to lowest NH4+-N concentration are ordered as follows: Swine LD-S > Cattle LD-S > Swine LD-M > MSW-R > MSW-C. According to the literature, a higher initial concentration of ammonium should increase the driving force and, therefore, lead to higher removal efficiencies [74]. However, in this study, we observed the opposite trend: higher removal efficiencies were obtained where the initial NH4+-N concentration was lower. This result is similar to that obtained by [46,48]. In this case, other factors, such as total solids content and other cation concentrations, may have played an important role. It has been reported by [9,66,75] that the presence of other ions, especially monovalent cations, like K+ and Na+, can lead to significant competition with NH4+ for adsorption sites compared to divalent cations, like Ca2+ and Mg2+, as their single positive charge makes them more competitive for adsorption. Among these ions, K+, in particular, can create greater competition because it can occupy the same sites within the zeolite structure as NH4+ [76,77]. If we consider the composition of the various digestates shown in Table 1, the concentration of K+ increases in the following order: MSW-C > MSW-R > Swine LD-S > Swine LD-M > Cattle LD-S. Comparing these data with the NH4+-N reduction trends (Figure 7), we observe that where the initial concentration of K+ is lower, a greater % reduction in ammonium is achieved. It was also observed by [43] that ammonium removal can be significantly reduced in the presence of simultaneous potassium adsorption. Similarly, [44,48] reported that a high content of solid particles can lead to competition with ammonium because solid particles may be adsorbed onto the zeolite surface or block the pores. According to [44], a reduction in NH4+ adsorption is observed with increasing DOC concentration in waters, attributed to the adsorption of organic matter by the zeolites, as also evidenced in this study, where a decrease in NH4+-N reduction was correlated to an increase in TS content. Specifically, we observed greater ammonium reduction in MSW-C, which has the lowest TS and K+ content, compared to Cattle LD-S, which has the highest TS and K+ content. Based on these considerations (ammonium concentration, total solids content, and the effect of other ions), the process appears to perform better for MSW digestates compared to those derived from livestock effluents.

3.3.5. Effects of Digestate Pre-Treatments

Since this study considered different forms of digestate, with each subjected to different pre-treatments (clarification and microfiltration), it is important to evaluate the effect of these treatments on the NH4+ adsorption process. As can be seen from the 1/n values, the ΔG values reported in Table 4, and the trend of the RL values in Figure 3, the clarified fraction of MSW and the microfiltered fraction of Swine LD exhibited lower 1/n values, more negative ΔG values, and lower RL values compared to their non-clarified and non-microfiltered counterparts. This suggests that the adsorption process is favored in these digestates. Greater ammonium reductions were also observed in the clarified and microfiltered digestates, as well as a shorter time required to reach equilibrium. The clarification and microfiltration processes reduce the solids content in the digestate [78], thus leading to more favorable conditions for ammonium adsorption, as discussed in Section 3.3.4. From an industrial implementation perspective, where possible, it would be better to work with clarified and/or microfiltered matrices to make this treatment technology even more efficient.

3.4. Estimation of Farm-Scale Daily Nitrogen Recovery Rates

To evaluate the potentialities of the method at the farm scale, it is necessary to consider the potential N recovery according to the average volume of digestate produced by an average biogas plant. According to the data from the Italian Ministry of Environment and Energy Security, in 2021, over 2000 biogas production plants were active in Italy, each associated with digestate production [79]. The European Biogas Association (EBA) estimates that global digestate production will reach 75 million tons of dry matter (Mt DM) by 2030 and 177 Mt DM by 2050 [80]. In 2022, the amount of digestate produced in Italy amounted to 3 Mt DM. Considering the number of plants and the quantity produced, the average production can be roughly estimated at approximately 10 m3 per day of digestate per plant. This daily volume, based on the results obtained from the experiments related to adsorption kinetics and isotherms, has been used to estimate the kilograms of nitrogen that are potentially recoverable daily (Figure 8) and yearly (Supplementary Table S1) from each type of digestate using the zeolitic tuff at different S/L ratios. These values were obtained using the following Equations (12) and (13), assuming continuous plant operation throughout the year:
k g   N   r e c o v e r e d   p e r   c y c l e = q e × k g   z e o l i t e   p e r   c y c l e
k g   N   r e c o v e r e d   d a i l y = k g   N   r e c o v e r e d   p e r   c y c l e × n u m b e r   o f   c y c l e s
where a “cycle” refers to the phase in which the fresh digestate is in contact with the zeolitic tuff for the time defined by kinetic experiments (120 min for MSW-R and MSW-C, 90 min for Swine LD-S, and 45 min for Swine LD-M and Cattle LD-S).
As shown in Figure 8, there are differences in the daily kilograms of nitrogen recovered among the various digestates, with higher amounts recovered from livestock-derived digestates. This is due to the greater nitrogen adsorption capacity of the zeolitic tuff in these matrices and the higher number of treatment cycles that can be carried out daily due to faster adsorption kinetics, allowing more treatment cycles throughout the day and, hence, greater N recovery. From an industrial perspective, if the goal is to recover as much nitrogen as possible, treatment is more effective for livestock-based digestates. However, in some cases, the priority may be to reduce the effluent load. In such situations, as discussed in previous chapters, treatment is more effective in certain matrices, like MSW-derived digestates, where ammonium reduction percentages are double those observed for livestock-derived digestates.
The data in Supplementary Table S1 shows that even at low S/L ratios, the annual nitrogen recovery from different digestates is significant. This recovery could allow the use of this material for agricultural purposes as partial substitute for conventional synthetic fertilizers, such as urea. Indeed, the effects of NH4-enriched zeolite tuffs on soil properties and crop yield have been already widely assessed in the literature [27,28,29,30,31,32,33]. The decrease in synthetic fertilizer use in agriculture is another key objective of the EU Green Deal because of their high energetic cost and low nutrient use efficiency by crops. Furthermore, finding alternative forms of fertilizers would help mitigate the environmental issues associated with the production of conventional synthetic nitrogen fertilizers.

4. Conclusions

This study investigated the use of a chabazite–phillipsite zeolite tuff for the recovery of nitrogen from various types of digestates. The Freundlich isotherm provided the best fit to the equilibrium data (R2 = 0.91–0.97), evidencing the heterogeneity of the adsorption process and indicating a multilayer adsorption mechanism. The pseudo-second-order (PSO) kinetic model evidenced that the process is governed by chemisorption and ion exchange. Ammonium removal was particularly rapid in digestates derived from livestock manure (Swine LD-S, Swine LD-M, and Cattle LD-S), with over 80% of NH4+-N removed within the first 60 min at a 5% S/L ratio. In contrast, municipal solid waste digestates (MSW-R, MSW-C) showed slightly higher overall removal efficiencies (up to 90%) but required longer contact times (up to 180 min) to reach equilibrium.
Farm-scale application modeling showed that, assuming 10 m3/day of digestate treated per plant, the method could allow the recovery of 1.2 to 16 kg of nitrogen per day, depending on the digestate type and process parameters. On a yearly basis, this corresponds to a potential recovery of 440 to nearly 6000 kg N/year, offering a feasible strategy for partial substitution of synthetic fertilizers in agricultural systems.
Digestate pre-treatments, such as clarification and microfiltration, increased NH4+-N removal efficiency by 15–25%, likely due to reduced competition with solids and K+ ions. These results suggest that optimal process conditions include a pre-treated matrix, moderate S/L ratio (~10–20%), and a contact time of 90–120 min.
This study provides novel insight into the application of a zeolitic tuff containing both chabazite and phillipsite—two less commonly studied minerals—for ammonium recovery from real, heterogeneous digestates. By integrating equilibrium, kinetic, and farm-scale modeling data, we addressed both the mechanistic understanding and the practical applicability of the process, thereby fulfilling the study aims outlined in the introduction.
From an environmental engineering perspective, the proposed approach represents a chemical-free, low-cost, and scalable solution for nutrient recovery from liquid digestates, in alignment with the EU Green Deal and circular economy objectives.
From a practical standpoint, the use of zeolitic tuff offers the following additional benefits: it reduces the environmental impact of digestate application by lowering nitrogen loads and enables the production of nitrogen-enriched materials with slow-release properties. This contributes to more sustainable agricultural practices and can help reduce reliance on synthetic fertilizers. Moreover, the enhanced transportability of the solid product compared to raw liquid digestate broadens its market potential and increases the area of agricultural soils that can benefit from renewable nitrogen sources.

Supplementary Materials

The following supporting information can be downloaded at: https://www.mdpi.com/article/10.3390/recycling10040137/s1, Table S1: Amount of zeolitic tuff required, price, and amount of N recovered yearly by a model biogas plant.

Author Contributions

Conceptualization, M.A. and G.F.; methodology, M.A. and G.F.; validation, G.F. and G.G.; formal analysis, M.A. and C.B.; investigation, M.A. and G.F.; data curation, M.A., G.F., and G.G.; writing—original draft preparation, M.A.; writing—review and editing, M.A., G.F., and G.G.; supervision, M.A. and G.F.; funding acquisition, G.F. and B.F. All authors have read and agreed to the published version of the manuscript.

Funding

This research was conducted within the framework of the project “Struvite—Trattamento dei digestati per ridurre le emissioni e recuperare un fertilizzante, la Struvite”, funded under the PR-FESR EMILIA-ROMAGNA 2021–2027 programme.

Data Availability Statement

All the data relevant to this study are displayed in this manuscript and in the Supplementary Materials.

Acknowledgments

We gratefully thank CRPA (Emilia-Romagna), the WAM Group for the technical support, and the companies Biorg and Colombaro for providing the different digestate samples used in this study.

Conflicts of Interest

The authors declare no conflicts of interest.

References

  1. FAO. How to Feed the World in 2050. In Proceedings of the Expert Meeting on How to Feed the World in 2050, Rome, Italy, 24–26 June 2009. [Google Scholar]
  2. Jadhav, D.A.; Ghosh Ray, S.; Ghangrekar, M.M. Third generation in bio-electrochemical system research—A systematic review on mechanisms for recovery of valuable by-products from wastewater. Renew. Sustain. Energy Rev. 2017, 76, 1022–1031. [Google Scholar] [CrossRef]
  3. Kim, D.; Min, K.J.; Lee, K.; Yu, M.S.; Park, K.Y. Effects of pH, molar ratios and pre-treatment on phosphorus recovery through struvite crystallization from effluent of anaerobically digested swine wastewater. Environ. Eng. Res. 2017, 22, 12–18. [Google Scholar] [CrossRef]
  4. Galamini, G.; Ferretti, G.; Rosinger, C.; Huber, S.; Mentler, A.; Pines, E.D.; Faccini, B.; Keiblinger, K.M. Potential for agricultural recycling of struvite and zeolites to improve soil microbial physiology and mitigate CO2 emissions. Geoderma 2025, 453, 117149. [Google Scholar] [CrossRef]
  5. Kim, T.; Nam, Y.; Lee, M. Nitrogen and Phosphorus Removal from Livestock Wastewater by Zeolite Ion Exchange and Ionizing Radiation. World Acad. Sci. Eng. Technol. 2009, 54, 9–13. [Google Scholar]
  6. Longhurst, R.D.; Roberts, A.H.C.; O’Connor, M.B. Farm dairy effluent: A review of published data on chemical and physical characteristics in New Zealand. N. Z. J. Agric. Res. 2000, 43, 7–14. [Google Scholar] [CrossRef]
  7. Tambone, F.; Orzi, V.; Zilio, M.; Adani, F. Measuring the organic amendment properties of the liquid fraction of digestate. Waste Manag. 2019, 88, 21–27. [Google Scholar] [CrossRef]
  8. Makdi, M.; Tomcsik, A.; Orosz, V. Digestate: A New Nutrient Source—Review. In Biogas; InTech: Vienna, Austria, 2012. [Google Scholar] [CrossRef]
  9. Ferretti, G.; Galamini, G.; Medoro, V.; Coltorti, M.; Di Giuseppe, D.; Faccini, B. Impact of Sequential Treatments with Natural and Na-Exchanged Chabazite Zeolite-Rich Tuff on Pig-Slurry Chemical Composition. Water 2020, 12, 310. [Google Scholar] [CrossRef]
  10. Kovačić, Đ.; Lončarić, Z.; Jović, J.; Samac, D.; Popović, B.; Tišma, M. Digestate Management and Processing Practices: A Review. Appl. Sci. 2022, 12, 9216. [Google Scholar] [CrossRef]
  11. Rossi, G.; Beni, C.; Benedetti, A.; Felici, B.; Neri, U. Effect of Mineral or OFMSW Digestate Fertilization on Ryegrass and Nitrogen Leaching. Agronomy 2023, 13, 1316. [Google Scholar] [CrossRef]
  12. Hickey, C.W.; Quinn, J.M.; Davies-Colley, R.J. Effluent Characteristics of Dairy Shed Oxidation Ponds and Their Potential Impacts on Rivers. N. Z. J. Mar. Freshw. Res. 1989, 23, 569–584. [Google Scholar] [CrossRef]
  13. Hooda, P.S.; Edwards, A.C.; Anderson, H.A.; Miller, A. A Review of Water Quality Concerns in Livestock Farming Areas. Sci. Total Environ. 2000, 250, 143–167. [Google Scholar] [CrossRef]
  14. Jongbloed, A.W.; Lenis, N.P. Environmental Concerns about Animal Manure. J. Anim. Sci. 1998, 76, 2641–2648. [Google Scholar] [CrossRef]
  15. Martinez, J.; Guiziou, F.; Peu, P.; Gueutier, V. Influence of Treatment Techniques for Pig Slurry on Methane Emissions during Subsequent Storage. Biosyst. Eng. 2003, 85, 347–354. [Google Scholar] [CrossRef]
  16. Nhubu, T.; Mbohwa, C.; Muzenda, E. Eutrophication Impact Potential of Solid Waste Management Options in Harare. In Wastes: Solutions, Treatments and Opportunities III, Proceedings of the 5th International Conference Wastes 2019, Lisbon, Portugal, 4–6 September 2019; CRC Press: London, UK, 2019; pp. 360–366. [Google Scholar] [CrossRef]
  17. Policastro, G.; Cesaro, A. Composting of Organic Solid Waste of Municipal Origin: The Role of Research in Enhancing Its Sustainability. Int. J. Environ. Res. Public Health 2023, 20, 1312. [Google Scholar] [CrossRef]
  18. Ross, C.; Donnison, A. Campylobacter and Farm Dairy Effluent Irrigation. N. Z. J. Agric. Res. 2003, 46, 255–262. [Google Scholar] [CrossRef]
  19. Martinez, J.; Dabert, P.; Barrington, S.; Burton, C. Livestock Waste Treatment Systems for Environmental Quality, Food Safety, and Sustainability. Bioresour. Technol. 2009, 100, 5527–5536. [Google Scholar] [CrossRef]
  20. Galamini, G.; Ferretti, G.; Medoro, V.; Tescaro, N.; Faccini, B. Isotherms, Kinetics, and Thermodynamics of NH4+ Adsorption in Raw Liquid Manure by Using Natural Chabazite Zeolite-Rich Tuff. Water 2020, 12, 2944. [Google Scholar] [CrossRef]
  21. European Commission. Farm to Fork Strategy; DG SANTE/Unit Food Inf. Compos. Food Waste. 2020. Available online: https://food.ec.europa.eu/horizontal-topics/farm-fork-strategy_en (accessed on 22 March 2025).
  22. Faccini, B.; Di Giuseppe, D.; Ferretti, G.; Coltorti, M.; Colombani, N.; Mastrocicco, M. Natural and NH4+-Enriched Zeolitite Amendment Effects on Nitrate Leaching from a Reclaimed Agricultural Soil (Ferrara Province, Italy). Nutr. Cycl. Agroecosyst. 2018, 110, 327–341. [Google Scholar] [CrossRef]
  23. Damodara, A.K.; Parameswaran, P. Ammonia Adsorption and Recovery from Swine Wastewater Permeate Using Naturally Occurring Clinoptilolite. J. Water Process Eng. 2021, 43, 102234. [Google Scholar] [CrossRef]
  24. Malferrari, D.; Laurora, A.; Brigatti, M.F.; Coltorti, M.; Di Giuseppe, D.; Faccini, B.; Passaglia, E.; Vezzalini, M.G. Open-field experimentation of an innovative and integrated zeolitite cycle: Project definition and material characterization. Rend. Lincei 2013, 24, 141–150. [Google Scholar] [CrossRef]
  25. Faccini, B. ; ZeoLIFE. Water Pollution Reduction and Water Saving Using a Natural Zeolitite Cycle; Aracne: Canterano, Italy, 2018. [Google Scholar]
  26. Ferretti, G.; Faccini, B.; Antisari, L.V.; Di Giuseppe, D.; Coltorti, M. 15N Natural Abundance, Nitrogen and Carbon Pools in Soil-Sorghum System Amended with Natural and NH4+-Enriched Zeolitites. Appl. Sci. 2019, 9, 4524. [Google Scholar] [CrossRef]
  27. Ali, S.; Nakhli, A.; Delkash, M. Application of Zeolites for Sustainable Agriculture: A Review on Water and Nutrient Retention. Water Air Soil Pollut. 2017, 228, 464. [Google Scholar] [CrossRef]
  28. Cataldo, E.; Salvi, L.; Paoli, F.; Fucile, M.; Masciandaro, G.; Manzi, D.; Masini, C.M.; Mattii, G.B. Application of Zeolites in Agriculture and Other Potential Uses: A Review. Agronomy 2021, 11, 1547. [Google Scholar] [CrossRef]
  29. Di Giuseppe, D.; Ferretti, G.; Faccini, B.; Blasi, E.; Passeri, N.; Bianchini, G.; Coltorti, M. Is it possible to cultivate corn in a sustainable way using a quarry waste? Period. Mineral. 2016, 85, 179–183. [Google Scholar] [CrossRef]
  30. Eroglu, N.; Emekci, M.; Athanassiou, C.G. Applications of Natural Zeolites on Agriculture and Food Production. J. Sci. Food Agric. 2017, 97, 3487–3499. [Google Scholar] [CrossRef]
  31. Ferretti, G.; Rosinger, C.; Diaz-Pines, E.; Faccini, B.; Coltorti, M.; Keiblinger, K.M. Soil Quality Increases with Long-Term Chabazite-Zeolite Tuff Amendments in Arable and Perennial Cropping Systems. J. Environ. Manag. 2024, 354, 120303. [Google Scholar] [CrossRef]
  32. Galamini, G.; Ferretti, G.; Rosinger, C.; Huber, S.; Medoro, V.; Mentler, A.; Díaz-Pinés, E.; Gorfer, M.; Faccini, B.; Keiblinger, K.M. Recycling nitrogen from liquid digestate via novel reactive struvite and zeolite minerals to mitigate agricultural pollution. Chemosphere 2023, 317, 137881. [Google Scholar] [CrossRef]
  33. Jarosz, R.; Szerement, J.; Gondek, K.; Mierzwa-Hersztek, M. The Use of Zeolites as an Addition to Fertilisers—A Review. Catena 2022, 213, 106125. [Google Scholar] [CrossRef]
  34. Coombs, D.S.; Alberti, A.; Armbruster, T.; Artioli, G.; Colella, C.; Galli, E.; Grice, J.D.; Liebau, F.; Mandarino, J.A.; Minato, H.; et al. Recommended Nomenclature for Zeolite Minerals: Report of the Subcommittee on Zeolites of the International Mineralogical Association, Commission on New Minerals and Mineral Names. Mineral. Mag. 1998, 62, 533–571. [Google Scholar] [CrossRef]
  35. Dyer, A.; Zubair, M. Ion-Exchange in Chabazite. Microporous Mesoporous Mater. 1998, 22, 135–150. [Google Scholar] [CrossRef]
  36. Chen, H.F.; Lin, Y.J.; Chen, B.H.; Yoshiyuki, I.; Liou, S.Y.H.; Huang, R.T. A Further Investigation of NH4+ Removal Mechanisms by Using Natural and Synthetic Zeolites in Different Concentrations and Temperatures. Minerals 2018, 8, 499. [Google Scholar] [CrossRef]
  37. Huang, H.; Xiao, X.; Yan, B.; Yang, L. Ammonium Removal from Aqueous Solutions by Using Natural Chinese (Chende) Zeolite as Adsorbent. J. Hazard. Mater. 2010, 175, 247–252. [Google Scholar] [CrossRef] [PubMed]
  38. Nguyen, M.L.; Tanner, C.C. Ammonium Removal from Wastewaters Using Natural New Zealand Zeolites. N. Z. J. Agric. Res. 1998, 41, 427–446. [Google Scholar] [CrossRef]
  39. Wasielewski, S.; Rott, E.; Minke, R.; Steinmetz, H. Evaluation of Different Clinoptilolite Zeolites as Adsorbent for Ammonium Removal from Highly Concentrated Synthetic Wastewater. Water 2018, 10, 584. [Google Scholar] [CrossRef]
  40. Young, H.D. Statistical Treatment of Experimental Data; McGraw-Hill B. Company, Inc.: New York, NY, USA, 1962. [Google Scholar]
  41. Gualtieri, A.F.; Gatta, G.D.; Arletti, R.; Artioli, G.; Ballirano, P.; Cruciani, G.; Guagliardi, A.; Malferrari, D.; Masciocchi, N.; Scardi, P. Quantitative Phase Analysis Using the Rietveld Method: Towards a Procedure for Checking the Reliability and Quality of the Results. Period. Mineral. 2019, 88, 147–151. [Google Scholar] [CrossRef]
  42. Detho, A.; Memon, A.A.; Memon, A.H.; Almohana, A.I.; Daud, Z.; Rosli, M.A. Sorption Kinetics, Isotherm Studies and Mechanism of Removal of Organic and Inorganic by Adsorption onto Renewable Biomineral. Water Air Soil Pollut. 2023, 234, 22. [Google Scholar] [CrossRef]
  43. Guo, X.; Zeng, L.; Li, X.; Park, H.S. Ammonium and Potassium Removal for Anaerobically Digested Wastewater Using Natural Clinoptilolite Followed by Membrane Pretreatment. J. Hazard. Mater. 2008, 151, 125–133. [Google Scholar] [CrossRef]
  44. Eberle, S.; Börnick, H.; Stolte, S. Granular natural zeolites: Cost-effective adsorbents for the removal of ammonium from drinking water. Water 2022, 14, 939. [Google Scholar] [CrossRef]
  45. Halim, A.A.; Aziz, H.A.; Johari, M.A.M.; Ariffin, K.S. Comparison study of ammonia and COD adsorption on zeolite, activated carbon and composite materials in landfill leachate treatment. Desalination 2010, 262, 31–35. [Google Scholar] [CrossRef]
  46. Kotoulas, A.; Agathou, D.; Triantaphyllidou, I.E.; Tatoulis, T.I.; Akratos, C.S.; Tekerlekopoulou, A.G.; Vayenas, D.V. Zeolite as a potential medium for ammonium recovery and second cheese whey treatment. Water 2019, 11, 136. [Google Scholar] [CrossRef]
  47. Lin, L.; Lei, Z.; Wang, L.; Liu, X.; Zhang, Y.; Wan, C.; Lee, D.J.; Tay, J.H. Adsorption mechanisms of high-levels of ammonium onto natural and NaCl-modified zeolites. Sep. Purif. Technol. 2013, 103, 15–20. [Google Scholar] [CrossRef]
  48. Taddeo, R.; Prajapati, S.; Lepistö, R. Optimizing ammonium adsorption on natural zeolite for wastewaters with high loads of ammonium and solids. J. Porous Mater. 2017, 24, 1545–1554. [Google Scholar] [CrossRef]
  49. Widiastuti, N.; Wu, H.; Ang, H.M.; Zhang, D. Removal of ammonium from greywater using natural zeolite. Desalination 2011, 277, 15–23. [Google Scholar] [CrossRef]
  50. Zhou, H.D.; Wang, C.Y.; Wang, Q.; Xu, B.X.; Zhu, G. Efficiency, mechanism and application prospect of ammonium adsorption and desorption over a sodium-acetate-modified synthetic zeolite. RSC Adv. 2024, 14, 17843–17854. [Google Scholar] [CrossRef] [PubMed]
  51. R Core Team. R: A Language Environment for Statistical Computing, Version 2023-3.0-386; The R Foundation for Statistical Computing: Vienna, Austria, 2021; Available online: https://www.r-project.org/ (accessed on 22 March 2025).
  52. Deocaris, C.C.; De Osio, L.P. Fitting Henry’s Adsorption Isotherm Model in R Using PUPAIM Package. Asia Pac. J. Res. 2020, 1, 47–51. [Google Scholar]
  53. Wang, J.; Guo, X. Adsorption isotherm models: Classification, physical meaning, application and solving method. Chemosphere 2020, 258, 127279. [Google Scholar] [CrossRef]
  54. Freundlich, H.M.F. Over the adsorption in solution. J. Phys. Chem. 1906, 57, 1100–1107. [Google Scholar]
  55. Weber, T.W.; Chakravorti, R.K. Pore and solid diffusion models for fixed-bed adsorbers. AIChE J. 1974, 20, 228–238. [Google Scholar] [CrossRef]
  56. Karaçetin, G.; Sivrikaya, S.; Imamoğlu, M. Adsorption of methylene blue from aqueous solutions by activated carbon prepared from hazelnut husk using zinc chloride. J. Anal. Appl. Pyrolysis 2014, 110, 270–276. [Google Scholar] [CrossRef]
  57. Jha, V.K.; Hayashi, S. Modification on natural clinoptilolite zeolite for its NH4+ retention capacity. J. Hazard. Mater. 2009, 169, 29–35. [Google Scholar] [CrossRef]
  58. Khan, A.A.; Singh, R.P. Adsorption thermodynamics of carbofuran on Sn (IV) arsenosilicate in H+, Na+ and Ca2+ forms. Colloids Surf. 1987, 24, 33–42. [Google Scholar] [CrossRef]
  59. Simonin, J.P. On the comparison of pseudo-first order and pseudo-second order rate laws in the modeling of adsorption kinetics. Chem. Eng. J. 2016, 300, 254–263. [Google Scholar] [CrossRef]
  60. Magalong, J.R.; DelaCruz, J.; Bumatay, J.; Deocaris, C. PUPAK: Parameter Estimation, and Plot Visualization of Adsorption Kinetic Models. 2022. Available online: https://cran.r-project.org/web/packages/PUPAK/index.html (accessed on 22 March 2025).
  61. Lagergen, S. About the Theory of So-Called Adsorption of Soluble Substances. K. Sven. Vetenskapsakademiens Handl. 1898, 24, 1–39. [Google Scholar]
  62. Weber, J.; Walter, J.; Morris, J.C. Kinetics of adsorption on carbon from solution. J. Sanit. Eng. Div. 1963, 89, 31–59. [Google Scholar]
  63. Cheng, Z.; Ding, W. Ammonium removal from water by natural and modified zeolite: Kinetic, equilibrium, and thermodynamic studies. Desalin. Water Treat. 2015, 55, 978–985. [Google Scholar] [CrossRef]
  64. Tang, H.; Xu, X.; Wang, B.; Lv, C.; Shi, D. Removal of Ammonium from Swine Wastewater Using Synthesized Zeolite from Fly Ash. Sustainability 2020, 12, 3423. [Google Scholar] [CrossRef]
  65. Haghseresht, F.; Lu, G.Q. Adsorption characteristics of phenolic compounds onto coal-reject-derived adsorbents. Energy Fuels 1998, 12, 1100–1107. [Google Scholar] [CrossRef]
  66. Huang, H.; Yang, L.; Xue, Q.; Liu, J.; Hou, L.; Ding, L. Removal of ammonium from swine wastewater by zeolite combined with chlorination for regeneration. J. Environ. Manag. 2015, 160, 333–341. [Google Scholar] [CrossRef]
  67. Ivanova, E.; Karsheva, M.; Koumanova, B. Adsorption of ammonium ions onto natural zeolite. J. Univ. Chem. Technol. Metall. 2010, 45, 295–302. [Google Scholar]
  68. Foo, K.Y.; Hameed, B.H. Insights into the modeling of adsorption isotherm systems. Chem. Eng. J. 2010, 156, 2–10. [Google Scholar] [CrossRef]
  69. Moussavi, G.; Talebi, S.; Farrokhi, M.; Sabouti, R.M. The investigation of mechanism, kinetic and isotherm of ammonia and humic acid co-adsorption onto natural zeolite. Chem. Eng. J. 2011, 171, 1159–1169. [Google Scholar] [CrossRef]
  70. Shaban, M.; AbuKhadra, M.R.; Nasief, F.M.; Abd El-Salam, H.M. Removal of ammonia from aqueous solutions, groundwater, and wastewater using mechanically activated clinoptilolite and synthetic zeolite-A: Kinetic and equilibrium studies. Water Air Soil Pollut. 2017, 228, 11. [Google Scholar] [CrossRef]
  71. Leggo, P.J.; Cochemé, J.-J.; Demant, A.; Lee, W.T. The role of argillic alteration in the zeolitization of volcanic glass. Mineral. Mag. 2001, 65, 653–663. [Google Scholar]
  72. Holder, C.F.; Schaak, R.E. Tutorial on powder X-ray diffraction for characterizing nanoscale materials. ACS Nano 2019, 13, 7359–7365. [Google Scholar] [CrossRef]
  73. Wang, J.; Guo, X. Adsorption kinetic models: Physical meanings, applications, and solving methods. J. Hazard. Mater. 2020, 390, 122156. [Google Scholar] [CrossRef]
  74. Demir, A.; Günay, A.; Debik, E. Ammonium removal from aqueous solution by ion-exchange using packed bed natural zeolite. Water SA 2002, 28, 329–335. [Google Scholar] [CrossRef]
  75. Farkaš, A.; Rožić, M.; Barbarić-Mikočević, Ž. Ammonium exchange in leakage waters of waste dumps using natural zeolite from the Krapina region, Croatia. J. Hazard. Mater. 2005, 117, 25–33. [Google Scholar] [CrossRef]
  76. Gualtieri, A.F.; Passaglia, E.; Galli, E. Ion exchange selectivity of phillipsite. Stud. Surf. Sci. Catal. 2002, 142, 1705–1712. [Google Scholar] [CrossRef]
  77. Kong, M.; Liu, Z.; Vogt, T.; Lee, Y. Chabazite structures with Li+, Na+, Ag+, K+, NH4+, Rb and Cs as extra-framework cations. Microporous Mesoporous Mater. 2016, 221, 253–263. [Google Scholar] [CrossRef]
  78. Proskynitopoulou, V.; Garagounis, I.; Vourros, A.; Dimopoulos, P.; Lorentzou, S.; Zouboulis, A. Nutrient recovery from digestate: Pilot test experiments. J. Environ. Manag. 2024, 353, 120166. [Google Scholar] [CrossRef]
  79. Dal Verme, M.; Lipari, D.; Lucido, G.; Maio, V.; Surace, V.; Liberatore, P. Statistical Report 2021: Renewable Energy Sources in Italy; GSE—Gestore dei Servizi Energetici: Rome, Italy, 2021. [Google Scholar]
  80. Exploring Digestate’s Contribution to Healthy Soils; European Biogas Association: Brussels, Belgium, 2022.
Figure 1. Geographic location of the three biogas plants.
Recycling 10 00137 g001
Figure 2. Equilibrium adsorption capacity “qe” (mg⋅g−1) against equilibrium concentration “Ce” (mg⋅L−1) after a contact time of 24 h for each digestate; the dashed lines represent the nonlinear Langmuir and Freundlich models. Graphs are isotherms of (A) raw municipal solid waste digestate, (B) clarified municipal solid waste digestate, (C) separated swine digestate, (D) microfiltered swine digestate, and (E) separated cattle digestate.
Recycling 10 00137 g002
Figure 3. Variation in the separation factor “RL” as a function of the equilibrium ammonium concentration “Ce” for the different digestates. MSW-R = raw municipal solid waste digestate, MSW-C = clarified municipal solid waste digestate, Swine LD-S = separated swine digestate, Swine LD-M = microfiltered swine digestate, and Cattle LD-S = separated cattle digestate.
Recycling 10 00137 g003
Figure 4. qt against Time plot for the different digestates; full dots are data with F(t) < 90%; thus, they have been considered in kinetic analyzes; empty dots are data with F(t) > 90%; thus, they were not taken into consideration; dotted lines represent the PSO nonlinear model. (A) Kinetic model for MSW-R, (B) kinetic model for MSW-C, (C) kinetic model for Swine LD-S, (D) kinetic model for Swine LD-M, and (E) kinetic model for Cattle LD-S.
Recycling 10 00137 g004
Figure 5. ID plots (qt against T0.5, Equation (11)); (A) ID model for MSW-R, (B) ID model for MSW-C, (C) ID model for Swine LD-S, (D) ID model for Swine LD-M, and (E) ID model for Cattle LD-S.
Recycling 10 00137 g005
Figure 6. NH4+-N reduction as a function of contact time. The S/L ratio of the zeolitic tuff used was 5%.
Recycling 10 00137 g006
Figure 7. NH4+-N reduction as a function of the S/L ratio of the zeolitic tuff that was used during the experiment.
Recycling 10 00137 g007
Figure 8. kg N recovered daily as a function of the S/L ratio of the zeolitic tuff that was used during the experiment.
Recycling 10 00137 g008
Table 1. Physico-chemical properties of liquid digestates. EC = electrical conductivity; TS = total solids; TKN = total Kjeldahl N.
MSWPig SlurryCattle Slurry
RawClarifiedSeparatedMicrofilteredSeparated
pH 7.89 ± 0.058.66 ± 0.007.62 ± 0.017.77 ± 0.007.75 ± 0.01
ECmS⋅cm−125.8 ± 0.421.7 ± 0.527.4 ± 1.527.2 ± 0.735.8 ± 1.5
TSg⋅L−114.1 ± 2.08.3 ± 0.132 ± 0.228.6 ± 0.431.6 ± 1.9
TKNmg⋅L−12514 ± 121812 ± 224353 ± 1904100 ± 1173950 ± 79
NH4+-Nmg⋅L−12031 ± 241681 ± 373085 ± 1562993 ± 1503000 ± 91
Na+mg⋅L−11474 ± 902010 ± 47557 ± 36558 ± 32285 ± 41
Mg2+mg⋅L−1188 ± 51102 ±7275 ± 34161 ± 1129 ± 12
K+mg⋅L−11799 ± 1251587 ± 322044 ± 1042115 ± 814326 ± 328
Ca2+mg⋅L−11414 ± 41277.4 ± 19.7720 ± 41725 ± 24293 ± 47
Table 2. Physico-chemical properties of the zeolitic tuff. QPA = quantitative phase analysis; chemical composition data were obtained through X-ray fluorescence analysis; CEC = cation exchange capacity; TZC = total zeolitic content. The category “other” includes undetectable phases due to minimal quantity and non-crystalline material. In the mineralogical analyses, the standard deviation (σQ, shown in parentheses) of the weight percentage for each phase (Q) was calculated from the values in the output file following refinement with the GSAS software (https://subversion.xray.aps.anl.gov/trac/EXPGUI), using the formula σQ = {[(σa/a)2 + (σb/b)2]1/2} Q [40], where a and b are the two variables with the greatest influence on Q, representing the weight fraction of the phase and the internal standard, respectively, while σa and σb are their standard deviations.
Chemical CompositionQPA CEC
% %cmol+·kg−1
SiO256.79Chabazite19.0 (3)233
TiO20.42Phillipsite10.0 (2)
Al2O316.50Mica/Illite/Biotite0.7 (2)
Fe2O33.00Sanidine13.6 (2)
MnO0.14Pyroxene2.5 (2)
MgO0.98Quartz2.7 (7)
CaO4.69Plagioclase7.0 (1)
Na2O1.25Other44.3 (5)
K2O6.21
P2O50.15TZC29.0
LOI9.86
Table 3. Parameters calculated by the Freundlich (Equation (3)) and Langmuir isotherms (Equation (4)) for MSW-R, MSW-C, Swine LD-S, Swine LD-M and Cattle LD-S at a temperature of 298.15 K (25 °C). MSW-R = raw municipal solid waste digestate, MSW-C = clarified municipal solid waste digestate, Swine LD-S = separated swine digestate, Swine LD-M = microfiltered swine digestate, and Cattle LD-S = separated cattle digestate.
FreundlichLangmuir
TR2p-ValueKFnAICR2p-ValueqmaxKLAIC
[K][-][-][mg⋅g−1⋅ (L⋅g−1)1/n][-][-][-][-][mg⋅g−1][L⋅g−1][-]
MSW-R298.150.964.58 × 10−139.062.2126.60.986.05 × 10−1315.691.472716.5
MSW-C298.150.971.50 × 10−128.472.5912.70.961.49 × 10−1111.422.97118.9
Swine LD-S298.150.919.34 × 10−96.061.7833.30.871.04 × 10−718.830.467339.5
Swine LD-M298.150.931.28 × 10−96.261.9626.80.901.17 × 10−816.930.583132.2
Cattle LD-S298.150.922.94 × 10−85.981.9924.40.901.17 × 10−715.050.671128.7
Table 4. Thermodynamic parameters of ΔG (Equation (6)) and Ke calculated by Equation (7) at a temperature of 298.15 K (25 °C).
MSW-RMSW-CSwine LD-SSwine LD-MCattle LD-S
Ke[-]14.81788.67.7
ΔG[J⋅mol−1]−6687−7024−5290−5325−5075
Table 5. Statistical and kinetic parameters of the tested PSO and PFO models: root mean square error (RMSE), mean squared error (MSE), Akaike information criterion (AIC), Bayesian information criterion (BIC), k1 (PFO constant), and k2 (PSO constant).
MODELRMSEMSEAICBICK1K2
[-][-][-][-][-][min−1][g·mg−1·min−1]
MSW-RPFO1.11.222.121.70.159
PSO0.40.18.58.1 0.030
MSW-CPFO1.42.028.728.60.071
PSO1.01.023.623.5 0.017
Swine LD-SPFO1.21.426.226.10.056
PSO0.70.418.118.0 0.009
Swine LD-MPFO1.21.523.523.10.100
PSO0.70.416.115.7 0.018
Cattle LD-SPFO0.70.514.713.90.064
PSO0.60.312.812.0 0.011
Table 6. ID parameters for the ID model for MSW-R, MSW-C, Swine LD-S, Swine LD-M, and Cattle LD-S.
ID Model
R2KIDC
[-][mg·g−1·min−0.5][mg·g−1]
MSW-RRegion 10.881.831.74
Region 20.790.197.54
MSW-CRegion 11.000.912.32
Region 20.980.354.31
Swine LD-SRegion 10.691.370.86
Region 20.990.564.82
Swine LD-MRegion 10.851.471.84
Region 20.850.645.05
Cattle LD-SRegion 10.951.670.33
Region 20.860.783.75
Disclaimer/Publisher’s Note: The statements, opinions and data contained in all publications are solely those of the individual author(s) and contributor(s) and not of MDPI and/or the editor(s). MDPI and/or the editor(s) disclaim responsibility for any injury to people or property resulting from any ideas, methods, instructions or products referred to in the content.

