3.1. Workability
Figure 8 illustrates the effect of varying GFA and FA contents on the flowability of mortar. As shown in
Figure 8, increasing the <4.75 mm GFA content significantly improves flowability, indicating that GFA enhances the workability of the mix.
Figure 8b further demonstrates that 1.18–4.75 mm GFA results in a similar flow increase to <4.75 mm GFA mixes. This indicates that deviating from the standard size range specified in ASTM C33 [
33] did not affect the flow when using 1.18–4.75 mm GFA. However, <1.18 mm GFA resulted in a noticeable reduction in flow compared to the <4.75 mm mixes, though the decrease was not significant when compared to the control mix without GFA. This reduction in flow observed with <1.18 mm GFA can be attributed to the loss of smooth surface texture, as shown in
Figure 3.
These smooth surfaces originate from the nature of the waste glass, which is largely sourced from consumer products such as bottles. The smooth texture of GFA reduces interparticle friction, thereby facilitating better flow. However, when GFA is crushed into finer sizes, the total area of the smooth surface diminishes, reducing its influence on flowability. Nonetheless, even the finer GFA retains some degree of surface smoothness when compared to river sand, as evidenced by the SEM images in
Figure 3. This explains the slight increase in flow observed at higher replacement levels of <1.18 mm GFA. In the <4.75 mm range, which includes both large and fine GFA particles, the flowability increases but shows intermediate values compared to mixes with 1.18–4.75 and <1.18 mm GFA. This is attributed to the combined influence of the smooth surfaces of larger particles and the reduced surface area effect of finer particles.
The incorporation of FA significantly improves the flowability of mortar, with higher FA replacement levels further enhancing this effect, as shown in
Figure 8a. This improvement is attributed to the smooth and spherical morphology of FA particles, which promotes better flow compared to the irregular, angular shapes of OPC particles, as illustrated in
Figure 4. The spherical shape of FA reduces inter-particle friction within the mix.
3.2. ASR Expansion
Figure 9 presents the MBT ASR expansion results for mortar incorporating increasing GFA content, varying GFA particle sizes, and different levels of FA. As illustrated in
Figure 9a, the ASR expansion increases significantly with higher levels of <4.75 mm GFA replacement. At 100% replacement, the ASR expansion reaches 0.2%, which is the threshold value for reactive aggregates as defined by ASTM C1260 [
43]. Ismail and Al-Hashmi [
15] and Limbachiya [
27] observed 298% and 142% increases in ASR expansion compared to the control, respectively, when 20% GFA was used in cementitious composites. This indicates that the use of GFA at high replacement levels poses a substantial risk of deleterious ASR-induced damage.
A comparison of the ASR behaviour of different GFA size ranges is shown in
Figure 9b,c. The mixes containing 1.18–4.75 mm GFA exhibit significantly higher expansion, reaching values up to 0.5%, which surpasses the ASTM threshold. In contrast, mixes incorporating <1.18 mm GFA show considerably lower expansion, peaking at only 0.12%. These observations are consistent with prior studies. Rajabipour et al. [
51] reported that glass finer than 0.6 mm resulted in negligible expansion, while particles around 1.8 mm exhibited significantly higher ASR. Similarly, Yuksel et al. [
52] found that glass finer than 1 mm produced expansions ≤0.04%, whereas coarse glass aggregates (2–4 mm) reached expansions exceeding 1.1% after 180 days. Liu et al. [
53] confirmed this trend, reporting that glass larger than 1 mm reached 0.54% expansion. These results indicate that ASR expansion is predominantly driven by the presence of larger glass particles, likely due to their greater surface area exposed to the alkaline environment, their slower pozzolanic reactivity relative to finer particles, and a higher likelihood of containing residual microcracks that can serve as initiation sites for ASR [
51,
54].
Although the reduction in GFA particle size effectively lowers ASR expansion, it is not sufficient to fully mitigate the risk. According to ASTM C1260 [
43], expansion values exceeding 0.10% after 14 days are considered potentially deleterious. Since the mixes with <1.18 mm GFA exceed this limit at some replacement levels, it can be concluded that reducing GFA size alone does not ensure long-term ASR safety. Nonetheless, the addition of FA effectively eliminated ASR expansion, as shown in
Figure 9c–e. Notably, even a 10% replacement of OPC with FA was sufficient to reduce ASR expansion to a level lower than that of the control without GFA. In this study, ASR expansion decreased from 0.20% to 0.044% with 10% FA, achieving complete mitigation. This result is supported by previous studies. Kim et al. [
18] reported that 10% FA reduced ASR expansion from 0.151% to 0.078% in mortars incorporating GFA between 4.75 mm and 1.18 mm. Similarly, Topçu et al. [
20] observed that 10% FA reduced expansion by approximately 38% in mortars containing 100% waste glass aggregate. These results highlight the high effectiveness of FA as an ASR mitigating SCM in GFA mortar. Several mechanisms are at play to cause this ASR mitigation by FA. The low CaO content in FA reduces the availability of calcium hydroxide in the system and suppresses high pH conditions that accelerate the reaction [
10,
55]. The pozzolanic reaction between FA and Portlandite [Ca(OH)
2] leads to the formation of a denser C-S-H phase with a lower Ca/Si ratio, which enhances the binding of alkalis and reduces their concentration in the pore solution, thereby further inhibiting ASR development [
41,
56,
57]. FA also appears to improve the microstructure of mortar. As shown in the SEM images in
Figure 10, the mortar containing FA exhibits a denser and less porous microstructure compared to the mortar made with 100% OPC. This microstructural refinement contributes to reduced ionic mobility and permeability, further enhancing ASR resistance [
58].
Moreover, across all FA replacement levels in mixes with <4.75 mm GFA, an interesting trend was observed where increasing GFA content led to a reduction in ASR expansion. This contrasts with the behaviour seen in OPC mixes containing <4.75 mm and 1.18–4.75 mm GFA size ranges, which both showed an increase in ASR expansion as the GFA content increased. A similar decreasing trend was also evident in the <1.18 mm GFA mix without FA, which showed ASR mitigation compared to mixes containing larger GFA size ranges (<4.75 and 1.18–4.75 mm). This behaviour is likely due to the dense and impermeable structure of GFA particles, which may act as physical barriers that hinder the penetration of the alkaline NaOH solution, thereby reducing ASR activity [
19,
59]. This effect is only observable when ASR expansion is effectively mitigated, in this study, through either the inclusion of FA or the use of <1.18 mm GFA. In mixes with high ASR expansion, the expansion due to ASR dominates the system, overshadowing this effect.
3.4. Life Cycle Assessment Results
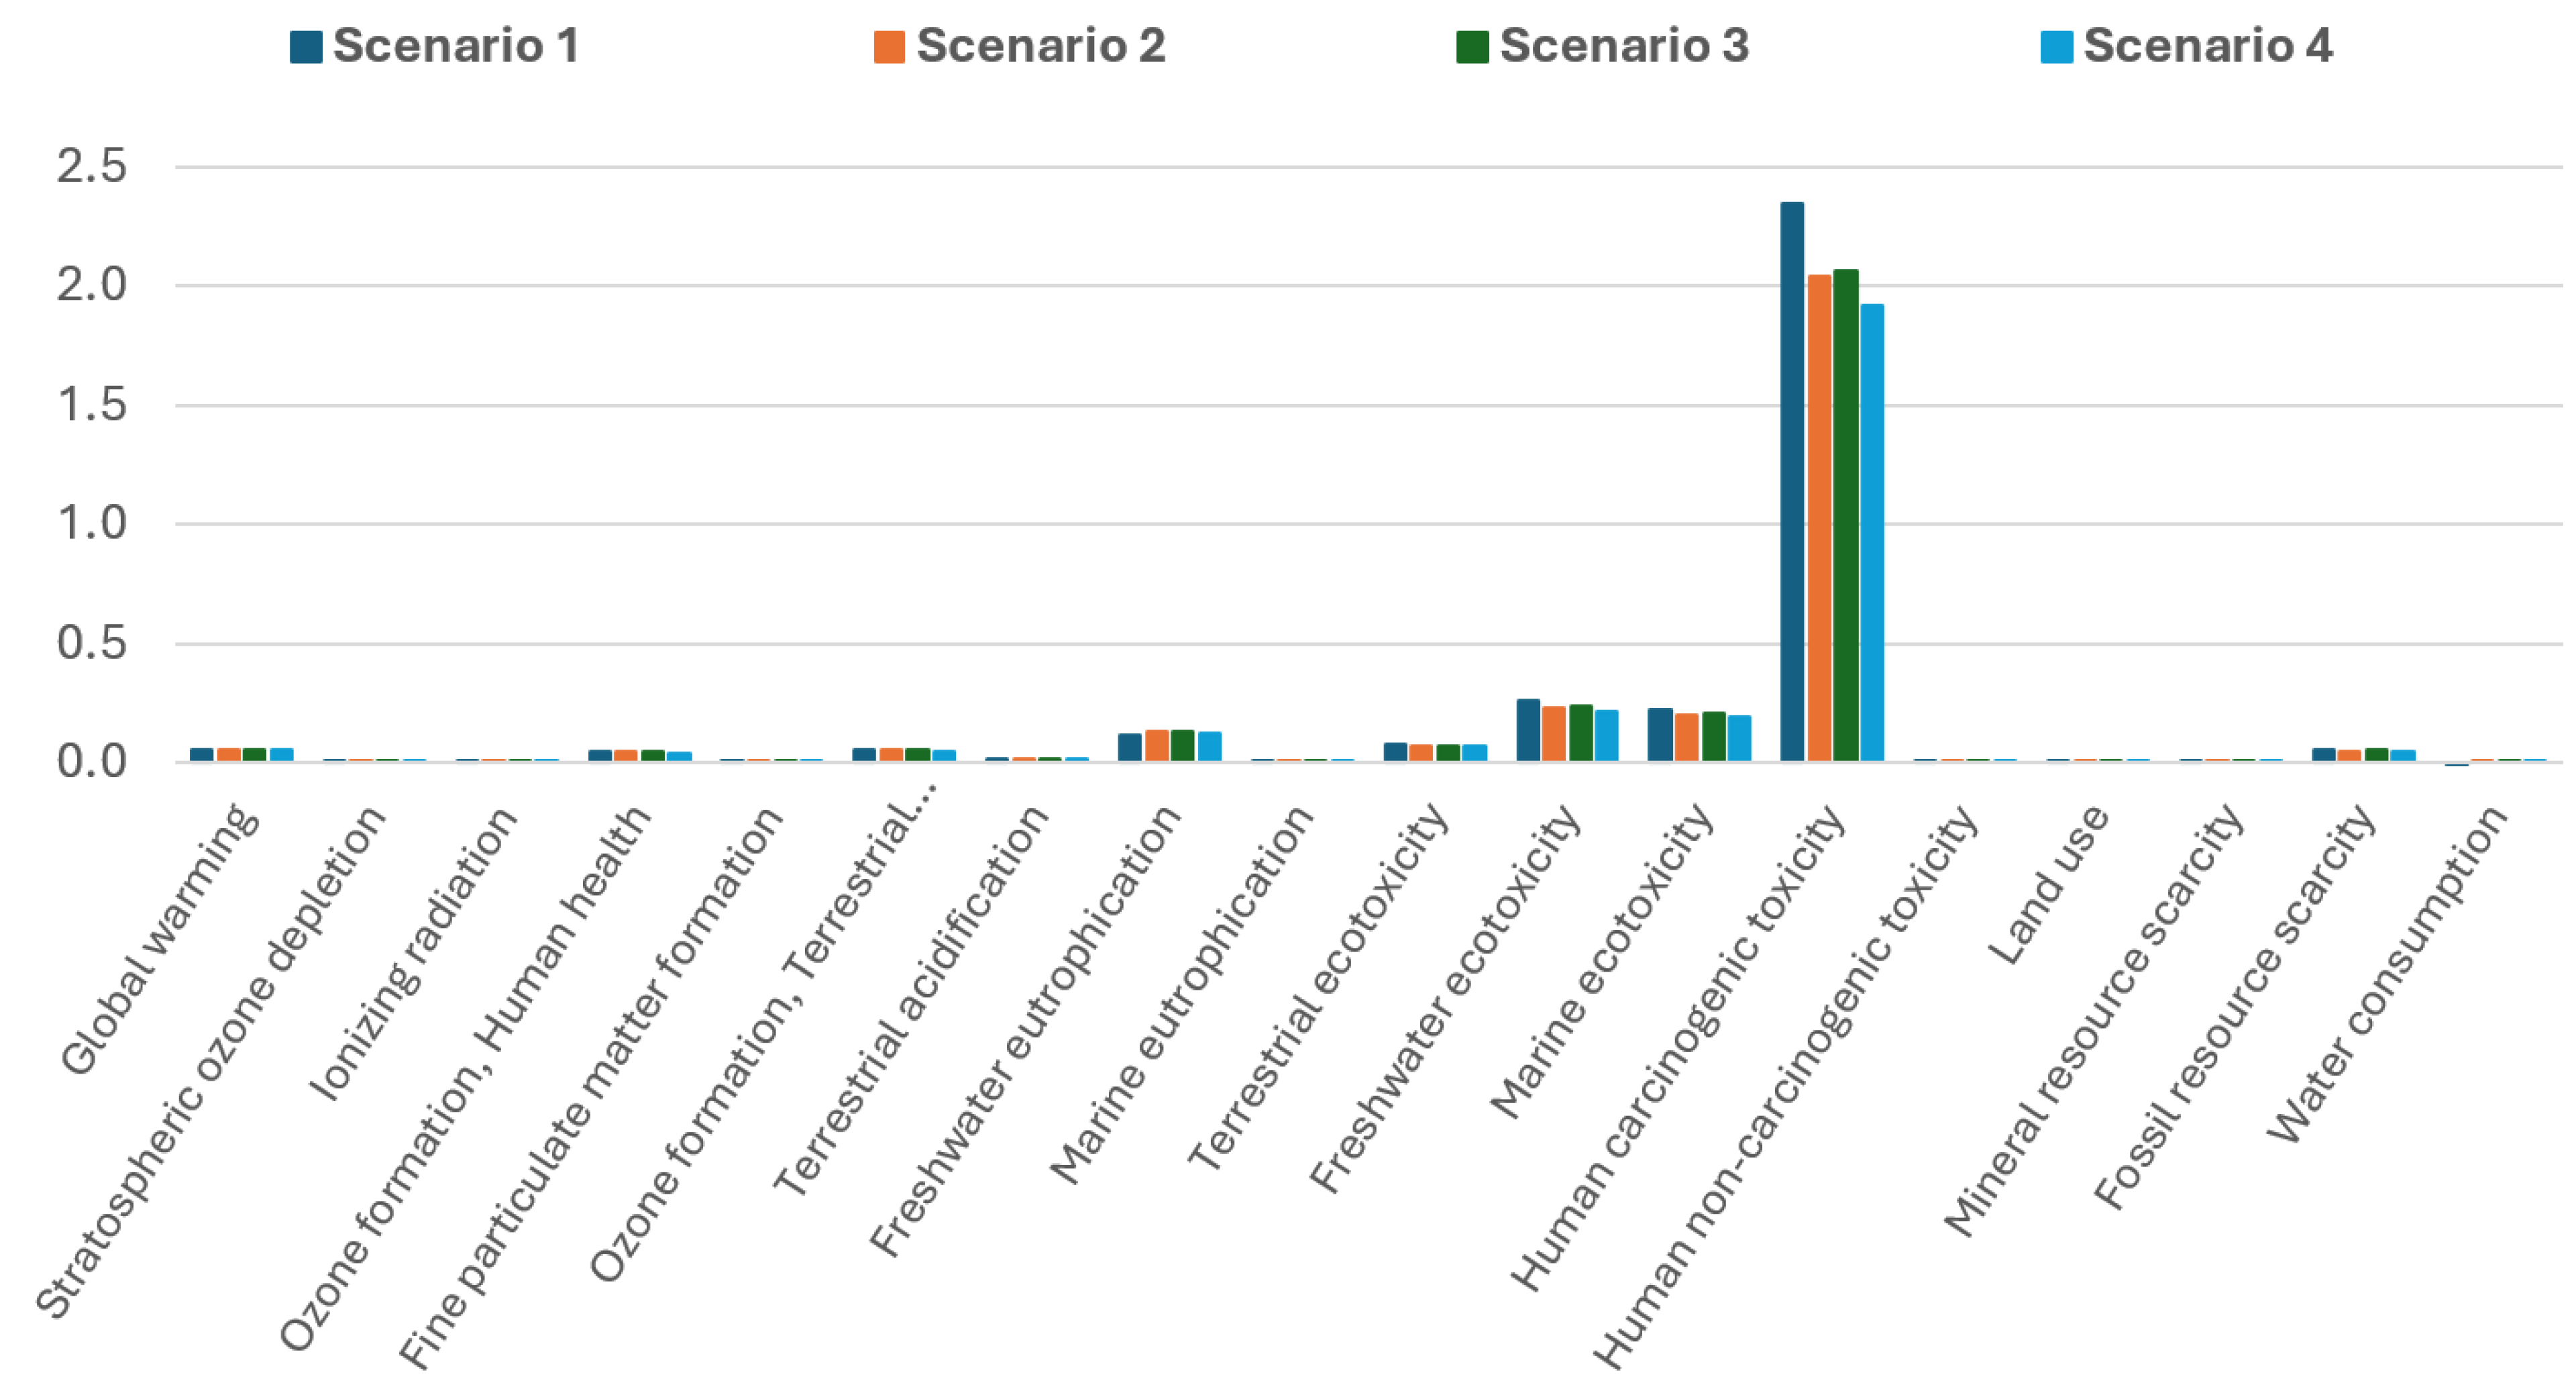
Figure 15 presents normalised midpoint results, highlighting the most critical environmental impacts associated with mortar production. The most dominant impact categories identified from the results include human carcinogenic toxicity, freshwater ecotoxicity, marine ecotoxicity, freshwater eutrophication, and global warming potential. These impacts represent the highest environmental burdens in the conventional mix (S1) and are therefore used as the primary basis for evaluating the performance of the alternative mixes in S2, S3, and S4.
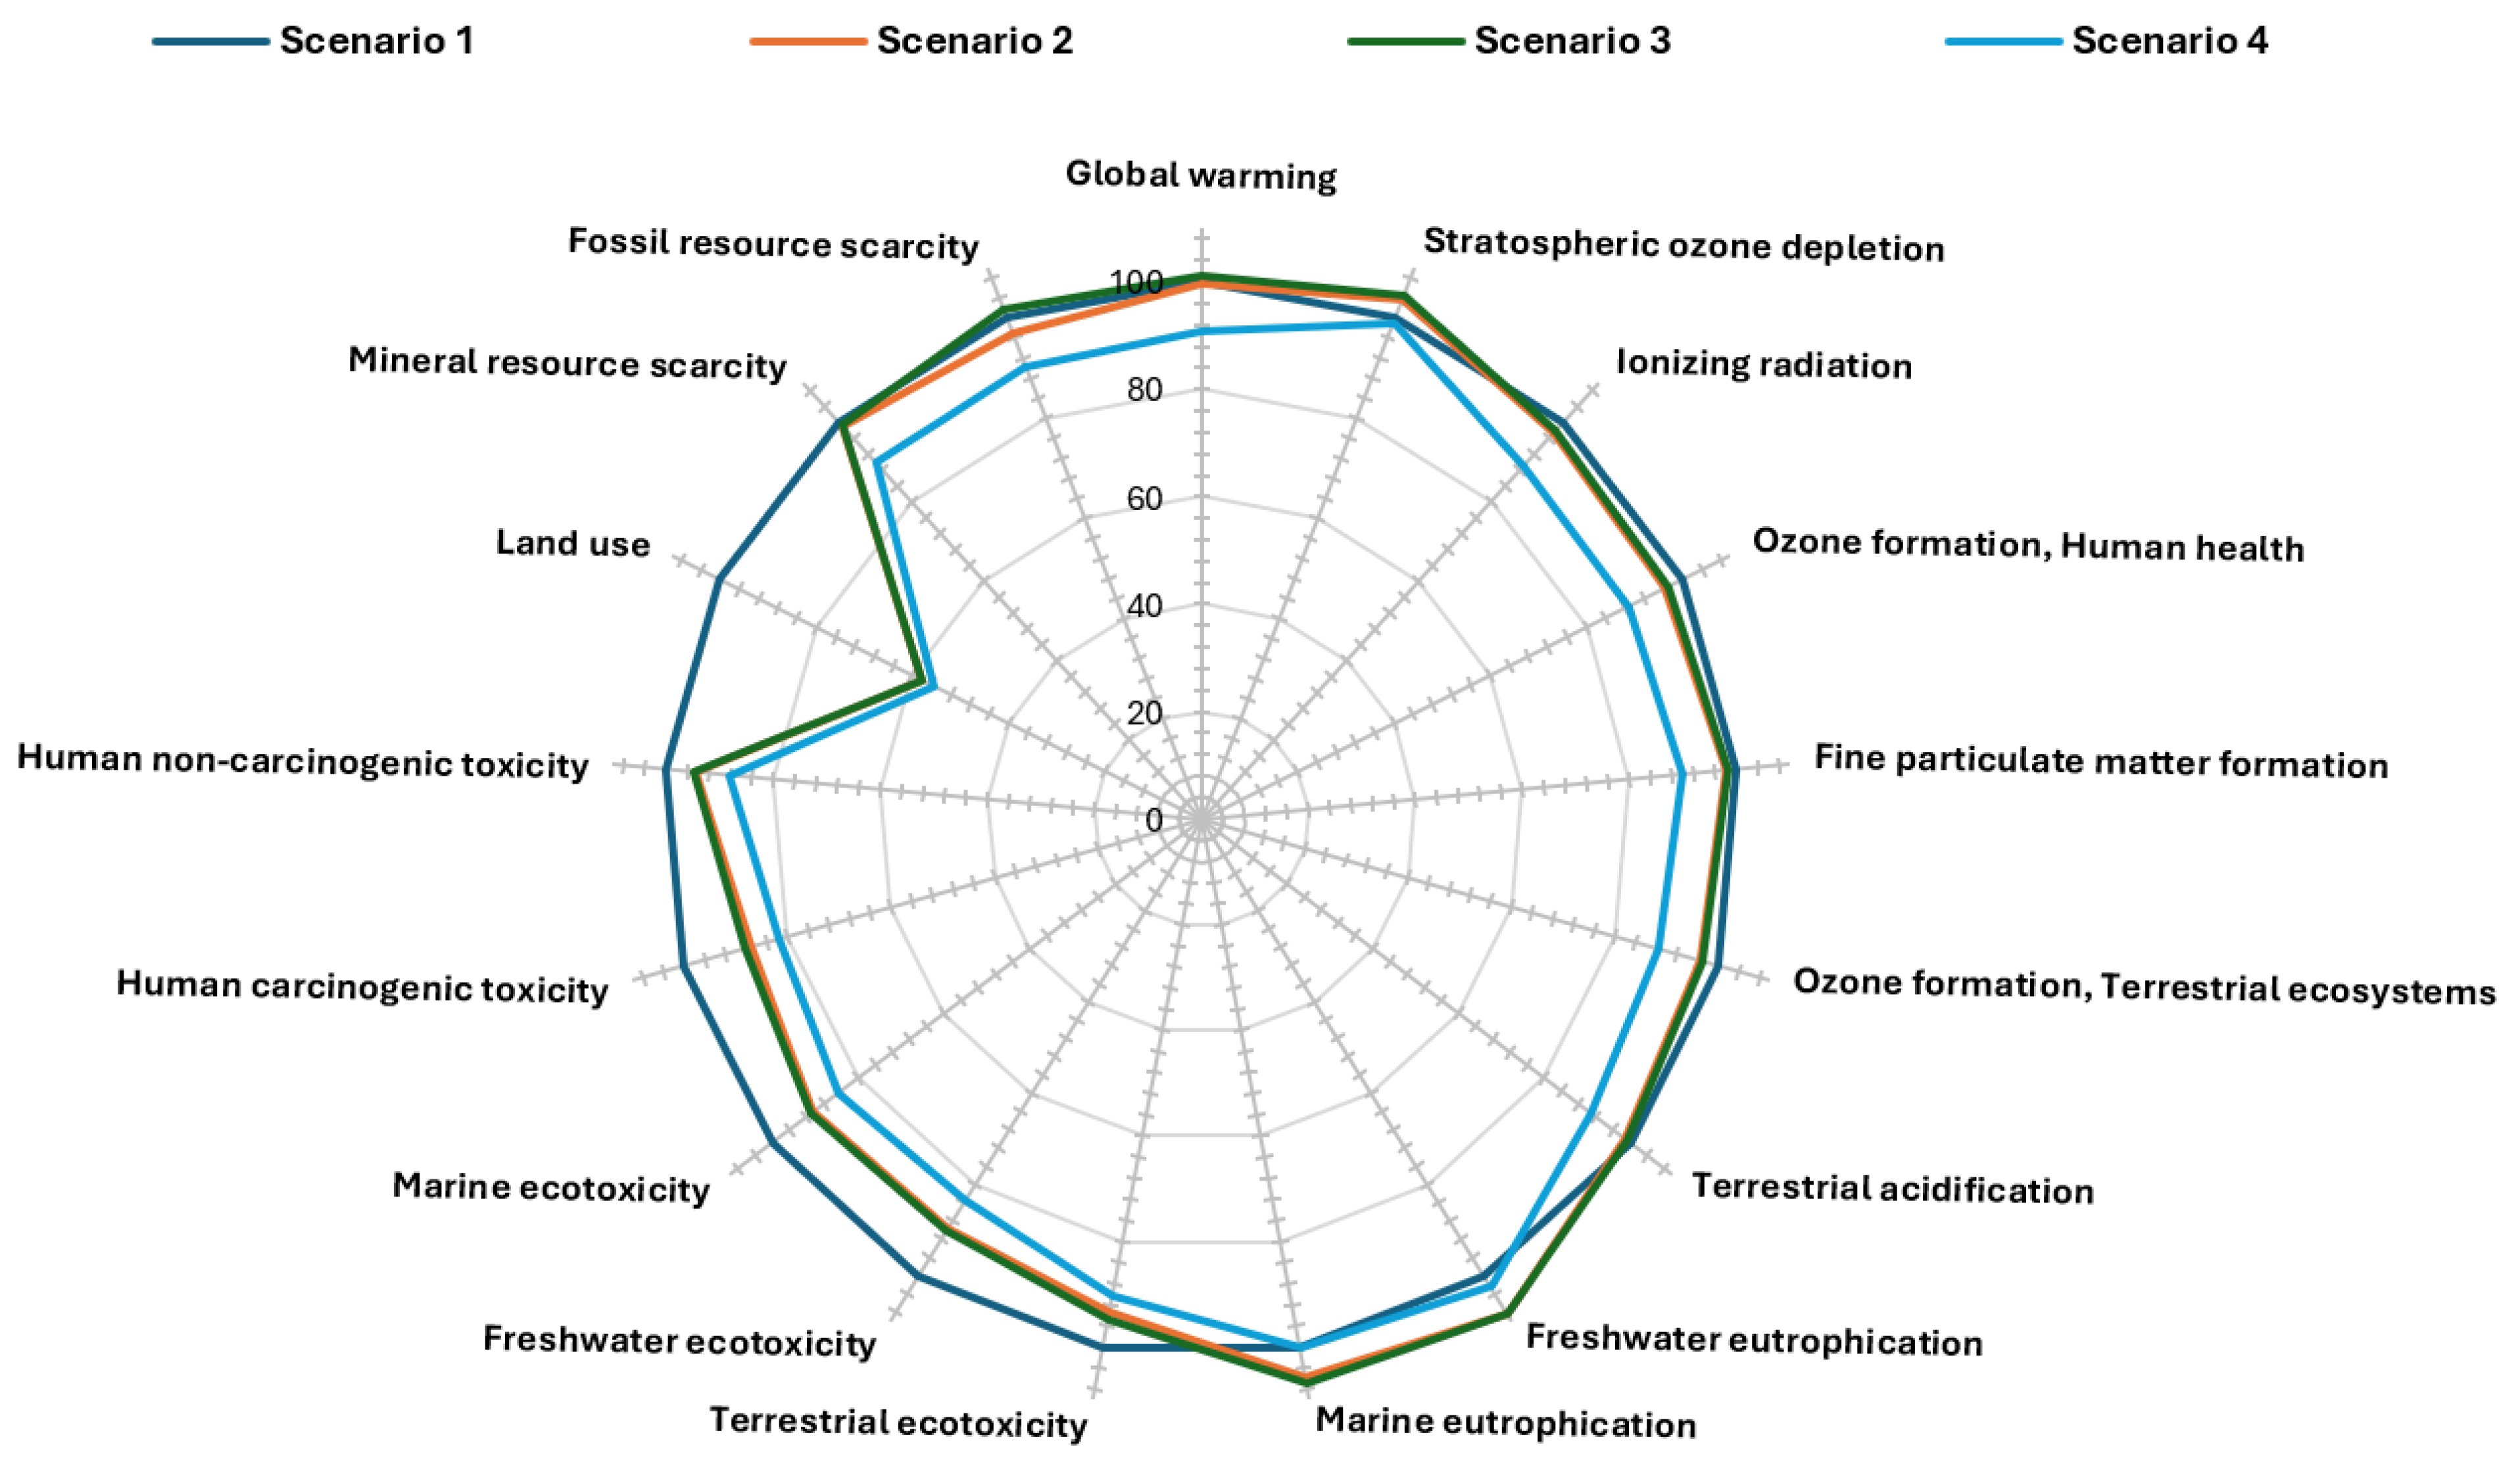
Figure 16 shows the characterised midpoint results as percentage differences in those environmental impacts for S2, S3, and S4 relative to S1, with S1 serving as the baseline, while
Table 6 presents the relevant midpoint results. When 60% of virgin sand was replaced with <4.75 mm GFA in S2, modest improvements were observed in most key impact areas. Human carcinogenic toxicity decreased by approximately 13%, which can be attributed to the reduced demand for natural raw materials and the utilisation of recycled glass that carries lower upstream emissions. Similarly, freshwater and marine ecotoxicity declined by around 7% to 13%, indicating that the environmental load from waste glass processing is lower than that associated with river sand extraction. A slight reduction in global warming potential was also observed (0.4% lower than S1), reflecting the avoided emissions from waste glass landfilling. However, freshwater eutrophication increased by about 8%, likely due to the water used in cleaning and processing the GFA. Overall, S2 delivered environmental benefits in most categories, though some trade-offs emerged.
Further refining GFA to a size below 1.18 mm (S3) led to less favourable outcomes. According to the waste recycling facility iQRenew, further crushing glass below 1.18 mm requires an additional drying step, as screening particles smaller than 2 mm becomes difficult without it. This additional energy required for drying increased the environmental burden in several categories. Fossil resource scarcity was the most affected, increasing by 4.5% compared to S2, which had previously shown a 2.9% reduction compared to S1. Global warming and terrestrial ecotoxicity followed, rising by 1.3% and 1.4% over S2, respectively. All other impact categories also showed slight worsening in S3 compared to S2. These results indicate that reducing GFA size to below 1.18 mm introduces additional environmental burdens that diminish the gains achieved through partial sand replacement by <4.75 mm GFA.
In S4, where 10% of OPC was replaced with FA alongside 60% GFA, significant improvements were observed across all high-impact categories. Human carcinogenic toxicity showed the most substantial reduction, decreasing by 18.2% compared to S1, due to the lower emissions associated with FA production and the reduced clinker content. Freshwater and marine ecotoxicity decreased by 16.4% and 15.5%, respectively, reflecting the dual benefit of reduced emissions and enhanced matrix densification from the pozzolanic activity of FA. Importantly, freshwater eutrophication, which had increased in both S2 and S3, was brought back below the baseline level in S4, with only a 2.4% increase over S1. This indicates that FA replacement not only compensates for the environmental costs of GFA processing but also contributes additional significant sustainability gains. Global warming potential also dropped substantially, with an 18% reduction compared to the control, reaffirming the advantage of reducing clinker usage in cementitious materials.
The results for water consumption require careful interpretation, particularly in S1, where a negative value is reported. This anomaly arises from the Ecoinvent database’s modelling of glass landfilling, which accounts for the capture of landfill leachate that is directed to wastewater treatment. As a result, the system assigns a net negative water use to S1, which does not reflect actual water savings but rather a modelling artefact. In contrast, Scenarios 2, 3, and 4 show small positive water consumption values, mainly due to the washing and processing of GFA. Despite this, water use remains low in absolute terms and is not among the most critical impact categories. On the other hand, land use shows a clear environmental benefit in all GFA-containing scenarios. The use of recycled glass reduces dependence on virgin sand extraction and, more importantly, avoids the need for landfilling glass waste. As a result, land use impacts are reduced by 42% in S2 and S3, and by 47% in S4 compared to S1, reinforcing the resource conservation and circular economy advantages of GFA utilisation in mortar production.
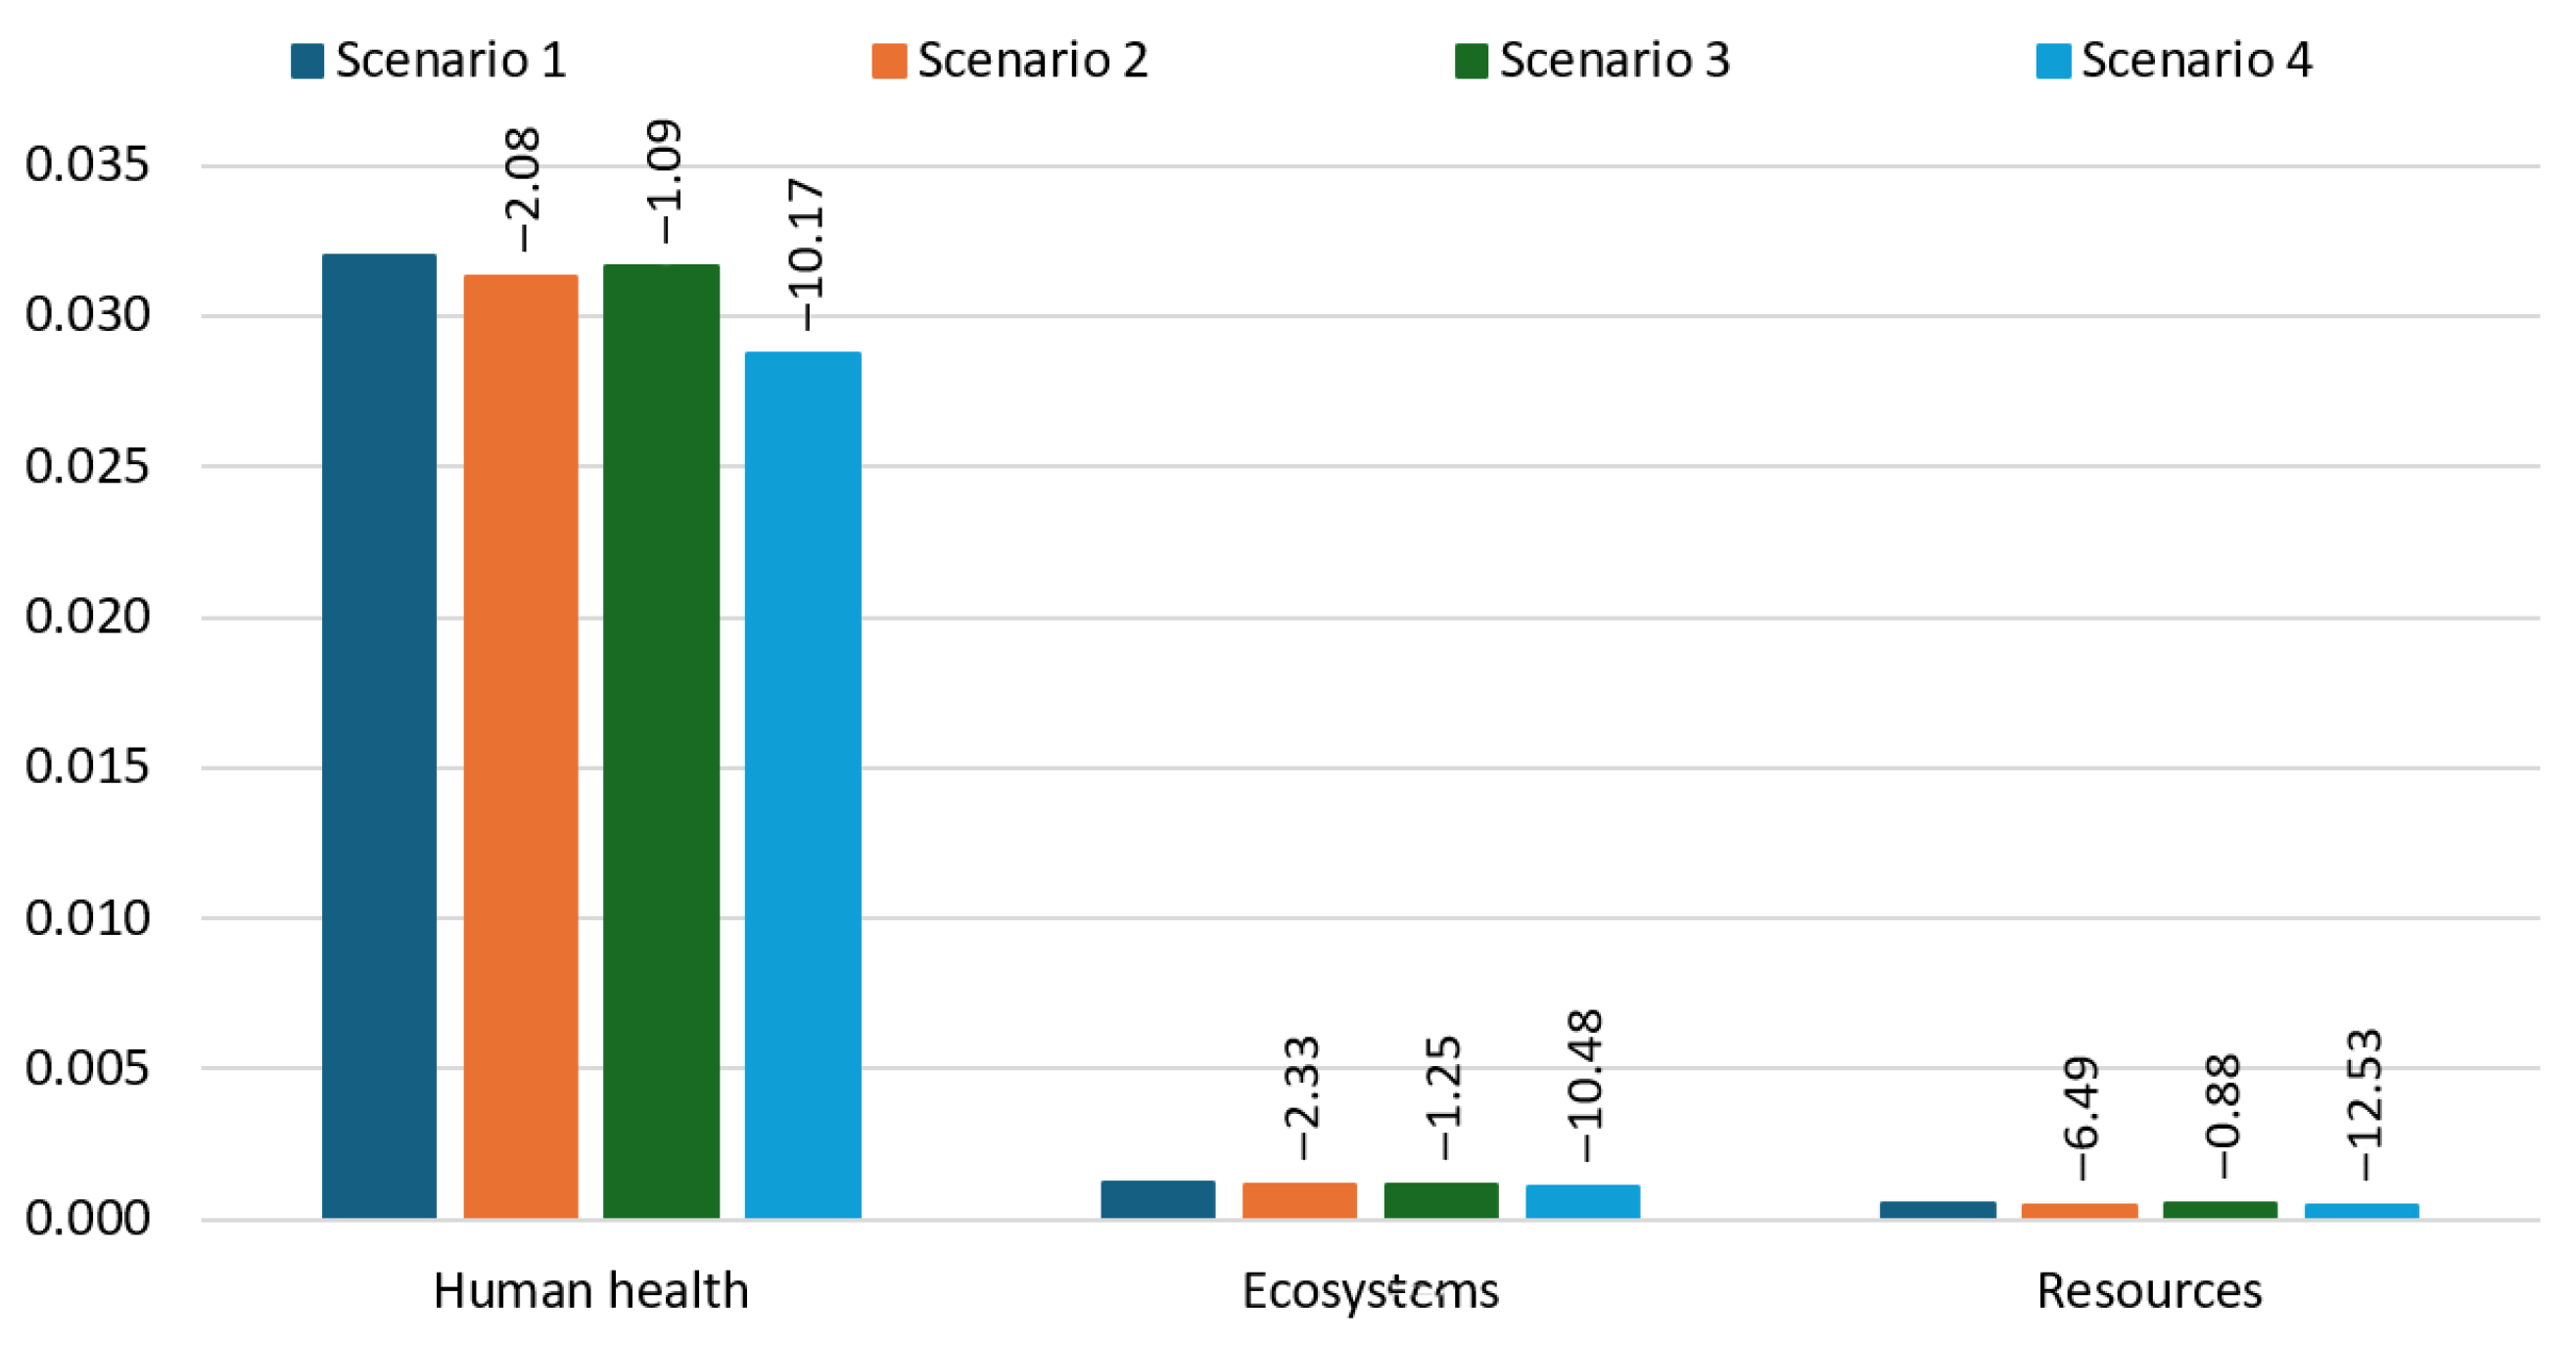
Figure 17 presents the normalised endpoint results, summarising the overall environmental burden of each scenario across three damage categories: Human Health, Ecosystems, and Resources. These results provide a high-level interpretation of the environmental trade-offs and benefits associated with the substitution of conventional materials with GFA and FA. In the Human Health category, S2 and S3 show very limited improvements over S1, with percentage reductions of only 2.08% and 1.09%, respectively.
This indicates that replacing 60% of river sand with GFA, whether at <4.75 mm or <1.18 mm, offers only marginal health-related environmental benefits when OPC content remains unchanged. In contrast, S4, which combines GFA with 10% FA replacement for OPC, shows a significant reduction of 18.26% in human health-related impacts. This demonstrates that FA plays a critical role in reducing emissions and pollutants associated with clinker production, which are major contributors to human toxicity, particulate matter formation, and related health risks. The Ecosystems category follows a similar trend. S2 and S3 provide minimal improvements (2.33% and 1.25% reductions, respectively), whereas S4 shows a substantial 18.62% decrease. This reflects the contribution of FA to lowering acidification, eutrophication, and ecotoxicity-related burdens, which directly affect terrestrial and aquatic ecosystems. The low improvement seen in S3 also confirms that the environmental cost of processing <1.18 mm GFA offsets its marginal benefits in this category. In the Resources category, the benefits of FA replacement are again evident. While S2 and S3 reduce resource-related impacts by only 6.49% and 0.88%, respectively, S4 achieves a significant 18.56% reduction. This is due to reduced demand for clinker and virgin sand, both of which are resource-intensive. The near-neutral result for S3 is a direct consequence of the increased energy demand associated with drying fine GFA, which diminishes its resource efficiency.
Table 7 presents the cumulative energy demand for each scenario across various impact categories, while
Figure 18 illustrates the total energy demand per scenario. The total energy demand for producing 1 m
3 of mortar varies notably across the four scenarios. S1, representing conventional mortar with 100% OPC and river sand, has the highest energy demand at 2572.3 MJ, serving as the baseline. Replacing 60% of river sand with <4.75 mm GFA in S2 results in a slight reduction, bringing the total energy use down to 2503.2 MJ, a 2.7% decrease compared to S1. However, further reducing the GFA size to <1.18 mm in S3 increases the total energy demand to 2611.1 MJ, which is 1.5% higher than in S1. This increase is due to the additional drying step required for <1.18 mm GFA processing. In contrast, S4, which combines 60% GFA with 10% FA replacement for OPC, achieves the most significant reduction in total energy demand, dropping to 2151.5 MJ. This represents a 16.4% decrease from the baseline, highlighting the energy-saving potential of incorporating FA as a partial cement replacement. These results demonstrate that while the use of GFA alone offers modest benefits, combining GFA with FA delivers substantial energy efficiency in mortar production.
3.5. Multidimensional Evaluation of Performance, Environmental Impact, and Cost
A more detailed comparison of all scenarios reveals the full extent of the trade-offs between technical performance, environmental performance, and material cost. While <1.18 mm GFA demonstrated slightly better technical performance in terms of ASR mitigation (0.07% expansion vs. 0.20% with <4.75 mm GFA) and higher long-term compressive strength (40 MPa vs. 37 MPa with <4.75 mm GFA), these gains came at a disproportionate cost. Environmentally, <1.18 mm GFA failed to improve key midpoint categories beyond what was achieved with <4.75 mm GFA and, in several cases, performed worse. Environmental impacts such as fossil resource scarcity, global warming, and terrestrial ecotoxicity increased by 4.5%, 1.3%, and 1.4%, respectively, primarily due to the additional drying process required for producing <1.18 mm GFA. Total energy demand increased by 1.5% over conventional mortar and 4.3% over <1.18 mm GFA mortar, further confirming the inefficiency introduced by <1.18 mm GFA processing. Moreover, according to iQRenew, the additional drying step required to produce <1.18 mm GFA significantly increases production costs. While the cost of producing 4.75 mm GFA is approximately 1.95 AUD per tonne, the cost rises to 3.15 AUD per tonne for <1.18 mm GFA, representing a 62% increase. This added expense introduces a clear economic disadvantage to the use of <1.18 mm GFA in mortar production.
However, the FA inclusion showed the most balanced performance overall. The addition of 10% FA to the <4.75 mm GFA mix led to a 16.4% reduction in energy demand compared to conventional mortar and yielded significant environmental gains, including an 18% decrease in global warming potential and reductions of 18.2%, 16.4%, and 15.5% in carcinogenic toxicity, freshwater ecotoxicity, and marine ecotoxicity, respectively. Endpoint results also confirmed that FA utilisation reduced human health, ecosystem, and resource-related impacts by 18.2%, 18.6%, and 18.6%, respectively. These findings demonstrate that while utilising <1.18 mm GFA offers incremental technical gains, these are outweighed by its increased environmental and economic burdens. In contrast, FA inclusion not only enhances durability and energy efficiency but also provides a substantially more sustainable and economically viable solution for mortar production when used with <4.75 mm GFA.


