Article

Evaluation of Bio-Polyurethane Foam Synthesized from Liquefied Waste Wood Polyol

Graduate School of Science and Engineering, Saitama University, 255 Shimo-Okubo, Sakura-ku, Saitama 338-8570, Japan
*
Authors to whom correspondence should be addressed.
Recycling 2025, 10(4), 126; https://doi.org/10.3390/recycling10040126
Submission received: 7 May 2025 / Revised: 12 June 2025 / Accepted: 20 June 2025 / Published: 22 June 2025

Abstract

Bio-polyurethane foam was synthesized in this study using bio-polyol derived from liquefied waste wood as a sustainable alternative to petroleum-based polyols. It has been widely reported that polyurethane foams incorporating liquefied wood exhibit biodegradability when buried in soil, with assessments typically relying on CO2 emission measurements in a close system. However, this method cannot obtain any chemical bonding breakage information of the bio-polyurethane foam. On the other hand, our study investigated the biodegradation process by employing an elemental composition analysis using a CHN coder and functional group analysis through Fourier transform infrared (FT-IR) spectroscopy to capture chemical structure changing. The results demonstrated that biodegradation occurs in three different stages over time, even in the absence of significant early-stage weight loss. The gradual breakdown of urethane bonds was confirmed through changes in the elemental composition and functional group ratios, providing a more detailed understanding of the degradation mechanism. These findings suggest highlighting the importance of complementary chemical analytical techniques for a more accurate evaluation. On the other hand, TG data showed that bio-polyurethane foams remained thermally stable even after biodegradation occurred.

1. Introduction

In recent years, there has been growing societal concern regarding carbon dioxide emissions associated with petroleum-based plastic production and use, their adverse environmental impacts, and the emerging issue of microplastics [1,2,3]. Conventional petroleum-based thermosetting plastics present significant environmental challenges that extend beyond CO2 emissions during manufacturing. These materials exhibit limited recyclability and reusability after their service life [4], resulting in substantial waste management issues. Furthermore, the incineration disposal of these plastics generates not only CO2 but also dioxins and other toxic compounds, thereby imposing considerable environmental burdens throughout their lifecycle [5]. This has led to increased interest in carbon-neutral materials, energy utilization, and biodegradation for a reduced environmental impact. Within this context, numerous research efforts, including those in the authors’ laboratory, have focused on converting abundantly available woody biomass into biodegradable bioplastics [6,7,8]. Among these technologies, liquefied wood has gained attention as a method for converting waste and unused biomass resources into bio-polyols, which can then be used to create various products. The liquefaction of wood is typically carried out under relatively mild conditions—around 100 °C—in the presence of an acid catalyst using organic solvents. Although a variety of solvents and reaction conditions have been investigated, glycol-based solvents, such as polyethylene glycol (PEG), have been found to be particularly effective in promoting the degradation of major wood components such as lignin and cellulose [9,10,11,12]. In this way, synthesizing bio-polyol is one of the ways of upcycling to utilize waste biomass. Moreover, research on this technology has been ongoing due to its potential applications [13,14,15]. While polyols are primarily used as raw materials for polyurethane, they also have applications in coatings and adhesives. Given the increasing demand for biomass-derived raw materials across various industries, the market for liquefied wood-based bio-polyols is expected to expand in the future. Especially, research on producing foamed bio-polyurethane from bio-polyols derived from liquefied wood technology has been extensively studied due to the relative ease of laboratory-scale experimentation and the diverse application fields for foam materials [16,17,18,19,20,21,22].
Furthermore, when synthesizing these biomass-derived plastics, the most preferred appealing feature is their biodegradability [23,24]. However, the expression of biodegradability is ultimately determined by whether the molecular structure can be decomposed by the microorganisms present in the given environment. Therefore, being biomass-derived does not necessarily guarantee biodegradability [25,26]. At the same time, if the physical properties of these materials are significantly inferior to petroleum-derived plastics [27,28,29], their adoption in practical applications would be limited, even if they are marketed as environmentally friendly. In addition, in the evaluation of biodegradable bio-polyurethane foam, the most simple and easy assessment methods involve visual inspection and weight loss measurements after burial in soil or immersion in water [30,31,32]. However, these methods have limitations, such as difficulties in tracking time-dependent changes using more chemical or objective techniques. ASTM D5988 (ISO 17556 equivalent), for instance, measures the increase in carbon dioxide within a sealed system to quantify plastic degradation, but the closed system introduces restrictions [33,34]. Since biodegradation is caused by bacterial activity, it occurs from the sample surface in contact with the microorganisms. However, an evaluation based on weight loss involves the entire sample material and is therefore not suitable for assessing minute biodegradation in the initial stages. Consequently, measurement methods should accurately evaluate which surface conditions are more preferable for biodegradation assessments. While some studies have employed Fourier-transform infrared (FT-IR) spectroscopy [30,35] and gas chromatography and mass spectrometry (GC-MS) for analysis, many of these focus on materials that biodegrade within short periods (e.g., 1–2 months) and do not clarify the long-term biodegradation process over time [31].
In this study, bio-polyurethane foam was prepared using liquefied wood and biomass-derived isocyanate resin, and its biodegradability was evaluated over 12 months in two different environments: field environment conditions and controlled chamber environment with a gardening soil. To elucidate the time-dependent biodegradation process, the study incorporated multiple assessment techniques beyond weight loss measurements. These included CHN elemental analysis to track compositional changes, FT-IR spectroscopy to monitor variations in functional groups, and scanning electron microscope (SEM) observations to analyze structural changes over time. These combined methods provided a comprehensive evaluation of how the foamed material degrades over an extended period. Additionally, by examining the thermal properties of the biodegraded bio-polyurea foam, the thermal degradation characteristics of biomaterials derived from liquefied wood were also evaluated.

2. Materials and Methods

2.1. Materials

The biomass samples used in this study were collected from the Saitama University campus as waste wood in April 2022. The wood species was Zelkova, and after sufficient natural drying of the log wood, the material was pulverized in two stages using a high-speed blender (YKB, AS ONE, Osaka, Japan) and a continuous mill (MF10 Basic, IKA, Staufen im Breisgau, Germany). The pulverized material was then sieved using an electric vibratory sieve shaker (AS200 Digit, Retsch GmbH, Haan, Germany) to obtain wood meal with a particle size of less than 200 μm.
All chemical reagents used in this study were purchased from FUJIFILM Wako Pure Chemical Corporation (Osaka, Japan) and used without further purification. These included antipyrine as the standard substance for elemental analysis; polyethylene glycol 400 (PEG400) and glycerol as liquefaction solvents; 95% sulfuric acid as the acid catalyst; acetic acid and sodium chlorite for Klason lignin and Wise method compositional analysis; methanol, 1,4-dioxane, 1 mol/L NaOH, phthalic anhydride, and imidazole for hydroxyl number determination; and tetrahydrofuran (THF) as the mobile phase for gel permeation chromatography (GPC) measurements.
In addition to liquefied wood, the raw materials for the bio-polyurethane foam included cyanate resin (STABiO D-370N; Mitsui Chemicals, Tokyo, Japan), silicone oil (VORASURF SH193; Toray Dow Corning Silicone, Ind. Ltd., Tokyo, Japan) as a foam stabilizer, and dibutyltin dilaurate (DBTDL; Wako Pure Chemicals, Ind. Ltd., Osaka, Japan) as a reaction catalyst. Ultrapure water was used as the blowing agent.

2.2. Analysis Methods of Wood Meal

The elemental analysis, ash content determination, compositional analysis, and extractable content measurements of the wood meal were conducted following the methodology of our previous research. In the elemental analysis, a CHN corder (MT-5, Yanaco Technical Science, Tokyo, Japan) was used to determine the proportions of carbon (C), hydrogen (H), nitrogen (N), and oxygen (O) in the biomass samples. For measurements, 2.0–2.5 mg of a standard sample was precisely weighed in a ceramic boat and inserted into the combustion chamber of the CHN corder. The standard sample was combusted three times in total, and the average value was used as the baseline. Similarly, each biomass sample was precisely weighed (2.0–2.5 mg) and subjected to combustion analysis three times, with the average value taken as the final result for that sample.
For ash content measurements, 1 g of the biomass sample was placed in a ceramic boat and heated in a muffle furnace (Ceramic Muffle Furnace CM-150, Sibata Scientific Technology Ltd., Saitama, Japan) at 815 °C for 1 h. After cooling at room temperature for 20 min, the remaining residue was weighed using an electronic balance to determine the ash content. This measurement was conducted once.
In the organic-solvent-soluble content extraction process, the wood meal was subjected to heat reflux in an organic solvent to extract, for 6 h, the solvent-soluble components, thereby producing defatted wood meal. This method was carried out following our previous study [36]. The organic solvent-soluble content was determined based on the mass change before and after extraction. A 5 g air-dried sample was set into a cylindrical paper filter and placed in a Soxhlet extractor. A total of 150 mL of a benzene:ethanol (2:1) solvent mixture was added, and the extraction was carried out under reflux in a 90 °C hot water bath for 6 h. After refluxing, the cylindrical filter paper was removed, and vacuum filtration was performed using pre-weighed filter paper. The sample was then dried overnight in an oven at 105 °C. After drying, the mass of the wood meal was measured using an electronic balance. The organic solvent-soluble content was calculated as a percentage based on the ratio of the mass loss to the initial mass of the wood meal.
The compositional analysis of the wood meal was conducted using the Klason method to determine the lignin content and the Wise method to quantify the holocellulose content. Each measurement was performed following the methodology established in our previous studies [36,37,38].

2.3. Liquefaction and Evaluation Methods of Liquefied Products

The liquefaction conditions were also based on our previous study [36,37,38], using a mixed solvent of polyethylene glycol 400 (PEG400) and glycerol. The mixture ratio was 7/3. The parameters for the liquefaction conditions were the liquefaction time and the solvent-to-wood meal weight ratio. In this study, liquefaction conditions were set as shown in Table 1.
The residue ratio was determined by collecting liquefied samples at 15, 30, 60, 90, 120, and 180 min after the addition of the sulfuric acid catalyst. At each time point, two aliquots of liquefied material were collected into pre-weighed vial bottles. The collected samples were immediately quenched in an ice-water bath to halt the reaction, followed by the weight measurement. The weight difference between the empty vial and the vial after sample collection was recorded as the mass of the recovered liquefied material. Subsequently, the weight of thoroughly dried filter paper was measured, and vacuum filtration was performed using this filter paper to separate the residue from the liquefied material. The residue was then washed with methanol, and the filter paper was dried before being weighed again to determine the residue mass. The residue ratio for each sampling time was calculated using the recorded values of the liquefied material weight and residue weight according to Equation (1).
W = m 1 ( m 2 × R w ) × 100
  • W: Residue rate (wt.%)
  • m1: Residue weight (g)
  • m2: The weight of collected sample (g)
  • Rw: The ratio of biomass in the liquefaction process (wt.%)
For acid and hydroxyl number measurements, liquefied samples collected at 60 and 180 min after the start of liquefaction were used. This selection was based on the fact that only liquefied samples obtained at these two time points were designated for bio-polyurethane foam synthesis. First, the liquefied samples were subjected to vacuum filtration using methanol to remove residues. The obtained filtrate was then concentrated using a rotary evaporator to remove methanol, yielding the liquefied material. The purified liquefied samples were subsequently used for acid and hydroxyl number measurements, as well as FT-IR analysis. To determine the acid number, the sample was titrated with NaOH to the equivalence point, and the acid number was calculated based on the amount of titrant consumed. Specifically, 8 g of the purified liquefied sample, 20 mL of pure water, and 80 mL of dioxane were mixed in a beaker. The mixture was then titrated with 1 mol/L NaOH using a calibrated pH meter, with titration continuing until the equivalence point at pH 8.3 was reached. The volume of NaOH consumed was recorded of 2 samples for each, and the acid number was calculated using Equation (2).
Acid number   ( m g K O H / g ) = A × N × 56.1 W
  • A: The amount of titrant (mL)
  • N: The factor of NaOH ≒ 1
  • W: Liquefied product sample weight
The hydroxyl number was determined by first protecting the hydroxyl groups in the sample through phthalation using a phthalation reagent. The sample was then titrated with NaOH until the equivalence point was reached, and the hydroxyl number was calculated based on the volume of NaOH consumed. For the experimental procedure, 1 g of the liquefied sample and 25 mL of the phthalation reagent were placed into a round-bottom flask and heated in an oil bath at 110 °C for 20 min to complete the phthalation reaction. After the reaction, the mixture was transferred to a beaker, along with 25 mL of pure water and 50 mL of dioxane, and thoroughly mixed. Once the temperature had sufficiently decreased, the solution was titrated with 1 mol/L NaOH using a pH meter. The titration was performed until the equivalence point at pH 8.3 was reached. The volume of NaOH consumed was recorded, and the hydroxyl number was calculated using Equation (3).
H y d r o x y l   n u m b e r   ( m g K O H / g ) = ( B C ) × N × 56.1 W + Acid number
To check the chemical functional groups, FT-IR spectra were obtained using the KBr method. First, a KBr plate was measured as a blank. Then, approximately 1 μL of the liquefied sample was dropped onto the KBr plate and sandwiched between two plates. The scan range was from 500 to 3500 cm−1. The obtained spectra were processed with automatic baseline correction, smoothing, water vapor subtraction, and CO2 subtraction before analysis. Each spectrum represents the average of 20 measurements, meaning that one measurement was performed per sample.
The average molecular weight of the liquefied product was determined using gel permeation chromatography (GPC). For sample preparation, 1 mg of each liquefied sample was accurately weighed and placed in a vial, followed by the addition of 2.5 mL of tetrahydrofuran (THF) to dissolve the sample. The GPC system (RI Detector RI-2031, Jasco, Tokyo, Japan) was then activated, and THF circulation was initiated. The column (Shodex KF-802, Resonac Holdings Corporation, Tokyo, Japan) was set up, and the column thermostat (CO-2060, Jasco, Tokyo, Japan) was heated to 40°C. A 1 mL disposable syringe was used for injection. The flow rate during measurement was set to 1 mL/min. Polystyrene (PS) was used as the standard material.

2.4. Synthesis and Evaluation Methods of Bio-Polyurethane Foam

The liquefied product sample was used as a bio-based polyol for the synthesis of bio-polyurethane foam (PUF). The synthesis conditions were adjusted to achieve an isocyanate-to-hydroxyl group ratio of 1:1, based on the hydroxyl number measured in advance. The amounts of the blowing agent and DBTDL were fixed at 1 g in all cases. Since differences in foam uniformity were observed depending on the sample, the amount of foam stabilizer was determined through trial and error within the range of 1–3 g for each sample.
In this study, to synthesize a bio-polyurethane foam, a 60 min liquefaction time was selected; 15 g of liquefied product was mixed with 1 g of foam stabilizer, 1 g of blowing agent, and 1 g of catalyst. The mixture was stirred at 1200 rpm for approximately 2 min using a stirrer to ensure the uniform dispersion of these components before the addition of isocyanate. After stirring, the mixture was left to stand until the generated bubbles dissipated, after which the isocyanate was added. Immediately after the addition, high-speed stirring was performed at 2000 rpm for 2.5 min. The stirred mixture was then left undisturbed on a level surface until foaming began. Following foaming, the sample was left at room temperature for one day to allow complete curing. After full curing, the sample was removed from the container, dried, and subsequently used for morphological observations and various analyses.
To evaluate the biodegradability of the bio-polyurethane foam (PUF) derived from the liquefied product, weight reduction of the foam specimens was monitored over a 12-month period under two distinct environmental conditions: a temperature- and humidity-controlled chamber and a field environment. Each PUF sample was sectioned into 1 cm³ cubic specimens, and initial weights were recorded. Biodegradability assessments were conducted at monthly intervals for up to 12 months. To ensure the reliability of biodegradability evaluations under soil burial conditions, the thickness of bio-polyurethane foam specimens was standardized to 1 cm, as variations in thickness—whether excessive or insufficient—can significantly influence the degradation kinetics and compromise the validity of experimental results [39]. A total of 18 samples, with three replicates per condition, were buried in soil under both outdoor and chamber conditions. For the field environment, a 15 cm-deep hole was dug on-site, and the samples were buried at a depth of 10 cm from the ground surface. As shown in Figure 1, the pole was set to indicate the places.
For the controlled chamber environment, plastic containers were filled with commercial gardening soil. Cavities were created in the soil matrix, and specimens were buried at a depth of 10 cm. The containers were subsequently placed within an environmental chamber (LPH-350P, Nippon Medical & Chemical Instruments Co., Ltd., Osaka, Japan) maintained at 24 °C and 60% relative humidity. At monthly intervals, all specimens were retrieved from the soil, cleaned using ultrasonic treatment, and dried for 24 h prior to gravimetric analysis. The weight loss ratio was calculated for each monthly period based on the obtained mass data. The calculation formula employed is presented in Equation (4).
W L = w 2 w 3 w 1 × 100
  • WL: Weight loss (%)
  • w1: Initial sample weight
  • w2: Sample weight at previous measurement
  • w3: Sample weight at newest measurement
To analyze the cell condition and morphology of PUF, scanning electron microscopy (SEM) was conducted using an SU1510 at the Comprehensive Analysis Center for Science, Saitama University (HITACHI High-Tech, Tokyo, Japan). The specimens were coated with an Au-Pd layer to mitigate electrical charging during SEM imaging. The accelerating voltage was set to 15 kV, and the magnification for observation was 120×.
FT-IR measurements were conducted using the same procedure and conditions as those applied for the liquefied product.
To analyze the elemental composition of bio-polyurethane foam (PUF) after biodegradation, the same CHN analysis method used for wood meal analysis was employed. Each value represents the mean of three independent measurements, with standard deviations verified to be within an acceptably low range.
Thermogravimetric analysis (TGA) was performed using a TG-50 instrument (Shimadzu Corporation, Kyoto, Japan) under a nitrogen atmosphere. The temperature was increased from room temperature to 600 °C at a heating rate of 20 °C/min while monitoring the weight change. The initial sample weight was set to 2–3 mg. Only one measurement was carried out for each sample.
The water absorption rate per unit mass for both bio-polyurethane foam (PUF) and petroleum-derived PUF was determined in accordance with the Japanese Industrial Standard (JIS) K 7209. For the measurements, three sample pieces of each type of PUF, totaling 21 samples, were cut into 1 cm³ cubes. However, due to the soft and porous nature of the PUF structure, precise volume measurements were not accurate. Thus, calculations were based on weight. The cut PUF samples were first dried in a constant-temperature drying oven for 24 h. Immediately after removal, their initial weights were measured using an electronic balance. The samples were then immersed in ultrapure water in a stainless-steel tray. A metal mesh was placed over the samples to ensure complete submersion while preventing deformation due to external forces. After 24 h of immersion, the samples were removed from the water, and once excess water had naturally dripped off, their weights were measured again. Subsequently, the samples were dried in a high-temperature drying oven for another 24 h, and their final weight was recorded. The water absorption rate was calculated using the following Equation (5).
A R = m 2 m 1 + ( m 1 m 3 ) m 1 × 100
  • AR: Water adsorption rate (%)
  • m1: Initial weight (g)
  • m2: The weight after soaking into water (g)
  • m3: The weight after drying (g)
The foaming ratio was measured just once for each polyol type as follows. To ensure precise measurements, a specially ordered platform equipped with a glass tube and a silicone stopper, as shown in Figure 2, was used.
The foaming ratio was determined for petroleum-derived PUF, bio-based PUF, and filler-containing bio-based PUF, respectively. Initially, the raw materials were mixed under the same conditions as the previously described PUF synthesis experiments. The mixed materials were then poured into the glass tube, which was set on the platform with the stopper attached, and the initial liquid level height was recorded. The foaming process was observed, and after complete foaming was confirmed, the final foam height was measured. The foaming ratio was calculated as the volume ratio before and after foaming. The foaming rate was calculated using the following Equation (6).
F R = H 1 H 2 × 100
  • FR: The foaming rate (%)
  • H1: The foam height after complete foaming (mm)
  • H2: The initial height before foaming (mm)

3. Results and Discussion

3.1. Evaluation of Wood Meal

The results of the elemental analysis using the CHN corder for each sample are shown in Table 2.
The ash content mainly originates from the inorganic substances present in the biomass. Since this elemental analysis does not directly measure the proportion of oxygen atoms and ash content, the oxygen content was calculated by subtracting the percentages of C, H, N, and ash from the total composition. Ash consists of residues that do not participate in the liquefaction process, meaning that a lower ash content is preferable for a higher liquefaction efficiency. The measured ash content of 3.3% indicates that a sufficiently high liquefaction efficiency was achieved. The component analysis results shown in Table 3 indicate that the holocellulose content was approximately 65%, while the lignin content was around 28%. Since the samples used in this study had their bark removed, the obtained cellulose and lignin contents are consistent with those of typical hard wood. (lignin 20–30% range in normal)

3.2. Evaluation of Liquefaction and Liquefied Products

Figure 3 shows the change in residue content over liquefaction time. The experimental results indicate that the residue content rapidly decreased to 20% within the first 15 min of liquefaction and further dropped to approximately 5% at 60 min, reaching an almost minimum value. Additionally, since no significant change in the residue content was observed beyond this point, it was confirmed that the mixed solvent containing glycerol effectively prevented recondensation.
Table 4 presents the results of the acid number and hydroxyl number measurements. From these results, the acid number remained nearly constant between 60 and 180 min, whereas the hydroxyl number showed a slight decrease. A similar trend has been reported in previous studies, where a decrease in the hydroxyl number over liquefaction time is attributed to the consumption of hydroxyl groups in polyhydric alcohols under acid catalysis as liquefaction progresses.
Figure 4 displays the FT-IR spectra of the liquefaction solvent and liquefied products obtained at 60 and 180 min. The results show that both liquefied product samples exhibit peaks at nearly identical positions, suggesting that the formation of different products due to an extended liquefaction time is unlikely. The composition of the liquefied products remained consistent.
Investigating the individual peaks, the peak at 1720 cm−1 corresponds to the C=O stretching vibration of carboxylic acids, such as levulinic acid, acetic acid, and oxalic acid, which are cellulose degradation products. The peak at 1640 cm−1 corresponds to the C=C stretching vibration of aromatic compounds, indicating the presence of components derived from lignocellulosic biomass, such as cellulose and lignin. Therefore, the intensity ratio of these peaks remained unchanged with a prolonged liquefaction time, the results suggest that sufficient liquefied products were obtained at 60 min, consistent with the findings from the residue content, acid number, and hydroxyl number measurements.
Figure 5 presents the weight-average molecular weight (MW) and molecular weight distribution (Mn/Mw) of the liquefied products obtained at 60 and 180 min, as measured via GPC, with the results summarized in Table 5.
A chromatographic analysis showed no significant changes in the peak position or height between 60 and 180 min, indicating that the liquefied products did not undergo further recondensation after 60 min and that the liquefaction reaction had reached equilibrium. This finding aligns with the other measurement results. Based on these results, a liquefaction time of 60 min was determined to be the optimal condition for producing the liquefied product used in bio-polyurethane foam, considering energy efficiency. Therefore, all subsequent experiments were conducted using samples obtained with a liquefaction time of 60 min.

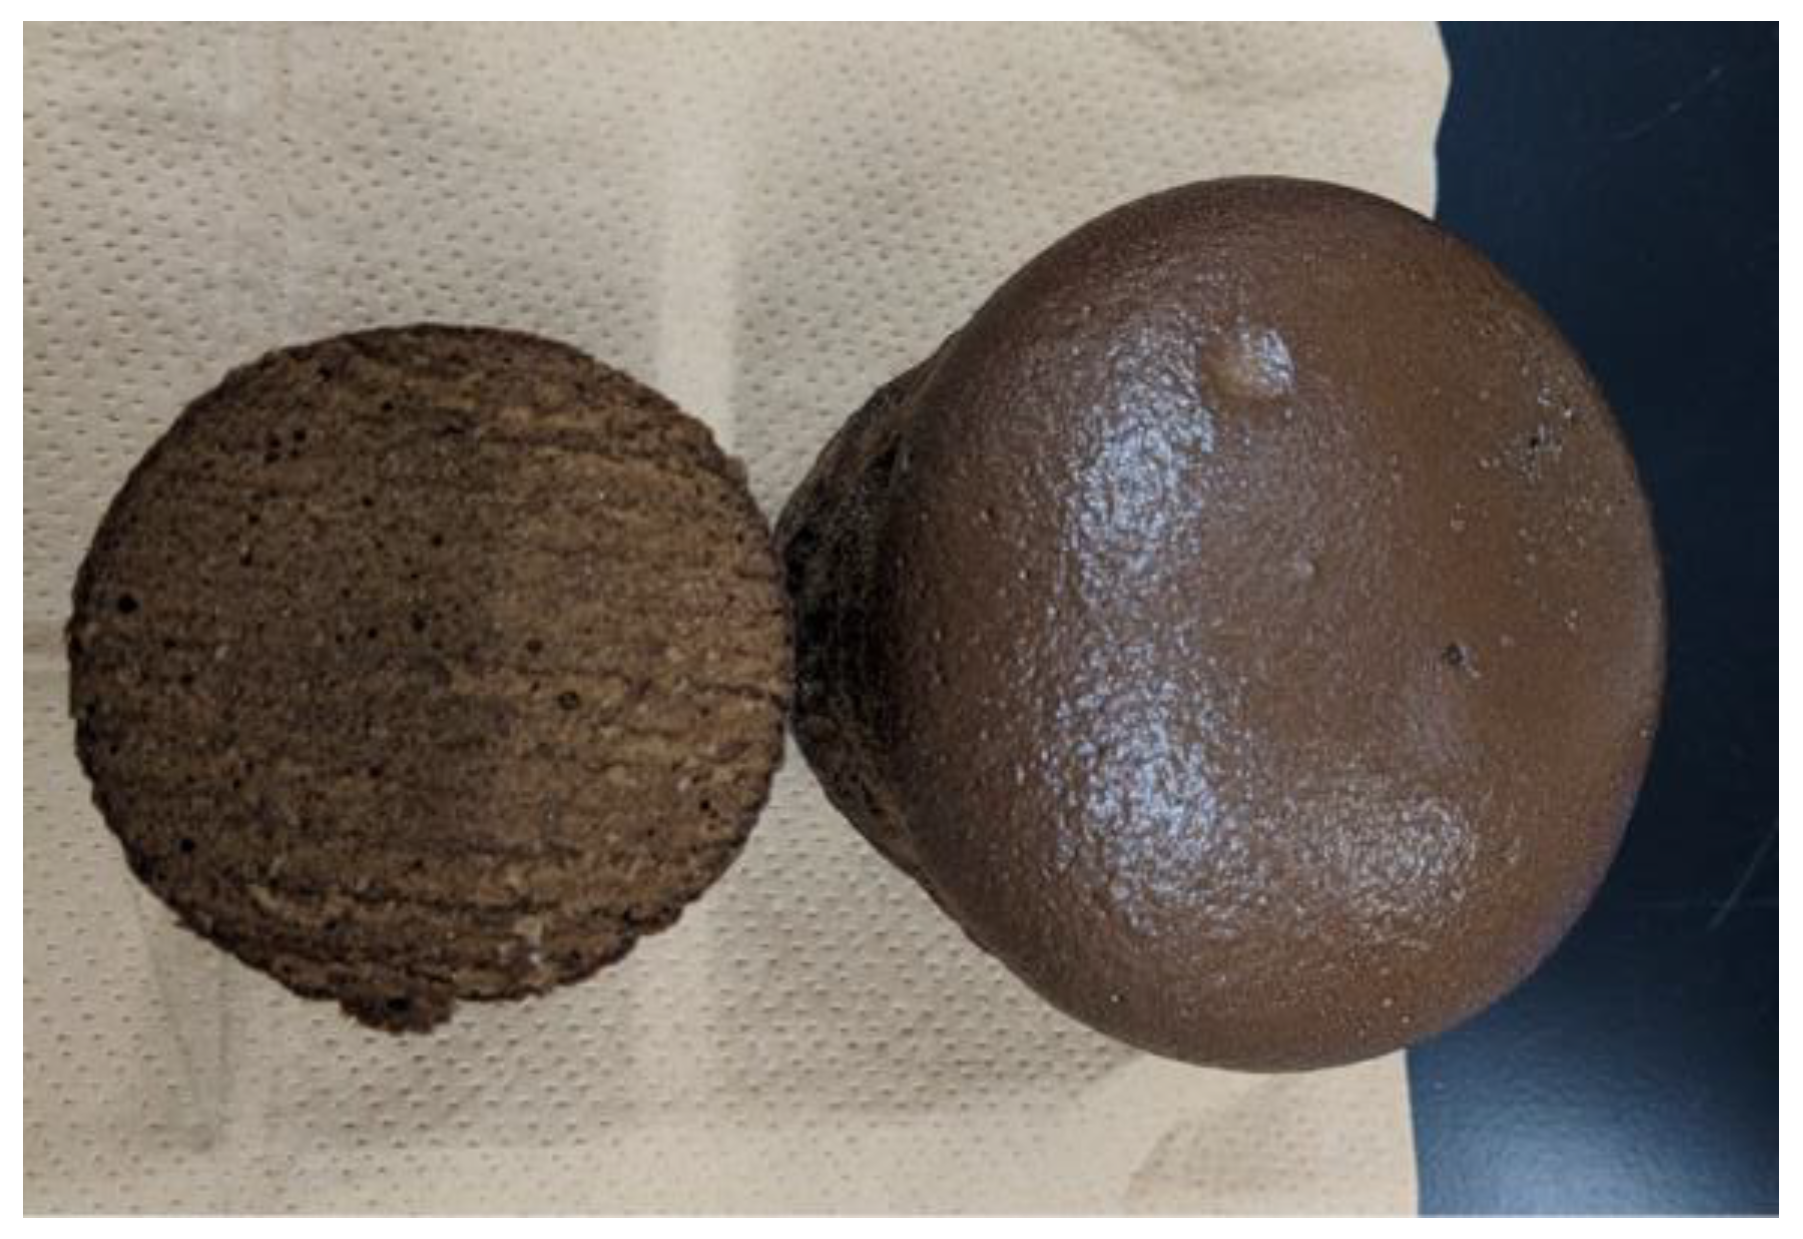
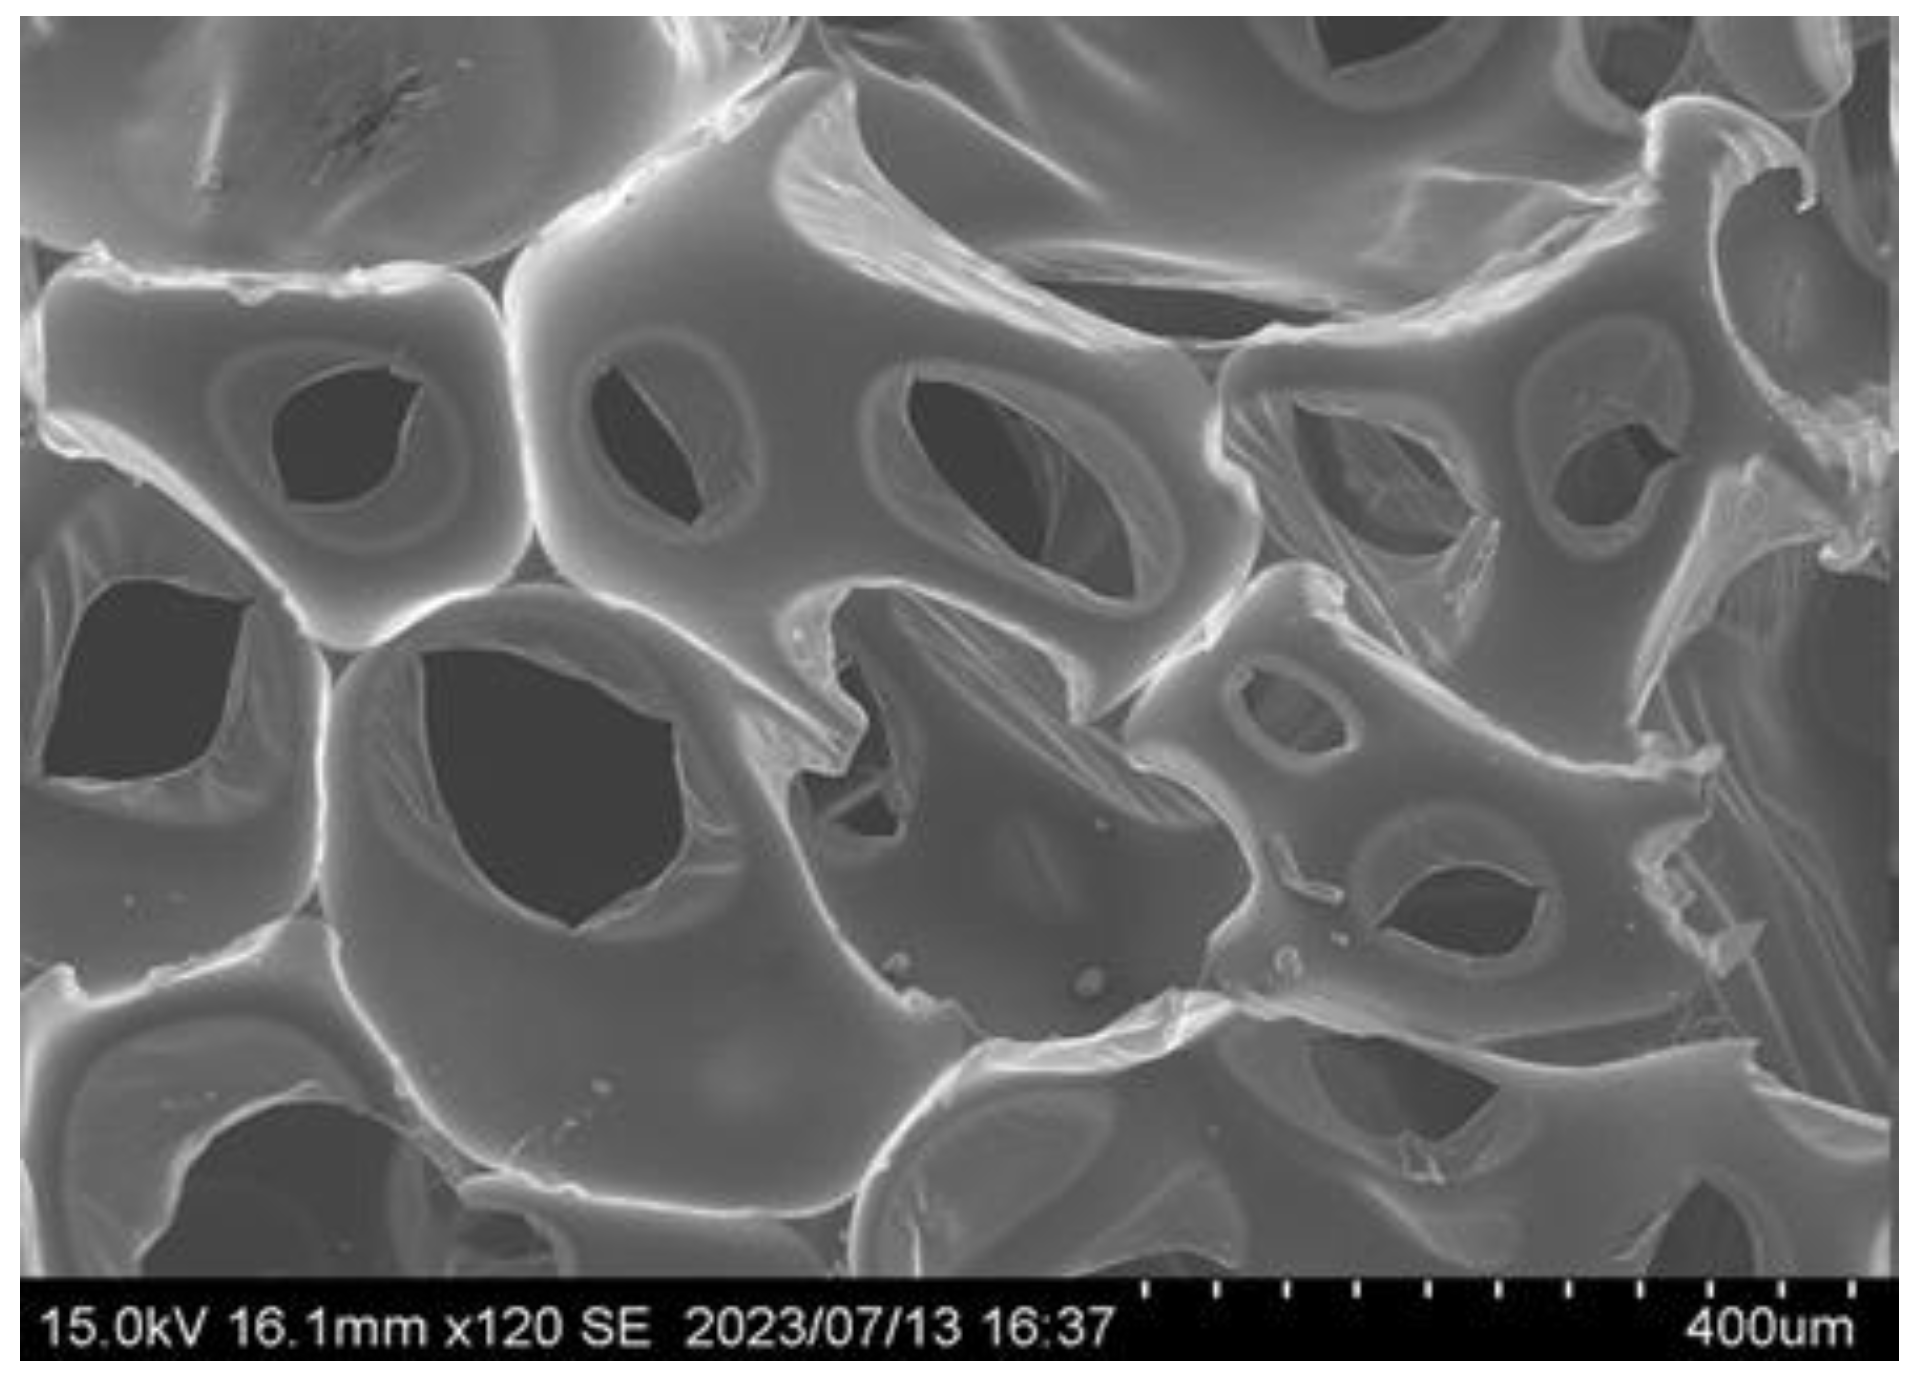
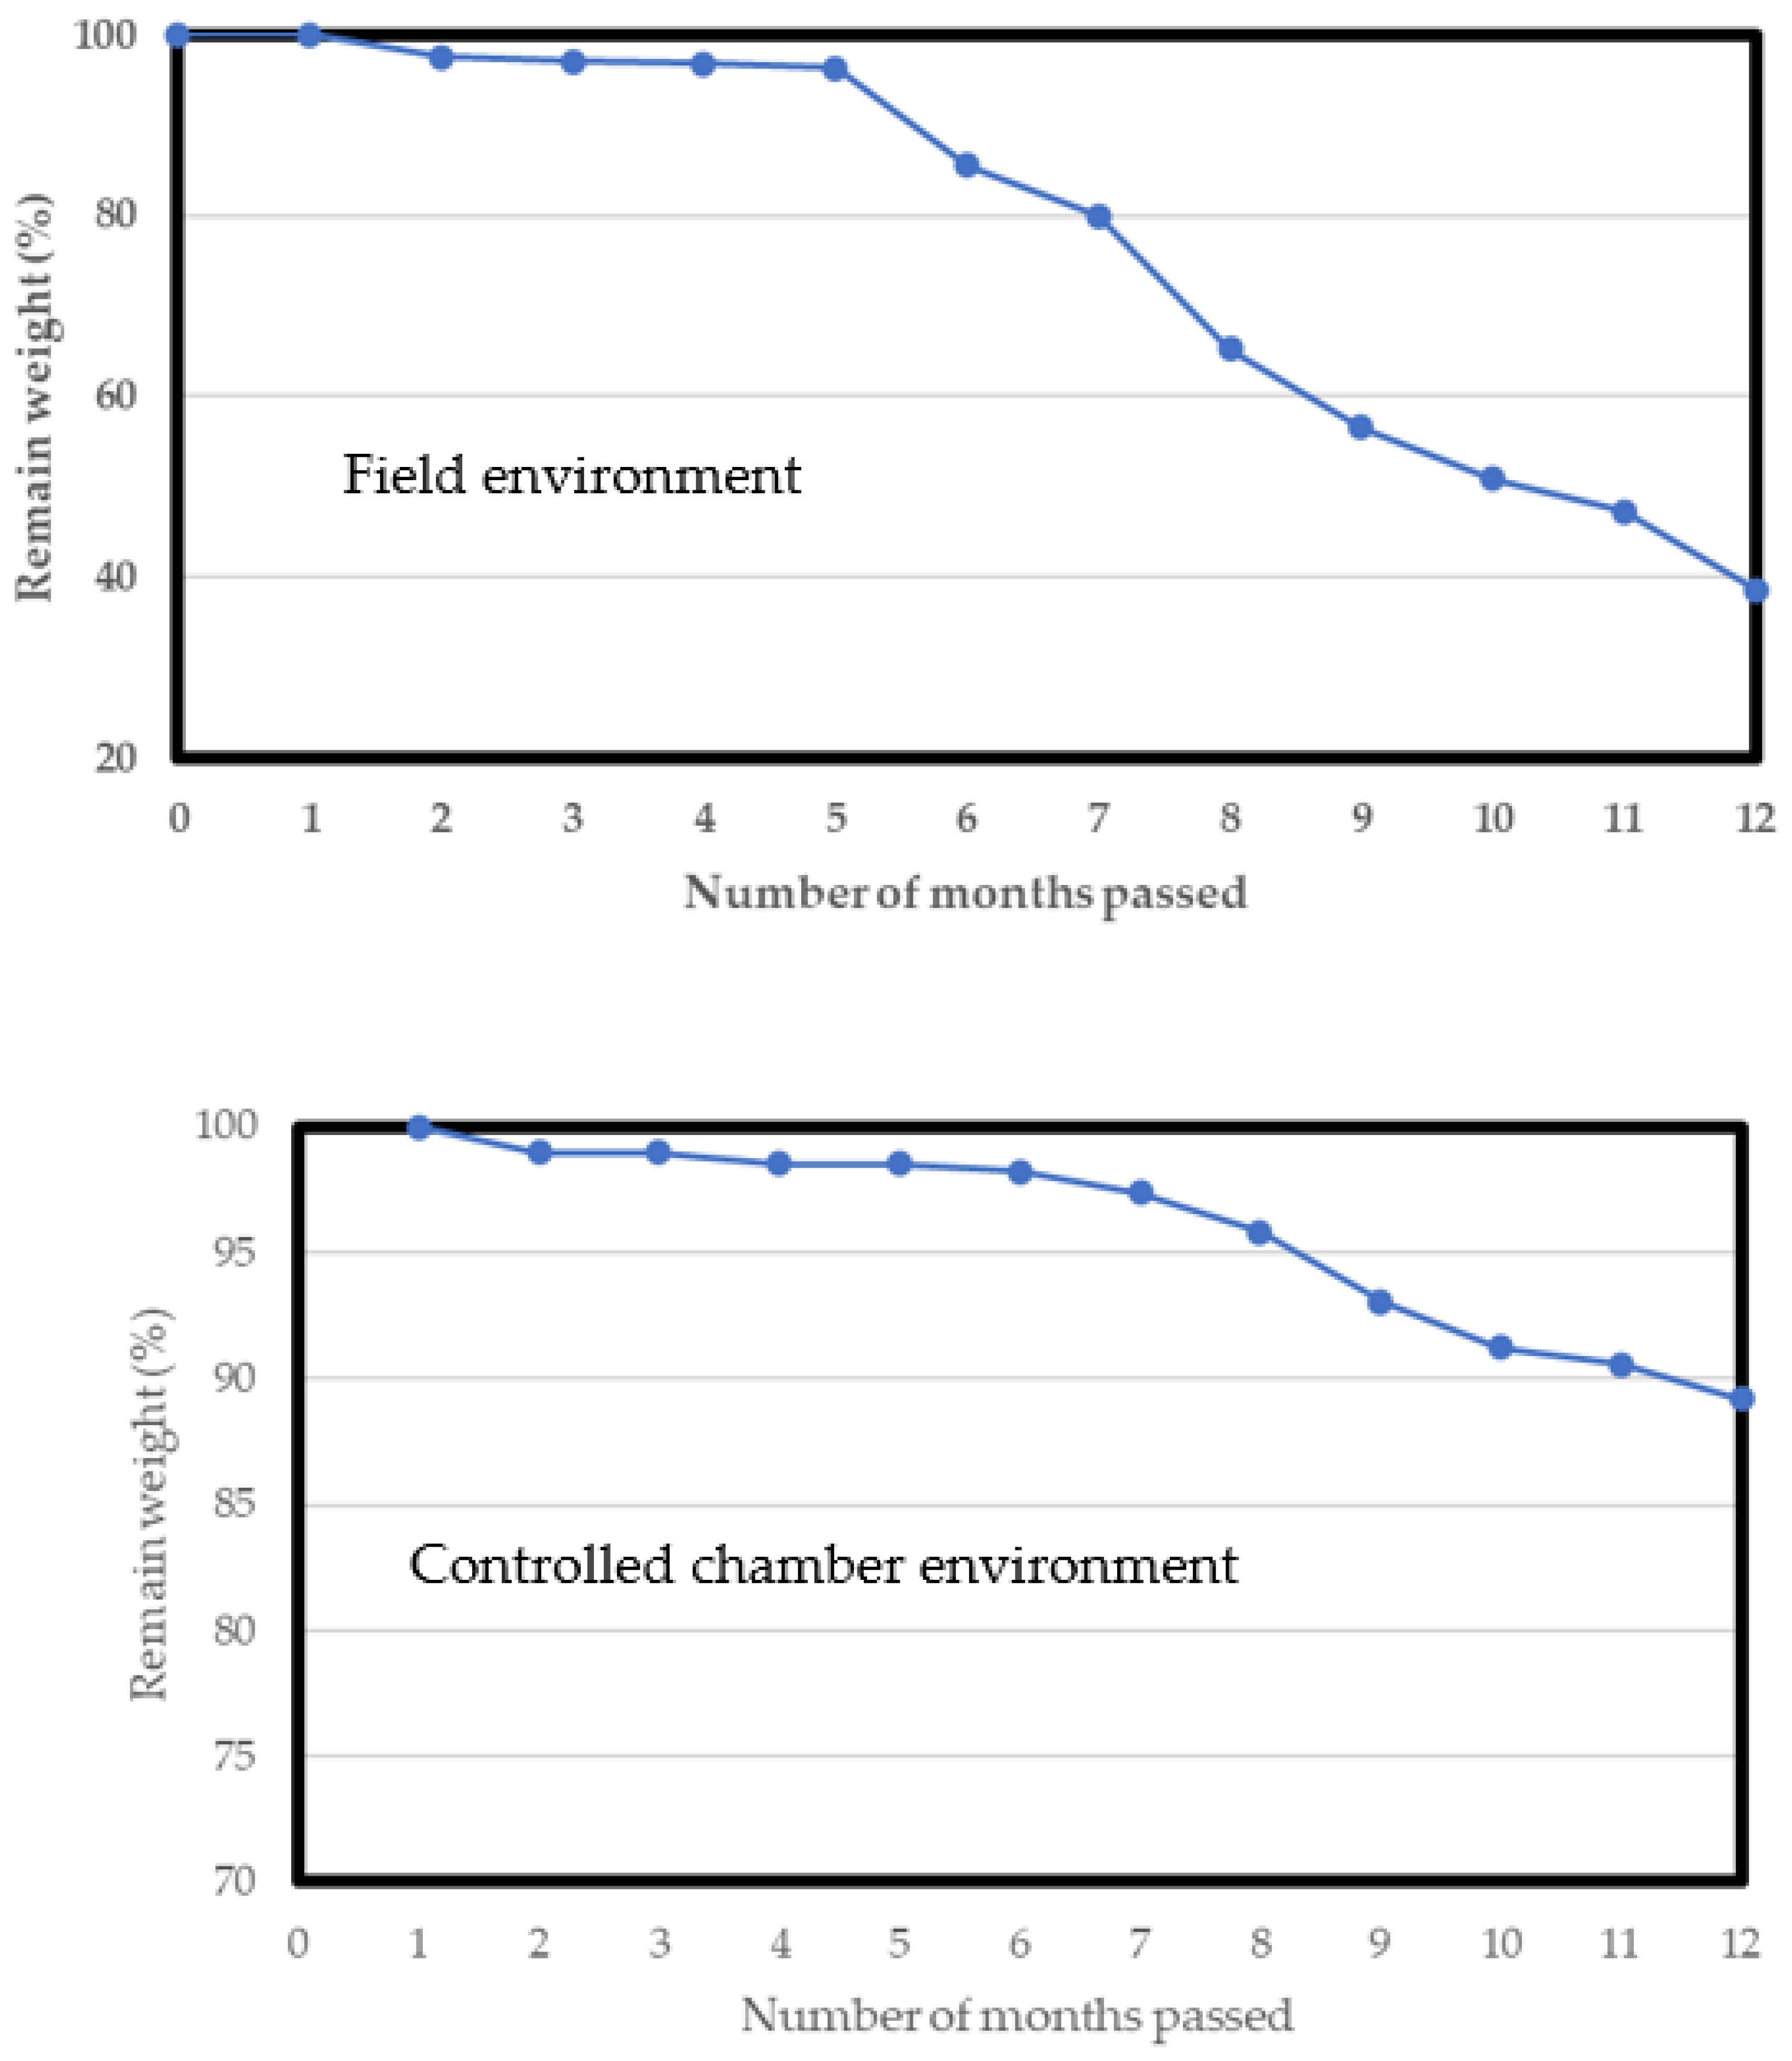
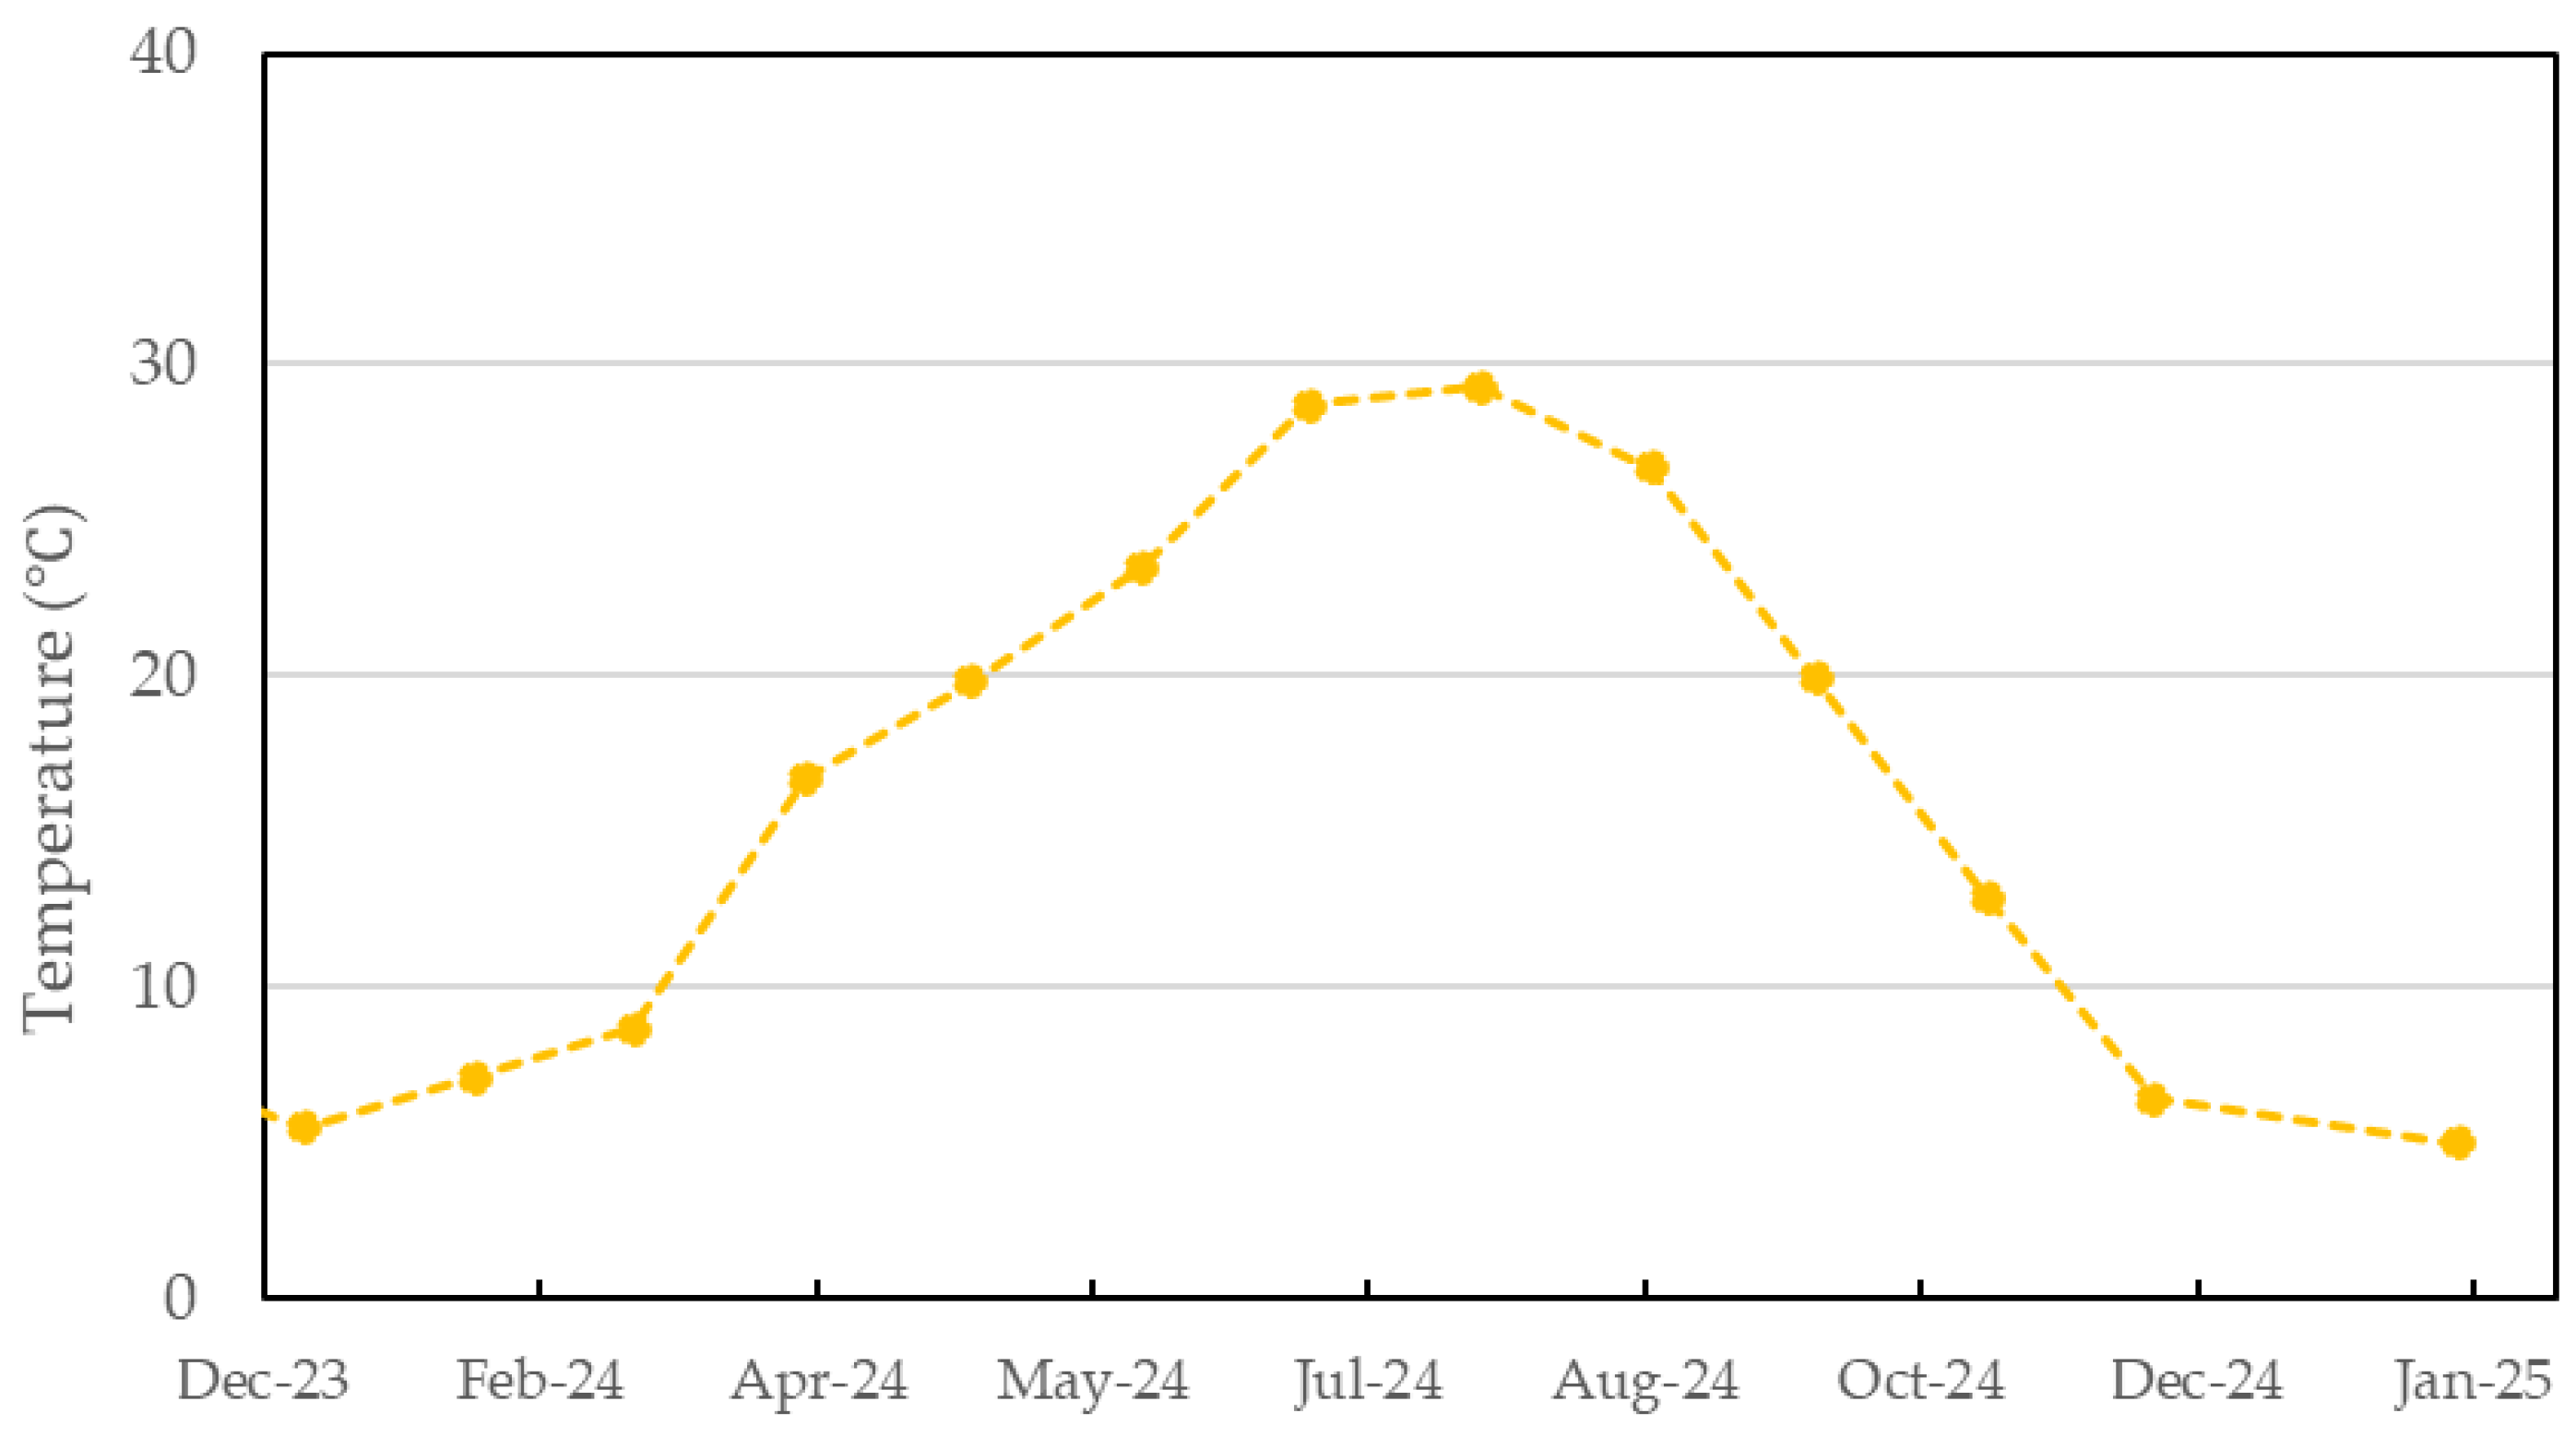
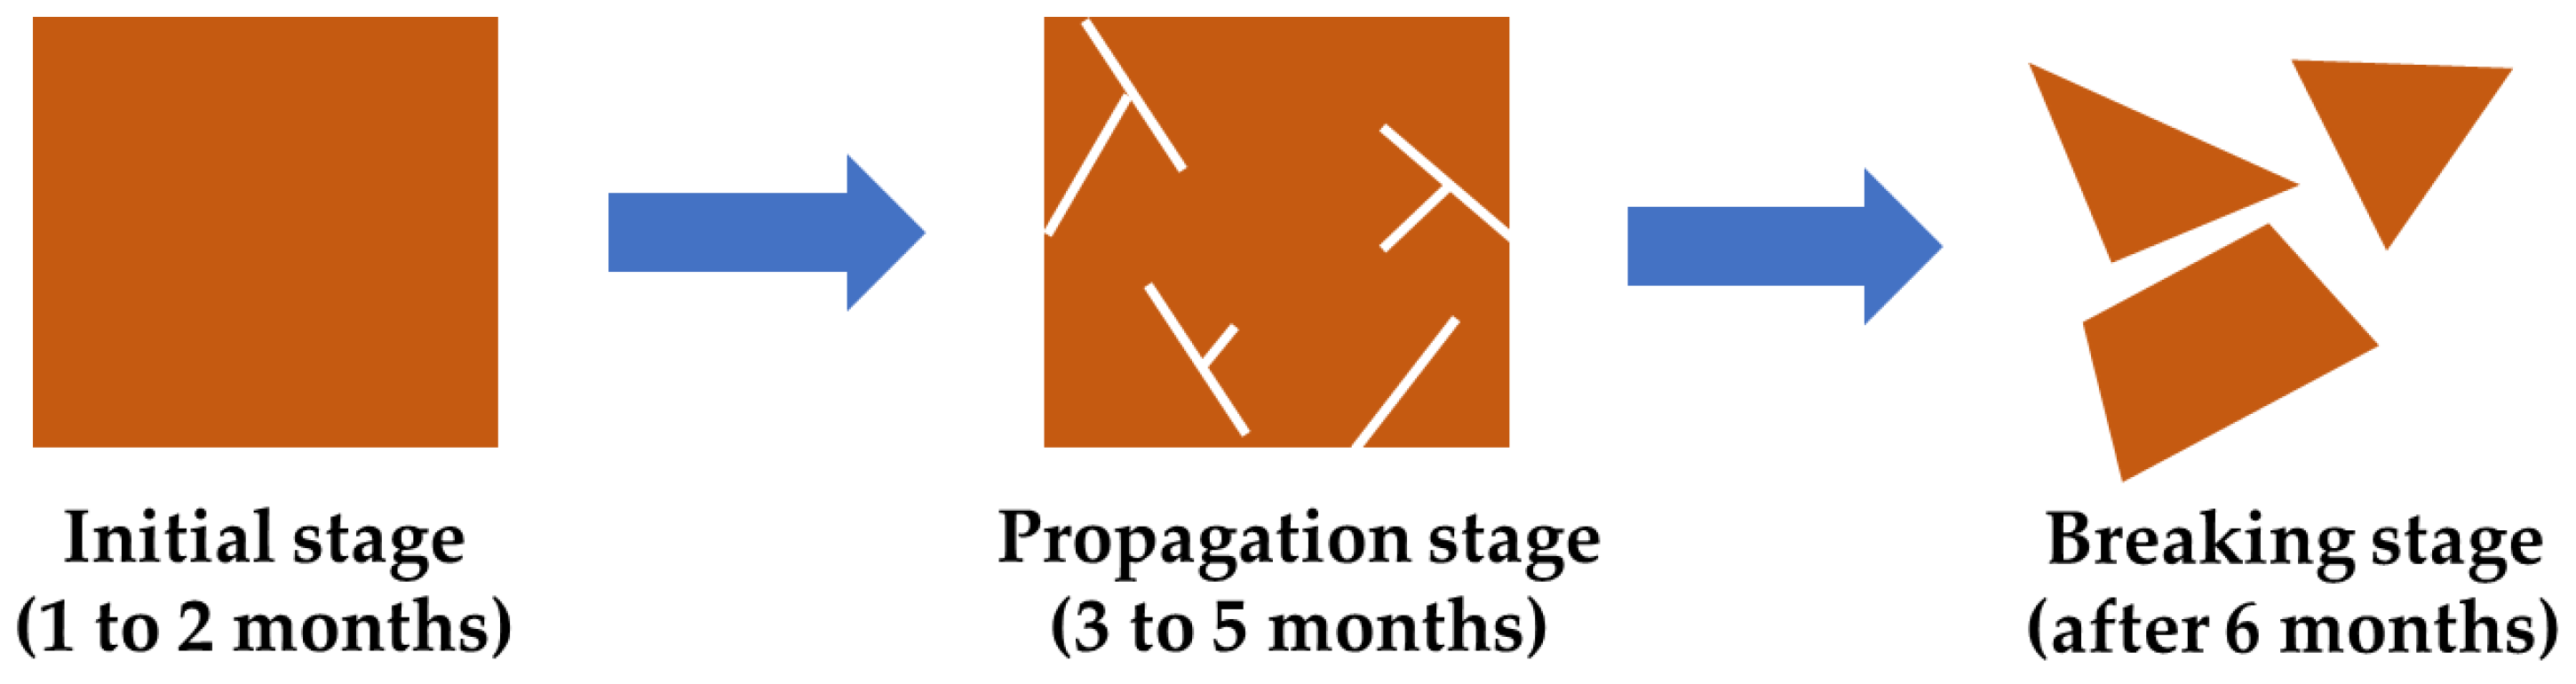
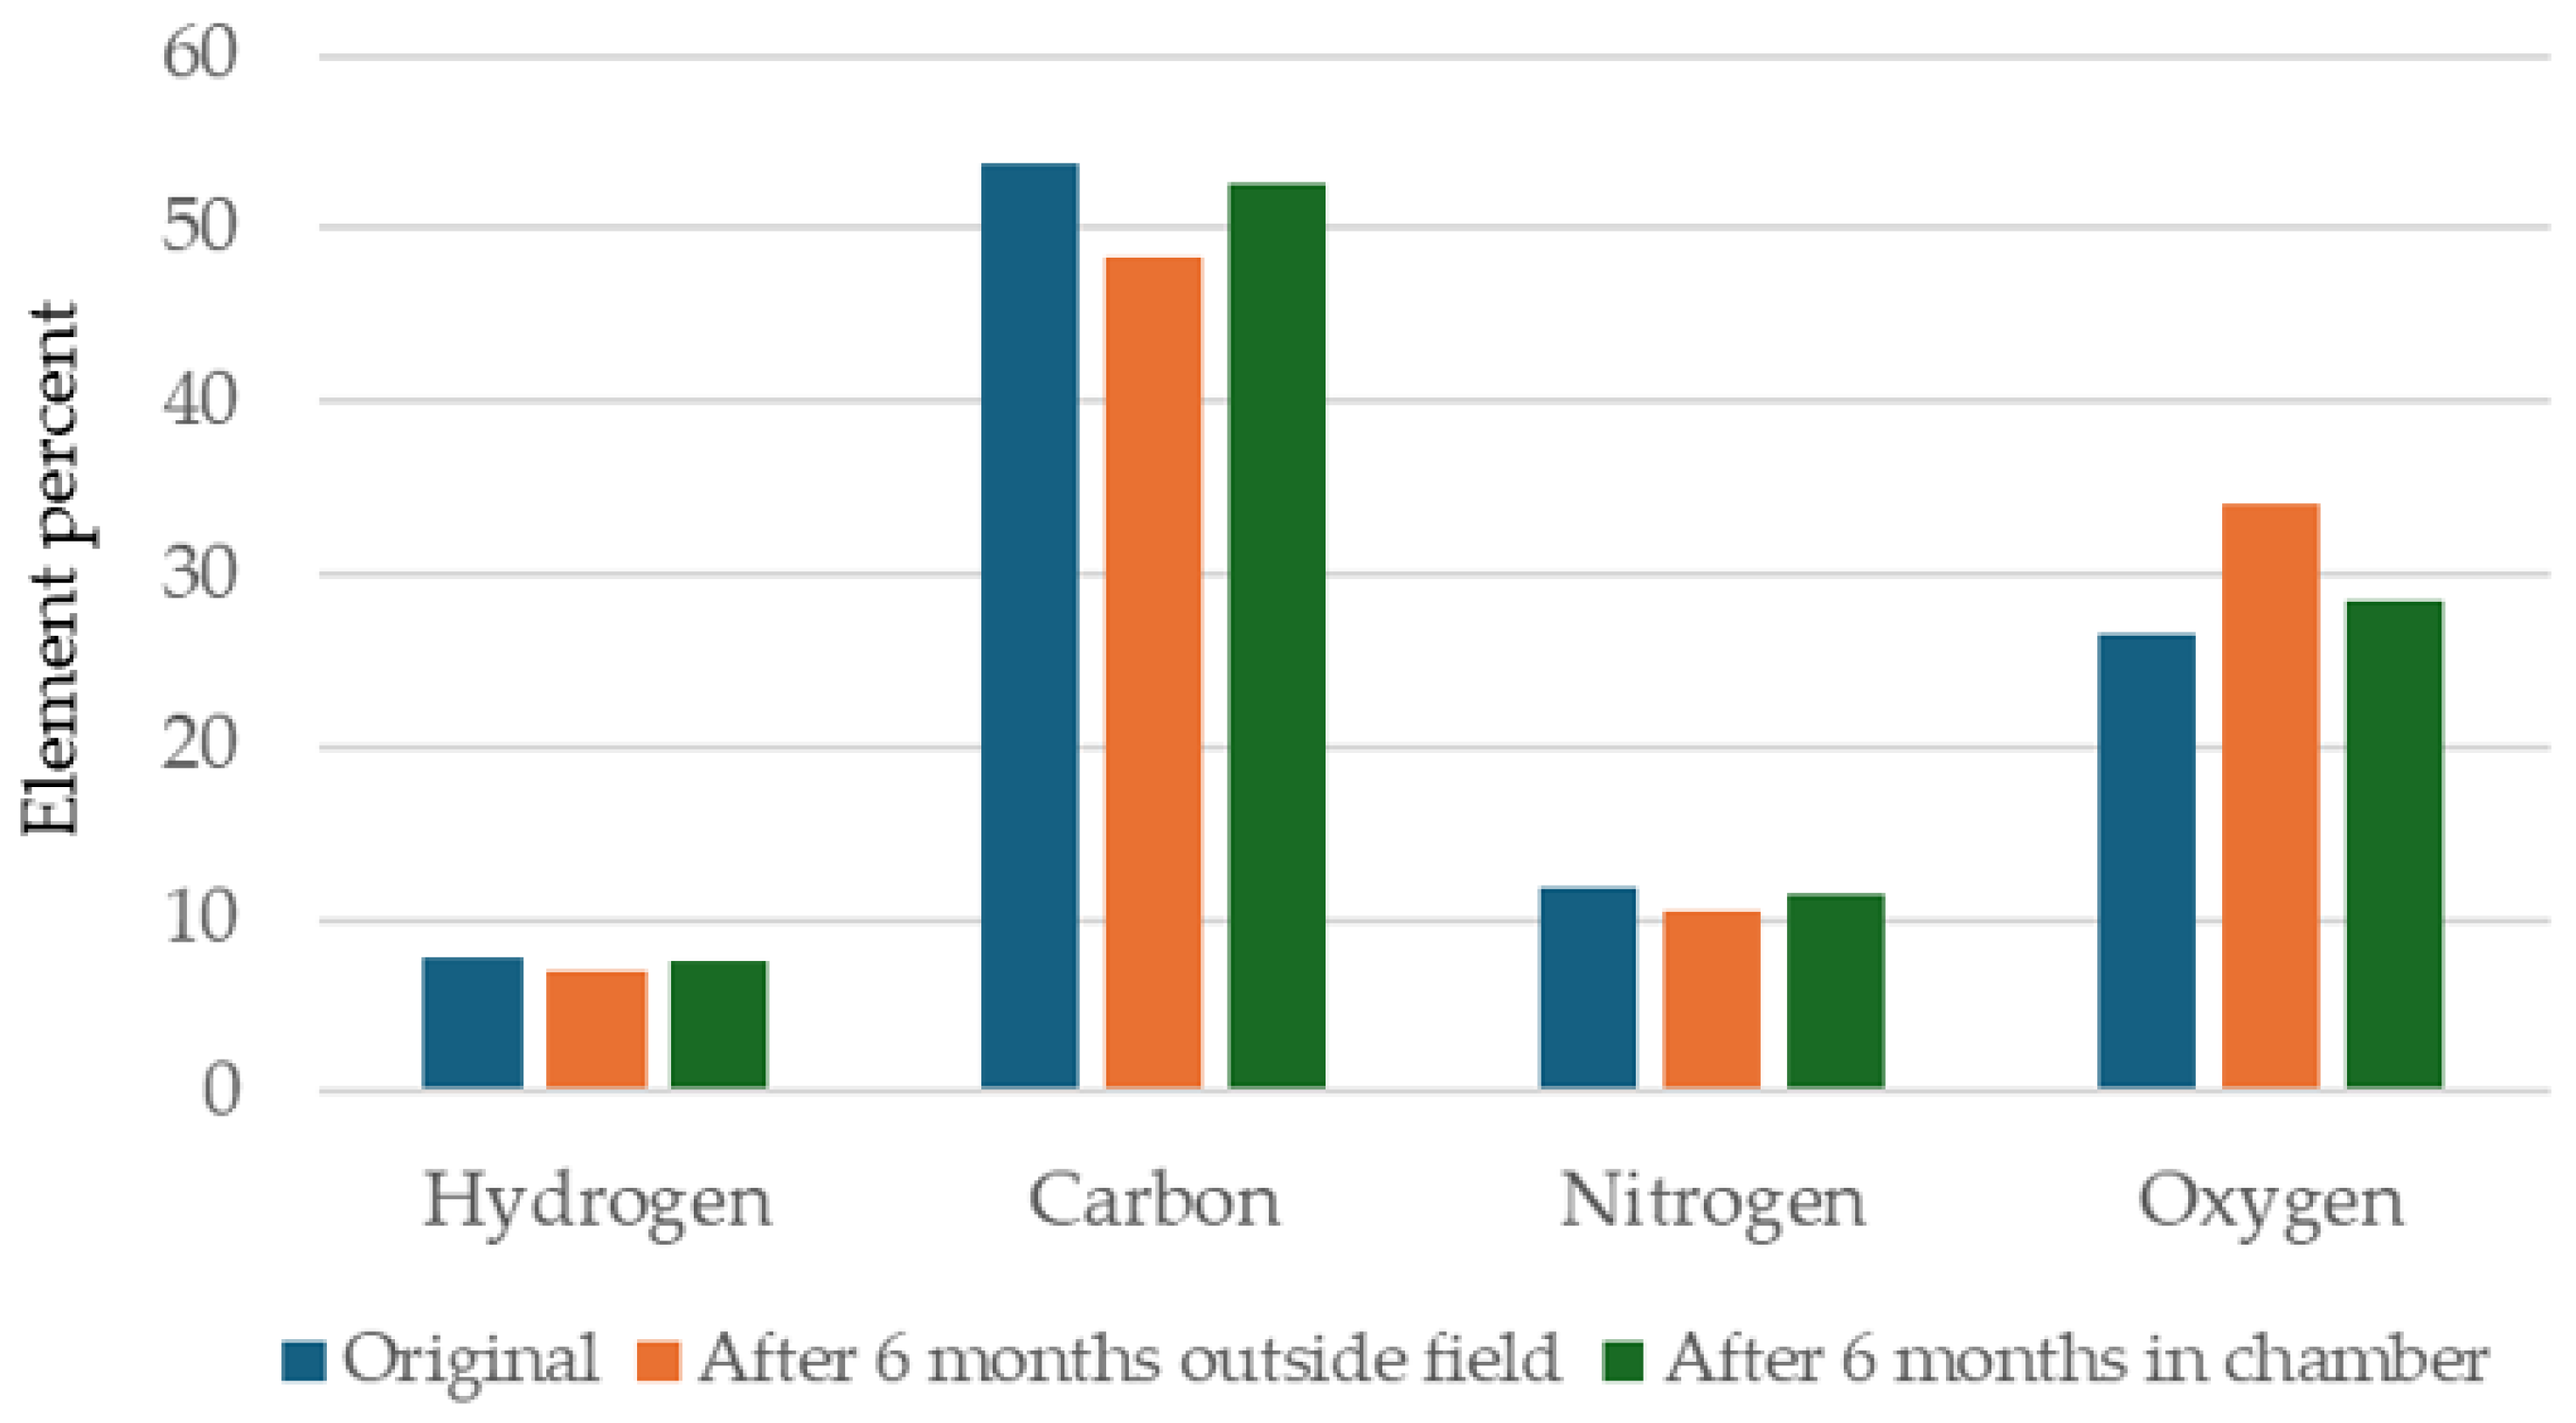
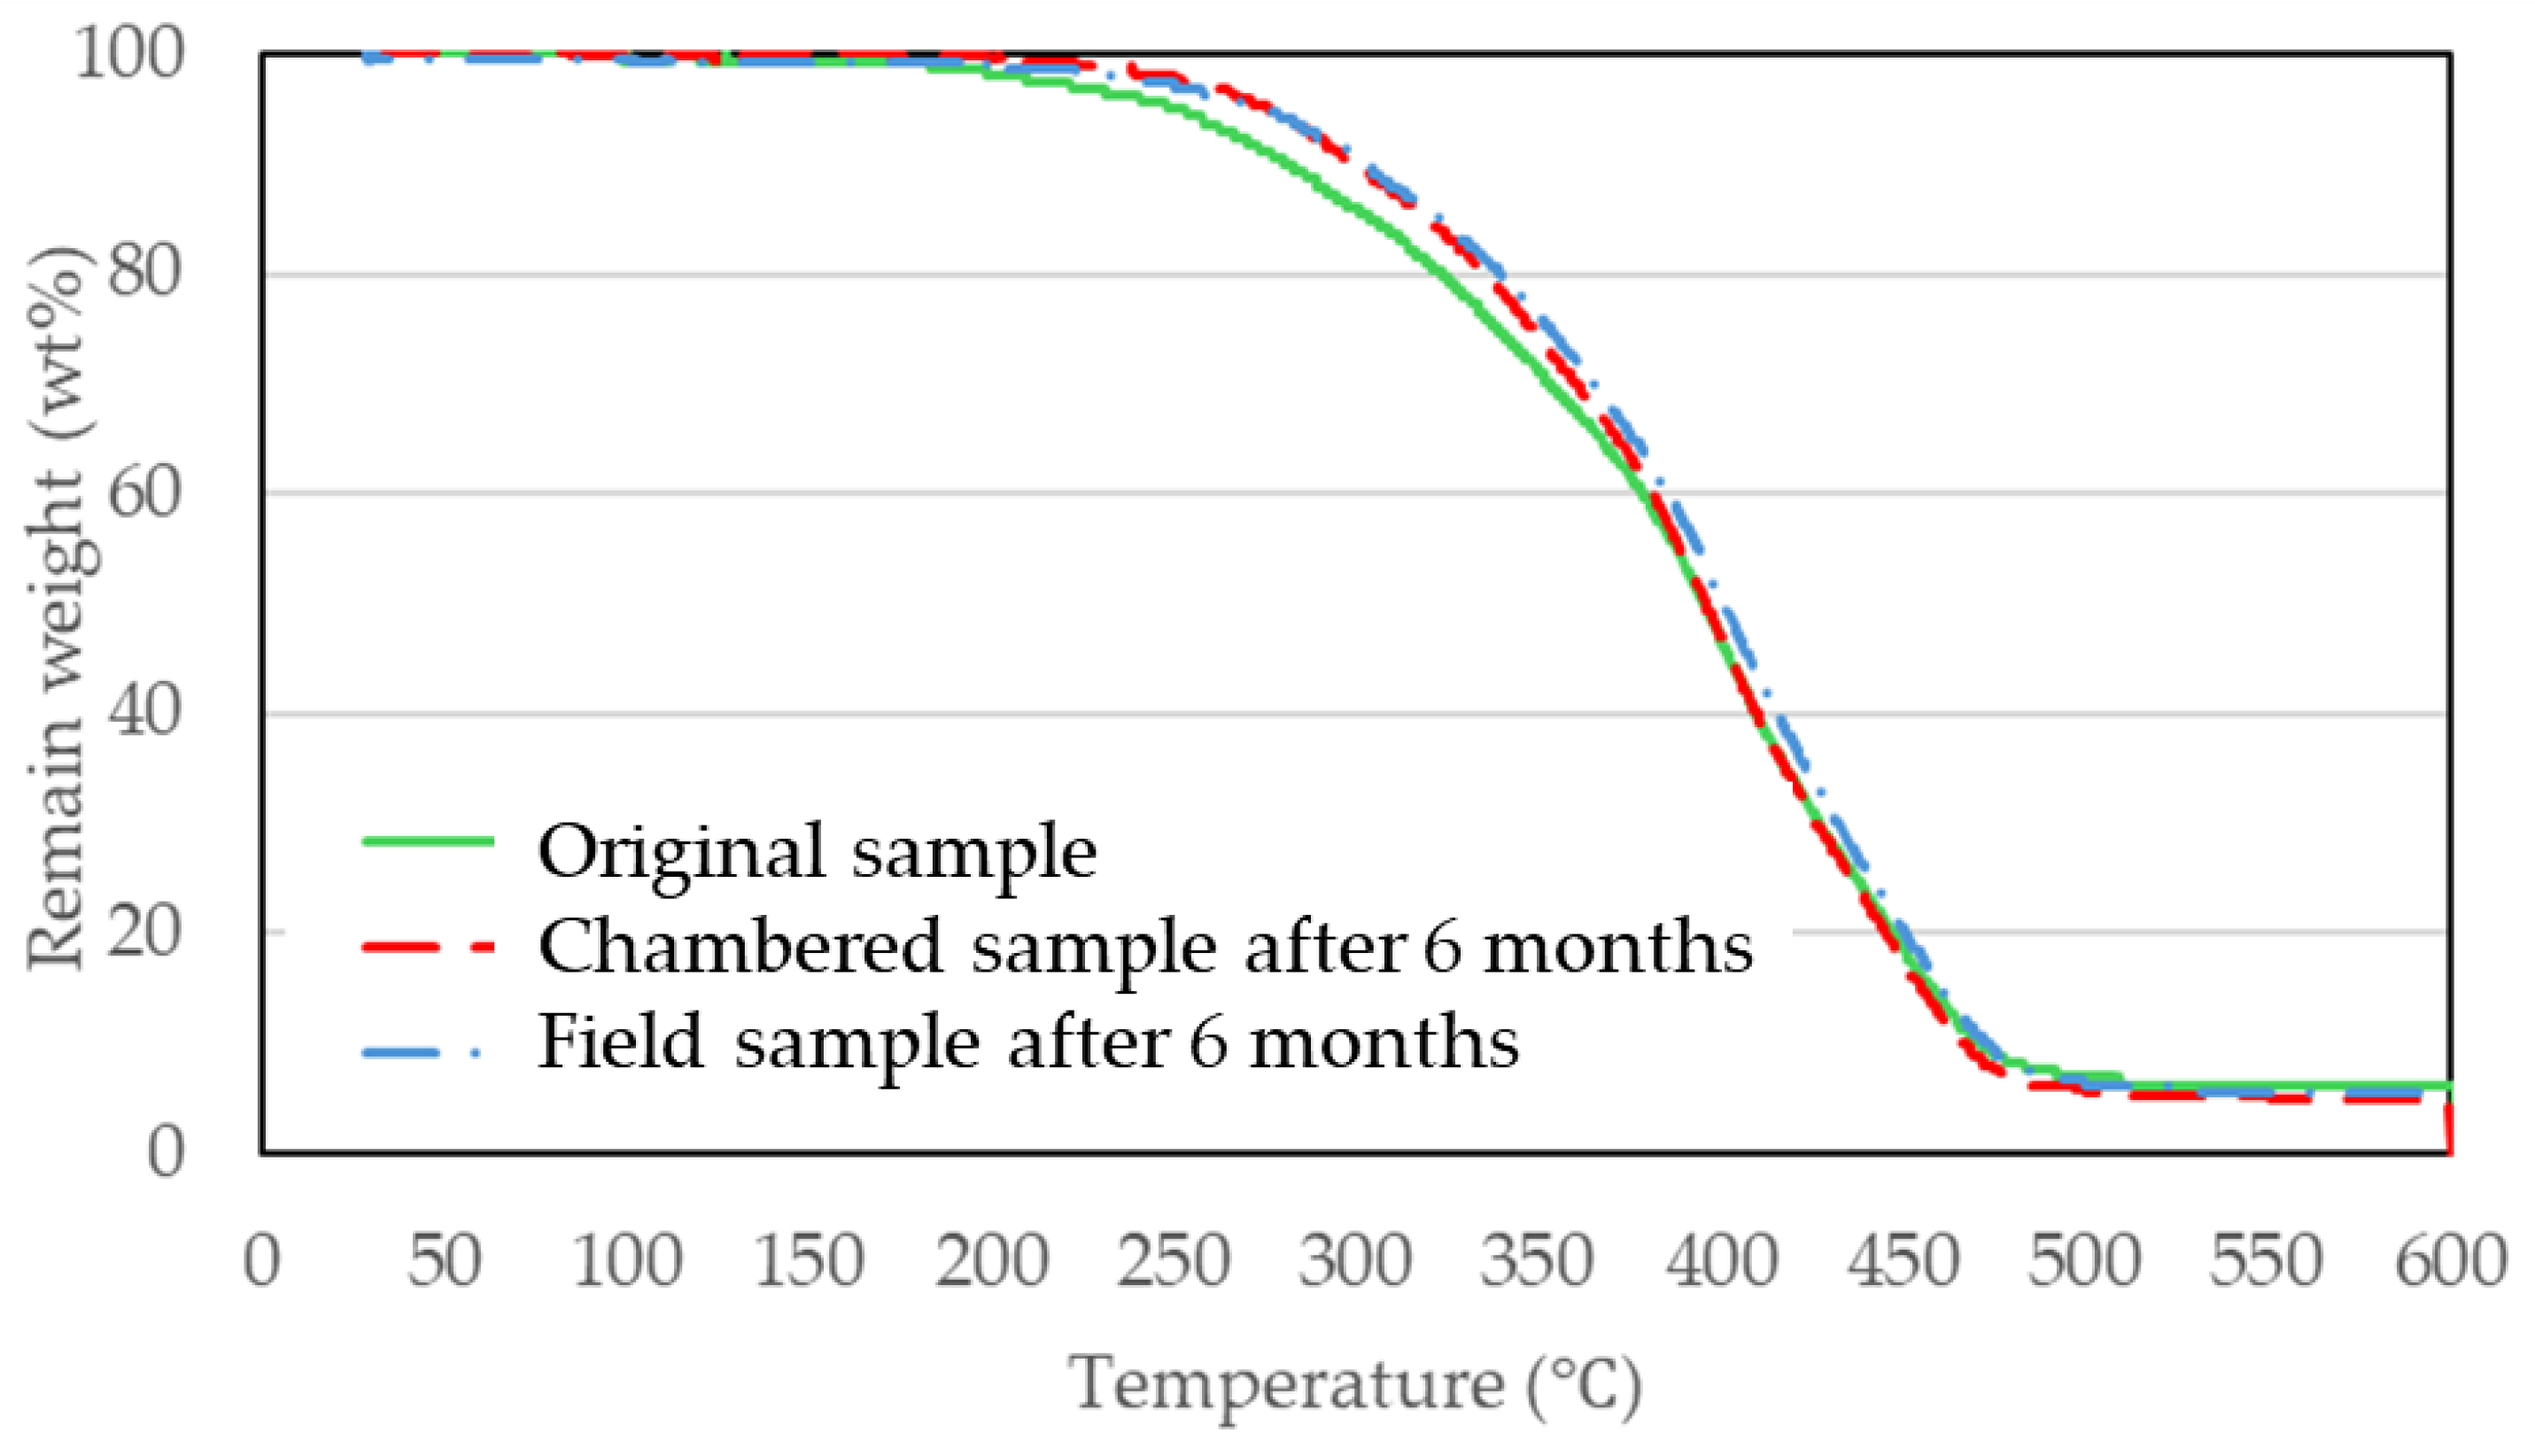
3.3. Evaluation of Bio-Polyurethane Foam

Figure 6 shows the bio-polyurethane foam produced from the liquefied product. The formulation consisted of 15 g of liquefied product, an isocyanate ratio of 1, and 1 g each of a foam stabilizer, water, and DBDTL. The surface of the foam was smooth, with a sponge-like texture and elasticity, demonstrating good resilience under stress. Additionally, SEM observations of the foam cross-section revealed a fine and uniform cell structure. Figure 7 presents the SEM images of the foam cross-section with zooming at ×120. Cell sizes were measured from the SEM images, and the size was in the 300 to 500 μm range.
In addition, the foaming ratio and water absorption of the bio-polyurethane foam produced in this study were measured and compared with those of petroleum-derived polyurethane foam made from PEG400. The results are presented in Table 6.
The foaming ratios of both types of polyurethane foams were found to be approximately ten times their original volume under identical conditions. This indicates that the bio-polyurethane foam, made from biomass-derived bio-polyol, exhibits an expansion ratio comparable to that of petroleum-derived polyurethane foam (PEG400). Furthermore, water absorption measurements based on JIS K7209 showed that the bio-polyurethane foam had a higher water absorption rate than the PEG400-based polyurethane foam. While a direct comparison is difficult due to differences in the expansion ratio and cell size, it is possible that the inclusion of low-molecular-weight lignocellulosic biomass altered the surface wettability, leading to an increase in water absorption.
The biodegradability of the bio-polyurethane foam was evaluated based on the weight change and the temperature of the field environment during the evaluation period, as shown in Figure 8 and Figure 9, respectively.
The weight reduction in field conditions revealed a significant decrease starting after six months. As seen in Figure 8, samples retrieved from the soil after six months showed substantial disintegration, with some samples losing their original shape. The weight loss pattern indicated an initial slight reduction in the first one to two months, followed by a stabilization period of about three months, and then a significant decrease afterward. This suggests that the progression of biodegradation and weight loss is not strictly proportional. However, since the biodegradation experiment in this study started in December (winter), as shown in Figure 9, the third stage coincided with Japan’s warm and humid rainy season. This suggests that the rate of stage progression may vary depending on the season. This seasonal influence may also explain why the samples put in a chamber with a constant temperature and humidity exhibited different results without distinct biodegradation stages. Additionally, the gardening soil used in the experiment may have contained fewer microorganisms capable of degrading bio-polyurethane. Based on this concept, the biodegradation of the bio-polyurethane foam appears to occur in distinct stages. In the biodegradation of polyurethane, ester bonds—being more susceptible to hydrolysis—are believed to degrade first [40,41], followed by the breakdown of urethane linkages. Accordingly, in the initial phase (1–2 months), the partial hydrolysis of ester bonds occurs preferentially; however, the material largely retains its structural integrity. In contrast, as hydrolysis progresses further and reaches the urethane linkages (after approximately 3–5 months), no significant weight change is detected. By 6 months, when the degradation of urethane bonds becomes prominent, the foam is no longer able to maintain its original shape, resulting in substantial weight loss. A schematic representation of these stages is illustrated in Figure 10.
Conversely, bio-polyurethane foam samples placed in the temperature- and humidity-controlled chamber exhibited almost no weight loss. The slight weight reduction observed was likely due to abrasion from repeated excavation and reburial rather than biodegradation. A comparison of sample appearances between the two environments showed significant structural deterioration and fragmentation in field environment samples, while controlled chamber samples maintained their structure with only minor rounding at the edges. Additionally, the weight of the chamber-stored samples closely matched that of the outdoor samples up to the five-month mark. This suggests that the sudden weight loss observed in outdoor samples after six months was due to biodegradation rather than physical wear.
To further assess biodegradability, the elemental composition was tracked using a CHN elemental analysis, with the results presented in Figure 11.
The analysis revealed a reduction in the percentages of C, H, and N in the buried samples compared to the original samples, while the oxygen content increased. This can be attributed to the hydrolysis of urethane bonds during biodegradation, leading to the cleavage of C-O ester bonds and the insertion of hydroxyl groups, thereby lowering the C, H, and N content while increasing the O content.
Additionally, the chemical changes in functional groups due to biodegradation were evaluated using FT-IR analysis. The samples used for this analysis were the same as those subjected to elemental analysis, having been buried for six months. The results are shown in Figure 12.
The FT-IR spectra indicated that the hydrolysis-induced cleavage of carbon chains and insertion of hydroxyl groups led to changes in peak intensities corresponding to the relevant functional groups (ester C-O bonds at 1210 and 1100 cm−1, Amide II bands at 1530 cm−1, and hydroxyl groups at 3300 cm−1). Compared to the original sample, the biodegraded samples showed decreased intensities in ester and C-N bond peaks and an increased intensity in hydroxyl group peaks. Furthermore, peak intensities followed the following order: original sample > controlled chamber sample > field sample, which corresponded to the degree of biodegradation [42,43]. Under field environmental conditions, a reduction in the peak intensity associated with ester bonds (at 1700 cm−1) and Amide II bands (at 1530 cm−1), indicative of biodegradation, was observed. In contrast, samples maintained in a temperature- and humidity-controlled chamber exhibited no discernible changes in the intensity of these peaks compared to the original specimen, nor was any weight loss detected. These results suggest that biodegradation did not occur under the controlled conditions.
Finally, to determine whether biodegradation affects the thermal properties of the bio-polyurethane foam, thermogravimetric analysis (TGA) was performed on samples retrieved during the biodegradation experiment. The results are shown in Figure 13.
The thermogravimetric behavior of the biodegraded samples remained unchanged compared to the initial sample, suggesting that the structural deterioration and molecular fragmentation due to biodegradation did not significantly impact the thermal properties of the bio-polyurethane foam. This trend for the bio-polyurethane foam has enough thermal stability and was equal to our previous study and others [8,44,45,46].

4. Conclusions

This study produced bio-polyol from liquefied wood and subsequently synthesized bio-polyurethane foam, evaluating its biodegradability through multiple approaches.
The weight loss analysis revealed three distinct biodegradation stages: initial dissolution of soluble components with minimal weight reduction (1–2 months), structural degradation without significant mass loss (3–5 months), and structural collapse with substantial weight decrease (after 6 months).
Beyond conventional CO2 emission assessments, chemical approaches were investigated for the biodegradation evaluation. FT-IR spectroscopy compared functional group intensities, while CHN elemental analysis examined compositional changes. Six-month biodegraded samples showed decreased C-O and Amide II absorption peaks with an increased hydroxyl group intensity. The CHN analysis indicated that the oxygen content increased from 26.5% to 28.4% (controlled chamber) and 34.1% (field environment), suggesting urethane bond cleavage and hydroxyl group formation primarily in field conditions. These findings demonstrate that chemical methods can effectively assess biodegradability.
The TGA analysis of biodegraded samples showed unchanged weight loss curves, indicating that biodegradation does not significantly compromise the thermal stability of bio-polyurethane foam.

Author Contributions

G.M.: Original Draft Writing—Visualization, Investigation, Writing—review & editing; C.E.E.: Supervision, Writing—review and editing; K.I.: Data curation, Conceptualization, Methodology, Visualization, Investigation; W.W.: Supervision, Writing—review and editing; Q.W.: Supervision, Writing—revision and editing, Resources. All authors have read and agreed to the published version of the manuscript.

Funding

This research received no external funding.

Data Availability Statement

All data have been presented in the manuscript.

Acknowledgments

This study was partially supported by the Special Funds for Basic Research (B) (No. 22H03747, FY2022-FY2024) of the Grant-in-Aid for Scientific Research of Japanese Ministry of Education, Culture, Sports, Science and Technology (MEXT). Our heartfelt thanks go to Mitsui Chemicals, Inc. for their kind donation of materials, which made this study possible. We are truly grateful for their generosity and the trust they placed in our research endeavors.

Conflicts of Interest

The authors declare the following financial interests/personal relationships, which may be considered as potential competing interests: GO MASUDA reports was provided by Saitama University.

References

  1. Allen, S.; Allen, D.; Phoenix, V.R.; Le Roux, G.; Jiménez, P.D.; Simonneau, A.; Binet, S.; Galop, D. Atmospheric transport and deposition of microplastics in a remote mountain catchment. Nat. Geosci. 2019, 12, 339–344. [Google Scholar] [CrossRef]
  2. Dris, R.; Gasperi, J.; Rocher, V.; Saad, M.; Renault, N.; Tassin, B. Microplastic contamination in an urban area: A case study in Greater Paris. Environ. Chem. 2015, 12, 592–599. [Google Scholar] [CrossRef]
  3. Chen, G.; Feng, Q.; Wang, J. Mini-review of microplastics in the atmosphere and their risks to humans. Sci. Total Environ. 2020, 703, 135504. [Google Scholar] [CrossRef] [PubMed]
  4. White, W.R.; Durocher, D.T. Recycling of Rigid Polyurethane Articles and Reformulation into a Variety of Polyurethane Applications. J. Cell. Plast. 1997, 33, 477–486. [Google Scholar] [CrossRef]
  5. Blais, M.; Carpenter, K. Flexible Polyurethane Foams: A Comparative Measurement of Toxic Vapors and Other Toxic Emissions in Controlled Combustion Environments of Foams With and Without Fire Retardants. Fire Technol. 2015, 51, 3–18. [Google Scholar] [CrossRef]
  6. Tuohedi, N.; Wang, Q. Preparation and Evaluation of Epoxy Resin Prepared from the Liquefied Product of Cotton Stalk. Processes 2021, 9, 1417. [Google Scholar] [CrossRef]
  7. Wang, Q.; Chen, Q.; Qiao, Q.; Sugiyama, K. Process analysis of the waste bamboo by using polyethylene glycol solvent liquefaction. Int. J. Sustain. Dev. Plan. 2014, 9, 647–657. [Google Scholar] [CrossRef]
  8. Wang, Q.; Tuohedi, N. Polyurethane Foams and Bio-Polyols from Liquefied Cotton Stalk Agricultural Waste. Sustainability 2020, 12, 4214. [Google Scholar] [CrossRef]
  9. Kurimoto, Y.; Doi, S.; Tamura, Y. Species effects on wood-liquefaction in polyhydric alcohols. Holzforschung 1999, 53, 617–622. [Google Scholar] [CrossRef]
  10. Kurimoto, Y.; Shirakawa, K.; Yoshioka, M.; Shiraishi, N. Liquefaction of untreated wood with polyhydric alcohols and its application to polyurethane foams. FRI Bull. 1992, 176, 163–172. [Google Scholar]
  11. Lin, L.; Yao, Y.; Yoshioka, M.; Shiraishi, N. Liquefaction mechanism of cellulose in the presence of phenol under acid catalysis. Carbohydr. Polym. 2004, 57, 123–129. [Google Scholar] [CrossRef]
  12. Kobayashi, M.; Asano, T.; Kajiyama, M.; Tomita, B. Analysis on residue formation during wood liquefaction with polyhydric alcohol. J. Wood Sci. 2004, 50, 407–414. [Google Scholar] [CrossRef]
  13. Zhang, Q.H.; Zhao, G.J.; Yu, L.L.; Jie, S.J. Preparation of liquefied wood-based resins and their application in molding material. For. Stud. China 2007, 9, 51–56. [Google Scholar] [CrossRef]
  14. Janiszewska-Latterini, D.; Pizzi, A. Application of Liquefied Wood Products for Particleboard Manufacturing: A Meta-analysis Review. Curr. For. Rep. 2023, 9, 291–300. [Google Scholar] [CrossRef]
  15. Yin, B.; Hakkarainen, M. Green Plasticizers from Liquefied Wood. Waste Biomass Valorization 2014, 5, 651–659. [Google Scholar] [CrossRef]
  16. Zhang, J.; Hori, N.; Takemura, A. Optimization of agricultural wastes liquefaction process and preparing biobased polyurethane foams by the obtained polyols. Ind. Crops Prod. 2019, 138, 111455. [Google Scholar] [CrossRef]
  17. Kurimoto, Y.; Takeda, M.; Koizumi, A.; Yamauchi, S.; Doi, S.; Tamura, Y. Mechanical properties of polyurethane films prepared from liquefied wood with polymeric MDI. Bioresour. Technol. 2000, 74, 151–157. [Google Scholar] [CrossRef]
  18. Wang, T.; Zhang, L.; Li, D.; Yin, J.; Wu, S.; Mao, Z. Mechanical properties of polyurethane foams prepared from liquefied corn stover with PAPI. Bioresour. Technol. 2008, 99, 2265–2268. [Google Scholar] [CrossRef]
  19. Domingos, I.; Ferreira, J.; Cruz-Lopes, L.; Esteves, B. Polyurethane foams from liquefied orange peel wastes. Food Bioprod. Process. 2019, 115, 223–229. [Google Scholar] [CrossRef]
  20. Bontaş, M.G.; Diacon, A.; Călinescu, I.; Rusen, E. Lignocellulose Biomass Liquefaction: Process and Applications Development as Polyurethane Foams. Polymers 2023, 15, 563. [Google Scholar] [CrossRef]
  21. Shiraishi, N. Liquefaction of Wood and Its Several Applications. J. Oleo Sci. 1997, 46, 1127–1236. [Google Scholar]
  22. Yang, W.; Han, Y.; Zhang, W.; Zhang, D. High-Strength and Low-Cost Biobased Polyurethane Foam Composites Enhanced by Poplar Wood Powder Liquefaction. Polymers 2021, 13, 2999. [Google Scholar] [CrossRef] [PubMed]
  23. Phosri, S.; Kunjiek, T.; Mukkhakang, C.; Suebthep, S.; Sinsup, W.; Phornsirigarn, S.; Charoeythornkhajhornchai, P. Biodegradability of bioplastic blown film in a marine environment. Front. Mar. Sci. 2022, 9, 917397. [Google Scholar] [CrossRef]
  24. Ruggero, F.; Onderwater, R.C.A.; Carretti, E.; Roosa, S.; Benali, S.; Raquez, J.-M.; Gori, R.; Lubello, C.; Wattiez, R. Degradation of Film and Rigid Bioplastics During the Thermophilic Phase and the Maturation Phase of Simulated Composting. J. Polym. Environ. 2021, 29, 3015–3028. [Google Scholar] [CrossRef]
  25. Payanthoth, N.S.; Mut, N.N.N.; Samanta, P.; Li, G.; Jung, J. A review of biodegradation and formation of biodegradable microplastics in soil and freshwater environments. Appl. Biol. Chem. 2024, 67, 110. [Google Scholar] [CrossRef]
  26. Tong, H.; Zhong, X.; Duan, Z.; Yi, X.; Cheng, F.; Xu, W.; Yang, X. Micro- and nanoplastics released from biodegradable and conventional plastics during degradation: Formation, aging factors, and toxicity. Sci. Total Environ. 2022, 833, 15527. [Google Scholar] [CrossRef]
  27. Gironi, F.; Piemonte, V. Bioplastics and Petroleum-based Plastics:Strengths and Weaknesses. Energy Sources Part A 2011, 33, 1949–1959. [Google Scholar] [CrossRef]
  28. Boey, J.Y.; Lee, C.K.; Tay, G.S. Factors Affecting Mechanical Properties of Reinforced Bioplastics: A Review. Polymers 2022, 14, 3737. [Google Scholar] [CrossRef]
  29. Omar, A.A.; Hanafi, M.H.M.; Razak, N.H.; Ibrahim, A.; Afwanisa’Ab Razak, N. A Best-Evidence Review of Bio-based Plasticizer and the Effects on the Mechanical Properties of PLA. Chem. Eng. Trans. 2021, 89, 241–246. [Google Scholar]
  30. Shashoua, Y.; Peydaei, A.; Mortensen, M.N.; Kanstrup, A.B.; Gregory, D.J. Real time degradation studies on polyurethane household sponges in Danish weather and marine environments. Mar. Pollut. Bull. 2022, 184, 114128. [Google Scholar] [CrossRef]
  31. Szpiłyk, M.; Lubczak, R.; Lubczak, J. The biodegradable cellulose-derived polyol and polyurethane foam. Polym. Test. 2021, 100, 107250. [Google Scholar] [CrossRef]
  32. Gunawan, N.R.; Tessman, M.; Schreiman, A.C.; Simkovsky, R.; Samoylov, A.A.; Neelakantan, N.K.; Bemis, T.A.; Burkart, M.D.; Pomeroy, R.S.; Mayfield, S.P. Rapid biodegradation of renewable polyurethane foams with identification of associated microorganisms and decomposition products. Bioresour. Technol. Rep. 2020, 11, 100513. [Google Scholar] [CrossRef]
  33. Pires, J.R.A.; Souza, V.G.L.; Fuciños, P.; Pastrana, L.; Fernando, A.L. Methodologies to Assess the Biodegradability of Bio-Based Polymers—Current Knowledge and Existing Gaps. Polymers 2022, 14, 1359. [Google Scholar] [CrossRef]
  34. Folino, A.; Karageorgiou, A.; Calabrò, P.S.; Komilis, D. Biodegradation of Wasted Bioplastics in Natural and Industrial Environments: A Review. Sustainability 2020, 12, 6030. [Google Scholar] [CrossRef]
  35. Gunawan, N.R.; Tessman, M.; Zhen, D.; Johnson, L.; Evans, P.; Clements, S.M.; Pomeroy, R.S.; Burkart, M.D.; Simkovsky, R.; Mayfield, S.P. Biodegradation of renewable polyurethane foams in marine environments occurs through depolymerization by marine microorganisms. Sci. Total Environ. 2022, 850, 158761. [Google Scholar] [CrossRef] [PubMed]
  36. Masuda, G.; Nagao, A.; Wang, W.; Wang, Q. Evaluation of Polyurethane Foam Derived from the Liquefied Driftwood Approaching for Untapped Biomass. Processes 2023, 11, 2929. [Google Scholar] [CrossRef]
  37. Masuda, G.; Enyoh, C.E.; Wang, W.; Suzuki, M.; Honda, Y.; Wang, Q. Synthesis and Characterization of Bio-Based Polyurea Derived from Liquefied Wood of Wooden Musical Instrument Offcuts. Macromol 2024, 4, 739–752. [Google Scholar] [CrossRef]
  38. Wang, Q.; Kawamura, S. Decayed Woody Material from Mushroom Cultivation: Characterization of Liquefaction. In Sustainable Development and Planning X; WIT Press: Hampshire, UK, 2018; pp. 481–492. [Google Scholar]
  39. Morohoshi, N.; Hong, C.-C.; Morimoto, M.; Oohashi, T.; Matumoto, H. Polymers and Environment I. Biodegradability of Flexible Polyurethane Foams. Kobunshi Ronbunshu 1993, 50, 731–738. [Google Scholar] [CrossRef]
  40. Taourit, S.; Le Gac, P.Y.; Fayolle, B. Relationship between network structure and ultimate properties in polyurethane during a chain scission process. Polym. Degrad. Stab. 2022, 201, 109971. [Google Scholar] [CrossRef]
  41. Di Bisceglie, F.; Quartinello, F.; Vielnascher, R.; Guebitz, G.M.; Pellis, A. Guebitz and Alessandro Pellis Cutinase-Catalyzed Polyester-Polyurethane Degradation Elucidation of the Hydrolysis Mechanism. Polymers 2022, 14, 411. [Google Scholar] [CrossRef]
  42. Pellizzi, E.; Lattuati-Derieux, A.; Lavédrine, B.; Cheradame, H. Degradation of polyurethane ester foam artifacts: Chemical properties, mechanical properties and comparison between accelerated and natural degradation. Polym. Degrad. Stab. 2014, 107, 255–261. [Google Scholar] [CrossRef]
  43. Skleničková, K.; Suchopárová, E.; Abbrent, S.; Pokorný, V.; Kočková, O.; Nevoralová, M.; Cajthaml, T.; Strejček, M.; Uhlík, O.; Halecký, M.; et al. Biodegradation of aliphatic polyurethane foams in soil: Influence of amide linkages and supramolecular structure. Sci. Total Environ. 2024, 912, 169062. [Google Scholar] [CrossRef] [PubMed]
  44. Kurańska, M.; Leszczyńska, M.; Kubacka, J.; Prociak, A.; Ryszkowska, J. Effects of Modified Used Cooking Oil on Structure and Properties of Closed-Cell Polyurethane foams. J. Polym. Environ. 2020, 28, 2780–2788. [Google Scholar] [CrossRef]
  45. Nguyen, T.A.; Vo, D.K.; Nguyen, K.T.D.; Tran, D.Q.; Nguyen, D.M.; Nguyen, N.T.; Vu, T.T.; Nguyen, V.T.; Hoang, D. Lightweight Biobased Polyurethane Composites Derived fromLiquefied Polyol Reinforced by Biomass Sources with HighMechanical Property and Enhanced Fire-Resistance Performance. ACS Omega 2024, 9, 19182–19192. [Google Scholar] [CrossRef]
  46. Lubczak, R.; Kus-Liśkiewicz, M.; Lubczak, J.; Szpiłyk, M.; Broda, D.; Bobko, E. Biodegradable Polyurethane Foams Based on Polyols Obtained from Cellulose and Its Hydroxypropyl Derivative. Materials 2024, 17, 5490. [Google Scholar] [CrossRef]
Figure 1. The appearance of field environment experiment.
Recycling 10 00126 g001
Figure 2. The order-made glass tube and silicone stopper for foaming.
Recycling 10 00126 g002
Figure 3. Residue content over liquefaction time in this study.
Recycling 10 00126 g003
Figure 4. FT-IR spectra of liquefaction solvent and liquefied products. Liquefaction solvent (top line), liquefaction time with 60 min (middle line), and liquefaction time with 180 min (bottom line).
Recycling 10 00126 g004
Figure 5. GPC chromatography of the liquefied products.
Recycling 10 00126 g005
Figure 6. Bio-polyurethane foam sample appearance.
Recycling 10 00126 g006
Figure 7. SEM image of the cross-section of bio-polyurethane foam.
Recycling 10 00126 g007
Figure 8. The biodegradability tests based on bio-polyurethane foam under two environmental conditions (field environment on top and controlled chamber on bottom).
Recycling 10 00126 g008
Figure 9. The temperature of the field environment during the evaluation period.
Recycling 10 00126 g009
Figure 10. The estimated process of biodegradation.
Recycling 10 00126 g010
Figure 11. The results of CHN analysis based on PUF.
Recycling 10 00126 g011
Figure 12. FT-IR spectra of bio-polyurethane foams during biodegradation process.
Recycling 10 00126 g012
Figure 13. TGA based on bio-polyurethane foams.
Recycling 10 00126 g013
Table 1. Liquefaction conditions in this study.
Setting ParameterSetting Point
Wood meal weight10 g
PEG400/Glycerol (7/3)50 g
Solvent weight ratio
(vs. wood meal)
6 times or 7 times
95% sulfuric acid1.5 g
Stirring speed700 rpm
Sampling points15, 30, 60, 90, 120, 180 min
Setting oil bath temperature150 °C
Table 2. The results of CHN corder and ash measurement.
ElementHydrogenCarbonNitrogenOxygenAsh
Content (%)5.844.50.346.13.3
Table 3. The component analysis results of wood meal.
ComponentOrganic Solvent-Soluble ContentHolocelluloseLignin
Content (%)11.964.528.4
Table 4. The results of acid and hydroxyl number measurements.
Residue Content (%)5
Liquefaction time (min)60180
Acid number (mg KOH/g)1416
Hydroxyl number (mg KOH/g)324265
Table 5. The calculation results of molecular weight.
Residue Content (%)5
Liquefaction time (min)60180
Mw10101080
Mn/Mw1.801.90
Table 6. The comparison of two types of polyols for polyurethane foams.
PolyolPEG400Liquefied Product
Foaming rate (times)9.914.0
Water adsorption (%)10.216.0
Disclaimer/Publisher’s Note: The statements, opinions and data contained in all publications are solely those of the individual author(s) and contributor(s) and not of MDPI and/or the editor(s). MDPI and/or the editor(s) disclaim responsibility for any injury to people or property resulting from any ideas, methods, instructions or products referred to in the content.

