
Evaluating Recycling Initiatives for Landfill Diversion in Developing Economies Using Integrated Machine Learning Techniques
 , ,
, ,
Abstract
1. Introduction
2. Literature Review
2.1. Recycling in Africa
Recycling Effectiveness
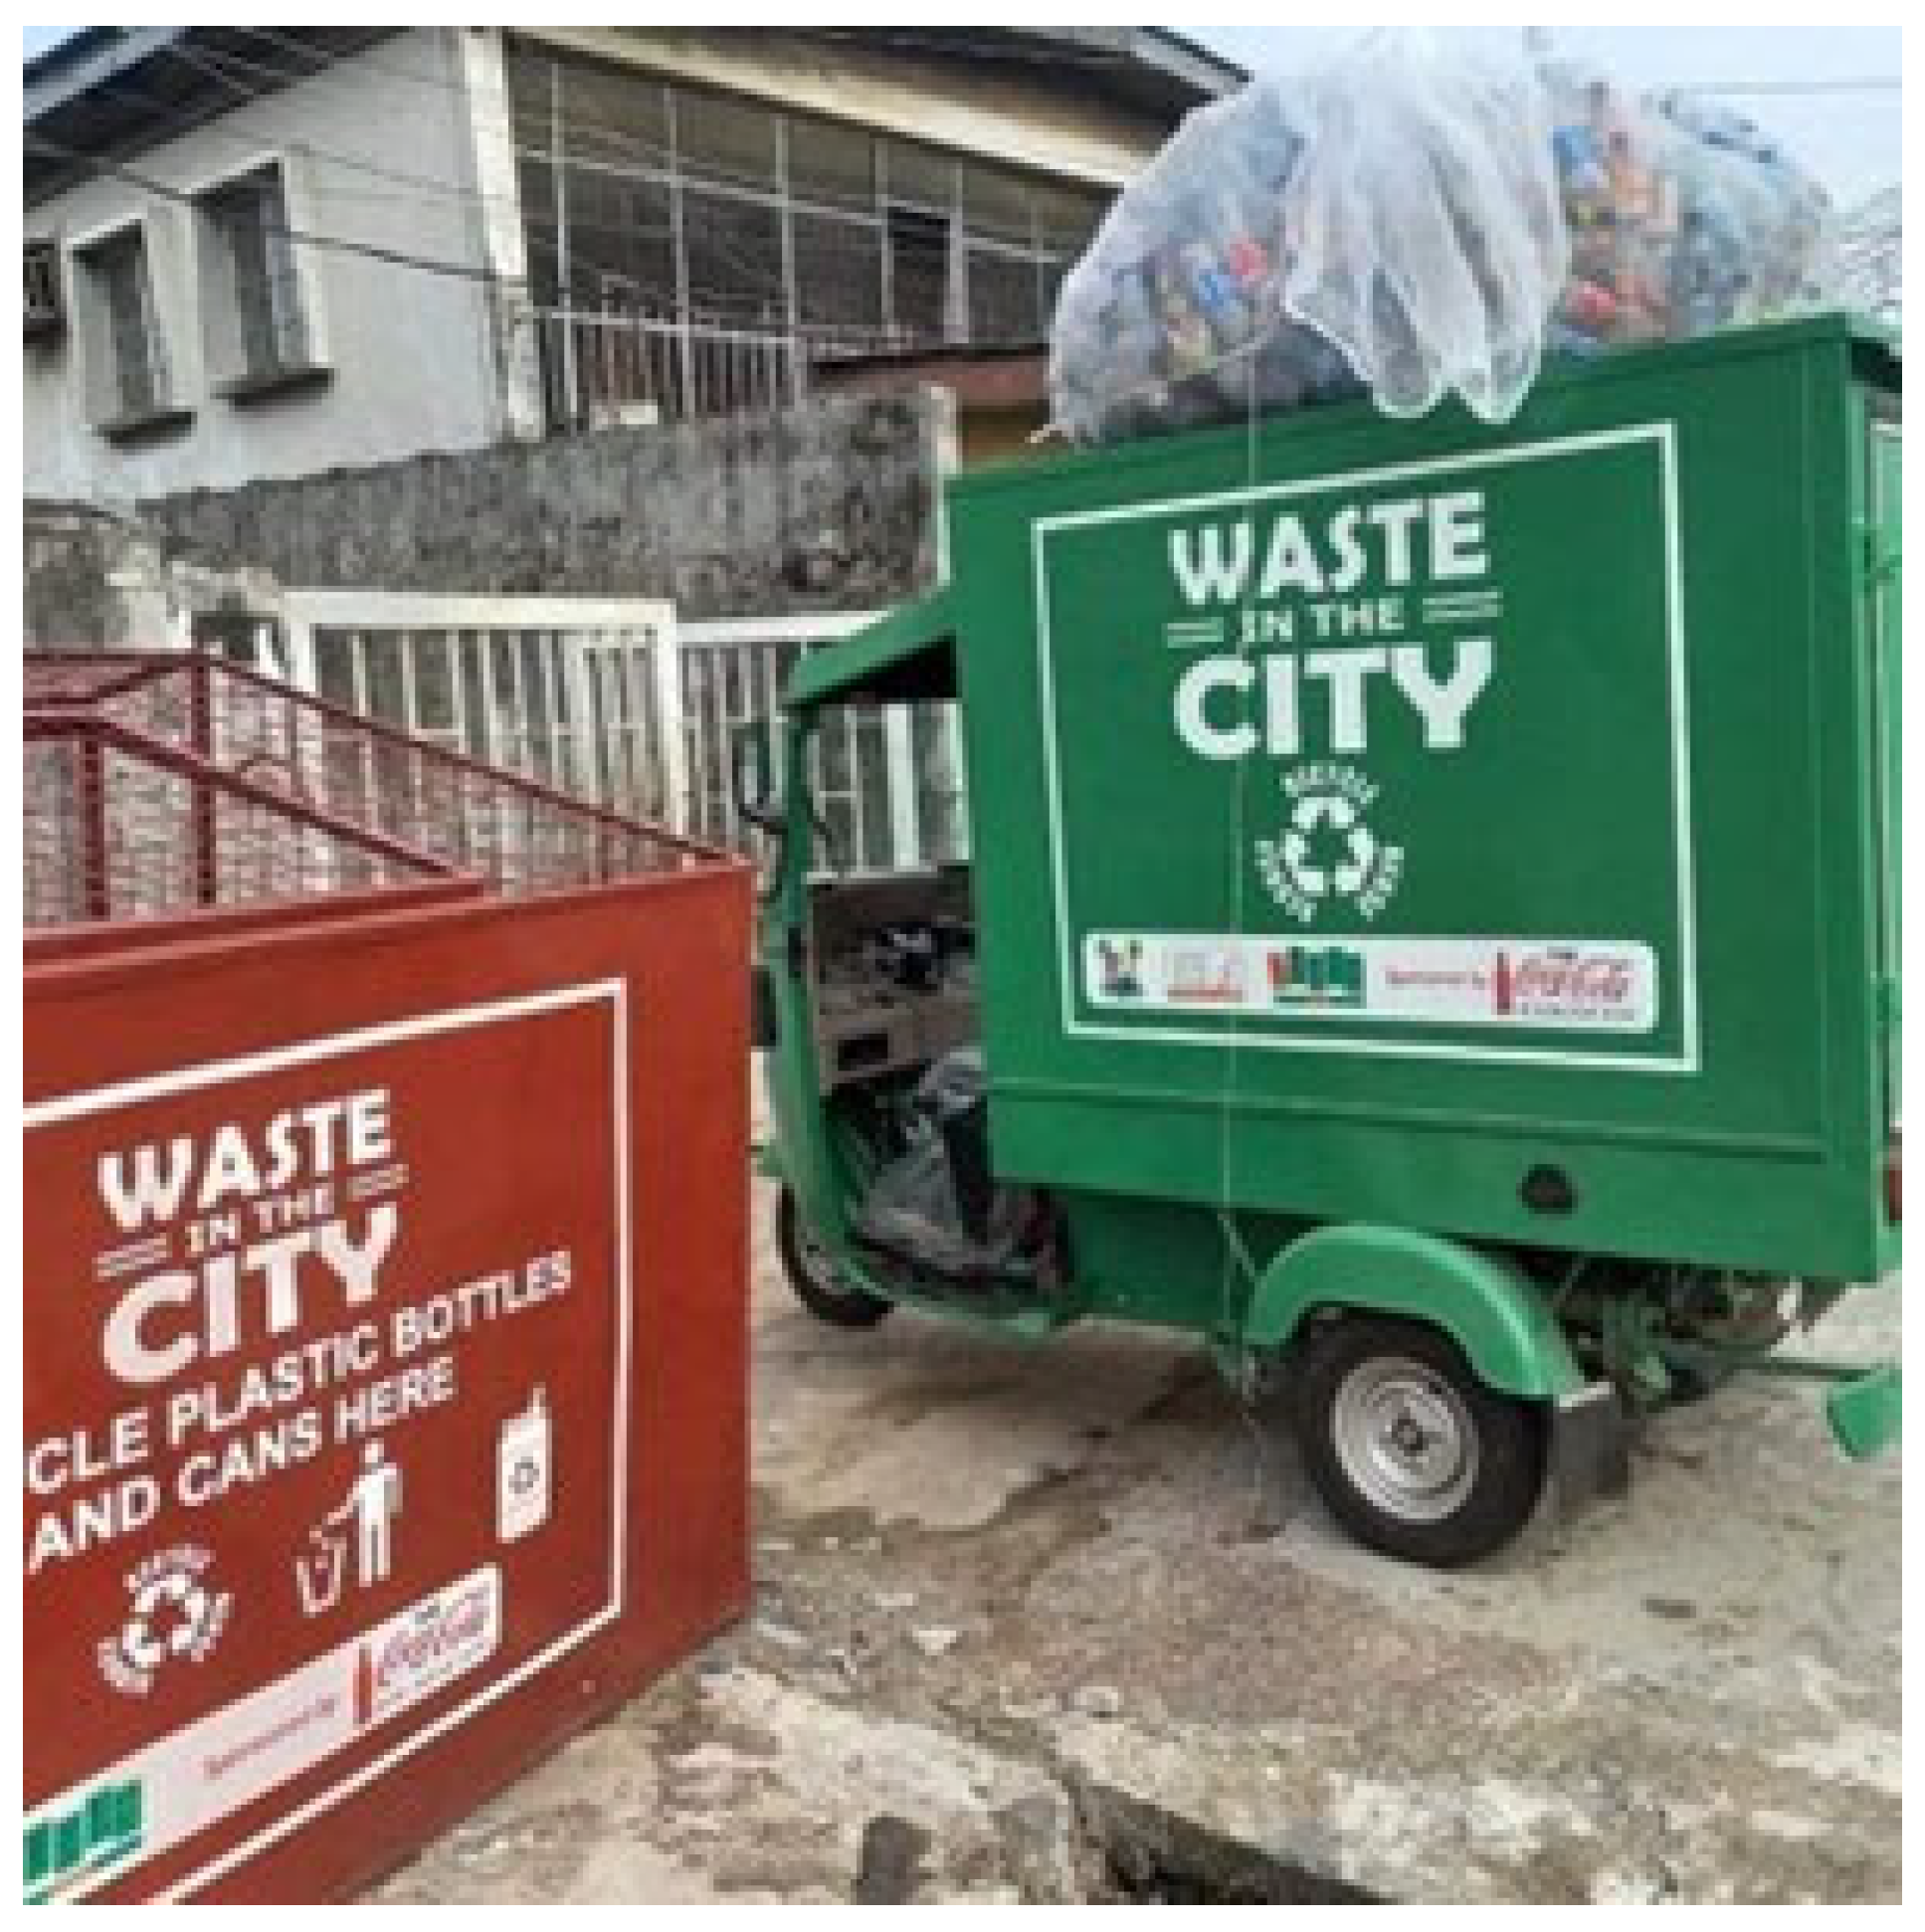
3. The Lagos Recycle Initiative
The Pakam App
4. Results and Discussion
4.1. Analysis of Data from the Recyclers
4.1.1. Distribution of the Collectors
4.1.2. Waste Bin Distribution Coverage
4.1.3. Waste Collection Frequency
4.1.4. Truck Capacity and the Weekly Volume of HSR Collected
4.1.5. HSR Material Type Collected
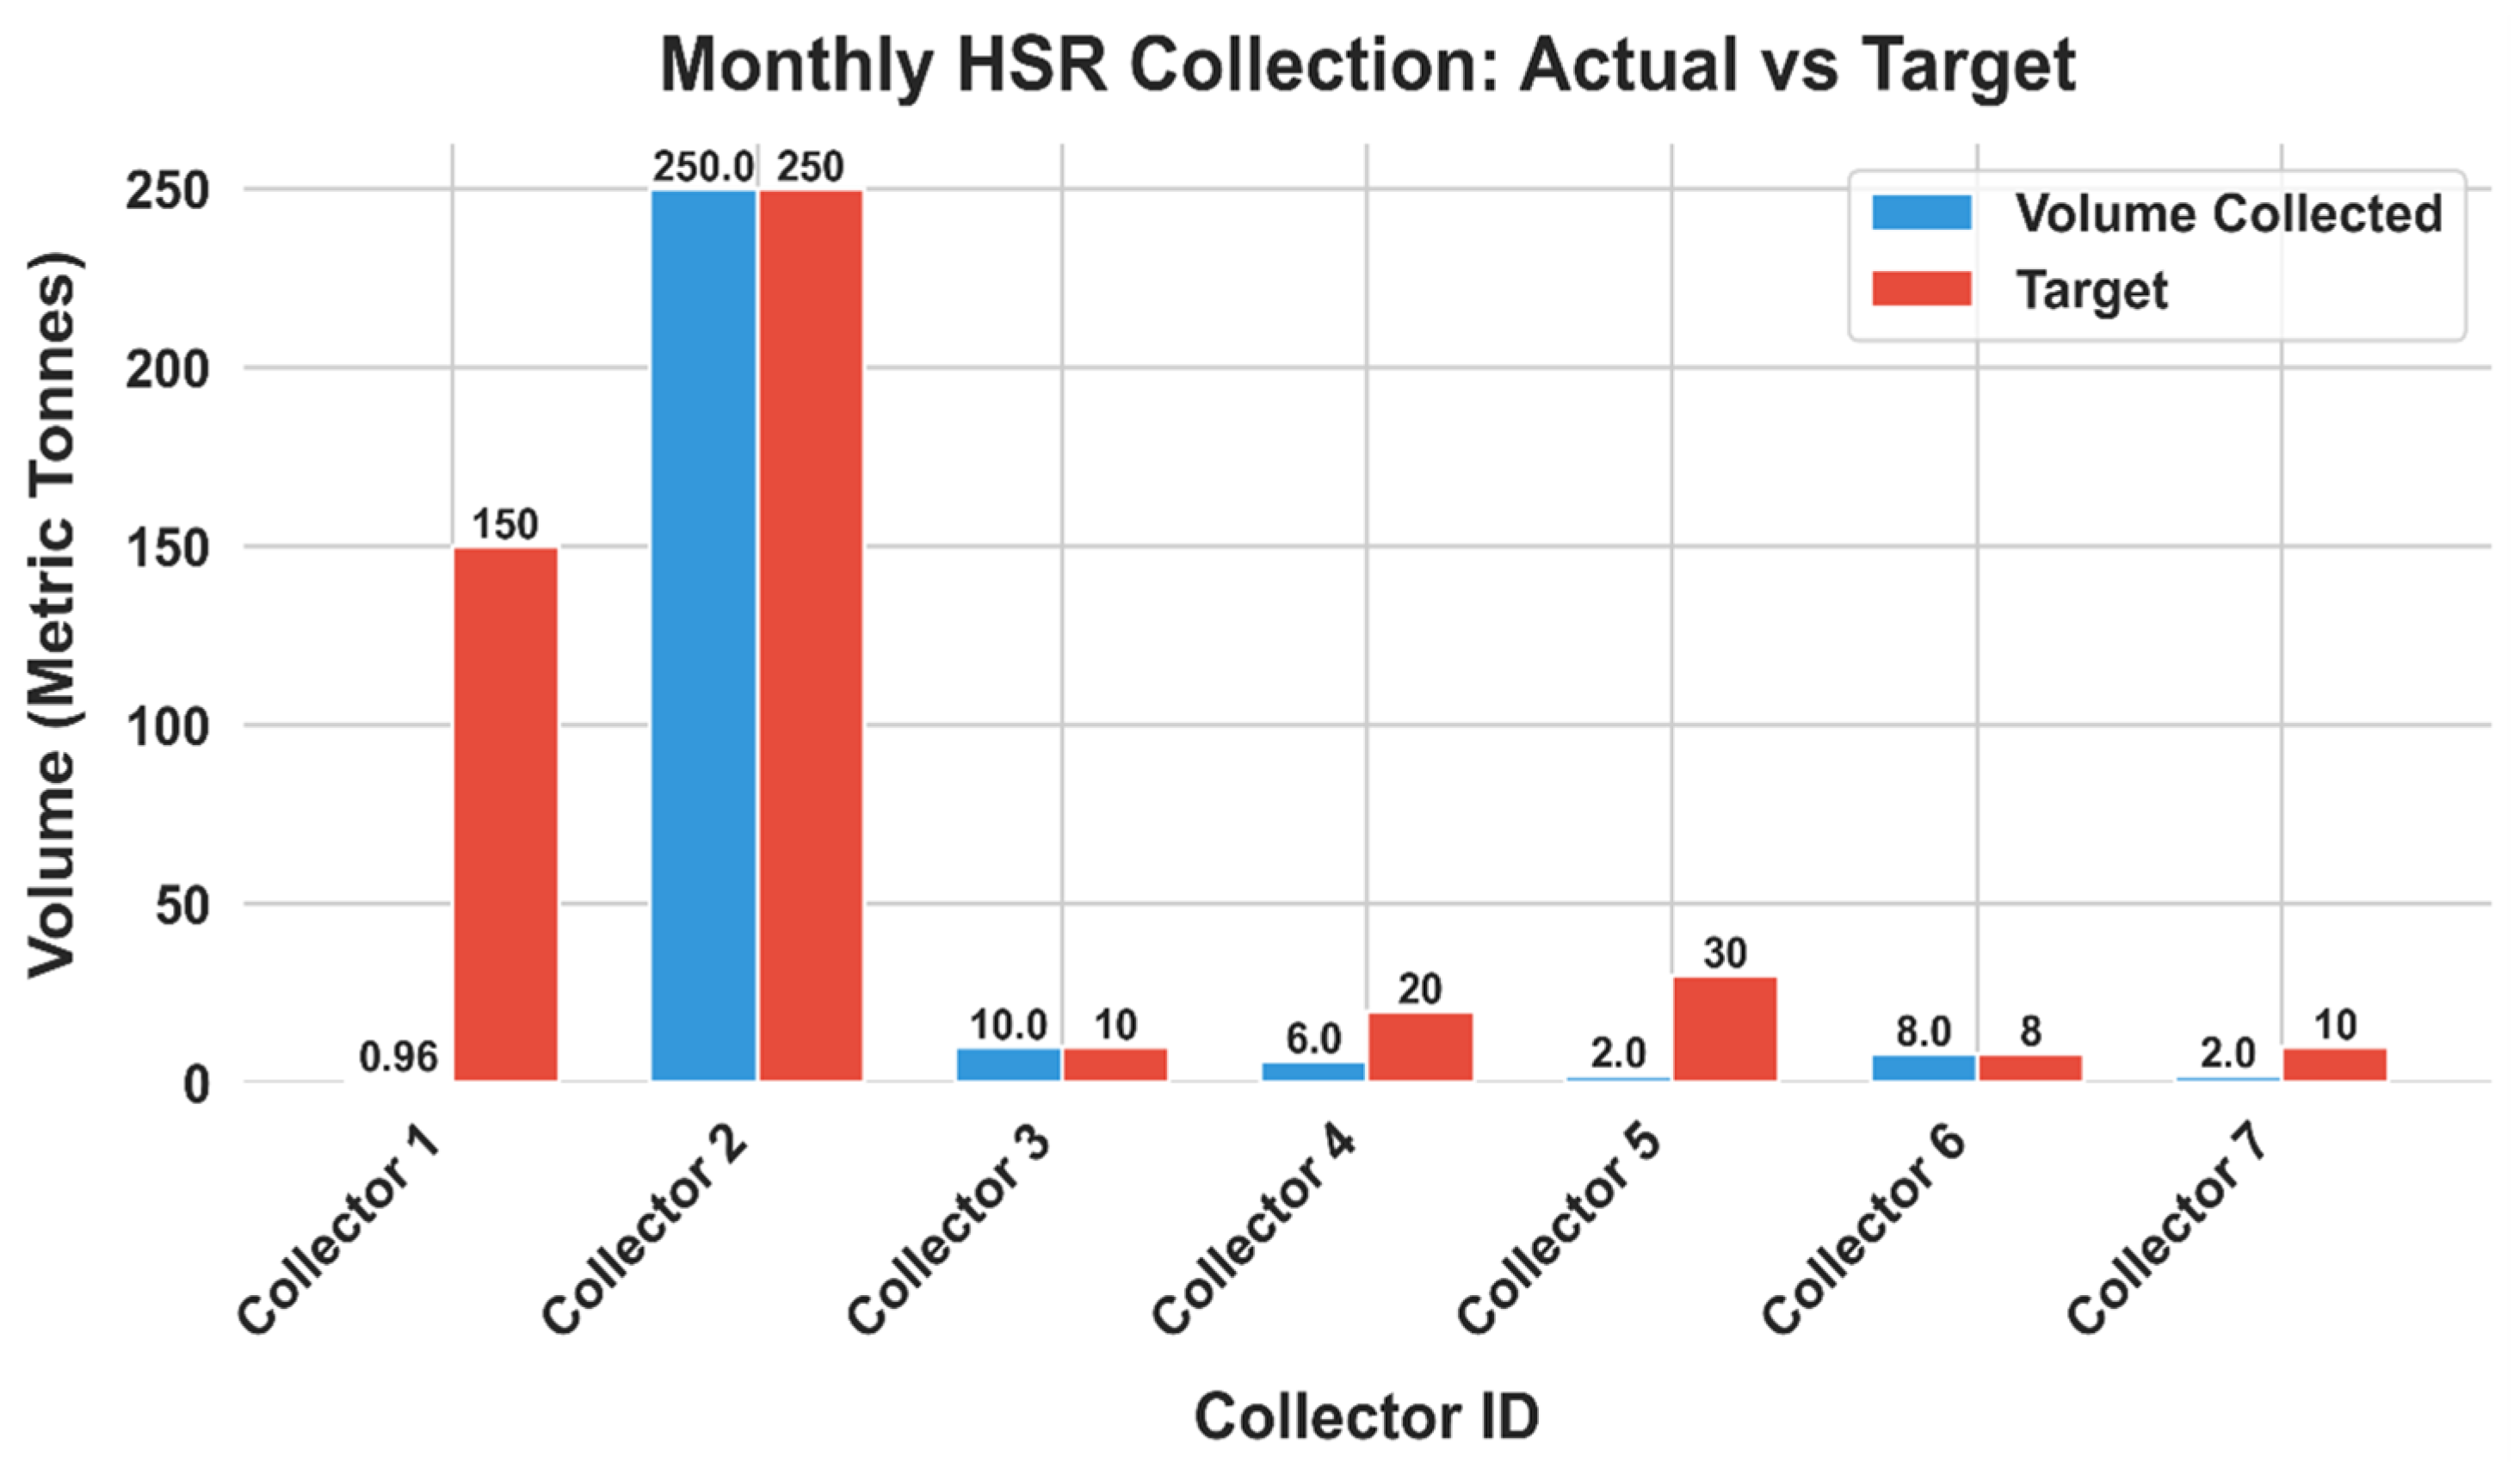
4.1.6. HSR Collected Versus Targeted
4.1.7. Challenges Faced by the Collectors
4.1.8. Estimation of the RDR
4.2. Analysis of Data from the Households
4.2.1. Profile of the Respondents
4.2.2. Data Preprocessing
- Ordinal data: Variables such as age, education level (Edl), frequency of HSR pick up (Fwp), no overflow of HSR bin (Nob), service quality during HSR collection (Sqc), and communication quality during HSR collection (Cqc) were encoded using label encoding. This method assigned numerical values to ordered categories, preserving the inherent order of the data (Table 1).
- Binary data: Variables like LRI awareness (Aws), regularity of HSR collection (Rwc), adequacy of HSR bin received (Awb), usage of Pakam app (Upa), HSR weighing at collection point (Hwc), perception of household regarding recycling (Phr), perception of recycling productivity (Prp), societal influence on recycling (Sir), HSR collection time (Hct), and motivation to recycle (Mtc) were encoded as binary values (1 for Yes, 0 for No).
- Categorical data: For variables such as working status (Wks) and type of waste sorted (Tws), one-hot encoding was employed. This technique created separate binary columns for each category, allowing for non-ordinal categorical data to be effectively used in various analytical models.
- Data standardisation: After encoding, numerical features were standardised to ensure all variables contribute equally to the model and to improve the convergence of ML algorithms. The standardisation process involved scaling the features to have a mean of 0 and a standard deviation of 1, using Equation (1):
4.2.3. Results of the ML Models
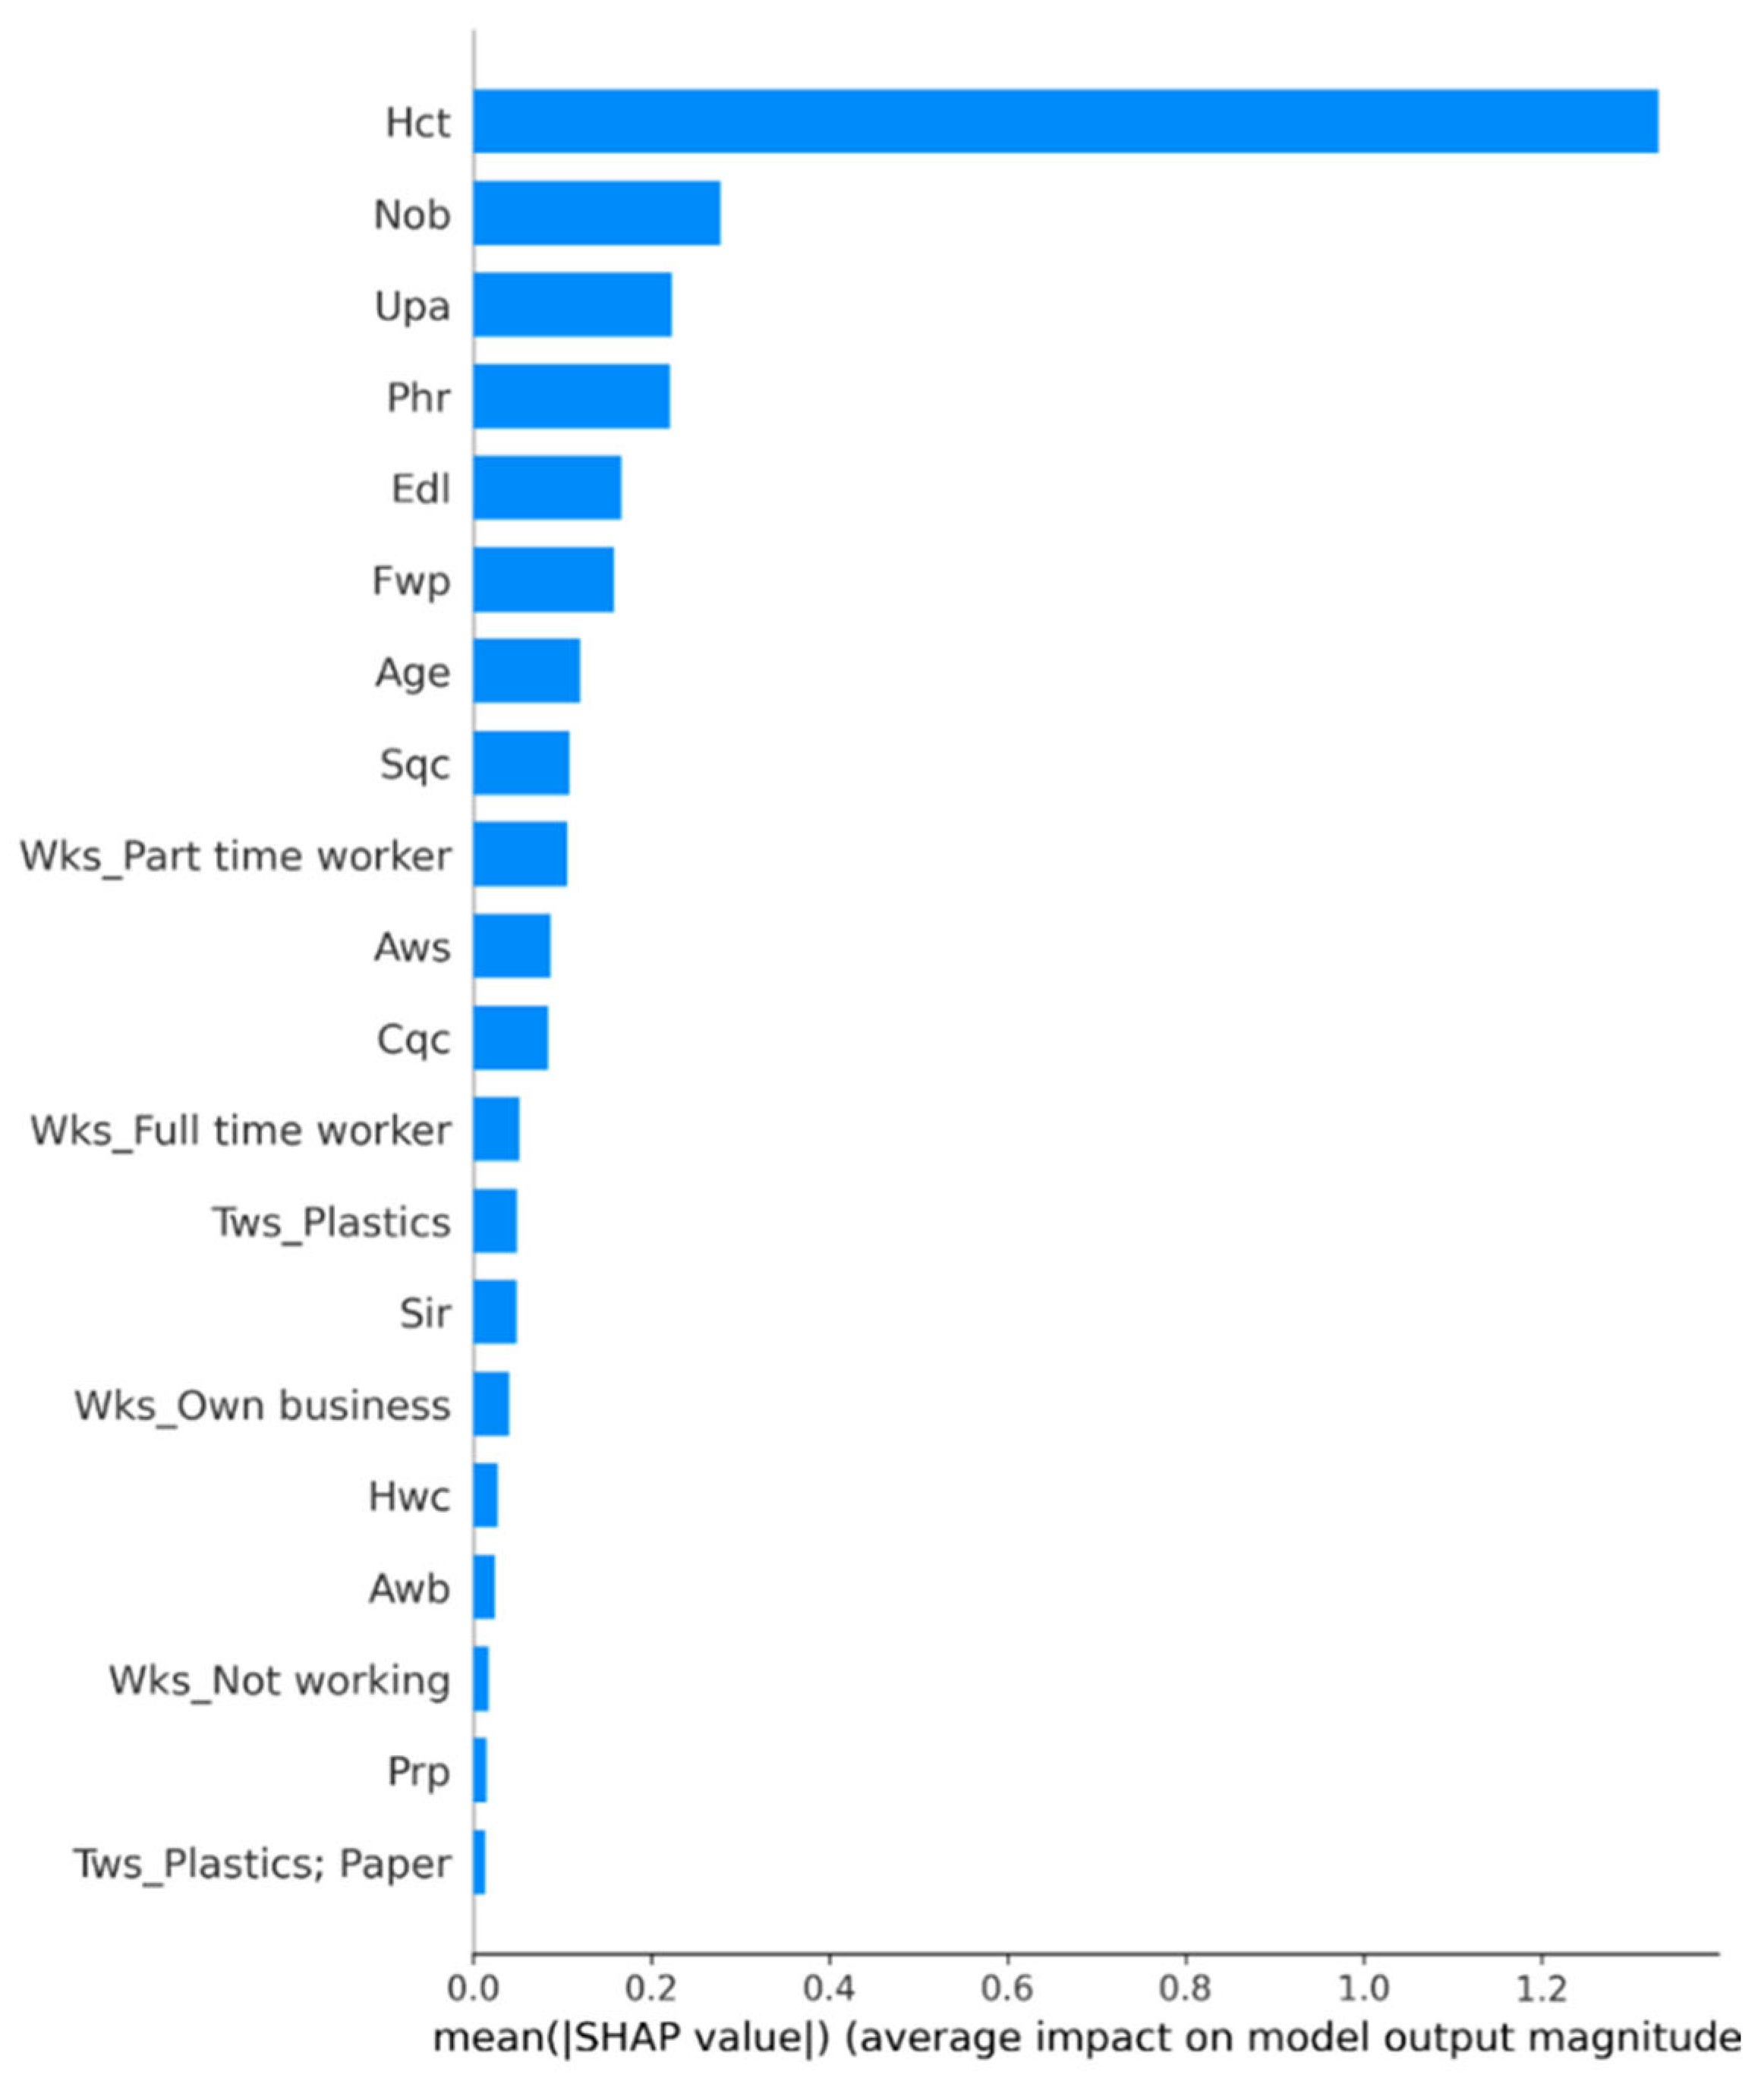
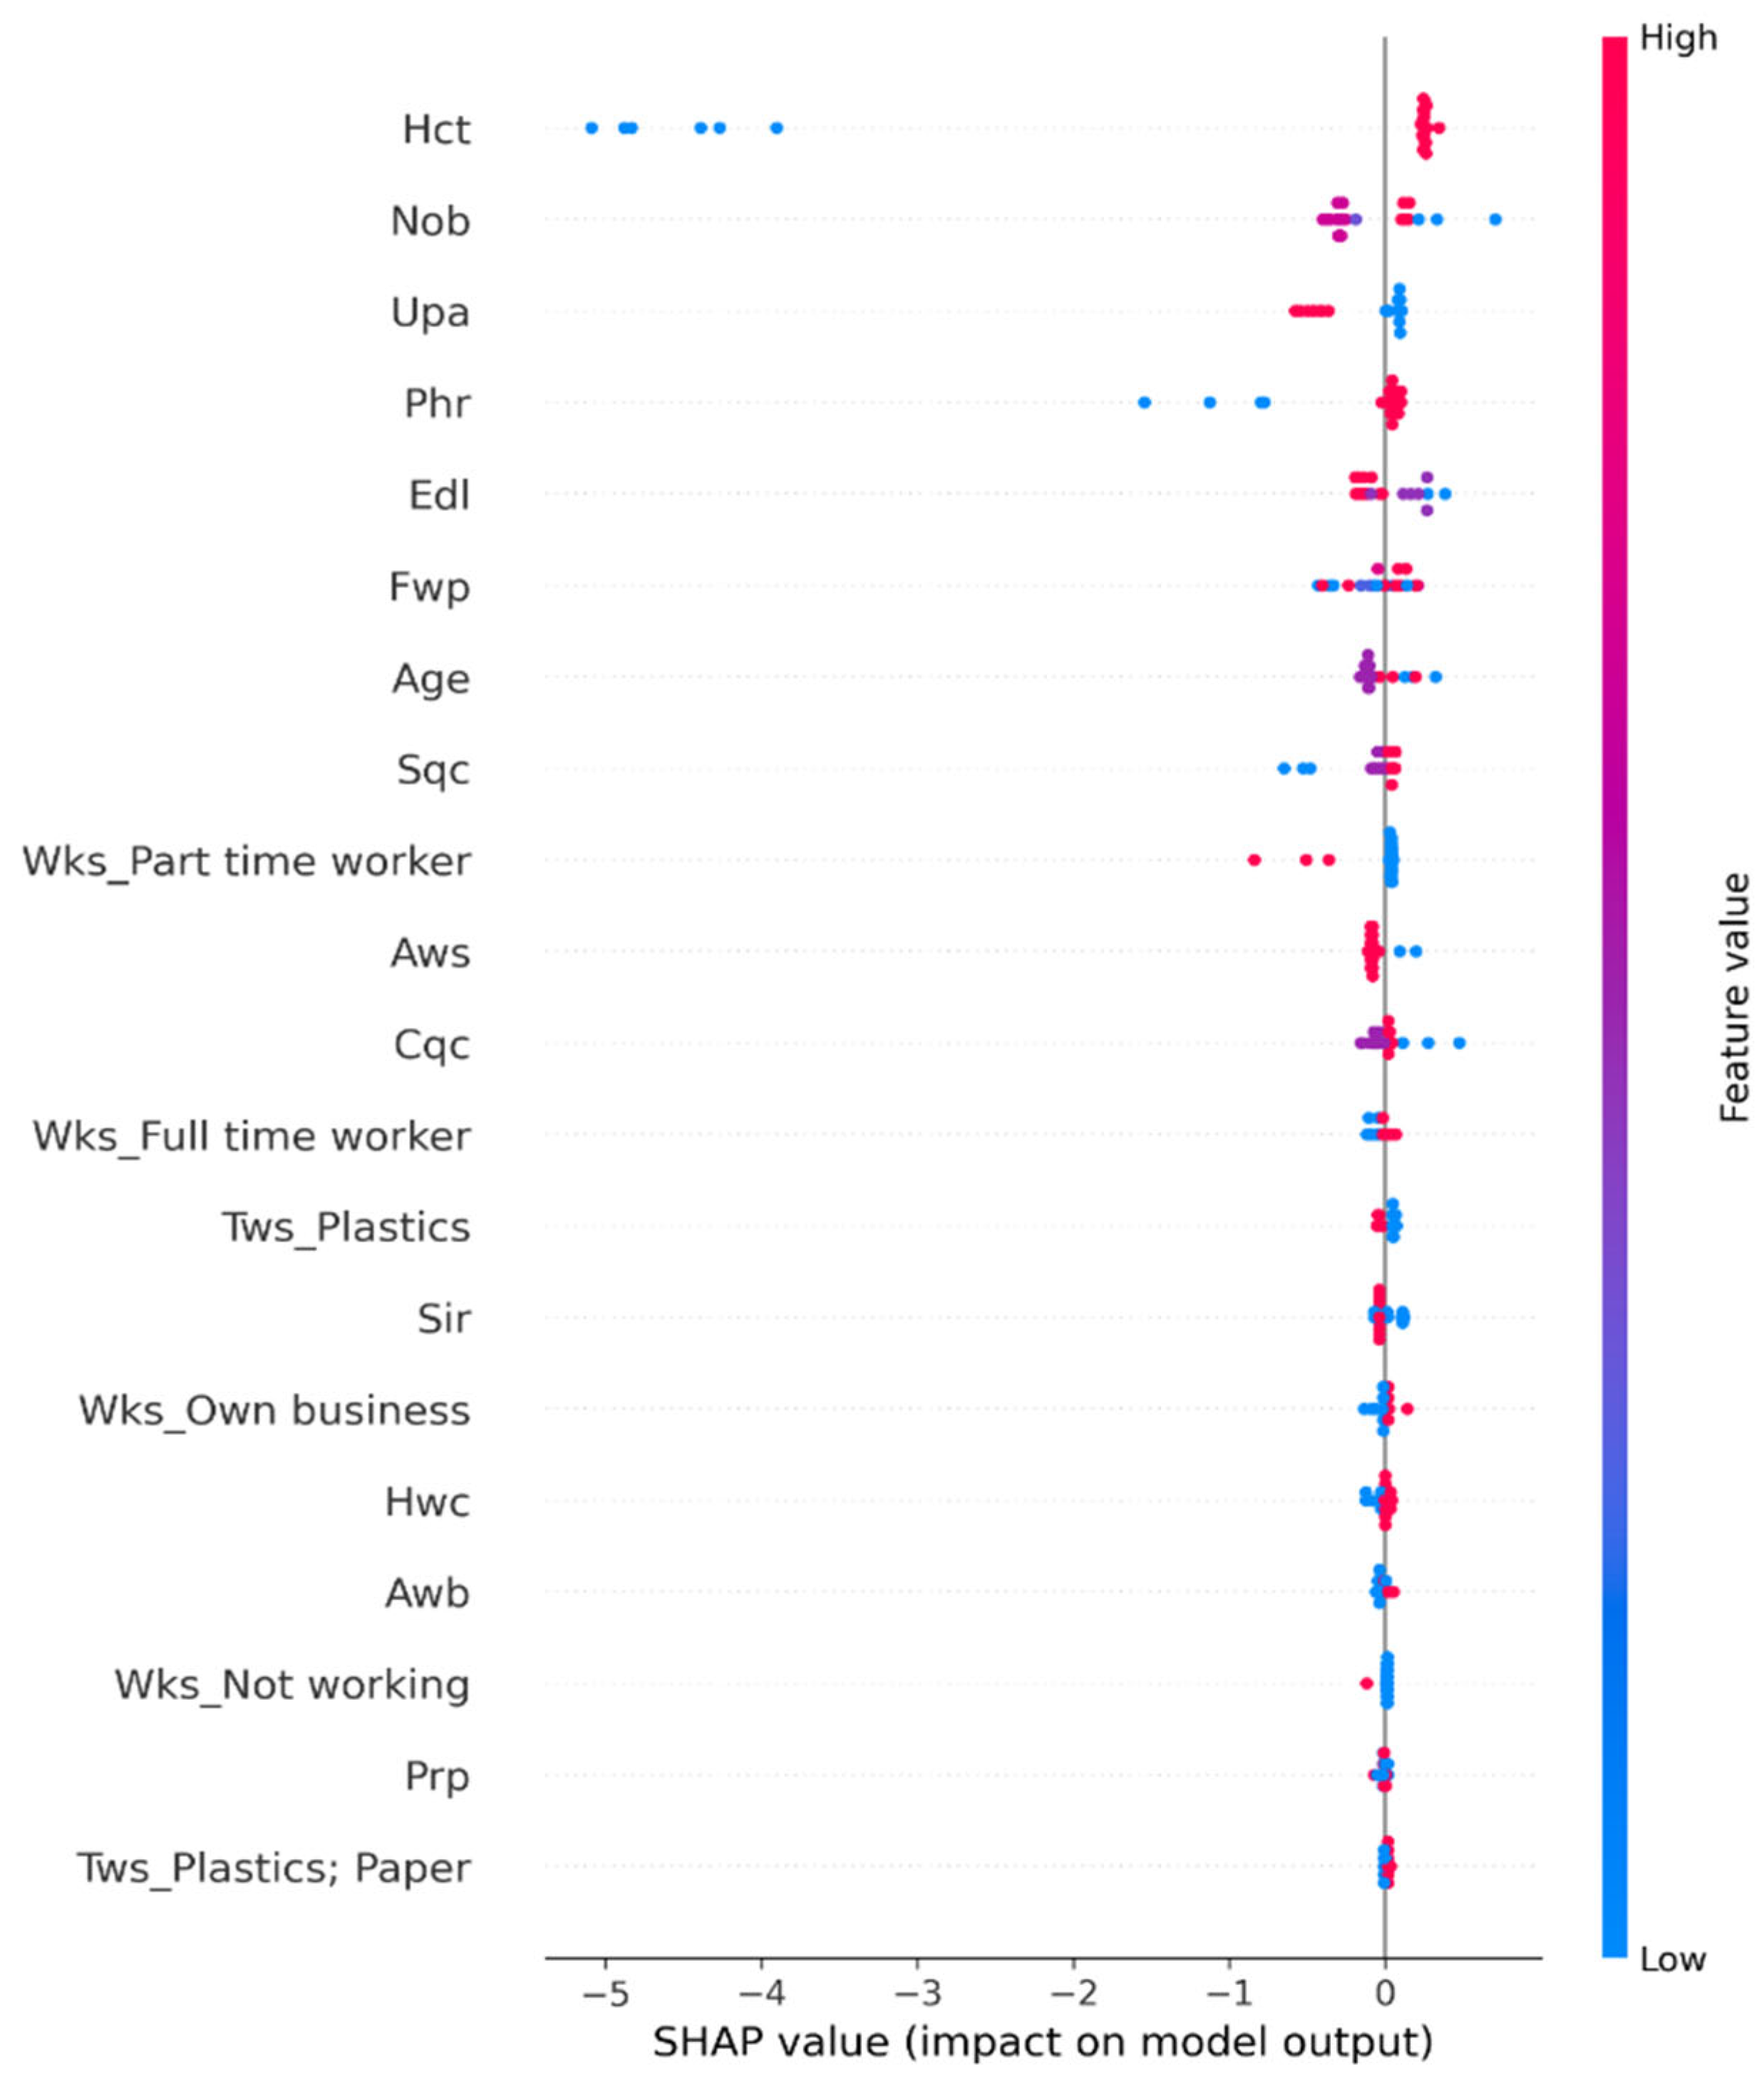
4.2.4. Factors Influencing Household Motivation to Recycle
4.3. Sensitivity Analysis and Cross-Validation
4.3.1. Feature Subset Sensitivity Analysis
4.3.2. Sample Size Sensitivity Analysis
4.3.3. Cross-Validation
5. Methodology
5.1. Design
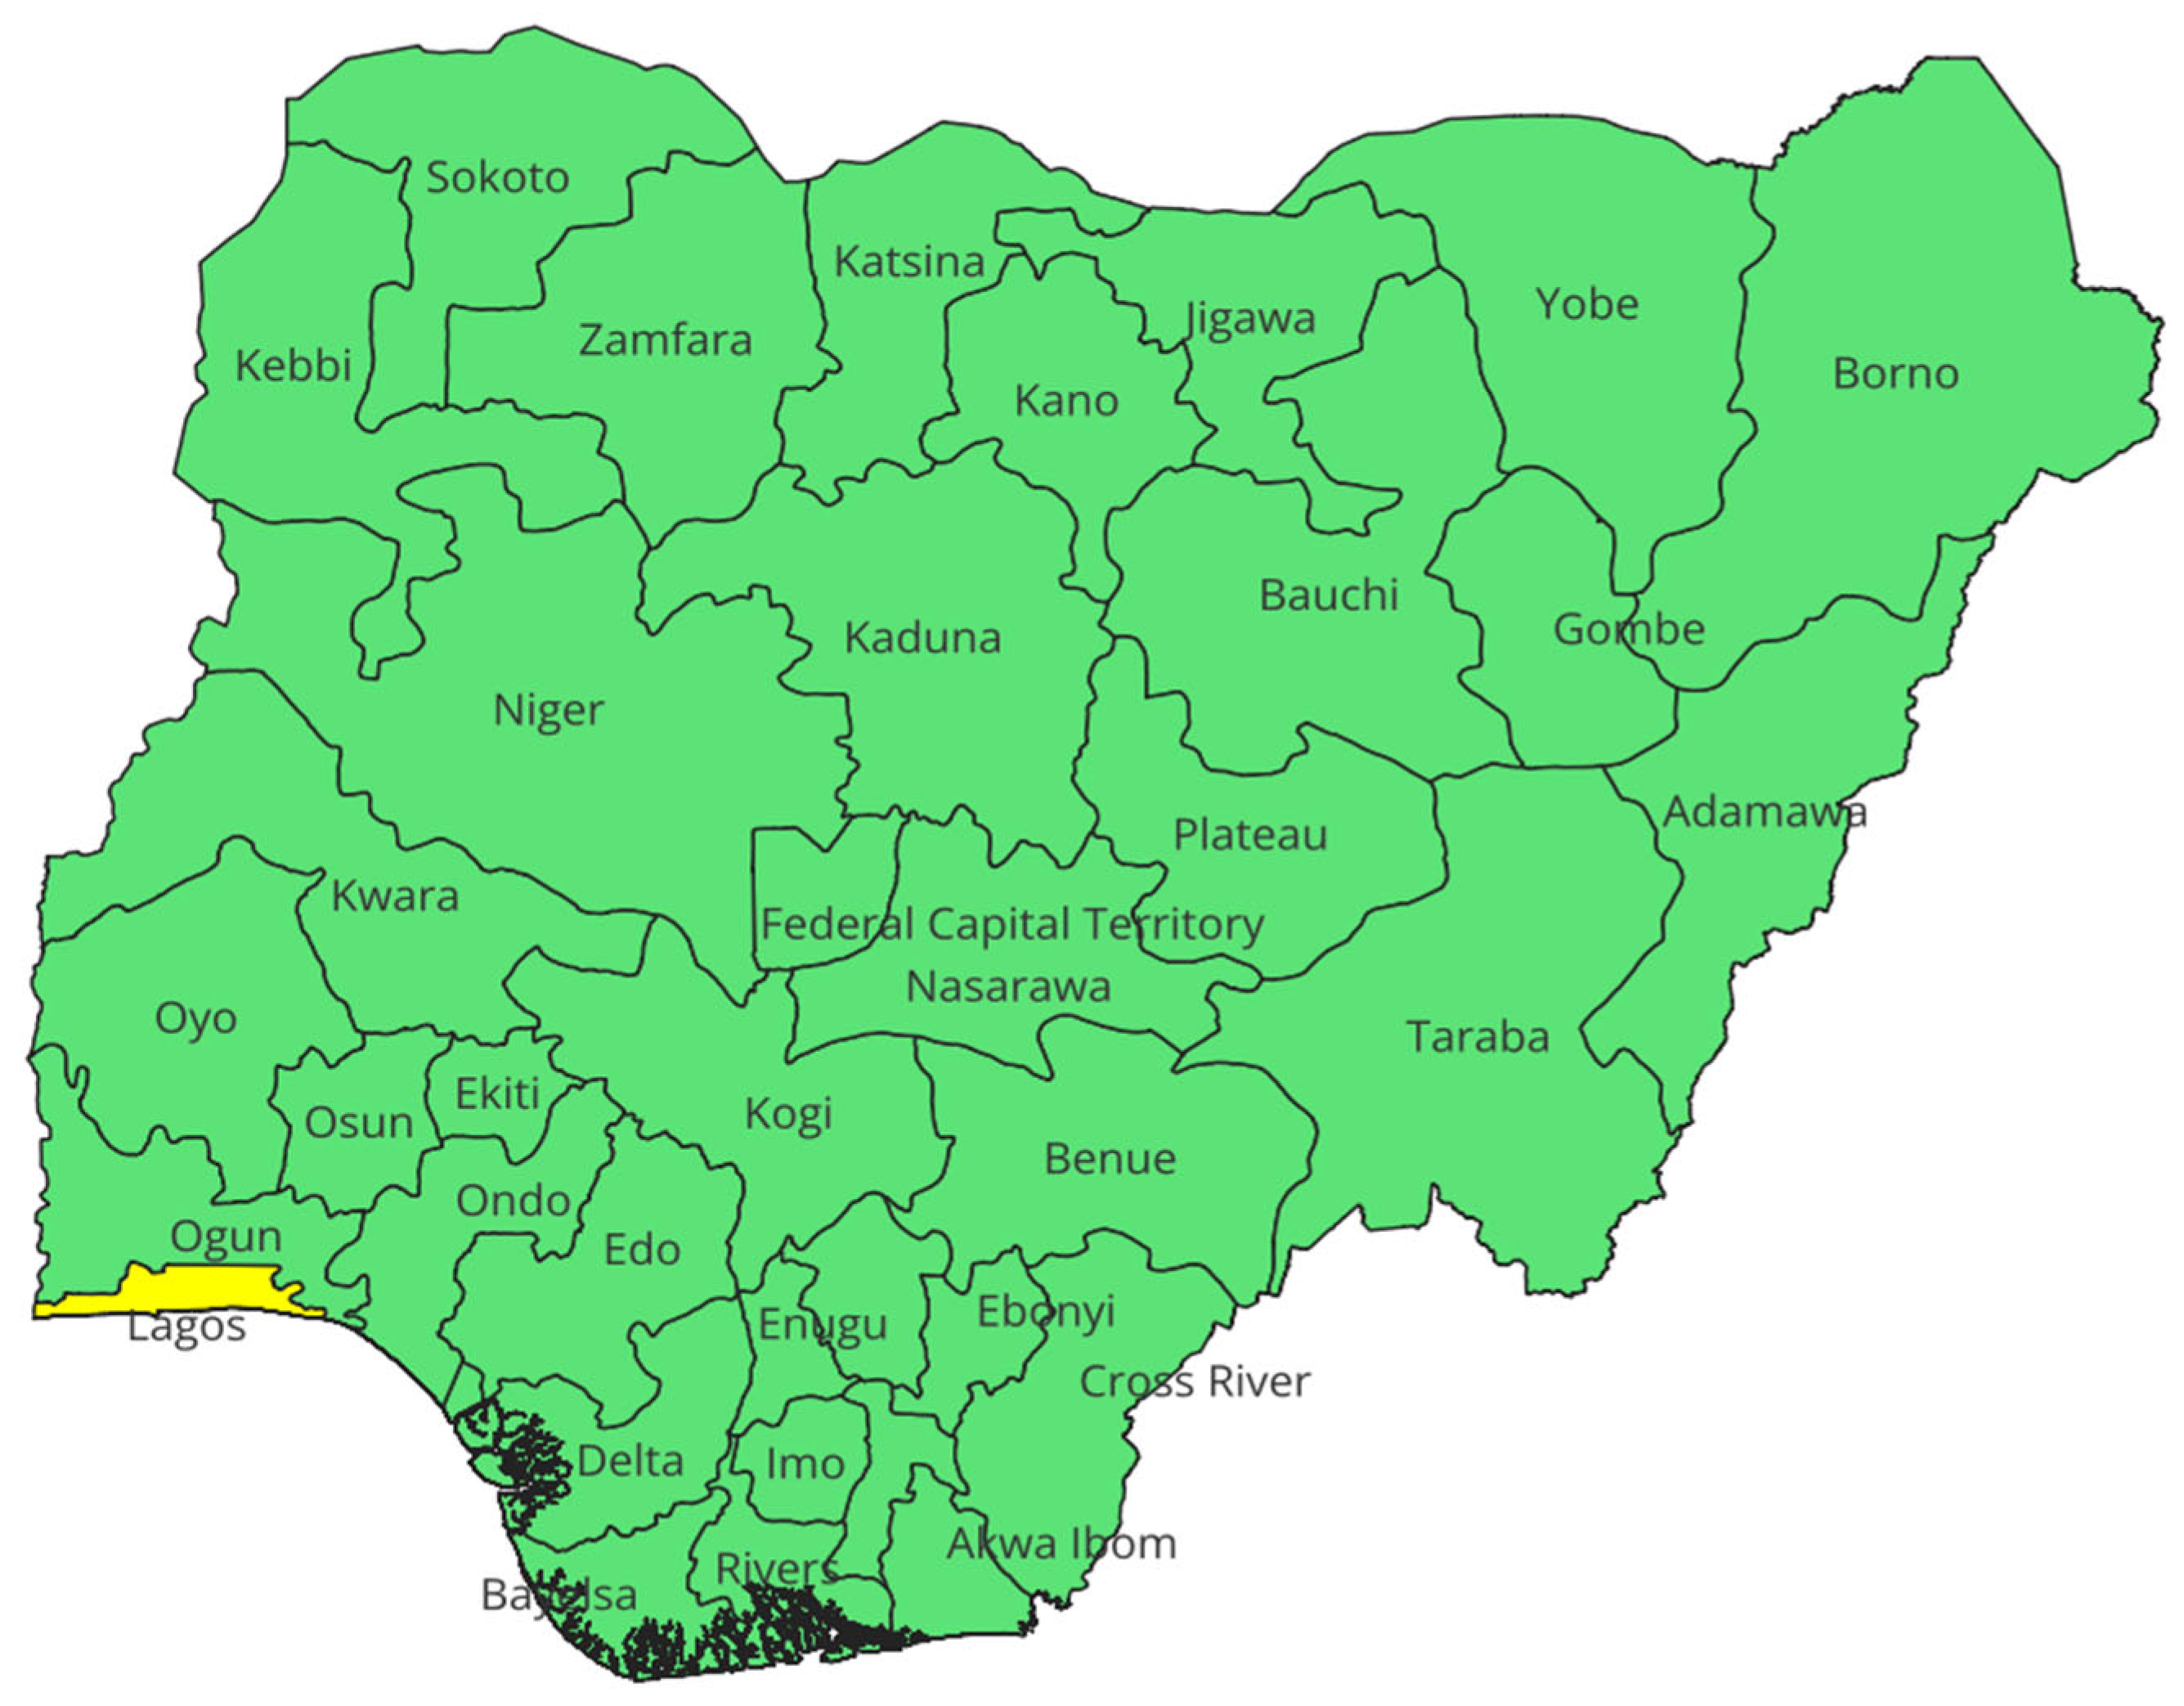
5.2. The Study Area
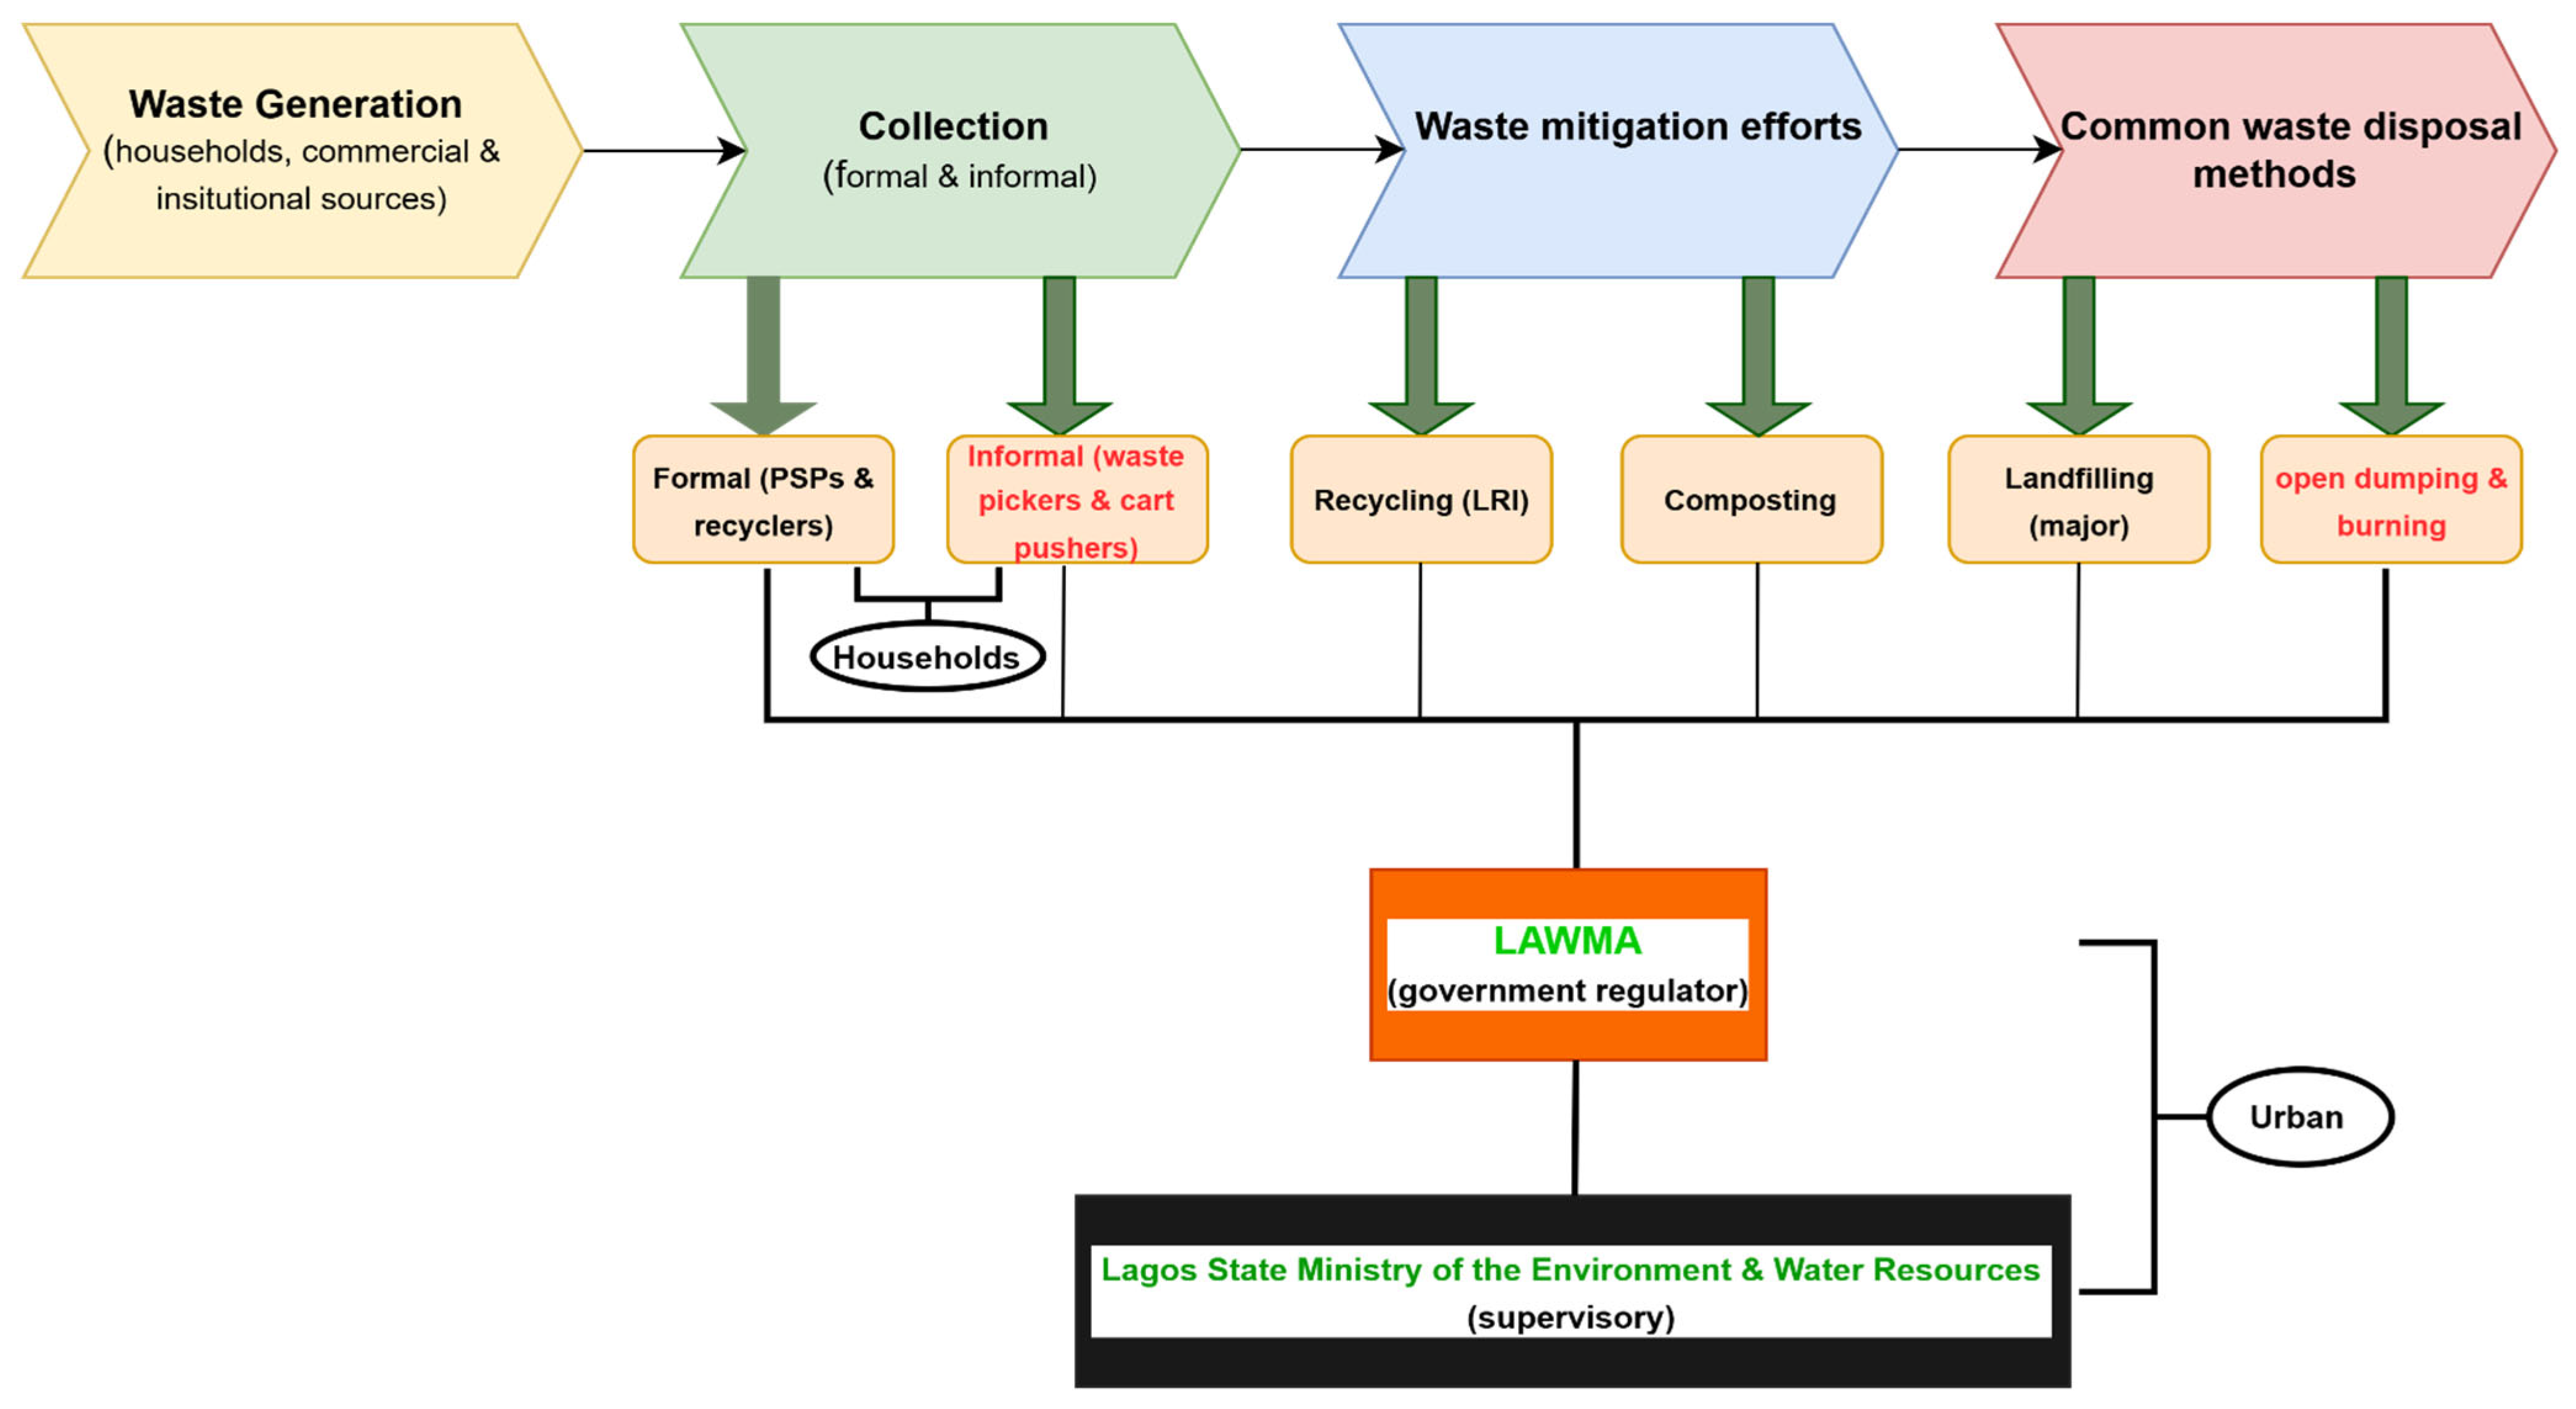
Institutional Framework for Waste Management in Lagos
5.3. Data Collection and Analysis
5.3.1. Exploratory Data Analysis
5.3.2. Machine Learning Modelling
5.3.3. Evaluation Metrics
- Accuracy
- 2.
- Weighted Recall
- 3.
- Weighted Precision
- 4.
- Weighted F1 Score
5.3.4. Interpretability Using SHAP
5.3.5. Data Validation and Cross-Validation Approach
5.3.6. Addressing Sampling Biases
6. Conclusions and Recommendations
6.1. Conclusions
6.2. Recommendations
Supplementary Materials
Author Contributions
Funding
Data Availability Statement
Acknowledgments
Conflicts of Interest
References
- United Nations Statistics Division UN Data. Glossary. Available online: https://data.un.org/Glossary.aspx?q=waste+datamart%5bEnvironmentG%5d (accessed on 23 March 2025).
- Ayeleru, O.O.; Fewster-Young, N.; Gbashi, S.; Akintola, A.T.; Ramatsa, I.M.; Olubambi, P.A. A Statistical Analysis of Recycling Attitudes and Behaviours Towards Municipal Solid Waste Management: A Case Study of the University of Johannesburg, South Africa. Clean. Waste Syst. 2023, 4, 100077. [Google Scholar] [CrossRef]
- UNEP Global Waste Management Outlook 2024. UNEP—UN Environment Programme. Available online: https://www.unep.org/resources/global-waste-management-outlook-2024 (accessed on 19 August 2024).
- Ayeleru, O.O.; Dlova, S.; Akinribide, O.J.; Ntuli, F.; Kupolati, W.K.; Marina, P.F.; Blencowe, A.; Olubambi, P.A. Challenges of Plastic Waste Generation and Management in Sub-Saharan Africa: A Review. Waste Manag. 2020, 110, 24–42. [Google Scholar] [CrossRef] [PubMed]
- Gutierrez, M.A.; Moreno, R.A.; Rebelo, M.S. Chapter 3—Information and Communication Technologies and Global Health Challenges. In Global Health Informatics; de Fátima Marin, H., Massad, E., Gutierrez, M.A., Rodrigues, R.J., Sigulem, D., Eds.; Academic Press: Cambridge, MA, USA, 2017; pp. 50–93. ISBN 978-0-12-804591-6. [Google Scholar]
- Adedara, M.L.; Taiwo, R.; Bork, H.-R. Municipal Solid Waste Collection and Coverage Rates in Sub-Saharan African Countries: A Comprehensive Systematic Review and Meta-Analysis. Waste 2023, 1, 389–413. [Google Scholar] [CrossRef]
- Agbefe, L.E.; Lawson, E.T.; Yirenya-Tawiah, D. Awareness on Waste Segregation at Source and Willingness to Pay for Collection Service in Selected Markets in Ga West Municipality, Accra, Ghana. J. Mater. Cycles Waste Manag. 2019, 21, 905–914. [Google Scholar] [CrossRef]
- Couth, R.; Trois, C. Waste Management Activities and Carbon Emissions in Africa. Waste Manag. 2011, 31, 131–137. [Google Scholar] [CrossRef]
- Vaccari, M.; Vinti, G.; Tudor, T. An Analysis of the Risk Posed by Leachate from Dumpsites in Developing Countries. Environments 2018, 5, 99. [Google Scholar] [CrossRef]
- Wielenga, K. Separate Waste Collection in the Context of a Circular Economy in Europe; Report; FFact: Delft, The Netherlands, 2016; Available online: https://www.yumpu.com/xx/document/view/55565080/separate-waste-collection-in-the-context-of-a-circular-economy-in-europe# (accessed on 13 May 2025).
- Suberu, M.Y.; Mokhtar, A.S.; Bashir, N. Renewable Power Generation Opportunity from Municipal Solid Waste: A Case Study of Lagos Metropolis (Nigeria). J. Energy Technol. Policy 2012, 2. Available online: https://www.iiste.org/Journals/index.php/JETP/article/view/1554 (accessed on 23 March 2025).
- World Bank. World Bank Open Data. Available online: https://data.worldbank.org (accessed on 18 May 2024).
- United Nations Department of Economic and Social Affairs. World Population Projected to Reach 9.8 Billion in 2050, and 11.2 Billion in 2100. Available online: https://www.un.org/en/desa/world-population-projected-reach-98-billion-2050-and-112-billion-2100 (accessed on 18 May 2024).
- Adeniran, A.E.; Nubi, A.T.; Adelopo, A.O. Solid Waste Generation and Characterization in the University of Lagos for a Sustainable Waste Management. Waste Manag. 2017, 67, 3–10. [Google Scholar] [CrossRef]
- Aboyeji, O.S.; Eigbokhan, S.F. Evaluations of Groundwater Contamination by Leachates around Olusosun Open Dumpsite in Lagos Metropolis, Southwest Nigeria. J. Environ. Manag. 2016, 183, 333–341. [Google Scholar] [CrossRef]
- Ajibade, F.O.; Adelodun, B.; Ajibade, T.F.; Lasisi, K.H.; Abiola, C.; Adewumi, J.R.; Akinbile, C.O. The Threatening Effects of Open Dumping on Soil at Waste Disposal Sites of Akure City, Nigeria. Int. J. Environ. Waste Manag. 2021, 27, 127–146. [Google Scholar] [CrossRef]
- Akpeimeh, G.F.; Fletcher, L.A.; Evans, B.E. Exposure to Bioaerosols at Open Dumpsites: A Case Study of Bioaerosols Exposure from Activities at Olusosun Open Dumpsite, Lagos Nigeria. Waste Manag. 2019, 89, 37–47. [Google Scholar] [CrossRef]
- Lagos State Resilience Office. Lagos Resilience Strategy. Available online: https://www.thegpsc.org/knowledge-products/cities-biodiversity/lagos-resilience-strategy (accessed on 21 August 2024).
- World Bank. Lagos Diagnostic Study and Pathway for Transformation. Available online: https://documents1.worldbank.org/curated/en/099062123034023646/pdf/P1750310c8d0390000afa70e5c583aa3b87.pdf (accessed on 21 September 2024).
- Kadiri, F.; Still on the LAWMA Blue Box Initiative. Business Day 17 October 2019. Available online: https://businessday.ng/opinion/article/still-on-the-lawma-blue-box-initiative (accessed on 21 August 2024).
- Oghifo, B. LAWMA Seeks Collaboration to Recycle Plastics—THISDAYLIVE. Available online: https://www.thisdaylive.com/index.php/2021/02/16/lawma-seeks-collaboration-to-recycle-plastics/ (accessed on 4 July 2024).
- Vanguard Media Limited. Lagos Generates 14,000 Metric Tonnes Waste Daily—Commissioner. Vanguard News. Available online: https://www.vanguardngr.com/2021/04/lagos-generates-14000-metric-tonnes-waste-daily-commissioner/ (accessed on 21 August 2024).
- Yu, K.H.; Zhang, Y.; Li, D.; Montenegro-Marin, C.E.; Kumar, P.M. Environmental Planning Based on Reduce, Reuse, Recycle and Recover Using Artificial Intelligence. Environ. Impact Assess. Rev. 2021, 86, 106492. [Google Scholar] [CrossRef]
- Barnes, K.; Blaauw, D.; Schenck, R.; Pretorius, A. Buyback Centres in Cape Town: The Key Integration Point between Formal and Informal Sectors in the Waste Economy of the Western Cape. GeoJournal 2022, 87, 2051–2065. [Google Scholar] [CrossRef]
- Pan, C.; Bolingbroke, D.; Ng, K.T.W.; Richter, A.; Vu, H.L. The Use of Waste Diversion Indices on the Analysis of Canadian Waste Management Models. J. Mater. Cycles Waste Manag. 2018, 21, 478–487. [Google Scholar] [CrossRef]
- Ratnasabapathy, S.; Alashwal, A.; Perera, S. Investigation of Waste Diversion Rates in the Construction and Demolition Sector in Australia. Built Environ. Proj. Asset Manag. 2020, 11, 427–439. [Google Scholar] [CrossRef]
- Cheng, X.; Zhang, L.; Li, W.; Long, R. Intentions and Actions in Household Waste Separation: A Machine Learning Approach on the Gap and Determinants. Environ. Impact Assess. Rev. 2024, 107, 107566. [Google Scholar] [CrossRef]
- Trash Butler. What Is Waste Diversion And How Can You Improve It? Available online: https://www.trashbutler.com/waste-diversion/ (accessed on 23 March 2025).
- Kjeldsen, P.; Barlaz, M.A.; Rooker, A.P.; Baun, A.; Ledin, A.; Christensen, T.H. Present and Long-Term Composition of MSW Landfill Leachate: A Review. Crit. Rev. Environ. Sci. Technol. 2002, 32, 297–336. [Google Scholar] [CrossRef]
- Psomopoulos, C.S.; Bourka, A.; Themelis, N.J. Waste-to-Energy: A Review of the Status and Benefits in USA. Waste Manag. 2009, 29, 1718–1724. [Google Scholar] [CrossRef]
- Pariatamby, A.; Law, H.J. Do We Need Landfills? Waste Manag. Res.. 2020, 38, 1075–1077. [Google Scholar] [CrossRef]
- Oke, A.; McDonald, S.; Korobilis-Magas, E.; Osobajo, O.A.; Awuzie, B.O. Reframing Recycling Behaviour Through Consumers’ Perceptions: An Exploratory Investigation. Sustainability 2021, 13, 13849. [Google Scholar] [CrossRef]
- Ayeleru, O.O.; Okonta, F.N.; Ntuli, F. Cost Benefit Analysis of a Municipal Solid Waste Recycling Facility in Soweto, South Africa. Waste Manag. 2021, 134, 263–269. [Google Scholar] [CrossRef]
- Owojori, O.; Edokpayi, J.N.; Mulaudzi, R.; Odiyo, J.O. Characterisation, Recovery and Recycling Potential of Solid Waste in a University of a Developing Economy. Sustainability 2020, 12, 5111. [Google Scholar] [CrossRef]
- Nzeadibe, C.; Eziuzor, O.J. Waste Scavenging and Recycling in Onitsha Urban Area, Nigeria. CIWM Sci. Tech. Rev. 2006, 7, 26–31. [Google Scholar]
- Ketlogetswe, C.; Mothudi, T.H. Botswana’s Environmental Policy on Recycling. Resour. Conserv. Recycl. 2005, 44, 333–342. [Google Scholar] [CrossRef]
- Ayeleru, O.O.; Okonta, F.N.; Ntuli, F. Municipal Solid Waste Generation and Characterization in the City of Johannesburg: A Pathway for the Implementation of Zero Waste. Waste Manag. 2018, 79, 87–97. [Google Scholar] [CrossRef]
- Dlamini, B.R.; Rampedi, I.T.; Ifegbesan, A.P. Community Resident’s Opinions and Perceptions on the Effectiveness of Waste Management and Recycling Potential in the Umkhanyakude and Zululand District Municipalities in the KwaZulu-Natal Province of South Africa. Sustainability 2017, 9, 1835. [Google Scholar] [CrossRef]
- Oyekale, A. Determinants of Households’ Involvement in Waste Separation and Collection for Recycling in South Africa. Environ. Dev. Sustain. 2018, 20, 2343–2371. [Google Scholar] [CrossRef]
- Kang, Y.O.; Yabar, H.; Mizunoya, T.; Higano, Y. Environmental and Economic Performances of Municipal Solid Waste Management Strategies Based on LCA Method: A Case Study of Kinshasa. Heliyon 2023, 9, e14372. [Google Scholar] [CrossRef]
- Kinobe, J.R.; Gebresenbet, G.; Niwagaba, C.B.; Vinnerås, B. Reverse Logistics System and Recycling Potential at a Landfill: A Case Study from Kampala City. Waste Manag. 2015, 42, 82–92. [Google Scholar] [CrossRef]
- Wilson, D.C.; Paul, J.; Ramola, A.; Filho, C.S. Unlocking the Significant Worldwide Potential of Better Waste and Resource Management for Climate Mitigation: With Particular Focus on the Global South. Waste Manag. Res. 2024, 42, 860–872. [Google Scholar] [CrossRef]
- Louzizi, T.; Chakir, E.; Sadoune, Z. A Comprehensive Review on Solid Waste Management in Morocco: Assessment, Challenges and Potential Transition to a Circular Economy. Euro-Mediterr. J. Environ. Integr. 2024. [Google Scholar] [CrossRef]
- Gardoni, P.; Murphy, C. Society-Based Design: Promoting Societal Well-Being by Designing Sustainable and Resilient Infrastructure. Sustain. Resilient Infrastruct. 2020, 5, 4–19. [Google Scholar] [CrossRef]
- Hotta, Y.; Visvanathan, C.; Kojima, M. Recycling Rate and Target Setting: Challenges for Standardized Measurement. J. Mater. Cycles Waste Manag. 2016, 18, 14–21. [Google Scholar] [CrossRef]
- Smith, S.R.; Jasim, S. Small-Scale Home Composting of Biodegradable Household Waste: Overview of Key Results from a 3-Year Research Programme in West London. Waste Manag. Res. J. A Sustain. Circ. Econ. 2009, 27, 941–950. [Google Scholar] [CrossRef]
- Plastic Action Centre. What Is a Diversion Rate? Available online: https://plasticactioncentre.ca/directory/what-is-a-diversion-rate/ (accessed on 15 June 2024).
- Clarke, M.J.; Maantay, J.A. Optimizing Recycling in All of New York City’s Neighborhoods: Using GIS to Develop the REAP Index for Improved Recycling Education, Awareness, and Participation. Resour. Conserv. Recycl. 2006, 46, 128–148. [Google Scholar] [CrossRef]
- Ali, G.; Saqib, Z.; Ziad, M.; Ali, J. Identification and Quantification of Major Components of Waste Diversion and Their Recovery Rates in Current Waste Management System in Peshawar, Pakistan. Arab. J. Geosci. 2022, 16, 34. [Google Scholar] [CrossRef]
- Wahabu, A.; Oduro-Kwarteng, S.; Monney, I.; Wahab, A. Characteristics of Diverted Solid Waste in Kumasi: A Ghanaian City. Am. J. Environ. Prot. 2014, 3, 225–231. [Google Scholar] [CrossRef]
- Olukanni, D.; Aipoh, A.; Kalabo, I. Recycling and Reuse Technology: Waste to Wealth Initiative in a Private Tertiary Institution, Nigeria. Recycling 2018, 3, 44. [Google Scholar] [CrossRef]
- Ayeleru, O.O.; Ntuli, F.; Mbohwa, C. Municipal Solid Waste Composition Determination in the City of Johannesburg. In Proceedings of the World Congress on Engineering and Computer Science 2016, San Francisco, CA, USA, 9–21 October 2016. [Google Scholar]
- Fehr, M.; Melo Vasques de Castro, M.S.; Calçado, M. dos R. Condominium Waste Management by Private Initiative: A Report of a 10-Year Project in Brazil. Waste Manag. Res. 2009, 28, 309–314. [Google Scholar] [CrossRef]
- Yadav, V.K.; Yadav, K.K.; Tirth, V.; Gnanamoorthy, G.; Gupta, N.; Algahtani, A.; Islam, S.; Choudhary, N.; Modi, S.; Jeon, B.-H. Extraction of Value-Added Minerals from Various Agricultural, Industrial and Domestic Wastes. Materials 2021, 14, 6333. [Google Scholar] [CrossRef]
- Kontokosta, C.E.; Hong, B.; Johnson, N.E.; Starobin, D. Using Machine Learning and Small Area Estimation to Predict Building-Level Municipal Solid Waste Generation in Cities. Comput. Environ. Urban Syst. 2018, 70, 151–162. [Google Scholar] [CrossRef]
- Chen, X. Machine Learning Approach for a Circular Economy with Waste Recycling in Smart Cities. Energy Rep. 2022, 8, 3127–3140. [Google Scholar] [CrossRef]
- Erkinay Ozdemir, M.; Ali, Z.; Subeshan, B.; Asmatulu, E. Applying Machine Learning Approach in Recycling. J. Mater. Cycles Waste Manag. 2021, 23, 855–871. [Google Scholar] [CrossRef]
- Vanguard Media Limited. Cleaner Lagos Initiative Takes off next Month—AMBODE. Vanguard News, 2017 August 2. Available online: https://www.vanguardngr.com/2017/08/cleaner-lagos-initiative-takes-off-next-month-ambode/ (accessed on 21 August 2024).
- Xu, L.; Yang, H.; Ling, M. Factors Moderating the Effect of Financial Incentives on Household Recycling: A Motivation Crowding Perspective. Environ. Impact Assess. Rev. 2023, 100, 107078. [Google Scholar] [CrossRef]
- LAWMA. LAWMA Launches Lagos Recycle Initiative. Available online: https://www.facebook.com/100064628231975/posts/3791920920826223/ (accessed on 13 April 2024).
- Sweep Foundation. Training + Education + Advocacy. Available online: https://sweepfoundation.org.ng/ (accessed on 10 December 2024).
- LAWMA. LAWMA Recycling. Available online: https://www.instagram.com/tv/CNlw9Tonqr5/ (accessed on 13 July 2024).
- Lagos Bureau of Statistics. Abstract of Local Government Statistics Report. Available online: https://lagosmepb.org/bureau-item/abstract-of-local-government-statistics-report/ (accessed on 11 September 2024).
- Aryal, G.R. Methods of Population Estimation and Projection. J. Popul. Dev. 2020, 1, 54–61. [Google Scholar] [CrossRef]
- Nabaa, S.H. Estimation Of Municipal Solid Waste Generation Rate (Case Study Of Hilla City). J. Kerbala Univ. 2014, 12, 72–80. [Google Scholar]
- New South Wales Environmental Protection Authority EPA. Calculation-Method-for-Waste-Generation-Recycling-and-Diversion. Available online: https://www.epa.nsw.gov.au/Publications/wastestrategy/19p1655-calculation-method-for-waste-generation-recycling-and-diversion (accessed on 12 June 2024).
- Kaza, S.; Yao, L.C.; Bhada-Tata, P.; van Woerden, F. What a Waste 2.0: A Global Snapshot of Solid Waste Management to 2050; Urban Development Series; License: Creative Commons Attribution CC BY 3.0 IGO; World Bank: Washington, DC, USA, 2018. [Google Scholar] [CrossRef]
- Spielberg, B. NYC Needs Common Sense Waste Management Now. Available online: https://nylcv.org/news/nyc-needs-common-sense-waste-management-now/ (accessed on 25 September 2024).
- Ben Seghier, M.E.A.; Plevris, V.; Solorzano, G. Random Forest-Based Algorithms for Accurate Evaluation of Ultimate Bending Capacity of Steel Tubes. Structures 2022, 44, 261–273. [Google Scholar] [CrossRef]
- Chou, J.-S.; Pham, A.-D. Enhanced Artificial Intelligence for Ensemble Approach to Predicting High Performance Concrete Compressive Strength. Constr. Build. Mater. 2013, 49, 554–563. [Google Scholar] [CrossRef]
- Taiwo, R.; Yussif, A.-M.; Ben Seghier, M.E.A.; Zayed, T. Explainable Ensemble Models for Predicting Wall Thickness Loss of Water Pipes. Ain Shams Eng. J. 2024, 15, 102630. [Google Scholar] [CrossRef]
- Schober, P.; Boer, C.; Schwarte, L.A. Correlation Coefficients: Appropriate Use and Interpretation. Anesth. Analg. 2018, 126, 1763–1768. [Google Scholar] [CrossRef]
- Taiwo, R.; Zayed, T.; Ben Seghier, M.E.A. Integrated Intelligent Models for Predicting Water Pipe Failure Probability. Alex. Eng. J. 2024, 86, 243–257. [Google Scholar] [CrossRef]
- Chen, T.; Guestrin, C. XGBoost: A Scalable Tree Boosting System. In Proceedings of the 22nd ACM SIGKDD International Conference on Knowledge Discovery and Data Mining, San Francisco, CA, USA, 13–17 August 2016; pp. 785–794. [Google Scholar]
- Prokhorenkova, L.; Gusev, G.; Vorobev, A.; Dorogush, A.V.; Gulin, A. CatBoost: Unbiased Boosting with Categorical Features. In Advances in Neural Information Processing Systems; Curran Associates, Inc.: New York, NY, USA, 2018; Volume 31. [Google Scholar]
- Islam, M.M.; Das, P.; Rahman, M.M.; Naz, F.; Kashem, A.; Nishat, M.H.; Tabassum, N. Prediction of Compressive Strength of High-Performance Concrete Using Optimization Machine Learning Approaches with SHAP Analysis. J. Build. Pathol. Rehabil. 2024, 9, 94. [Google Scholar] [CrossRef]
- Aazam, M.; St-Hilaire, M.; Lung, C.-H.; Lambadaris, I. Cloud-Based Smart Waste Management for Smart Cities. In Proceedings of the 2016 IEEE 21st International Workshop on Computer Aided Modelling and Design of Communication Links and Networks (CAMAD), Toronto, ON, Canada, 23–25 October 2016; pp. 188–193. [Google Scholar] [CrossRef]
- Barbariol, F.; Baid, H. Introduction to an Intensive Care Recycling Program. Intensive Care Med. 2023, 49, 327–329. [Google Scholar] [CrossRef]
- Zhang, Y.; Wang, G.; Zhang, Q.; Ji, Y.; Xu, H. What Determines Urban Household Intention and Behavior of Solid Waste Separation? A Case Study in China. Environ. Impact Assess. Rev. 2022, 93, 106728. [Google Scholar] [CrossRef]
- Omotayo, A.O.; Omotoso, A.B.; Daud, A.S.; Ogunniyi, A.I.; Olagunju, K.O. What Drives Households’ Payment for Waste Disposal and Recycling Behaviours? Empirical Evidence from South Africa’s General Household Survey. Int. J. Environ. Res. Public Health 2020, 17, 7188. [Google Scholar] [CrossRef]
- De Wildt, K.K.; Meijers, M.H.C. Time Spent on Separating Waste Is Never Wasted: Fostering People’s Recycling Behavior through the Use of a Mobile Application. Comput. Hum. Behav. 2023, 139, 107541. [Google Scholar] [CrossRef]
- Abila, B. Households’ Perception of Financial Incentives in Endorsing Sustainable Waste Recycling in Nigeria. Recycling 2018, 3, 28. [Google Scholar] [CrossRef]
- Escario, J.-J.; Rodriguez-Sanchez, C.; Casaló, L.V. The Influence of Environmental Attitudes and Perceived Effectiveness on Recycling, Reducing, and Reusing Packaging Materials in Spain. Waste Manag. 2020, 113, 251–260. [Google Scholar] [CrossRef]
- Wang, H.; Liu, X.; Wang, N.; Zhang, K.; Wang, F.; Zhang, S.; Wang, R.; Zheng, P.; Matsushita, M. Key Factors Influencing Public Awareness of Household Solid Waste Recycling in Urban Areas of China: A Case Study. Resour. Conserv. Recycl. 2020, 158, 104813. [Google Scholar] [CrossRef]
- Mikuła, A.; Raczkowska, M.; Utzig, M. Pro-Environmental Behaviour in the European Union Countries. Energies 2021, 14, 5689. [Google Scholar] [CrossRef]
- Tabernero, C.; Hernández, B.; Cuadrado, E.; Luque, B.; Pereira, C.R. A Multilevel Perspective to Explain Recycling Behaviour in Communities. J. Environ. Manag. 2015, 159, 192–201. [Google Scholar] [CrossRef]
- Kuhn, M.; Johnson, K. Feature Engineering and Selection: A Practical Approach for Predictive Models; Chapman and Hall/CRC: New York, NY, USA, 2019; ISBN 978-1-315-10823-0. [Google Scholar]
- Taiwo, R.; Zayed, T.; Bakhtawar, B.; Adey, B.T. Explainable Deep Learning Models for Predicting Water Pipe Failures. J. Environ. Manag. 2025, 379, 124738. [Google Scholar] [CrossRef]
- Lim, W.M. What Is Quantitative Research? An Overview and Guidelines. Australas. Mark. J. 2024. [Google Scholar] [CrossRef]
- Queirós, A.; Faria, D.; Almeida, F. Strengths And Limitations Of Qualitative And Quantitative Research Methods. Eur. J. Educ. Stud. 2017, 3, 369–387. [Google Scholar] [CrossRef]
- Chetty, P. Limitations and Weakness of Quantitative Research Methods. Available online: https://www.projectguru.in/limitations-quantitative-research/ (accessed on 23 March 2025).
- Lagos State Government. About Lagos. Available online: https://lagosstate.gov.ng/about-lagos/ (accessed on 16 November 2024).
- Ajibade, I.; McBean, G.; Bezner-Kerr, R. Urban Flooding in Lagos, Nigeria: Patterns of Vulnerability and Resilience among Women. Glob. Environ. Change 2013, 23, 1714–1725. [Google Scholar] [CrossRef]
- LSBS. Abstract of Local Government Statistics. Available online: https://mepb.lagosstate.gov.ng/wp-content/uploads/sites/29/2017/01/Abstract-Of-Local-Government-Statistics-2016.Pdf (accessed on 11 September 2024).
- Global Administrative Areas. Download GADM Data (Version 4.1)—Nigeria 2018–2022. Available online: https://gadm.org/download_country.html. (accessed on 8 February 2025).
- Lagos State House of Assembly Bills. Lagos House of Assembly. Available online: https://lagoshouseofassembly.gov.ng/home/bills/ (accessed on 22 March 2025).
- Lagos State Waste Management Authority. LAWMA’s Profile. Available online: https://lawma.gov.ng/about/ (accessed on 22 March 2025).
- Owusu-Sekyere, E. Scavenging for Wealth or Death? Exploring the Health Risk Associated with Waste Scavenging in Kumasi, Ghana. Ghana J. Geogr. 2014, 6, 63–80. [Google Scholar]
- Afon, A. A Survey of Operational Characteristics, Socioeconomic and Health Effects of Scavenging Activity in Lagos, Nigeria. Waste Manag. Res.. 2012, 30, 664–671. [Google Scholar] [CrossRef]
- Vanguard Media. Limited Lagos Bans Cart Pushers, Wheel Barrow Operators from Streets. Available online: https://www.vanguardngr.com/2018/01/lagos-bans-cart-pushers-wheel-barrow-operators-streets/ (accessed on 22 March 2025).
- Ajose, T. Lagos Assembly Urges Action Against Scavengers, Manhole Thefts. Available online: https://newscentral.africa/lagos-assembly-urges-action-against-scavengers-manhole-thefts/ (accessed on 22 March 2025).
- Ogundepo, J. Cart Pushers Return to Lagos Streets Seven Years after Ban. Available online: https://punchng.com/cart-pushers-return-to-lagos-streets-seven-years-after-ban/ (accessed on 22 March 2025).
- Simkus, J. Convenience Sampling (Accidental Sampling): Definition, Method & Examples. Available online: https://www.simplypsychology.org/convenience-sampling.html (accessed on 9 September 2024).
- Momade, M.H.; Shahid, S.; Hainin, M.R.b.; Nashwan, M.S.; Tahir Umar, A. Modelling Labour Productivity Using SVM and RF: A Comparative Study on Classifiers Performance. Int. J. Constr. Manag. 2020, 22, 1924–1934. [Google Scholar] [CrossRef]
- Książek, W.; Gandor, M.; Pławiak, P. Comparison of Various Approaches to Combine Logistic Regression with Genetic Algorithms in Survival Prediction of Hepatocellular Carcinoma. Comput. Biol. Med. 2021, 134, 104431. [Google Scholar] [CrossRef]
- Breiman, L. Random Forests. Mach. Learn. 2001, 45, 5–32. [Google Scholar] [CrossRef]
- Snoek, J.; Larochelle, H.; Adams, R.P. Practical Bayesian Optimization of Machine Learning Algorithms. In Proceedings of the 26th International Conference on Neural Information Processing Systems, Lake Tahoe, NV, USA, 3–6 December 2012; Curran Associates, Inc.: Red Hook, NY, USA, 2012; Volume 2, pp. 2951–2959. Available online: https://proceedings.neurips.cc/paper_files/paper/2012/file/05311655a15b75fab86956663e1819cd-Paper.pdf (accessed on 23 March 2025).
- Zhang, L.; Pan, Y. Information Fusion for Automated Post-Disaster Building Damage Evaluation Using Deep Neural Network. Sustain. Cities Soc. 2022, 77, 103574. [Google Scholar] [CrossRef]


| Respondent’s ID | Weekly Tonnage (Metric Tonnes) | Estimated Annual Tonnage (Metric Tonnes) |
|---|---|---|
| Collector 1 | 0.24 | 12.48 |
| Collector 2 | 62.5 | 3250 |
| Collector 3 | 2.5 | 130 |
| Collector 4 | 1.5 | 78 |
| Collector 5 | 0.5 | 26 |
| Collector 6 | 2 | 104 |
| Collector 7 | 0.5 | 26 |
| Variables | Codes | Description | Type | Unique Values |
|---|---|---|---|---|
| Age | Age | Age of the respondent | Ordinal | 18–29 (1) |
| 30–49 (2) | ||||
| 50–64 (3) | ||||
| 65 and above (4) | ||||
| Working status | Wks | Employment status of respondent | Categorical | Full-time worker Part-time worker Not working Own business Job applicant |
| Educational level | Edl | Highest educational level of respondent | Ordinal | Pry. Schl. cert. (1) Sec. Schl. cert. (2) Tertiary inst. (3) |
| LRI awareness | Aws | Awareness of respondent about LRI | Binary | Yes (1) No (2) |
| Type of waste sorted | Tws | Types of HSR sorted by respondent | Categorical | Plastics Paper UBCs Glass |
| Frequency of HSR pick up | Fwp | Frequency of HSR collection | Ordinal | Once in 3 weeks (1) Once in two weeks (2) |
| Once a month (3) | ||||
| Once a week (4) | ||||
| Twice a week (5) | ||||
| No overflow of HSR bin | Nob | Respondent’s agreement with statement that HSR bin does not overflow | Ordinal | Strongly agree (5) Agree (4) Neutral (3) Disagree (2) Strongly disagree (1) |
| Regularity of HSR collection | Rwc | Whether HSR collection is regular | Binary | Yes (1) No (2) |
| Adequacy of HSR bin received | Awb | Whether HSR bin received by respondent is adequate | Binary | Yes (1) No (2) |
| Service quality during HSR collection | Sqc | Rating of service quality during HSR collection | Ordinal | Excellent (3) Fair (2) Poor (1) |
| Communication quality during HSR collection | Cqc | Rating of communication quality during HSR collection | Ordinal | Excellent (3) Fair (2) Poor (1) |
| Usage of Pakam app | Upa | Whether respondents use Pakam app during HSR collection | Binary | Yes (1) No (2) |
| HSR weighing at collection point | Hwc | Whether collectors weigh HSR at collection point | Binary | Yes (1) No (2) |
| Perception of household about recycling | Phr | Whether household perceives recycling as beneficial | Binary | Yes (1) No (2) |
| Perception of recycling productivity | Prp | Whether household perceives recycling as productive/time wasting | Binary | Yes (1) No (2) |
| Societal influence on recycling | Sir | Whether societal views on importance of recycling influence respondent’s recycling behaviour | Binary | Yes (1) No (2) |
| HSR collection time | Hct | Whether the time of HSR collection is regular | Binary | Yes (1) No (2) |
| Motivation to recycle | Mtc | To assess if respondents are motivated to recycle or not | Binary | Yes (1) No (2) |
| Models | Accuracy | Weighted Precision | Weighted Recall | Weighted F1 Score |
|---|---|---|---|---|
| LR | 0.67 | 0.70 | 0.67 | 0.68 |
| RF | 0.50 | 0.62 | 0.50 | 0.53 |
| XGBoost | 0.51 | 0.63 | 0.50 | 0.53 |
| CatBoost | 0.75 | 0.75 | 0.75 | 0.75 |
| Models | Accuracy | Weighted Precision | Weighted Recall | Weighted F1 Score |
|---|---|---|---|---|
| LR + BO | 0.75 | 0.75 | 0.75 | 0.75 |
| RF + BO | 0.75 | 0.75 | 0.75 | 0.75 |
| XGBoost + BO | 0.75 | 0.75 | 0.75 | 0.75 |
| CatBoost + BO | 0.79 | 0.78 | 0.79 | 0.79 |
| Feature_Setup | Included_Features | Excluded_Features | Weighted_Accuracy | Weighted_Precision | Weighted_Recall | Weighted_F1_Score |
|---|---|---|---|---|---|---|
| All Top 5 | Hct, Nob, Upa, Phr, Edl | None | 0.791667 | 0.781579 | 0.791667 | 0.785012 |
| Excluding Hct | Nob, Upa, Phr, Edl | Hct | 0.75 | 0.5625 | 0.75 | 0.642857 |
| Excluding Nob | Hct, Upa, Phr, Edl | Nob | 0.75 | 0.725 | 0.75 | 0.731579 |
| Excluding Upa | Hct, Nob, Phr, Edl | Upa | 0.791667 | 0.781579 | 0.791667 | 0.785012 |
| Excluding Phr | Hct, Nob, Upa, Edl | Phr | 0.791667 | 0.781579 | 0.791667 | 0.785012 |
| Excluding Edl | Hct, Nob, Upa, Phr | Edl | 0.791667 | 0.781579 | 0.791667 | 0.785012 |
| Train Size | Test Size | Weighted Accuracy | Weighted Precision | Weighted Recall | Weighted F1 Score |
|---|---|---|---|---|---|
| 0.3 | 0.7 | 0.82 | 0.83 | 0.82 | 0.81 |
| 0.5 | 0.5 | 0.83 | 0.83 | 0.83 | 0.82 |
| 0.7 | 0.3 | 0.77 | 0.77 | 0.77 | 0.76 |
| 0.9 | 0.1 | 0.75 | 0.74 | 0.75 | 0.73 |
Disclaimer/Publisher’s Note: The statements, opinions and data contained in all publications are solely those of the individual author(s) and contributor(s) and not of MDPI and/or the editor(s). MDPI and/or the editor(s) disclaim responsibility for any injury to people or property resulting from any ideas, methods, instructions or products referred to in the content. |
© 2025 by the authors. Licensee MDPI, Basel, Switzerland. This article is an open access article distributed under the terms and conditions of the Creative Commons Attribution (CC BY) license (https://creativecommons.org/licenses/by/4.0/).
Share and Cite
Adedara, M.L.; Taiwo, R.; Ayeleru, O.O.; Bork, H.-R. Evaluating Recycling Initiatives for Landfill Diversion in Developing Economies Using Integrated Machine Learning Techniques. Recycling 2025, 10, 100. https://doi.org/10.3390/recycling10030100
Adedara ML, Taiwo R, Ayeleru OO, Bork H-R. Evaluating Recycling Initiatives for Landfill Diversion in Developing Economies Using Integrated Machine Learning Techniques. Recycling. 2025; 10(3):100. https://doi.org/10.3390/recycling10030100
Chicago/Turabian StyleAdedara, Muyiwa Lawrence, Ridwan Taiwo, Olusola Olaitan Ayeleru, and Hans-Rudolf Bork. 2025. "Evaluating Recycling Initiatives for Landfill Diversion in Developing Economies Using Integrated Machine Learning Techniques" Recycling 10, no. 3: 100. https://doi.org/10.3390/recycling10030100
APA StyleAdedara, M. L., Taiwo, R., Ayeleru, O. O., & Bork, H.-R. (2025). Evaluating Recycling Initiatives for Landfill Diversion in Developing Economies Using Integrated Machine Learning Techniques. Recycling, 10(3), 100. https://doi.org/10.3390/recycling10030100