Abstract
The ubiquity of diclofenac (DCF) in the environment has raised significant concerns. Diclofenac is a non-steroidal anti-inflammatory drug that has been found in various environmental matrices at minimum concentrations that are harmful to aquatic and terrestrial organisms. Traditional wastewater treatment plants (WWTPs) are not fully equipped to remove a range of pharmaceuticals, and that explains the continued ubiquity of DCF in surface waters. In this study, an Fe3O4/SiO2 nanocomposite prepared from acid mine drainage and coal fly ash was applied for the removal of DCF from wastewater. Major functional groups (Si–O–Si and Fe–O) were discovered from FTIR. TEM revealed uniform SiO2 nanoparticle rod-like structures with embedded dark spherical nanoparticles. SEM-EDS analysis discovered a sponge-like structure fused with Fe3O4 nanoparticles that had significant Si, O, and Fe content. XRD demonstrated the crystalline nature of the nanocomposite. The surface properties of the nanocomposite were evaluated using BET and were 67.8 m2/g, 0.39 cm3/g, and 23.2 nm for surface area, pore volume, and pore size, respectively. Parameters that were suspected to be affecting the removal process were evaluated, including pH, nanocomposite dosage, and sample volume. The detection of DCF was conducted on high-performance liquid chromatography with diode-array detection (HPLC-DAD). Under optimum conditions, the adsorption process was monolayer, and physisorption was described using the Langmuir and Dubinin-Radushkevich (D-R) isotherm models. The kinetic data best fitted the pseudo-first order kinetic model, indicating a physisorption adsorption process. The thermodynamic experimental data confirmed that the adsorption process was spontaneous. The results obtained from real water samples showed 95.28% and 97.44% removal efficiencies from influent and effluent: 94.83% and 88.61% from raw sewage and final sewage, respectively. Overall, this work demonstrated that an Fe3O4/SiO2 nanocomposite could be successfully prepared from coal fly ash and acid mine drainage and could be used to remove DCF in wastewater.
1. Introduction
Deterioration of water quality has been attributed to the presence of residues of pesticides, industrial solvents, personal care products, and pharmaceuticals, among other commonly detected emerging contaminants [1]. Among the pharmaceutical residues, diclofenac (DCF) is present—a common non-steroidal anti-inflammatory drug for mild to severe pain, including migraine and toothache. In addition, DCF is used as an analgesic and anti-arthritic compound. Diclofenac has been found in amounts between ng/L and µg/L in environmental water and may pose a danger to aquatic life and human health [2,3]. This drug mostly enters the aquatic environment and groundwater through direct human excretion, leakage of sewage pipelines, and partially treated wastewater [4,5]. Therefore, researchers need to ensure that DFC is removed from water points since it is toxic to aquatic organisms and a threat to human health.
Recently, several techniques including reverse osmosis [6], biodegradation [7], filtration [8], photodegradation [9], photocatalysis [10], oxidation [11], and bank filtration [12] were used for the removal of DCF from water. Nevertheless, most of these techniques operate at a high cost and are ineffective. Consequently, it is necessary to enhance treatment processes by removing DCF. The adsorption method can be used to reduce these types of contaminants [13]. Adsorption is preferred since it is easy to operate, environmentally friendly, and inexpensive [14].
A wide range of adsorbent materials, such as rice husk biochar [15], mesoporous silica nanospheres [16], organoclay [17], and molecularly imprinted polymers [18] have been studied for their potential to remove DCF from wastewater. The adsorption of DCF onto activated carbon (AC) derived from the husk of einkorn (Triticum monococcum L.) was investigated, and the maximum adsorption capacity was found to be 147.06 mg/g [19]. Guava seed AC-loaded calcium alginate aerogel was applied for the removal of DCF, which had 489.97 mg/g adsorption capacity [20]. Moreover, a nanoporous carbon adsorbent produced from red pepper (Capsicum annuum L.) showed 303.0 mg/g adsorption capacity on the adsorption of DCF from water [21].
Silica nanoparticles (SiO2 NPs) are known to be stable with a high surface area, which makes SiO2 NPs a good adsorbent [22]. However, SiO2 NP adsorption capacity for DCF is generally limited since there is a lack of necessary adsorptive sites for effective interaction with pollutant molecules [23,24]. On the other hand, Fe3O4 exhibits excellent magnetic properties, facilitating easy separation of the adsorbent from the aqueous solutions. Nonetheless, Fe3O4 alone may agglomerate and lower the surface area [25], consequently reducing the effectiveness of Fe3O4 as an adsorbent. Integrating SiO2 NPs with Fe3O4 forms a composite that results in a high surface area and with magnetic properties [26]. This composite can provide more adsorptive sites for adsorption. It is crucial to explore various waste materials and convert them into valuable products. High surface area and magnetic properties allow the Fe3O4/SiO2 composites to effectively remove organic contaminants such as dyes, heavy metals, and pharmaceuticals, which could work well for DCF removal from water [27,28]. Furthermore, Fe3O4/SiO2 nanocomposites have been broadly explored for drug delivery [29].
In the present work, an Fe3O4/SiO2 nanocomposite was successfully prepared from coal fly ash (CFA) and acid mine drainage (AMD). The Fe3O4/SiO2 nanocomposite exhibited functional groups, as reflected on the FTIR, that interact with DCF molecules during the removal process. Consequently, numerous optimization parameters, isotherms, kinetics, thermodynamics, and adsorption mechanisms, together with desorption studies and regeneration cycles, were analyzed to understand the potential, performance, recovery, and possibility for further reuse of the Fe3O4/SiO2 nanocomposite.
2. Results and Discussion
2.1. Characterization of SiO2 NPs and Fe3O4/SiO2
2.1.1. Fourier Transform Infrared Spectroscopy
The FTIR spectra of SiO2 NPs, Fe3O4 NPs, and Fe3O4/SiO2 nanocomposites are shown in Figure 1, which reveal major functional groups. Strong and broad bands at 3500 cm−1 in Figure 1a,b were ascribed to the silanol, Si–OH [30]. The shoulder peak appearing around 3100–3200 cm−1 in Figure 1b corresponds to the OH group. This is because surface hydroxyl groups can form hydrogen bonds, which can cause their stretching frequencies to be slightly shifted and result in shoulder peaks in the 3100–3200 cm−1 region [31,32]. Nevertheless, the SiO2 NPs prepared and calcined for 30 min presented in Figure 1a, did not show the shoulder peak that signifies the OH group. The peaks at 1400 and 1640 cm−1 in Figure 1a,b were allotted to the physisorbed water molecules, H–O–H [33]. The peak exhibited at 1100 cm−1 in both materials was attributed to the Si–O–Si asymmetric stretching vibration. Furthermore, Si–OH stretching appeared at 495 cm−1 in Figure 1a,b, respectively. Pure silica nanoparticles have a similar peak of around 470–495 cm−1 [34]. The FTIR spectrum of Fe3O4 NPs (Figure 1c) revealed a broad peak and a shoulder around 3200–3500 cm−1, which are due to O–H vibrational stretching, suggesting the presence of hydroxyl groups. Absorption bands at 1612, 1400, and 1106 cm−1 peaks are associated with the bending vibrations of physisorbed water molecules, H–O–H [35]. Moreover, a strong peak around 619 cm−1, suggests Fe−O stretching vibration, confirming the successful synthesis of Fe3O4 NPs. In Figure 1d,e, the broad bands at 3500 cm−1 were ascribed to the silanol, Si–OH [36], and the shoulder peak appearing around 3100–3200 cm−1 corresponds to the OH group. The 1400 and 1640 cm−1 peaks in Figure 1d,e were assigned to the adsorbed water molecules, H–O–H [37]. The peak exhibited at 1100 cm−1 was ascribed to the Si–O–Si asymmetric stretching vibration. The peaks observed at 646 cm−1 were assigned to the Fe–O stretching vibrations [38], indicating that the nanocomposites were successfully prepared.
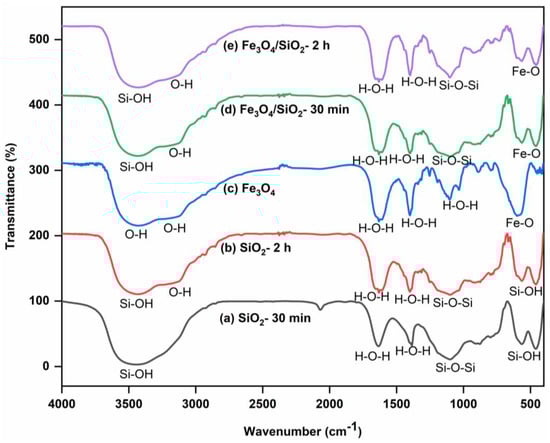
Figure 1.
FTIR spectra of SiO2 NPs, Fe3O4 NPs, and Fe3O4/SiO2 nanocomposites: (a) SiO2—30 min, (b) SiO2—2 h, (c) Fe3O4 NPs, (d) Fe3O4/SiO2—30 min, and (e) Fe3O4/SiO2—2 h.
2.1.2. X-Ray Diffraction
X-ray diffraction (XRD) analysis was executed to study the crystalline structure of SiO2 NPs, Fe3O4 NPs, and Fe3O4/SiO2 nanocomposites, and the X-ray patterns are presented in Figure 2. For SiO2 NPs (Figure 2a,b) and Fe3O4/SiO2 (Figure 2d,e), a sharp peak roughly at 2θ = 26.5° is perceived and it corresponds to (101) crystal planes, which is attributed to the SiO2 NPs [39,40]. This crystal plane is mostly observed in numerous XRD patterns of silica and its composites [41]. Peaks appeared at 2θ = 35.6 and 53.1° for the nanocomposites with (113) and (224) crystal planes, demonstrating that the magnetic nanoparticles were present [42]. The existence of (101) crystal plane in the composite indicates that the magnetite phase has maintained its crystalline structure within the composite [43]. The peaks labelled with asterisks come from the impurity components. Furthermore, the XRD pattern of the magnetite (Figure 2c) exhibited the characteristic peaks of Fe3O4 NPs at 2θ = 32.7°, 35.4°, 43.0°, 54.2°, 56.1°, and 62.6°, which corresponds to (220), (311), (440), (422), (511), and (440) crystal planes of pure Fe3O4 NPs [44,45]. The absence of broad peaks shows that there is no amorphous structure in all the materials, indicating the crystalline nature of the SiO2 NPs, Fe3O4 NPs, and Fe3O4/SiO2 nanocomposites. The atoms and molecules of crystalline material are organized in a definite lattice pattern. The SiO2 NPs produced in 120 min of calcination time are likely to be more uniform and well-defined compared to those prepared in 30 min, leading to slight differences in performance [46]. Combining SiO2 NPs and Fe3O4 NPs results in changes in the XRD patterns, such as decreased peak intensity and shifted peak positions. SiO2 NPs can disrupt the crystalline order of Fe3O4 NPs, leading to increased disorder and a reduction in crystallinity [47,48]. This results in less intense peaks. Additionally, SiO2 can absorb or scatter part of the incident X-rays, reducing the intensity of the diffracted peaks from Fe3O4 [49]. This phenomenon was observed in the nanocomposites in Figure 2d,e. Furthermore, chemical interaction between SiO2 and Fe3O4 can change the electronic environment and affect the lattice spacing [50], which causes shifts in the peak positions. The average particle sizes of the SiO2 NPs, Fe3O4 NPs, and Fe3O4/SiO2 nanocomposites were calculated using the Debye–Scherrer Equation (1) as shown below:
where variable d indicates particle size (nm), k indicates lattice constant (0.9), λ represents the wavelength (0.154 nm), β is the full-width half maximum (FWHM) of the maximum intensity (radians), and θ is the Bragg peak angle (degrees). Thus, the SiO2—30 min, SiO2—2 h, Fe3O4 NPs, Fe3O4/SiO2—30 min, and Fe3O4/SiO2—2 h particle sizes were calculated as 26, 21.5, 9.0, 15, and 13 nm, respectively. SiO2 NPs showed more intense peaks; and the Fe3O4/SiO2 nanocomposites exhibited intermediate sizes with peak intensities between SiO2 NPs and Fe3O4 NPs.
d = Kλ/βcosθ
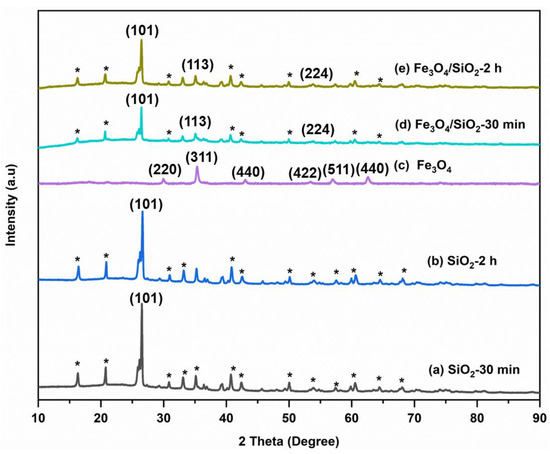
Figure 2.
XRD patterns for SiO2 NPs, Fe3O4 NPs, and Fe3O4/SiO2 nanocomposites: (a) SiO2—30 min, (b) SiO2—2 h, (c) Fe3O4 NPs, (d) Fe3O4/SiO2—30 min, and (e) Fe3O4/SiO2—2 h. The asterisks (*) represent peaks from the impurity components.
2.1.3. Scanning Electron Microscopy
SEM analysis was carried out to investigate the surface morphology of the synthesized materials as presented in Figure 3. Figure 3a,b demonstrate sponge-like structures with particles dispersed in Figure 3a. In contrast, the particles are packed together in Figure 3b. Similar results were reported by Meng [51]. Relatively small spherical shapes, together with irregular shapes of Fe3O4 NPs, were observed in Figure 3c. Furthermore, the Fe3O4 NPs were agglomerated. The Fe3O4 NPs were embedded in the pores of SiO2 NPs in the SEM images displayed in Figure 3d,e, which further corroborates the successful synthesis of Fe3O4/SiO2 nanocomposites.
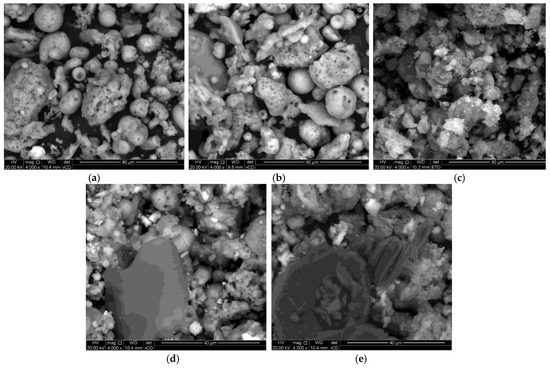
Figure 3.
SEM images of SiO2 NPs, Fe3O4 NPs, and Fe3O4/SiO2 nanocomposites: (a) SiO2—30 min, (b) SiO2—2 h, (c) Fe3O4 NPs, (d) Fe3O4/SiO2—30 min, and (e) Fe3O4/SiO2—2 h.
2.1.4. Energy-Dispersive X-Ray Spectroscopy
The EDS spectra of SiO2 NPs synthesized from CFA, Fe3O4 NPs, and Fe3O4/SiO2 nanocomposites are shown in Figure 4. The presence of Si and O in spectra Figure 4a (O = 40.6% and Si = 12.3%) and Figure 4b (O = 42.4% and Si = 13.7%) verified successful formation of SiO2 NPs. A very high content of Fe (Fe = 65.4%) with O (O = 23.0%) proved that Fe3O4 NPs were synthesized successfully as seen in Figure 4c. Conversely, the EDS spectra of Fe3O4/SiO2 nanocomposites shown in Figure 4d, with (O = 37.9%, Si = 12.1%, and Fe = 4.1%), and Figure 4e (O = 42.0%, Si = 18.4%, and Fe = 17.6%) corroborated the formation of Fe3O4/SiO2 nanocomposites. Furthermore, the existence of Al, C, Ti, Mg, Na, P, Ca, K, Cl, and Cu is ascribable to impurities linked with inappropriate washing. These impurities (Ti, Mg, Na, P, Ca, K, Cl, and Cu) would not compromise the performance of the SiO2 NPs and Fe3O4/SiO2 nanocomposites during the adsorption process because they exist at a very low amount, less than 3%. C is perceived as due to the CFA carbon [52]. The significant amount of Al observed in all EDS spectra is attributed to the contact of the specimen aluminum stubs with the sample CFA (contains various oxides with alumina (Al2O3) included) [53,54] and AMD (which often contains dissolved [55,56] metals such as aluminum) [57].

Figure 4.
EDS spectra of SiO2 NPs, Fe3O4 NPs, and Fe3O4/SiO2 nanocomposites: (a) SiO2—30 min, (b) SiO2—2 h, (c) Fe3O4 NPs, (d) Fe3O4/SiO2—30 min, and (e) Fe3O4/SiO2—2 h. The EDS software (AZtec Version 5.1, Oxford Instruments NanoAnalysis) shows the elements in red color when their amounts are very low. Hence S and Cl appeared in red color on the EDS spectrum (Figure 4c).
2.1.5. Transmission Electron Microscopy
The particle size distribution and shape of the SiO2 NPs, Fe3O4 NPs, and Fe3O4/SiO2 nanocomposites were evaluated using TEM, as presented in Figure 5a–e. Figure 5a,b reveal uniform rod-like structures of SiO2 NPs, which are aggregated. The TEM image in Figure 5c displays spherical Fe3O4 NPs, which are distributed evenly and slightly agglomerated at other spots. The dark spherical nanoparticles embedded in thin rod-like structures are observed in Figure 5d,e. These spherically shaped nanoparticles in Figure 5d,e are associated with Fe3O4 NPs, while thin rod-like structures are amalgamated to SiO2 NPs, respectively. However, the embedded spherical nanoparticles are clustered in Figure 5d, whereas in Figure 5e, they are well-dispersed, implying that the number of active sites for adsorption would be high [58]. BET results emphasized this point as the highest surface areas of the SiO2 NPs and Fe3O4/SiO2 nanocomposites were found to be 10.5 and 67.7 m2/g (see Table 1). This is evident in that the surface area increased after the incorporation of Fe3O4 NPs into SiO2 NPs.
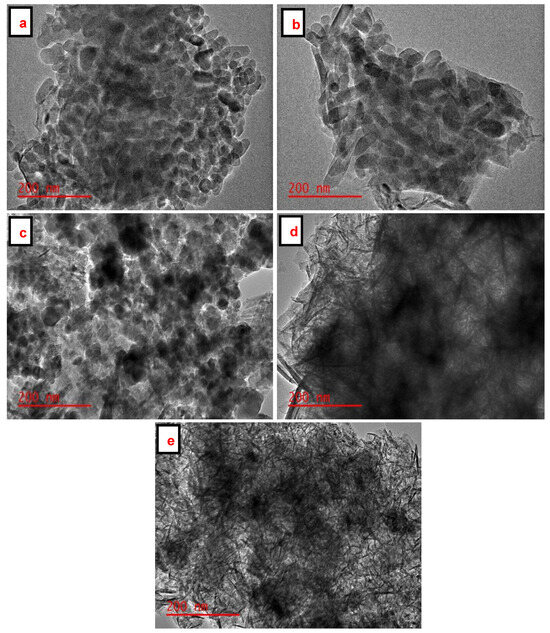
Figure 5.
TEM images of Fe3O4 NPs, SiO2 NPs and Fe3O4/SiO2 nanocomposites: (a) SiO2—30 min, (b) SiO2—2 h, (c) Fe3O4 NPs, (d) Fe3O4/SiO2—30 min, and (e) Fe3O4/SiO2—2 h.

Table 1.
Surface area, pore volume, and pore size of SiO2 NPs and magnetic nanocomposites.
2.1.6. Nitrogen Adsorption–Desorption Studies
The N2 adsorption–desorption isotherms of the prepared materials were studied to acquire the surface area, pore volume, and pore size, as illustrated in Figure 6. The SiO2 NPs (Figure 6a,b) depict type IV isotherms with an H3-type hysteresis loop in the range 0.6–1.0 (P/Po), indicating the presence of mesopores in the materials [59]. The Fe3O4 NPs (Figure 6c) depict type IV isotherm. In addition, Fe3O4/SiO2 nanocomposite (Figure 6d,e) exhibited type IV isotherm with H3-type hysteresis loop in a 0.4 to 1.0 (P/Po) range, and this confirms meso-porosity of the nanocomposite [60,61,62]. Table 1 depicts the surface properties of the prepared materials. More adsorptive sites that are available for adsorption are indicated by a higher surface area [63]. The BET surface area of SiO2 NPs (SiO2—30 min and SiO2—2 h) increased from (3.7 and 10.6 m2/g) to (37.7 and 67.8 m2/g) after the incorporation of Fe3O4 NPs. The BET surface area of Fe3O4 NPs was discovered as 90.8 m2/g. After incorporation, surface area, pore size, and pore volume increased significantly, indicating improved performance of the nanocomposite. Nonetheless, the variations in pore size between SiO2—30 min and SiO2—2 h can be ascribed to synthesis conditions, structural changes, and the nature of the precursor. A shorter treatment time may result in a more open structure with less density [64], enabling the formation of bigger pores (228 nm). This could be the result of incomplete network formation [65]. On the other hand, an extended treatment duration promotes complete condensation and polymerization of the silica network [66], leading to a denser structure with smaller pores (87 nm). Moreover, the pore size is reduced by the growth of silica particles and increased cross-linking [40,67]. Ultimately, the addition of the Fe3O4 NPs reduces the pore size by taking up space and changing the structure of the silica network. Thus, Fe3O4/SiO2—30 min exhibits smaller pores than Fe3O4/SiO2—2 h, mainly due to differences in the silica shell condensation and network formation around the Fe3O4 core [68].
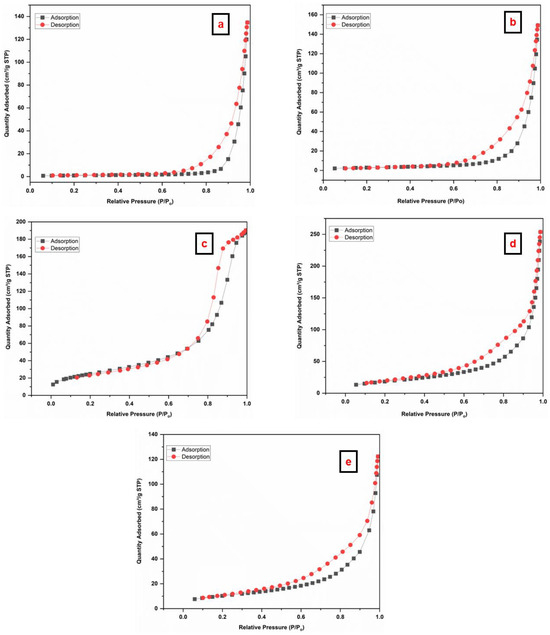
Figure 6.
Nitrogen adsorption–desorption BET isotherms of the prepared materials (a) SiO2—30 min, (b) SiO2—2 h, (c) Fe3O4 NPs, (d) Fe3O4/SiO2—30 min, and (e) Fe3O4/SiO2—2 h.
2.1.7. Point of Zero Charge (pHPZC)
The point of zero charge is a crucial property that represents the pH at which the material’s surface has a net zero charge. Figure S1 reveals a pHPZC of SiO2—30 min, SiO2—2 h, Fe3O4/SiO2—30 min and Fe3O4/SiO2—2 h, which were found at pH = 3.4, pH = 2.8, pH = 3.5 and pH = 5.2, respectively. The pHPZC postulates that when the pH of the solution is below and above the pHPZC, the adsorbent’s surface becomes positively and negatively charged, respectively. The pKa value of DCF is 3.15 [69]. It has a greater ability to donate protons in aqueous media/solutions, and that results in the adsorbent surface strongly favoring the removal of negatively charged species (anions). When the pH of the solution is greater than the pHPZC, the adsorbent’s surface becomes negatively charged and adsorbs positively charged species (cations) [70].
2.1.8. Vibrating Sample Magnetometer
A vibrating sample magnetometer (VSM) was used to investigate the magnetic properties of Fe3O4 NPs and Fe3O4/SiO2 nanocomposite, with the results presented in Figure 7. Based on the results in Figure 7, it was revealed that the saturation magnetisation values for Fe3O4 NPs and Fe3O4/SiO2 nanocomposite were calculated as 14 and 6.10 emu/g, indicating that Fe3O4 NPs were more magnetic than Fe3O4/SiO2 nanocomposite. The prepared nanocomposite’s saturation magnetisation value expectedly dropped due to the incorporation of SiO2, which reduced the magnetic moment, making it less magnetic than Fe3O4 NPs. This is also indicative that Fe3O4 was successfully incorporated with SiO2, which expectedly lowered the magnetic field. However, it increased the surface area and was expected to have a higher removal efficiency than Fe3O4 NPs.
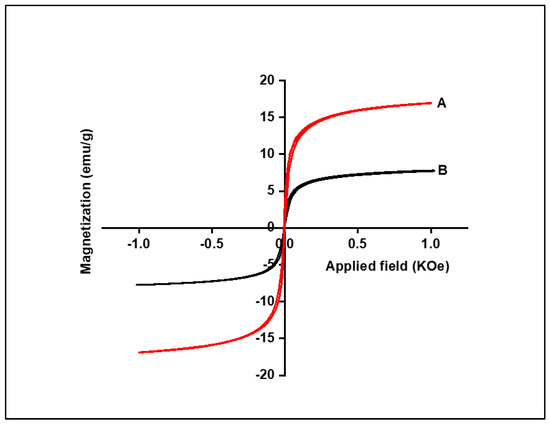
Figure 7.
M–H loops of the Fe3O4 NPs (A) and Fe3O4/SiO2 nanocomposite (B).
2.2. Optimisation of Adsorbents (Selection of Best Adsorbent Material)
The selection of a better adsorbent depends on the analyte and solution pH. The performance of SiO2 NPs, Fe3O4, and Fe3O4/SiO2 nanocomposites at different pH levels is shown in Figure 8. Notably, Fe3O4/SiO2 nanocomposite exhibited remarkable removal efficiencies compared to SiO2 NPs and Fe3O4 at acidic pH (pH = 3). This may be due to the synergistic effects and additional adsorption sites, which facilitated the adsorption of more DCF. This also agrees with the SEM and TEM results in Figure 3 and Figure 4, which prove that the SiO2 NPs and Fe3O4 NPs were properly integrated. Moreover, the adsorbent’s surface charge varies with pH, thus affecting the removal efficiencies. This point was thoroughly stressed in the above section when PZC was discussed (Figure S1). Consequently, Fe3O4/SiO2—2 h nanocomposite was selected based on the performance to conduct additional research.

Figure 8.
The performance of SiO2 NPs, Fe3O4, and Fe3O4/SiO2 nanocomposites at pH = 3, 7, and 9.
2.3. Optimization Scheme
Response surface methodology (RSM), which is made possible by CCD, was used to investigate the impact of significant parameters, including the MA, SV, and sample pH, in order to remove DCF from the aqueous solution. The Pareto chart in Figure 9 depicts the outcomes. Information about the importance of the variables and how they interact is provided by the horizontal bars. If the horizontal bar passes the red line (95 % confidence level), it indicates that there is statistical significance for the factor or interactions [71]. Based on the Pareto chart (Figure 9), it is evident that the pH demonstrated statistical significance for the process of adsorptive removal. Additionally, the negative pH value (−4.820) suggests that sorption is highly favored at lower pH levels.
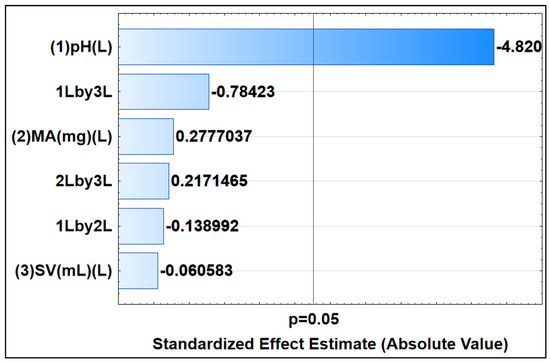
Figure 9.
Pareto chart of standardized effects, indicating the significance of parameters at 95% confidence level. This chart was constructed using linear models, depicting main (L) and interactive effects (L by L) among selected parameters.
Three-dimensional (3-D) response surface plots in Figure 10 were used to evaluate the impact of variables interacting when DCF is being removed. Based on the RSM plots, it was observed that there were notable interactions between the sample pH and adsorbent mass. It was evident from RSM plots that MA and %RE were proportional to one another, i.e., when MA increased, RE% also increased. This was because of the increase in the surface area and availability of adsorptive sites on the adsorbent’s surface. Additionally, the effect of pH was conducted, and the highest recoveries were attained at a pH below 8. The pKa value of DCF is 3.15 [72]. When the pH ≥ pKa, DCF exists as an anion and when pH ≤ pKa, it exists in its neutral form. The PZC of the adsorbent was discovered to be 5.2. Thus, when the pH of the solution is lower (below 3.15) than the pHPZC, the surface of the adsorbent becomes positively charged. Therefore, at pH values below 5.2, the %RE increases drastically. This was due to the electrostatic attraction between the nanocomposite and DCF. As seen in 3-D plots, at pH values above 5.2, the %RE significantly decreased. This was due to the repulsive forces which existed between the nanocomposite and DCF. Moreover, there were no significant interactions between SV and MA. Therefore, it should be clear from the 3-D plots that there was no significant %RE increase as both the SV and MA were increasing.
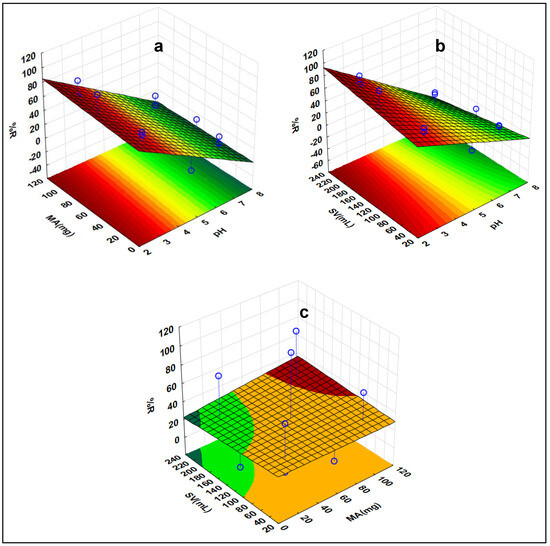
Figure 10.
Response surface methodology of DCF indicating the interactive effects of the investigated factors (a) MA vs. pH, (b) pH vs. SV, and (c) MA vs. SV.
The desirability function was used to optimize all the evaluated parameters simultaneously. After the method of the desired function shown in Figure 11 was employed, optimum conditions were discovered to be as follows: sample pH value 2.4, SV 221.5 mL, and MA at 111.5 mg with total desirability of 1.00. The chosen SV was 200 mL since it is on the same desirability value of 1.00. The predicted optimum mass of adsorbent was also high; however, different masses of adsorbent ranging from 10−111.49 mg lie on the desirability value of 1.00; any MA in this range is suitable for further application. Therefore, 20 mg was chosen for the rest of the study. The experiments were conducted in triplicate with the optimal conditions, which produced %RE of 82.8%. Table S1 shows a list of runs attained using CCD and their responses.
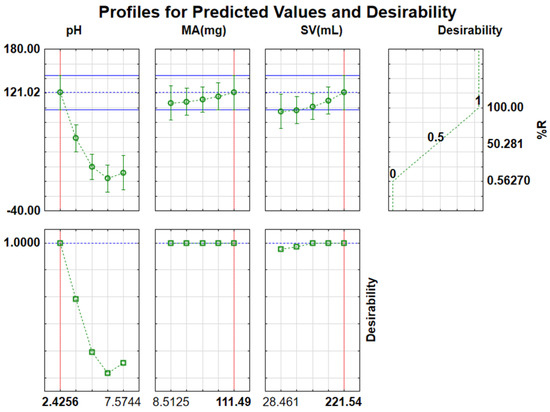
Figure 11.
Desirability functions for optimization of independent variables.
2.4. Isotherm Studies
Adsorption isotherms models were critical in understanding the interaction behavior of DCF and Fe3O4/SiO2 nanocomposite [73]. In this study, nonlinear Langmuir, Freundlich, Temkin, Sips, Redlich–Peterson (R−P), and Dubinin–Radushkevich (D−R) adsorption isotherms were employed to investigate the measured data shown in Table 2.
Table 2.
Adsorption isotherms of DCF onto Fe3O4/SiO2.
The Langmuir isotherm model (Figure S2a) is an important tool for analyzing adsorption processes, particularly for systems where monolayer adsorption on homogeneous surfaces is predominant. A measure of how well the model describes the experimental data is provided by the coefficient of determination (R2), and the parameters qmax and KL provide important details about the adsorption capacity and affinity [74]. As depicted in Table 2, the correlation coefficient (R2 = 0.9766) substantiates the adsorption of DCF on a monolayer surface of Fe3O4/SiO2 nanocomposite with no lateral interactions between DCF molecules. The KL value of 0.38 obtained indicates a high affinity of the Fe3O4/SiO2 nanocomposite towards DCF. Consequently, the experimental data were best described by the Langmuir isotherm.
The Freundlich isotherm model (Figure S2a) plays a pivotal role in understanding the adsorption process on heterogeneous surfaces with different adsorption energies [75]. Freundlich’s adsorption strength is measured by the parameter KF, while n indicates the adsorption’s feasibility and intensity [76]. These parameters were calculated to be 18.9 mg/g and 2.77 (Table 2), which stipulates that the adsorption process was favorable since values of n indicate a good adsorption process between 1 and 10, and less than 1 indicates inadequate adsorption [77]. Furthermore, the results obtained showed that the Freundlich model has a lower coefficient of determination (R2 = 0.9236) than the Langmuir model, denoting that the equilibrium data were best explained by the Langmuir isotherm.
The Temkin isotherm model (Figure S2b) comprises a parameter that accounts for adsorbent–adsorbate interactions [78]. According to the model, all of the molecules in the layer would experience a linear drop in heat of adsorption when the coverage increases, by neglecting very small and very large values of concentrations [79,80]. Based on the results presented in Table 2, the binding energy (BT) and binding constant (AT) were discovered to be 11.2 J/mol and 4.87 L/g. The coefficient of determination of this model is R2 = 0.9574, which evidently shows that it fits the equilibrium data better than the Freundlich isotherm. However, compared to the Langmuir isotherm, with a coefficient of determination of 0.9766, the Temkin isotherm model does not adequately fit the equilibrium data.
The Sips isotherm model was also used to fit the measured data (Figure S2b), which is the derivative of Freundlich and Langmuir isotherms, to affirm the homogeneity or heterogeneity of the surface of the adsorbent [81]. As the parameters illustrated in Table 2, if n lies between 0 and 1, it represents heterogeneity. However, if n = 1 or close to 1, it suggests a homogenous adsorption process [82]. Based on the findings displayed in Table 2, the n value was discovered to be 1.34, slightly above 1, stipulating a homogenous adsorption process. These results align with the conclusions made from the Langmuir isotherm, which assumed homogenous adsorption.
Figure S2c illustrates Redlich–Petersen (R–P) isotherm model, which is a hybridized adsorption model that combines features of the Freundlich and Langmuir isotherm models. The Redlich–Petersen isotherm has parameters such as KRP, αRP, and β, which were calculated as 13.6 L/g, 1.38 L/mg, and 0.09 as shown in Table 2, respectively. The β value of the R–P isotherm model ranges from 0 and 1. If β approaches or equals to 1, the R–P isotherm suggests a monolayer, and if β approaches 0, the R−P isotherm indicates a multilayer feature [83]. As seen in Table 2, the value of β was 0.09, with a coefficient of determination of 0.9882. The equilibrium data described the monolayer characteristic, which was described by the Langmuir isotherm.
Figure S2c illustrates the Dubini–Radushkevich (D–R) isotherm model, which is normally used to predict whether adsorption is based on a chemical or physical process [84]. The prediction was based on the obtained mean free energy (E, kJ/mol), which suggests that mean free energy above and below 8 kJ/mol suggests chemisorption and physisorption, respectively [85]. From the results obtained in Table 2, the value of E was below 8 kJ/mol (4.6 kJ/mol), which showed that physisorption was the primary mechanism by which DCF was adsorbed onto Fe3O4/SiO2.
2.5. Kinetics Studies
To examine the mechanism for DCF onto Fe3O4/SiO2, nonlinear kinetic models (Figure S3) such as pseudo-first order (PFO), pseudo-second order (PSO), and intraparticle diffusion were plotted with the calculated parameters shown in Table 3. The R2 values of PFO and PSO are used to assess the appropriateness of the kinetic adsorption. Therefore, the highest R2 value, which is closest to 1, indicates more suitable kinetic adsorption [86,87]. Based on the plots (Figure S3), the PFO plot shows an R2 value of 0.9819, which is close to 1. On the other hand, the PSO plot reveals an R2 value of 0.9569. The adsorption of DCF was, therefore, driven by a PFO mechanism and was not amenable to the PSO model rendition. According to the PFO model, physisorption is the primary mechanism driving DCF adsorption [88], which is in agreement with the D−R isotherm model, as discussed. On the PFO model, it can be noted that the qt values increased gradually and eventually became nearly constant.
Table 3.
Adsorption kinetic parameters for the adsorption of DCF onto Fe3O4/SiO2 nanocomposite.
In contrast to the PSO model, with an increase in contact time, the qt values kept increasing. To better understand the adsorption behavior, the experimental data were fitted into the intraparticle diffusion model. From the obtained plot, as presented in Figure S4, it is evident that there are two phases; the initial phase (Figure S4a) entails DCF molecules from the liquid phase migrating to the outer surface of the nanocomposite; the second phase (Figure S4b) involves the diffusion of the DCF molecules within the adsorbent’s pores and finally bonding to the internal structures [89]. As seen in Table 3, the boundary layer diffusion parameters (C1 and C2) have values greater than zero, indicating that intraparticle diffusion does not appear as the rate-limiting step. Consequently, intraparticle diffusion mostly controlled the adsorption mechanism.
2.6. Thermodynamic Studies
The study of thermodynamics was carried out to evaluate the impact of temperature on the adsorptive removal of DCF. The plot of 1/T vs. lnK at different temperatures is demonstrated in Figure S5, and temperatures ranged from 25–60 °C. The calculated Gibbs free energies described the thermodynamic behavior of DCF onto Fe3O4/SiO2. Gibbs free energy was calculated using Equation (2). According to the data in Table 4, the ΔG° values ranged from −5.84 to −3.89 kJ/mol, demonstrating that the process of adsorption was spontaneous. As such, the decrease in ΔG° as the temperature increases proves that the adsorption process that occurred is inversely proportional to the temperature [90]:
Table 4.
Thermodynamic parameters for the adsorption of DCF onto Fe3O4/SiO2 nanocomposite.
The positive ΔH° value (11.38 kJ/mol) indicated that the adsorption process was endothermic. Furthermore, the ΔS° value was calculated to be 51.81 J/mol·K, demonstrating that the adsorption process has a high degree of disorder [91].
2.7. Possible Adsorption Mechanism
Diclofenac adsorption onto the Fe3O4/SiO2 nanocomposite surface was investigated to provide understanding into potential interactions. According to the BET results, the porous nature of the Fe3O4/SiO2 nanocomposite facilitates the DCF molecules’ penetration into the interior pores. The PZC of Fe3O4/SiO2 nanocomposite was identified (as exhibited in Figure S1), which was obtained at 5.2. At this point, the Fe3O4/SiO2 nanocomposite surface is neutral. Therefore, at the pH below pHPZC = 5.2, the Fe3O4/SiO2 nanocomposite surface is protonated, and the nanocomposite surface is negatively charged at pH values higher than pHPZC = 5.2 [92]. The optimum pH is 2.4, and DCF is in an anionic form in the solution. Electrostatic attraction occurs between positively charged Fe3O4/SiO2 and negatively charged DCF molecules, thereby promoting high adsorption efficiency. FTIR spectra and the adsorption mechanism presented in Figure 12 and Figure 13 further elucidated how the hydrogen bond formed between O atoms from the Fe3O4/SiO2 and H atoms on the aromatic ring and the secondary amine group from DCF. Moreover, Figure 13 illustrates the metallic bond formed between the pool of electrons in the aromatic ring of the DCF and iron (Fe) from the Fe3O4/SiO2. According to Figure 12b (after adsorption), the shape, broadness, and intensity of the hydroxy group peaks and asymmetrical peaks from the Si–O–Si changed. Furthermore, the adsorption isotherms demonstrated that the results could be described by the Langmuir isotherm model, which postulates that the adsorbate molecule can only occupy an adsorption site at the Fe3O4/SiO2 nanocomposite once [93,94]. The results from kinetic studies demonstrated that the experimental data best fitted the PFO model, which presumed that physisorption was a dominant mechanism for the removal of DCF, which agrees with the results of the D−R isotherm. The chromatograms of before and after adsorption are presented in Figure S6.
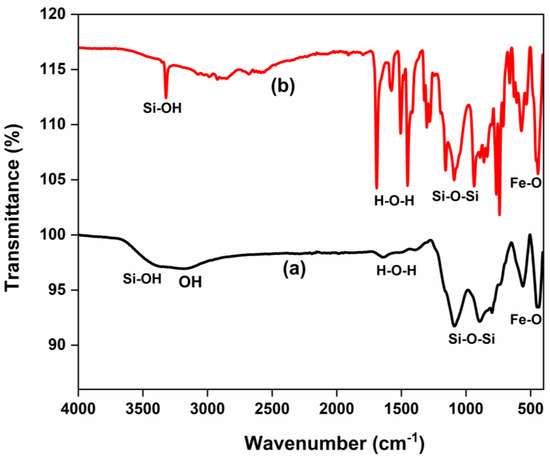
Figure 12.
FTIR spectra of the nanocomposite (a) before, and (b) after adsorption.

Figure 13.
Adsorption mechanism of DCF onto Fe3O4/SiO2 nanocomposite.
2.8. Desorption Mechanism
Desorption of DCF was conducted to evaluate the behavior of the adsorbent in the process. HNO3 was used as it created an acidic environment and protonated the functional groups of Fe3O4/SiO2 nanocomposite. Consequently, the interaction forces (hydrogen and metallic bonds) between DCF and Fe3O4/SiO2 nanocomposite were weakened. Therefore, DCF’s H atoms detached from the O atoms of the adsorbent, and the adsorbent was regenerated. The schematic representation of the desorption mechanism is presented in Scheme 1.
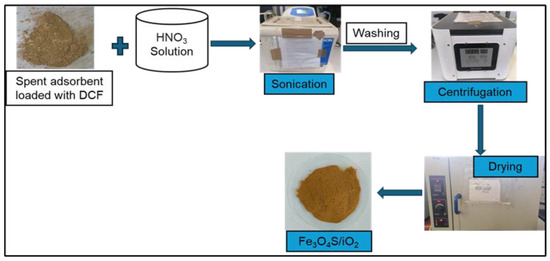
Scheme 1.
Desorption of DFC from Fe3O4/SiO2 nanocomposite.
2.9. Analysis of Wastewater and Sewage Samples
The spiked real water samples (influent, effluent, raw sewage, and final sewage) were analyzed using the adsorptive removal process described in this study to assess the performance of Fe3O4/SiO2 in the presence of sample matrices. After optimum conditions were employed, high removal efficiencies were obtained, as presented in Table 5. In the influent and effluent wastewater, the removal efficiencies were determined as 95.28% and 97.44%, whereas 94.83% and 88.61% were obtained for raw sewage and final sewage samples. These findings demonstrated that the complex matrices had no detrimental effects on the removal of DCF.
Table 5.
Adsorptive removal of DCF in real water samples (wastewater and sewage samples).
The physicochemical parameters, such as total dissolved solids (TDS), electrical conductivity (EC), turbidity, and pH (Table 6) were assessed before and after applying Fe3O4/SiO2 nanocomposite in sewage samples and wastewater to adsorb DCF. The pH of influent, effluent, raw sewage, and final sewage before the adsorption process was high, ranging from 8.21 to 10.1. However, the optimum conditions were used, and the adsorption process was executed. After adsorption, the pH was perceived to have dropped (7.03–7.46). The turbidity values before adsorption were extraordinarily high in the influent wastewater, raw sewage, and final sewage (29.0, 15.8, and 23.0 NTU); but were low in the effluent (1.31 NTU), which was within the permissible level of 0.4–2.5 NTU [95]. Nevertheless, after adsorption, the turbidity of the effluent and raw sewage was reduced significantly to 0.95 and 1.33 NTU. Additionally, the turbidity of the influent and final sewage dropped to 11.7 and 11.1 NTU, respectively. Nevertheless, untreated wastewater and sewage samples often exhibit high conductivity because they contain dissolved salts and other ionic species. The EC before adsorption was measured to be 0.19, 0.37, 1.48, and 1.25 mS for the influent, effluent, raw sewage, and final sewage, respectively; whereas, after adsorption, the EC decreased to 0.12, 0.24, 1.02, and 0.95 S/m. The measured TDS of the influent, effluent, raw sewage, and final sewage before the adsorption process could be carried out were 130, 192, 776, and 595 mg/L. Then, after adsorption, the TDS decreased to 65, 96, 411, and 299 mg/L. A TDS level of less than 300 mg/L is advised for drinking water by the World Health Organization [96]. Therefore, the TDS levels detected after adsorption were less than 300 mg/L except for the raw sewage sample (411 mg/L). The investigation of these physicochemical parameters demonstrates the efficacy of Fe3O4/SiO2 in adsorbing DCF from wastewater and sewage samples and improving water quality. The adsorption process reduced the TDS, EC, and turbidity significantly. This technique proved to be a promising solution for treating contaminated wastewater and sewage.
Table 6.
Physico–chemical analysis of wastewater and sewage samples.
2.10. Comparison Study
Table 7 displays the maximum capacities of different adsorbents employed in removing DCF. Fe3O4/SiO2 nanocomposite synthesized in this work had 55.7 mg/g maximum adsorption capacity compared to adsorbent materials discussed in the literature for the removal of DCF. However, it is noteworthy that other adsorbents might have relatively high adsorption capacities towards the removal of DCF from aqueous solution or wastewater. For instance, polypyrrole (RM-PPy) showed 195 mg/g adsorption capacity (Table 7).
Table 7.
Comparison of other adsorbents employed in removing DCF.
2.11. Regenerability and Reusability Studies
Regenerability and reusability studies of Fe3O4/SiO2 nanocomposite were evaluated to determine the capacity to remove DCF from wastewater. Successive adsorption–desorption experiments were performed based on the methodology reported in the previous studies [102]. Figure 14 demonstrates the removal efficiencies of the spent Fe3O4/SiO2 nanocomposite after seven adsorption–desorption cycles. As seen in Figure 14, the removal efficiency dropped significantly from the first cycle to the second, then started reducing with a slight margin until the end of the seventh cycle of adsorption–desorption with a removal efficiency of 78.8%. Therefore, it can be concluded that the Fe3O4/SiO2 nanocomposite showed excellent regeneration and reusability properties, with a slight decrease (from the second cycle) in removal efficiency over seven cycles. The results also demonstrated that the Fe3O4/SiO2 nanocomposite was structurally stable, indicating that it could be used repeatedly to remove DCF. Nonetheless, the prepared nanocomposite demonstrated exceptional reusability and a sustainable solution to remove DCF in wastewater.

Figure 14.
Regenerability and reusability studies of Fe3O4/SiO2 nanocomposite. Optimum experimental conditions: MA = 20 mg and pH = 2.4.
3. Materials and Methods
3.1. Reagents and Materials
Only analytical grade reagents were used. Diclofenac sodium salt (≥99%), iron (II) chloride tetrahydrate (FeCl2·4H2O), hydrochloric acid (HCl), sodium hydroxide (NaOH), methanol (CH3OH), ammonia hydroxide (NH4OH), acetonitrile (HPLC grade), and formic acid (HCOOH) were all procured from Sigma-Aldrich (St. Louis, MO, USA). Acid mine drainage waste was collected from the central basin acid mine drainage treatment plant in Germiston, Gauteng province, South Africa. Coal fly ash was obtained from Lethabo Power Station, situated in Free State province, South Africa. Ultra-pure water was used throughout the experiments.
3.2. Instrumentation
The masses of chemical salts and adsorbent materials were recorded using a Radwag AS220/C/2 analytical balance. Transmission electron microscopy (TEM) studies were performed at an acceleration voltage of 200 kV by using a Jeol JEM-2100F transmission electron microscope instrument (Akishima, Tokyo, Japan) equipped with a LaB6 source. The morphological and structural properties of the synthesized materials were studied using a scanning electron microscopy (SEM, Tescan Vega 3 LMH) instrument (Tescan Company, Brno, Czech Republic) coupled with an energy dispersive X-ray spectroscopy (EDS) and an Empyrean X-ray diffractometer (PANalytical, Almelo, The Netherlands). Analysis of functional moieties for the prepared materials was conducted on a MIRacle-10 Fourier-transform infrared spectrometer (FT-IR) (Shimadzu, Japan). A benchtop pH/mV Meter (HI5221, Hanna Instruments, Woonsocket, RI, USA) was used for pH adjustments. The point of zero charge (pHPZC) was evaluated by using a zetasizer (Malvern PANalytical, Worcestershire, UK). The solids were separated from the supernatant through the Eppendorf 5702 centrifuge (Eppendorf, Hamburg, Germany). The filtrate was analyzed on an Agilent HPLC 1200 Infinity series coupled to a DAD (AgilentTechnologies, Waldbronn, Germany). An Agilent Zorbax Eclipse Plus C18 column (3.5 mm × 150 mm × 4.6 mm) (Agilent, Newport, CA, USA) was operated at an oven temperature of 25 °C.
3.3. Synthesis of SiO2 Nanoparticles from Coal Fly Ash
To synthesize SiO2 NPs, a sodium silicate solution was first prepared by following the previous method with a few small adjustments [27]. Coal fly ash was obtained from the Power Station. Sodium silicate solution was prepared according to the following recipe: 10 g of CFA was mixed with 10 M NaOH solution. The mixture was subjected to heat in a closed high-density polyethylene (HDPE) bottle at 97 °C inside a silicone oil bath, and the mixture was constantly agitated at 300 rpm for 60 min. The concentration of NaOH and reaction time were chosen based on the promotion of the highest silica extraction. Silica nanoparticles were synthesized from the sodium silicate solution obtained through the precipitation process. The silicate solution was stirred vigorously for 60 min. During the precipitation process, nitric acid was added dropwise into the sodium silicate solution until the pH of the solution was reduced from approximately 11 to 8. After that, ethanol (20 mL) was added to the mixture. The mixture was stirred continuously for 45 min and then centrifugated at 4000 rpm for a precipitate to form. The formed precipitate was washed several times with deionized water and further placed in a muffle furnace for 30 min at 600 °C to achieve SiO2 NPs [103]; they were labelled SiO2—30 min. The SiO2—2 h was synthesized by following a similar procedure of heating for 120 min in the last step.
3.4. Synthesis of Fe3O4/SiO2 Nanocomposite
Fe3O4/SiO2 nanocomposite was synthesized following the method reported previously [104]. An amount of 1000 mL of AMD was taken for the preparation of Fe3O4 NPs. The pH of the AMD was set to 4.5 by adding 1 M HCl or 1 M NaOH to the mixture, and an Fe3+ precipitate was formed and settled at the bottom of the beaker. The Fe3+ precipitate was separated from the supernatant through centrifugation. Fe3O4/SiO2 nanocomposite was synthesized by following the method reported by Munonde [105] with a few modifications. Briefly, 10.4 g precipitate and 5.2 g FeCl2·4H2O were mixed in 200 mL deionized water and rapidly agitated at 85 °C. This process took place under a nitrogen atmosphere. After quickly adding NH4OH solution (50 mL) and 7.8 g of SiO2 NPs, the mixture abruptly turned black. The contents were further agitated for 15 min under the same conditions and cooled to 25 °C. The formed precipitate was segregated through a magnetic decantation process. The precipitate was washed several times with deionized water to pH 10. Finally, the achieved Fe3O4/SiO2 nanocomposite was dried for 10 h at 60 °C in an oven and crushed into small grains. The nanocomposite was labelled Fe3O4/SiO2—30 min. The Fe3O4/SiO2—2 h was synthesized by following a similar procedure with an addition of SiO2—2 h into the mixture. The schematic representation of the nanocomposite synthesis is presented in Scheme 2.
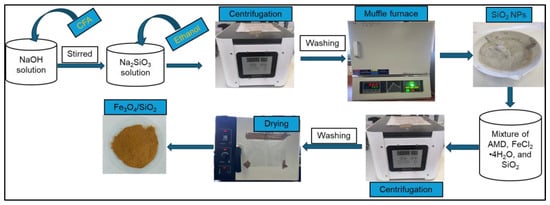
Scheme 2.
Synthesis of SiO2 NPs and Fe3O4/SiO2 nanocomposite.
3.5. Batch Adsorption Experiments
Erlenmeyer flasks were used for the adsorption experiments, which were conducted at room temperature. Central composite design (CCD) was utilized to optimize the variables that influenced sorption. The adsorption of DCF was carried out following the method reported by Pereira Gómez and co-workers [106]. Briefly, distinct masses of Fe3O4/SiO2—2 h (10 to 100 mg) were added into 200 mL of 1 mg/L DCF solution. The pH (2–10) of the solutions was set by adding 1.0 M HCl or 1.0 M NaOH dropwise. After sonication for 60 min, the solids were separated from the supernatant by centrifugation at 4000 rpm for 10 min. The filtrates were filtered through a 0.22 μm acrodisc membrane filter and then analyzed with HPLC-DAD to determine the concentration of DCF after adsorption. The percentage removal efficiency (%RE) of DCF was determined using Equation (3):
where: C0 (mg/L) is the initial concentration, and Ce (mg/L) is the equilibrium concentration of DCF.
3.6. Isotherms Studies
In order to study the isotherms, various concentrations of DCF (2–20 mg/L) were prepared in 200 mL, and then 1.0 M HCl and 1.0 M NaOH were used to bring the solution’s pH down to 2.4. Twenty mg of Fe3O4/SiO2 nanocomposite was introduced into the solutions, and the contents were sonicated for 60 min at 25 °C. The nanocomposite was isolated from the supernatant through centrifugation (4000 rpm; 10 min), and the filtrates were analyzed by HPLC-DAD. The adsorption capacities (qe (mg/g)) of DCF were obtained using Equation (4):
where qe (mg/g) is the amount of DCF adsorbed at equilibrium, W (mg) and V (mL) are mass of adsorbent (MA) and sample volume (SV), respectively.
3.7. Kinetics Studies
Kinetics studies were conducted at varying contact times (5–60 min) with 20 mg Fe3O4/SiO2 nanocomposite, pH = 2.4, and 200 mL SV. The experiments were carried out using an initial concentration of 14.1 mg/L. The concentrations after adsorption were determined by the use of HPLC-DAD, and the adsorption capacities (qt (mg/g)) of DCF were calculated using Equation (5):
where qt (mg/g) represents the amounts of DCF adsorbed at equilibrium, W (mg) and V (mL) are the MA and SV.
3.8. Thermodynamics Studies
Temperatures between 25 and 60 °C were used to investigate how temperature affected the adsorption process. The MA, pH, contact time, SV, and initial concentration were kept constant.
3.9. Real Water Sample Analysis
Wastewater samples (effluent, influent, and raw sewage) were collected from Steelpoort and Marble Hall (Steelpoort and Marble Hall, Limpopo, South Africa). Bottles of 800 mL were used to collect these samples, which were then refrigerated at 8 °C. The samples were filtered via 0.22 μm syringe filters.
3.10. Point of Zero Charge
The pHPZC of the synthesized SiO2—30 min, SiO2—2 h, Fe3O4/SiO2—30 min, and Fe3O4/SiO2—2 h was evaluated through the zetasizer technique. During the preparation of 50 mL solutions, the pH was adjusted with 0.10 mol/L NaOH or 0.1 mol/L HCl solutions, and 120 mg of adsorbent materials were introduced into the solutions. The mixtures were sonicated and analyzed to obtain pHPZC.
4. Conclusions
A Fe3O4/SiO2 nanocomposite was synthesized from CFA and AMD, and various analytical characterization techniques confirmed its successful synthesis. Then, Fe3O4/SiO2 nanocomposite was applied to remove DCF from wastewater, and excellent removal was achieved with a 97.4% maximum removal efficiency. The equilibrium data were fitted into nonlinear Langmuir, Freundlich, Temkin, Sips, Redlich–Peterson (R−P) and Dubinin–Radushkevich (D−R) adsorption isotherms models, and according to the Langmuir isotherm model, the adsorption was monolayer. The PFO kinetic model was best fitted by kinetic data, which suggested that the controlling mechanism for the uptake of DCF was physisorption, and the D–R isotherm model also confirmed this phenomenon. The thermodynamic data established that the system was endothermic and spontaneous. Fe3O4/SiO2 nanocomposite demonstrated high removal efficiencies of DCF from wastewater and sewage. Therefore, it is noticeable that Fe3O4/SiO2 nanocomposite can be applied to reduce the pollution caused by pharmaceuticals (namely diclofenac) in aquatic bodies. By incorporating Fe3O4 to enhance the physicochemical properties of the adsorbent, the Fe3O4/SiO2 nanocomposite reduced the turbidity, EC, and TDS of wastewater and sewage while keeping the pH almost constant. The results obtained demonstrated the potential applicability of Fe3O4/SiO2 nanocomposite as an adsorbent to remove DCF in complex matrices of real water samples. Furthermore, the Fe3O4/SiO2 nanocomposite could be regenerated and reused seven times, maintaining high performance.
Supplementary Materials
The following supporting information can be downloaded at: https://www.mdpi.com/article/10.3390/recycling10030099/s1, Figure S1: Point of zero charge plot for SiO2 NPs and Fe3O4/SiO2 nanocomposites.; Figure S2: Plots of nonlinear Langmuir and Freundlich adsorption isotherms (a), Temkin and Sips adsorption isotherms (b), Redlich–Peterson (R−P) and Dubinin-Radushkevich (D−R) adsorption isotherms (c); for the adsorption of DCF onto Fe3O4/SiO2 nanocomposite.; Figure S3: Nonlinear PFO, and PSO models for the adsorption kinetics of DCF onto Fe3O4/SiO2 nanocomposite., Figure S4: Intra-particle diffusion model for the adsorption kinetics of DCF onto Fe3O4/SiO2 nanocomposite, (a) initial phase, and (b) second phase., Figure S5: Van’t Hoff plot of DCF adsorption onto Fe3O4/SiO2 nanocomposite., Figure S6: Chromatograms of the spiked wastewater (a) before, and (b) after adsorption Table S1: Number of runs obtained using CCD and their respective responses.
Author Contributions
Conceptualization, T.S.M., A.N. and P.N.N.; Methodology, D.M. and N.J.W.; Software, P.N.N.; Validation, D.M. and N.J.W.; Formal analysis, D.M. and N.J.W.; Investigation, T.S.M. and A.N.; Writing–original draft, D.M.; Writing–review & editing, T.S.M., A.N. and P.N.N.; Supervision, T.S.M., A.N. and P.N.N.; Funding acquisition, P.N.N. All authors have read and agreed to the published version of the manuscript.
Funding
This research was funded by the Department of Science, Technology and Innovation-National Research Foundation South African Research Chair Initiative (DSTI-NRF SARChI), grant number [91230] And the APC was funded by the University of Johannesburg.
Data Availability Statement
The original contributions presented in this study are included in the article/Supplementary Materials. Further inquiries can be directed to the corresponding author.
Acknowledgments
The authors would like to acknowledge the Department of Chemical Science, University of Johannesburg (UJ) for offering their laboratory. The authors also acknowledge the support they receive from all instrument scientists from the Department of Chemical Sciences (PS Pole, S Wagenaar and P Komane) and Spectrum Analytical Facility (S Mpelane and MO Sebabi).
Conflicts of Interest
The authors have no conflicts of interest.
References
- Frascaroli, G.; Reid, D.; Hunter, C.; Roberts, J.; Helwig, K.; Spencer, J.; Escudero, A. Pharmaceuticals in wastewater treatment plants: A systematic review on the substances of greatest concern responsible for the development of antimicrobial resistance. Appl. Sci. 2021, 11, 6670. [Google Scholar] [CrossRef]
- Puga, A.; Pazos, M.; Rosales, E.; Sanromán, M.A. Electro-reversible adsorption as a versatile tool for the removal of diclofenac from wastewater. Chemosphere 2021, 280, 130778. [Google Scholar] [CrossRef]
- Parolini, M. Toxicity of the Non-Steroidal Anti-Inflammatory Drugs (NSAIDs) acetylsalicylic acid, paracetamol, diclofenac, ibuprofen and naproxen towards freshwater invertebrates: A review. Sci. Total Environ. 2020, 740, 140043. [Google Scholar] [CrossRef] [PubMed]
- Ishii, E.; Watanabe, Y.; Agusa, T.; Hosono, T.; Nakata, H. Acesulfame as a suitable sewer tracer on groundwater pollution: A case study before and after the 2016 Mw 7.0 Kumamoto earthquakes. Sci. Total Environ. 2021, 754, 142409. [Google Scholar] [CrossRef]
- Kimbi Yaah, V.B.; Zbair, M.; de Oliveira, S.B.; Ojala, S. Hydrochar-derived adsorbent for the removal of diclofenac from aqueous solution. Nanotechnol. Environ. Eng. 2021, 6, 3. [Google Scholar] [CrossRef]
- Shin, Y.; Hwang, T.M.; Nam, S.H.; Kim, E.; Park, J.; Choi, Y.J.; Koo, J.W. Evaluating Nanofiltration and Reverse Osmosis Membranes for Pharmaceutically Active Compounds Removal: A Solution Diffusion Model Approach. Membranes 2024, 14, 250. [Google Scholar] [CrossRef]
- Dzimitrowicz, A.; Terefinko, D.; Bielawska-Pohl, A.; Motyka-Pomagruk, A.; Jamroz, P.; Cyganowski, P.; Caban, M. Biosafe removal of diclofenac from wastewaters by a continuous-flow mode cold atmospheric pressure plasma system. J. Environ. Chem. Eng. 2024, 12, 111598. [Google Scholar] [CrossRef]
- Salomão, G.R.; Américo-Pinheiro, J.H.P.; Isique, W.D.; Torres, N.H.; Cruz, I.A.; Ferreira, L.F.R. Diclofenac removal in water supply by adsorption on composite low-cost material. Environ. Technol. 2021, 42, 2095–2111. [Google Scholar] [CrossRef]
- Gao, Y.; Cheng, T.; Zhao, F.; Huang, G.; Bi, J. A hybrid linker-MOF fibrous composite for efficient diclofenac removal and self-cleaning. Sep. Purif. Technol. 2024, 337, 126260. [Google Scholar] [CrossRef]
- Kubiak, A.; Cegłowski, M. Investigating a batch-flow photocatalytic LED system for diclofenac removal in wastewater treatment plants: Assessing the influence of reaction conditions on photocatalytic efficiency. J. Water Process Eng. 2024, 62, 105397. [Google Scholar] [CrossRef]
- Lee, J.; Jo, S.J.; Yoon, S.; Ko, M.; Jang, T.; Kim, H.K.; Park, J.A. Coupled adsorption-photocatalysis process for the removal of diclofenac using magnetite/reduced graphene oxide nanocomposite. Chemosphere 2024, 349, 140788. [Google Scholar] [CrossRef] [PubMed]
- Conte, F.; Tommasi, M.; Degerli, S.N.; Forame, E.; Parolini, M.; De Felice, B.; Rossetti, I. Comparison of Different Advanced Oxidation Processes (AOPs) and Photocatalysts for the Degradation of Diclofenac. ChemPhotoChem 2024, 8, e202300177. [Google Scholar] [CrossRef]
- de Carvalho Filho, J.A.A.; da Cruz, H.M.; Fernandes, B.S.; Motteran, F.; de Paiva, A.L.R.; Cabral, J.J.D.S.P. Efficiency of the bank filtration technique for diclofenac removal: A review. Environ. Pollut. 2022, 300, 118916. [Google Scholar] [CrossRef]
- Bernal, V.; Giraldo, L.; Moreno-Piraján, J.C. Physicochemical properties of activated carbon: Their effect on the adsorption of pharmaceutical compounds and adsorbate–adsorbent interactions. C 2018, 4, 62. [Google Scholar] [CrossRef]
- Lan, D.; Zhu, H.; Li, S.; Chen, Q.; Wang, C.; Xu, M. Adsorptive removal of organic dyes via porous materials for wastewater treatment in recent decades: A review on species, mechanisms and perspectives. Chemosphere 2022, 293, 133464. [Google Scholar] [CrossRef]
- Hinsene, H.; Bhawawet, N.; Imyim, A. Rice husk biochar doped with deep eutectic solvent and Fe3O4/ZnO nanoparticles for heavy metal and diclofenac removal from water. Sep. Purif. Technol. 2024, 339, 126638. [Google Scholar] [CrossRef]
- Ortiz-Bustos, J.; Soares, S.F.; del Pulgar, H.P.; Gómez-Ruiz, S.; Daniel-da-Silva, A.L.; del Hierro, I. Tuning adsorption capacities of hybrid mesoporous silica nanospheres and adsorption mechanism study for sulfamethoxazole and diclofenac removal from water. J. Mol. Liq. 2024, 398, 124213. [Google Scholar] [CrossRef]
- Saadoon, S.; Mohammed, A.K.; Ali, Z.T.A.; Rashid, I.M.; Isahak, W.N.R.W.; Rahimnejad, M. Removal of Diclofenac from Contaminated Water using Organoclay as Reactive Material. Al-Khwarizmi Eng. J. 2024, 20, 1–13. [Google Scholar] [CrossRef]
- Parlapiano, M.; Foglia, A.; Sgroi, M.; Pisani, M.; Astolfi, P.; Mezzelani, M.; Fatone, F. Assessment of molecularly imprinted polymers for selective removal of diclofenac from wastewater by laboratory and pilot-scale adsorption tests. J. Water Process Eng. 2024, 63, 105467. [Google Scholar] [CrossRef]
- Kocabıyık, B.; Üner, O.; Geçgel, U. Diclofenac sodium adsorption in aqueous media by activated carbon obtained from einkorn (Triticum monococcum L.) husk. Adsorption 2024, 30, 1033–1046. [Google Scholar] [CrossRef]
- Al-Hazmi, G.A.; Alayyafi, A.A.; El-Desouky, M.G.; El-Bindary, A.A. Guava seed activated carbon loaded calcium alginate aerogel for the adsorption of diclofenac sodium: Characterisation, isotherm, kinetics, and optimisation via Box-Behnken design. Int. J. Biol. Macromol. 2024, 262, 129995. [Google Scholar] [CrossRef] [PubMed]
- Koyuncu, F.; Güzel, F.; Teymur, Y.A. Red pepper (Capsicum annuum L.) industrial processing pulp-derived nanoporous carbon sorbent for the removal of methylene blue, diclofenac, and copper (II). Biomass Convers. Biorefin. 2024, 14, 5651–5664. [Google Scholar] [CrossRef]
- Sharma, P.; Prakash, J.; Kaushal, R. An insight into the green synthesis of SiO2 nanostructures as a novel adsorbent for removal of toxic water pollutants. Environ. Res. 2022, 212, 113328. [Google Scholar] [CrossRef] [PubMed]
- Li, X.; Li, L.; Tang, L.; Mei, J.; Fu, J. Unveiling combined ecotoxicity: Interactions and impacts of engineered nanoparticles and PPCPs. Sci. Total Environ. 2024, 921, 170746. [Google Scholar] [CrossRef]
- Lilli, B.; Wassersleben, S.; Schulze, T.; Otto, A.; Enke, D. Additive effects of rice husk-based carbon-silica composites on adsorption of diclofenac sodium and carbamazepine from aqueous solutions. Sci. Total Environ. 2024, 954, 176389. [Google Scholar] [CrossRef]
- Eskandari, M.J.; Hasanzadeh, I. Size-controlled synthesis of Fe3O4 magnetic nanoparticles via an alternating magnetic field and ultrasonic-assisted chemical co-precipitation. Mater. Sci. Eng. B. 2021, 266, 115050. [Google Scholar] [CrossRef]
- Ain, S.N.U.; Khan, M.S.; Riaz, N.; Khan, A.; Sarwar, A.; Khalid, A.; Al-Harrasi, A. Surface-Functionalized Magnetic Silica-Malachite Tricomposite (Fe–M–Si tricomposite): A Promising Adsorbent for the Removal of Cypermethrin. ACS Omega 2024, 9, 13803–13817. [Google Scholar] [CrossRef]
- Ali, N.S.M.; Alalwan, H.A.; Alminshid, A.H.; Mohammed, M.M. Synthesis and characterization of Fe3O4-SiO2 nanoparticles as adsorbent material for methyl blue dye removal from aqueous solutions. Pollution 2022, 8, 295–302. [Google Scholar]
- Jahanbakhsh, Z.; Hosseinzadeh, H.; Masoumi, B. Synthesis of carboxymethyl β-cyclodextrin bonded Fe3O4@ SiO2–NH2 core-shell magnetic nanocomposite adsorbent for effective removal of Pb (II) from wastewater. J. Solgel Sci. Technol. 2021, 99, 230–242. [Google Scholar] [CrossRef]
- Hosseinzadeh, H.; Jahanbakhsh, Z.; Masoumi, B.; Hooshangi, V. Preparation of amino-functionalized β-cyclodextrin/Fe3O4@ SiO2 magnetic nanocarrier for controlled release of doxorubicin, an anticancer drug. Arab. J. Sci. Eng. 2024, 49, 459–473. [Google Scholar] [CrossRef]
- Khalid, A.; Saddique, Z.; Iqbal, Z.F.; Imran, M.; Javaid, A.; Latif, S.; Rasheed, T. Photocatalytic Potential of Sandwich like Magnetic NPs/MXenes Nanohybrids for Abatement of Wastewater Contaminants. Top. Catal. 2024, 68, 951–964. [Google Scholar] [CrossRef]
- Du, J.; Xu, K.; Yang, X.; Dong, Z.; Zhao, L. Removal of diclofenac sodium from aqueous solution using different ionic liquids functionalized tragacanth gum hydrogel prepared by radiation technique. Int. J. Biol. Macromol. 2024, 265, 130758. [Google Scholar] [CrossRef] [PubMed]
- Wazir, A.H.; Haq, I.U.; Manan, A.; Khan, A. Preparation and characterisation of activated carbon from coal by chemical activation with KOH. Int. J. Coal Prep. Util. 2022, 42, 1477–1488. [Google Scholar] [CrossRef]
- Volkov, D.S.; Rogova, O.B.; Proskurnin, M.A. Temperature dependences of IR spectra of humic substances of brown coal. Agronomy 2021, 11, 1822. [Google Scholar] [CrossRef]
- Gaweł, B.A.; Ulvensøen, A.; Łukaszuk, K.; Arstad, B.; Muggerud, A.M.F.; Erbe, A. Structural evolution of water and hydroxyl groups during thermal, mechanical and chemical treatment of high purity natural quartz. RSC Adv. 2020, 10, 29018–29030. [Google Scholar] [CrossRef]
- Zhang, C.; Zhang, Y.; Cao, K.; Guo, Z.; Han, Y.; Hu, W.; He, Y. Ultrasensitive and reversible room-temperature resistive humidity sensor based on layered two-dimensional titanium carbide. Ceram. Int. 2021, 47, 6463–6469. [Google Scholar] [CrossRef]
- Sugie, C.; Navrotsky, A.; Lauterbach, S.; Kleebe, H.J.; Mera, G. Structure and thermodynamics of silicon oxycarbide polymer-derived ceramics with and without mixed-bonding. Materials 2021, 14, 4075. [Google Scholar] [CrossRef]
- Peréz, D.L.; Puentes, I.; Romero, G.M.; Gaona, I.S.; Vargas, C.P.; Rincón, R.J. Synthesis of superparamagnetic iron oxide nanoparticles coated with polyethylene glycol as potential drug carriers for cancer treatment. J. Nanopart. Res. 2024, 26, 2. [Google Scholar] [CrossRef]
- Tharani, D.; Ananthasubramanian, M. Influence of pre-treatment processes on the purity and characteristics of silica extracted from rice husk. Biomass Convers. Biorefin. 2024, 14, 12517–12529. [Google Scholar] [CrossRef]
- Rahimzadeh, B.; Ghosoun, Z.; Masoudi, F. Identification of Fe3+ content in Epidote from Varan, Urumieh-Dokhtar magmatic arc, Iran: Using FTIR and Raman spectroscopy. Iran J. Earth Sci. 2022, 14, 131–139. [Google Scholar]
- He, S.; Ruan, C.; Shi, Y.; Chen, G.; Ma, Y.; Dai, H.; Yang, X. Insight to hydrophobic SiO2 encapsulated SiO2 gel: Preparation and application in fire extinguishing. J. Hazard. Mater. 2021, 405, 124216. [Google Scholar] [CrossRef] [PubMed]
- Gu, X.; Ma, J.; He, J. Fabrication of SiO2/TiO2 coated polyethylene films with photoinduced superhydrophilicity, antifogging property and mechanical robustness. Ceram. Int. 2024, 50, 37183–37192. [Google Scholar] [CrossRef]
- Yaseen, M.; Khan, A.; Humayun, M.; Farooq, S.; Shah, N.; Bibi, S.; Ullah, H. Facile synthesis of Fe3O4–SiO2 nanocomposites for wastewater treatment. Macromol. Mater. Eng. 2023, 308, 2200695. [Google Scholar] [CrossRef]
- Saeed, M.S.; Hekmatara, H. MWCNT decorated Magnetic/Ceramic/Polymer (Fe2O3/Fe3O4/SiO2/PANI) nanocomposite with enhanced microwave absorption at an entire X and Ku frequency bands. Ceram. Int. 2024, 50, 11795–11803. [Google Scholar] [CrossRef]
- Takai, Z.I.; Mustafa, M.K.; Asman, S.; Sekak, K.A. Preparation and characterization of magnetite (Fe3O4) nanoparticles by sol-gel method. Int. J. Nanoelectron. Mater. 2019, 12, 37–46. [Google Scholar]
- Sabur, M.A.; Gafur, M.A. Crystallographic; Morphological; Magnetic, and Thermal Characterization of Superparamagnetic Magnetite Nanoparticles (Fe3O4) Synthesized by Chemical Coprecipitation Method and Calcined at 250 °C for 4 hr. J. Nanomater. 2024, 2024, 9577778. [Google Scholar] [CrossRef]
- Kosari, M.; Askari, S.; Seayad, A.M.; Xi, S.; Kawi, S.; Borgna, A.; Zeng, H.C. Strong coke-resistivity of spherical hollow Ni/SiO2 catalysts with shell-confined high-content Ni nanoparticles for methane dry reforming with CO2. Appl. Catal. B Environ. 2022, 310, 121360. [Google Scholar] [CrossRef]
- Yusoff, F.; Suresh, K.; Khairul, W.M. Synthesis and characterization of reduced graphene oxide/iron oxide/silicon dioxide (rGO/Fe3O4/SiO2) nanocomposite as a potential cathode catalyst. J. Phys. Chem. Solids 2022, 163, 110551. [Google Scholar] [CrossRef]
- Nguyen, M.D.; Tran, H.V.; Xu, S.; Lee, T.R. Fe3O4 nanoparticles: Structures; synthesis; magnetic properties; surface functionalisation; emerging applications. Appl. Sci. 2021, 11, 11301. [Google Scholar] [CrossRef]
- Peñafiel, M.E.; Jara-Cobos, L.; Flores, D.; Jerves, C.; Menendez, M. Enhancing adsorptive removal of diclofenac from aqueous solution: Evaluating organic and inorganic acid treatment of zeolite. CSCEE 2024, 9, 100575. [Google Scholar] [CrossRef]
- Ling, W.; Wang, M.; Xiong, C.; Xie, D.; Chen, Q.; Chu, X.; Xiao, X. Synthesis, surface modification, and applications of magnetic iron oxide nanoparticles. J. Mater. Res. 2019, 34, 1828–1844. [Google Scholar] [CrossRef]
- Ebrahimi-Tazangi, F.; Hekmatara, S.H.; Seyed-Yazdi, J. Remarkable microwave absorption of GO-SiO2/Fe3O4 via an effective design and optimised composition. J. Alloys Compd. 2021, 854, 157213. [Google Scholar] [CrossRef]
- Divya, S.; Lims, S.C.; Manivannan, M.; Robert, R.; Das, S.J.; Jose, M. Impact of amorphous SiO2 as shell material on superparamagnetic Fe3O4 nanoparticles and investigation of temperature and frequency dependent dielectric properties. J. Alloys Compd. 2022, 919, 165751. [Google Scholar] [CrossRef]
- Meng, C.; Liu, X.; Li, R.; Malekmohammadi, S.; Feng, Y.; Song, J.; Li, J. 3D Poly (L-lactic acid) fibrous sponge with interconnected porous structure for bone tissue scaffold. Int. J. Biol. Macromol. 2024, 268, 131688. [Google Scholar] [CrossRef]
- Yadav, V.K.; Fulekar, M.H. Green synthesis and characterisation of amorphous silica nanoparticles from fly ash. Mater. Today Proc. 2019, 18, 4351–4359. [Google Scholar] [CrossRef]
- Sahoo, P.K.; Kim, K.; Powell, M.A.; Equeenuddin, S.M. Recovery of metals and other beneficial products from coal fly ash: A sustainable approach for fly ash management. Int. J. Coal Sci. Technol. 2016, 3, 267–283. [Google Scholar] [CrossRef]
- Panda, L.; Dash, S. Characterisation and utilisation of coal fly ash: A review. Emerg. Mater. Res. 2020, 9, 921–934. [Google Scholar]
- Yuan, J.; Ding, Z.; Li, J.; Yu, A.; Wen, S.; Bai, S. An innovative method to degrade xanthate from flotation tailings wastewater in acid mine drainage (AMD) system: Performance, degradation mechanism and pathways. J. Environ. Manag. 2024, 349, 119395. [Google Scholar] [CrossRef]
- Jiang, F.; Li, Y.; Pan, Y. Design Principles of Single-Atom Catalysts for Oxygen Evolution Reaction: From Targeted Structures to Active Sites. Adv. Mater. 2024, 36, 2306309. [Google Scholar] [CrossRef]
- Kishibayev, K.K.; Serafin, J.; Tokpayev, R.R.; Khavaza, T.N.; Atchabarova, A.A.; Abduakhytova, D.A.; Ibraimov, Z.T.; Sreńscek-Nazzal, J. Physical and chemical properties of activated carbon synthesised from plant wastes and shungite for CO2 capture. J. Environ. Chem. Eng. 2021, 9, 106798. [Google Scholar] [CrossRef]
- Fu, S.; Fang, Q.; Li, A.; Li, Z.; Han, J.; Dang, X.; Han, W. Accurate characterization of full pore size distribution of tight sandstones by low-temperature nitrogen gas adsorption and high-pressure mercury intrusion combination method. Energy Sci. Eng. 2021, 9, 80–100. [Google Scholar] [CrossRef]
- Imoisili, P.E.; Jen, T.C.; Safaei, B. Microwave-assisted sol–gel synthesis of TiO2-mixed metal oxide nanocatalyst for degradation of organic pollutant. Nanotech. Rev. 2021, 10, 126–136. [Google Scholar] [CrossRef]
- Mahdi, A.E.; Ali, N.S.; Kalash, K.R.; Salih, I.K.; Abdulrahman, M.A.; Albayati, T.M. Investigation of equilibrium, isotherm, and mechanism for the efficient removal of 3-nitroaniline dye from wastewater using mesoporous material MCM-48. Prog. Color Color. Coat. 2023, 16, 387–398. [Google Scholar]
- Watthanachai, C.; Ngamcharussrivichai, C.; Pengprecha, S. Synthesis and characterisation of bimodal mesoporous silica derived from rice husk ash. Eng. J. 2019, 23, 25–34. [Google Scholar] [CrossRef]
- Dong, Y.; Wang, F.; Song, W.; Zhu, C.; Wang, X.; Li, W. Construction of surface oxygen vacancy active sites upon MnOx/AC composite catalysts for efficient coupling adsorption and oxidation of toluene. Chem. Eng. J. 2023, 464, 142740. [Google Scholar] [CrossRef]
- Zhang, B.; Tong, Z.; Pang, Y.; Xu, H.; Li, X.; Ji, H. Design and electrospun closed cell structured SiO2 nanocomposite fiber by hollow SiO2/TiO2 spheres for thermal insulation. Compos. Sci. Technol. 2022, 218, 109152. [Google Scholar] [CrossRef]
- Karamikamkar, S.; Naguib, H.E.; Park, C.B. Advances in precursor system for silica-based aerogel production toward improved mechanical properties, customised morphology, and multifunctionality: A review. Adv. Colloid Interface Sci. 2020, 276, 102101. [Google Scholar] [CrossRef]
- Dilshad, M.R.; Islam, A.; Haider, B.; Sajid, M.; Ijaz, A.; Khan, R.U.; Khan, W.G. Effect of silica nanoparticles on carbon dioxide separation performances of PVA/PEG cross-linked membranes. Chem. Pap. 2021, 75, 3131–3153. [Google Scholar] [CrossRef]
- Choi, H.; Kim, T.; Kim, T.; Moon, S.; Yoo, S.; Parale, V.G.; Park, H.H. Ultralow dielectric cross-linked silica aerogel nanocomposite films for interconnect technology. Appl. Mater. Today 2022, 28, 101536. [Google Scholar] [CrossRef]
- Vohl, S.; Kristl, M.; Stergar, J. Harnessing Magnetic Nanoparticles for the Effective Removal of Micro-and Nanoplastics: A Critical Review. Nanomaterials 2024, 14, 1179. [Google Scholar] [CrossRef]
- Doss, V.N.M.M.A.; Lin, Y.W.; Horng, L. Characterization of an Environmentally Responsive Organic–Inorganic Hybrid Fe3O4/SiO2/PPy-c Core–Shell Nanocomposite with Magneto-Chromatic Ability for Synergistic Electrical Properties. Inorg. Chem. 2024, 63, 18016–18029. [Google Scholar] [CrossRef] [PubMed]
- Huaccallo-Aguilar, Y.; De Tuesta, J.D.; Álvarez-Torrellas, S.; Gomes, H.T.; Larriba, M.; Ovejero, G.; García, J. New insights on the removal of diclofenac and ibuprofen by CWPO using a magnetite-based catalyst in an up-flow fixed-bed reactor. J. Environ. Manag. 2021, 281, 111913. [Google Scholar] [CrossRef]
- Nguyen, V.T.; Nguyen, T.B.; Dat, N.D.; Huu, B.T.; Nguyen, X.C.; Tran, T.; Bui, X.T. Adsorption of norfloxacin from aqueous solution on biochar derived from spent coffee ground: Master variables and response surface method optimised adsorption process. Chemosphere 2022, 288, 132577. [Google Scholar] [CrossRef]
- Gerbing, D.W. Enhancement of the command-line environment for use in the introductory statistics course and beyond. J. Stat. Data Sci. Educ. 2021, 29, 251–266. [Google Scholar] [CrossRef]
- Alrefaee, S.H.; Aljohani, M.; Alkhamis, K.; Shaaban, F.; El-Desouky, M.G.; El-Bindary, A.A.; El-Bindary, M.A. Adsorption and effective removal of organophosphorus pesticides from aqueous solution via novel metal-organic framework: Adsorption isotherms, kinetics, and optimisation via Box-Behnken design. J. Mol. Liq. 2023, 384, 122206. [Google Scholar] [CrossRef]
- Vitek, R.; Masini, J.C. Nonlinear regression for treating adsorption isotherm data to characterise new sorbents: Advantages over linearisation demonstrated with simulated and experimental data. Heliyon 2023, 9, e15128. [Google Scholar] [CrossRef]
- Hu, Q.; Lan, R.; He, L.; Liu, H.; Pei, X. A critical review of adsorption isotherm models for aqueous contaminants: Curve characteristics, site energy distribution and common controversies. J. Environ. Manag. 2023, 329, 117104. [Google Scholar] [CrossRef]
- Kong, Y.Y.S.; Wang, Q.; Lu, J.X.; Poon, C.S. Lightweight aggregates produced from low-temperature sintering of multiple solid wastes for heavy metals removal: Adsorption kinetics and stabilization. J. Clean. Prod. 2024, 480, 144118. [Google Scholar] [CrossRef]
- Kalam, S.; Abu-Khamsin, S.A.; Kamal, M.S.; Patil, S. Surfactant adsorption isotherms: A review. ACS Omega 2021, 6, 32342–32348. [Google Scholar] [CrossRef]
- Abumelha, H.M. Enhancing brilliant green dye removal via bio composite chitosan and food-grade algae capsulated ruthenium metal-organic framework: Optimization of adsorption parameters by box-behnken design. Int. J. Biol. Macromol. 2024, 264, 130635. [Google Scholar] [CrossRef]
- Fakhfakh, F.; Raissi, S.; Jeddou, F.B.; Zghal, R.Z.; Ghorbel, A. Isotherm and kinetic modeling of Cr (VI) removal with quaternary ammonium functionalized silica. J. Solgel Sci. Technol. 2024, 111, 921–940. [Google Scholar] [CrossRef]
- Ribeiro, A.C.; Januário, E.F.D.; Vidovix, T.B.; Vieira, A.M.S.; Bergamasco, R. Synthesis of a novel functionalised biosorbent from mango stone and its application in the pharmaceutical’s removal from water and a synthetic mixture. Chemosphere 2024, 346, 140520. [Google Scholar] [CrossRef] [PubMed]
- Chu, K.H.; Hashim, M.A.; da Costa Santos, Y.T.; Debord, J.; Harel, M.; Bollinger, J.C. The Redlich–Peterson isotherm for aqueous phase adsorption: Pitfalls in data analysis and interpretation. Chem. Eng. Sci. 2024, 285, 119573. [Google Scholar] [CrossRef]
- Van Melkebeke, M.; De Somer, T.; Van Laere, T.; Minh, T.N.L.; Shirazi, H.M.; Poelman, H.; De Meester, S. Adsorption modeling for contaminant removal in plastic dissolution recycling: Investigating an amino ketone-based red dye. Sep. Purif. Technol. 2024, 331, 125559. [Google Scholar] [CrossRef]
- Yanardağ, D.; Edebali, S. Adsorptive removal of malachite green dye from aqueous solution by ion exchange resins. Biomass Conv. Biorefin. 2024, 14, 5699–5710. [Google Scholar] [CrossRef]
- Mustafa, D.; Ibrahim, B.; Erten, A. Adsorptive removal of anticarcinogen pazopanib from aqueous solutions using activated carbon: Isotherm, kinetic and thermodynamic studies. Sci. Rep. 2024, 14, 17765. [Google Scholar] [CrossRef]
- Zafar, S.; Khan, M.I.; Rehman, H.U.; Fernandez-Garcia, J.; Shahida, S.; Prapamonthon, P.; Lashari, M.H. Kinetic, equilibrium, and thermodynamic studies for adsorptive removal of cobalt ions by rice husk from aqueous solution. Desalination Water Treat. 2020, 204, 285–296. [Google Scholar] [CrossRef]
- Hidayat, A.R.P.; Sulistiono, D.O.; Murwani, I.K.; Endrawati, B.F.; Fansuri, H.; Zulfa, L.L.; Ediati, R. Linear and nonlinear isotherm, kinetic and thermodynamic behavior of methyl orange adsorption using modulated Al2O3@ UiO-66 via acetic acid. J. Environ. Chem. Eng. 2021, 9, 106675. [Google Scholar] [CrossRef]
- Islam, M.S.; Maamoun, I.; Falyouna, O.; Eljamal, O.; Saha, B.B. Arsenic removal from contaminated water utilising novel green composite Chlorella vulgaris and nano zero-valent iron. J. Mol. Liq. 2023, 370, 121005. [Google Scholar] [CrossRef]
- Khankhasaeva, S.T.; Badmaeva, S.V.; Ukhinova, M.V. Adsorption of diclofenac onto Fe2O3-pillared montmorillonite: Equilibrium, kinetics and thermodynamic studies. J. Mol. Liq. 2023, 380, 121725. [Google Scholar] [CrossRef]
- Alahabadi, A.; Shomoossi, N.; Riahimanesh, F.; Salari, M. Development of AC/ZnO/Fe2O3 for efficiently adsorptive removal of Tetracycline from water environment: Isotherm, kinetic and thermodynamic studies and adsorption mechanism. Biomass Conv. Biorefin. 2024, 14, 17499–17517. [Google Scholar] [CrossRef]
- Al-Ghouti, M.A.; Da, D.A. Guidelines for the use and interpretation of adsorption isotherm models: A review. J. Hazard. Mater. 2020, 393, 122383. [Google Scholar] [CrossRef] [PubMed]
- Deb, A.; Debnath, A.; Bhattacharjee, N.; Saha, B. Ultrasonically enhanced dye removal using conducting polymer functionalised ZnO nanocomposite at near neutral pH: Kinetic study, isotherm modelling and adsorbent cost analysis. Int. J. Environ. Anal. Chem. 2022, 102, 8055–8074. [Google Scholar] [CrossRef]
- Tunio, A.; Balouch; Talpur, F.N.; Alveroglu, E.; Jagirani, M.S.; Safdar, M.; Mustafai, F.A. Lipase Enzyme Immobilized Magnetic NanoAdsorbent: A promising candidate to efficiently remove chromium from aqueous media. Mater. Chem. Phys. 2024, 323, 129632. [Google Scholar] [CrossRef]
- Shaba, E.Y.; Tijani, J.O.; Jacob, J.O.; Suleiman, M.A.T.; Mathew, J.T. Preparation, characterisation, adsorptive and antimicrobial properties of Fe3O4@ SiO2@ ZnO nanocomposite. Colloids Surf. A Physicochem. Eng. Aspects 2024, 686, 133190. [Google Scholar] [CrossRef]
- Islam, R.; Faysal, S.M.; Amin, R.; Juliana, F.M.; Islam, M.J.; Alam, J.; Asaduzzaman, M. Assessment of pH and total dissolved substances (TDS) in the commercially available bottled drinking water. IOSR-JNHS 2017, 6, 35–40. [Google Scholar] [CrossRef]
- Szabolcsik-Izbéki, A.; Bodnár, I.; Fábián, I. The removal of pollutants from synthetic bathroom greywater by coagulation-flocculation and filtration as a fit-for-purpose method. J. Environ. Chem. Eng. 2024, 12, 114250. [Google Scholar] [CrossRef]
- Li, X.; Ji, M.; Nghiem, L.D.; Zhao, Y.; Liu, D.; Yang, Y.; Tran, N.H. A novel red mud adsorbent for phosphorus and diclofenac removal from wastewater. J. Mol. Liq. 2020, 303, 112286. [Google Scholar] [CrossRef]
- Van Tran, T.; Nguyen, D.T.C.; Le, H.T.; Vo, D.V.N.; Nanda, S.; Nguyen, T.D. Optimization, equilibrium, adsorption behavior and role of surface functional groups on graphene oxide-based nanocomposite towards diclofenac drug. J. Environ. Sci. 2020, 93, 137–150. [Google Scholar] [CrossRef]
- Larous, S.; Meniai, A.H. Adsorption of Diclofenac from aqueous solution using activated carbon prepared from olive stones. Int. J. Hydrogen Energy 2016, 41, 10380–10390. [Google Scholar] [CrossRef]
- Pourzamani, H.; Hajizadeh, Y.; Mengelizadeh, N. Application of three-dimensional electrofenton process using MWCNTs-Fe3O4 nanocomposite for removal of diclofenac. Process Saf. Environ. Prot. 2018, 119, 271–284. [Google Scholar] [CrossRef]
- Aphane, M.E.; Doucet, F.J.; Kruger, R.A.; Petrik, L.; van der Merwe, E.M. Preparation of sodium silicate solutions and silica nanoparticles from South African coal fly ash. Waste Biomass Valori. 2020, 11, 4403–4417. [Google Scholar] [CrossRef]
- Razavi, R.; Amiri, M.; Salavati-Niasari, M. Eco-friendly synthesis by Rosemary extract and characterization of Fe3O4@ SiO2 magnetic nanocomposite as a potential adsorbent for enhanced arsenic removal from aqueous solution: Isotherm and kinetic studies. Biomass Conv. Bioref. 2024, 14, 5109–5123. [Google Scholar] [CrossRef]
- De Luna, M.D.G.; Budianta, W.; Rivera, K.K.P.; Arazo, R.O. Removal of sodium diclofenac from aqueous solution by adsorbents derived from cocoa pod husks. J. Environ. Chem. Eng. 2017, 5, 1465–1474. [Google Scholar] [CrossRef]
- Munonde, T.S.; Maxakato, N.W.; Nomngongo, P.N. Preparation of magnetic Fe3O4 nanocomposites modified with MnO2, Al2O3, Au and their application for preconcentration of arsenic in river water samples. J. Environ. Chem. Eng. 2018, 6, 1673–1681. [Google Scholar] [CrossRef]
- Pereira, L.; Castillo, V.; Calero, M.; González-Egido, S.; Martín-Lara, M.A.; Solís, R.R. Promoting the circular economy: Valorization of a residue from industrial char to activated carbon with potential environmental applications as adsorbents. J. Environ. Manag. 2024, 356, 120753. [Google Scholar] [CrossRef]
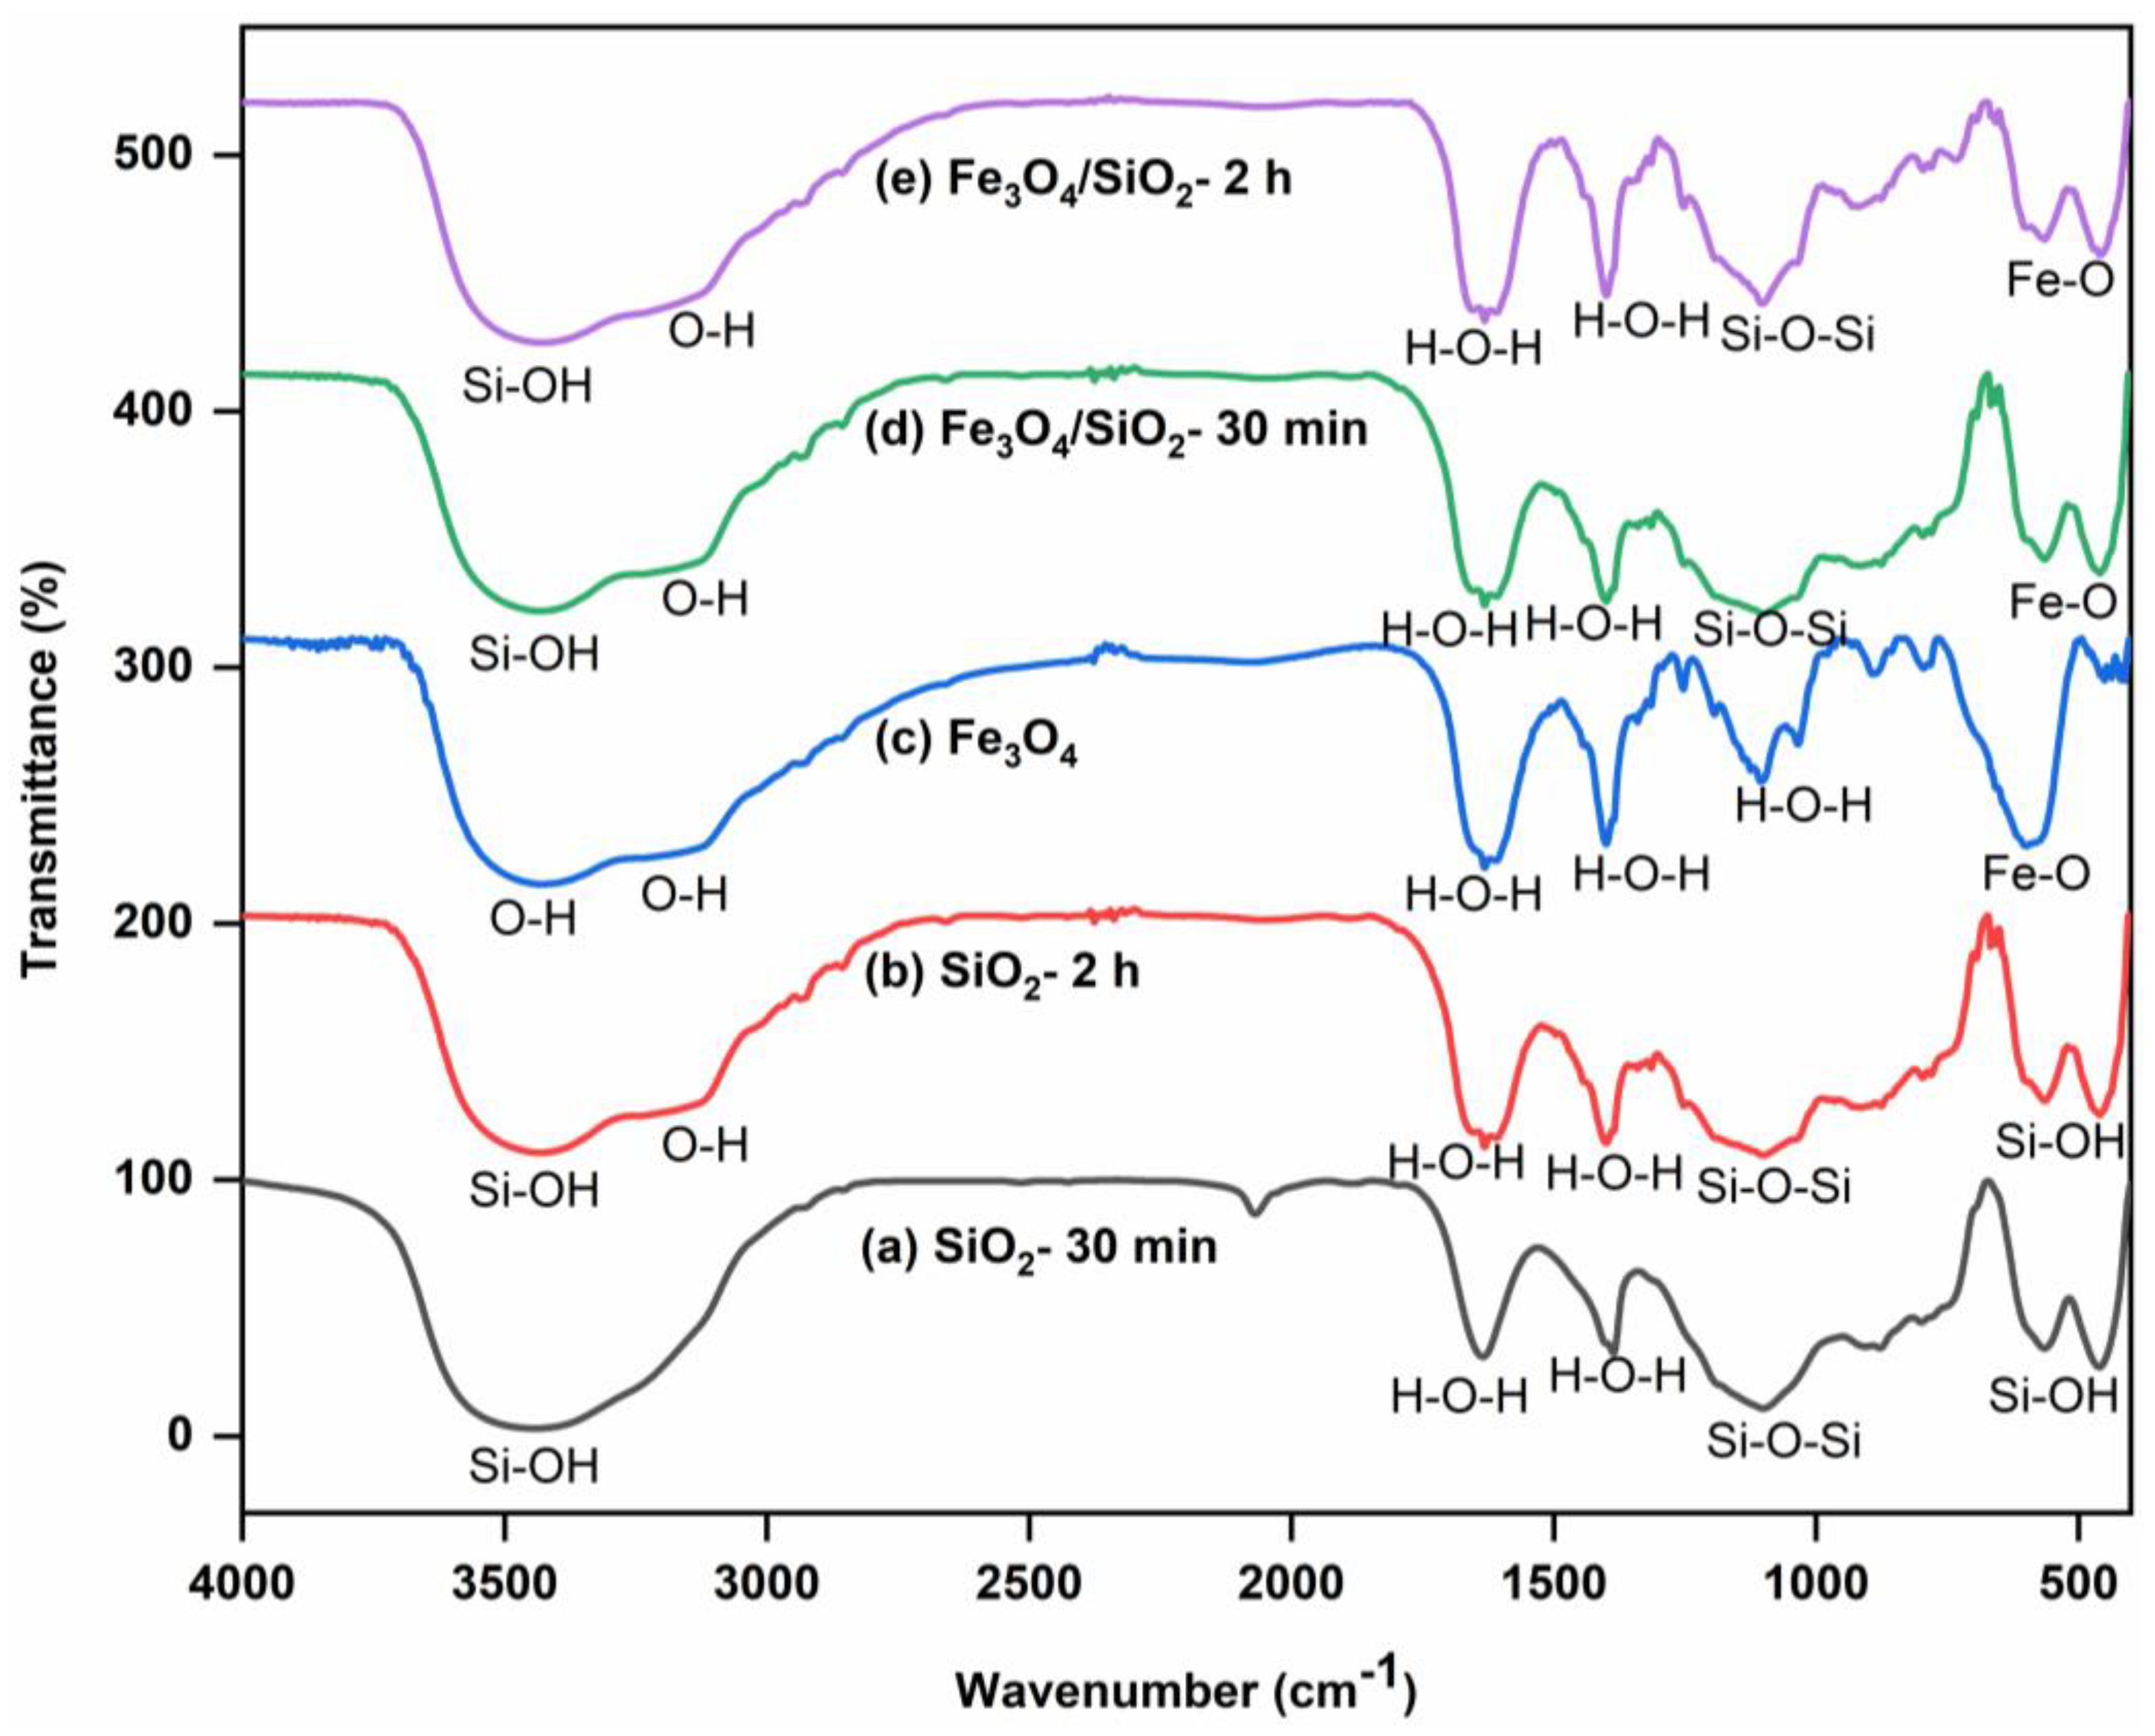


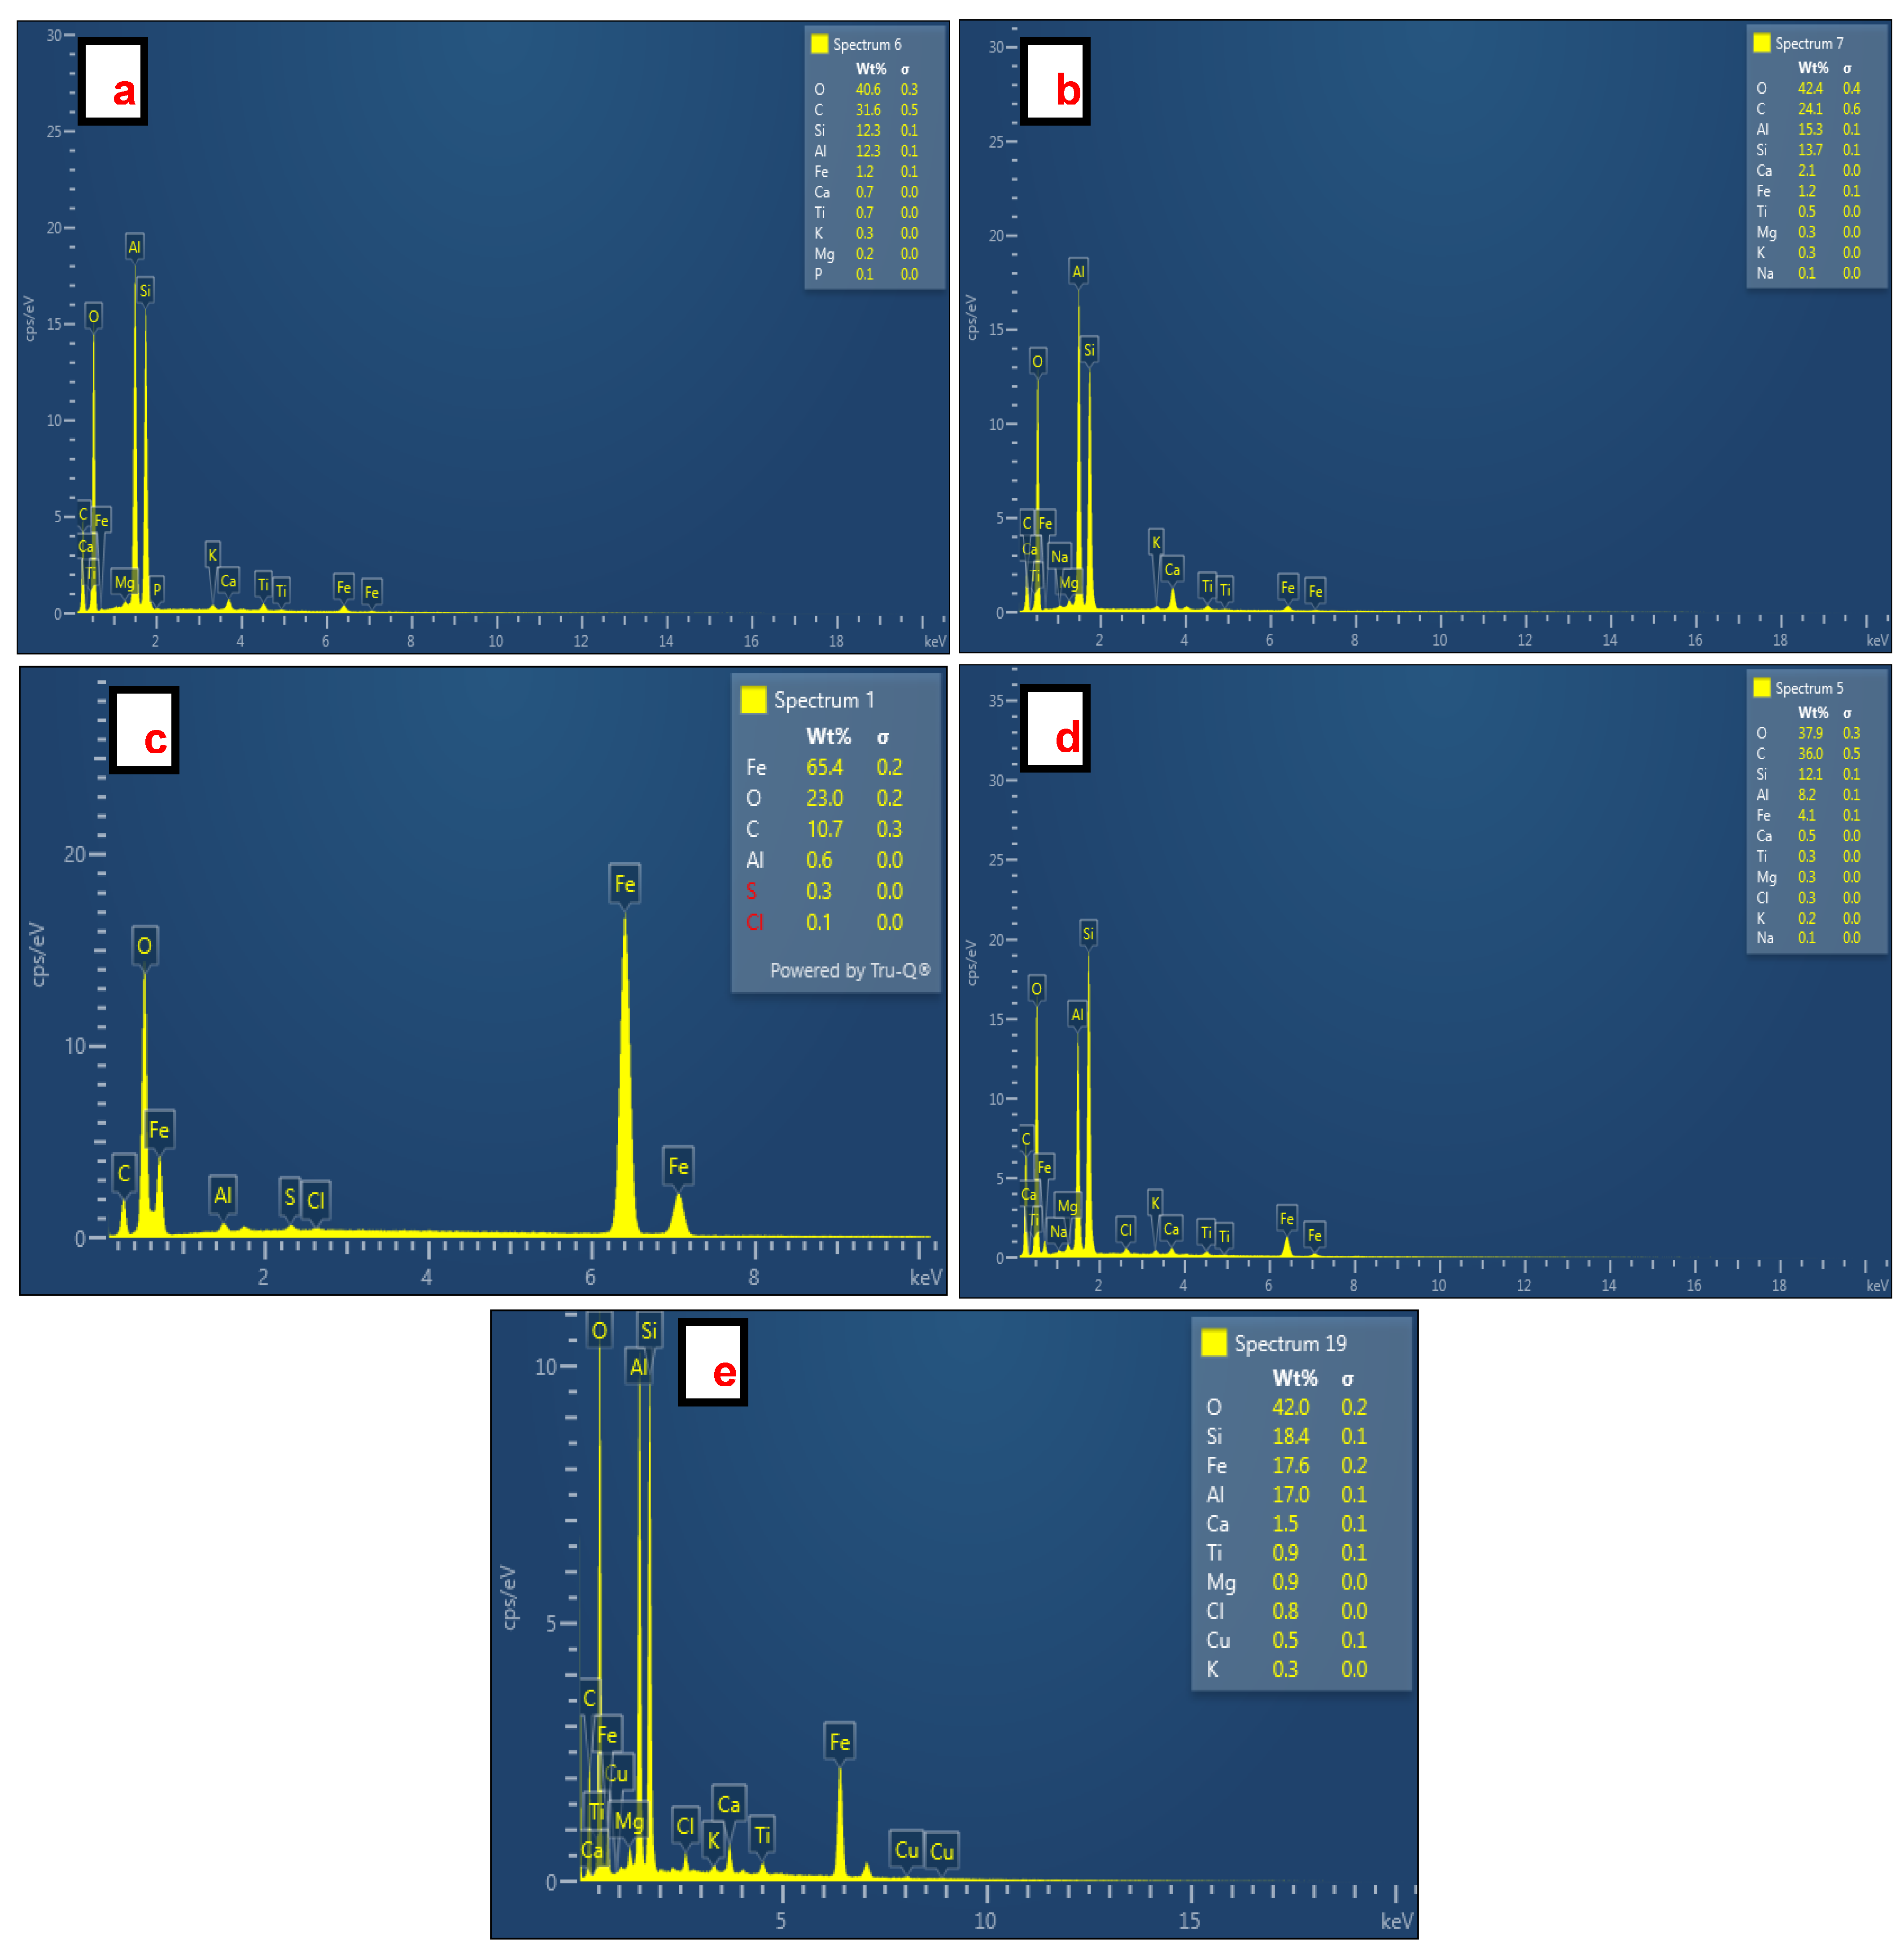


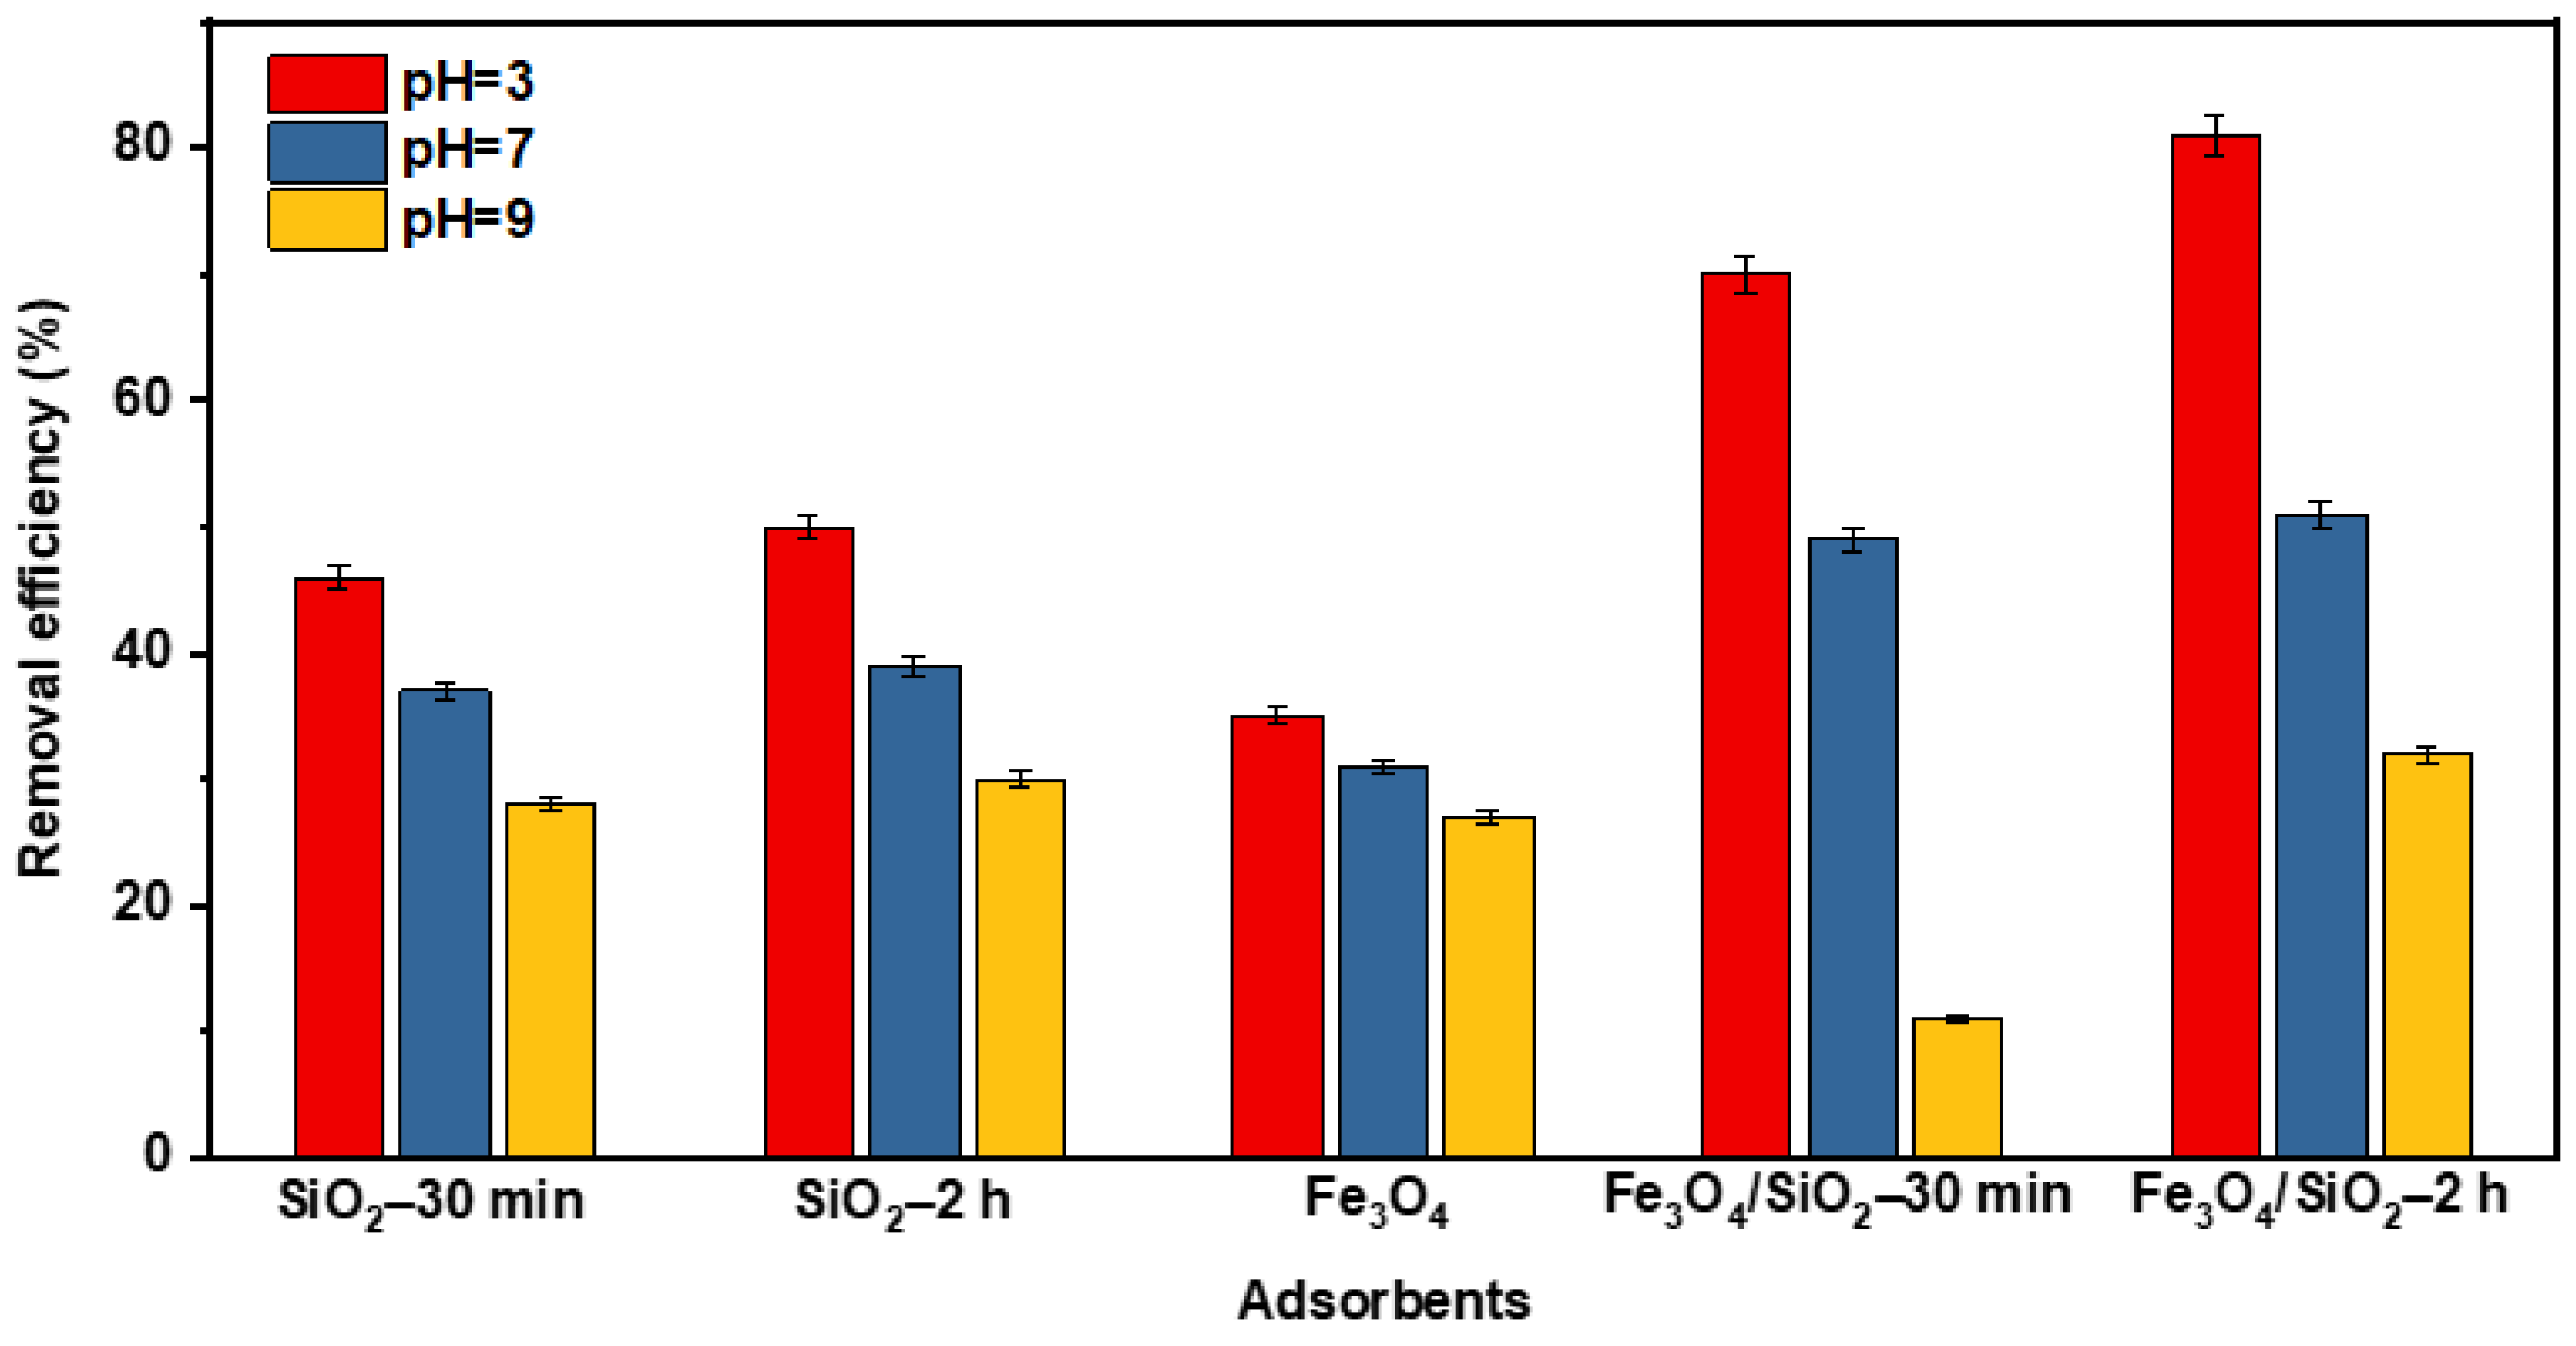


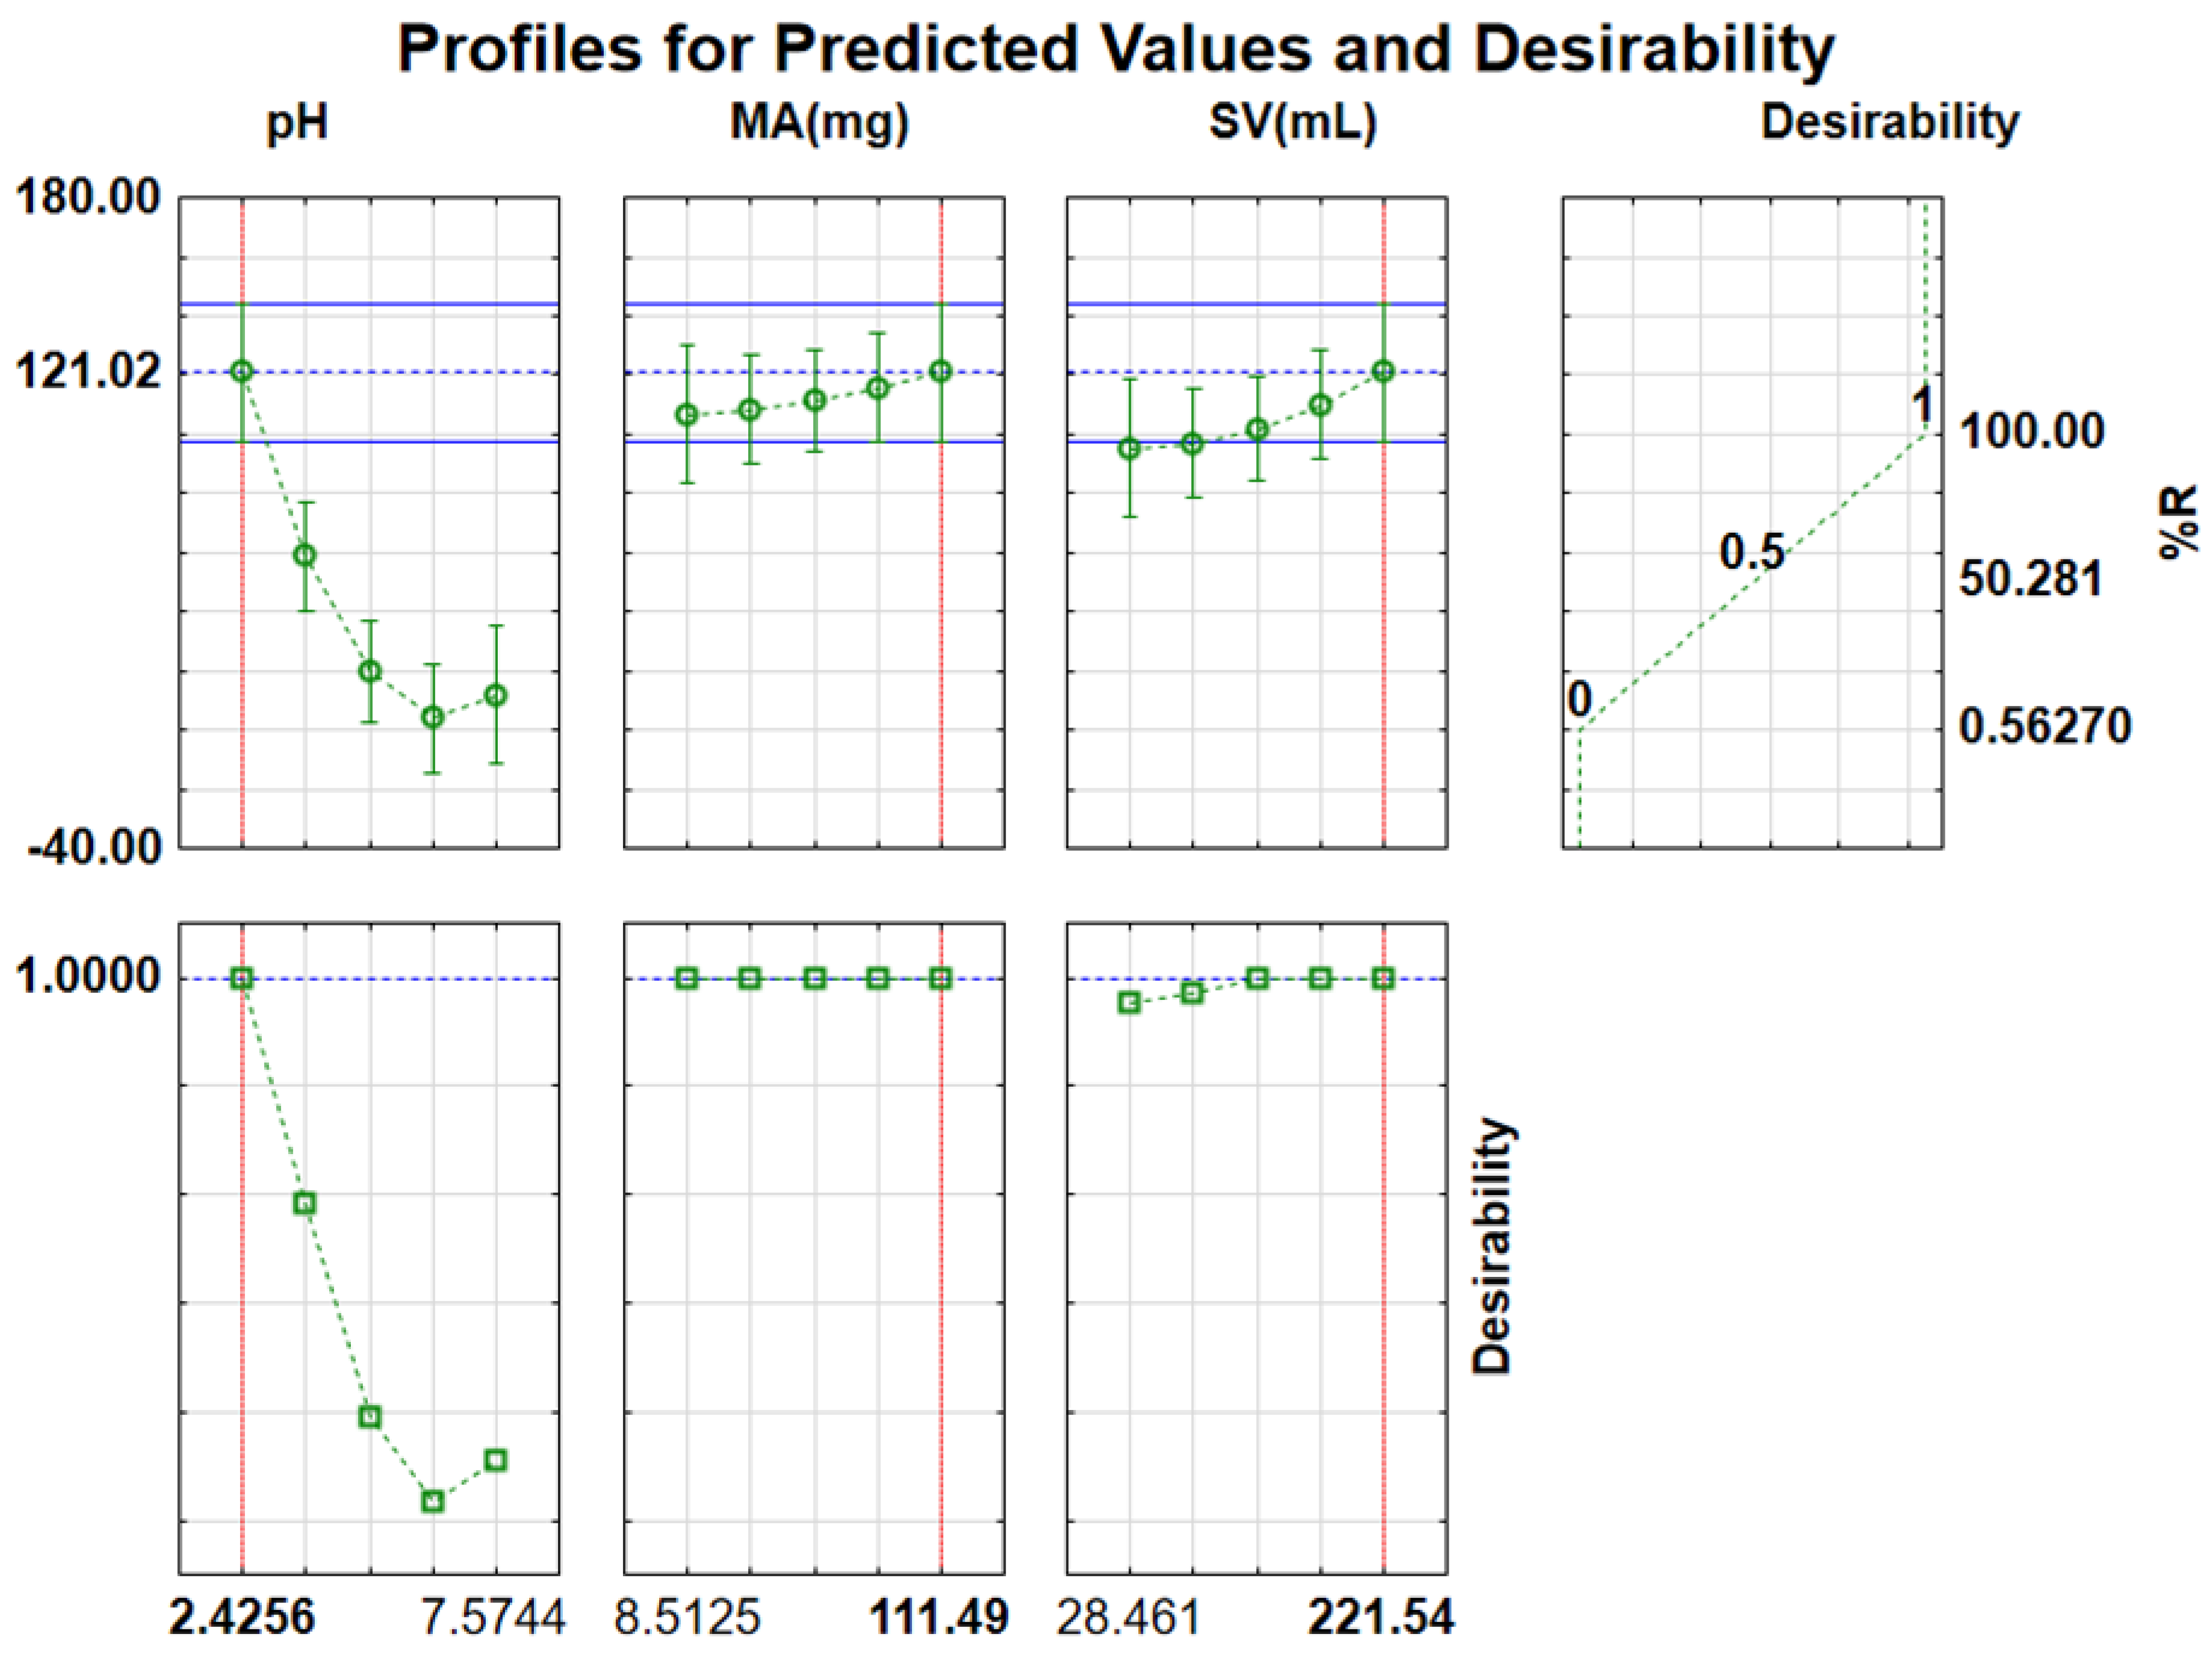

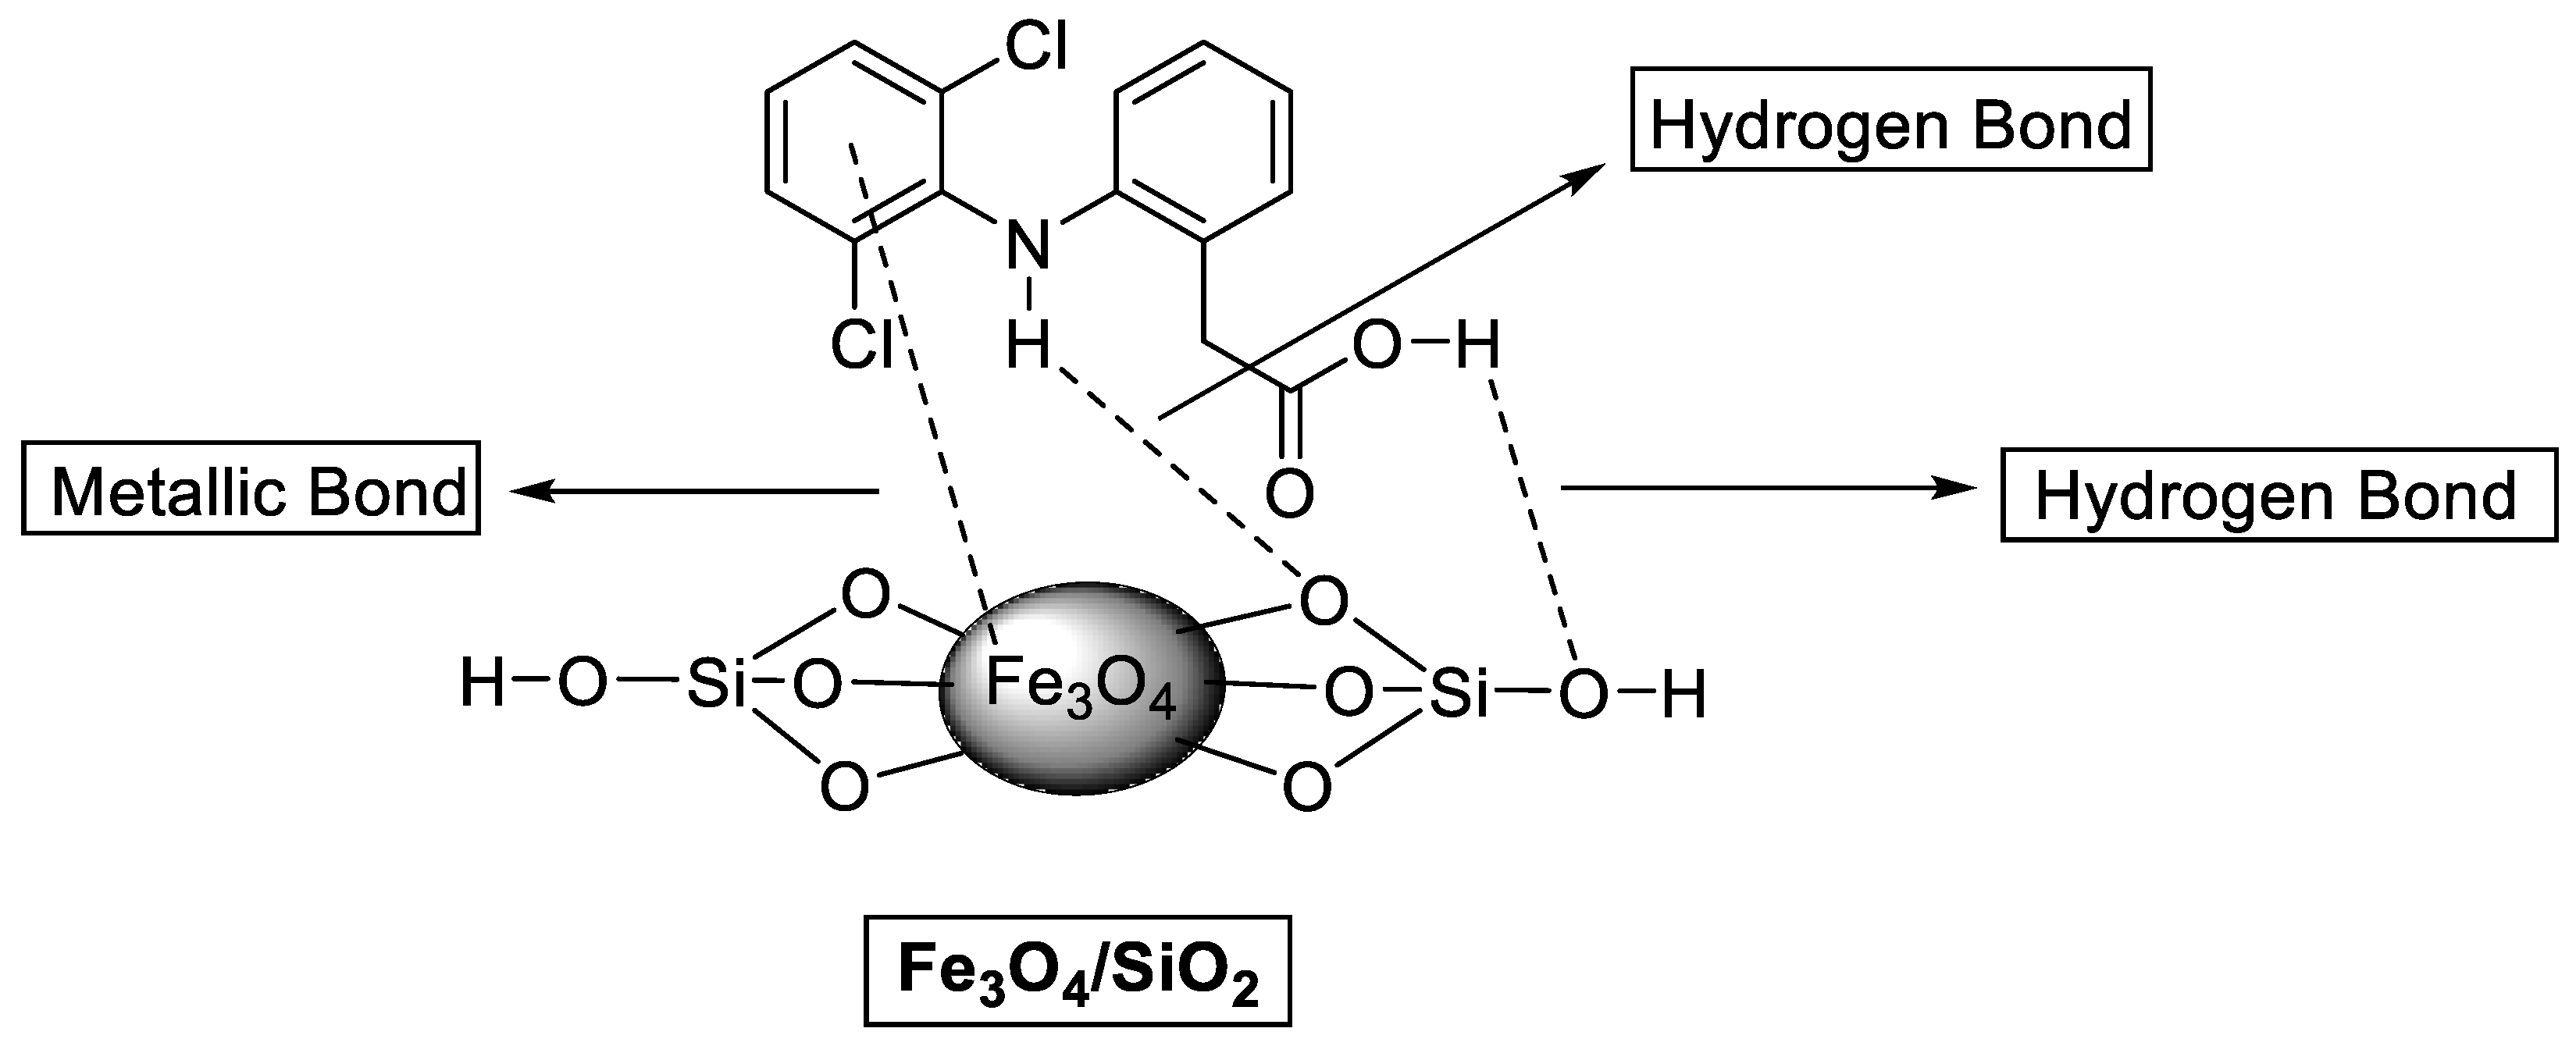

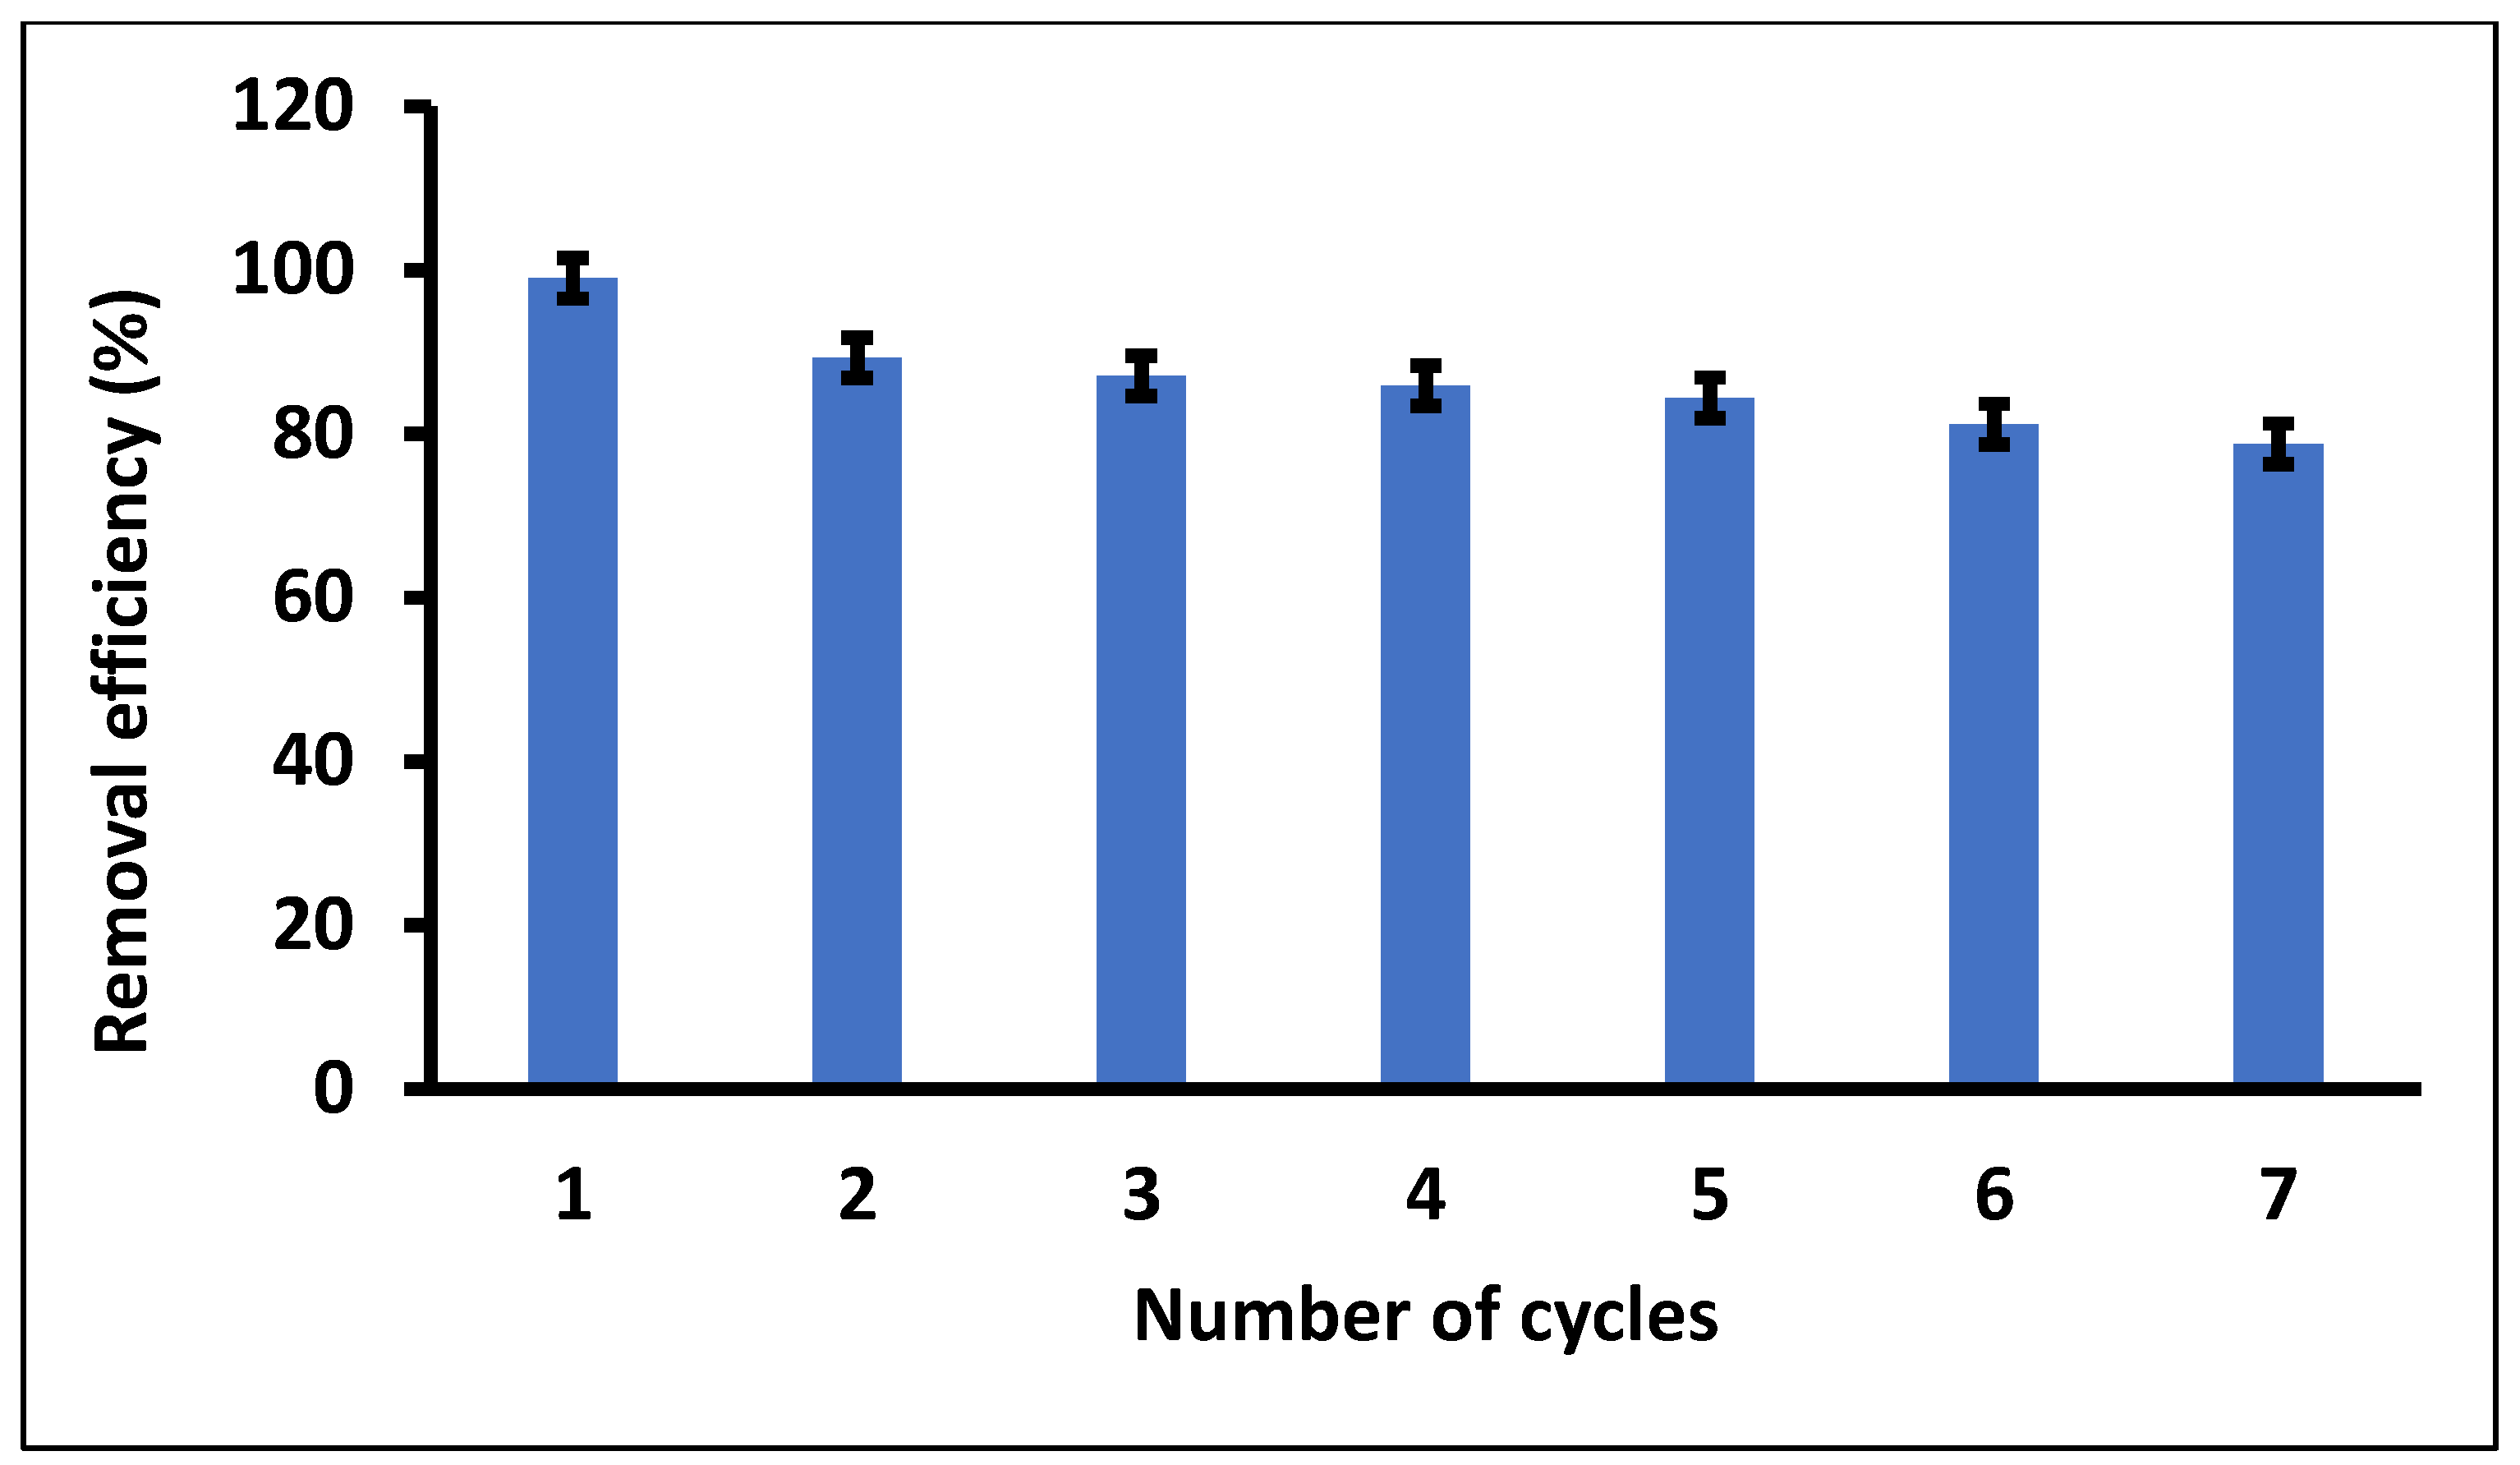
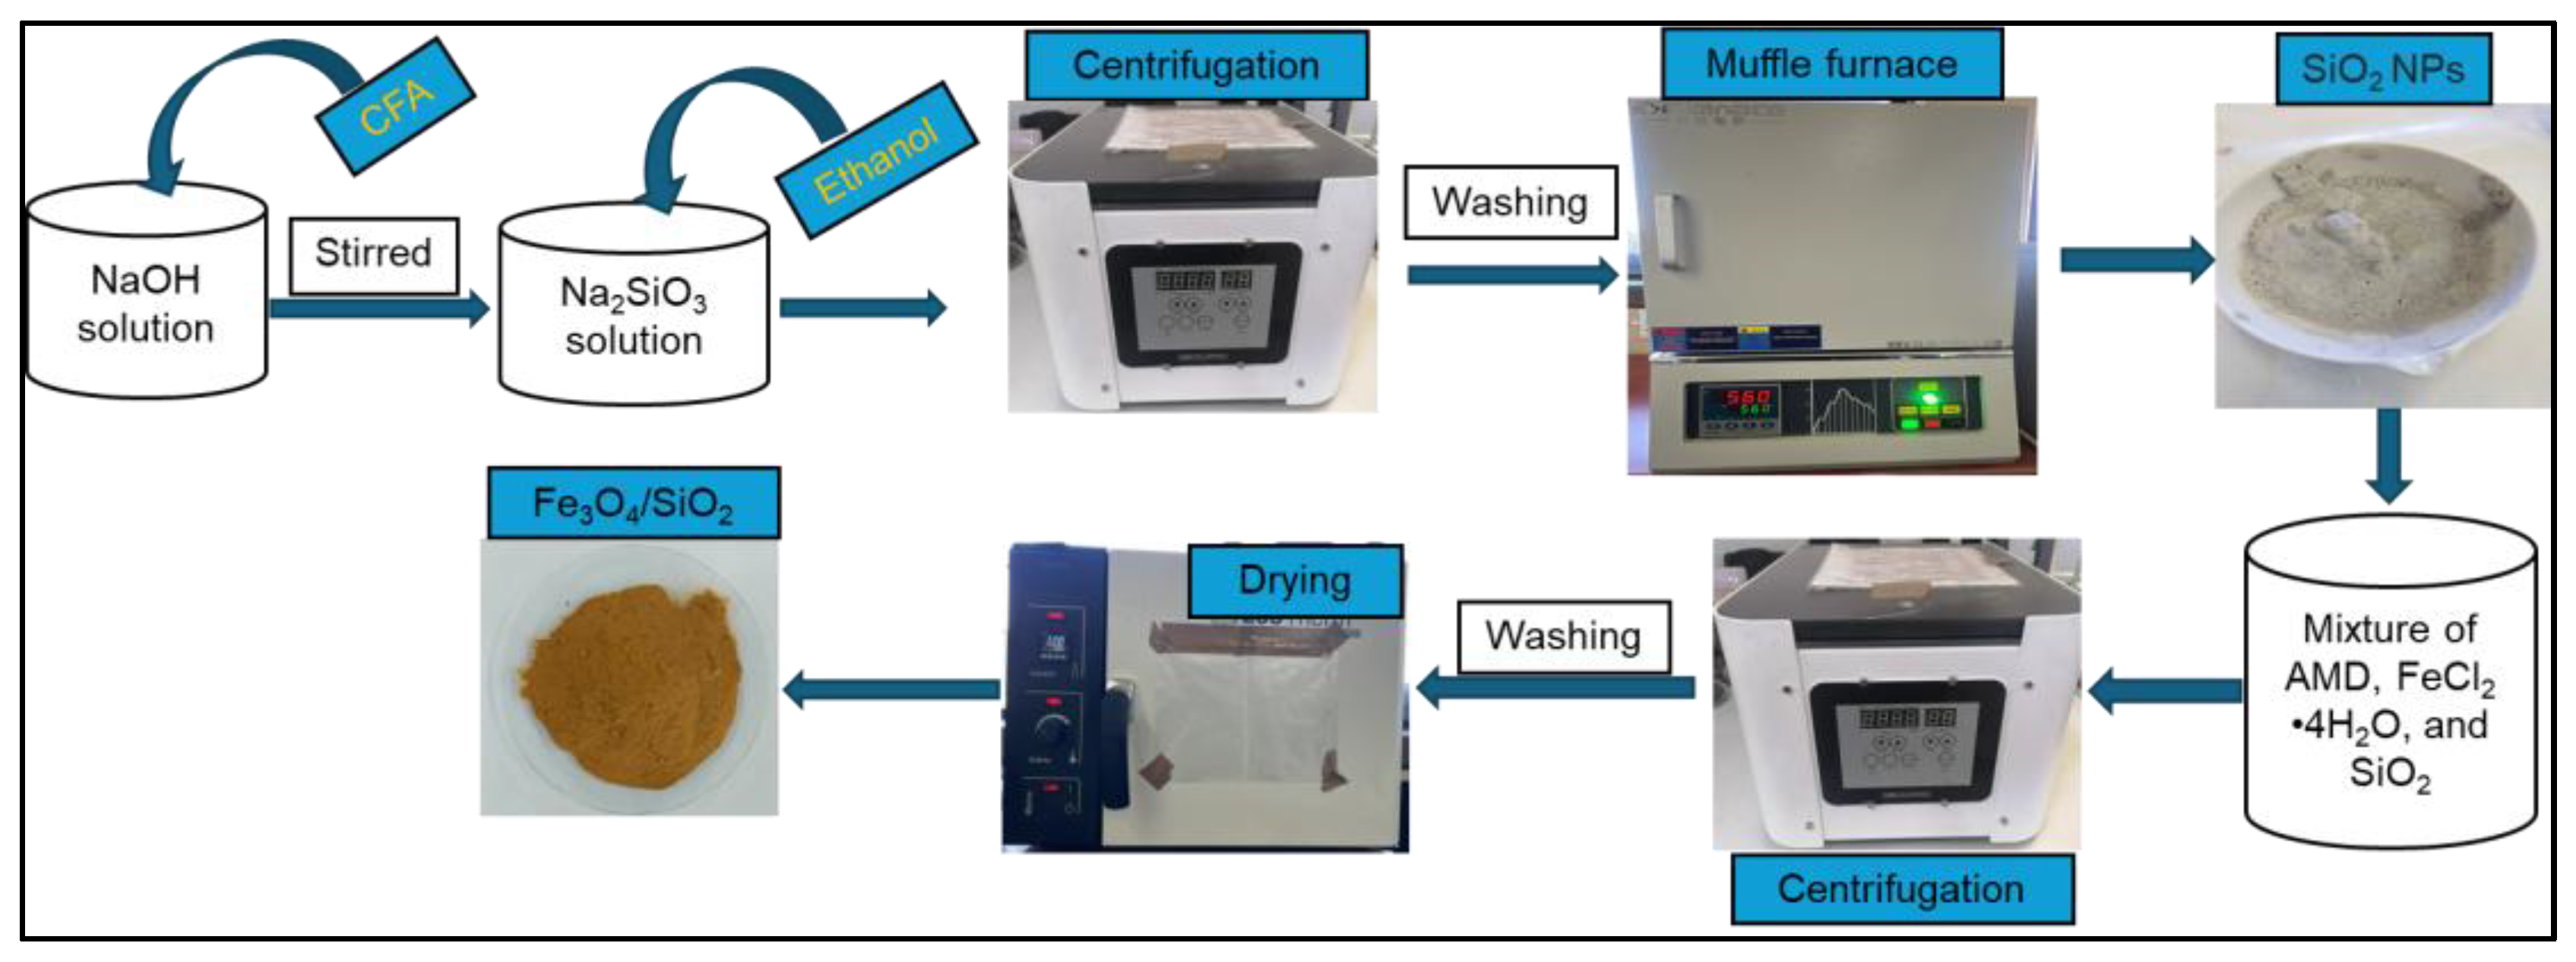
Disclaimer/Publisher’s Note: The statements, opinions and data contained in all publications are solely those of the individual author(s) and contributor(s) and not of MDPI and/or the editor(s). MDPI and/or the editor(s) disclaim responsibility for any injury to people or property resulting from any ideas, methods, instructions or products referred to in the content. |
© 2025 by the authors. Licensee MDPI, Basel, Switzerland. This article is an open access article distributed under the terms and conditions of the Creative Commons Attribution (CC BY) license (https://creativecommons.org/licenses/by/4.0/).