Abstract
Redox flow batteries provide high flexibility and scalability for large-scale energy storage systems due to their safety, low cost and decoupling of energy and power. While typical flow frame designs usually assume all parts are standard, the industry can suffer from irregularity and manufacturing tolerances of cell components, such as the shape or dimensions of the flow frame and porous electrode. This paper evaluates the impact of side gaps and porosity differences of the graphite felt due to irregularity and manufacturing tolerances on the electrolyte flow in the active cell areas. A three-dimensional hydraulic model with parameterised multi-cell stack geometry has been developed in COMSOL to compare the cell velocity distributions and pressure losses of a vanadium redox flow battery with flow-through electrodes. The results indicate that the side gaps and porosity segments can result in preferential flow within low-resistance areas, leading to significantly lower flow rates for other cell areas compared with standard flow frames. Proposed countermeasures of adjusting channel locations and applying dimples protruding into the cell cavity from the flow frame show good potential to avoid stagnant zones and maintain theoretical flow rates for the active cell areas.
1. Introduction
Increasing growth in renewables, together with the intermittent nature of solar and wind generation, has dramatically increased the need for large-scale energy storage to alleviate the grid’s potential for instability. A leading contender for large-scale, long-duration energy storage is the vanadium redox flow battery (VRFB) system pioneered by Skyllas-Kazacos et al. at UNSW Australia in the 1980s. The system provides high efficiency, low cost, no fire/explosion hazard and a long-demonstrated cycle life [1,2,3]. Flow battery systems store all energy in liquid electrolytes, which are contained in external reservoirs. The electrolytes are circulated through the battery stacks, which either charge the electrolyte or extract power from the electrolytes during the discharge process. The power and capacity can be varied independently, where the electrolyte volume determines the system’s capacity, and the size and number of battery stacks determine the system’s power. The decoupling of capacity and power provides high flexibility and scalability for large-scale energy storage systems.
The vanadium redox flow battery system utilises vanadium ions supported in sulphuric acid in the positive and negative electrolytes, as vanadium ions can exist at four different oxidation states. In the negative electrolyte, the V(II)/V(III) redox couple is used, and in the positive electrolyte, the V(IV)/V(V) redox couple is utilised [4]. Using the same metallic ion in both electrolytes negates issues due to cross-contamination as periodic remixing of the electrolytes restores system capacity and provides an indefinite life for the electrolytes. The half-cell reactions for the VRFB are described below, with a schematic of a 3-cell VRFB illustrated in Figure 1.
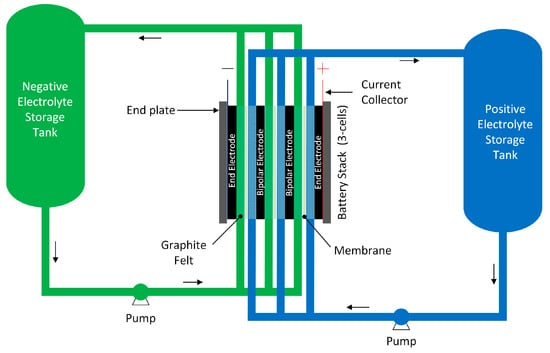
Figure 1.
Schematic of a 3−cell stack in vanadium redox flow battery system.
Negative:
Positive:
While the standard cell potential is 1.26 V, systems employing approximately 2 M vanadium in 5 M sulphuric acid will have an open circuit voltage of approximately 1.4 V at a 50% state of charge [4]. The overall cell voltage is given by:
where and are the cathode and anode half potentials (V), is the activation overpotential being the additional potential required to overcome the activation energy barrier for the reactions in both the cathode and anode (V), is the concentration overpotential, which is the additional potential needed to overcome mass transport limitations at the electrode/electrolyte interface at both the cathode and anode (V), is the current density (A cm−2), is the ohmic resistance of the cell for a specific electrode area (Ω cm2).
As flow battery systems typically utilise flow-through porous graphite felt with high surface area for electrode materials to facilitate electron transfer at the electrode/electrolyte interface, the activation overpotential becomes insignificant [1]. Concentration overpotential is affected by the electrolyte flow rate. It is more evident at high states of charge during charging and low states of charge during the discharge process when the concentration of reactants is low. For a given current, the rate of transfer of reactants to the electrode surface may be less than the transfer of electrons across the electrode/electrolyte interface resulting in a high concentration overpotential. For optimal performance, it is critical to supply enough reactants to the electrode/electrolyte interface across the entire cell active area and all cells within a battery stack. In addition, flow uniformity across the entire cell area is critical to avoid any local regions of inadequate flow, which could contribute to high localised concentration overpotential or undesirable gassing side reactions.
Flow battery technology has been widely investigated and developed over decades by researchers worldwide [5]. Researchers have developed numerical models from the early 1D to the current 2D or 3D to predict and optimise the performance of VRFB systems. In terms of 1D models, Tang et al. proposed a lumped VRFB stack model to optimise the flow rates and system efficiency [1], and Barton et al. developed a more comprehensive 1D VRFB stack model to facilitate high-throughput system-level analysis [6]. Recent research by Mourouga et al. also presented 0D models for dimensionality reduction to provide faster predictions for battery performance, such as cell voltage and power density in terms of current density or state-of-charge [7], whose model can also be used for membrane optimisation [8].
In addition to the well-established 1D model focusing on the stack and system performance, 2D or 3D models have also experienced rapid growth in detailing the electrolyte flow and concentrations within battery cells. Shah et al. proposed a transient 2D model based on mass, momentum and charge conservation and a kinetic description for vanadium reactants [9]. The model was then extended to include the thermal effects by adding the energy balance equation [10], with extra consideration of the gassing side reactions, such as the hydrogen evolution [11] and oxygen evolution [12]. Shah et al. also presented a dynamic unit cell model relating the process time and conditions to the state of charge (SOC) [13]. With Shah’s transient 2D models, Ma et al. extended the stationary 2D cell model proposed by You et al. [14] to a stationary 3D model for a negative half cell of VRFB [15]. Later researchers, such as Gurieff et al., adapted this 3D half-cell model to optimise the flow batteries with flow-through porous electrodes [16,17]. To extend the cell model to a stack level, Darling et al. developed a comprehensive 2D stack model in conjunction with the traditional equivalent-circuit stack models, focusing on edge corrosion due to shunt currents [18]. Moreover, Zhang et al. reported a coupled 2D stack model for VRFB with flow-through electrodes considering the nonuniformity of electrolytes in the flow frame [19].
Recent research also showed interest in flow-by electrodes with flow frame designs to intensify the flow battery performance [20,21,22,23]. Aaron first proposed a zero-gap serpentine flow field with carbon paper, considerably enhancing the power density of VRFB with a potentially lower cost [24]. Messaggi et al. developed a 3D model with experimental validation to investigate the performance of serpentine and interdigitated flow channels, pointing out that the serpentine distributor performs better than the interdigitated distributor despite the lower pressure drops and more uniform reaction rate in the interdigitated design [25]. The latest study extended the 3D model to improve the serpentine flow frame by adding baffles [26] with another research analysing the effect of the uneven electrode deformation in parallel, serpentine and interdigitated flow field designs [27]. Although the cell or flow frame designs can be different, the principles of their 2D/3D modelling are common.
Flow field optimisation is one of the crucial aspects of VRFB, which can improve flow uniformity, battery metrics and efficiencies [28,29,30], with many comparative studies performed between different flow field designs. Xu et al. compared the performance of flow-by electrodes with serpentine and parallel flow channels to flow-through electrodes numerically [31] and experimentally [32], demonstrating slightly higher round-trip and energy efficiencies for the serpentine flow field. Similarly, Kumar and Jayanti experimentally compared the serpentine, interdigitated and conventional (flow-through) channels, showing the highest efficiency for the serpentine design [33]. However, when comparing the conventional flow-through electrode with the interdigitated and serpentine flow-by porous electrodes using both experiments and modelling, Maurya et al. pointed out that the performance gap between flow field designs can vary significantly under certain conditions, which should be evaluated case by case [34].
Even though the flow-by electrode with flow field design can be a promising development field, flow-through porous electrodes using graphite felt are still dominantly used for commercial-scale applications. For flow-through electrodes, typical flow frame designs usually assume that the felts are attached tightly to the cells’ cavity walls, while in practice, manufacturing tolerances or irregularities can lead to bypass flows in the side gaps between the felt and the cavity walls. From the authors’ knowledge, no available literature to date has considered the side gaps for flow-through porous electrodes. Moreover, porosity differences or felt thickness variations due to the manufacturing tolerances of the porous carbon felt electrodes may further lead to low-flow-rate regions or dead zones within the cells, potentially resulting in localised concentration overpotential or undesirable gassing side reactions. No literature has examined this practical problem due to its uncertainty by nature.
To this end, this paper evaluates the effect of side gaps and porosity differences of the flow-through porous graphite felt due to the irregularity and manufacturing tolerances by comparing the cell velocity distributions and pressure losses using the 3D hydraulic stack model developed in COMSOL. The model focuses on the hydraulic aspects to make it easier to scale up to a stack level, considering flow-related electrochemical factors. The results indicate that the side gaps and porosity segments can result in preferential flow within low-resistance areas, leading to significantly lower flow rates for other active cell areas. Proposed countermeasures of slightly oversizing the felt, applying a higher inlet flow rate, adjusting the vertical channels towards the centre and designing multiple dimples in the flow frame to protrude into the two edges of the cell cavity show good potential to reduce stagnant zones and maintain theoretical flow rates for the active cell areas.
2. Mathematical Model
A three-dimensional hydraulic stack model has been developed to determine the flow of electrolytes in various regions within a battery stack to understand how a particular battery stack design will perform or operate. COMSOL Multiphysics and High-Performance Computing (HPC) platform, Katana, have been used for efficient numerical modelling and simulation of the flow in the stack-manifold arrangements, with the velocity distributions and pressure losses of different components in the battery stack determined. COMSOL Multiphysics has advantages with its advanced CFD and Battery Design Modules, which provide a user-friendly graphical interface to facilitate the modelling of redox flow batteries, while Katana can offer sufficient computational resources for efficient multi-task simulations of different scenarios. COMSOL Multiphysics utilises the finite element method (FEM) to discretise the geometry into mesh elements defined by a set of shape functions. The physics-controlled mesh has been applied for the simulation, with the Newton–Raphson iteration utilised to approximate the solutions to the physical problem with the provided boundary conditions until the solution residuals satisfy the convergence criteria.
2.1. Assumptions
The following assumptions have been made to develop the 3D hydraulic stack model in COMSOL:
- The electrolyte is an incompressible Newtonian fluid fully filled in the system with constant volume, density and viscosity.
- The electrolyte flow is within the laminar regime.
- The electrolyte and porous electrode are assumed to be isotropic and homogeneous.
- The electrolyte is assumed to be balanced, so no ion diffusion or water transport across the membrane is considered.
- Gassing side reactions, self-discharge reactions and shunt currents are assumed to be negligible.
- Constant temperature is assumed for the system with the heat transfer and thermal effects neglected.
- The gravitational effect of electrolytes is assumed to be negligible.
2.2. Geometry
A 3D parameterised stack geometry has been built with an interface that allows input parameters to be varied for different system designs and chemistries. The geometric parameters, such as the number of cells, cell size, manifold and channel sizes, are fully user-defined. The inlet manifolds and channels sit at the bottom, while the outlet manifolds and channels are at the top of the stack. Between the inlet and outlet flow frames is a cell cavity with porous felt, which can be further modified to include the secondary manifolds before and after the felt. The secondary manifold is a void chamber between the vertical channels and the graphite felt, commonly used in research or industrial cell designs to improve the flow uniformity within the felt. When multiple vertical channels are considered in the design, the length of the horizontal channel directly connected to the vertical channels has been fixed at the entire cell width to cater for any number of vertical channels. The side gaps on two sides of the felt are an undesirable feature that could arise due to irregularities, while felt segments are used to define porosity difference due to felt thickness variations within manufacturing tolerances, which can typically be up to ±0.5 mm. Figure 2 shows the parameterised 3D geometry examples of a single cell and a 10-cell battery stack with the abovementioned geometric features. Depending on the research requirements, researchers can simulate different scenarios to predict and optimise the hydraulic performance of battery cells.
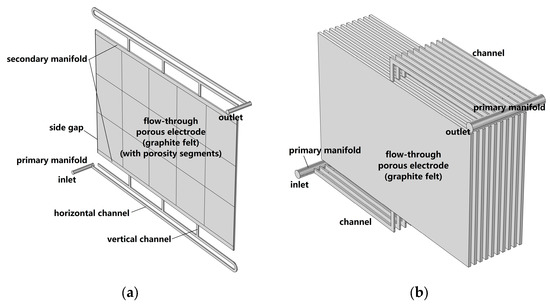
Figure 2.
Parameterised geometry of (a) a single cell with primary manifolds, horizontal channels, vertical channels, secondary manifolds, side gaps and flow−through porous electrode with felt segments; (b) a 10−cell battery stack with primary manifolds, channels and flow−through porous electrode.
2.3. Governing Equations
When the Reynolds number, the dimensionless ratio of inertial forces to viscous forces in a fluid, is lower than a critical value, a flow tends to be dominated by laminar flow. As the Reynolds number increases to a higher value, the flow tends to have more disturbances, leading to a transition to turbulent flow. The critical Reynolds number varies with physical models, with the critical value of pipe flow known to be approximately 2000, as a classic example. For pipe flow, the Renolds number is generally defined as:
where is the fluid density (kg m−3), is the volumetric flow rate (m3 s−1), is the dynamic viscosity of the fluid (Pa s), is the cross-sectional area of the pipe (m2), is the hydraulic diameter of the pipe (m), which is the inside diameter for a circular pipe (such as the primary manifolds) or four times the pipe’s internal cross-sectional area divided by the inner perimeter for a rectangular pipe (such as the channels, secondary manifolds and side gaps).
Since the flow rate of the battery stack is properly controlled, the Reynolds number of the flow in the manifolds, channels and porous electrodes tends to be lower than 2000 (typically for vanadium redox flow batteries). In the case of a higher Reynolds number, the standard k-epsilon turbulence model may be applied to model the unsteady flow in the flow frame, which is not detailed in this paper. Laminar flow physics has been selected to model the flow within the battery stack, with the Reynolds numbers of the manifolds, channels and side gaps always checked to be lower than 2000 for the simulations.
Since constant flow rates were applied for the entire state-of-charge (SOC) range of the charging and discharging processes, stationary analyses have been performed to compute the velocity and pressure fields of the single-phase fluid in the laminar flow regime. The equations solved for the single-phase fluid flow in the manifolds, channels and side gaps are the Navier–Stokes equations, which consist of the conservation of momentum:
and the continuity equation for the conservation of mass:
which can be simplified for the stationary incompressible flow:
where is the flow velocity of the electrolyte (), is the density of the electrolyte (kg m−3), is the dynamic viscosity of the electrolyte (Pa s), is the absolute pressure of the electrolyte (Pa), is the temperature (K).
For the electrolyte flow in the porous electrode of the cells, the Fluid and Matrix Properties are applied to the electrode domain to model the flow in porous media. The equations solved for the flow are the Brinkman Equations extended from Darcy’s Law, with the simplified form for the single-phase incompressible flow:
and the conservation of mass:
where the permeability of the porous electrode can be determined by the Kozeny–Carman equation [35]:
where is the effective viscosity (Pa s); is the fibre diameter of the carbon electrode (m); is the Kozeny–Carman constant; is the porosity of the porous electrode.
2.4. Boundary Conditions
No-slip walls are assumed for the wall boundary of the flow frame with no leakage of electrolytes through the surfaces. The outlet is located at the top of the stack, which is assumed to be connected to the atmosphere with zero relative pressure (the reference pressure equals 1 atm), while the inlet is set at the bottom of the stack, assuming the flow is fully developed with the constant applied flow rate calculated from:
where is the applied flow rate of the stack (m3 s−1), is the dimensionless multiplier used to manipulate the magnitude of the flow rate, is the number of cells in the stack, is the theoretical flow rate of a cell (m3 s−1), which is to ensure sufficient reactant for chemical reactions to generate the charging or discharging currents and can be derived from Faraday’s Law of Electrolysis as below:
where is the charging or discharging current (A), is the electrons involved in the reaction, is the Faraday constant, which is 96,485.3 (C mol−1), is the reactant concentration (mol m−3).
Since the simulations use a vanadium redox flow battery with the electrolyte assumed to be balanced (i.e., neglecting the side reactions and ion diffusions or water transport across the membrane), the concentrations of vanadium species can be estimated using the state of charge (SOC) of the battery as follow:
where , , , are concentrations of vanadium ions , , , , respectively (mol m−3), is the total vanadium concentration (mol m−3), is the state of charge of the electrolyte.
Since the simulations utilise constant inlet flow rates, the selected flow rate to supply sufficient reactants for chemical reactions throughout the entire SOC range should be the maximum theoretical flow rate, which can be obtained at the end of the charging or discharging processes when the reactant concentrations are lowest. Thus, the constant applied flow rates at the inlet for the charge or discharge process can be solved by combining Equations (11)–(13), giving:
where and are the SOCupper limit and SOClower limit, respectively.
2.5. System Specifications
The simulations started with the validation (case 1) using similar flow battery configurations as the battery stack from the literature to compare simulated stack pressure drop against the reported experimental values. After the validation of the 3D hydraulic model, this work studied typical flow frame designs (case 2) with the primary manifold, horizontal and vertical channels, secondary manifold and flow-through electrode, assuming the graphite felt is isotropic and homogeneous with no side gaps between the felt and the cell cavity. However, since the industry can suffer from bypass flows in the side gaps between the felt and the cavity due to unavoidable felt and flow-frame irregularities, the impact of the side gaps on the electrolyte flow within the active cell areas has been investigated by adding small gaps attached to two sides of the porous electrode (case 3). Additionally, the effect of the porosity difference within the cells due to the manufacturing tolerances of the felt has also been studied by randomly distributing porosity segments across the felt (case 4) in combination with the effect of the side gaps.
For the validation study (case 1), the battery stack employs a geometry as shown in Figure 2b, with the same electrode (felt) area of 1500 cm2, cell number of 10, cell cavity thickness of 6 mm, an inlet flow rate of 6 L min−1 and total vanadium concentrations of 1.5 M as the early UNSW 1 kW VRFB stack [36] to provide a fair comparison. Since the literature does not precisely specify the flow frame sizes, the rectangular channels are assumed to be 10-mm wide by 3-mm deep (half the cell cavity thickness), with inlet vertical channel length estimated to be 4 cm and horizontal channel length assumed to be half the cell width plus an offset of 4 cm from the manifold. The circular manifold has an estimated length of 17.2 cm, considering the thicknesses of electrodes, membrane and bipolar plates of the ten cells, with the manifold’s cross-sectional area determined by the sum of the channel’s cross-sectional area. The porosity of the graphite felt is assumed to be 0.9, corresponding to a compression ratio of 10% for the graphite felt. Other stack parameters are adapted from the previous UNSW research investigating the same stack [1], with the electrolyte density of 1354 kg m−3, electrolyte viscosity of 4.928 mPa s, electrodes’ fibre diameter of 17.6 μm and Kozeny–Carman constant of 4.28.
In the study cases (cases 2–4), the battery employs a base geometry, as shown in Figure 2a, to investigate the effect of channels, secondary manifold, side gaps and porosity difference of the felt on the electrolyte flow within the flow-through electrode. Since the cells perform similarly across the stack for these hydraulic studies, this work simulates only one cell of the stack to save computational time and resources. Unless specified otherwise, the default cell input parameters, mainly adapted from literature [1,17], have been used to simulate the hydraulic performance of a negative half cell of vanadium redox flow battery, as detailed in Table 1.

Table 1.
Default system specifications used for cases 2–4.
3. Results and Discussion
3.1. Case 1: Validation
Figure 3 shows the 3D pressure plot of the 10-cell stack and the 2D velocity plot on the half-electrode cut plane of the last cell in the stack. As mentioned in Section 2.5, the simulation employed the same electrode (felt) area of 1500 cm2, cell number of 10, cell cavity thickness of 6 mm, flow rate of 6 L min−1 and total vanadium concentrations of 1.5 M as the early UNSW 1 kW VRFB stack with assumptions about some stack features. The simulated stack pressure drop of 73.2 kPa from inlet to outlet, as shown in Figure 3a, correlates well with the pressure observations in the UNSW experimental stack, whose value is approximately 80 kPa [36] under the same flow rate and similar stack conditions. The discrepancy of 8.5% is associated with the unknown parameters of the experimental stack, such as the uncertain permeability of the porous felt electrode and the gravitational effect. Figure 3b presents the simulated non-uniform velocity distribution within the porous felt electrode of the early cell design, mainly due to the single channel layout, which can be improved by flow frame optimisation.
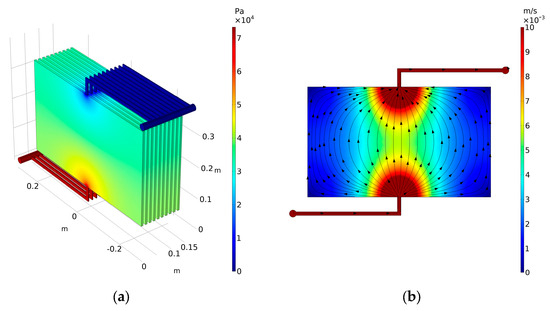
Figure 3.
In the validation case, (a) 3D pressure plot of the 10−cell stack and (b) 2D velocity plot on the half−electrode cut plane of the last cell in the 10−cell stack.
3.2. Case 2: Typical Flow Frame
Typical flow frame designs with the primary manifold, horizontal and vertical channels, secondary manifold and flow-through electrode, which were widely used for the early experimental cell settings in the UNSW laboratory and the redox flow battery industry, have been simulated to determine the configurations of the vertical and horizontal channels together with the secondary manifolds at the inlet and outlet of the porous electrode.
3.2.1. Case 2.1: Horizontal Channels
Initially, three horizontal channels with three vertical channels were simulated for the battery cell, as shown in Figure 4a,b, with a cell pressure drop of 197 kPa. This value can be reduced to 172 kPa by applying two horizontal channels, as shown in Figure 4c,d. However, a shorter channel with a lower pressure drop can be suitable for a single-cell setup but may lead to higher shunt current losses for a multi-cell stack [37]. The actual length of the channels is subject to the number of cells in a stack, which should be evaluated on a case-by-case basis. Trade-offs between the pressure drops and shunt currents should be carefully considered to achieve a high system efficiency [1]. The simulated flow within the active cell area in Figure 4a,c also shows an uneven flow distribution with a noticeable velocity gradient next to the vertical channels and dead zones at four corners and the areas between the vertical channels.
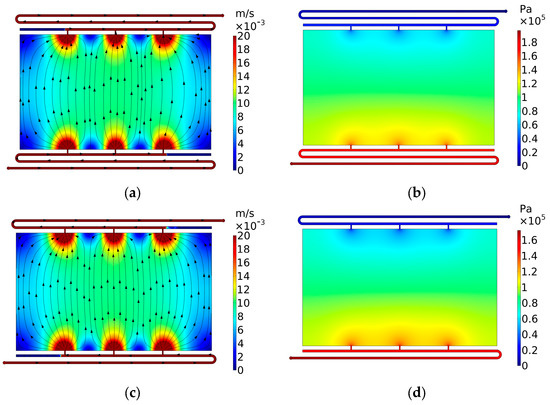
Figure 4.
On the half−electrode cut plane, (a) velocity plot and (b) pressure plot for the simulation with 3 horizontal channels, (c) velocity plot and (d) pressure plot for the simulation with two horizontal channels.
Since the COMSOL Multiphysics utilises the finite element method (FEM) to discretise the geometry into mesh elements defined by a set of shape functions, the simulations should pass a mesh-independence test, which ensures the results remain unchanged as the number of mesh elements increases. Figure 5 presents the pressure profile along the middle line of the cell in Figure 4b under four meshes for the mesh independence study. The study employed the same simulation conditions except for the number of mesh elements. As can be seen, the simulations require at least a fine mesh with 495,617 mesh elements (the red line) to obtain mesh-independent results for the given geometry. The relative error of the pressure between the finer and fine mesh is less than 1%. Thus, this study employs fine mesh for all simulations.
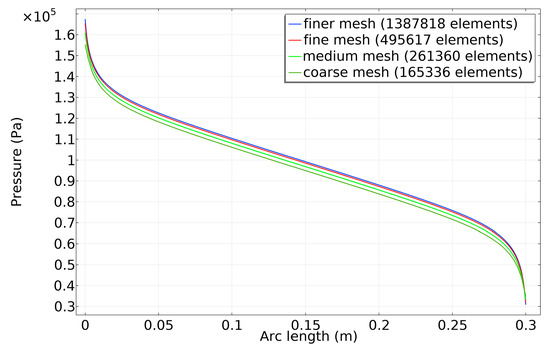
Figure 5.
Pressure profile along the middle line of the cell in Figure 4b under four meshes for the mesh independence study.
3.2.2. Case 2.2: Vertical Channels
To increase the uniformity of electrolyte flow and reduce dead zones within the active cell area, more vertical channels of the same size have been simulated, as shown in Figure 6. As vertical channels increase from 3 to 20, more uniform flows with fewer dead zones can be observed. The dead zones at four corners, as demonstrated in Figure 6a–e, are eventually eliminated when the design includes vertical channels at the two ends of the porous electrode, as demonstrated in Figure 6f.
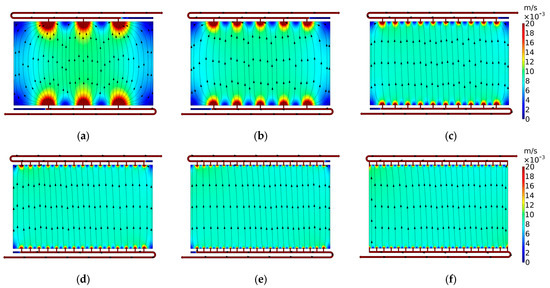
Figure 6.
The velocity plots for the simulations with the vertical channel number of (a) 3, (b) 5, (c) 10, (d) 15, (e) 20 and (f) 20 with vertical channels to two ends.
Furthermore, another benefit of a higher number of vertical channels is the considerably lower cell pressure drop, as illustrated in Figure 7. The cell pressure drops significantly decrease from 172 kPa with three vertical channels to 97.8 kPa with twenty vertical channels. These results indicate that more vertical channels are desirable for both uniform flow distribution and lower cell pressure loss.
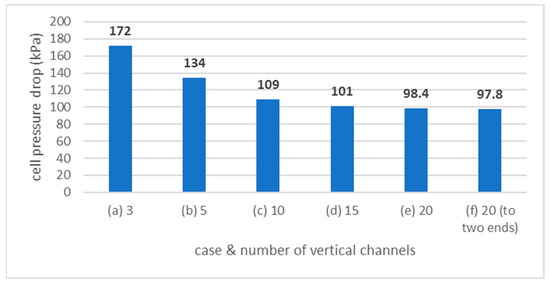
Figure 7.
The cell pressure drops for cases 2.2 vertical channels (a)–(f).
3.2.3. Case 2.3: Secondary Manifold
Rather than attaching the vertical channels directly to the porous electrode, some flow frame designs apply small void chambers to the inlet and outlet of the porous felt electrode. These small void chambers acting like infinite vertical channels are called secondary (distribution) manifolds, commonly used in research or industrial cell designs to improve the flow uniformity within the felt. The electrolyte distribution resulting from introducing a secondary manifold is shown in Figure 8. It can be observed that the flow spreads across the 1-cm secondary manifolds and tends to be uniform within the porous electrode with few dead zones. Since the cell pressure drop moderately descends from 101 kPa with one vertical channel to 90 kPa with twenty vertical channels connected to the secondary manifolds, as demonstrated in Figure 8b,d, more vertical channels attached to the secondary manifolds tend to perform better in reducing pressure loss. Additionally, the cell pressure drop decreases by 8.4 kPa from 98.4 kPa without the secondary manifolds to 90 kPa with the secondary manifolds by comparing Figure 7e with Figure 8d. These simulation results imply that secondary distribution manifolds can be a feasible approach to reduce the cell pressure drop and improve the uniformity of the electrolyte flow within the porous electrode, even though it may need a protective cover to fix the felt and membrane firmly.
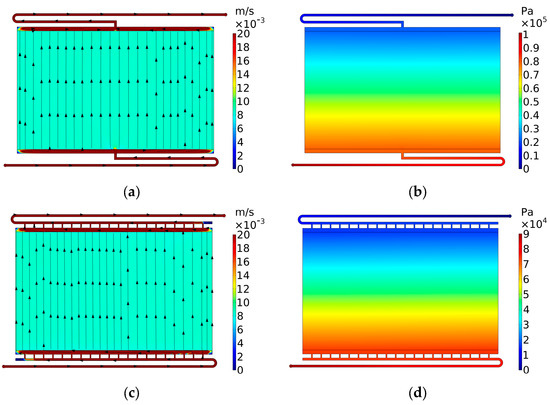
Figure 8.
(a) Velocity plot and (b) pressure plot for the simulation with secondary manifolds and one vertical channel, (c) velocity plot and (d) pressure plot for the simulation with secondary manifolds and 20 vertical channels.
3.3. Case 3: Side Gaps
Since manufacturing irregularities and tolerances can lead to side gaps between the felt and the cavity wall, the effect of the side gaps on the electrolyte flow within the active cell areas has been studied by adding 1-mm gaps to both sides of the porous electrode.
3.3.1. Case 3.1: Side Gaps on Flow Frame
In case 2 above, Figure 6f and Figure 8c demonstrate the best hydraulic performance regarding flow uniformity and pressure loss for the flow frame designs without and with secondary manifolds, respectively. However, these typically used ‘optimal’ designs are susceptible to side gaps. For example, applying 1-mm side gaps to these two cases results in preferential bypass flow within the side gaps, leading to significantly slower flow within the felt, as shown in Figure 9 and Figure 10. The actual flow velocity in the active cell area, nearly 4 mm s−1, is only half the theoretical flow velocity of 8 mm s−1. A flow rate lower than the theoretical value constrains the supply of reactants to the electrode surface for the chemical reactions at higher SOCs, potentially increasing the concentration overpotential and contributing to premature voltage cutoff and capacity loss. Even worse, low flow rates may increase the risk of gassing side reactions, such as hydrogen and oxygen evolutions, due to an insufficient supply of electroactive species to the electrode surface. Moreover, after adding the side gaps, the cell pressure drops dramatically decrease from 97.8 kPa (without side gaps) to 64.9 kPa (with side gaps) for the former case and from 90 kPa (without side gaps) to 61.4 kPa (with side gaps) for the latter case, mainly due to the bypass flows.
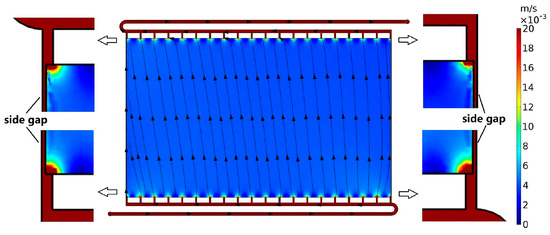
Figure 9.
The velocity plot for the simulation with vertical channels to two ends and side gaps (zoomed in).
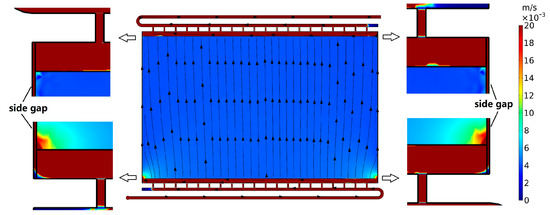
Figure 10.
The velocity plot for the simulation with secondary manifolds and side gaps (zoomed in).
3.3.2. Case 3.2: Countermeasures against the Side Gaps
Countermeasures against the side gaps must be considered to maintain the theoretical flow rate and provide adequate reactants for the redox reactions. The approaches to cope with the bypass flow in the side gaps include utilising slightly larger felt than the cell cavity to minimise the side gaps or applying a marginally larger flow rate to the inlet to compensate for the bypass flow. Additionally, in this paper, semicircular dimples of a radius of 2 mm are proposed and applied to two sides of the cell cavity to control the flow in the assumed 1-mm side gaps, as shown in Figure 11.
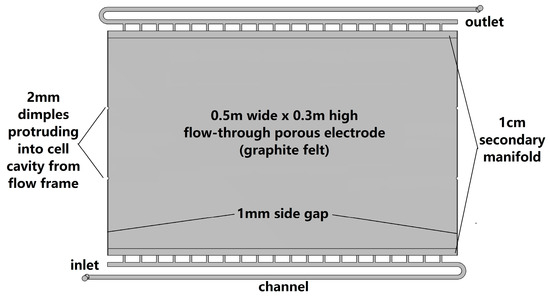
Figure 11.
Semicircular dimples of a 2−mm radius applied to two sides of the flow frame to protrude into the cell cavity to restrict the bypass flow in the side gaps.
Simulation results in Figure 12a,b demonstrate the velocity plots when applying two dimples on each side to constrain the bypass flow in the side gaps observed for case 3.1. Faster flow within the felt with noticeable velocity gradients next to the dimples can be observed compared to the case with no countermeasures. If secondary distribution manifolds are not utilised in the flow frame design, such as in Figure 12b, adjusting the vertical channels from two edges towards the centre can also reduce the bypass flow in the side gaps and increase the flow rate in the active cell area, as shown in Figure 12c, even though there were still small dead zones near the side gaps. The dead zones can, however, be reduced by applying more dimples, as showcased in Figure 12d–f, when the number of dimples for each side is increased to 10. The flow rates in the felt of these three cases rise considerably compared with Figure 12a–c, with the average flow velocity of the active cell area close back to the theoretical flow velocity of approximately 8 mm s−1.
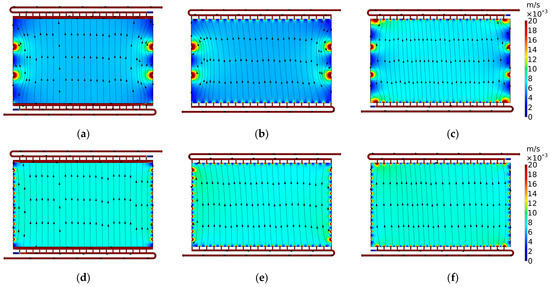
Figure 12.
The velocity plots for the countermeasures against the side gaps: (a) Secondary manifolds with two dimples on each side, (b) vertical channels to two ends with two dimples on each side, (c) vertical channels not to two ends with two dimples on each side, (d) secondary manifolds with 10 dimples on each side, (e) vertical channels to two ends with 10 dimples on each side, (f) vertical channels not to two ends with 10 dimples on each side.
Furthermore, for the simulations with secondary manifolds, the cell pressure loss decreases from 90 kPa (no side gaps) to 61.4 kPa (with side gaps) and then climbs back to 75.1 kPa (two dimples) and even 87.4 kPa (10 dimples). Similarly, for the simulation without secondary manifolds, the cell pressure loss decreases from 97.8 kPa (no side gaps) to 64.9 kPa (with side gaps) and then jumps back to 79.4 kPa (two dimples) and even 93.8 kPa (10 dimples), whose values, by adjusting the vertical channels towards the centre, can further increase to 90.3 kPa (two dimples) and 96.7 kPa (10 dimples), respectively. Overall, the cell pressure drops show a similar trend as the actual flow velocity in the graphite felt, mainly due to the dominant role of the porous electrode towards the cell pressure drop. These simulation results suggest that adjusting channel locations and applying dimples protruding into the cell cavity from the flow frame can effectively deal with the side gaps.
3.4. Case 4: Porosity Segments
The impact of the porosity difference of the graphite felt due to manufacturing tolerances has also been studied by randomly distributing porosity segments across the felt in combination with the effect of the side gaps. The cell cavity used in the simulation is 3-mm thick, while the thickness of the felt from manufacturers can have a tolerance of 4 ± 0.5 mm, corresponding to felt compression from 14.3% for 3.5-mm felt in a 3-mm cavity to 33.3% for 4.5-mm felt in the 3-mm cavity. Felt compressions can be used to estimate the porosities of the graphite felt [16,38], which are assumed to be 0.89, 0.88 and 0.87 in this study, corresponding to 20%, 25% and 30% compression within the abovementioned felt compression range. The porosities are also assumed to have random distribution across the graphite felt with the porosity segments shown in Figure 13.
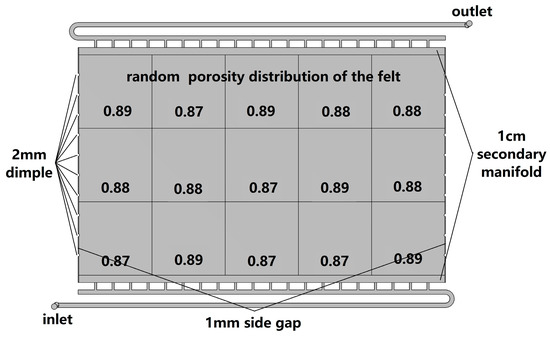
Figure 13.
Random porosity distribution within the porous electrode using graphite felt.
Figure 14a,d shows the velocity plots when applying the porosity segments to the standard flow frame assuming no side gaps. Preferential flows were generated in the areas with high porosity of 0.89. In contrast, moderately lower flow rates can be observed for the areas with low porosity of 0.87, in which the flow velocity is slightly lower than the theoretical velocity of 8 mm s−1. The side gaps can further worsen the flow rates, as demonstrated in Figure 14b,e, which may be resolved by utilising the proposed dimples as shown in Figure 14c,f. It is worth mentioning that the flow frame designs with secondary manifolds tend to be more sensitive to the side gaps, as observed in Figure 14e, which implies the necessity for dimples in the flow frame internal edges or other countermeasures against the side gaps for the design.
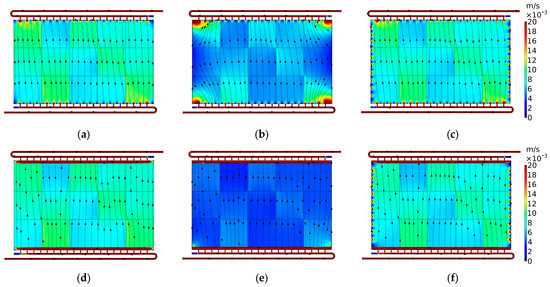
Figure 14.
Velocity plots for the simulations with random porosity segments plus (a) no secondary manifold without side gaps, (b) no secondary manifold with side gaps, (c) no secondary manifold with side gaps and dimples, (d) secondary manifold without side gaps, (e) secondary manifold with side gaps, (f) secondary manifold with side gaps and dimples.
Figure 15 summarises the pressure drops for Figure 14a–f, with the comparison against previous pressure drop results under the same condition but without porosity segments. As can be seen, the cell pressure drop significantly decreases by adding the side gaps and jumps back by utilising dimples to constrain the bypass flow. The results also show that the random porosity distribution assumed in this study has minimal effect on the cell pressure drops, although the actual porosity distribution can be uncertain and hard to predict. In summary, the results indicate that the porosity difference of the graphite felt due to manufacturing tolerance can have less impact than the side gaps on the flow rates and pressure drops.
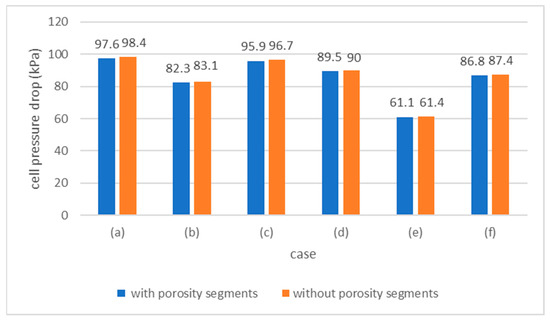
Figure 15.
The cell pressure drops for Figure 14a–f with porosity segments, compared against previous pressure drop results without porosity segments.
4. Conclusions
Regarding standard flow frame designs for redox flow battery stacks, the secondary distribution manifolds with more vertical channels connected to the cell cavity can reduce the cell pressure drop and improve the electrolyte flow uniformity within the porous electrode. However, these designs are sensitive to the side gaps and porosity segments from felt and flow-frame irregularity or manufacturing tolerances, which can result in preferential flow within low-resistance areas, leading to significantly lower flow rates for other cell areas. Proposed countermeasures of slightly oversizing the felt, applying a higher inlet flow rate, adjusting the vertical channels towards the centre and designing multiple dimples in the flow frame to protrude into the two edges of the cell cavity can effectively maintain theoretical flow rates for the active cell areas to avoid capacity losses induced by high concentration overpotential or gassing side reactions in the low-flow-rate regions or dead zones. The porosity difference of the graphite felt due to manufacturing tolerance can have less impact than the side gaps on the flow rates and pressure drops, despite the uncertainty of its distribution by nature.
The simulations have been performed for a single cell of vanadium redox flow battery as an illustration. Still, the hydraulic model has incorporated a parameterised geometry for a multi-cell battery stack with an input interface that allows input parameters to be varied for different chemistries and designs. The model can demonstrate the flow within the cells’ cross-sessional area and the flow to individual cells within a battery stack, which can thus assist in evaluating different design parameters and concepts for flow battery stack optimisation.
Author Contributions
Conceptualization, X.G., C.M. and M.S.-K.; methodology, X.G.; software, X.G.; validation, X.G.; formal analysis, X.G.; investigation, X.G.; resources, C.M. and M.S.-K.; data curation, X.G.; writing—original draft preparation, X.G.; writing—review and editing, C.M. and M.S.-K.; visualization, X.G.; supervision, C.M. and M.S.-K. All authors have read and agreed to the published version of the manuscript.
Funding
This work was supported by PhD scholarship from the Faculty of Engineering, UNSW, Australia, and was conducted as part of the EU-funded project, SONAR (Modelling for the search for new active materials for redox flow batteries), under Grant Agreement no. 875489.
Data Availability Statement
Not applicable.
Acknowledgments
The first author is grateful to his colleague, Hengrui Liu, for the technical support on High-Performance Computing (HPC) at UNSW Australia.
Conflicts of Interest
The authors declare no conflict of interest.
References
- Tang, A.; Bao, J.; Skyllas-Kazacos, M. Studies on Pressure Losses and Flow Rate Optimization in Vanadium Redox Flow Battery. J. Power Sources 2014, 248, 154–162. [Google Scholar] [CrossRef]
- Kear, G.; Shah, A.A.; Walsh, F.C. Development of the All-Vanadium Redox Flow Battery for Energy Storage: A Review of Technological, Financial and Policy Aspects. Int. J. Energy Res. 2012, 36, 1105–1120. [Google Scholar] [CrossRef]
- Shigematsu, T. Redox Flow Battery for Energy Storage. SEI Tech. Rev. 2011, 73, 13. [Google Scholar]
- Menictas, C.; Skyllas-Kazacos, M. Next-Generation Vanadium Flow Batteries. Flow Batter. Fundam. Appl. 2023, 2, 673–687. [Google Scholar]
- Aluko, A.; Knight, A. A Review on Vanadium Redox Flow Battery Storage Systems for Large-Scale Power Systems Application. IEEE Access 2023, 11, 13773–13793. [Google Scholar] [CrossRef]
- Barton, J.L.; Brushett, F.R. A One-Dimensional Stack Model for Redox Flow Battery Analysis and Operation. Batteries 2019, 5, 25. [Google Scholar] [CrossRef]
- Mourouga, G.; Schaerer, R.P.; Yang, X.; Janoschka, T.; Schmidt, T.J.; Schumacher, J.O. Physics-Based 0D-U-I-SoC Cell Performance Model for Aqueous Organic Redox Flow Batteries. Electrochim. Acta 2022, 415, 140185. [Google Scholar] [CrossRef]
- Tsehaye, M.T.; Mourouga, G.; Schmidt, T.J.; Schumacher, J.O.; Velizarov, S.; Van der Bruggen, B.; Alloin, F.; Iojoiu, C. Towards Optimized Membranes for Aqueous Organic Redox Flow Batteries: Correlation between Membrane Properties and Cell Performance. Renew. Sustain. Energy Rev. 2023, 173, 113059. [Google Scholar] [CrossRef]
- Shah, A.A.; Watt-Smith, M.J.; Walsh, F.C. A Dynamic Performance Model for Redox-Flow Batteries Involving Soluble Species. Electrochim. Acta 2008, 53, 8087–8100. [Google Scholar] [CrossRef]
- Al-Fetlawi, H.; Shah, A.A.; Walsh, F.C. Non-Isothermal Modelling of the All-Vanadium Redox Flow Battery. Electrochim. Acta 2009, 55, 78–89. [Google Scholar] [CrossRef]
- Shah, A.A.; Al-Fetlawi, H.; Walsh, F.C. Dynamic Modelling of Hydrogen Evolution Effects in the All-Vanadium Redox Flow Battery. Electrochim. Acta 2010, 55, 1125–1139. [Google Scholar] [CrossRef]
- Al-Fetlawi, H.; Shah, A.A.; Walsh, F.C. Modelling the Effects of Oxygen Evolution in the All-Vanadium Redox Flow Battery. Electrochim. Acta 2010, 55, 3192–3205. [Google Scholar] [CrossRef]
- Shah, A.A.; Tangirala, R.; Singh, R.; Wills, R.G.A.; Walsh, F.C. A Dynamic Unit Cell Model for the All-Vanadium Flow Battery. J. Electrochem. Soc. 2011, 158, A671. [Google Scholar] [CrossRef]
- You, D.; Zhang, H.; Chen, J. A Simple Model for the Vanadium Redox Battery. Electrochim. Acta 2009, 54, 6827–6836. [Google Scholar] [CrossRef]
- Ma, X.; Zhang, H.; Xing, F. A Three-Dimensional Model for Negative Half Cell of the Vanadium Redox Flow Battery. Electrochim. Acta 2011, 58, 238–246. [Google Scholar] [CrossRef]
- Gurieff, N.; Timchenko, V.; Menictas, C. Variable Porous Electrode Compression for Redox Flow Battery Systems. Batteries 2018, 4, 53. [Google Scholar] [CrossRef]
- Gurieff, N.; Cheung, C.Y.; Timchenko, V.; Menictas, C. Performance Enhancing Stack Geometry Concepts for Redox Flow Battery Systems with Flow through Electrodes. J. Energy Storage 2019, 22, 219–227. [Google Scholar] [CrossRef]
- Darling, R.M.; Shiau, H.-S.; Weber, A.Z.; Perry, M.L. The Relationship between Shunt Currents and Edge Corrosion in Flow Batteries. J. Electrochem. Soc. 2017, 164, E3081–E3091. [Google Scholar] [CrossRef]
- Zhang, B.W.; Lei, Y.; Bai, B.F.; Xu, A.; Zhao, T.S. A Two-Dimensional Mathematical Model for Vanadium Redox Flow Battery Stacks Incorporating Nonuniform Electrolyte Distribution in the Flow Frame. Appl. Therm. Eng. 2019, 151, 495–505. [Google Scholar] [CrossRef]
- Viswanathan, V.V.; Crawford, A.J.; Thomsen, E.C.; Shamim, N.; Li, G.; Huang, Q.; Reed, D.M. An Overview of the Design and Optimized Operation of Vanadium Redox Flow Batteries for Durations in the Range of 4–24 Hours. Batteries 2023, 9, 221. [Google Scholar] [CrossRef]
- Puleston, T.; Clemente, A.; Costa-Castelló, R.; Serra, M. Modelling and Estimation of Vanadium Redox Flow Batteries: A Review. Batteries 2022, 8, 121. [Google Scholar] [CrossRef]
- Esan, O.C.; Shi, X.; Pan, Z.; Huo, X.; An, L.; Zhao, T.S. Modeling and Simulation of Flow Batteries. Adv. Energy Mater. 2020, 10, 2000758. [Google Scholar] [CrossRef]
- Aramendia, I.; Fernandez-Gamiz, U.; Martinez-San-vicente, A.; Zulueta, E.; Lopez-Guede, J.M. Vanadium Redox Flow Batteries: A Review Oriented to Fluid-Dynamic Optimization. Energies 2021, 14, 176. [Google Scholar] [CrossRef]
- Aaron, D.S.; Liu, Q.; Tang, Z.; Grim, G.M.; Papandrew, A.B.; Turhan, A.; Zawodzinski, T.A.; Mench, M.M. Dramatic Performance Gains in Vanadium Redox Flow Batteries through Modified Cell Architecture. J. Power Sources 2012, 206, 450–453. [Google Scholar] [CrossRef]
- Messaggi, M.; Canzi, P.; Mereu, R.; Baricci, A.; Inzoli, F.; Casalegno, A.; Zago, M. Analysis of Flow Field Design on Vanadium Redox Flow Battery Performance: Development of 3D Computational Fluid Dynamic Model and Experimental Validation. Appl. Energy 2018, 228, 1057–1070. [Google Scholar] [CrossRef]
- Wu, H.-W.; Zeng, Y.-K. Effect of Baffles in Flow Channel on the Performance of Vanadium Redox Flow Battery. Processes 2023, 11, 523. [Google Scholar] [CrossRef]
- Xiong, B.; Li, Y.; Ding, Y.; Wang, J.; Wei, Z.; Zhao, J.; Ai, X.; Fang, J. Numerical Analysis of Vanadium Redox Flow Batteries Considering Electrode Deformation under Various Flow Fields. J. Power Sources 2023, 564, 232814. [Google Scholar] [CrossRef]
- Huang, Z.; Mu, A.; Wu, L.; Wang, H. Vanadium Redox Flow Batteries: Flow Field Design and Flow Rate Optimization. J. Energy Storage 2022, 45, 103526. [Google Scholar] [CrossRef]
- Prumbohm, E.; Becker, M.; Flaischlen, S.; Wehinger, G.D.; Turek, T. Flow Field Designs Developed by Comprehensive CFD Model Decrease System Costs of Vanadium Redox-Flow Batteries. J. Flow Chem. 2021, 11, 461–481. [Google Scholar] [CrossRef]
- He, Q.; Yu, J.; Guo, Z.; Sun, J.; Zhao, S.; Zhao, T.; Ni, M. Modeling of Vanadium Redox Flow Battery and Electrode Optimization with Different Flow Fields. e-Prime-Adv. Electr. Eng. Electron. Energy 2021, 1, 100001. [Google Scholar] [CrossRef]
- Xu, Q.; Zhao, T.S.; Leung, P.K. Numerical Investigations of Flow Field Designs for Vanadium Redox Flow Batteries. Appl. Energy 2013, 105, 47–56. [Google Scholar] [CrossRef]
- Xu, Q.; Zhao, T.S.; Zhang, C. Performance of a Vanadium Redox Flow Battery with and without Flow Fields. Electrochim. Acta 2014, 142, 61–67. [Google Scholar] [CrossRef]
- Kumar, S.; Jayanti, S. Effect of Flow Field on the Performance of an All-Vanadium Redox Flow Battery. J. Power Sources 2016, 307, 782–787. [Google Scholar] [CrossRef]
- Maurya, S.; Nguyen, P.T.; Kim, Y.S.; Kang, Q.; Mukundan, R. Effect of Flow Field Geometry on Operating Current Density, Capacity and Performance of Vanadium Redox Flow Battery. J. Power Sources 2018, 404, 20–27. [Google Scholar] [CrossRef]
- Tomadakis, M.M.; Robertson, T.J. Viscous Permeability of Random Fiber Structures: Comparison of Electrical and Diffusional Estimates with Experimental and Analytical Results. J. Compos. Mater. 2005, 39, 163–188. [Google Scholar] [CrossRef]
- Skyllas-Kazacos, M.; Kasherman, D.; Hong, D.R.; Kazacos, M. Characteristics and Performance of 1 KW UNSW Vanadium Redox Battery. J. Power Sources 1991, 35, 399–404. [Google Scholar] [CrossRef]
- Fink, H.; Remy, M. Shunt Currents in Vanadium Flow Batteries: Measurement, Modelling and Implications for Efficiency. J. Power Sources 2015, 284, 547–553. [Google Scholar] [CrossRef]
- Park, S.K.; Shim, J.; Yang, J.H.; Jin, C.S.; Lee, B.S.; Lee, Y.S.; Shin, K.H.; Jeon, J.D. The Influence of Compressed Carbon Felt Electrodes on the Performance of a Vanadium Redox Flow Battery. Electrochim. Acta 2014, 116, 447–452. [Google Scholar] [CrossRef]


Disclaimer/Publisher’s Note: The statements, opinions and data contained in all publications are solely those of the individual author(s) and contributor(s) and not of MDPI and/or the editor(s). MDPI and/or the editor(s) disclaim responsibility for any injury to people or property resulting from any ideas, methods, instructions or products referred to in the content. |
© 2023 by the authors. Licensee MDPI, Basel, Switzerland. This article is an open access article distributed under the terms and conditions of the Creative Commons Attribution (CC BY) license (https://creativecommons.org/licenses/by/4.0/).