Article

Tracking Flows of End-of-Life Battery Materials and Manufacturing Scrap

1
Energy Systems and Infrastructure Analysis Division, Argonne National Laboratory, Lemont, IL 60439, USA
2
Aramco Americas: Aramco Research Center—Detroit, 46535 Peary Ct., Novi, MI 48377, USA
3
Circular Energy Storage Research and Consulting, London N101NH, UK
*
Author to whom correspondence should be addressed.
Batteries 2023, 9(7), 360; https://doi.org/10.3390/batteries9070360
Submission received: 29 March 2023 / Revised: 13 June 2023 / Accepted: 27 June 2023 / Published: 4 July 2023
(This article belongs to the Special Issue Feature Papers to Celebrate the First Impact Factor of Batteries)

Abstract

:
This paper defines terms such as “recycling rate” that enable the characterization of flows of battery materials and expands the terminology to accommodate the description of complex product recycling. It also estimates the maximum percentage of U.S. demand for critical elements that could be satisfied by recycling as demand continues to grow, and it defines and estimates the recycling rate for lithium-ion batteries. Finally, it clarifies the role of manufacturing scrap as the domestic U.S. supply chain is built up. It concludes that recycling will be important in the long term, but growth still requires that new material be extracted to supply additional material.

1. Introduction

The rapid growth of demand for electric vehicles (EVs) and energy storage systems (ESS) in the U.S. (shown in Figure 1 by chemistry and by end-use market) has caused a corresponding surge in the need for the key elements contained in the batteries, specifically cobalt, nickel, and lithium. However, domestic supplies of the required minerals are severely limited. Comparing reserves estimated by the U.S. Geological Service to the quantities of materials that would be required to supply EV manufacturing using lithium-ion batteries (LIBs) with NMC622 cathodes (Table 1) reveals that there is insufficient supply of nickel and cobalt for even one year’s domestic auto production (about 10 million units) were it all electric, and there are other uses for the batteries and competing uses for the materials. Additional supplies from domestic resources would only be available at a higher cost. Thus, the U.S. is highly dependent on imports of these elements.
U.S. reserves of lithium are somewhat more promising, and before the discovery of South American Salars, the U.S. was a leading supplier. However, for all these materials, decades of underinvestment in mining and conversion means that it will take many years until the U.S. can take full advantage of the existing resources. Recycling is therefore important as an additional source, as it has the potential to help reduce the need for new materials.
Several studies have been conducted on the global or regional supply potential of critical materials through EV LIB recycling [1,2,3,4,5,6]. However, to the best of our knowledge, there is a lack of consensus on the definition of battery recycling rates and related concepts. This study expands the scope to include the recovery potential of critical materials from all LIB applications in the U.S. Another contribution of this research is the verification of North American recycling capacity through announcements and direct communication with companies. The third unique aspect of this research is the differentiation between materials available from end-of-life (EOL) sources and from production scrap. It emphasizes that scrap does not contribute to the material supply since an increase in scrap will be accompanied by an increase in raw material demand.
Table 1. Potential for use of U.S. reserves (data from [7,8]).
Elementkg/Car (100 kWh)U.S. Reserves (kT)World Reserves (kT)Number for U.S. (Million)Number for World (Billion)
Cobalt15.46983004.50.54
Nickel46.3370>100,0008.02.2
Lithium9.4100026,0001072.8
Figure 1. U.S. LIB demand by chemistry and by end-use market sector [9].
Batteries 09 00360 g001
This work begins by providing a framework for a discussion of recycling. It defines the key terms and parameters that we use to characterize material flows and compares lifecycle considerations for simple and complex products. It first discusses EOL materials and broadens the discussion to include manufacturing scrap, which plays a key role in developing a recycling industry but does not contribute to the material supply. Then, it discusses data sources and the analysis framework. This is then used to characterize the flows of battery materials and describe the role that recycling can play in alleviating potential U.S. shortages of battery raw materials. Finally, it compares the material available to existing and planned capacity to process it to enable us to gain a perspective on the role of battery recycling in the U.S. in the near future. A glossary of terms is included for reference.

2. Framework and Definitions

Recycling is often discussed in the media and among diverse groups using terminology that is inexact. Therefore, we start by defining some basic concepts. When a product’s performance is no longer satisfactory for its intended purpose, several options can be employed to extend its use: the product can be repaired or refurbished and returned to its primary use, or it can be relegated to a less demanding use (repurposed). These options should all be explored, but eventually, functionality is lost and the product is available for recycling. Recycling is the capture of a product after use and reprocessing it back into useful materials that can be used in the same or another useful product (not burned to recover energy). What we really want to know is for a given category of products (manufactured at a given time and place), how much of the component material will eventually make it back into productive use when the product is no longer functional? That is the recycling rate—the mass of used material that is actually recycled divided by the mass of used material generated (expressed as a percent). This is difficult to determine for LIBs. The quantity of material generated (i.e., the out-of-service material) is all the material that reaches the end of its usefulness, wherever it is, while the quantity collected is the material gathered and kept out of the waste stream. Some, but not all, of the material collected will actually be processed and recycled. The European Union (EU) Battery Directive (currently in revision) [10] sets collection targets for portable batteries to incentivize ambitious collection activities by stewardships working on behalf of producers and importers of batteries. There are no federal regulations about EOL batteries in the U.S., but California has studied the problem and recommended several potential strategies [11].

2.1. End-of-Life Material

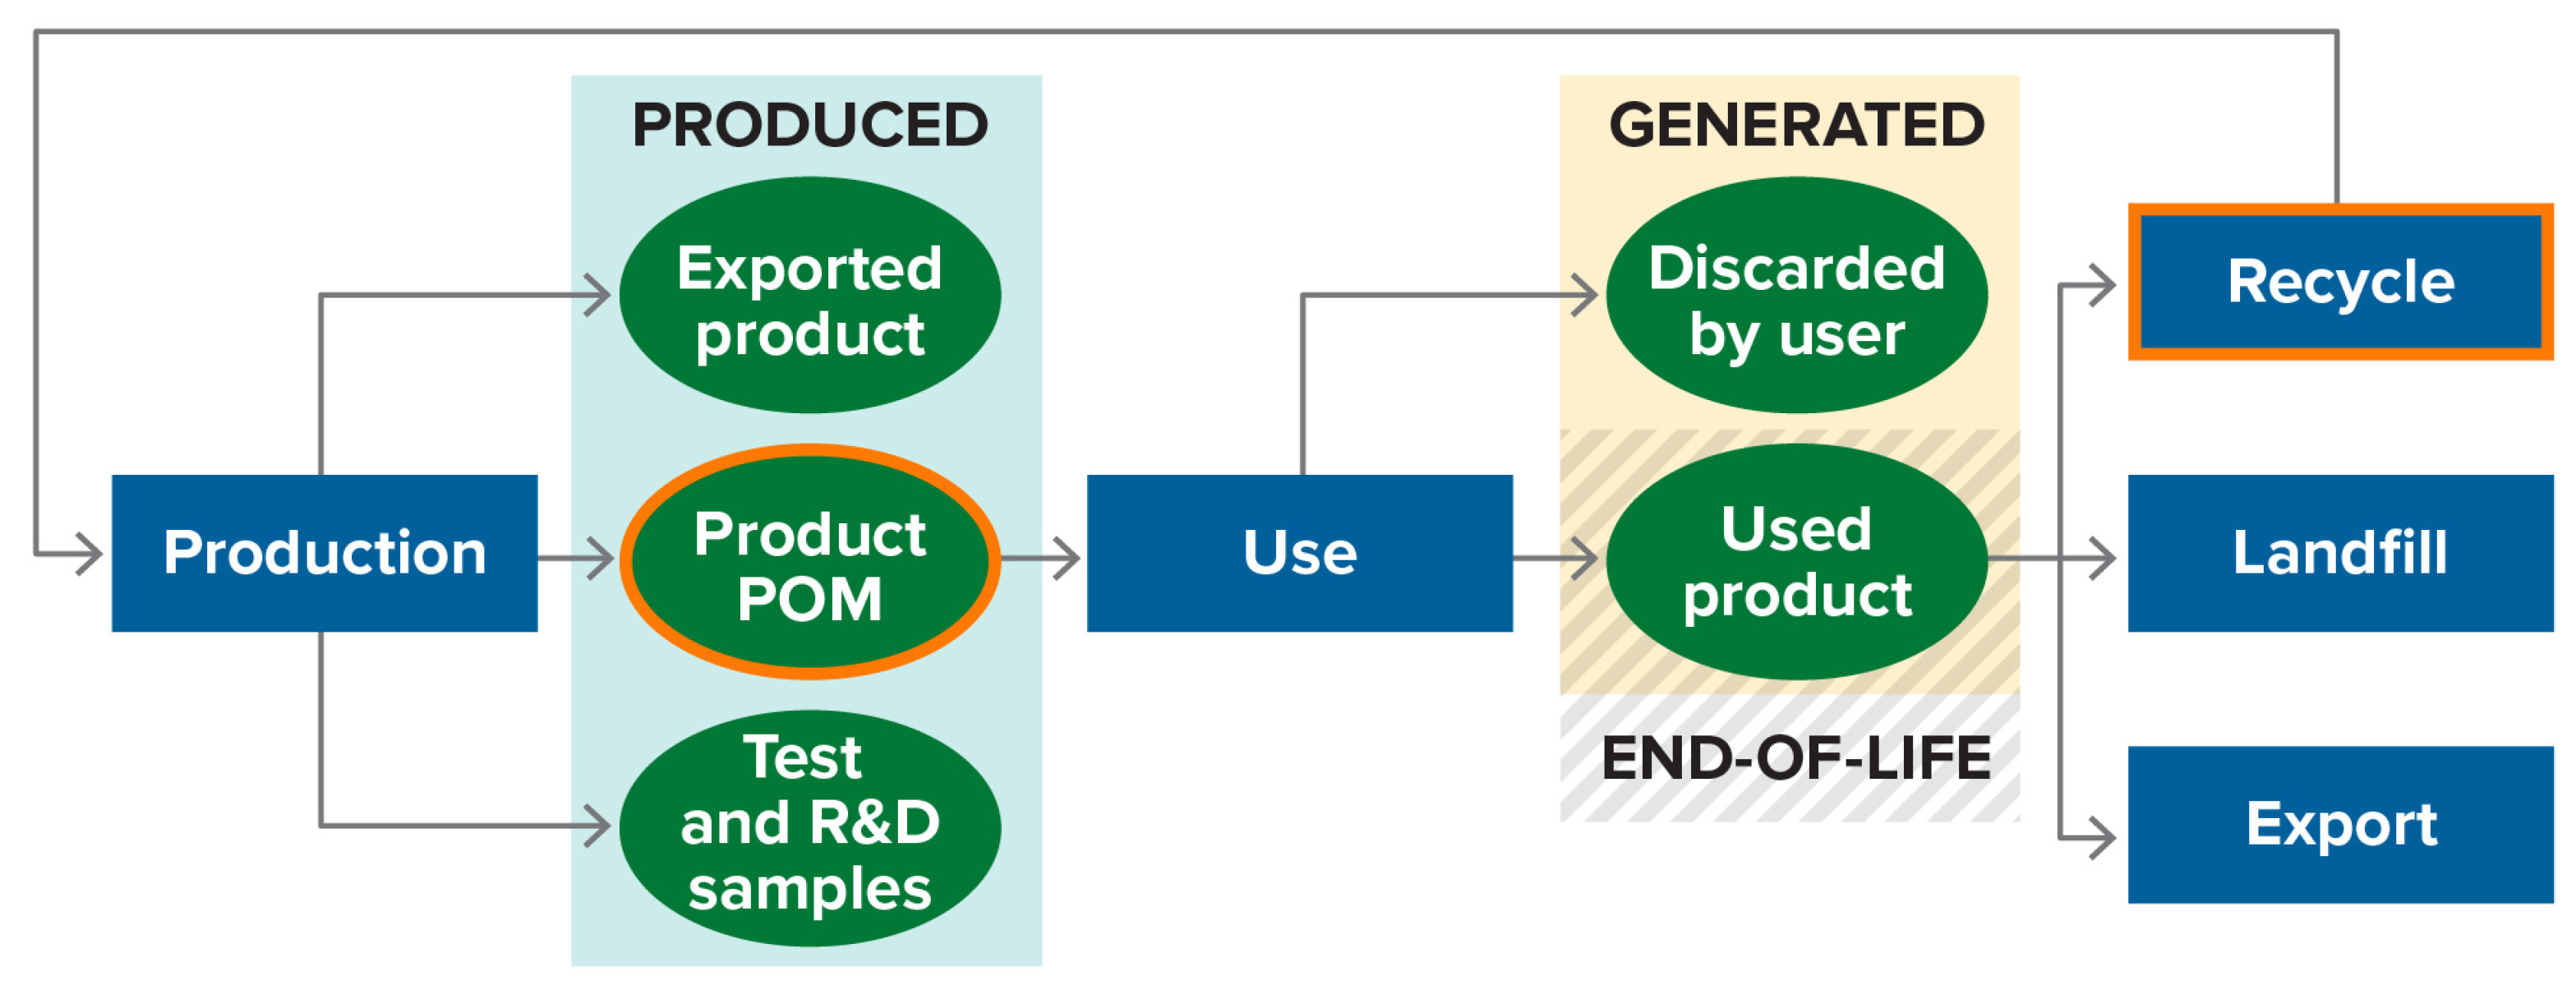
2.1.1. Simple Product Case

Our focus is on LIBs, especially those used for vehicles, but these are complex products with a very branched life cycle, so for clarity we first consider a simple product, say a plastic or glass bottle. The used bottle gets collected, sorted, washed, chopped or crushed, remelted, and reformed. Its lifetime is short, and the production rate is relatively flat, so we can easily compare the quantity recycled to that initially produced. The percentage of recycled material in a new product is called its recycled content. Some material may get made into another product or downcycled into a lower-value product; these also count as recycling. Repurposing (using for another purpose such as a flower vase) competes with recycling for the immediate disposition of material, but the bottles can and should eventually go to recycling. Some material may get stored or exported and eventually recycled; the remainder gets discarded and put in landfill or is otherwise lost. A simple product lifecycle flow is shown in Figure 2. The recycling rate is found by simply comparing the quantity recycled to the quantity generated during the same period. Scrap that may be generated during the production process is important as recycling plant feed, but is not relevant here and will be discussed later.

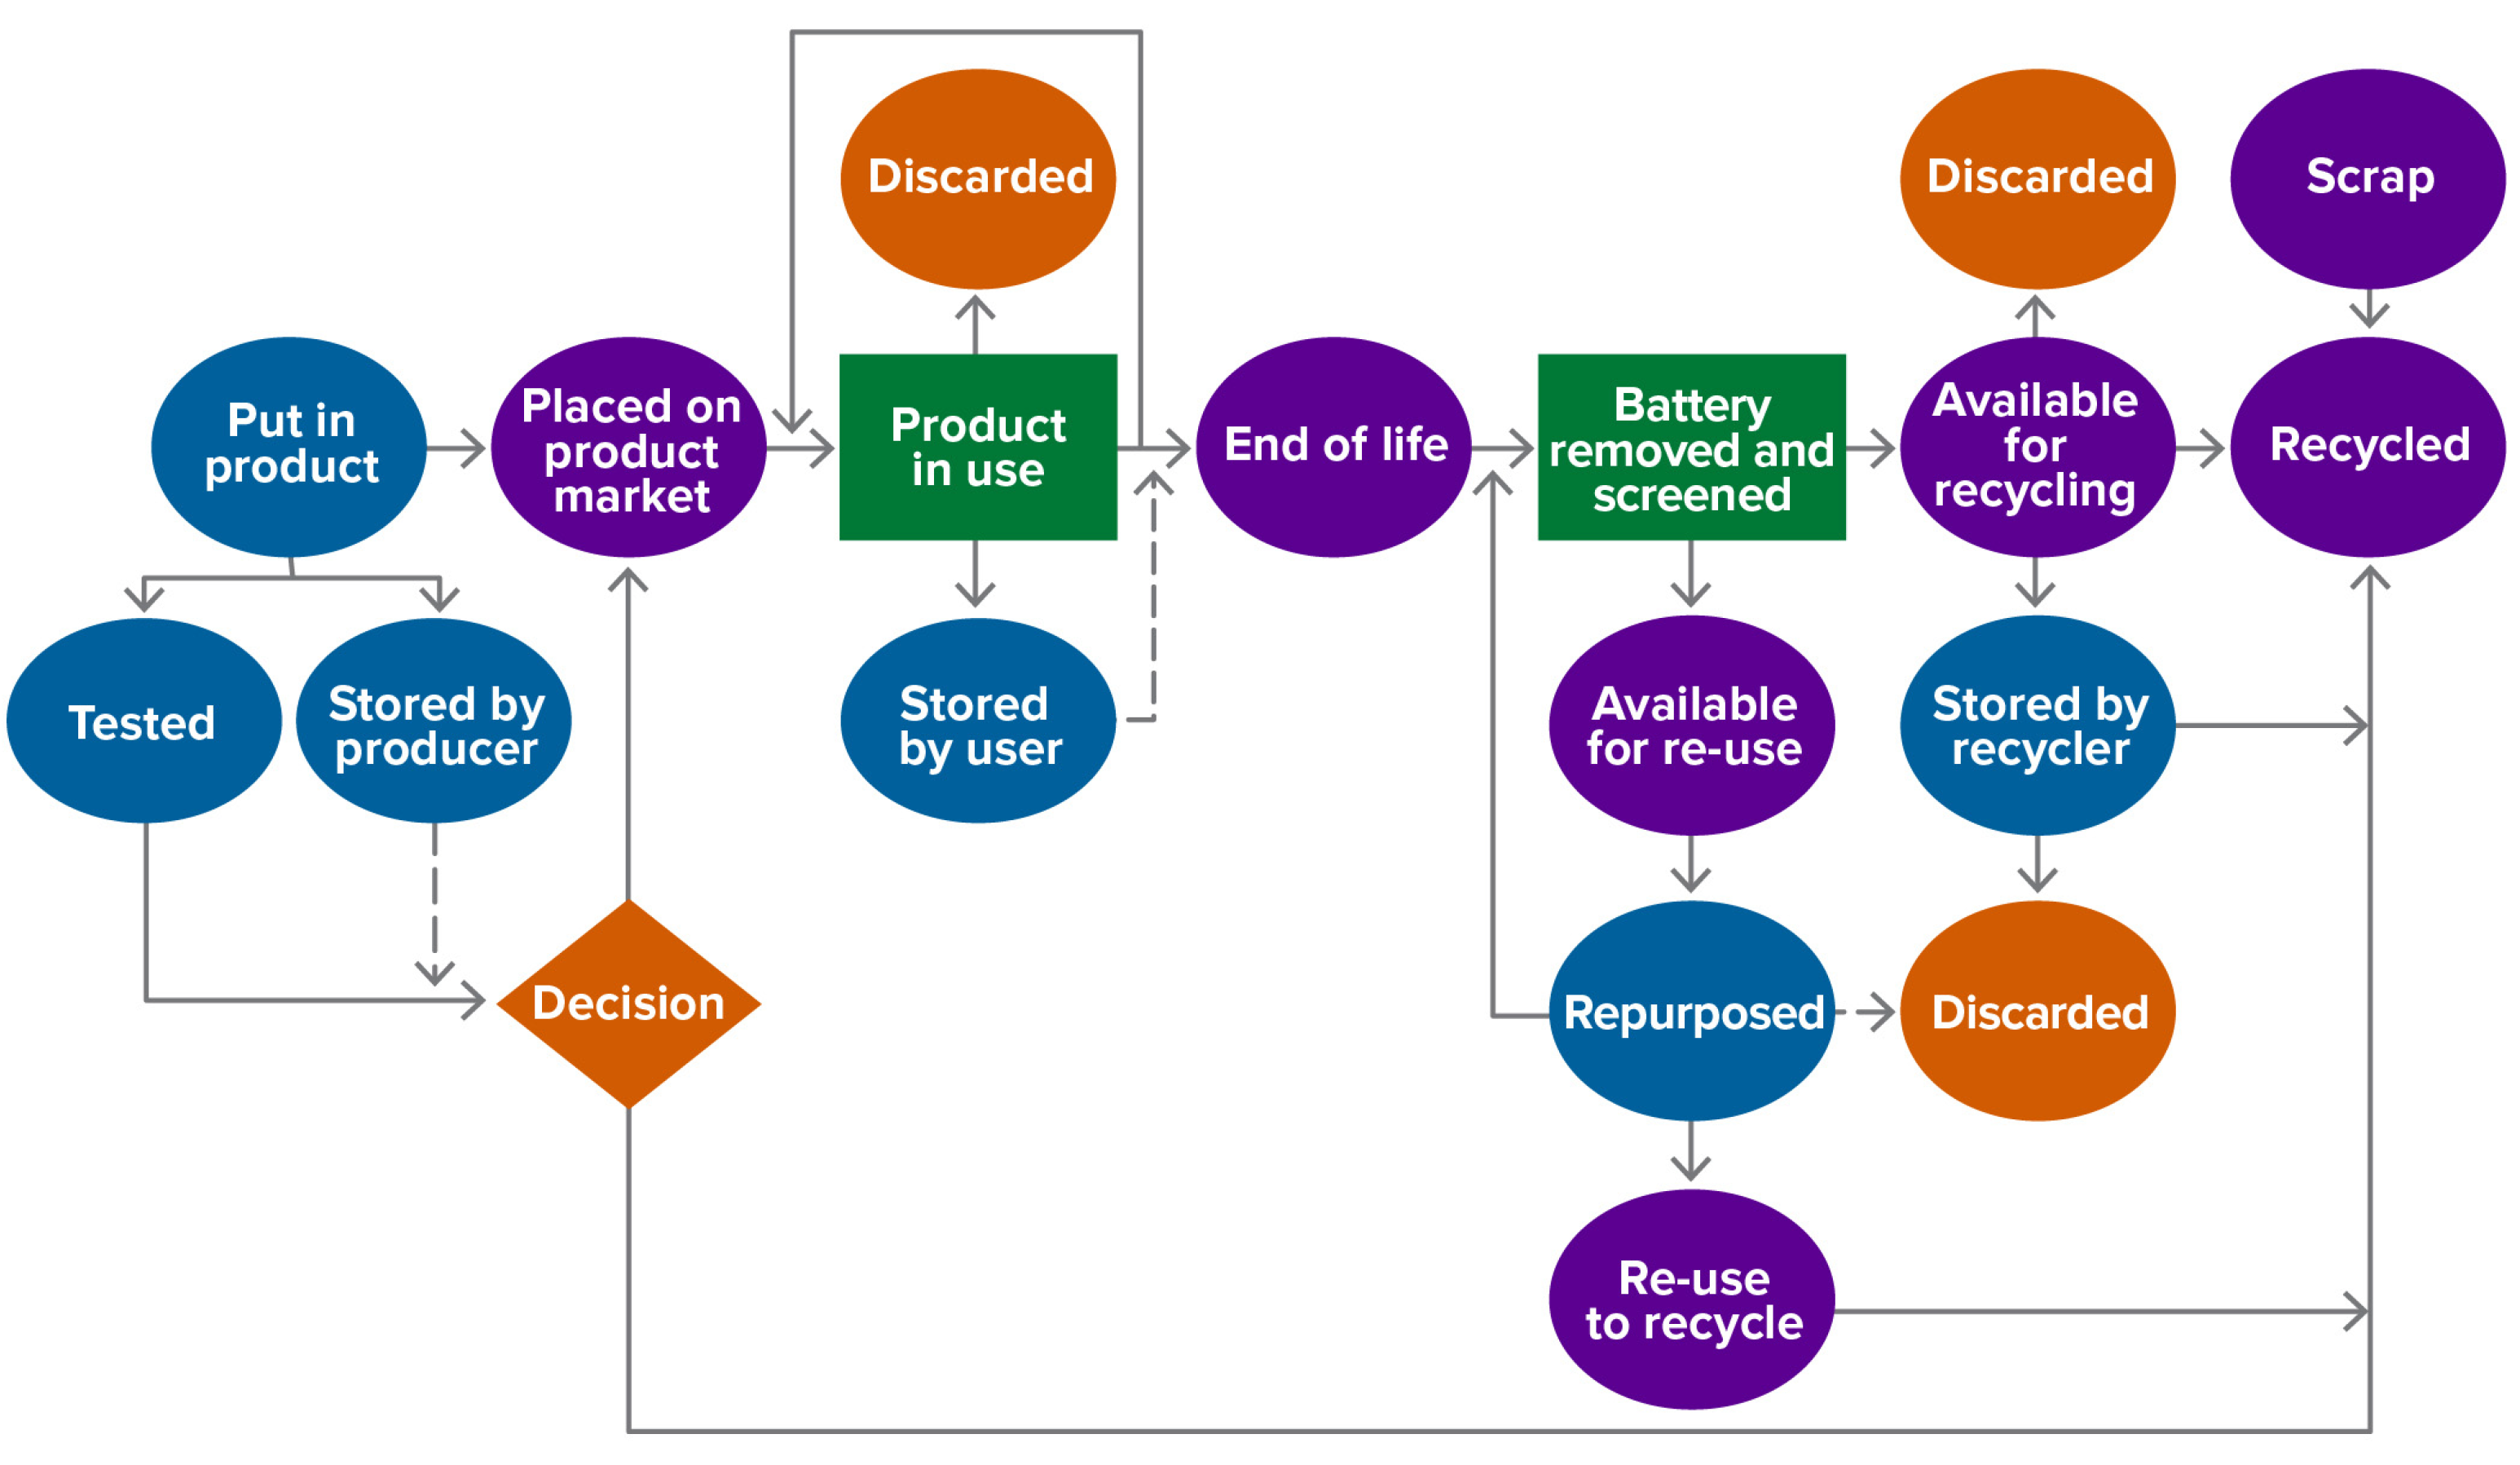
2.1.2. Complex Product Case (Batteries)

Several characteristics of LIBs make their recycling more complicated to characterize.
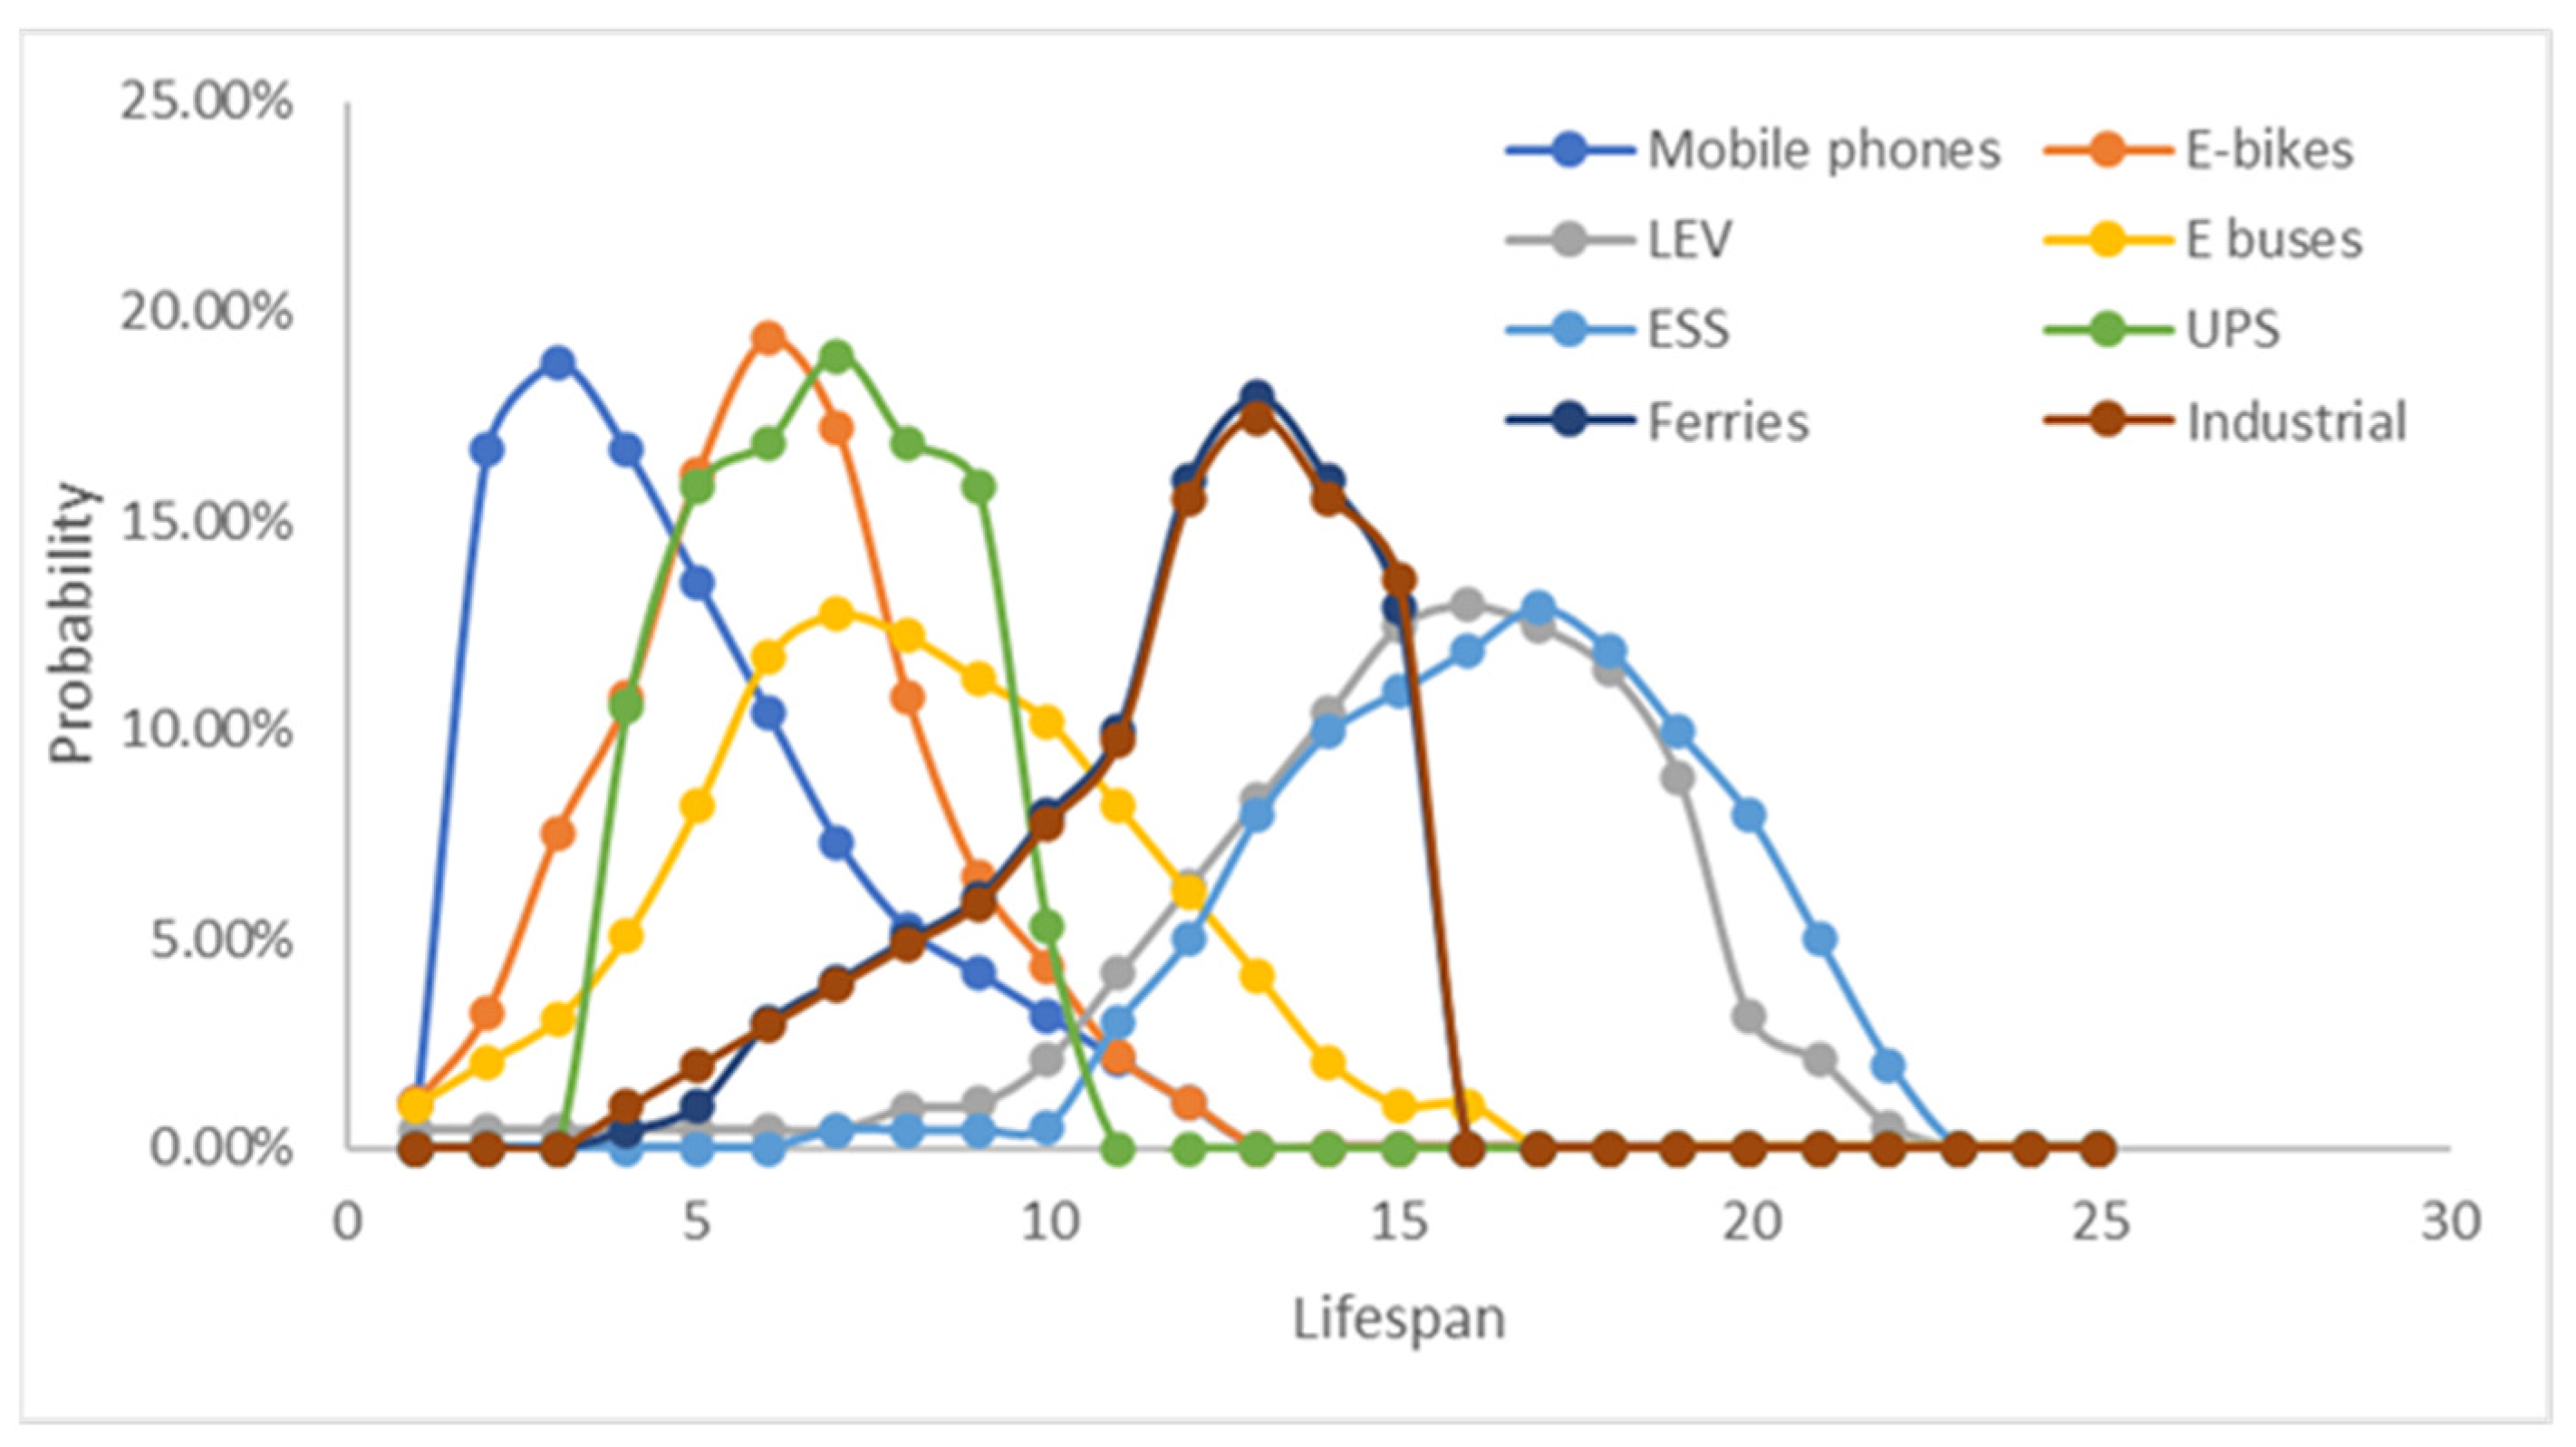
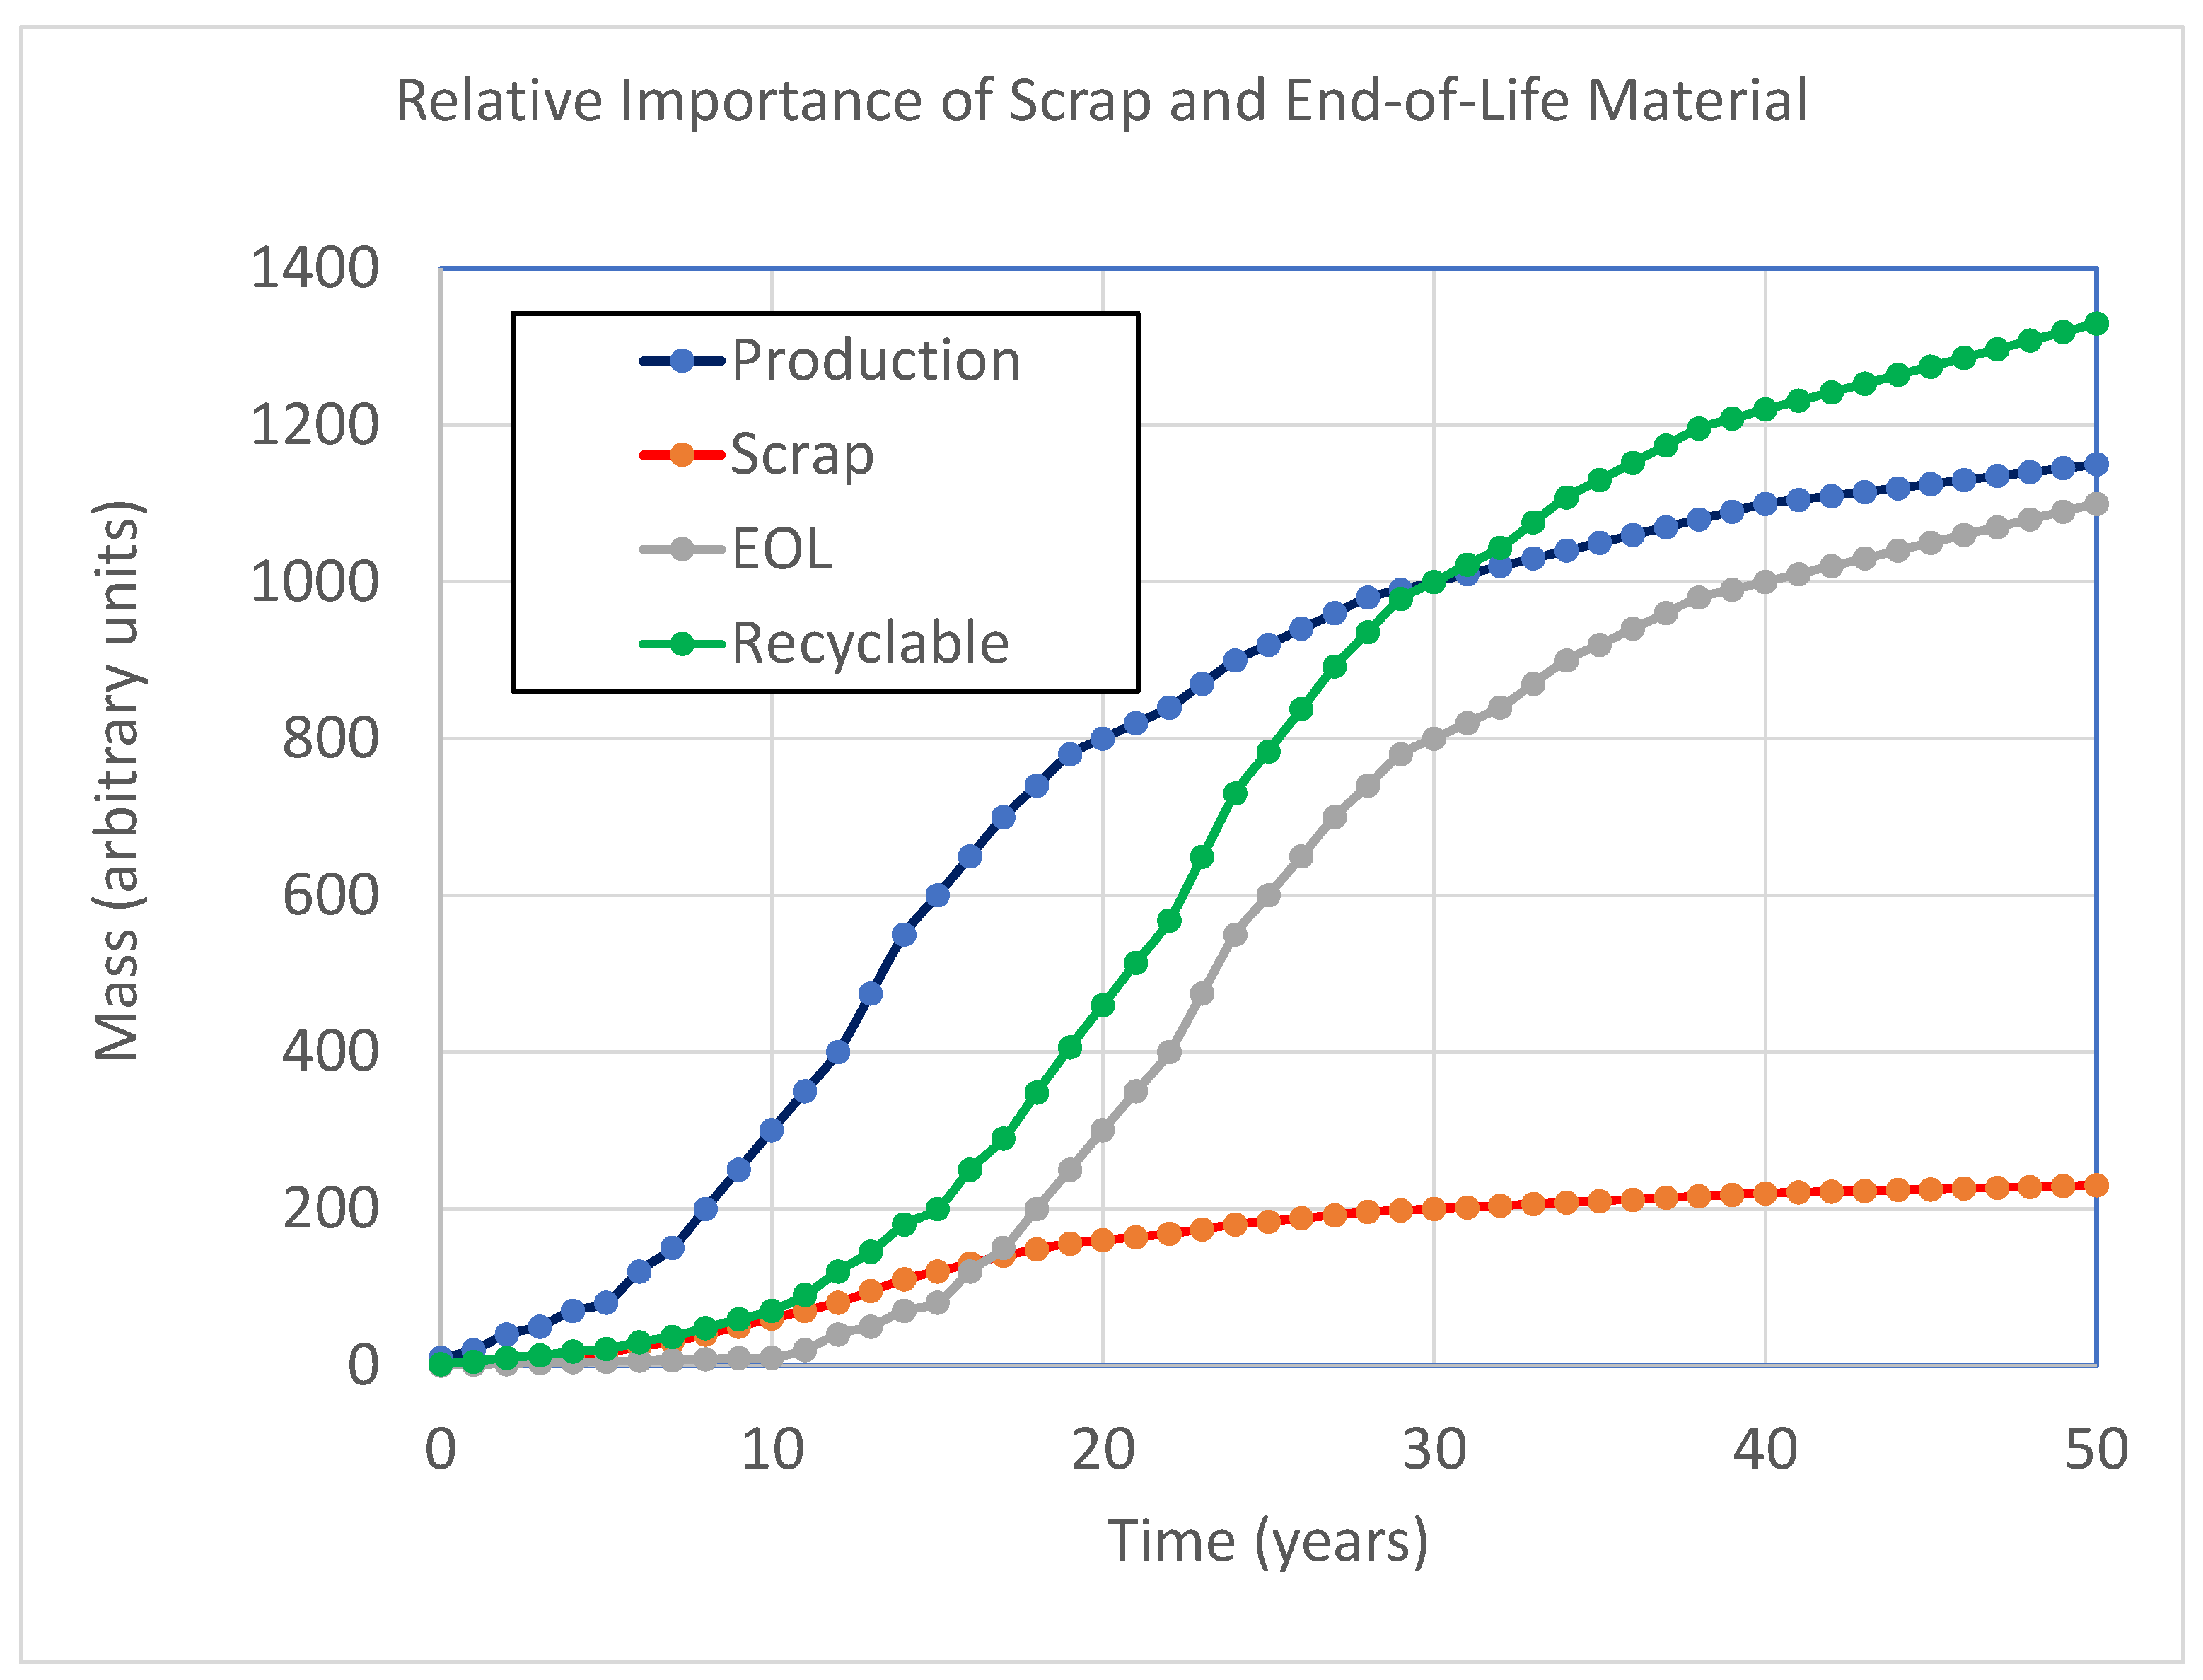
  • Long product life: A battery has a long lifetime, and those in any one use will become unusable over a lengthy period (Figure 3), with some expiring much sooner than others. That is, batteries becoming unusable today were produced over an extended past interval.
  • Chemistry is evolving: The chemical composition of cells is changing, so the recovered material is likely to differ from that used at the time of recovery.
  • Product complexity: A battery is a complex product comprising many components, each in a highly processed state. Component parts may have different lifetimes and may be more or less recyclable, by different processes, with varied products.
  • Not a stand-alone product: A battery is generally not used alone but as part of a host product (e.g., cell phone or EV) for which it provides power. It may outlive the host product and then be transferred to another host, or it may fail during the host’s lifetime, complicating collection.
  • May be exported: Both host products and separate batteries may be traded internationally, at any point during the lifecycle, complicating tracking of materials flows.
It is useful to now introduce a flowchart showing the complicated lifecycle of an LIB (Figure 4). When an LIB reaches its end of life depends on a wide range of internal and external factors. The LIB’s host product may be sold to subsequent users and serve different purposes with varying requirements while still being considered to be in its original use. For example, a second car in a family does not need the same range as a commuter car that is also used for weekend trips. Unlike single-use batteries, or automotive starting, lighting, and ignition (SLI) batteries, LIBs are rarely replaceable by the user and require professional service. This increases the likelihood that the battery’s lifetime will equal to that of its host product. So, the first end of life (EOL1)—when the LIB is removed from its first host—happens either because the host product fails, the battery fails and causes the same destiny for the product, or, if it makes economic and practical sense, the battery is replaced.
The end of first life, which may include multiple resales, is defined as when the battery is removed from its original host product and evaluated for possible placement in a second host product (second life). That material will be available for recycling at a later date. These sufficiently functional batteries are deemed available for reuse and may be repurposed until that host product (or the battery itself) is no longer serviceable and the battery has reached its end of final life (EOLf). Batteries then sent for recycling are accounted for as R2R (reuse to recycling). Note that reuse diminishes the quantity available for immediate recycling by diverting some of the material. Batteries not suitable for repurposing are deemed available for recycling, either immediately or at some later time when the recycler judges it more economically beneficial. The quantity at EOLf is the sum of R2R and that available for recycling at EOL1.
By comparing the quantities of used batteries generated at any time to the quantity of material actually being recycled at that time, we can evaluate the effectiveness of recycling. The quantity that can be recovered at the end of life in the U.S. is less than the quantity generated because there are products removed by losses, stored items, and exports. However, estimating flows is not trivial. Each product that is sold (placed on market (POM)) has a distribution of possible lifetimes, with some being broken or crashing immediately after purchase and others remaining in service until they are obsolete (see Figure 3). No public records are available. Exports are significant and may occur at numerous points along the lifecycle. Tested, rejected, and unsold items are not counted in the product POM and there are no data on these; they may end up recycled, discarded, or included in scrap. These categories are believed to be small (a few percent). Thus, the batteries reaching EOL1 are from a mixture of products produced at various times in the past.

2.1.3. Battery Recycling Metrics

These factors all make the definition of a recycling rate for batteries, or any complex products, problematic. The problem is compounded by the lack of good data. However, several measures can be defined to enable us to characterize the effectiveness of battery recycling. The recycling rate for a complex product can be defined on a mass basis in a manner similar to that for a simple product as the mass of used material actually recycled divided by the mass of used material generated that year (expressed as a percentage). The time qualification is important since the products being recycled were produced over a range of times. Note that the quantity of material placed on the U.S. market in 2019 was 181 kT [9], about three times larger than that estimated to go out of service that year (and produced in years with a much lower POM), so if one were mistakenly to compare the quantity recycled to the POM in the same year, the maximum possible “rate” would be 31%, even if every battery was recycled. Additionally, the quantity recycled domestically would apparently but erroneously be cited as only 3% by domestic processing and 18% for the total.
The quantity of used battery material generated in any year can be determined from a detailed history of a product’s POM, such as that compiled by Circular Energy Storage (CES) (Figure 1 right) and the expected lifetimes for those products (Figure 3). It is more difficult to estimate the actual quantity of material recycled. There is no way to estimate the quantity discarded. Recyclers are not always open about the quantities of material processed, and international material shipments are not well documented. Recognizing these limitations, CES used installed capacity data coupled with published information and personal communications to estimate recycled battery material quantities for the U.S., Europe, China, and the rest of the world in 2019 [9,13]. Using those estimates, we find that about 9.2% (by mass) of the 62 kT of used batteries due to go “out of service” in the U.S. in 2019 were recycled domestically. Because of the lack of recovery capacity, these were preprocessed and then shipped abroad for further material recovery. An additional 44.5% of the used batteries generated were sent to China for processing, although some of those are likely to have been reused or stored and not immediately recycled. In total, the 2019 U.S. battery recycling rate is thus estimated to have been about 54%. This estimate is quite uncertain, but it indicates that significant quantities of material are actually being recycled. As U.S. recycling capacity increases (see below), exports for recycling will decrease because transport costs to the growing number of U.S. recyclers will be lower, and there may be regulations or financial incentives to encourage domestic processing.
This estimate of the recycling rate may also significantly underestimate the quantity of U.S. batteries that are recycled because of the large volumes of used batteries and battery-containing devices that are exported for reuse before reaching EOL1. This material is very likely to also get recycled eventually and raise the actual percentage recycled. The global recycling rate in 2019 was about 59% and includes imported materials that were eventually recycled after reuse (R2R) (calculated from [9,12,13]).
Another way to define the U.S. recycling rate would be to look at what happens to batteries that are retained domestically in the possession of a responsible party when they reach their EOL1. The mass of batteries actually reaching EOL1 is considerably less than the total mass generated, not only because of exports but because of discards and losses and because devices may be stored for possible later use. Thus, a recycling rate estimated based on EOL1 material would be higher than one based on generated material. Material actually in hand at EOL is likely to be evaluated for its potential to be reused, possibly abroad (see Figure 3), and only goes to a recycler if not salable for reuse. Compared to portable devices, such as earbuds or old light-up sneakers likely to end up in landfills, electric vehicle batteries and energy storage systems are unlikely to be discarded because of the high mass of valuable materials they contain. There is already a thriving market for used EV batteries [14].
A similar recycling rate definition can be applied to element- or part-specific recycling rates as well. These are useful adjuncts to the overall recycling rate for the battery, as not all components or elements are equally valuable or recyclable. Recycling process efficiency is another useful parameter. It can be defined as (a) the mass of recycled materials exiting the recycling process and returning to the economy divided by (b) the mass of materials entering the recycling process (recycled product/recycling process input) (expressed as a percent). Similarly, we define element-specific recycling process efficiency, which may differ by element for any given process, as the usable quantity of the element exiting the process divided by the quantity entering (expressed as a percent).
For LIBs, there are three basic types of recycling processes: pyrometallurgy (smelting), hydrometallurgy (leaching), and direct recycling. These are discussed elsewhere [15,16,17]. They differ in inputs, outputs, and economics, but the first important difference among them, for the purpose of this discussion, is their process efficiencies and element-specific efficiencies. Smelting can recover a maximum of only 36% of the input mass (see Figure 5), consisting of the transition metals in a mixed alloy with the carbon-containing components and aluminum becoming oxidized and entrained in the slag with the lithium. This results in both a low process efficiency and a low element-specific process efficiency for some of the elements, as can be seen in Table 2. It is possible to process the slag to recover lithium and increase the process efficiency, but this is only economical when lithium prices are high. Leaching can recover most of the mass in the cells (about 73%), but economic considerations may lead to lower process efficiencies in actual practice. The results are similar for direct recycling.
The parameters defined so far enable us to say how much of what type of material was recycled. However, for a complex product, there may be multiple ways to recycle the various components, with different resultant products, and so the quality of the recycling needs to be considered as well.

2.1.4. Recycling Quality Characterization

The quantity of material by type that makes it back into useful commerce is the first metric for recycling, but it does not supply complete information. Recycled material quality and composition vary by process, so it is useful to specify the recycling products and their quality along with the percentage of recoveries. The quality of recycled products may differ by component as well. For instance, hydrometallurgy may recover most of the material in a cell, but the main products are precursors for cathode production, while direct recycling yields cathode powder that can go directly back into cell manufacturing. It would be useful to characterize that difference in the utility of the product.
In fact, there is a whole spectrum of processes that can be considered “recycling”. Figure 6 provides a schematic hierarchy, with the options near the top representing the material utilizations with the highest intrinsic value or those that retain the most embodied energy from the feed batteries. One can see that metals from pyrometallurgy or metal salts from hydrometallurgy are of lower value than cathodes from direct recycling because more processing is required to restore them to a battery-usable condition.
When evaluating battery recycling status and options, one can specify (a) the quantity of material kept out of the waste stream (collected) and (b) fed into or (c) emerging from recycling plants (percentage recycled or process efficiency), and/or (d) the products’ position in the hierarchy. One could also specify where the recycling occurred. Thus, multiple parameters are required to completely characterize the recycling of a complex product such as a battery. For example, portable electronics batteries collected in the U.S. (unknown collection rate) could all be shredded in Ohio (100% recycling rate) and then shipped to Canada, where they are fed into a smelter with nickel ore. The overall process efficiency would be (at most) 36%, and the element-specific process efficiency would be close to 100% for the transition metals but zero for the other elements. Additionally, the transition metals end up in a mixed alloy, requiring separation, so they occupy a relatively low position on the hierarchy. Direct recycling, on the other hand, could achieve close to 100% process efficiency for all of the components (except perhaps the separator), and recover valuable reusable cathodes. Hydrometallurgy would be somewhere between the two.
The general concept is that “better” options are at the top of the hierarchy. However, evaluating options is not easy. One way to think about characterizing recycling options is to use lifecycle analysis (LCA), for instance, using Argonne’s GREET model [18], to identify the options with the lowest impacts (GHG, energy, criteria pollutants). However, real-life decisions are strongly influenced by monetary considerations, so cost can be added into the picture, as in the EverBatt model [19], which is based on GREET. Using the criteria in these models, direct recycling looks very promising, although it is not yet technically mature; technical maturity is another factor for possible consideration. European LCA models such as Gabi [20] and SimaPro [21] add additional impact categories such as toxicity and resource depletion. These are difficult to evaluate, differ by location, plant age, and other characteristics, and data may be difficult to obtain. It is also possible to combine multiple impacts into a single score using a model such as ReCiPe [22]. However, this process depends on the relative weighting of different factors and so is not unique, differing depending on who is performing the analysis/making the decisions. The Ellen MacArthur Foundation widely publicized a circular economy chart with reuse and repair as the smallest circles. The foundation developed a measure of circularity that also includes many inputs, and implicitly includes a relative set of values that might not be universally accepted [23]. Additional criteria such as reduction of reliance on imports can be factored into the evaluation as well. Thus, the evaluation of recycling alternatives is not a trivial problem. Recommending “best” decision criteria is beyond the scope of this work; we merely point out their importance and difficulties.

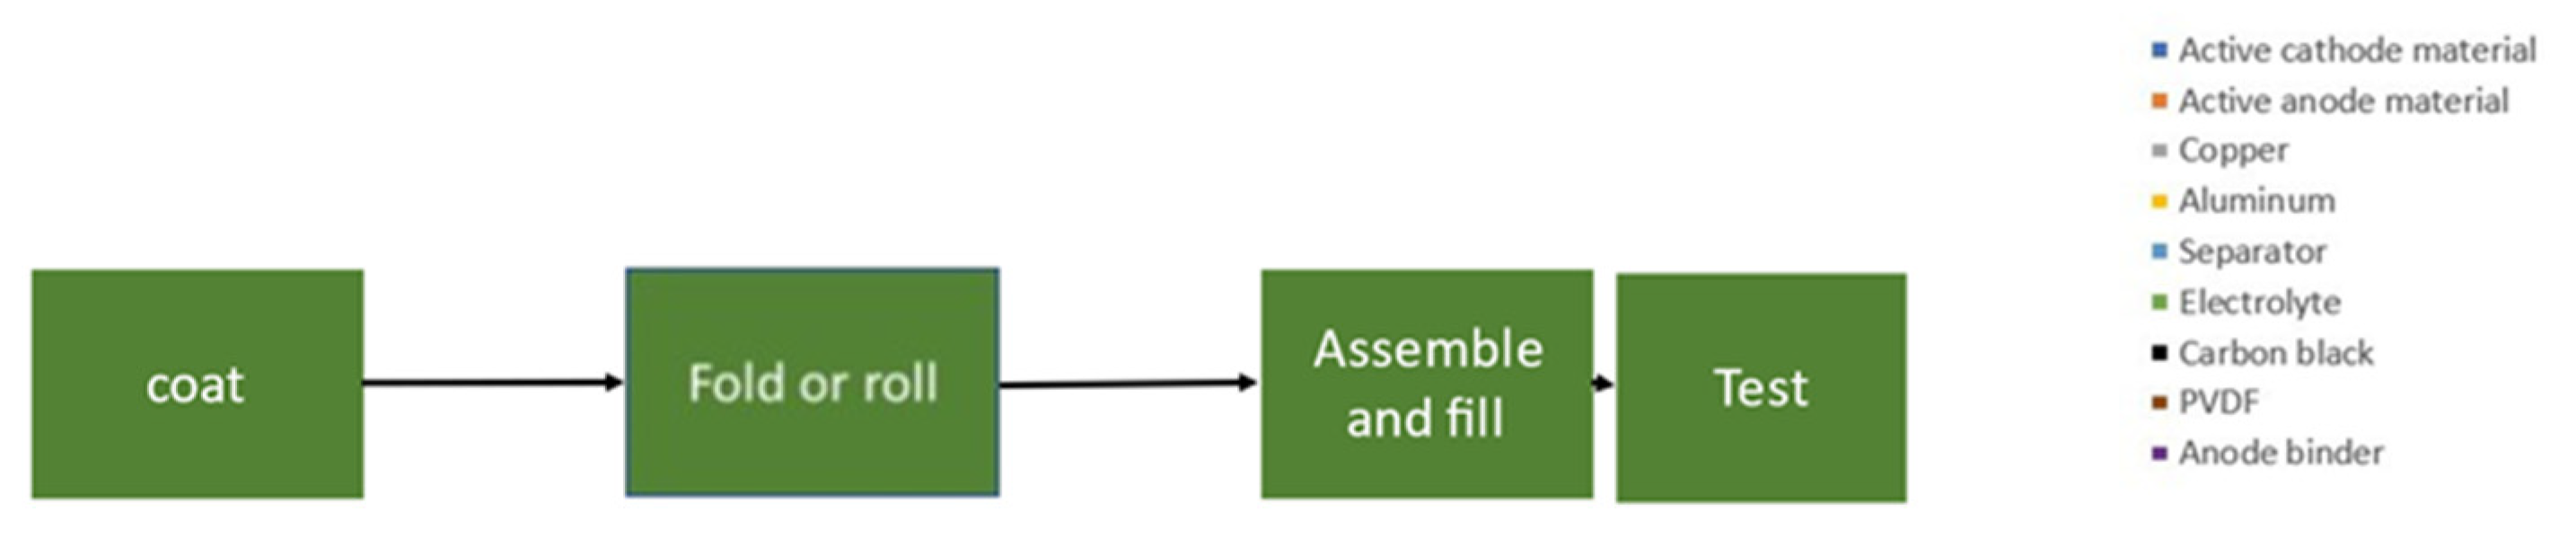
2.2. Manufacturing Scrap

The other important input into recycling battery materials is manufacturing scrap. Manufacturing processes produce scrap from trimmings, process start-ups, off-spec parts, etc. Cell manufacturing is no exception. The existence of manufacturing scrap increases the total quantity of material that must be processed but does not reduce the quantity of raw material that must be input. Figure 7 shows possible schematic flow charts for a process that ideally uses F units of feedstock to produce P units of product, and operates with a scrap fraction s (there may be other inputs or outputs, so F and P may not be equal).
If there was no scrap produced during the process (Figure 7a), F units of feedstock would produce P units of product. If there is scrap, additional feedstock is required to produce that same quantity of product. Of course, the scrap material can be fed back into the process, perhaps after some treatment to restore quality, but that does not reduce the quantity of new material below F. If there is unrecycled scrap (Figure 7b), there is less product. More feedstock would be needed to produce the same quantity of product (Figure 7c). If there is s (fraction) scrap, and the material is replaced or recycled elsewhere, the input needed to produce P units of product increases to F(1 + s/(1 − s)), and Fs/(1 − s) extra material is needed. The total input required has been increased because there is scrappage. Scrap is not an additional source of material supply. The fraction of product produced from recycled or replaced scrap is simply s. When the scrap is fed back into the process (Figure 7d), a fraction of that scrap stays as scrap, and does not become product, which must be fed back in ad infinitum. So, to obtain 100% yield from the original feedstock F, 1/(1 − s) times as much material must be processed. As an example, if you have a scrappage rate of 75%, then a total of 4 kg of material must be processed to give a full 1 kg of product. For that 1 kg of product, 0.25 comes from virgin material, 0.1875 from once-scrapped material, 0.140625 kg from twice-scrapped material, etc. In sum, 75% of the output will have come via scrap. The simplest answer is that if you need one ton of material to produce your product, then you need (at least) one ton of input material. The existence of scrap can only increase the amount of input needed or the processing required.
However, manufacturing scrap is very important, supplying a major portion of feed for early recycling plants before significant quantities of EV batteries have reached their final end of life. This material, coupled with recalls and returned-to-vendor material, represents a major business opportunity for recyclers, even though it does not replace a single gram of newly mined material. If no scrap was available, the development of the U.S. recycling industry might be significantly delayed.
Figure 8 shows how scrap from the rapidly growing production of a new product with a long lifetime (10 years in the example) competes with EOL material. Scrap material is available as soon as production starts, with start-up scrappage at a higher-than-ideal rate and the quantity exceeding that of EOL material until long after one product lifetime has passed. Therefore, it becomes the main input available to feed early recycling plants. Note that the early dearth of EOL material is consistent with Figure 9 even though the actual U.S. data include a small baseline of EOL material from portable electronics. Eventually, EOL material will exceed manufacturing scrap (which will, we hope, decrease on a percentage basis as production matures). If product demand levels off, EOL material can even meet demand, accomplishing the ideal of a circular economy for the product, with no newly mined material required.
Manufacturing scrap is an ideal feedstock for recycling for several reasons. First, it is of known composition and has not been degraded by use. The cathode material is of the latest design. Second, much of the scrap comprises fewer components than the finished complex product and so requires fewer separations to retrieve. Manufacturing scrap can be recycled back into the process stream with much less processing than would be required for EOL material. Using estimated scrap rates for different process steps (Table 3) enables average production scrap to be characterized. It differs from finished cell composition by having fewer electrolytes and more active materials/current collectors. This makes scrap more valuable overall and easier to process. Figure 10 shows the estimated composition of several types of scrap. As an example, cathode scrap, consisting mainly of cathode powder on aluminum foil, can simply be treated with a green organic solvent to remove the powder from the foil. The powder can then be dried and directly returned to the process [24].

3. Methodology and Results

3.1. Data and Method

3.1.1. Data Sources

Most of the data used in this work were from CES. The data from CES are based on information in two different categories: (1) volume data for the main applications in which LIBs are installed, combined with battery data for the batteries used in these applications, and (2) indicators used to project. The volume data are derived from a wide range of sources and vary in granularity depending on data availability as well as the segment’s relative importance to the overall volume. Currently, CES collects information on 9 different categories of applications and 36 sub-categories. The main categories include batteries for portable devices, personal mobility, EVs, and storage systems. Data are obtained from manufacturer data sheets, open-source information, direct communications with vehicle and battery manufacturers, and pack disassembly. Detailed data sources and the granularity of the information on volume data can be found in the Supporting Information (SI) in Table S11.
CES conducts both continuous and occasional research to find indicators that are used to build models for both historical and future data, as most of the EOL statistics are not official or mandatory. Indicators include growth rates, export, reuse, and recycling ratios, and product lifetimes. The different indicators, their origin, role, and updating frequency are presented in detail in SI Table S12.

3.1.2. Data Reliability

Given the lack of mandatory reporting and the complexity of the whole value chain, there are several uncertainties present in the data, especially when it comes to the destiny of batteries after they are placed on the market. However, given the strong dominance of two segments (portable batteries until 2015 and thereafter EV batteries), the transparency is considered to be fairly good given the established trade flows of these applications.
After technical considerations, CES considers prices of used products that include batteries and the used batteries after removal as the most important indicators of the batteries’ fate. So, for example, the likelihood that a battery whose price far exceeds that of its constituent materials will be disposed of, or even sent for recycling, is considered very small. Although legislation is important for directing the general flow of materials, products or batteries with high reuse values sometimes find their way to new markets even if there are bans on export and/or import. Low-value products, on the other hand, may be sent to recycling as the most profitable option.

3.1.3. Data Availability

CES’s data collection and analysis are exclusively funded by subscribers to the company’s services and the company has not received any public funding. Therefore, the source information and raw data are generally not made available outside of the company but have been discussed among the authors of this paper, who have been granted access to the same data provided to subscribers.

3.1.4. Modifications to CES’s Data
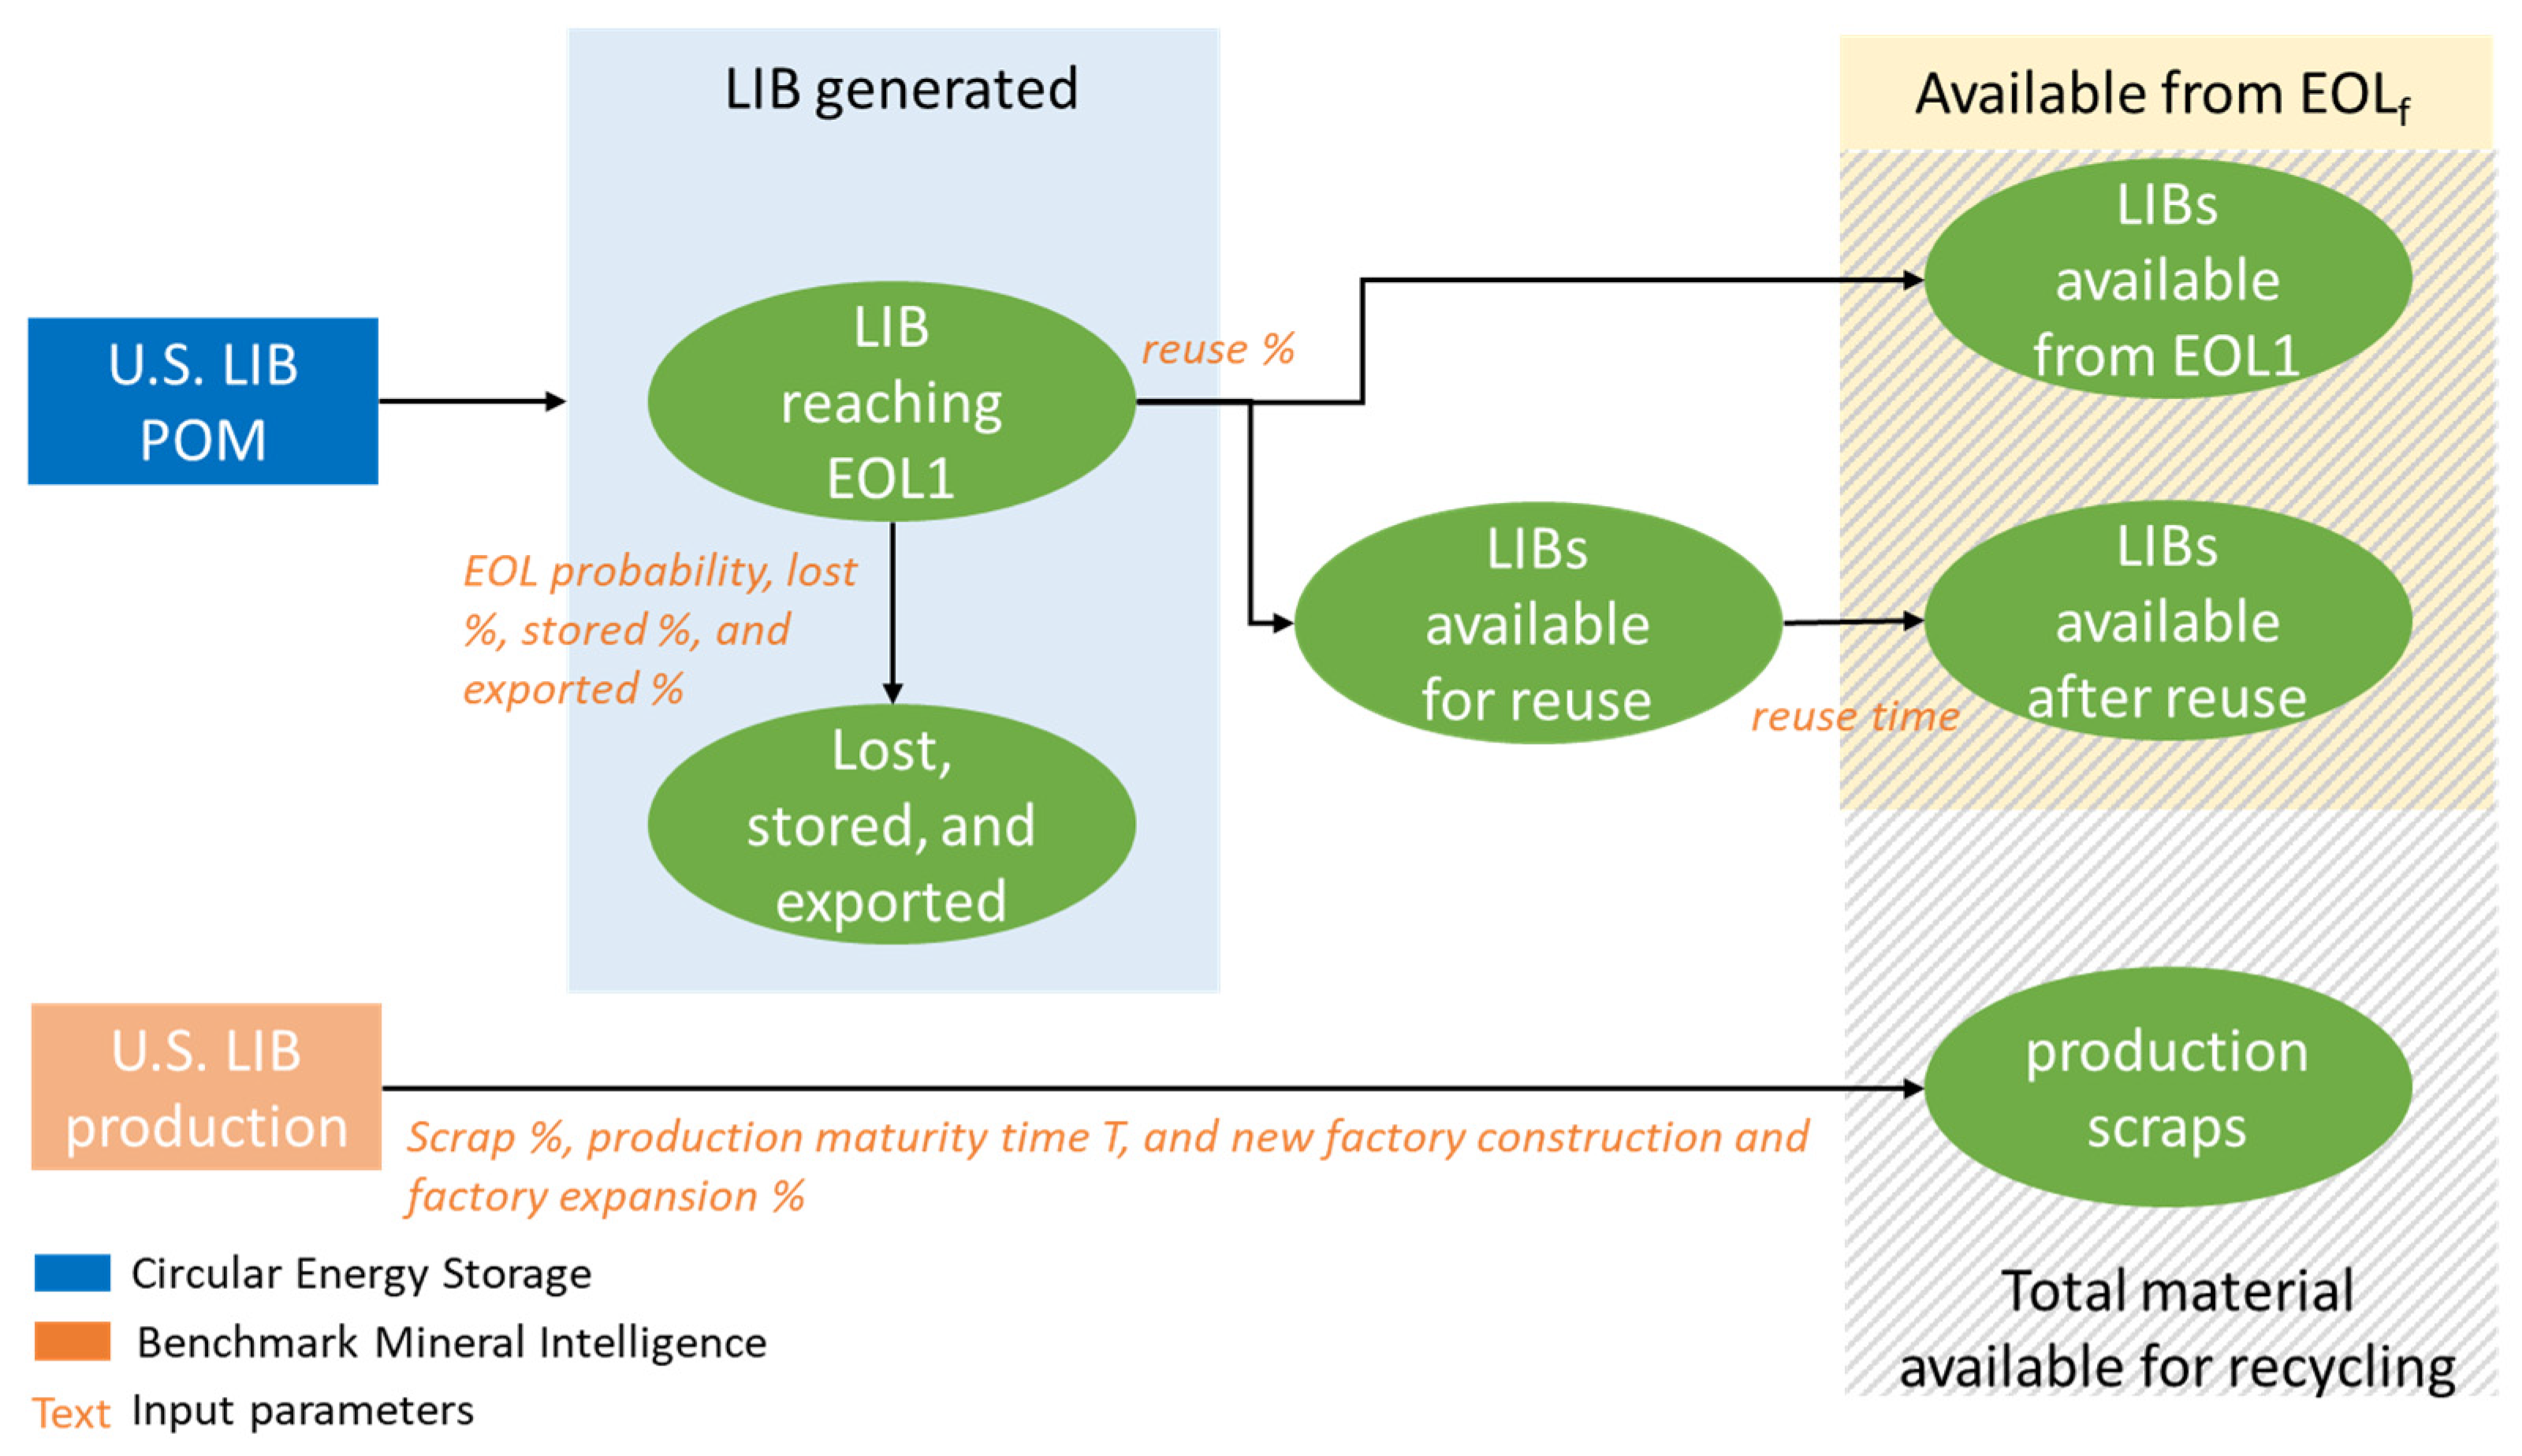
CES used data on products placed on the market and product lifetime information to estimate the quantity of the LIBs generated [9,12]. Additional data were obtained from Benchmark Minerals, the open literature, and our own estimates. In particular, estimates of U.S. recycling plant capacities were based on personal communications with company representatives because of the variance in published information.
This work estimated the quantities generated and made minor adjustments (see Section S1 in the SI) in how CES’s estimates account for some exports, discards, and storage, which resulted in the quantity remaining at EOL1 being less than the original production. These flows are especially difficult to estimate for small, portable device batteries, which dominated the market in the past, so previous EOL1 estimates are uncertain. However, as EV and ESS batteries begin to dominate the market, the large battery packs are not expected to wind up in landfill or storage because they have high value, first for reuse and then for their material content [14]. Tracking EOL1 batteries is thus expected to become easier. A complete list of the input parameters and their data sources are summarized in Table S10 in the SI.

3.1.5. Methodology

Figure 11 is a simple schematic that summarizes the material flows to recycling.
The total material available for recycling is the sum of batteries available for recycling after all uses and material available from production scrap. LIBs are categorized into the primary market sectors defined by CES. Each is further classified based on the specific cathode chemistries used. Representative lifespan probabilities (EOL probabilities) are estimated for each application, as depicted in Figure 3. The quantity of batteries that have gone through their usage phase and reached their EOL (LIBs generated) is calculated using the quantity placed on the market and the lifetime distributions (EOL probabilities). The elements contained were calculated based on detailed data on products sold, their cathode chemistries, and the associated product’s EOL probabilities. LIBs reaching their EOL1 are those generated minus those diverted through storage, loss, or export (which can happen at any stage of the lifecycle). To simplify calculations, the stored, lost, and exported LIBs were determined by multiplying the quantity generated by estimated stored, lost, and exported rates (%). After reaching EOL1, batteries are either available for recycling or available for reuse. It is assumed that those available for reuse will eventually undergo recycling (referred to as R2R). The sum of LIBs available for recycling (from EOL1) and R2R is referred to as LIBs available for recycling from the EOLf. The maximum amounts of Li, Ni, and Co that could be recovered from EOLf were estimated assuming 100% recovery without any reduction due to export, discard, storage, or reuse. The baseline scenario considers the battery storage, loss, export, and reuse, and detailed assumptions can be found in Table 4. The baseline scenario results will be compared to North American recycling capacity in Section 3.3.
Another contribution to the material available for recycling comes from production scrap. Scrap was estimated from U.S. LIB production, scrap rate (%), production maturity time T, and new factory construction and expansion rates (%). In this model, the scrap rate was assumed to decrease from 30% to 5% as experience was gained (defining the production maturity time T). However, factories learn from experience. If LIB demand is supplied by a new factory, it takes T years for a factory to decrease its scrap rate to 5%, but if it is supplied by factory expansion, the scrap rate is assumed to be the average of past scrap rates due to previously gained experience. The split between new factory construction and factory expansion was estimated based on the LIB production increase rate. In 2010, all production was allocated to new factories since the U.S. had just started LIB production. If the LIB production increase rate (production in year i/production in year i-1) is at or over 1.8, it is assumed that 50% of the production increase is from new factories, and the rest is from expansion. If the increase rate is less than 1.8, 80% of the production increase is from factory expansion. This dividing line is set to be 1.8 based on the observed trend of LIB production increasing. Note that the potential supply from recycling is solely from EOLf. because the existence of scrap is accompanied by a corresponding increase in input material demand.

3.1.6. Sensitivity and Scenario Analyses

Sensitivity analyses were conducted to evaluate how input parameter changes affected our baseline results. Separate analyses were conducted for LIBs available from EOLf and materials available from production scrap since LIB POM and production were from different data sources. The input parameters examined for LIBs available from EOLf were stored %, lost %, exported %, reuse %, and reuse time, while the input parameters examined for materials available for production scrap were scrap %, production maturity time T, and new factory construction and factory expansion %. In addition, this study incorporated five different scenarios to assess the variations in LIBs available for recycling from EOLf: alternative lifespan, 30% exported rate for EVs, upper bound without export, loss, and storage, fast LFP penetration, and flattened demand scenarios.

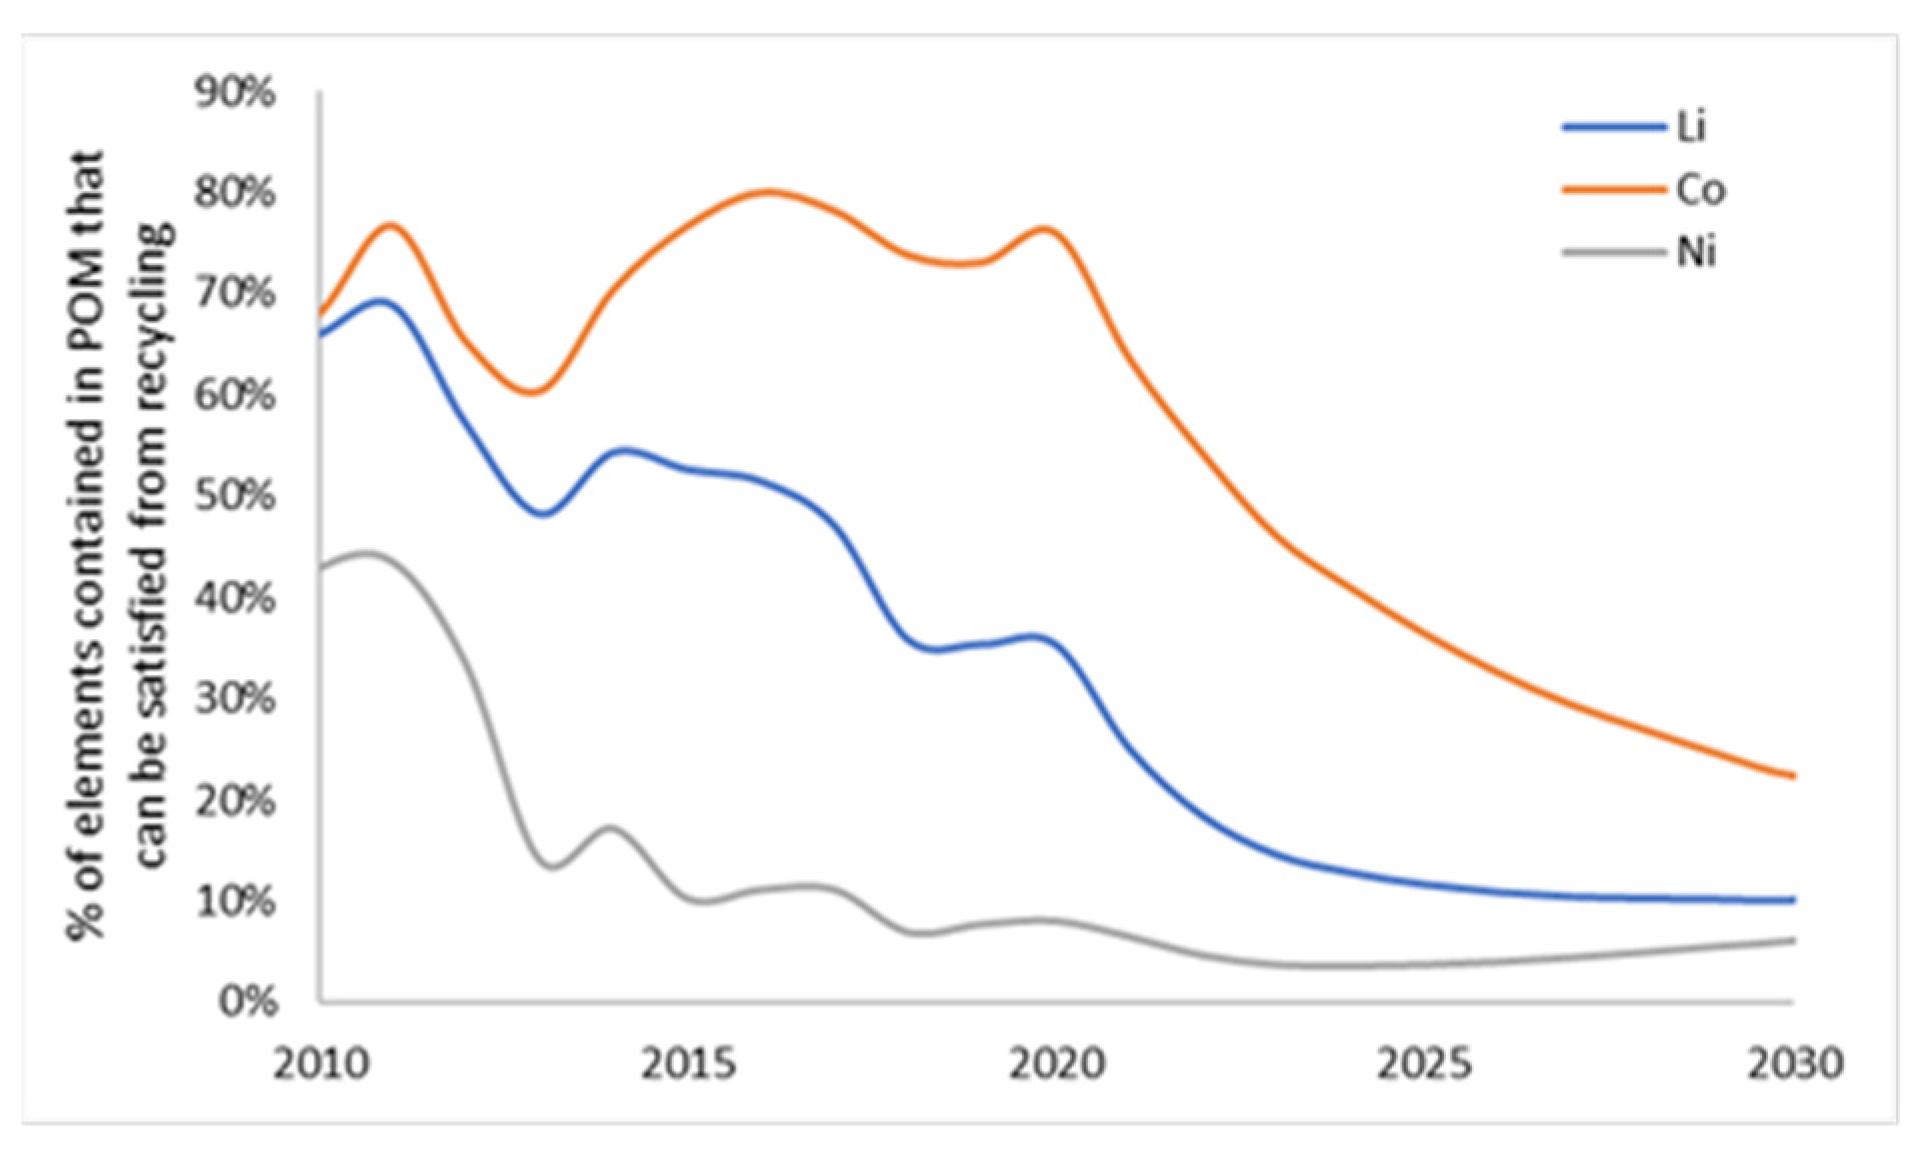
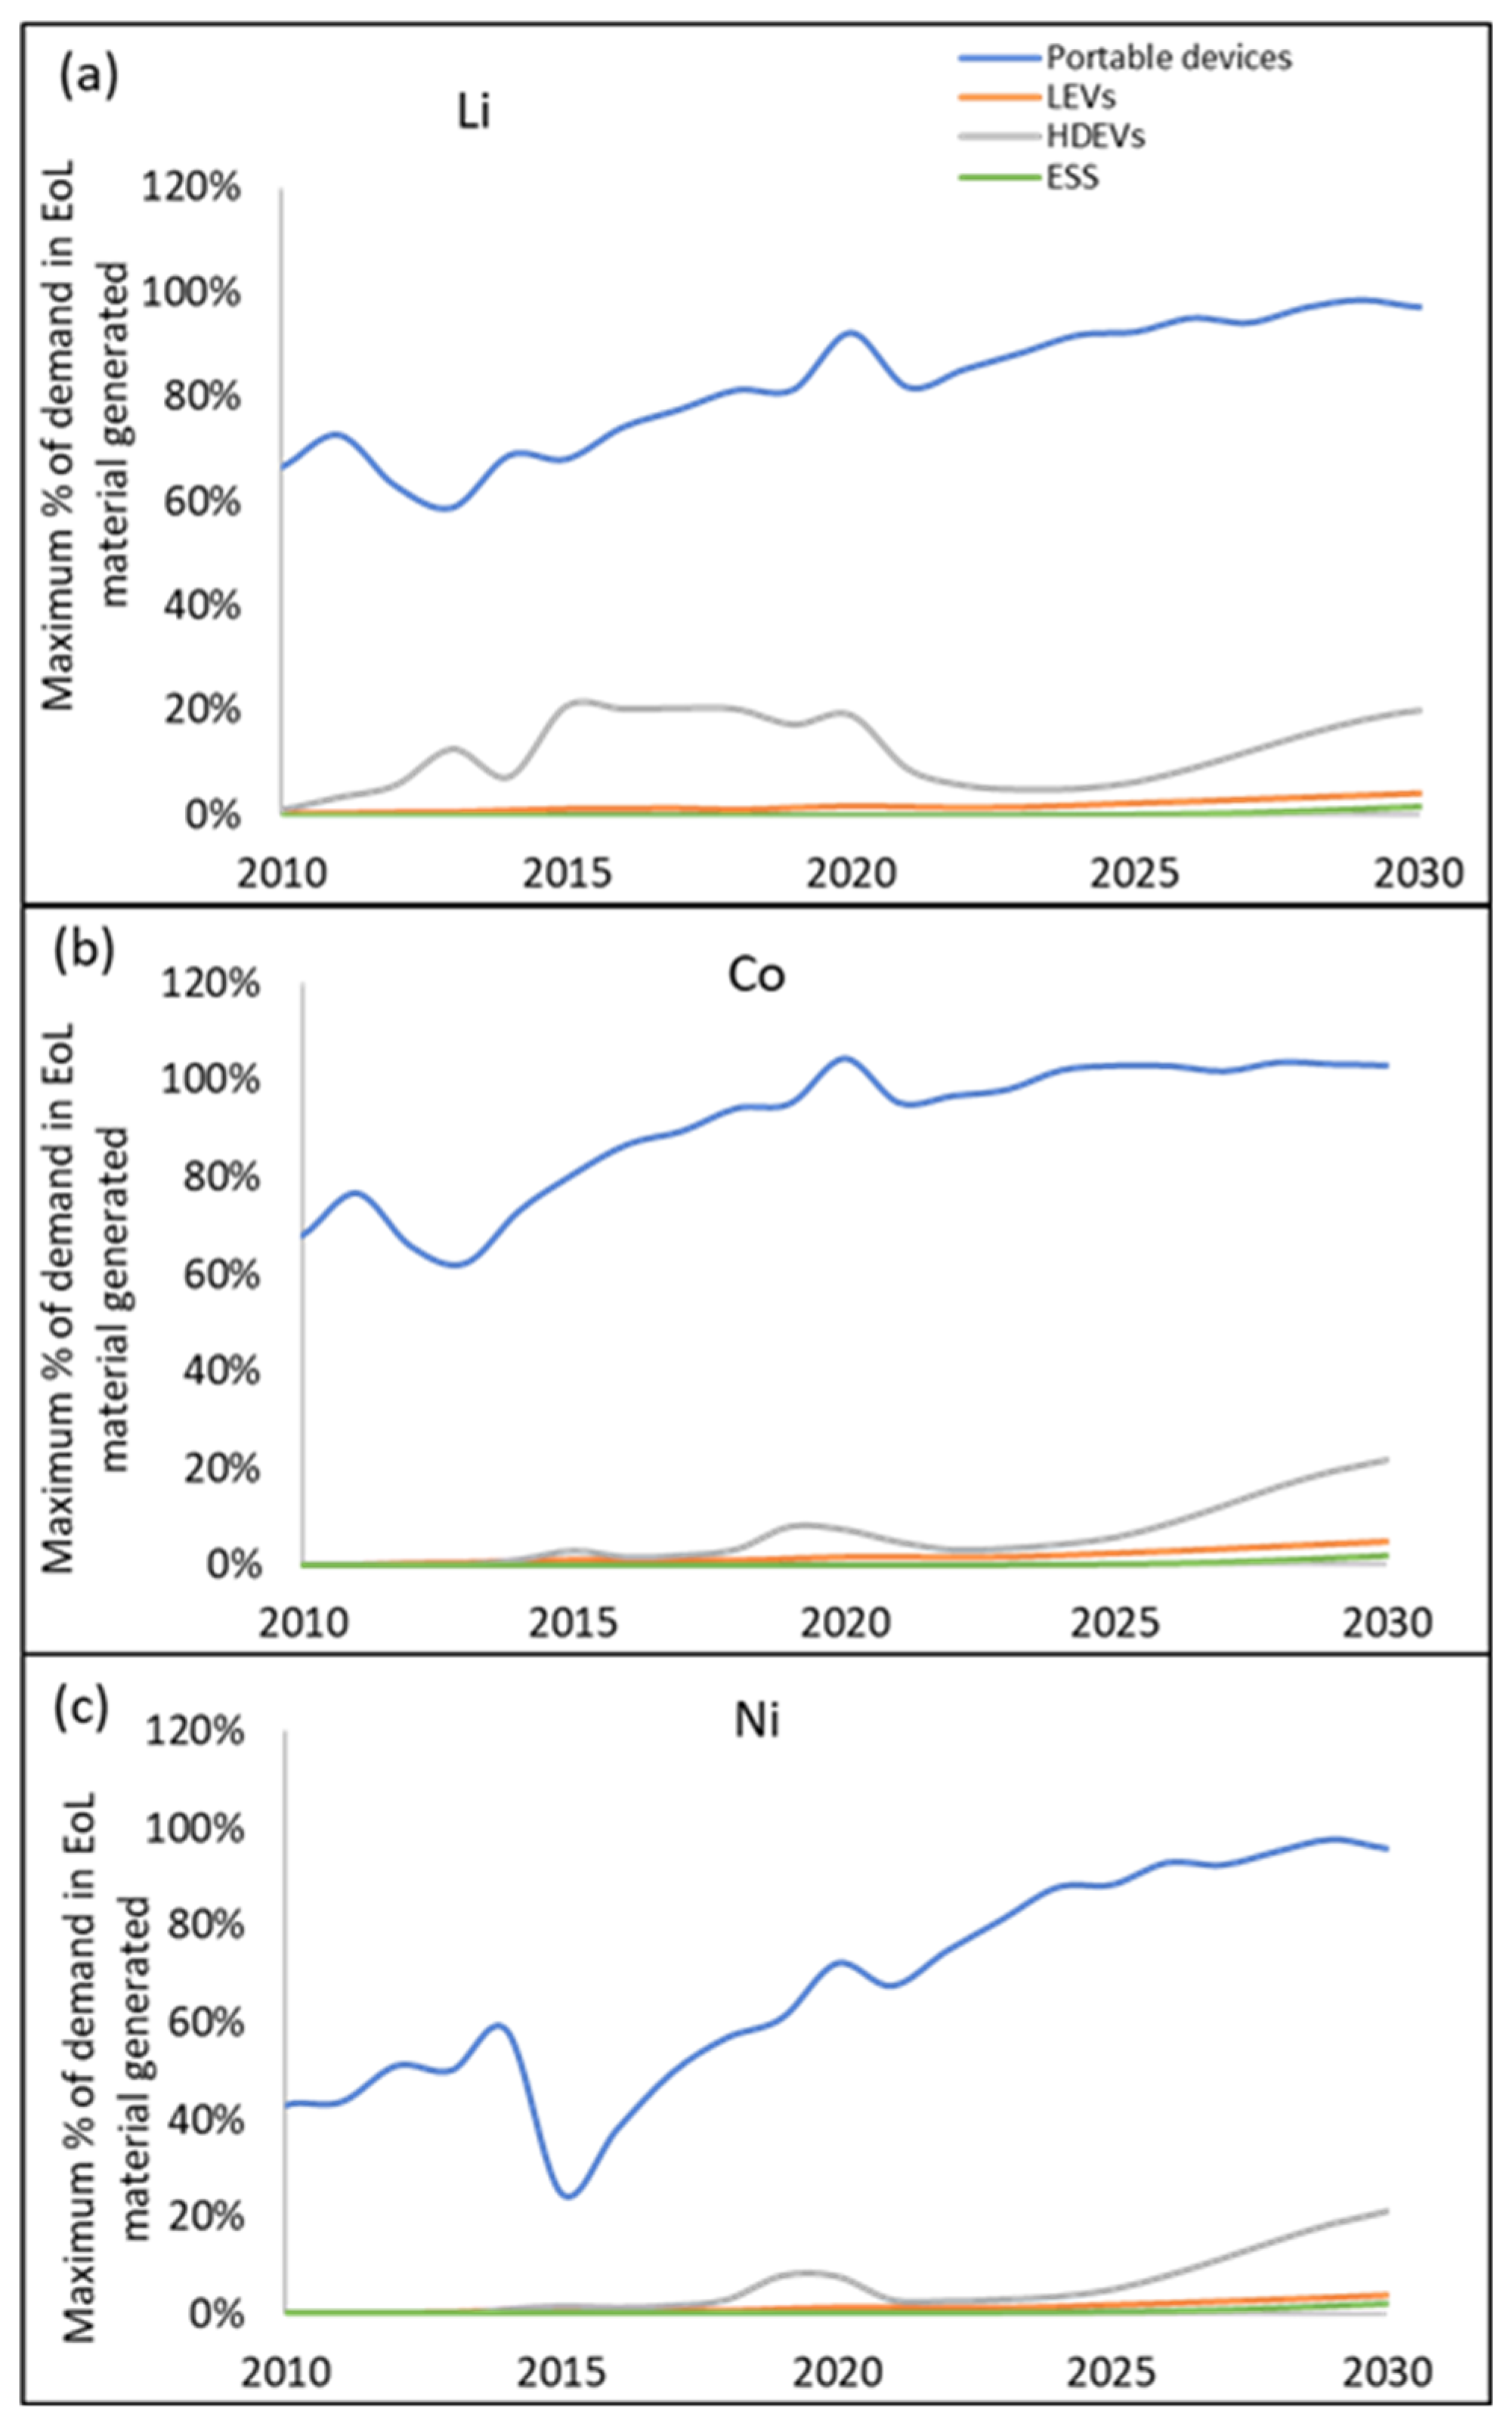
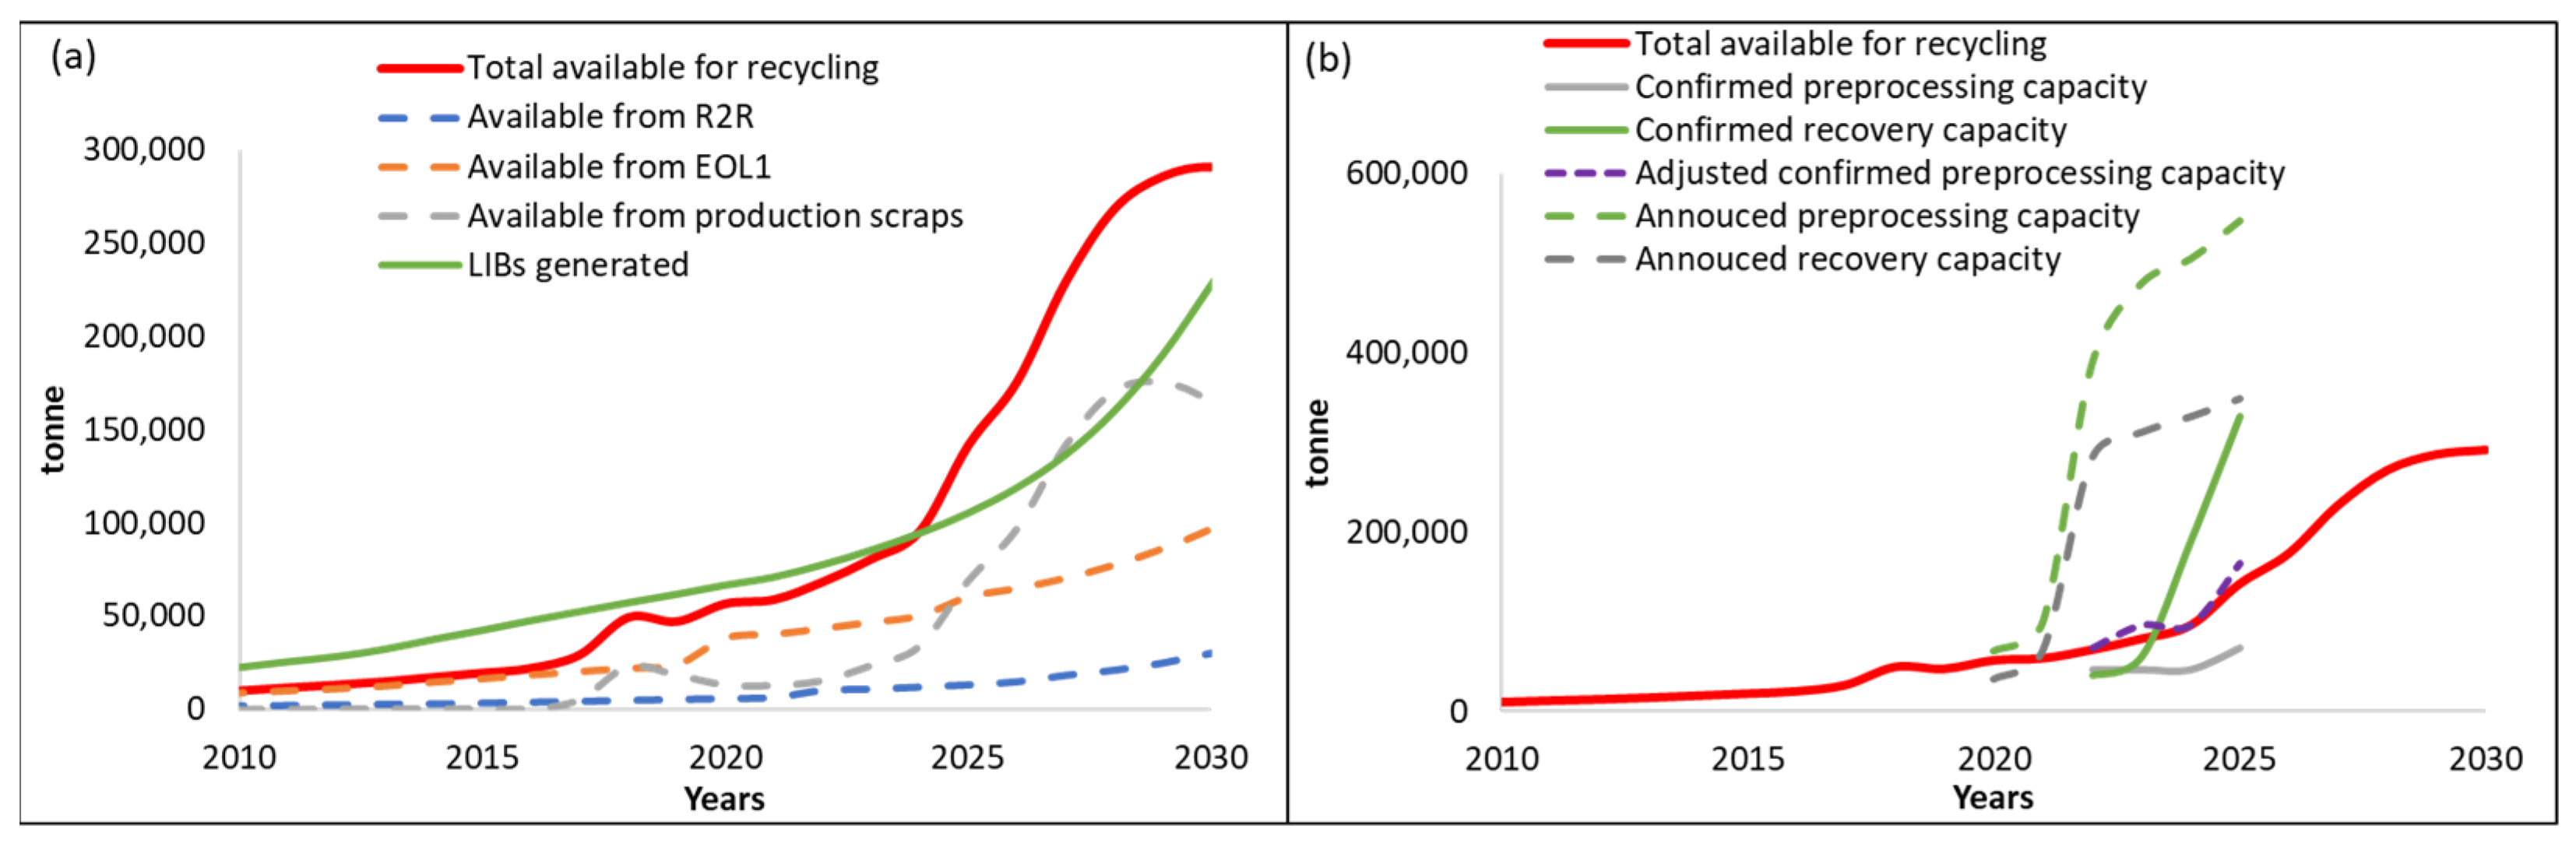
3.2. Demand Compared to Maximum Material Potentially Available from Recycling

We can now compare the maximum quantity of materials that could be recovered from all LIBs generated to the materials required for new battery production. The potential for supplementing primary materials, imported or domestically sourced, through recycling depends on the rate and extent to which batteries reach their end of life and become available for recycling, as well as the growth rate of the battery market. This growth is dominated by light-duty electric vehicles (LEV), which were, until very recently, only a minor presence in the market, resulting in a relatively small stock of material available for recycling compared to the current demand. Both the batteries and the vehicles have very long lifetimes; furthermore, the batteries can find second-life use in applications such as home or charging station storage, backup power, conversion of vehicles and boats to electric propulsion, and utility frequency regulation. These batteries are not available for recycling until a future time when demand has grown significantly. Thus, even if all the batteries could be collected for recycling, their contribution to material supply would be minimal before 2030. Figure 9a compares the mass of used batteries generated from LIBs, with no reuse, no exports, or other losses (the upper bound of material that could possibly be recycled from used batteries), compared to the battery mass placed on the market in the U.S. the same year. In 2030, that upper bound is only about 10%. This could pose a limitation if recycled content standards were imposed (as proposed in the EU [10,25]).
Furthermore, materials from each recycled EV battery will provide battery material for at most one new EV battery to replace it (battery size is growing as well), so freshly produced material is required to supply the batteries for the growing fleet of EVs. While the batteries can be dealt with in a circular flow in which materials go back to the same application, only when the growth eventually slows can the market rely on recycling instead of primary materials. This is because demand is growing, so recovering material from one product lifetime ago, when less was used, cannot satisfy the now-larger demand. There is a lag that can only be made up after growth stops (see Figure 9).
Figure 9b–d compare the projected elemental content of lithium, cobalt, and nickel in LIBs placed on the market in the U.S. to the content of those elements in the generated LIBs (assuming no batteries are diverted), as a function of time. The elemental variation is due to the shifting cathode mix toward higher nickel content. Battery usage rises quickly due to rapid EV penetration, but EVs have long lives and so are not retired during the period. The EOL1 material is dominated by portables, which continue to be available for recycling without much growth. Thus, Figure 12 shows that in the early years, before much EV penetration, material recovered from recycling could have supplied a significant portion of U.S. demand. Of course, that is purely hypothetical since the batteries were almost all produced outside of the U.S. and exported for recycling due to a lack of both domestic production and recycling capacity.
Batteries that are still installed in high-value host products, such as smartphones, tablets, and laptops, are generally exported as part of these products for the reuse market, further limiting the quantity of both electronics and batteries that have been recycled in the U.S. As the much larger EV battery demand takes off, the potential percentage of material available from recycling declines precipitously. It will, of course, rise eventually as demand growth slows.
The differences by market sector can be seen more clearly in Figure 13, which shows the percentage of each element required for that market sector that could theoretically be supplied from generated material. The relatively small and stable portables market could be well supplied by recycling, but the much larger and growing vehicle and energy storage markets could not and will not until after growth slows. Note that these elemental contents are upper bounds, assuming no exported material or other removals. The effect of removing material is discussed later.
We have shown that material obtained by recycling LIBs after they are no longer useful will not make a significant contribution to the overall U.S. battery material supply until well into the 2030s because of the long product lifetime and rapid demand growth for the dominant products. We will still need raw material extraction, imports, and/or substitution of alternative materials. These results compare favorably with those from studies that only considered EV battery recycling. Although we estimate the percent of Li that can be satisfied by recycling to be somewhat lower than the two other studies we found [26,27], there is a consensus that recycling will not make a major contribution to material supply until after 2030.
However, there are several factors that can influence this conclusion and modify the relative impact of different materials. Therefore, we used sensitivity analysis to explore how changing the key parameters modified our conclusions. The initial analysis was based on an upper-bound estimate of recoverable material: the quantity generated. We estimated the maximum quantity of material that could be recovered from batteries going out of service if there was no repurposing, losses or discards, stored products, or exports. Now, we examine how much the quantity of material recoverable would be reduced by these diversions. Of these, the most important is exports, as large quantities of spent batteries and no-longer-useful (by U.S. standards) devices are known to be shipped to Asian countries (note that there are also small quantities of recyclable EV batteries imported into the U.S. [26], partially counteracting the exports). Each of these factors behaves the same way: each removes a fraction of the material generated from circulation so that it is not available for domestic collection and recycling at the end of its life. Removal of 30% of the material generated in 2030 from the stream available for recycling would reduce the overall percentage of demand that could be supplied from used material from 9.9% to 6.9% (SI Section S6).
Sensitivity analysis confirms that the percentage of material demand that could be satisfied by recovered material could be raised if future material demand rose more slowly than projected. Shorter lifetimes for the products would bring material back for recycling sooner, but replacement products would be needed sooner as well, increasing demand and counteracting any benefit. The sensitivity analysis also highlights the importance of additional key factors such as scrap rate, which is expected to decrease. The U.S. lacked significant LIB production capacity until 2015, and during this period, LIBs were predominantly produced in new factories with higher scrap rates than factory expansions. Detailed results of the sensitivity analysis can be found in Section S5 of the SI.
Additionally, scenario analysis reveals that the percentage available from recycling for each element could be changed if the battery chemistry mix was altered. A shift to lithium iron phosphate (LFP) or other low-Co and Ni chemistry would increase the percentage of demand for these elements that could be supplied by recycling. This is consistent with the other studies that also suggest a higher percentage of element satisfaction with the projected decrease in cobalt content in NMC and NCA cathodes. Analysis of these factors is examined in more detail in SI Section S6.

3.3. U.S. Material Availability and Processing Capacity

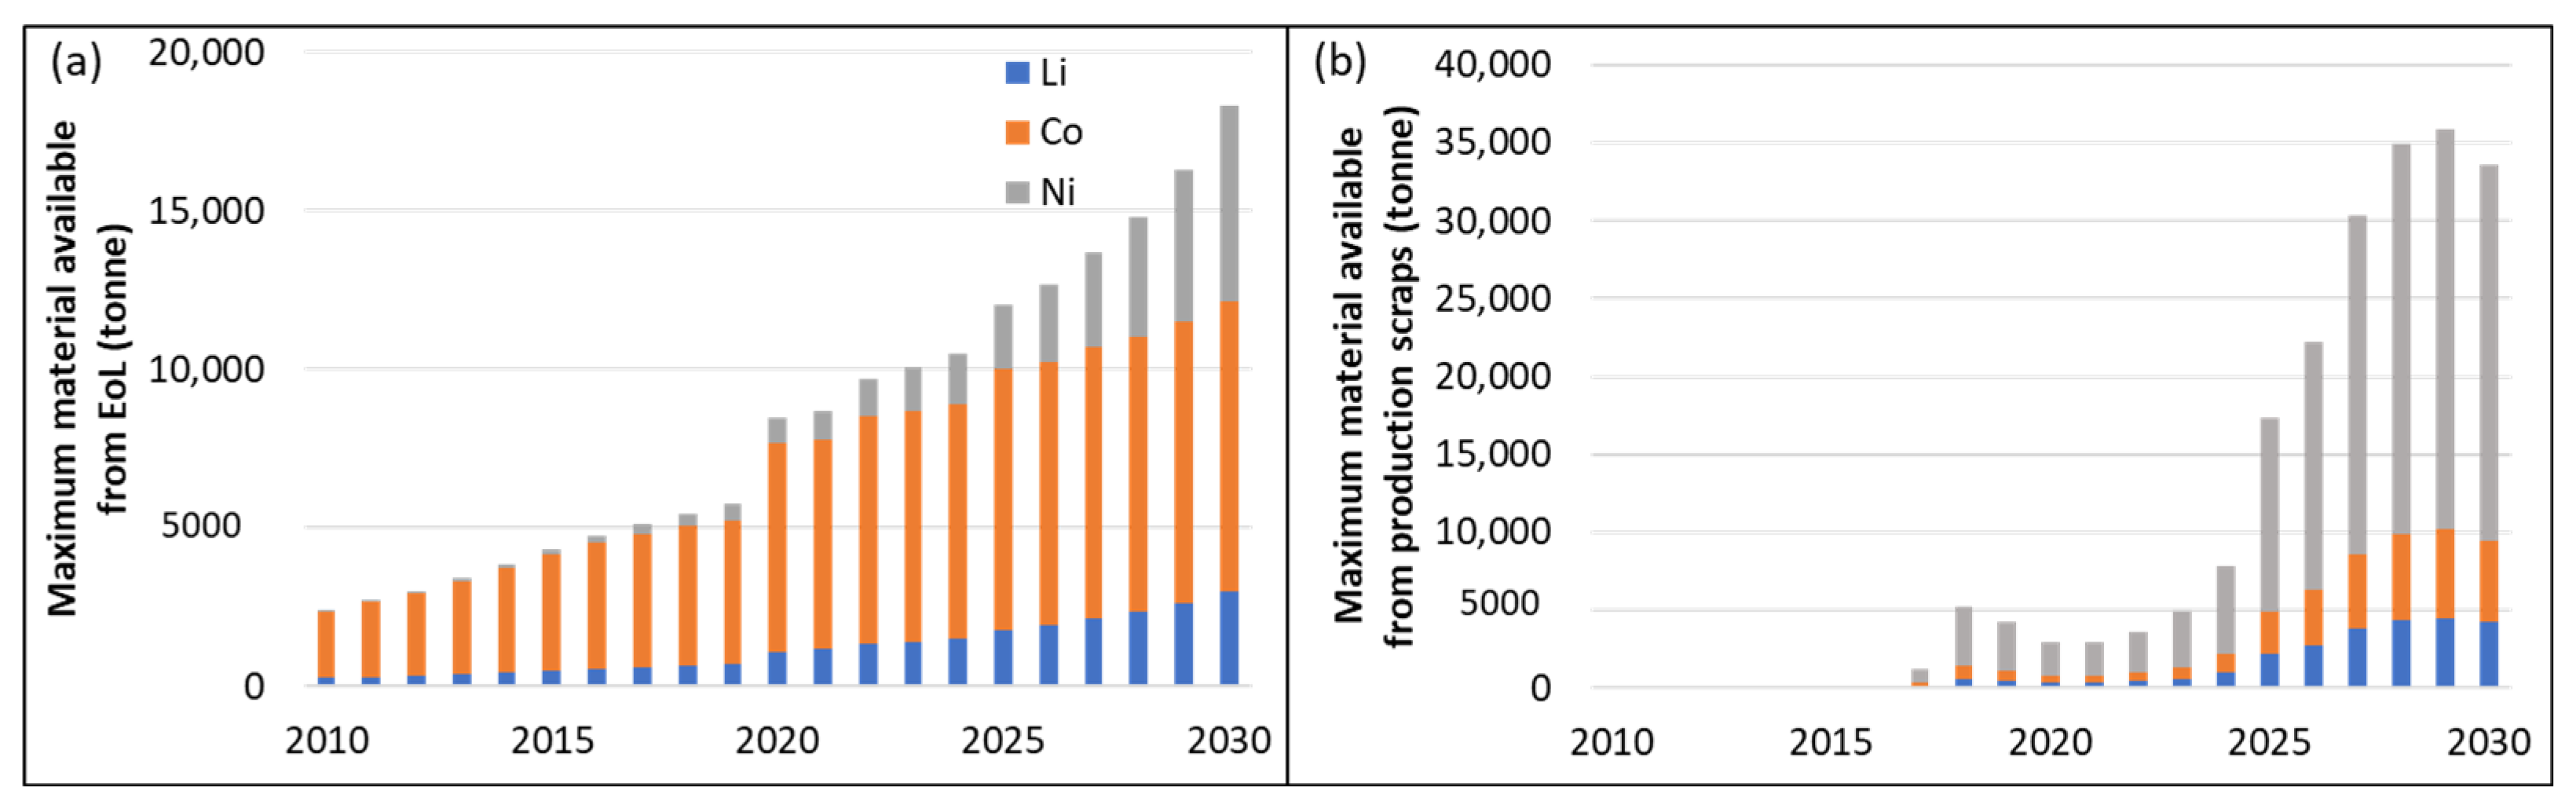
3.3.1. Material Availability

The actual quantity of material from spent batteries that can be fed into domestic recycling plants will be considerably less than the upper bound (maximum) estimated earlier. Material is exported all along the battery lifecycle, portable electronic devices are thrown away, and devices may be stored for potential later use. Using POM data from CES [9] and assuming the material reductions from exports, storage, and discards shown in Table 4, we estimated the quantity and the composition of EOLf battery material that will be available in the U.S. Exports play a significant role before 2025 due to the high volume of portable devices that are exported to other countries, such as China, for reuse or recycling. As more EV batteries come back from reuse and fewer portable devices are exported, the fraction of reuse and its duration will become more important.
The remaining EOL material can be fed into U.S. recycling facilities, along with manufacturing scrap. Scrap rate plays a key role as domestic production capacity grows, and much of the production is from new factories. Factory expansion is assumed to take advantage of a learning curve and have lower scrap rates than greenfield plants (more detail on sensitivity to plant maturation time can be found in SI Sections S1.2 and S5). Figure 14 shows the different contributions to material available for recycling in the U.S., with manufacturing scrap making a significant contribution as U.S. battery production ramps up. The total quantity of material that can go to recycling plants is greater than the spent batteries generated. The contribution from batteries completing their second/subsequent lives consists mainly of batteries from portable electronics, as few long-lived EV batteries will have completed their second lives by 2030.
The cathode elements contained in the EOL and scrap material streams are compared in Figure 15. The overall feed available will contain a rapidly rising fraction of nickel and a corresponding decrease in cobalt. This implies a decrease in potential revenues available from the production of precursors. Not surprisingly, two U.S. recyclers (Ascend Elements and Redwood Materials) have announced that they will be producing cathode material to maximize product value [27,28].

3.3.2. North American Recycling Capacity

Recycling capacity is expanding rapidly in North America. Companies perform different services and produce products that re-enter the manufacturing process at different stages. Some of the possible recycling operations include the following:
  • Collection/consolidation;
  • Sorting;
  • Size reduction/dismantling;
  • Black mass recovery (but note some recovery processes might not go via black mass);
  • Precursor production;
  • Production of cathode and other products.
Our tabulation of recycling capacities is split into preprocessors, which perform process steps up to and including black mass recovery, and recovery plants, which actually accomplish some additional chemical or physical upgrading of the material to a market commodity. The declared capacities cannot simply be added, since some companies perform only one process step, and material may be processed by several companies on its path. Care must therefore be taken to avoid double counting. On the other hand, some pre-processing capacity exists at recovery plants and adds to total preprocessing capacity, but is not included in lists of preprocessors. Recovery companies that stated they processed batteries were assumed to have preprocessing capabilities. A table of known recyclers in North America is included in the SI (Tables S14 and S15).
Now we can compare recycling capacity to material expected to be available as feedstock for the plants. Figure 14b shows U.S. preprocessing capacity (with and without that inferred at recovery facilities) as well as recovery capacity, both announced and actually confirmed by company contacts. Announcements far exceed confirmed capacity. These are compared to the quantity of material expected to be available for recycling: the sum of manufacturing scrap and EOLf material. In the near term, capacity appears to be in excess. Indeed, one expert has called this a “tsunami of recycling companies” [29], further encouraged by incentives from the U.S. government. However, if processing capacity comes online in modular units or if consolidation occurs, large capacity excesses might not occur. Additionally, towards 2030, the material available could exceed the capacity to process it unless additional capacity that has not been announced yet is built; however, there is still sufficient lead time.

4. Summary and Conclusions

Recycling is an area of broad interest, from consumers dealing with packaging to industries that must cope with thousands of tons of manufacturing scrap, but a careful definition of the terms to describe the processes and flows has been lacking, hindering scholarly and policy discussions. This paper has attempted to define such terms as “recycling” and “recycling rate” while extending the scope to cover complex products such as LIBs. Such products are composed of numerous components that can be recycled separately or together in various ways so that a single number does not adequately characterize the product’s fate. We propose terms such as “element-specific recycling rates” and suggested a hierarchy of recycling processes to better characterize the fate of EOL products.
We estimated the generation rate of battery materials from product lifetime distributions and historical data of products placed on the market. Then, we applied the proposed definitions to LIBs and, in spite of data limitations on quantities actually recycled, estimated that in 2019, approximately 54% of no-longer-usable LIBs generated in the U.S. were recycled, almost 10% domestically and 44% in China. The quantity recycled in the U.S. will increase as an adequate capacity of recycling plants is commissioned. The global LIB recycling rate in 2019 was estimated at 59%. Element-specific recycling process efficiencies for different recovery processes ranged from zero to almost 100%. Recycling rates are expected to increase as large batteries from EVs and ESS, which represent concentrated sources of expensive materials, come out of service, possibly after cascading uses.
We also compared overall and element-specific generation rates—the total quantity coming out of service—to domestic demand and found that even if all that material could be collected, it would only supply about 10% of our requirements in 2030 because of long product life and rapid growth. Recycled material can buffer prices and provide a domestic source, but its short-term potential is limited. Virgin materials will still be needed until after demand growth stops. The percentage varies by element and is sensitive to exports and other losses that significantly reduce what can be collected and recycled. Longer product life also reduces the material available for recycling. Reduced demand for battery materials would increase the contribution from recycling temporarily, and a shift away from NMC could raise the percentages of nickel and cobalt available from recycling.
The battery manufacturing industry is growing rapidly in the U.S., further encouraged by the recent Bipartisan Infrastructure Investment and Jobs Act and the Inflation Reduction Act of 2022 [30,31]. Production growth yields a significant volume of scrap material that serves as feedstock for the nascent recycling industry. This material is available now in large quantities as start-up issues are being resolved, which enables the recycling industry to build up before large volumes of EV batteries come out of service and need recycling. However, the availability of recycled scrap material does not reduce the need for virgin material. Beyond 2035, EOL batteries possess the potential to emerge as a substantial source of battery materials, provided that we make substantial advancements in recycling technologies and systematically expand recycling efforts.
In summary, the recycling of LIBs is both important and necessary as it aids in mitigating supply issues. However, considering the rapid growth in battery demand to fulfill the immediate requirements of transport decarbonization, we still need to find additional ways to supply and use materials more efficiently.

Supplementary Materials

The following supporting information can be downloaded at: https://www.mdpi.com/article/10.3390/batteries9070360/s1, Materials available for recycling model and key assumptions, data sources, results, pretreatment and recovery capacity in North America, sensitivity analysis, scenario analysis, validation of the data with data from CES, and upper and lower bounds of the model [32,33,34,35,36,37,38,39,40,41,42,43,44,45,46,47,48,49,50].

Author Contributions

L.G.: conceptualization and writing—original draft and preparation; J.Z.: methodology, formal analysis, software, writing Supplementary Materials; X.H. resources, review and editing, supervision, funding acquisition; J.B.: consultation, project administration; H.E.M.: data collection and curation, methodology. All authors have read and agreed to the published version of the manuscript.

Funding

This work was supported by the Aramco Services Company. Argonne National Laboratory is a U.S. Department of Energy laboratory operated by UChicago Argonne, LLC under Contract no. DEAC02-06CH11357.

Data Availability Statement

Data were obtained from different resources, including analysts, industry organizations, investor presentations, annual reports, open and subscribed data sources, etc. Table S11 in the Supporting Information summarizes the data sources.

Acknowledgments

The authors thank David Gohlke for data on vehicle registrations and exports and thank both him and Jarod Kelly for helpful technical discussions. We also thank the many recyclers who shared their company information with us and our very helpful summer student Jessica Moon Sun, who gathered recycler data.

Conflicts of Interest

The authors declare no conflict of interest. Co-authors X. He and J. Bouchard are employees of Aramco Americas, which is a U.S. subsidiary of Saudi Aramco. Saudi Aramco is a fully integrated energy company whose business interests include the sale of crude oil and refined products. Saudi Aramco did not influence any research stage of this study.

Glossary

These definitions are excerpted and expanded from those developed for the ReCell Center [51].
  • Cathode-to-Cathode Recycling: Recovery of cathode material for reuse in a battery (see direct recycling).
  • Gross Available for Recycling: Total material that is ready to be recycled in a given year; equal to the sum of the material available for recycling at EOL, reaching the end of its utility in reuse, and production scrap.
  • Closed-Loop Recycling: Recycling of material into the same product from which it was recovered.
  • Collected: The quantity of material gathered and kept out of the waste stream.
  • Direct (Cathode) Recycling: Recovery, regeneration, and reuse of battery components (cathode material) directly without breaking down the chemical structure.
  • Disposal: Final non-productive disposition of a material for which no use is economical, often in a landfill.
  • Element-Specific Recycling Process Efficiency: 100× the usable quantity of the element exiting the process divided by that entering. It may differ by element for any given process.
  • Element-Specific Recycling Rate: The mass of an element actually recycled, divided by the its mass contained in the used material generated that year (expressed as a percent).
  • End-of-(First)-Life (EOL1): Standard designation of a product that has reached the end of its useful life for its primary application (typically falling below 80% of original discharge capacity for EV batteries). It is when a battery is removed from its first host product. It may still be usable for one or more subsequent lives.
  • End of Final Life (EOLf): Designates a battery that has been repurposed until no longer serviceable and is sent for recycling. The additional material is accounted for as “R2R” (reuse to recycling) and gets added to material available for recycling after its first life.
  • Export %: Percentage of used LIBs (in or out of vehicles) that are sold overseas.
  • Generated: All the material that reaches the end of its usefulness, wherever it is.
  • Hydrometallurgy: Process or technique of extracting material at ordinary temperatures by leaching ores (or recovered material) with liquid solvents.
  • Lost %: Mass percentage of LIBs that would have been expected to go out of service at this time but are instead lost or discarded. EOL material is reduced by this material. Expected to be negligible for EV and ESS uses.
  • New Scrap: Scrap generated in manufacturing processes from out-of-specification products or general manufacturing reject material (also known as home scrap or pre-consumer).
  • Old Scrap: Material from end-of-life products that can be recovered (also known as post-consumer scrap).
  • Open-Loop Recycling: Recycling a material into a different product than the one from which it was recovered.
  • Production Maturity Time: Years required for a factory to decrease production scrap (from 30%) to 5%.
  • Percent Recycled: 100× the quantity of EOL material processed (at least to shred stage) in a given year divided by the quantity of material generated in that year. It will differ by type of product, location, and time. Scrap, test, and unsold material are not included.
  • Placed on Market: Made available for sale; equivalent to product demand.
  • Preprocessing: Recycling process steps up to/including black mass recovery.
  • Pyrometallurgy: Process or technique of refining ores (or recovered material) using heat to melt the metallic and burn the non-metallic content.
  • Recovery: Recycling processes that accomplish chemical or physical upgrading of the material to a market commodity such as cathodes or cathode precursors.
  • Recycle: Convert materials that are no longer functional into usable materials or products.
  • RE: The “RE” terms below are widely used with varying connotations. Terms are not mutually exclusive.
  • Recycled Content: The percent of mass post-consumer material contained in a recycled product (this may also differ by element).
  • Recycling Process Efficiency: can be defined as 100× (a) the mass of recycled materials exiting the recycling process and returned to the economy, divided by (b) the mass of materials entering the recycling process. (Recycled product/Recycling process input).
  • Recycling Rate: the mass of used material actually recycled, divided by the mass of used material generated that year (expressed as a percent).
  • Refurbish: Repair or freshen a product to meet original specifications, typically done by the original manufacturer. Generally, does not entail major modification.
  • Rejuvenate: Restore materials or devices to performance similar to their pristine state. Similar to refurbish, but not necessarily done by the original manufacturer.
  • Remanufacture: Return previously sold, worn, or non-functional products to same-as-new condition and performance for original use. Automotive parts are disassembled and re-machined during remanufacture.
  • Repair: Restore to operational condition.
  • Repurpose: Reuse a battery pack or components for a new and often less demanding application. Generally, requires reconfiguration and new BMS.
  • Reuse: Using a product again with or without major modifications. (Generic term).
  • Reuse %: Percentage of EOL LIBs judged available for reuse.
  • Reuse time: Length of service in 2nd and subsequent lives.
  • Scrap: Material that enters production process but does not make it out as usable product. Could define percent as 100 minus yield for a simple process.
  • Second Life: Use of an end-of-life battery for a new purpose. Possibly then suitable for another, even less-demanding use, or unusable, i.e., spent (see below).
  • Secondary Material: Material that has been previously used and is to be used again.
  • Spent Battery: Battery or cell that can no longer supply sufficient storage capacity for use. Suitable for recycling to recover useful components.
  • Stored %: Mass percentage of (portable device) LIBs that would have been expected to go out of service at this time but are instead stored by the user, so still counted as in use.
  • Upcycle: Recycle to a higher-value use. DOE’s ReCell Center is trying to upcycle NMC111 to NMC622.

References

  1. Xu, C.; Dai, Q.; Gaines, L.; Hu, M.; Tukker, A.; Steubing, B. Future material demand for automotive lithium-based batteries. Commun. Mater. 2020, 1, 99. [Google Scholar] [CrossRef]
  2. Neidhardt, M.; Mas-Peiro, J.; Schulz-Moenninghoff, M.; Pou, J.O.; Gonzalez-Olmos, R.; Kwade, A.; Schmuelling, B. Forecasting the global battery material flow: Analyzing the break-even points at which secondary battery raw materials can substitute primary materials in the battery production. Appl. Sci. 2022, 12, 4790. [Google Scholar] [CrossRef]
  3. Abdelbaky, M.; Peeters, J.R.; Dewulf, W. On the influence of second use, future battery technologies, and battery lifetime on the maximum recycled content of future electric vehicle batteries in Europe. Waste Manag. 2021, 125, 1–9. [Google Scholar] [CrossRef] [PubMed]
  4. Shafique, M.; Rafiq, M.; Azam, A.; Luo, X. Material flow analysis for end-of-life lithium-ion batteries from battery electric vehicles in the USA and China. Resour. Conserv. Recycl. 2022, 178, 106061. [Google Scholar] [CrossRef]
  5. Richa, K.; Babbitt, C.W.; Gaustad, G.; Wang, X. A future perspective on lithium-ion battery waste flows from electric vehicles. Resour. Conserv. Recycl. 2014, 83, 63–76. [Google Scholar] [CrossRef]
  6. Dunn, J.; Slattery, M.; Kendall, A.; Ambrose, H.; Shen, S. Circularity of lithium-ion battery materials in electric vehicles. Environ. Sci. Technol. 2021, 55, 5189–5198. [Google Scholar] [CrossRef] [PubMed]
  7. U.S. Geological Survey. Mineral Commodity Summaries 2023; U.S. Geological Survey: Reston, VA, USA, 2023. [CrossRef]
  8. Knehr, K.W.; Kubal, J.J.; Nelson, P.A.; Ahmed, S. Battery Performance and Cost Modeling for Electric-Drive Vehicles: A Manual for BatPaC V5.0; ANL/CSE-22/1; Argonne National Laboratory: Lemont, IL, USA, 2022. [Google Scholar] [CrossRef]
  9. CES Online. Batteries Placed on the Market. Available online: https://www.circularenergystorage-online.com/placed-on-the-market (accessed on 1 October 2022).
  10. European Parliament; Council of the European Union. Battery Directive 2006: Directive 2006/66/EC of the European Parliament and of the Council of 6 September 2006 on Batteries and Accumulators and Waste Batteries and Accumulators and Repealing Directive 91/157/EEC. 2006. Available online: https://eur-lex.europa.eu/legal-content/EN/ALL/?uri=CELEX%3A32006L0066 (accessed on 10 May 2023).
  11. Kendall, A.; Slattery, M.; Dunn, J. Lithium-ion Car Battery Recycling Advisory Group Final Report; California Environmental Protection Agency: Sacramento, CA, USA, 2022. Available online: https://calepa.ca.gov/wp-content/uploads/sites/6/2022/05/2022_AB-2832_Lithium-Ion-Car-Battery-Recycling-Advisory-Goup-Final-Report.pdf (accessed on 1 June 2023).
  12. CES Online. Batteries Reaching End of Life. Available online: https://www.circularenergystorage-online.com/end-of-life (accessed on 1 October 2022).
  13. CES. The Lithium-Ion Battery Life Cycle Report 2021; Circular Energy Storage Research and Consulting: London, UK, 2021; Available online: https://static1.squarespace.com/static/587657ddbe659497fb46664c/t/5fdaa991dc2ddb6396c30fa6/1608165783527/The+lithium-ion+battery+life+cycle+report+sample.pdf (accessed on 10 September 2022).
  14. Melin, H.E. Update on Used EV Battery Prices–New Indicators, Drivers and Data; Circular Energy Storage Research and Consulting: London, UK, 2022; Available online: https://www.circularenergystorage-online.com/_files/ugd/0cdb21_9e5c976aa70742458f1b2763cefdc351.pdf (accessed on 10 September 2022).
  15. Gaines, L.; Dai, Q.; Vaughey, J.; Gillard, J. Direct Recycling R&D at the ReCell Center. Recycling 2021, 6, 31. [Google Scholar] [CrossRef]
  16. Harper, G.; Sommerville, R.; Kendrick, E.; Driscoll, L.; Slater, P.; Stolkin, R.; Walton, A.; Christensen, P.; Heidrich, O.; Lambert, S.; et al. Recycling lithium-ion batteries from electric vehicles. Nature, 2019; 75, 75–86. [Google Scholar] [CrossRef] [Green Version]
  17. Gaines, L. The future of automotive lithium-ion battery recycling: Charting a sustainable course. Sustain. Mater. Technol. 2014, 1–2, 2–7. [Google Scholar] [CrossRef] [Green Version]
  18. Argonne National Laboratory. GREET® Model: The Greenhouse Gases, Regulated Emissions, and Energy Use in Transportation Model. Available online: https://greet.es.anl.gov/ (accessed on 12 June 2023).
  19. Argonne National Laboratory. EverBatt. Available online: https://www.anl.gov/amd/everbatt (accessed on 22 October 2022).
  20. Sphera. Search Life Cycle Assessment Datasets (fka GaBi). Available online: https://sphera.com/product-sustainability-gabi-data-search/ (accessed on 3 June 2023).
  21. SimaPro. LCA Software for Informed Change-Makers. Available online: https://simapro.com/ (accessed on 3 June 2023).
  22. U.S. Environmental Protection Agency. ReCiPe2016v1.1 for FEDEFLv1. Available online: https://edg.epa.gov/metadata/catalog/search/resource/details.page?uuid=%7B2EB191F8-43DB-4CF1-8DFD-E4F1652133AC%7D (accessed on 3 June 2023).
  23. Ellen Macarthur Foundation. The Butterfly Diagram: Visualizing the Circular Economy. Available online: https://ellenmacarthurfoundation.org/circular-economy-diagram (accessed on 3 June 2023).
  24. Bai, Y.; Hawley, W.B.; Jafta, C.J.; Muralidharan, N.; Polzin, P.J.; Belharouak, I. Sustainable recycling of cathode scraps via Cyrene-based separation. Sustain. Mater. Technol. 2020, 25, e00202. [Google Scholar] [CrossRef]
  25. European Parliament. Batteries: Deal on New EU Rules for Design, Production and Waste Treatment. Available online: https://www.europarl.europa.eu/news/en/press-room/20221205IPR60614/batteries-deal-on-new-eu-rules-for-design-production-and-waste-treatment (accessed on 26 May 2023).
  26. Czarnota, M.; Recharge Recycling LLC, Flint, MI, USA; Gaines, L.; Argonne National Laboratory, Lemont, IL, USA. Personal communication. 2023. [Google Scholar]
  27. Randall, T. A Tesla Co-Founder Aims to Build an Entire US Battery Industry. Available online: https://www.bloomberg.com/news/articles/2021-09-14/a-tesla-co-founder-aims-to-build-an-entire-u-s-battery-industry?srnd=hyperdrive&leadSource=uverify%20wall (accessed on 1 June 2023).
  28. Ascend Elements. Ascend Elements Begins Construction of Apex 1 in Southwestern Kentucky. Available online: https://ascendelements.com/ascend-elements-begins-construction-of-apex-1-in-southwestern-kentucky/ (accessed on 1 March 2022).
  29. Spiers, D. Roundtable: Who Will the Winners and Losers in the Battery Business Be Five Years From Now? In Proceedings of the 14th Annual NAATBaat Annual Meeting, Litchfield Park, AZ, USA, 20–23 February 2023. [Google Scholar]
  30. CRS. Infrastructure Investment and Jobs Act. In Proceedings of the 117th U.S. Congress, Washington, DC, USA, 3 January 2021; Available online: https://www.congress.gov/117/bills/hr3684/BILLS-117hr3684enr.pdf (accessed on 1 June 2023).
  31. CRS. Inflation Reduction Act of 2022. In Proceedings of the 117th U.S. Congress, Washington, DC, USA, 3 January 2021; Available online: https://www.congress.gov/bill/117th-congress/house-bill/5376/text (accessed on 1 June 2023).
  32. Circular Energy Storage Online. n.d. Available online: https://www.circularenergystorage-online.com/ (accessed on 1 March 2023).
  33. Benchmark Mineral Intelligence. Price Reporting Agency & Market Intelligence for Lithium Ion Battery, Electric Vehicle & Energy Storage Supply Chains. 2022. Available online: https://www.benchmarkminerals.com (accessed on 1 March 2023).
  34. dataweb.usitc.gov (USITC). 2023. Available online: https://dataweb.usitc.gov/ (accessed on 1 March 2023).
  35. Experian. Auto Registration Database. 2023. Available online: https://www.experian.com/automotive/auto-vehicle-data (accessed on 1 March 2023).
  36. Proceedings of the 14th Annual NAATBatt Meeting, Litchfield Park, AZ, USA, 20–23 February 2023.
  37. Melin, H.E. State-of-the-Art in Reuse and Recycling of Lithium-Ion Batteries–A Research Review. 2019. Available online: https://www.energimyndigheten.se/globalassets/forskning--innovation/overgripande/state-of-the-art-in-reuse-and-recycling-of-lithium-ion-batteries-2019.pdf (accessed on 1 March 2023).
  38. Zlatev, D. Tesla Battery Factory Took Panasonic 6 Years to Master since US Workers Lost Their Manufacturing Skills. Notebookcheck, 27 February 2023. Available online: https://www.notebookcheck.net/Tesla-battery-factory-took-Panasonic-6-years-to-master-since-US-workers-lost-their-manufacturing-skills.697571.0.html (accessed on 1 March 2023).
  39. Green Giant; Ace Green Team Up for Texas Recycling Plant. Energy Storage Journal (ESJ). 2003. Available online: https://www.energystoragejournal.com/green-giant-ace-green-team-up-for-texas-recycling-plant/?utm_campaign=BESB+No.+178%3A+EU+risks+%27losing+all%27+in+gigafactory+stakes%2C+says+new+study&utm_content=batteriesinternational-magazine.com&utm_medium=email&utm_source=Batteries+International&wp-linkindex=16 (accessed on 1 March 2023).
  40. Nickle; Doug; (American Battery Technology, Reno, NV, USA). Personal Communication to Linda Gaines. 13 March 2023. [Google Scholar]
  41. Ascend Elements. “Ascend Elements to Recycle Lithium-ion Battery Manufacturing Scrap for SK Battery America.” News release, 9 March 2022. Available online: https://ascendelements.com/sk-battery-america/ (accessed on 1 March 2023).
  42. Cirba Solutions. “World-Class EV Battery Materials Facility in South Carolina.” News Release, 22 March 2023. Available online: https://www.cirbasolutions.com/world-class-ev-battery-materials-facility-in-south-carolina/ (accessed on 1 March 2023).
  43. Electra. “Electra Achieves first Plant-Scale Recycling of Black mass In NORTH America.” News release, 14 February 2023. Available online: https://electrabmc.com/electra-achieves-first-plant-scale-recycling-of-black-mass-in-north-america-marks-important-milestone-for-north-americas-ev-battery-supply-chain/ (accessed on 1 March 2023).
  44. Kochar; Ajay; (Li-Cycle, Mississauga, ON, Canada). Personal Communication to Linda Gaines. 12 March 2023. [Google Scholar]
  45. Sloop; Steve. Personal Communication to Linda Gaines, 12 March 2023.
  46. NAATBatt Recap. 2023. Available online: https://nac.naatbatt.org/naatbatt-annual-conference-2023/presentations/ (accessed on 1 March 2023).
  47. Benchmark Mineral Intelligence. Battery Recyclers Database Q4-2022. 2022. Available online: https://www.benchmarkminerals.com/forecasts/#battery-database (accessed on 1 March 2023).
  48. Turner; Shawn. Personal Communication to Linda Gaines. 14 March 2023. [Google Scholar]
  49. Recycling Product News Staff. “Redwood Materials Makes Policy Suggestions for EV Battery Recycling following Successful Recycling Program.” Recycling Product News, 7 March 2023. Available online: https://www.recyclingproductnews.com/article/39953/redwood-materials-makes-policy-suggestions-for-ev-battery-recycling-following-successful-recycling-program (accessed on 1 March 2023).
  50. ReElement Technologies LLC. “ReElement Technologies Takes Possession of Initial Battery Element Purification Equipment.” News Release, 6 October 2022. Available online: https://www.einpresswire.com/article/594572674/reelement-technologies-takes-possession-of-initial-battery-element-purification-equipment (accessed on 1 March 2023).
  51. ReCell Advanced Battery Recycling. Lithium-ion Battery and Recycling Terminology. Available online: https://recellcenter.org/lithium-ion-battery-and-recycling-terminology/ (accessed on 1 March 2023).
Figure 2. Simple product lifecycle flow (POM = placed on market).
Batteries 09 00360 g002
Figure 3. Lifespan of products containing LIBs in the U.S. (data from [12]).
Batteries 09 00360 g003
Figure 4. Lifecycle of an LIB.
Batteries 09 00360 g004
Figure 5. Recycling process efficiency by a process based on a nickel-rich nickel manganese cobalt (NMC622) cathode battery [data from 8].
Batteries 09 00360 g005
Figure 6. Material recycling hierarchy.
Batteries 09 00360 g006
Figure 7. Flowcharts showing influence of scrap on process material flow.
Batteries 09 00360 g007
Figure 8. Importance of scrap as feed to recycling plants.
Batteries 09 00360 g008
Figure 9. (a) U.S. LIB POM and LIB materials generated in the U.S., (bd) Li, Co, and Ni contained in U.S. LIB POM and maximum Li, Co, and Ni contained in generated material.
Batteries 09 00360 g009
Figure 10. Composition and origin of production scrap (data from [8]).
Batteries 09 00360 g010aBatteries 09 00360 g010b
Figure 11. Flow diagram of materials available for recycling.
Batteries 09 00360 g011
Figure 12. Percentage of Li, Co, and Ni in material generated that could have been satisfied by recycling in the U.S. (based on 100% recovery efficiency, with no reduction from export, discard, storage, or reuse).
Batteries 09 00360 g012
Figure 13. Potential U.S. supply from recycling, by market sector.
Batteries 09 00360 g013
Figure 14. (a) Contributions to material available for recycling, and (b) comparison to North American recycling capacity. Adjusted preprocessing capacity = preprocessing capacity + recovery capacity for companies that do not accept black mass as input.
Batteries 09 00360 g014
Figure 15. Material expected to be available for recycling in the U.S. (EOL (a), scrap (b)).
Batteries 09 00360 g015
Table 2. Comparison of maximum efficiencies for LIB recycling (upper bound: red = not recovered, green = up to 100%, yellow = possible but generally not economical).
ProcessCathodeLiCo, Ni, MnCUAlAnodeElectrolyteSeparator
Pyro
Hydro
Direct N/A
Table 3. Manufacturing process yield by process step [8].
MaterialDefaultMixingCoatingElectrode SlittingCell StackingElectrolyte Filling
Active cathode material92.2%99%95%99%99%
Active anode material92.2%99%95%99%99%
Aluminum foil90.2% 99%92%99%
Copper foil90.2% 99%92%99%
Separator98.0% 98%
Electrolyte99.0% 99%
Table 4. Parameter assumptions made for baseline scenario.
Portable DevicesLEVsHDEVs
Stored %5%----
Lost %0% for first 2 years and 1–10% from year 3 to year 10----
Export %45% (2000–2019); 20% (2020–2024); 10% (2025–2030)5%5%
Reuse %20%LFP (2000–2019): 85%; LFP (2019–): 90%; Other chemistries (2000–2019): 60%; Other chemistries (2019–): 70%LFP (2000–2019): 70%; (2019–): 75%;
Other chemistries: 80%
Reuse time (years)266
Scrap %Decreases from 30% to 5% in 4 years
Production maturity time (years)4
Disclaimer/Publisher’s Note: The statements, opinions and data contained in all publications are solely those of the individual author(s) and contributor(s) and not of MDPI and/or the editor(s). MDPI and/or the editor(s) disclaim responsibility for any injury to people or property resulting from any ideas, methods, instructions or products referred to in the content.

