Article

Trends in Automotive Battery Cell Design: A Statistical Analysis of Empirical Data

1
Fraunhofer Institute for Systems and Innovation Research ISI, Breslauer Street 48, 76139 Karlsruhe, Germany
2
Karlsruhe Institute of Technology, Kaiserstraße 12, 76131 Karlsruhe, Germany
*
Author to whom correspondence should be addressed.
Batteries 2023, 9(5), 261; https://doi.org/10.3390/batteries9050261
Submission received: 8 March 2023 / Revised: 25 April 2023 / Accepted: 28 April 2023 / Published: 5 May 2023
(This article belongs to the Special Issue Trends and Prospects in Lithium-Ion Batteries)

Abstract

:
Lithium-ion (Li-ion) batteries have become the preferred power source for electric vehicles (EVs) due to their high energy density, low self-discharge rate, and long cycle life. Over the past decade, technological enhancements accompanied by massive cost reductions have enabled the growing market diffusion of EVs. This diffusion has resulted in customized and cost-effective Li-ion battery cell designs tailored to automotive requirements. This study describes design trends in Li-ion batteries from the pack to the electrode level based on empirical data, including pack energy, cell capacity, outer cell dimensions and formats, energy density, specific energy, and electrode properties, such as active material selection, porosities, and component thicknesses. Market share-weighted findings imply several trends, such as (1) increasing cell dimensions, with the longest cells reaching 500 mm (pouch) and almost 1000 mm (prismatic) in 2021, (2) increasing differentiation between either high-energy or low-cost cathode and anode materials, and (3) increasing cell energy, equivalent to gaining about 100% (energy density) and 70% (specific energy) compared to the 2010 and 2021 averages. Despite these improvements, this study finds that the widespread market diffusion of the latest cell technologies proceeds slower than industry announcements suggest and that several well-known, literature-proofed potentials are not yet fully exploited.

1. Introduction

Increasing demand for electric vehicles (EVs) has created the need for high-performance, cost-effective, and safe energy storage systems. Lithium-ion (Li-ion) batteries have emerged as the preferred power source for EVs due to their high energy density, low self-discharge rate, adequate chemical potential, and long cycle life [1,2,3,4,5]. Technological enhancements accompanied by massive cost reductions of Li-ion batteries have been critical for the growing market diffusion of EVs [6] and, thus, the transition to more sustainable road transport [7,8]. While there were roughly 50 EV models available globally in 2015, there are more than 300 models available across all vehicle segments today [9]. This model variety results from new original equipment manufacturers (OEMs) that disrupted the market and specialized in EVs early on and established OEMs that are now also transforming their product portfolios from internal combustion engine-powered vehicles to EVs [10,11]. Some have even announced an all-electric strategy from 2025/2030/2035 onwards, at least for the EU market [10].
The current automotive battery market is highly heterogeneous, with numerous manufacturers producing cells of varying sizes, formats, and cell designs, as well as active and inactive material combinations. Currently, the automotive industry is utilizing cylindrical, prismatic hard-case, and pouch cells with different shapes, geometries, and internal structures [2,12,13]. This battery variety results from numerous related factors, such as different vehicle segments (e.g., volume versus luxury or short-distance versus long-distance), where each segment sets specific battery requirements to achieve the best match with customer expectations and utilization patterns [3]. Moreover, OEMs pursue individual strategies regarding supply chain designs, alliances, or cooperations with cell or material suppliers to secure vehicle sales [8], leading to complex dependencies and entanglements [12]. Finally, equipment availability and cell manufacturability result in further differences [14]. Besides these factors, automotive Li-ion battery cell development is characterized by an engineering trade-off that is associated with specific design strategies at the electrode level: high-energy versus high-power density [15]. On the one hand, power density is more critical for hybrid vehicles [16], so minimizing each component’s electronic, ionic, and thermal resistance is targeted [4,17]. On the other hand, energy density is most relevant for battery-electric vehicles (BEVs) to ensure acceptable ranges given the limited installation space [16]. Here, maximizing the ratio of electrode volume to battery cell volume and the ratio of active material to electrode volume are targeted [15], yet without impairing the fast-charging capability [3,4]. Searching for the best possible trade-off between energy and power capability nowadays also increasingly involves battery pack design and system optimization [3,4,14,18], such as optimized cell-to-module or cell-to-pack integration, enhanced battery management systems, and tailored battery thermal control systems. In addition, the recyclability of cells may soon emerge as a key factor for future sustainable battery designs [19].
While numerous studies selectively examine individual battery systems, single cells, or only individual cell parameters, few cross-cutting and aggregated assessments exist. Exemplary, typical studies focus either on active material selection [20,21], thermal properties [22,23], internal structures [15,20], fast charging capability [24,25], aging [26,27,28], or cost [2,4,29,30,31] in great detail and with differing methods. Pack-level properties are typically discussed concerning individual models, and battery cell properties concerning individual cells [15,32,33,34,35,36]. Typically, such studies use rather well-established or even dummy cells, and published findings often lag behind the cell’s market launch. Although commercial teardowns of the latest pack and cell models have become well-established, such as those by A2Mac1 [37] or the B3 Corporation [38], general access to this data is limited. Open-source and scientific teardowns are the exceptions, such as that for the 2021 VW ID3 cell by Günter et al. [32]. Last, more aggregated analyses, including the market relevance, as Nykvist et al. [39] did for the American EV market, are scarce.
While the current literature provides detailed technological insights into single packs, cells, and their structures, there is limited information about the global dissemination and utilization of these specific items. This makes it difficult to draw conclusions about the market’s technological progress and the impact of these cells and their technological intricacies on it. As an alternative to this common method of examining individual cells, this study aggregates single-cell information from scientific papers, market studies, reports, and commercial teardown reports in a common database, adds information about sales figures, and uses statistical methods to reveal certain temporal trends. The presented study is the first to combine the comprehensive assessment of pack energies, formats, external cell dimensions, common cell performance indicators, active material selection, and electrode properties for automotive Li-ion batteries with actual sales data. In doing so, this study assesses the status quo of the global automotive Li-ion battery market and the diffusion speed of new technologies and allows us to draw conclusions on near-term trends.
This paper is structured as follows: Section 2 introduces the data and underlying sources. Results are structured from pack to cell to the electrode level (see Figure 1). Section 3 starts with the market-share weighted trends for pack energy (3.1), cell capacity, outer cell dimensions and formats and energy density (3.2) from 2010 to 2021. It closes with trends in automotive electrode properties such as active materials, thickness and porosity from 2016 to 2022 (3.3). Section 4 discusses the completeness, limitations, and representativeness of the findings. This paper closes with a short outlook in Section 5.

2. Data and Methods

Trends for pack energy, cell capacity, outer cell dimensions and formats, active materials, energy density, and specific energy were analyzed using the Fraunhofer ISI xEV battery database. This database contains comprehensive information on the global production and sales of xEV models, including hybrids, plug-in hybrids, BEVs, and fuel-cell vehicles. This study uses vehicle-specific data with a cutoff in May 2022 and global xEV sales data until January 2022. Thus, all market-share weighted analyses cover the period 2010–2021. The database includes over 1100 xEV models between 2010 and 2021 and more than 500 additional models launched or announced for 2022–2026. The database aggregates different sources, including Marklines, the European Automobile Manufacturers Association (ACEA), the European Alternative Fuels Observatory (EAFO), the German Automobile Club (ADAC e.V.), OEM websites, market and technology studies [40,41,42,43,44,45,46], reports [47,48,49,50], and numerous online sources: Skobyakov S.A. Chinese Cars: www.chinamobil.ru (accessed on 19 January 2023); Tycho de Feijter, Car news China: www.carnewschina.com (accessed 19 January y 2023); Wynand Goosen, wattEV2Buy: www.wattev2buy.com (accessed on 2 February 2023); A07 online media LLC. CarSalesBase: www.carsalesbase.com (accessed on 2 February 2023); Seo and Web Ltd. Auto-Data-net: www.auto-data.net (accessed on 8 February 2023); Zach Shahan. CleanTechnica: www.cleantechnica.com (accessed on 2 February 2023); Ecomotors Inc. EV Compare: www.evcompare.io (accessed on 3 February 2023); Motor Presse Stuttgart GmbH & Co. KG. Auto, Motor und Sport: www.auto-motor-und-sport.de (accessed on 8 February 2023); Bauer Xcel Media Deutschland KG. autozeitung.de: www.autozeitung.de (accessed on 8 February 2023); SIDEBI TECHNOLOGY LTD. Chinapev.com: www.chinapev.com (accessed on 19 January 2023); RABBIT PUBLISHING GmbH. electrive: www.electrive.net (accessed on 16 February 2023); Electric Vehicle Database. EV Database: www.ev-database.org (accessed on 3 February 2023); VerticalScope Inc. China Car Forums: www.chinacarforums.com (accessed on 19 January 2023); EVSpecifications. EVSpecifications: www.evspecifications.com (accessed on 3 February 2023); Motorsport Network LLP. insideEVs. www.insideevs.com (accessed on 2 February 2023); Pedro Lima. PushEVs: www.pushevs.com (accessed on 16 February 2023); EV Volumes. EV Volumes: https://www.ev-volumes.com/ (accessed on 16 February 2023); China Automotive Technology and Research Center Co., Ltd. CATARC: https://www.catarc.ac.cn/ (accessed on 19 January 2023); International Energy Agency. IEA: https://www.iea.org/ (accessed on 3 February 2023); Bitauto. yiche.com: https://www.yiche.com/ (accessed on 19 January 2023) and [51]. No speculative data on vehicle batteries, cell chemistries, and energy densities are included, leading to missing information and, thus, higher uncertainty (see Section 4). This mainly concerns several Chinese manufacturers.
The electrode properties were analyzed using a sample of automotive battery cells without market shares. Following Lain et al. [14], we cover the thickness of electrode coatings in µm, electrode porosities as a percentage, the current collector foil thickness in µm, and the separator thickness in µm as key electrode design parameters. Additionally, we include the model year (MY) of the reference vehicle or the year of publication, cathode and anode chemistries, and the cell format (pouch, prismatic, or cylindrical). There are some missing data as certain sources did not provide all the information required. The data were sourced from market studies, commercial cell teardown reports, and scientific literature harmonizing different methods such as simulation studies, cell measurements, teardowns, material tests, cycle life or calendar aging tests, post-mortem analyses, or general assessments. The most relevant scientific studies were identified using the search string “automotive AND lithium-ion AND battery AND electrode AND (thickness OR porosity) AND Year >= 2016” in the Scopus database and Google Scholar. Thus, the statistical analysis covers the period 2016–2022. After reviewing and filtering, we considered 78 references [2,15,18,24,25,31,32,37,38,52,53,54,55,56,57,58,59,60,61,62,63,64,65,66,67,68,69,70,71,72,73,74,75,76,77,78,79,80,81,82,83,84,85,86,87,88,89,90,91,92,93,94,95,96,97,98,99,100,101,102,103,104,105,106,107,108,109,110,111,112,113,114,115,116,117,118,119,120,121].

3. Results

3.1. Pack capacity

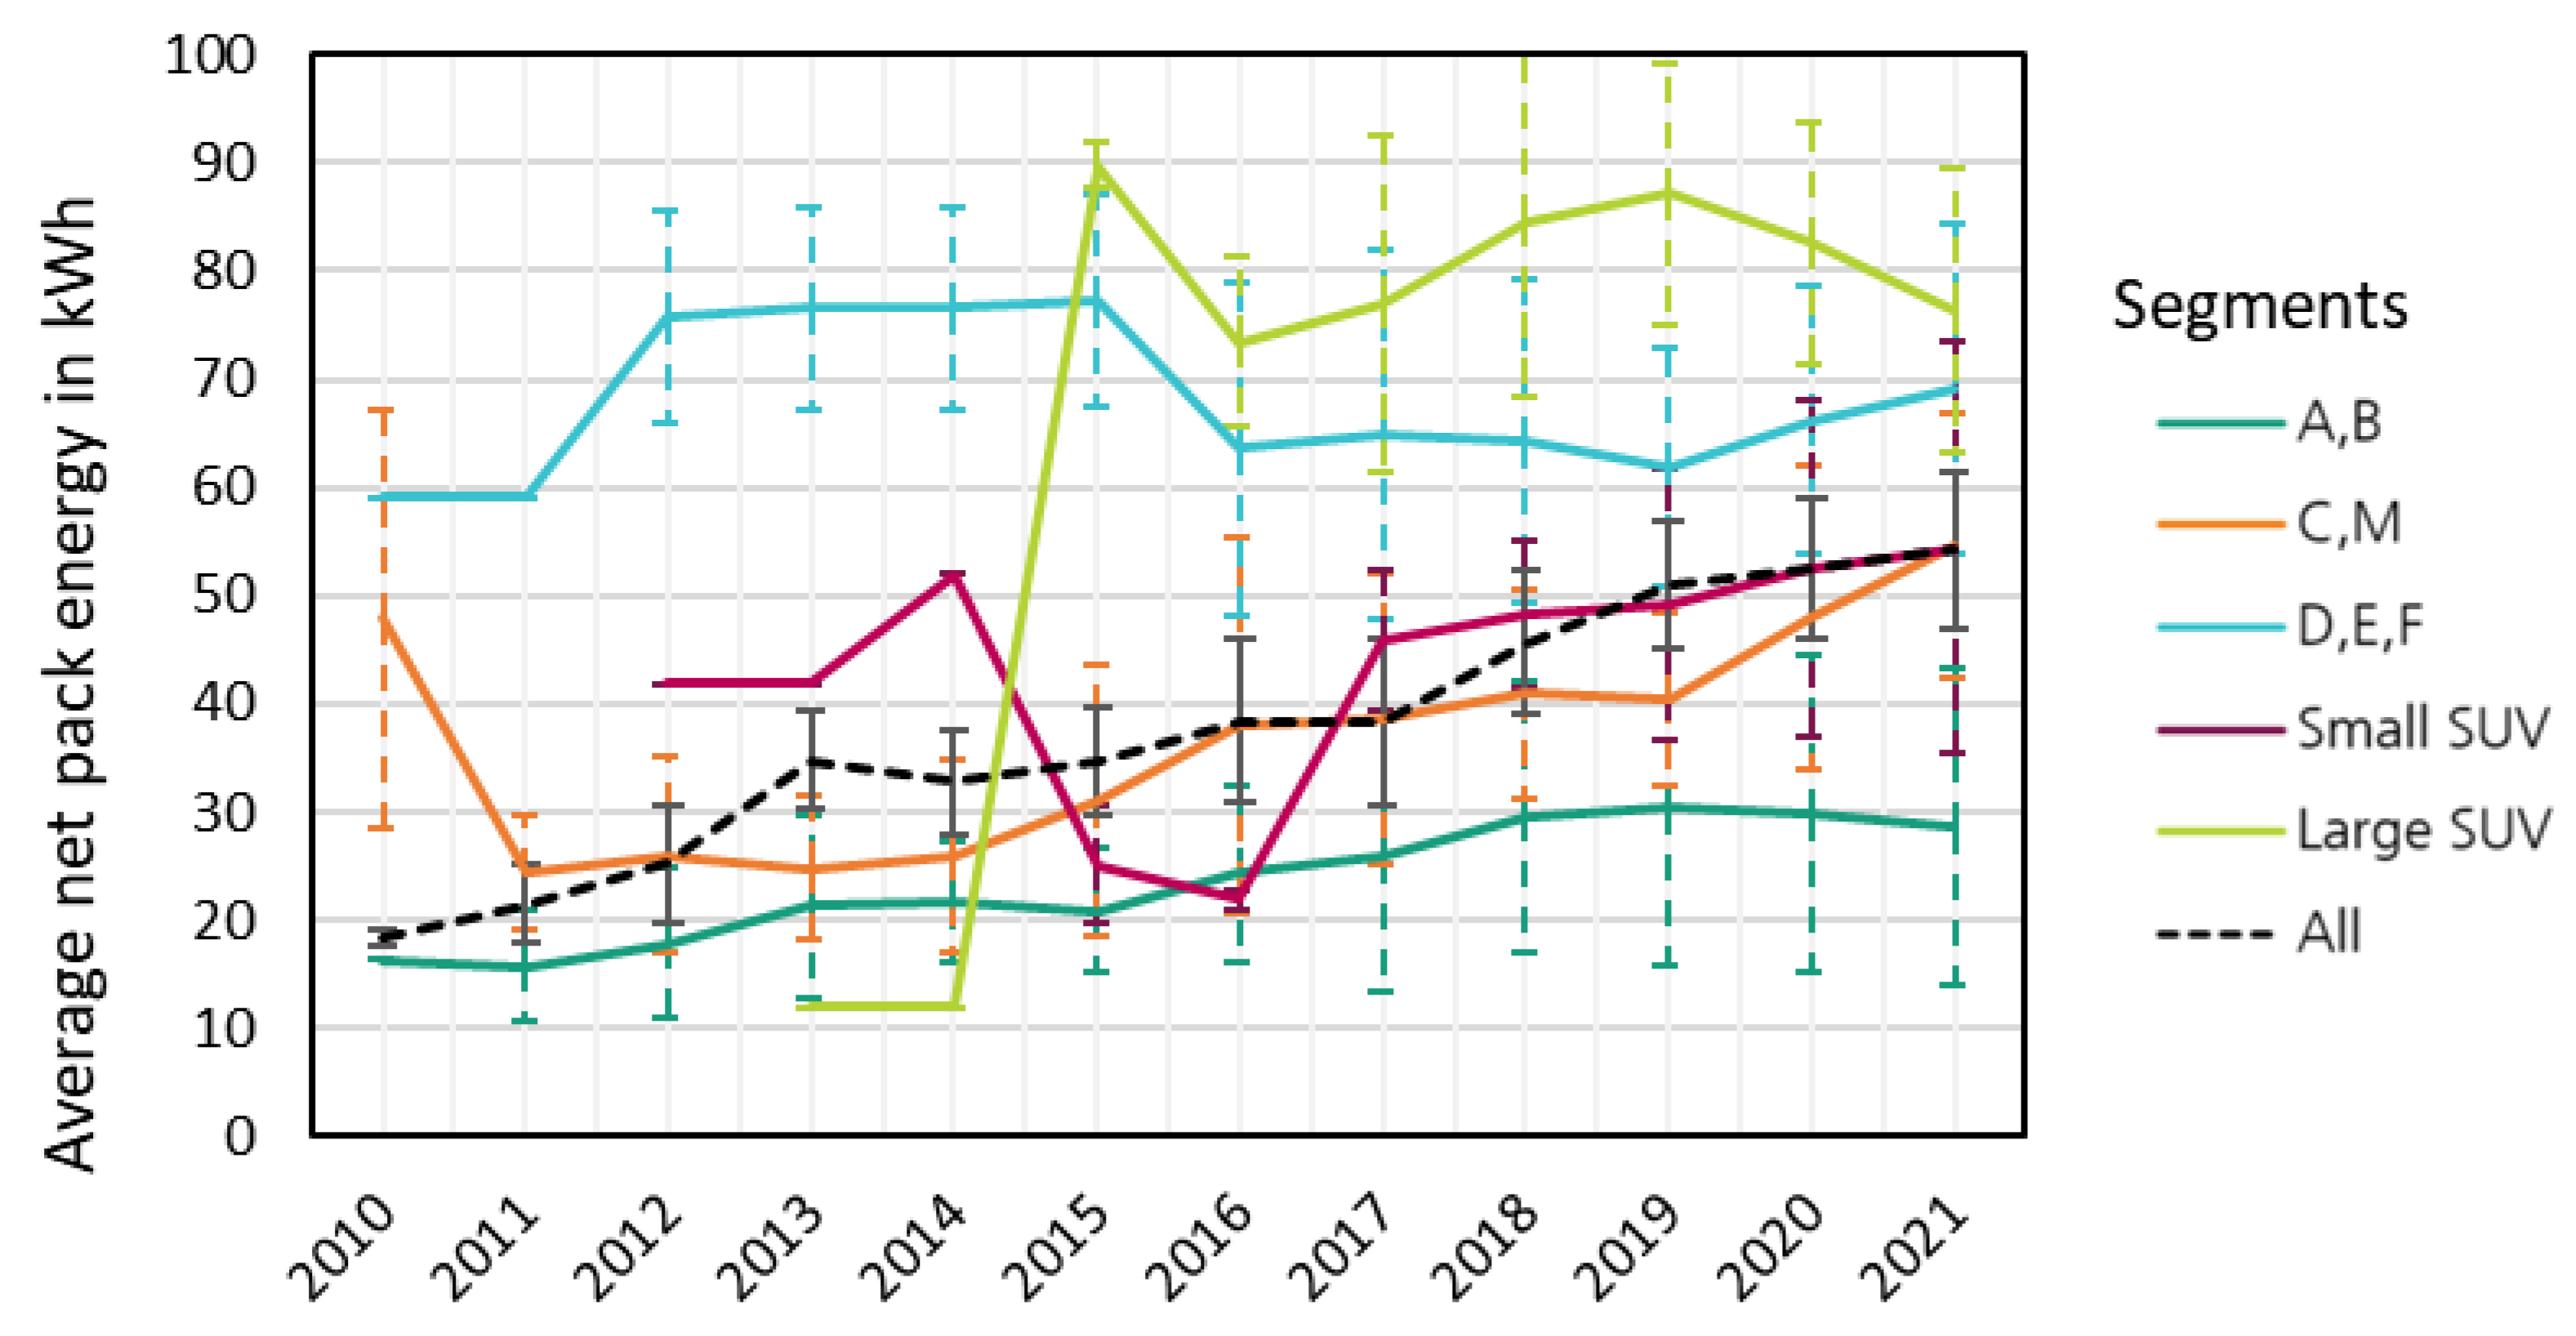
Figure 2 illustrates the global vehicle-sales-weighted evolution of the average net pack capacity in kWh for different segments. Here, we followed the vehicle classification by Marklines, which is comparable to the EU classification scheme. This comprises the AB segment (mini and small vehicles), the CM segment (compact cars and multi-purpose vehicles), the DEF segment (large and premium-type vehicles), and the SUV segment, further split into small (ABC segment) and large (DE segment) subsegments. All analyses include the annual mean values ± one standard deviation.
For the AB segment, to which most early xEV models can be attributed, we observe a clear upward trend starting from less than 20 kWh in the early 2010s to around 30 kWh in 2019. Since then, we have seen saturation and no further increase in net pack capacity. Conversely, a slight decline is discernible, primarily due to cheap and short-range A-segment vehicles in China. The CM segment increased from around 25 kWh to 50 kWh in 2021, with no saturation visible, and the analysis indicates an expected further increase. In contrast, the DEF segment shows no clear increase. This is partially due to the recent market entry of many D-segment models with smaller packs, especially in China. In addition, several OEMs have introduced entry-level model series with smaller battery packs, even for more premium-type vehicles, like the Tesla Model 3 Standard. Finally, xEVs with larger packs, like the Tesla Model S 85, were already available early on, leading to high values in the mid-2010s. In recent years, SUVs have become increasingly popular, and several xEV versions have entered the market. While we find a clear distinction in battery pack capacity between smaller and larger SUVs, the average pack capacity increased for both. In 2021, the average was around 55 kWh for smaller and 70–80 kWh for larger SUVs.
When classifying the segment-individual findings, it became evident that no single battery pack capacity can be assigned to a specific vehicle segment. While we find obvious differences in the average pack capacity between segments, there are high fluctuations and large standard errors within each segment. This partially results from the chosen vehicle classification into segments, originally designed to distinguish car dimensions and vehicle weight [122] but not vehicle range or battery size. Further, many models are available as short-range and long-range versions.
When evaluating the global market across all segments, average pack capacities have been rising almost constantly since 2010, starting from less than 20 kWh and reaching 54 kWh (47–61 kWh) in 2021. We highlight two main effects: (1) larger pack sizes accompanied by increasing specific energy and energy density of pack and cells (see Section 3.2.3) to extend vehicle range, and (2) increasing xEV availability and sales across all segments, from small, light, and short-range to large, heavy, and long-range vehicles.

3.2. Cell Properties

3.2.1. Cell Formats and Outer Cell Dimensions

The chosen cell format, i.e., cylindrical, pouch, or prismatic hard-case, affects many system parameters like pack design, cell cooling, pack safety, cell-to-module or cell-to-pack integration, and mechanical stability [5,13,18]. As a result, cell formats have a large impact on pack-level performance, as shown by [18,123] for energy density and specific energy. Although there are examples of using several cell formats in one EV model (e.g., the Tesla Model 3), OEMs more often commit to one particular cell format for each EV model, allowing for substantial economies of scale. The same applies to vehicle platforms, where several models share one common platform. However, multi-format strategies for models or platforms may still be relevant due to the required flexibility concerning cell availability, different cell suppliers, or stronger model diversification [124].
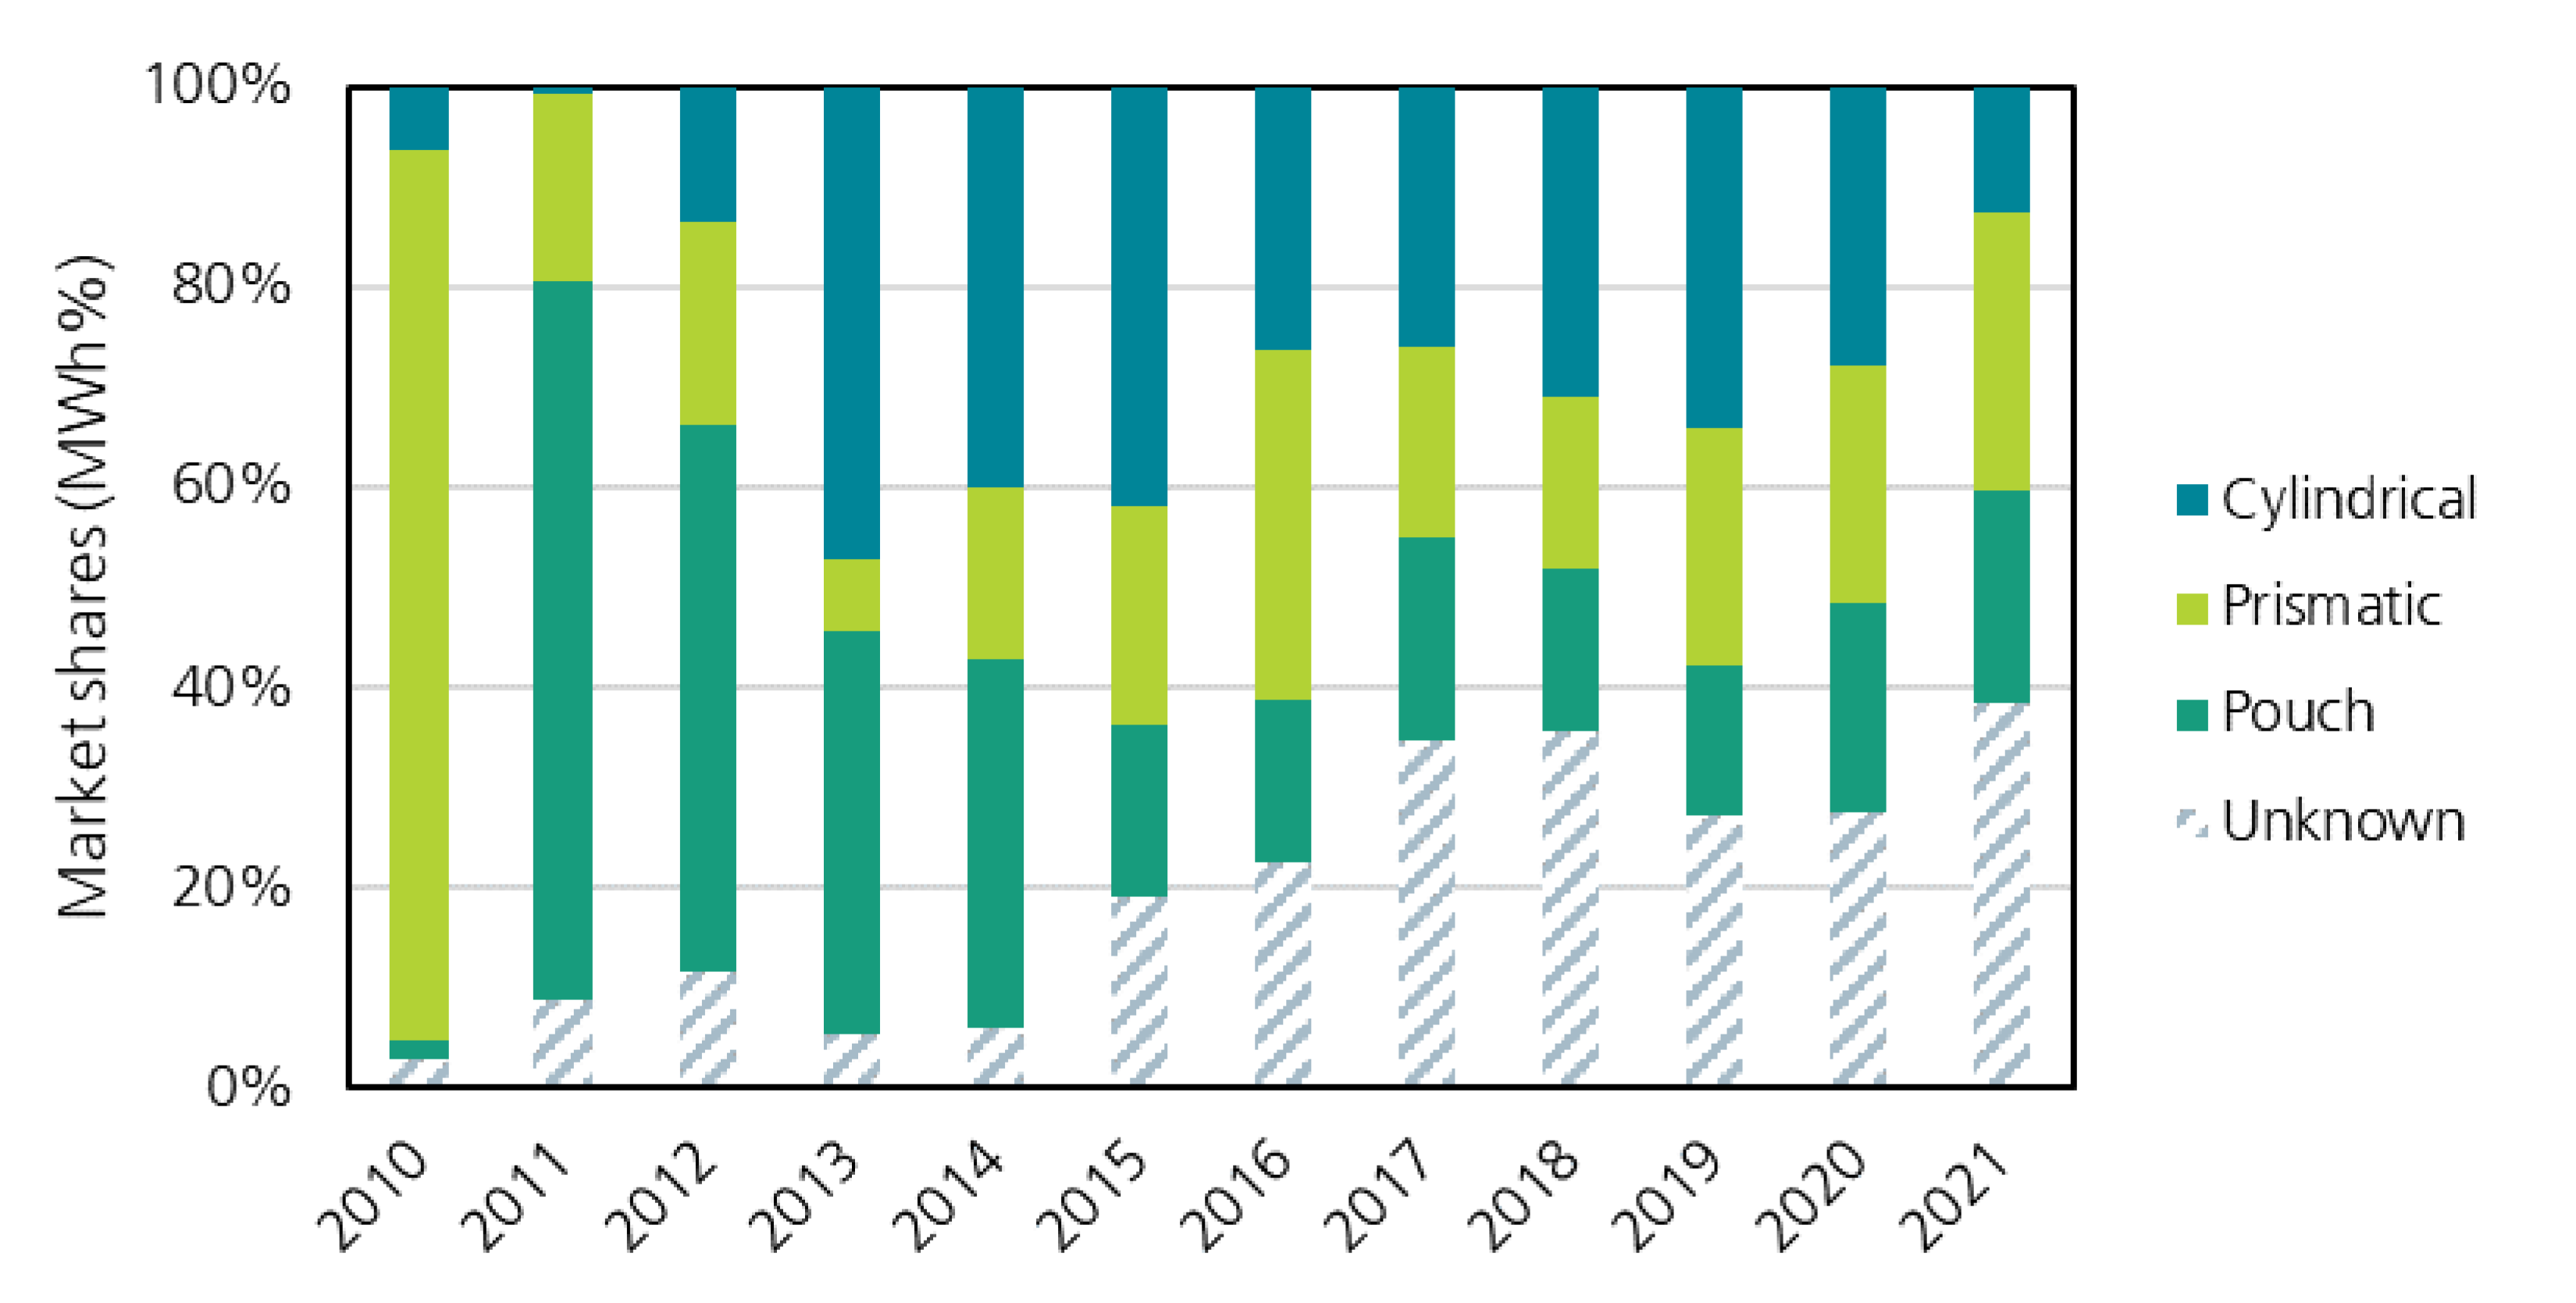
Figure 3 illustrates the global evolution of the market shares of cylindrical, pouch-type, and prismatic cells, weighted by MWh and limited to BEV only. Tesla directly affects the market share of cylindrical cells as the only large company currently utilizing this format. Until 2020, the market share was constantly over 20%, with the latest increase in 2017–2019 resulting from the introduction of the Tesla Model 3. Although other OEMs such as GM, BMW, or NIO, and start-ups like Rivian and Lucid Motor may use cylindrical cells in the future, according to the latest announcements [12], our analysis showed a declining market share of cylindrical cells in the 2020s. This may have resulted from Tesla’s decision to use prismatic LFP cells and the increasing xEV availability and sales from OEMs other than Tesla. While we acknowledge that our database’s share of not-specified cell formats increased substantially (38% in 2022), this share can be allocated almost exclusively to pouch and prismatic cells. We found no clear individual trend for pouch or prismatic cells, but both gained market shares so that at least 20% were pouch and at least 30% were prismatic, with the latter having higher growth rates.
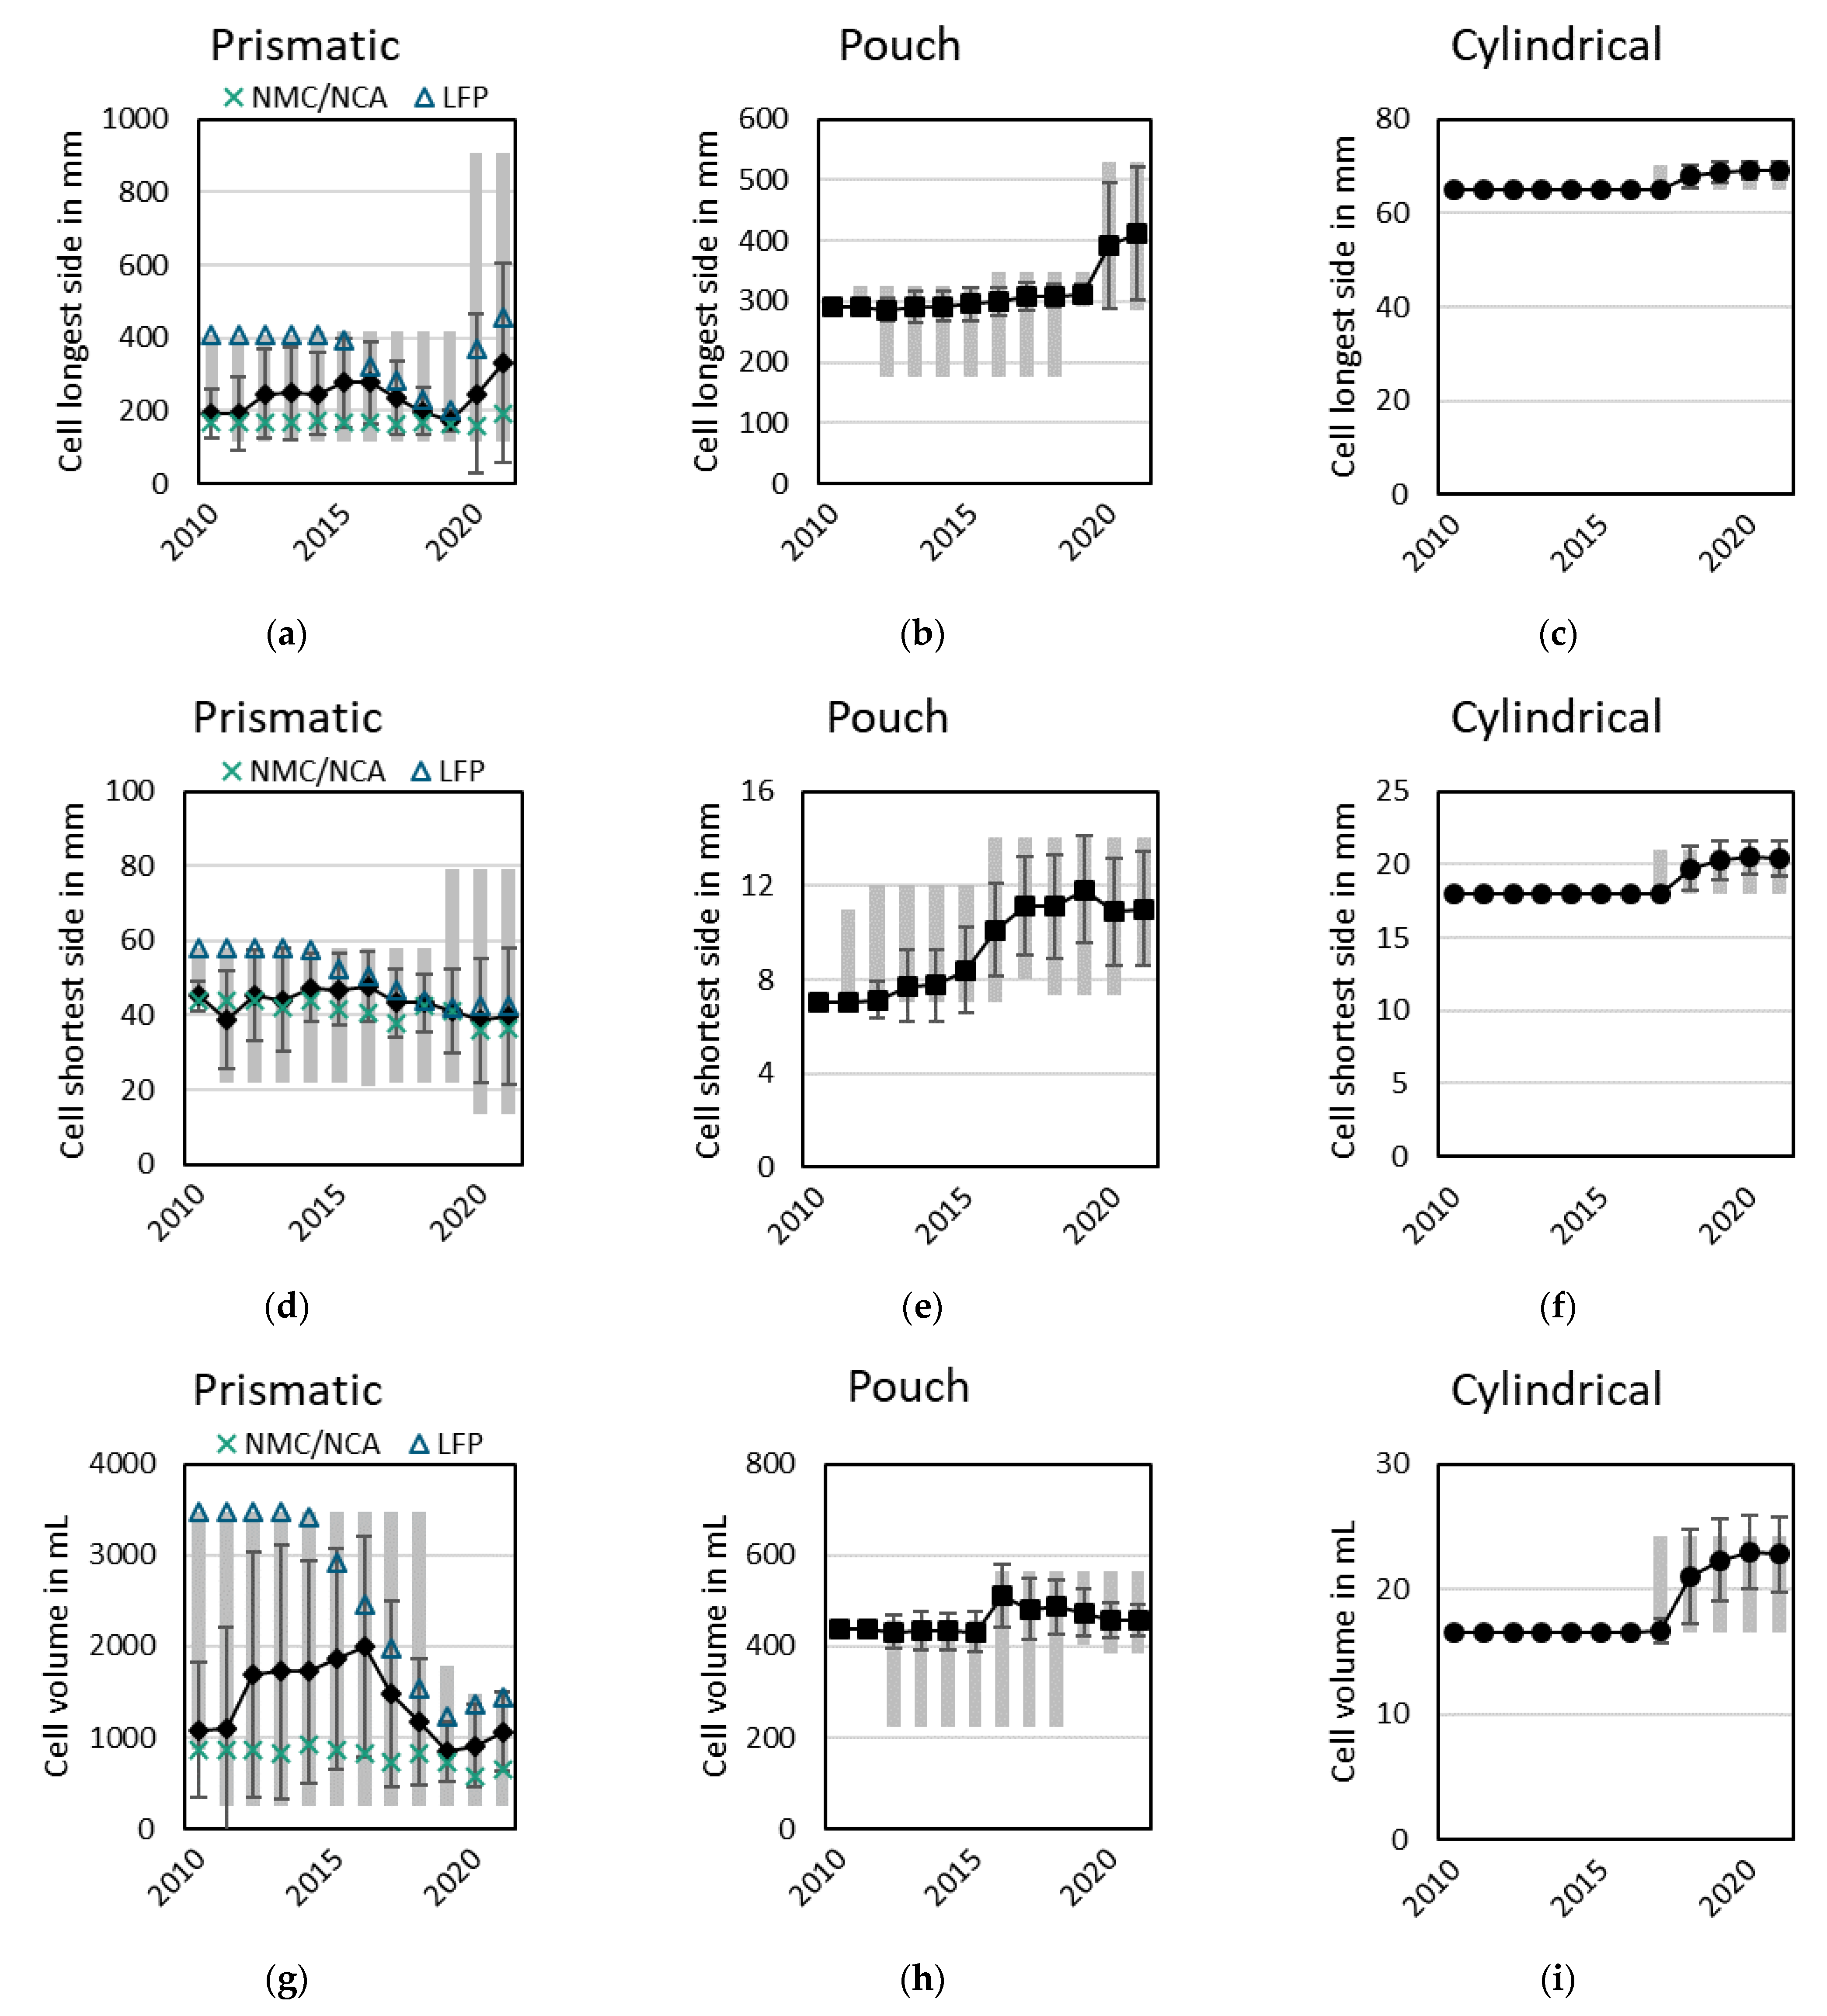
Apart from the basic cell format, various customized cells with tailored outer dimensions emerged due to, among other factors, different vehicle architectures, specific market requirements, material availability, supplier cooperations, or system integration strategies [13]. In contrast, several market participants (OEMs, system integrators, and automotive associations) emphasized the development of standard cell sizes to leverage economies of scale or ease multi-sourcing strategies. Therefore, Figure 4 shows the global evolution of cell sizes between 2010 and 2021, differentiated by cylindrical, pouch, and prismatic cells, weighted by MWh, and limited to BEV only. The analysis includes the minimum and maximum dimensions and the annual mean values ± one standard deviation. Since most LFP cells use the prismatic cell design, we distinguished between prismatic cells with LFP cathode material and cells with (high nickel) NMC or NCA cathode material.
For cylindrical cells (cf. Figure 4c,f,i), the presence of just two automotive-relevant formats until 2022, 18650 and 21700 cells, renders an evaluation of cell geometries irrelevant. Accordingly, the outer diameter increased from 18 to 21 mm, and the can height from 650 to 700 mm. The impact of larger cells in the future, e.g., Tesla’s 4680 or Samsung’s 4080 announcements, is discussed in Section 4.
For pouch cells (cf. Figure 4b,e,h), the longest side remained relatively constant at 300 mm until 2018 and increased as larger cells with more than 500 mm entered the market. While these lengths follow the battery module standard sizes, the shortest side (i.e., the cell thickness) increased in the 2012–2016 period from around 7 mm and has since plateaued at around 11–12 mm. Despite this increase in the longest and shortest sides, the total cell volume increased only slightly from 2010 to 2021 and remained between 400 and 500 mL. In fact, there was even a minor decrease from 2016 to 2021, in line with a decreasing standard deviation, implying higher robustness. This indicates that single pouch bags have not become larger but have been tailored to the space available in the vehicle.
For prismatic cells (cf. Figure 4a,d,g), the trends are not straightforward due to various overlapping circumstances. First, the high standard deviation implies that a great variety of cell geometries are utilized within the global automotive industry. Second, the effects of different cathode chemistries overlap. In particular, this involves cheaper LFP cells and high-energy nickel-rich cells (see Section 3.2.2 and Section 3.3.2). Third, there is a transition toward cell-to-pack (C2P) concepts and, thus, the higher integration of cells into the vehicle chassis. This C2P concept is typically associated with very long cells (up to around 900 mm) and promises cost advantages due to higher process efficiency and fewer components, and performance advantages due to higher achievable specific energy and energy density at the pack level [12,18]. Very large cells from 2000 to 3500 mL have mostly disappeared. Nevertheless, prismatic cells outperform the other formats regarding cell volume, with a corridor from around 500 to 1500 mL forming in recent years. Even these larger prismatic cells necessitate high mechanical and thermal stability and increased safety requirements, which may be fulfilled by larger housing thicknesses or using intrinsically safer materials. Following this, larger (400–900 mm) and thicker cells (up to 80 mm) feature LFP cathodes, while thinner (12–36 mm) and smaller cells (up to around 400 mm) primarily feature nickel-rich cathodes (mainly NMC). The decreasing average cell volume from 2016 to 2019 resulted from the increasing share of NMC chemistries, while the growing share of LFP and C2P concepts resulted in increased cell volume since 2019.

3.2.2. Cell Capacities

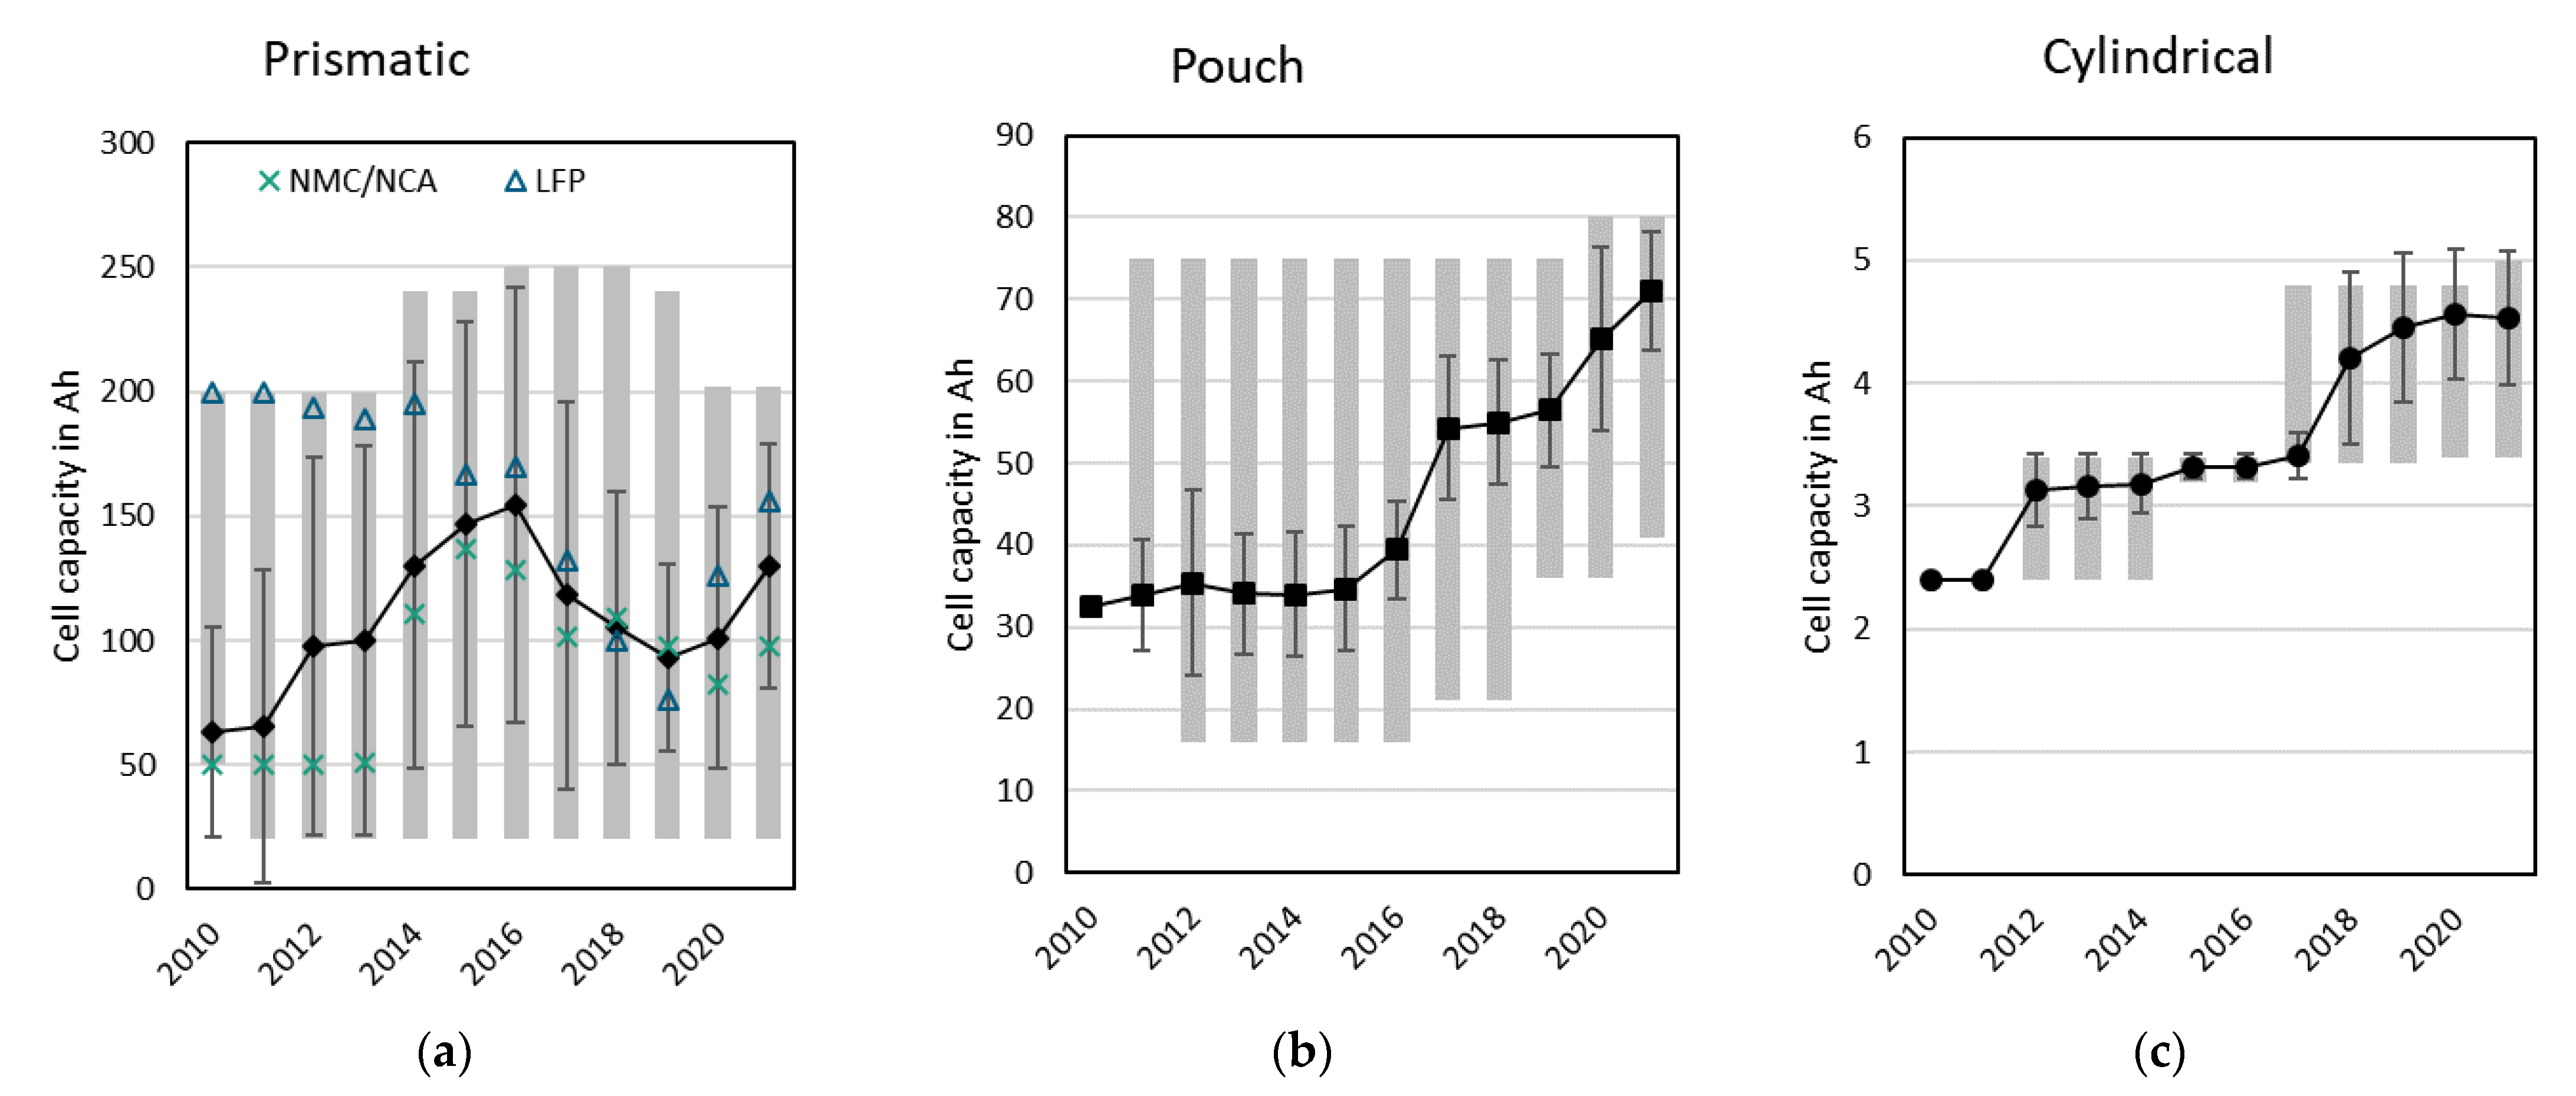
Figure 5 illustrates the global evolution of cell capacity between 2010 and 2021, differentiated by cell format and weighted by MWh. For cylindrical and pouch cells, average capacities doubled from 2010 to 2021 to around 70 Ah (pouch) and 4.5 Ah (cylindrical). This increase, particularly from 2015 onwards, can be attributed mainly to higher energy densities (see Section 3.2.3) from new active materials (see Section 3.3.2) since the cell volume (see Section 3.2.1) has not increased to the same extent. The development of cylindrical cells reflects the transition from 18650 to 21700 cells with the introduction of Tesla’s Model 3. Starting with a capacity of about 2 Ah in the early 2010s (Tesla Roadster EV), average capacities converge toward nearly 5 Ah due to strong Model 3 sales.
An increase from around 60 Ah in 2010 to 150 Ah in 2016 is noticeable for prismatic cells. This is primarily driven by Chinese manufacturers using LFP-based cathodes and increasing the cell volumes (cf. Figure 4g). With an increasing share of NMC/NCA-based cathodes from the mid-2010s, cell dimensions and capacities have decreased due to safety and temperature concerns [5].

3.2.3. Specific Energy and Energy Density

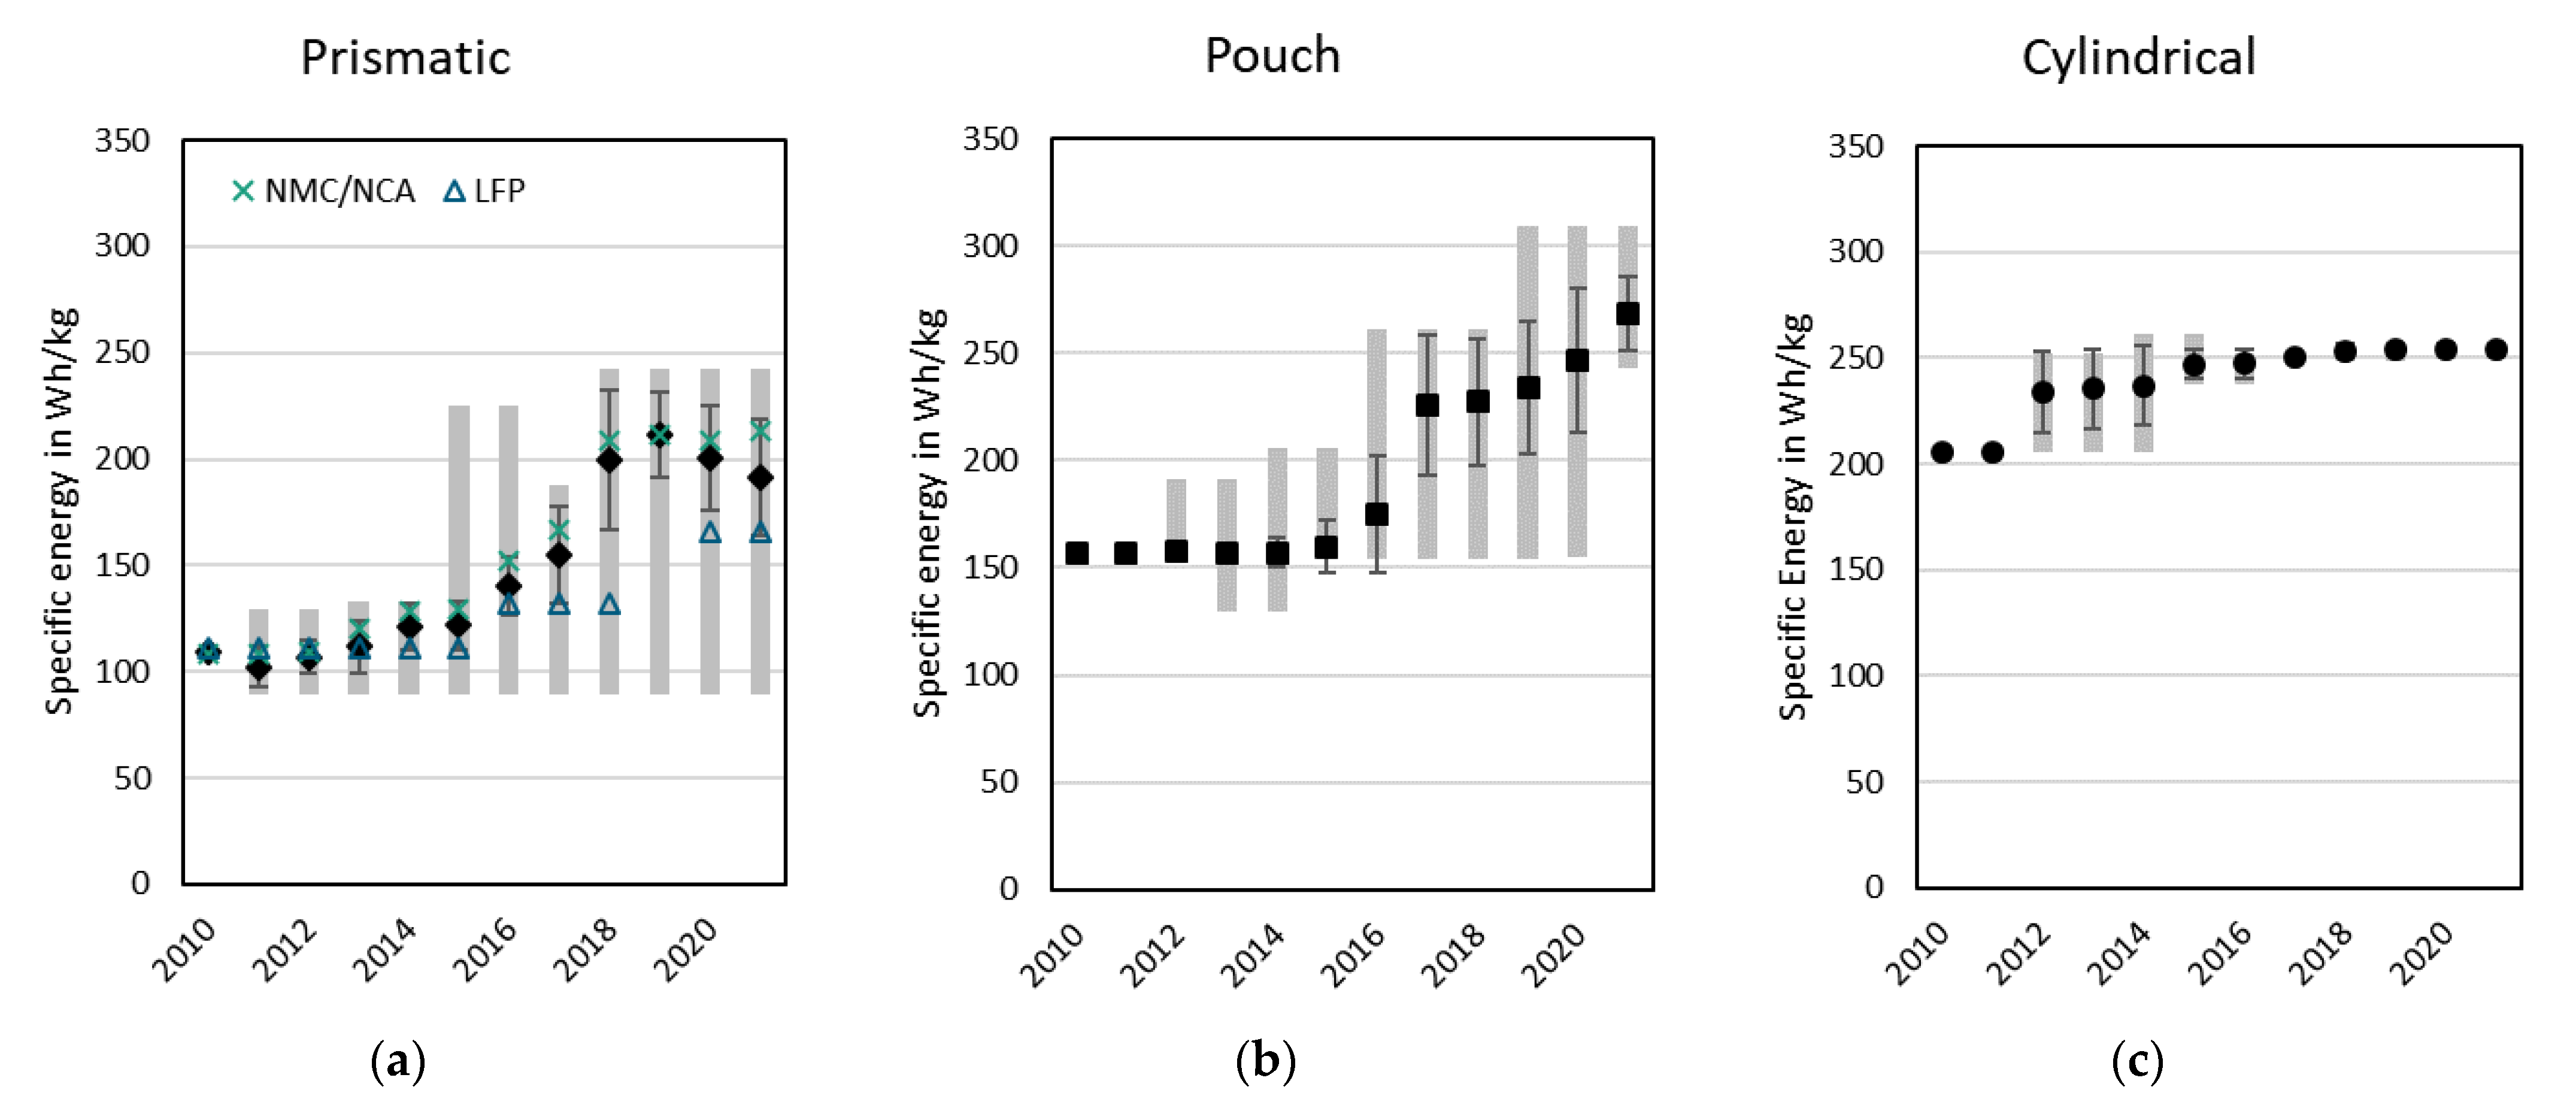
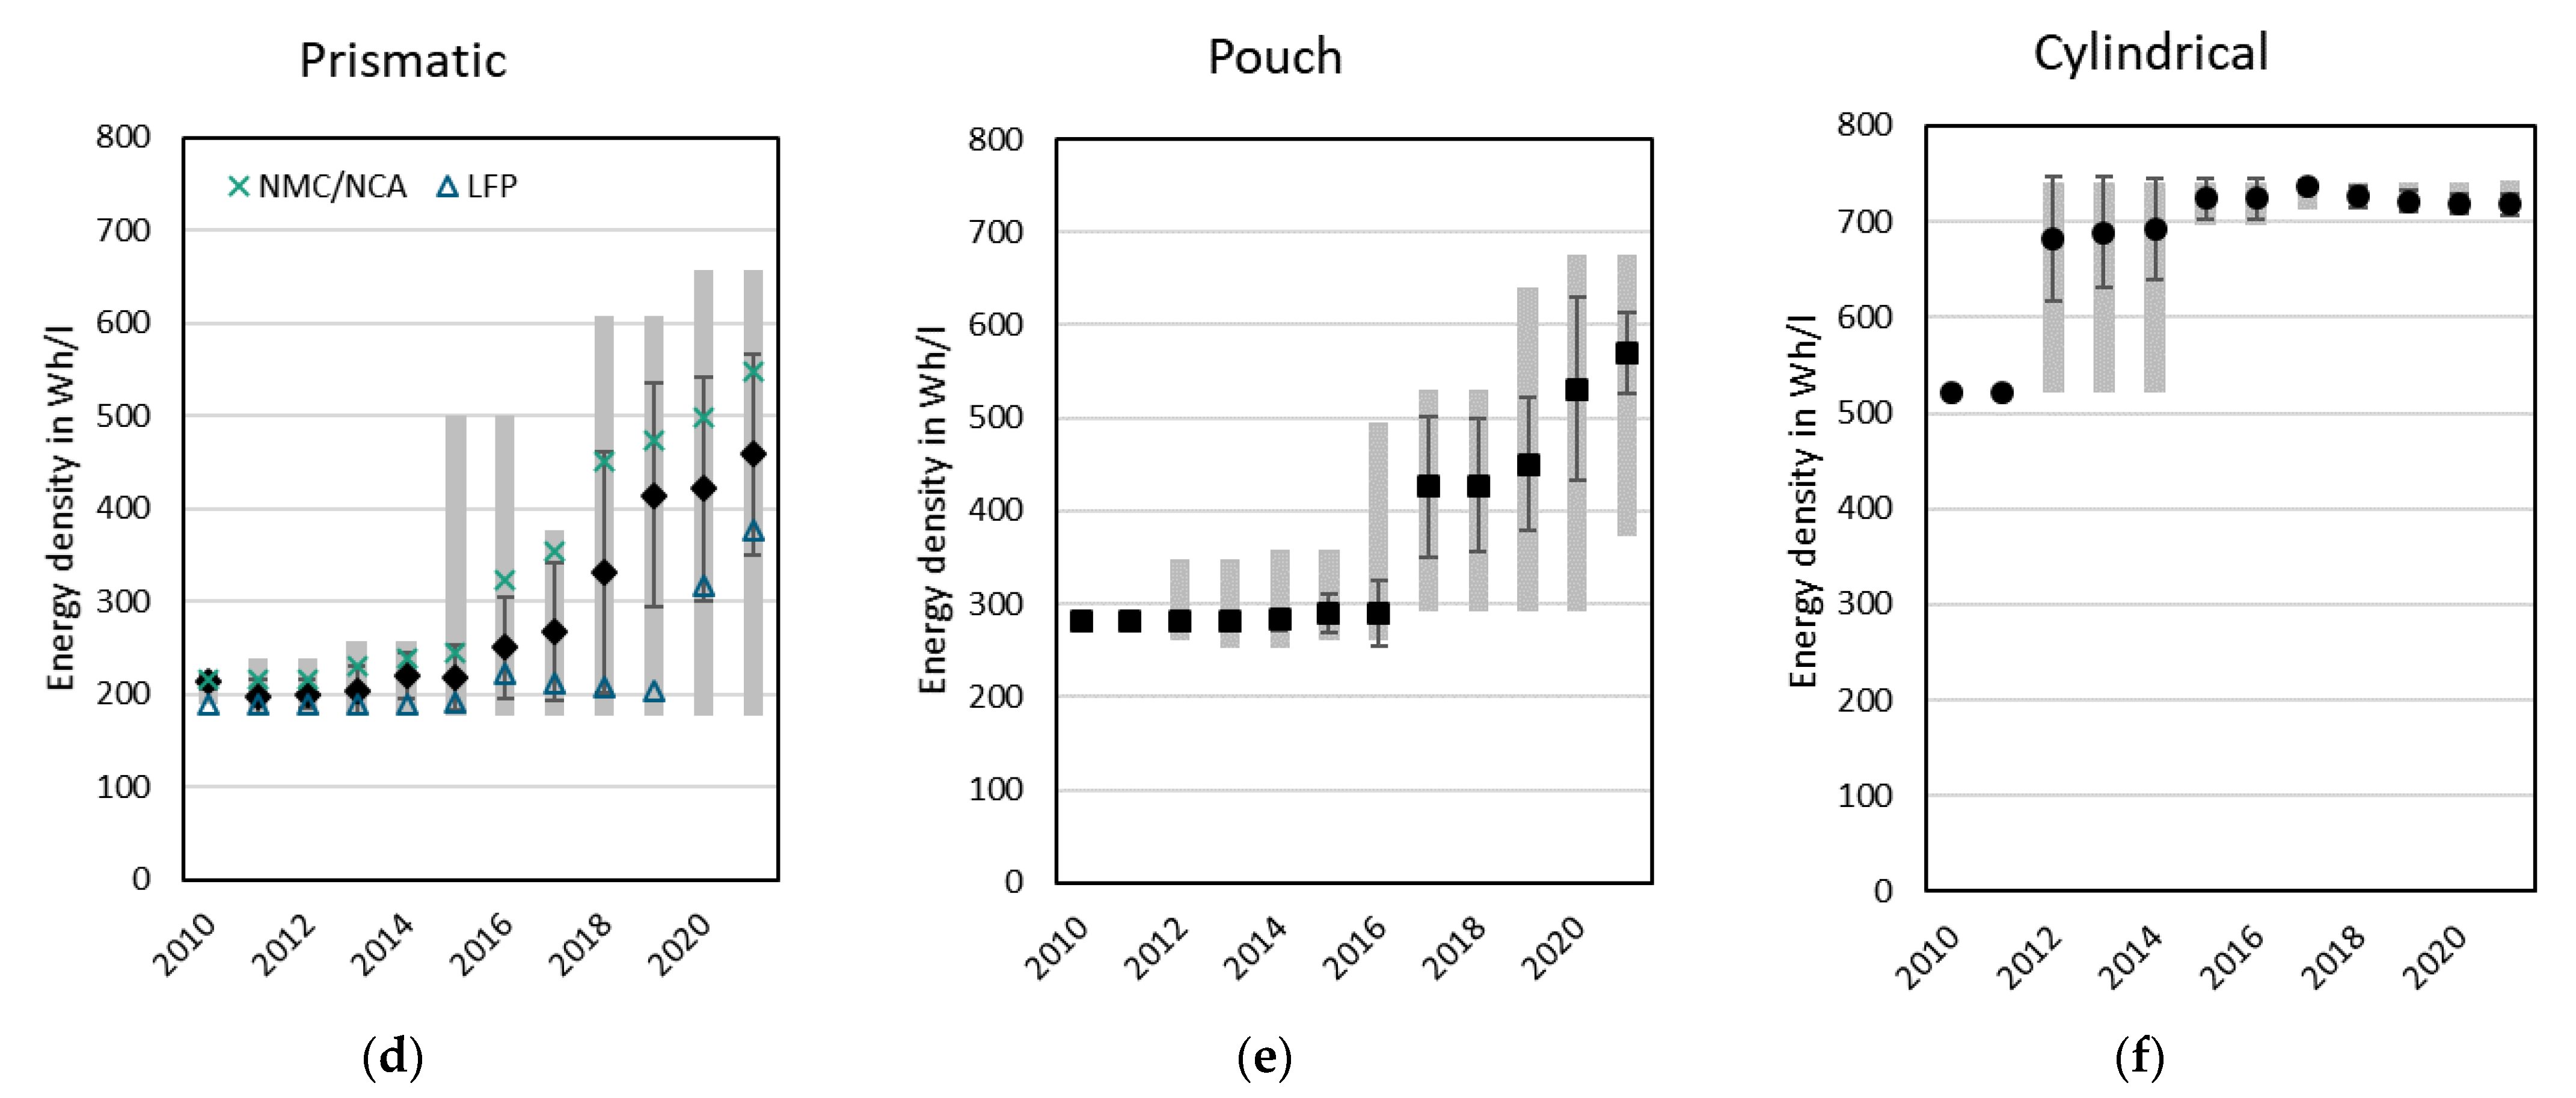
Specific energy ( e ) and energy density ( w ) are two crucial performance indicators for battery cells since space and weight in EVs are limited, but high driving ranges are required [3,6,16]. Figure 6 shows the global evolution of both parameters at the cell level between 2010 and 2021, differentiated by cell format and weighted by MWh. The analyses include the annual mean values ± one standard deviation and the span.
Both parameters are calculated based on specified cell capacities C , average discharge voltages U , and cell weight ( M ) or cell volume ( V ) , respectively (see Equations (1) and (2)). For cell capacities (see Section 3.2.2), we mainly used the manufacturers’ specifications. Depending on the data source, varying ranges for the average discharge potentials are available for the same cathode and anode active materials combinations. These ranges might indicate differences in the current load during discharge experiments. For example, NMC/graphite-based cells might be listed with a voltage of 3.6 to 3.7 V in our database, producing an uncertainty of up to 3% for the specific energy. For cell volume, we used the outer cell dimensions (length or diameter, thickness, height, or width) for approximation unless a manufacturer’s specification was available. This approach results in quite accurate values for cylindrical and prismatic cells due to their cylindrical and cuboidal shape. However, pouch cells do not have a cuboidal shape due to their thin sealing notch width ranging from 5 to 10 mm. While the impact of this on total cell volume is minor, the sealing notch width can significantly increase the cell length and/or height. Since precise information on the sealing notch width is missing for most cells in our database, we calculated the cell volume for all pouch cells as a cuboid. However, this approach overestimates the cell volume and, thus, lowers energy densities. A typical pouch-type cell with 100 mm height and a sealing notch width of 7 mm per side may be assigned a 12% lower energy density than its real value. Our energy densities for pouch cells are therefore underestimated.
e = C · U M   i n   Wh kg
w = C · U V   i n   Wh L
The data show a steady increase in both specific energy and energy densities for all cell formats between 2010 and 2021. Compared to pouch and prismatic cells, the increase for cylindrical cells (cf. Figure 6c,f) is less noticeable, with average values reaching more than 250 Wh/kg and 700 Wh/L in 2021. For pouch cells (cf. Figure 6b,e), there were sharp increases in performance between 2015 and 2018, reaching over 260 Wh/kg in 2021 and thus surpassing the cylindrical cells. In parallel, energy density reached around 560 Wh/L. As discussed, this value is likely to be underestimated. Maximum values unaffected by our calculation and sourced using the manufacturers’ specifications reach around 670 Wh/L. This is almost equal to cylindrical cells. Prismatic cells (cf. Figure 6a,d) continue to lag behind the other formats in specific energy and energy density at the cell level. However, they have improved significantly. The difference between all three cell formats is less noticeable for the specific energy, with prismatic cells around 200 Wh/kg on average in 2021. Here, we highlight the difference between average LFP cells at around 160 Wh/kg and average NMC/NCA cells at around 210–220 Wh/kg. For energy density, average values have been 400–450 Wh/L since 2019, with NMC/NCA cells achieving an average value of around 550 Wh/L and LFP cells around 380 Wh/L in 2021. Maximum energy densities even surpassed the 650 Wh/L threshold, close to the other formats.
As will be discussed in Section 3.3.2, energy density and specific energy are largely determined by the applied active materials and the ratio of active to passive components in a cell. This partly explains the gap between the average values of the formats. In particular, this addresses the large share of lower-energy LFP prismatic cells versus the high-energy NCA cathode materials in Tesla’s cells from the very beginning.

3.3. Electrode Properties

3.3.1. Stack Design

Apart from the selected active materials, the electrode properties, and the chosen cell format, assembling the electrodes into the housing is crucial for the overall cell performance [14,125]. Two principal techniques exist: (1) winding of continuous electrodes and (2) stacking of pre-cut electrodes (cf. [126]). In practice, several combinations such as Z-folding (cf. [127]), stack-winding (cf. [128]), and other methods are used. Simple electrode winding is applied to both prismatic (cf. [129]) and cylindrical (cf. [130]) cells.
Different techniques have specific safety properties and facilitate specific production footprints (such as cells per minute), which leads to the relevant techniques varying for different applications and formats. The interaction of the final electrode geometry with the cell housing may lead to a certain level of dead volume inside the cell, directly affecting the achievable energy density and specific energy. Apparently, winded electrodes in cylindrical cells do not create any dead volume, so this only results from the space required for contacting and cap components. Hence, this type of cell naturally features high energy densities. In contrast, an elongated electrode coil inside a prismatic/rectangular cell housing will create a large dead volume. For prismatic cells, the increasing energy density and specific energy may be attributed, to a certain extent, to changing the electrode geometry from large single coils with a large radius to several stacked rolls with smaller radii or to fully stacked electrode sheets. However, this information is missing in our database and cannot be analyzed.

3.3.2. Cathode and Anode Active Materials

Discussions about active materials typically focus on cathodes, as these make up the biggest share of the cell in terms of cost and weight [2,112]. As a result, many cathode materials are utilized for automotive applications to enable cost-effective and high-energy Li-ion batteries. In parallel, almost every cell manufacturer uses a unique material combination with a specific chemical composition, particle size distribution, and particle coating. Thus, detailed information on these materials across the global automotive industry is scarce, and the shares of different cathode materials were analyzed on an aggregated level. Based on the data available, we grouped the cathode materials based on their approximate chemical composition into LFP (ideally LiFePO4), LMO (ideally LiMn2O4), NCA (LiNi0.8+x+yCo0.15−xAl0.05−yO2; 0 ≤ x < 0.15; 0 ≤ y < 0.05) or NMC (LiNixMnyCozO2; x, y, z ≥ 0; x + y + z = 1). Wherever data were available, we further differentiated NMC materials into NMC111 (ideally LiNi0.33Mn0.33Co0.33O2), NMC2xx-5xx (LiNixMnyCozO2, 0.2 ≤ x ≤ 0.5; x + y + z = 1), NMC622 (ideally LiNi0.6Mn0.2Co0.2O2) and NMC811 (ideally LiNi0.8Mn0.1Co0.1O2). Different material blends, such as NMC/LMO [131,132], further aggravated the analysis and increased the uncertainty of specific material shares. Here we arbitrarily assumed a decreasing LMO share over the last years from 30 wt.% to 10 wt.% for all potential LMO-featured blends. We discuss the limitations of this approach in Section 4.1.
Figure 7a shows the global shares of different cathode materials between 2010 and 2021, weighted by MWh and limited to BEVs only.
While several BEVs even used pure LMO cathodes in the early 2010s, their importance decreased continuously until LMO almost disappeared after 2016.
The market share of LFP ranges from 5 to 20%, with a peak in 2016 resulting from the high market growth in China and the preferred use of LFP by many Chinese manufacturers. Between 2016 and 2019, LFP shares declined. Starting in 2020, LFP regained its market shares and reached around 15% in 2021. This momentum resulted from rising raw material costs and further BEV mass-market diffusion, which renders low-cost and broadly available materials such as LFP highly attractive. Additionally, new LFP cell designs have increased the useable energy densities.
For NCA, market shares are strongly correlated to the global market share of Tesla vehicles. The maximum share was around 40% in 2013: it has since remained around 20%. We classified these NCA shares as upper thresholds since our database for Tesla vehicles is more complete than for other OEMs and their utilized chemistries.
For NMC, market shares have been well above 50% since 2016, with a noticeable increase until 2021. Even though detailed NMC composition is often unavailable (i.e., the NMCxxx market share was around 25% in 2021), there is an obvious transition to Ni-rich NMC compounds. This facilitates higher vehicle ranges due to higher achievable energy density and specific energy but also increases the cell cost [2], primarily due to the differences in the cost of cobalt and nickel precursors. On the material level (meaning calculated vs. graphite potential), reversible specific energy and energy densities for LMO are 480 Wh/kg and 2 kWh/L, 512 Wh/kg and >2 kWh/L for LFP, 540 Wh/kg and 2.6 kWh/L for NMC111, 590 Wh/kg and 2.9 kWh/L for NMC622, and even more than 700 Wh/kg and 3.4 kWh/L for NMC811 or NCA [4,133,134]. In 2021, the market share for NMC622 and NMC811 was around 12%.
While missing information was well below 10% until 2016, this value increased in the following years to around 27% in 2021. Information on cell chemistries often originates from scarcely accessible teardown reports of battery cells, so a certain delay to the BEV model launch happens. This resulted in an increased share of missing information between 2018 and 2021. This excludes the NCA chemistries associated with Tesla sales, for which our database provides good coverage. Thus, the market shares of unknown chemistries most likely correspond to either LFP or NMC. Here, we draw attention to a shift from LFP to NMC in many Chinese BEV models in the period 2016 to 2018. In contrast to this, LFP-based batteries have been reintroduced in the latest model generations from 2020 onwards.
Figure 7b displays the global shares of different anode compounds between 2010 and 2021. There are more missing data than in the previous sections, with around 40% in 2021. In contrast, the anode materials used in commercial Li-ion batteries are not as diverse as those used for the cathode. While we observed minor shares for LTO in the early 2010s, this almost disappeared from 2014 onwards. Primarily, graphite-based materials were used. Since 2017, the market share of graphite/silicon blends (cf. [135,136]) has risen sharply. However, our data do not show whether this means only a minor percentage and hence a minor boost of graphite capacity (cf. [42]) to values of around 400 mAh/g, or whether respective blends utilize the storage capacity of silicon to a higher degree. In 2021, graphite/silicon blends had a market share of at least 20%.

3.3.3. Electrode Thicknesses and Porosities

In contrast to the data shown in the previous sections, the following evaluations were conducted using the supplemental database without sales data. In order to still evaluate trends for relevant design parameters and trade-offs, selectively available data on electrode thickness and porosity were analyzed using a time series analysis and statistical evaluation.
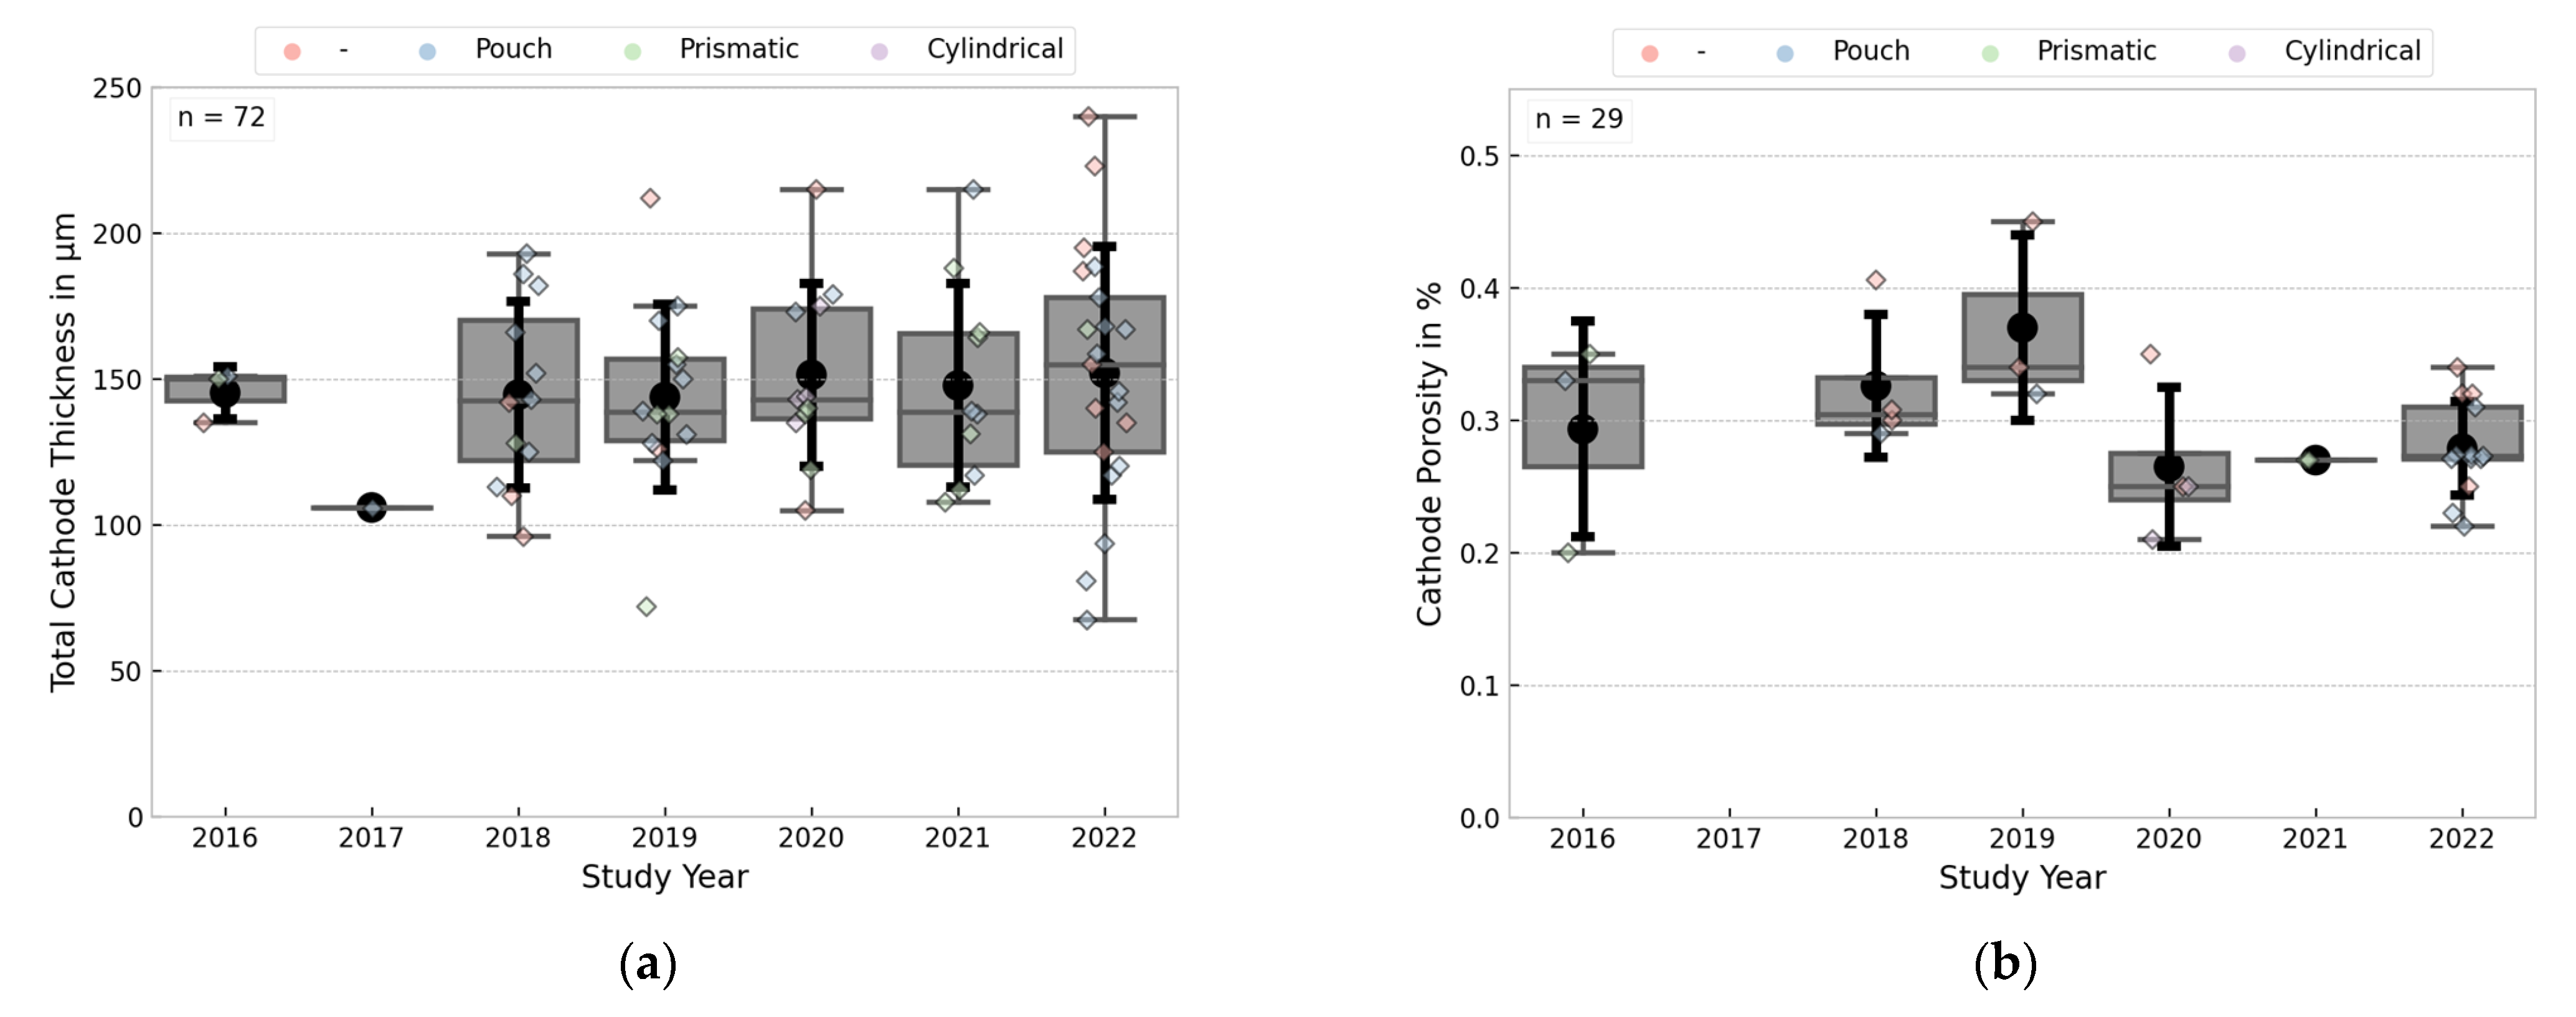
Figure 8 shows the temporal evolution for electrode thicknesses in µm (double-sided coating including current collector) and coating porosities in percentage. Cathode chemistries are NMC/NCA (78%), LFP (6%), blends (7%), and others (9%). Anode chemistries include natural or synthetic graphite (95%) and Gr-SiO blends (5%). Depending on whether the anode or cathode is considered, cell formats include pouch-type cells (50–59%), prismatic cells (22–29%), cylindrical cells (5–6%), and not-specified cell formats (7–22%). If only a one-sided coating thickness was available, we used findings from Section 3.3.4 to derive the total electrode thicknesses.
We found no statistically significant changes in total cathode thickness over the last six years, as both median and mean values range from 140 to 155 µm (cf. Figure 8a). The overall mean is 147.6 µm (±34.7 µm standard deviation), and the overall median is 142.5 µm. Only five cells reach over 200 µm, with 240 µm the highest thickness. Only three cells fall below 100 µm, with 72 µm the lowest thickness. Since our sample is dominated by pouch cells, distinct conclusions about the influence of cell format are limited. However, the analysis did not reveal any substantial differences. In cell chemistry, NMC/NCA chemistries spread across the entire corridor, while LFP-type cells are above 165 µm only. This indicates that LFP cells may be characterized by thicker electrodes to compensate for lower capacity.
We found no statistically significant changes in cathode coating porosity over the last six years, as both median and mean values range from 25 to 35% (cf. Figure 8b). However, there are slight tendencies toward lower porosities. We highlight cathode porosities ranging from 20 to 30%, especially in the 2020s. The overall mean is 29.4% (±5.5% standard deviation), and the median is 27.4%. There are no significant effects of cell format or chemistry.
For total anode thickness (cf. Figure 8c), we found a slight increase over the last six years, but note that this trend is not statistically significant (p > 0.05). The overall mean is 161.2 µm (±36.9 µm standard deviation), and the overall median is 154 µm. Ten cells reach over 200 µm, with 243.6 µm the highest thickness and 80 µm the thinnest electrode. There are no significant effects of cell format or chemistry.
Findings for the anode coating porosity are similar to those for the cathode (cf. Figure 8d). Thus, we found no statistically significant changes in coating porosities over the last six years, as both median and mean values range from 25 to 35%. The overall mean is 30.2% (±6.2% standard deviation), and the median is 31%. Overall, porosities tend to be slightly higher than for the cathode. There are no significant effects of cell format or the share of silicon.
In conclusion, our findings indicate that single-sided electrode coatings above 100 µm are typically unexploited today. While we find rather constant cathode thicknesses in parallel with more high-energy active materials, there is a slight increase in anode thicknesses to sustain an appropriate N/P ratio. For electrode porosities, we found a corridor from around 20 to below 35% forming in recent years, implying a trend toward HE electrode designs (low porosity) rather than HP (high porosity, over 30%).

3.3.4. Current Collector Thicknesses

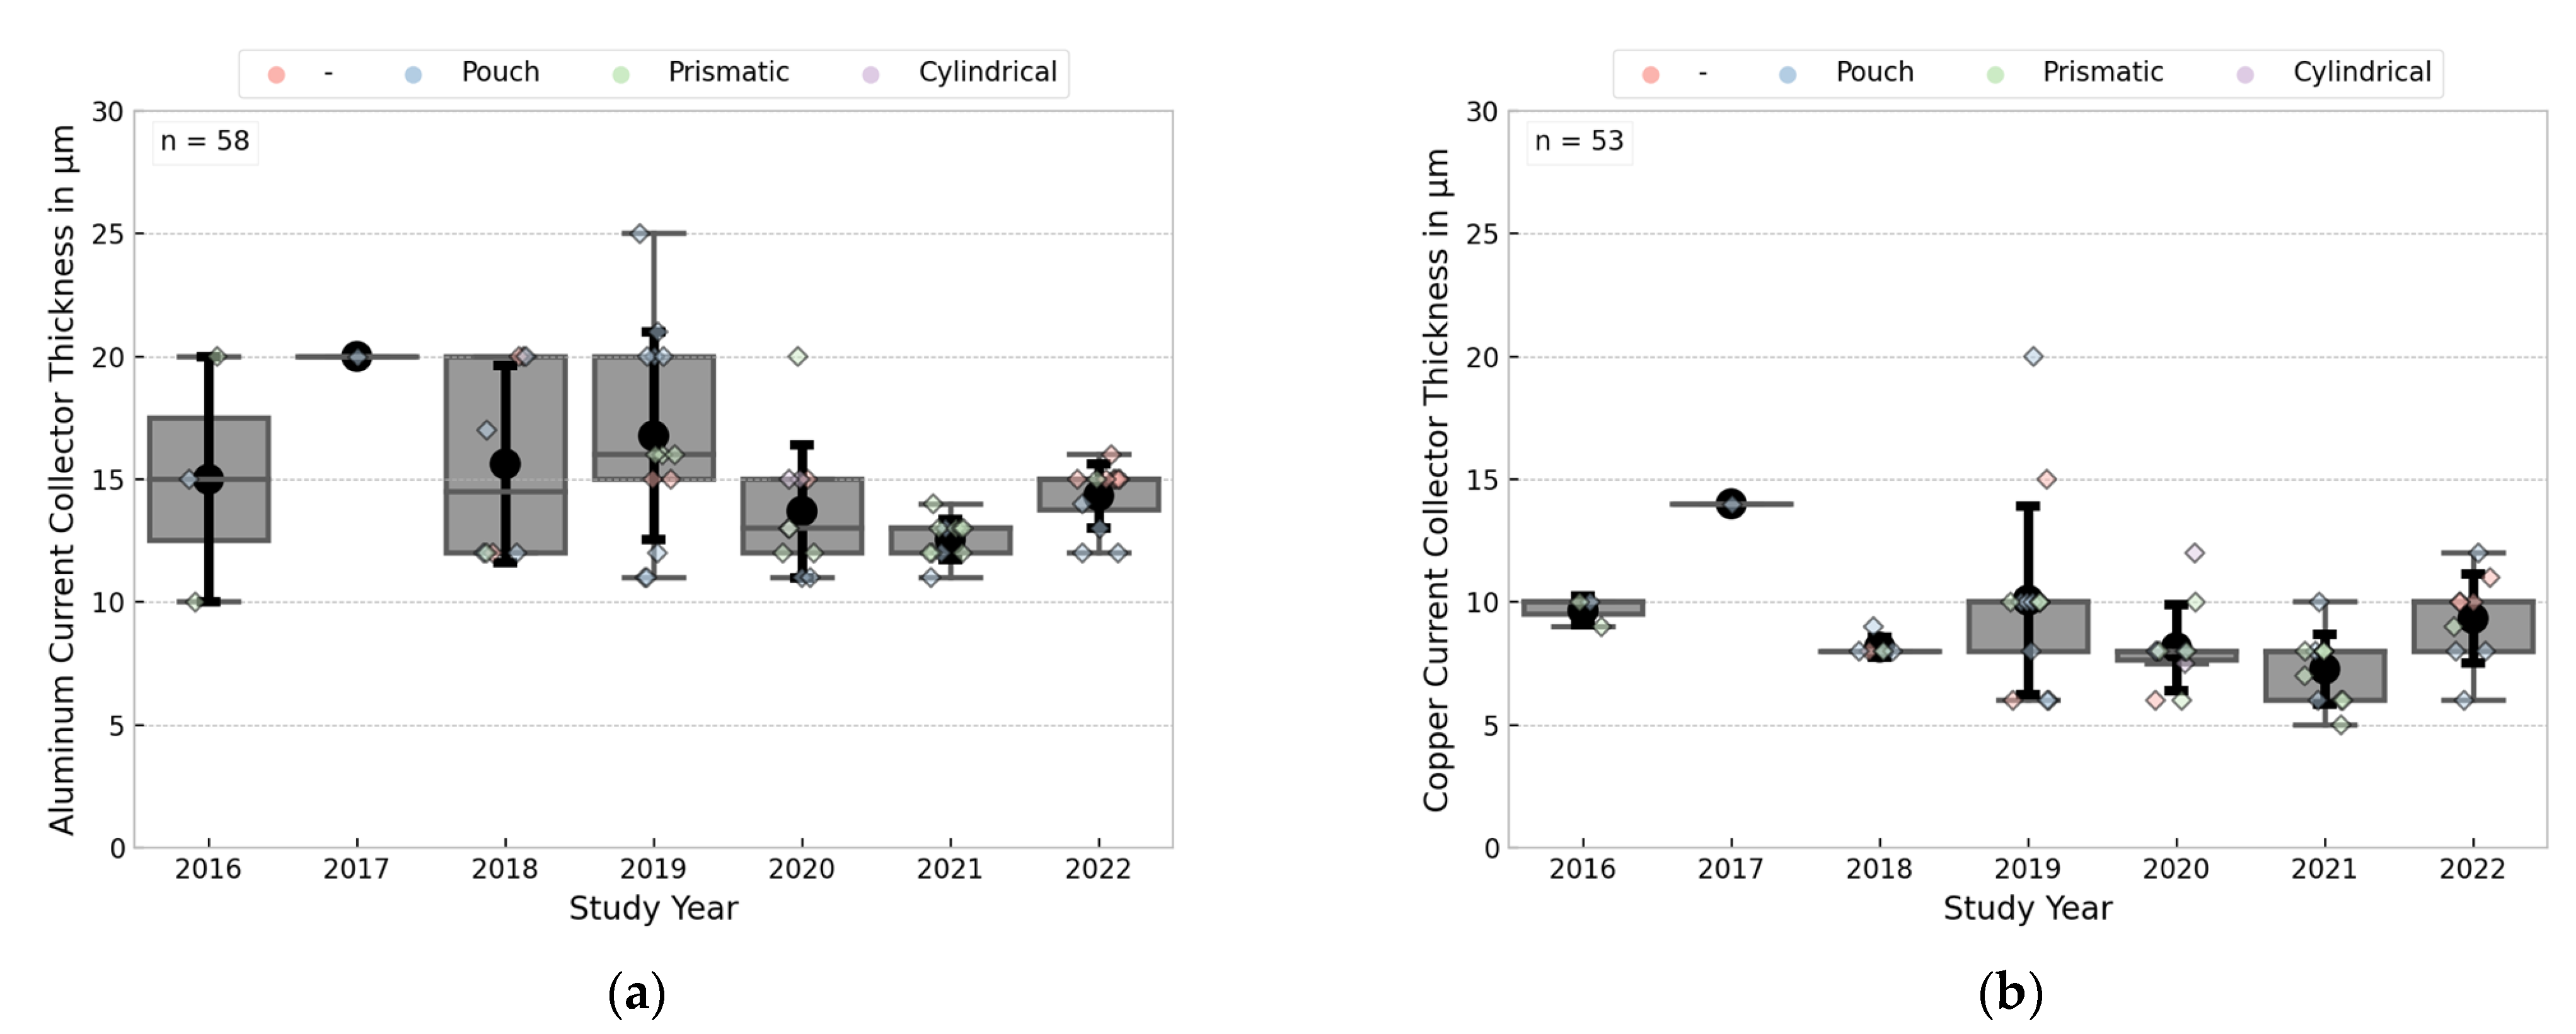
Figure 9 shows the current collector thicknesses in µm over time. Shares for cell chemistries and formats are similar to the previous section.
For aluminum foils (cf. Figure 9a), we find a saturation at 12 to 15 µm in the 2020s. Overall, foils range from 10 to 25 µm, the overall mean is 14.7 µm (±3.3 µm standard deviation), and the overall median is 14.5 µm. Over the considered period, median and mean values range from 13 to 17 µm, with 15 µm as the modal value. There are no significant effects of cell format or chemistry.
For copper foils (cf. Figure 9b), we find a saturation at 8 to 10 µm in the 2020s. Overall, foils range from 5 to 20 µm, the overall mean is 8.8 µm (±2.5 µm standard deviation), and the overall median is 8 µm. Over the considered period, median and mean values range from 13 to 17 µm, with 15 µm as the modal value. There are no significant effects of cell format or chemistry. Compared to aluminum foil, copper’s better electrical conductivity, higher heat conductivity and thus more efficient dissipation, and slightly higher mechanical properties allow for thinner foils.
We conclude that there are clear trends toward thinner current collector foils, i.e., ≤15 µm for aluminum and ≤10 µm for copper foils, to reduce costs and increase energy density and specific energy.

3.3.5. Separator Thickness

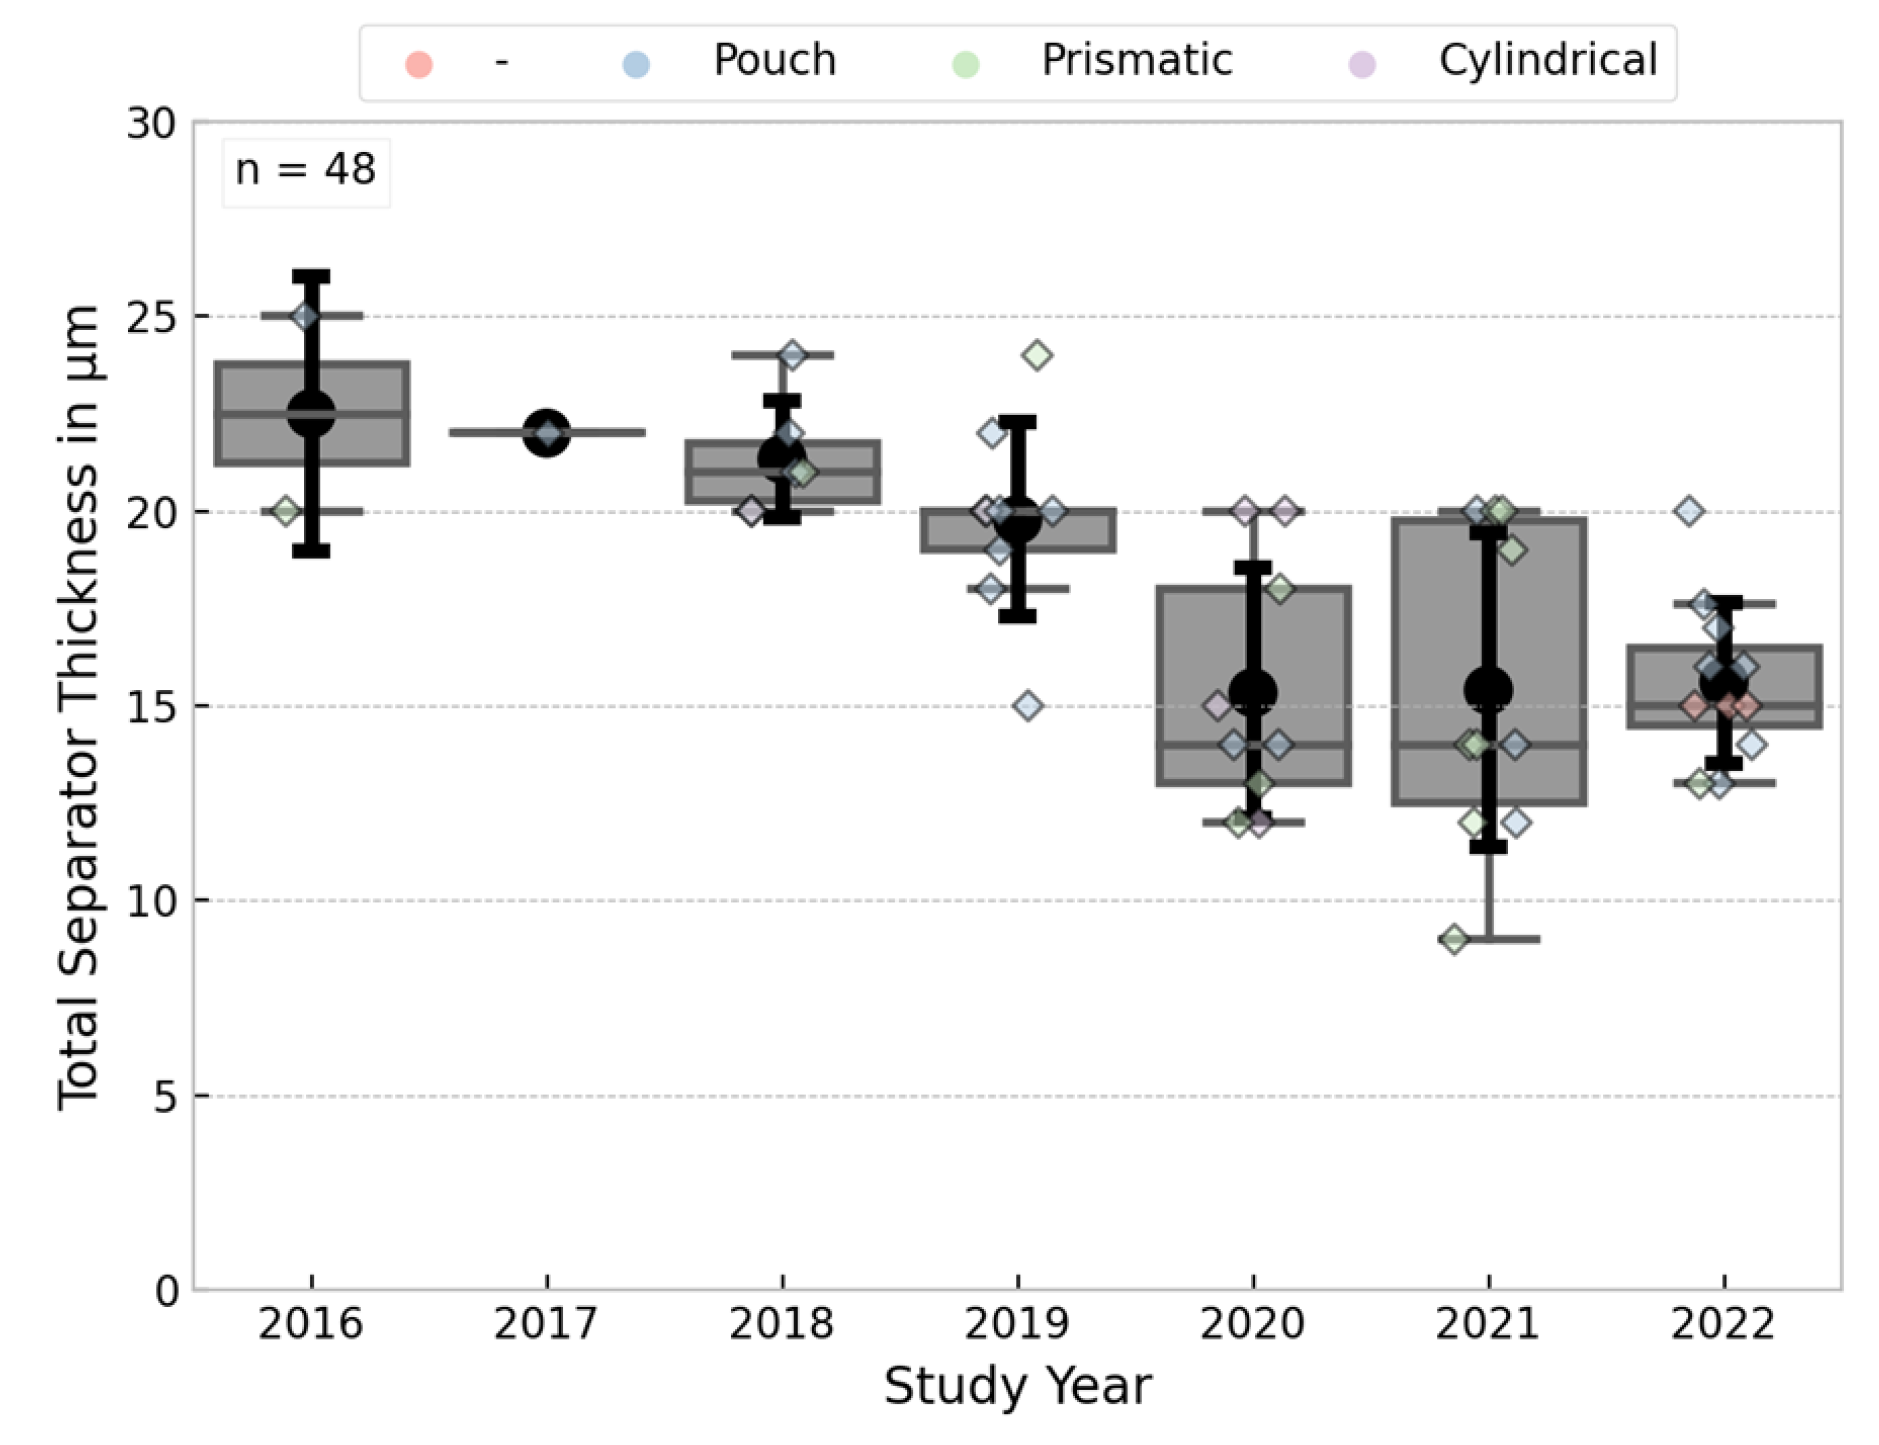
Figure 10 illustrates the total separator thicknesses in µm over time. This total thickness includes the mostly polymer-based separator plus one- or double-sided coatings.
A clear and statistically significant (p < 0.05) trend toward thinner separators is visible. Both median and mean values decreased from 19 to 23 µm in 2019 to 14 to 15.6 µm in 2022. Values range from 8 to 25 µm, while pouch-type cells are above 13 µm. Thinner separators under 10 µm are found more often in prismatic or cylindrical cells, which might be due to the solid housing. However, this dependency is not statistically significant. There are no effects of either cathode or anode chemistry. In comparison, Greenwood et al. [66] mention even thinner separators of 5 µm, but 12 µm is given as the most representative value.

4. Discussion

The present study aimed to assess design trends for different battery parameters from pack to cell to the electrode level using empirical battery and vehicle sales data. This allowed us to draw conclusions on the overall technological progress and the impact of the latest technologies on the market. However, our results come with some uncertainty.

4.1. Data Limitations

Our study is based on two databases that build on various sources. The xEV-database contains information from several sources, so mapping xEV sales data and xEV battery information is not straightforward. The names of xEV models can vary, and most sources do not distinguish model variants (e.g., mid-range or long-range) and model generations (e.g., updated battery packs). That said, our analyses are partially based on sales split assumptions for one model and its battery-specific sub-models. There is also uncertainty concerning sales figures for OEM and xEV models since numbers may vary between different sources. The database contains more than 1100 xEV (HEV, PHEV, BEV, and FCEV) models sold worldwide between 2010 and 2021. Related to BEV sales in 2021, completeness for battery pack energy (kWh) is 96% compared to global sales; completeness for cathode chemistry is 71%; completeness of battery cell format is 61%; completeness of anode chemistry is 53%. Most missing data relates to the Chinese market, so our findings particularly underrepresent Chinese OEM’s cell designs and battery intricacies. Information on other battery materials (e.g., electrolytes) is missing. However, based on the partially available data, we do not see any major shift from established LiPF6-based electrolytes, separators, and coating materials. We highlight the increasing uncertainty in recent years because data collection and evaluation have become more difficult due to an expanding xEV product portfolio and the multi-sourcing strategy of many OEMs.
We acknowledge that the second database, used to assess electrode properties, such as coating thicknesses or porosities, is based on a limited vehicle sample without matching vehicle sale figures. However, the evaluations did include globally important models using different cell formats from various OEMs and cell suppliers, such as Renault Zoe (MY2019), Volkswagen ID3 (MY2021) and ID4 (MY2021), Tesla Model S (MY2016) and Model 3 (MY2020), Porsche Taycan (MY2021), Hyundai Kona (MY2018) and IONIQ 5 (MY2021), Jaguar I-Pace (MY2018), Mercedes-Benz EQS580 (MY2021), KIA EV6 (MY2022), or BYD Tang (MY2021).

4.2. Discussion of Results

Examining the evolution of battery performance indicators reveals a continuous improvement of battery properties from the pack to the electrode and material levels. In contrast to the impression given by individual announcements from research and industry, our market-share weighted results rarely show major disruptions and highlight the significant delay involved for new technologies to penetrate the market (cf. NMC811 market share in 2021: 8%).
Pack properties:
While the average cross-segment pack capacities have been rising almost constantly since 2010, this trend might reach global saturation with China’s strong market growth of smaller vehicles (AB segment). Plus, it is somewhat reasonable to assume that battery pack capacities may only increase until a minimum acceptable segment-specific real-world range is reached, even though subjective situational range anxiety or anticipatory range concerns hamper the BEV adoption today [137].
When comparing the average cross-format energy density at the cell level (see Section 3.2.3) to the cross-segment average pack capacity (see Section 3.1), we observed a strong correlation and similar growth rates until around 2018. Since then, total installed pack capacities have grown significantly faster than the cell energy density. Since this cannot be attributed to increased space within the vehicle, it implies that energy density is being improved at the pack level rather than the cell level. For instance, purely EV platforms and C2P concepts can be mentioned here. However, detailed design characteristics at the pack level were not part of this study but could be included in future studies.
Cell properties:
The development of cell formats for BEV over the last ten years shows clear differences between pouch, prismatic, and cylindrical formats. The cylindrical cell, dominated by the technology development of Tesla and Panasonic, shows little change apart from the transition from the 18650 to the 21700 formats. Regarding properties such as energy density and specific energy, the cells utilizing NCA chemistry have already been at a very high level for several years and currently reach >700 Wh/L and >250 Wh/kg. However, in addition to this technical perspective, the data also show that, with only one major user in the automotive sector, it is becoming increasingly difficult to maintain the market shares for cylindrical cells. With the announcements of companies like BMW, GM, or Rivian [12], the cylindrical cell with the new 46 mm format (e.g., 4680) could experience a renaissance in the coming years, possibly also with a greater variety of active materials.
Compared to the cylindrical cell, recent developments in prismatic and pouch cells have allowed these formats to catch up. While the average energy density of pouch cells (>650 Wh/L) has now almost reached the level of cylindrical cells, their average specific energy has even exceeded that of cylindrical cells (>260 Wh/kg). Although substantially longer pouch cells emerged, the cell volume was fairly constant. Prismatic cells have undergone the most complex development, comprising three major reasons: (1) the utilization of NMC or LFP, (2) the transition from cell-to-module to direct C2P integration, and (3) and stack design changes from electrode winding to stacking. Concerning energy density and specific energy, best-in-class NMC cells follow close behind pouch and cylindrical cells and LFP cells substantially increased to over 450 Wh/L and around 200 Wh/kg in 2021. Some deficit of prismatic cells in terms of specific energy and energy density compared to cylindrical and pouch cells may be related to other factors, such as heavier contacting elements and the solid and more robust cell housing for large cells.
Electrode design
We highlight and discuss three main findings: (1) Cell manufacturers tend not to increase the electrode coating thicknesses to increase energy density and specific energy and reduce costs. Our empirical findings still mirror those of the five-year-old assessment by Schmuch et al. [2], where 65 to 80 µm are given as typical one-sided coating thickness corridors for automotive cells. While Patry et al. [31] highlight noteworthy cost reduction potentials by increasing the one-sided coating thickness to above 100 µm, Wu et al. [138] and Schmuch et al. [2] state a single-sided coating thickness of 150 µm as a long-term boundary achievable in practical applications. However, our findings indicate that thick electrode coatings above 100 µm are still typically unexploited today. We emphasize rather constant cathode thicknesses (see Section 3.3.3) in line with more high-energy active materials (see Section 3.3.2) in line with a slight increase in anode thicknesses to presumably sustain an appropriate N/P ratio. (2) Cell manufacturers tend to balance the electrode porosities between high energy and power. Our empirical findings for cathode and anode porosities with roughly 20 to 35% coincide with the optimization corridor of 10 to 40% for automotive cells given by Zheng et al. [119] and the typical value of 35% stated for standard cathodes by Gallager et al. [65]. However, we highlight the trend toward HE electrode designs (low porosity) rather than HP (high porosity, over 30%), yet without impairing fast-charging capability [15]. Unfortunately, we cannot conclude why implementing new cathode active materials to improve cell capabilities is more apparent in commercial cells than adjusting electrode thicknesses or porosities. (3) Cell manufacturers tend to optimize the thickness of inactive cell components. We found the most distinct trends for decreasing current collector foils’ and separators’ thicknesses to reduce costs and increase energy density and specific energy. Greenwood et al. [66] have similar findings, with 10 to 16 µm in the most recent studies compared to 20 µm in older studies for aluminum current collector foils. Eight to 10 µm are stated for copper current collector foils, and limits of approximately 6 µm due to either mechanical strength or processability.

5. Conclusions

The present study assessed design trends for different battery parameters from pack to the electrode level using empirical battery and vehicle sales data. In contrast to the current literature providing detailed technological insights into single packs, cells, and their technological intricacies, the presented study is the first cross-cutting and comprehensive assessment of pack energies, formats, external cell dimensions, energy density, specific energy, active material selection, and electrode properties with actual sales data. In doing so, this study assesses the status quo of the global automotive Li-ion battery market and the diffusion speed of new technologies and allows us to draw conclusions on near-term trends.
Our market share-weighted findings emphasize that no single battery pack capacity can be assigned to a specific vehicle segment. While all three formats are likely to persist, we highlight the increasing relevance of prismatic cells. While we observed increasing cell dimensions, with the longest cells reaching 500 mm (pouch) and almost 1000 mm (prismatic) in 2021, total cell volumes somewhat consolidated. This indicates that single cells have not necessarily become larger but have been tailored to the space available in the vehicle. In addition, we highlight that pack-level improvements are gaining importance. We observed an increasing differentiation between either high-energy or low-cost cathode and anode materials and increasing cell capacities, equivalent to gaining about 100% (energy density) and 70% (specific energy) compared to the 2010 and 2021 averages. Despite these improvements, this study finds that the widespread market diffusion of the latest cell technologies proceeds slower than industry announcements suggest. Furthermore, well-known and literature-proofed potentials, such as adjusting electrode design parameters, are not yet fully exploited.
Apart from more advanced statistical analysis and including more recent data, future studies may focus on other battery parameters or other important xEV subgroups, such as plug-in hybrids, and compare findings to those of this study.

Author Contributions

The authors contributed to the work as follows: Conceptualization and methodology, S.L. and C.N.; programming and data analysis, S.L., C.N. and T.W.; writing—original draft preparation, S.L. and C.N.; review and editing, T.W.; data visualization, S.L. and T.W. All authors have read and agreed to the published version of the manuscript.

Funding

This research was funded by the German Federal Ministry for Education and Research (BMBF), grant numbers 03XP0256 (FoFeBat) and 03XP0272B (BEMA) and the fund for strategic proprietary research of Fraunhofer Institute for Systems and Innovation Research ISI.

Data Availability Statement

The data presented in this study are partially available on request from the corresponding author. The data included in the databases are taken from public and non-public/commercial sources, restricting their publication.

Conflicts of Interest

The authors declare no conflict of interest.

Abbreviations

BEVBattery Electric Vehicle
C2PCell-to-Pack
EVElectric Vehicle
HPHigh Power
HEHigh Energy
Li-ionLithium-ion
MYModel Year
OEMOriginal Equipment Manufacturer
xEVDifferent electric vehicles, including hybrids, plug-in hybrids, BEVs, and fuel-cell vehicles

References

  1. Kim, T.; Song, W.; Son, D.-Y.; Ono, L.K.; Qi, Y. Lithium-ion batteries: Outlook on present, future, and hybridized technologies. J. Mater. Chem. A 2019, 7, 2942–2964. [Google Scholar] [CrossRef]
  2. Schmuch, R.; Wagner, R.; Hörpel, G.; Placke, T.; Winter, M. Performance and cost of materials for lithium-based rechargeable automotive batteries. Nat. Energy 2018, 3, 267–278. [Google Scholar] [CrossRef]
  3. Masias, A.; Marcicki, J.; Paxton, W.A. Opportunities and Challenges of Lithium Ion Batteries in Automotive Applications. ACS Energy Lett. 2021, 6, 621–630. [Google Scholar] [CrossRef]
  4. Ding, Y.; Cano, Z.P.; Yu, A.; Lu, J.; Chen, Z. Automotive Li-Ion Batteries: Current Status and Future Perspectives. Electrochem. Energy Rev. 2019, 2, 1–28. [Google Scholar] [CrossRef]
  5. Chen, Y.; Kang, Y.; Zhao, Y.; Wang, L.; Liu, J.; Li, Y.; Liang, Z.; He, X.; Li, X.; Tavajohi, N.; et al. A review of lithium-ion battery safety concerns: The issues, strategies, and testing standards. J. Energy Chem. 2021, 59, 83–99. [Google Scholar] [CrossRef]
  6. Deng, J.; Bae, C.; Denlinger, A.; Miller, T. Electric Vehicles Batteries: Requirements and Challenges. Joule 2020, 4, 511–515. [Google Scholar] [CrossRef]
  7. Davis, S.J.; Lewis, N.S.; Shaner, M.; Aggarwal, S.; Arent, D.; Azevedo, I.L.; Benson, S.M.; Bradley, T.; Brouwer, J.; Chiang, Y.-M.; et al. Net-zero emissions energy systems. Science 2018, 360, eaas9793. [Google Scholar] [CrossRef]
  8. Xu, C.; Dai, Q.; Gaines, L.; Hu, M.; Tukker, A.; Steubing, B. Future material demand for automotive lithium-based batteries. Commun. Mater. 2020, 1, 99. [Google Scholar] [CrossRef]
  9. Marklines. Marklines Co L Automotive Industry Portal. Available online: http://www.marklines.com/ (accessed on 27 January 2023).
  10. IEA. Global EV Outlook 2022; IEA: Paris, France, 2022; Available online: https://www.iea.org/reports/global-ev-outlook-2022 (accessed on 24 January 2023).
  11. Cornet, A.; Heuss, R.; Tschiesner, A.; Hensley, R.; Hertzke, P.; Möller, T.; Schaufuss, P.; Conzade, J.; Schenk, S.; von Laufenberg, K. Why the Automotive Future is Electric: Mainstream EVs Will Transform the Automotive Industry and Help Decarbonize the Planet; IAA: Westchester, IL, USA, 2021. [Google Scholar]
  12. Volta Foundation. The Battery Report 2022; Volta Foundation: San Francisco, CA, USA, 2023; Available online: https://www.volta.foundation/annual-battery-report (accessed on 15 February 2023).
  13. Link, S.; Neef, C.; Wicke, T.; Hettesheimer, T.; Diehl, M.; Krätzig, O.; Degen, F.; Klein, F.; Fanz, P.; Burgard, M.; et al. Development Perspectives for Lithium-Ion Battery Cell Formats. 2022. Available online: https://www.isi.fraunhofer.de/content/dam/isi/dokumente/cct/2022/Development_perspectives_for_lithium-ion_battery_cell_formats_Fraunhofer_2022.pdf (accessed on 20 February 2023).
  14. Kwade, A.; Haselrieder, W.; Leithoff, R.; Modlinger, A.; Dietrich, F.; Droeder, K. Current status and challenges for automotive battery production technologies. Nat. Energy 2018, 3, 290–300. [Google Scholar] [CrossRef]
  15. Lain, M.J.; Brandon, J.; Kendrick, E. Design Strategies for High Power vs. High Energy Lithium Ion Cells. Batteries 2019, 5, 64. [Google Scholar] [CrossRef]
  16. EUCAR. Battery Requirements for Future Automotive Applications: EG BEV&FCEV; EUCAR: Brussels, Belgium, 2019. [Google Scholar]
  17. Rauscher, S. Einfluss von Material-und Beschichtungsparametern auf die Elektrodenmorphologie und die Leistungsparameter von Lithiumionen-Zellen. Ph.D. Thesis, Universität Ulm, Ulm, Germany, 2014. [Google Scholar] [CrossRef]
  18. Yang, X.-G.; Liu, T.; Wang, C.-Y. Thermally modulated lithium iron phosphate batteries for mass-market electric vehicles. Nat. Energy 2021, 6, 176–185. [Google Scholar] [CrossRef]
  19. Thompson, D.L.; Hartley, J.M.; Lambert, S.M.; Shiref, M.; Harper, G.D.J.; Kendrick, E.; Anderson, P.; Ryder, K.S.; Gaines, L.; Abbott, A.P. The importance of design in lithium ion battery recycling—A critical review. Green Chem. 2020, 22, 7585–7603. [Google Scholar] [CrossRef]
  20. Schmidt, A.; Smith, A.; Ehrenberg, H. Power capability and cyclic aging of commercial, high power lithium ion battery cells with respect to different cell designs. J. Power Sources 2019, 425, 27–38. [Google Scholar] [CrossRef]
  21. Wagner, R.; Preschitschek, N.; Passerini, S.; Leker, J.; Winter, M. Current research trends and prospects among the various materials and designs used in lithium-based batteries. J. Appl. Electrochem. 2013, 43, 481–496. [Google Scholar] [CrossRef]
  22. Al Hallaj, S.; Maleki, H.; Hong, J.; Selman, J. Thermal modeling and design considerations of lithium-ion batteries. J. Power Sources 1999, 83, 1–8. [Google Scholar] [CrossRef]
  23. Huang, Y.; Lu, Y.; Huang, R.; Chen, J.; Chen, F.; Liu, Z.; Yu, X.; Roskilly, A.P. Study on the thermal interaction and heat dissipation of cylindrical Lithium-Ion Battery cells. Energy Procedia 2017, 142, 4029–4036. [Google Scholar] [CrossRef]
  24. Mao, C.; Ruther, R.E.; Li, J.; Du, Z.; Belharouak, I. Identifying the limiting electrode in lithium ion batteries for extreme fast charging. Electrochem. Commun. 2018, 97, 37–41. [Google Scholar] [CrossRef]
  25. Mussa, A.S.; Liivat, A.; Marzano, F.; Klett, M.; Philippe, B.; Tengstedt, C.; Lindbergh, G.; Edström, K.; Lindström, R.W.; Svens, P. Fast-charging effects on ageing for energy-optimized automotive LiNi1/3Mn1/3Co1/3O2/graphite prismatic lithium-ion cells. J. Power Sources 2019, 422, 175–184. [Google Scholar] [CrossRef]
  26. Preger, Y.; Barkholtz, H.M.; Fresquez, A.; Campbell, D.L.; Juba, B.W.; Romàn-Kustas, J.; Ferreira, S.R.; Chalamala, B.R. Degradation of Commercial Lithium-Ion Cells as a Function of Chemistry and Cycling Conditions. J. Electrochem. Soc. 2020, 167, 120532. [Google Scholar] [CrossRef]
  27. Han, X.; Lu, L.; Zheng, Y.; Feng, X.; Li, Z.; Li, J.; Ouyang, M. A review on the key issues of the lithium ion battery degradation among the whole life cycle. Etransportation 2019, 1, 100005. [Google Scholar] [CrossRef]
  28. Wassiliadis, N.; Steinsträter, M.; Schreiber, M.; Rosner, P.; Nicoletti, L.; Schmid, F.; Ank, M.; Teichert, O.; Wildfeuer, L.; Schneider, J.; et al. Quantifying the state of the art of electric powertrains in battery electric vehicles: Range, efficiency, and lifetime from component to system level of the Volkswagen ID.3. Etransportation 2022, 12, 100167. [Google Scholar] [CrossRef]
  29. Mauler, L.; Duffner, F.; Zeier, W.G.; Leker, J. Battery cost forecasting: A review of methods and results with an outlook to 2050. Energy Environ. Sci. 2021, 14, 4712–4739. [Google Scholar] [CrossRef]
  30. Nykvist, B.; Nilsson, M. Rapidly falling costs of battery packs for electric vehicles. Nat. Clim. Chang. 2015, 5, 329–332. [Google Scholar] [CrossRef]
  31. Patry, G.; Romagny, A.; Martinet, S.; Froelich, D. Cost modeling of lithium-ion battery cells for automotive applications. Energy Sci. Eng. 2015, 3, 71–82. [Google Scholar] [CrossRef]
  32. Quinn, J.B.; Waldmann, T.; Richter, K.; Kasper, M.; Wohlfahrt-Mehrens, M. Energy Density of Cylindrical Li-Ion Cells: A Comparison of Commercial 18650 to the 21700 Cells. J. Electrochem. Soc. 2018, 165, A3284–A3291. [Google Scholar] [CrossRef]
  33. Muenzel, V.; Hollenkamp, A.; Bhatt, A.I.; De Hoog, J.; Brazil, M.; Thomas, D.; Mareels, I. A Comparative Testing Study of Commercial 18650-Format Lithium-Ion Battery Cells. J. Electrochem. Soc. 2015, 162, A1592–A1600. [Google Scholar] [CrossRef]
  34. Zeng, X.; Li, M.; Abd El-Hady, D.; Alshitari, W.; Al-Bogami, A.S.; Lu, J.; Amine, K. Commercialization of Lithium Battery Technologies for Electric Vehicles. Adv. Energy Mater. 2019, 9, 1900161. [Google Scholar] [CrossRef]
  35. Safari, M. Battery electric vehicles: Looking behind to move forward. Energy Policy 2018, 115, 54–65. [Google Scholar] [CrossRef]
  36. Barkholtz, H.M.; Fresquez, A.; Chalamala, B.; Ferreira, S.R. A Database for Comparative Electrochemical Performance of Commercial 18650-Format Lithium-Ion Cells. J. Electrochem. Soc. 2017, 164, A2697–A2706. [Google Scholar] [CrossRef]
  37. A2Mac1. Benchmarking Data and Tear-Down Reports; A2Mac1: Belleville, MI, USA, 2023; Available online: https://www.a2mac1.com/ (accessed on 3 February 2023).
  38. B3 Corporation. LIB Materials Market Bulletin E15Q3—Market Reports; B3 Corporation: Tokyo, Japan, 2015. [Google Scholar]
  39. Nykvist, B.; Sprei, F.; Nilsson, M. Assessing the progress toward lower priced long range battery electric vehicles. Energy Policy 2019, 124, 144–155. [Google Scholar] [CrossRef]
  40. B3 Corporation. LIB-Equipped Vehicle Market Bulletin E16Q4 and Long-Term LIB Market Forecast; B3 Corporation: Tokyo, Japan, 2016. [Google Scholar]
  41. B3 Corporation. LIB-Equipped Vehicle Market Bulletin E17Q4 and Long-Term LIB Market Forecast; B3 Corporation: Tokyo, Japan, 2017. [Google Scholar]
  42. B3 Corporation. LIB-Equipped Vehicle Market Bulletin E18Q4 and Long-Term LIB Market Forecast; B3 Corporation: Tokyo, Japan, 2018. [Google Scholar]
  43. B3 Corporation. LIB-Equipped Vehicle Market Bulletin E19Q4 and Long-Term LIB Market Forecast; B3 Corporation: Tokyo, Japan, 2019. [Google Scholar]
  44. B3 Corporation. LIB-Equipped Vehicle Market Bulletin E20Q4 and Long-Term LIB Market Forecast; B3 Corporation: Tokyo, Japan, 2020. [Google Scholar]
  45. B3 Corporation. LIB-Equipped Vehicle Market Bulletin E21Q4 and Long-Term LIB Market Forecast; B3 Corporation: Tokyo, Japan, 2021. [Google Scholar]
  46. B3 Corporation. Market Bulletin on LIB-Equipped Vehicle Markets (Q23Q1); B3 Corporation: Tokyo, Japan, 2023. [Google Scholar]
  47. Berman, K.; Carlson, R.; Dziuba, J.; Jackson, J.; Sklar, P.; Hamilton, C. The Lithium Ion Battery and the eV Market: The Science behind What You Can’t See; BMO: Hong Kong, China, 2018. [Google Scholar]
  48. Goldman, A.R.; Rotondo, F.S.; Swallow, J.G. Lithium Ion Battery Industrial Base in the U.S. and Abroad; IDA: Alexandria, VA, USA, 2019; IDA Document D-11032. [Google Scholar]
  49. Curry, C. Lithium-ion Battery Cost and Market; BNEF: New York, NY, USA, 2018; Available online: https://data.bloomberglp.com/bnef/sites/14/2017/07/BNEF-Lithium-ion-battery-costs-and-market.pdf (accessed on 2 February 2023).
  50. Hummel, P.; Bush, T.; Gong, P.; Yasui, K.; Lee, T.; Radlinger, J.; Langan, C.; Lesne, D.; Takahashi, K.; Jung, E.; et al. UBS Q-Series Tearing Down the Heart of an Electric Car: Can Batteries Provide an Edge, and Who Wins? Report; UBS: New York, NY, USA, 2018. [Google Scholar]
  51. José Pontes. EV Sales Blog. Available online: www.ev-sales.blogspot.com (accessed on 3 February 2023).
  52. Adam, A.; Knobbe, E.; Wandt, J.; Kwade, A. Application of the differential charging voltage analysis to determine the onset of lithium-plating during fast charging of lithium-ion cells. J. Power Sources 2021, 495, 229794. [Google Scholar] [CrossRef]
  53. Ahmed, S.; Trask, S.E.; Dees, D.W.; Nelson, P.A.; Lu, W.; Dunlop, A.R.; Polzin, B.J.; Jansen, A. Cost of automotive lithium-ion batteries operating at high upper cutoff voltages. J. Power Sources 2018, 403, 56–65. [Google Scholar] [CrossRef]
  54. B3 Corporation. LIB Materials Market Bulletin E16Q1; B3 Corporation: Tokyo, Japan, 2016. [Google Scholar]
  55. B3 Corporation. LIB Materials Market Bulletin E18Q1; B3 Corporation: Tokyo, Japan, 2018. [Google Scholar]
  56. B3 Corporation. LIB Materials Market Bulletin E19Q1; B3 Corporation: Tokyo, Japan, 2019. [Google Scholar]
  57. B3 Corporation. LIB Materials Market Bulletin E20Q1; B3 Corporation: Tokyo, Japan, 2020. [Google Scholar]
  58. B3 Corporation. LIB Materials Market Bulletin E22Q1; B3 Corporation: Tokyo, Japan, 2022. [Google Scholar]
  59. Daubinger, P.; Schelter, M.; Petersohn, R.; Nagler, F.; Hartmann, S.; Herrmann, M.; Giffin, G.A. Impact of Bracing on Large Format Prismatic Lithium-Ion Battery Cells during Aging. Adv. Energy Mater. 2022, 12, 2102448. [Google Scholar] [CrossRef]
  60. Deich, T.; Storch, M.; Steiner, K.; Bund, A. Effects of module stiffness and initial compression on lithium-ion cell aging. J. Power Sources 2021, 506, 230163. [Google Scholar] [CrossRef]
  61. Dreizler, A.M.; Bohn, N.; Geßwein, H.; Müller, M.; Binder, J.R.; Wagner, N.; Friedrich, K.A. Investigation of the Influence of Nanostructured LiNi0.33Co0.33Mn0.33O2Lithium-Ion Battery Electrodes on Performance and Aging. J. Electrochem. Soc. 2018, 165, A273–A282. [Google Scholar] [CrossRef]
  62. Du, Z.; Wood, D.L., III; Daniel, C.; Kalnaus, S.; Li, J. Understanding limiting factors in thick electrode performance as applied to high energy density Li-ion batteries. J. Appl. Electrochem. 2017, 47, 405–415. [Google Scholar] [CrossRef]
  63. DuBeshter, T.; Sinha, P.K.; Sakars, A.; Fly, G.W.; Jorne, J. Measurement of Tortuosity and Porosity of Porous Battery Electrodes. J. Electrochem. Soc. 2014, 161, A599–A605. [Google Scholar] [CrossRef]
  64. Duffner, F.; Kronemeyer, N.; Tübke, J.; Leker, J.; Winter, M.; Schmuch, R. Post-lithium-ion battery cell production and its compatibility with lithium-ion cell production infrastructure. Nat. Energy 2021, 6, 123–134. [Google Scholar] [CrossRef]
  65. Gallagher, K.G.; Trask, S.; Bauer, C.; Woehrle, T.; Lux, S.F.; Tschech, M.; Lamp, P.; Polzin, B.J.; Ha, S.; Long, B.; et al. Optimizing Areal Capacities through Understanding the Limitations of Lithium-Ion Electrodes. J. Electrochem. Soc. 2016, 163, A138–A149. [Google Scholar] [CrossRef]
  66. Greenwood, M.; Wentker, M.; Leker, J. A bottom-up performance and cost assessment of lithium-ion battery pouch cells utilizing nickel-rich cathode active materials and silicon-graphite composite anodes. J. Power Sources Adv. 2021, 9, 100055. [Google Scholar] [CrossRef]
  67. Günter, F.J.; Wassiliadis, N. State of the Art of Lithium-Ion Pouch Cells in Automotive Applications: Cell Teardown and Characterization. J. Electrochem. Soc. 2022, 169, 030515. [Google Scholar] [CrossRef]
  68. Heenan, T.M.M.; Jnawali, A.; Kok, M.D.R.; Tranter, T.G.; Tan, C.; Dimitrijevic, A.; Jervis, R.; Brett, D.J.L.; Shearing, P.R. An Advanced Microstructural and Electrochemical Datasheet on 18650 Li-Ion Batteries with Nickel-Rich NMC811 Cathodes and Graphite-Silicon Anodes. J. Electrochem. Soc. 2020, 167, 140530. [Google Scholar] [CrossRef]
  69. Heubner, C.; Nickol, A.; Seeba, J.; Reuber, S.; Junker, N.; Wolter, M.; Schneider, M.; Michaelis, A. Understanding thickness and porosity effects on the electrochemical performance of LiNi0.6Co0.2Mn0.2O2-based cathodes for high energy Li-ion batteries. J. Power Sources 2019, 419, 119–126. [Google Scholar] [CrossRef]
  70. Hewawasam, D.; Subasinghe, L.; Karunathilake, H.; Witharana, S. Bottom-up cost modeling of lithium-ion battery cells for electric vehicle applications. In Proceedings of the 2022 Moratuwa Engineering Research Conference (MERCon), Moratuwa, Sri Lanka, 27–29 July 2022; pp. 1–6. [Google Scholar]
  71. Hille, L.; Noecker, M.P.; Ko, B.; Kriegler, J.; Keilhofer, J.; Stock, S.; Zaeh, M.F. Integration of laser structuring into the electrode manufacturing process chain for lithium-ion batteries. J. Power Sources 2023, 556, 232478. [Google Scholar] [CrossRef]
  72. Huang, C.; Grant, P.S. Coral-like directional porosity lithium ion battery cathodes by ice templating. J. Mater. Chem. A 2018, 6, 14689–14699. [Google Scholar] [CrossRef]
  73. Huang, Q.-A.; Shen, Y.; Huang, Y.; Zhang, L.; Zhang, J. Impedance Characteristics and Diagnoses of Automotive Lithium-Ion Batteries at 7.5% to 93.0% State of Charge. Electrochim. Acta 2016, 219, 751–765. [Google Scholar] [CrossRef]
  74. Huang, W.; Ye, Y.; Chen, H.; Vilá, R.A.; Xiang, A.; Wang, H.; Liu, F.; Yu, Z.; Xu, J.; Zhang, Z.; et al. Onboard early detection and mitigation of lithium plating in fast-charging batteries. Nat. Commun. 2022, 13, 7091. [Google Scholar] [CrossRef]
  75. Kaiser, J.; Wenzel, V.; Nirschl, H.; Bitsch, B.; Willenbacher, N.; Baunach, M.; Schmitt, M.; Jaiser, S.; Scharfer, P.; Schabel, W. Prozess-und Produktentwicklung von Elektroden für Li-Ionen-Zellen. Chem. Ing. Tech. 2014, 86, 695–706. [Google Scholar] [CrossRef]
  76. Kang, J.; Atwair, M.; Nam, I.; Lee, C.-J. Experimental and numerical investigation on effects of thickness of NCM622 cathode in Li-ion batteries for high energy and power density. Energy 2023, 263, 125801. [Google Scholar] [CrossRef]
  77. Keppeler, M.; Roessler, S.; Braunwarth, W. Production Research as Key Factor for Successful Establishment of Battery Production on the Example of Large-Scale Automotive Cells Containing Nickel-Rich LiNi0.8Mn0.1Co0.1O2 Electrodes. Energy Technol. 2020, 8, 2000183. [Google Scholar] [CrossRef]
  78. Keyser, M.; Pesaran, A.; Li, Q.; Santhanagopalan, S.; Smith, K.; Wood, E.; Ahmed, S.; Bloom, I.; Dufek, E.; Shirk, M.; et al. Enabling fast charging—Battery thermal considerations. J. Power Sources 2017, 367, 228–236. [Google Scholar] [CrossRef]
  79. Kim, H.-J.; Krishna, T.; Zeb, K.; Rajangam, V.; Gopi, C.V.V.M.; Sambasivam, S.; Raghavendra, K.V.G.; Obaidat, I.M. A Comprehensive Review of Li-Ion Battery Materials and Their Recycling Techniques. Electronics 2020, 9, 1161. [Google Scholar] [CrossRef]
  80. Kisu, K.; Aoyagi, S.; Nagatomo, H.; Iwama, E.; Reid, M.T.H.; Naoi, W.; Naoi, K. Internal resistance mapping preparation to optimize electrode thickness and density using symmetric cell for high-performance lithium-ion batteries and capacitors. J. Power Sources 2018, 396, 207–212. [Google Scholar] [CrossRef]
  81. Kovachev, G.; Schröttner, H.; Gstrein, G.; Aiello, L.; Hanzu, I.; Wilkening, H.M.R.; Foitzik, A.; Wellm, M.; Sinz, W.; Ellersdorfer, C. Analytical Dissection of an Automotive Li-Ion Pouch Cell. Batteries 2019, 5, 67. [Google Scholar] [CrossRef]
  82. Krsmanovic and Dejana. Development of a Property Forecast Tool for Flexible Compositions of Li-Ion Batteries, Including Raw Material Availability and Price Forming; Uppsala University: Uppsala, Sweden, 2019. [Google Scholar]
  83. Lee, D.-C.; Lee, K.-J.; Kim, C.-W. Optimization of a Lithium-Ion Battery for Maximization of Energy Density with Design of Experiments and Micro-genetic Algorithm. Int. J. Precis. Eng. Manuf. Technol. 2020, 7, 829–836. [Google Scholar] [CrossRef]
  84. Lei, C.; Aldous, I.; Hartley, J.M.; Thompson, D.L.; Scott, S.; Hanson, R.; Anderson, P.A.; Kendrick, E.; Sommerville, R.; Ryder, K.S.; et al. Lithium ion battery recycling using high-intensity ultrasonication. Green Chem. 2021, 23, 4710–4715. [Google Scholar] [CrossRef]
  85. Li, D.; Lv, Q.; Zhang, C.; Zhou, W.; Guo, H.; Jiang, S.; Li, Z. The Effect of Electrode Thickness on the High-Current Discharge and Long-Term Cycle Performance of a Lithium-Ion Battery. Batteries 2022, 8, 101. [Google Scholar] [CrossRef]
  86. Liu, B.; Duan, X.; Yuan, C.; Wang, L.; Li, J.; Finegan, D.P.; Feng, B.; Xu, J. Quantifying and modeling of stress-driven short-circuits in lithium-ion batteries in electrified vehicles. J. Mater. Chem. A 2021, 9, 7102–7113. [Google Scholar] [CrossRef]
  87. Lu, X.; Daemi, S.R.; Bertei, A.; Kok, M.D.; O’regan, K.B.; Rasha, L.; Park, J.; Hinds, G.; Kendrick, E.; Brett, D.J.; et al. Microstructural Evolution of Battery Electrodes During Calendering. Joule 2020, 4, 2746–2768. [Google Scholar] [CrossRef]
  88. Lu, X.; Zhang, X.; Tan, C.; Heenan, T.M.M.; Lagnoni, M.; O’Regan, K.; Daemi, S.; Bertei, A.; Jones, H.G.; Hinds, G.; et al. Multi-length scale microstructural design of lithium-ion battery electrodes for improved discharge rate performance. Energy Environ. Sci. 2021, 14, 5929–5946. [Google Scholar] [CrossRef]
  89. Lybbert, M.; Ghaemi, Z.; Balaji, A.; Warren, R. Integrating life cycle assessment and electrochemical modeling to study the effects of cell design and operating conditions on the environmental impacts of lithium-ion batteries. Renew. Sustain. Energy Rev. 2021, 144, 111004. [Google Scholar] [CrossRef]
  90. Ma, R.; Deng, Y. The electrochemical model coupled parameterized life cycle assessment for the optimized design of EV battery pack. Int. J. Life Cycle Assess. 2022, 27, 267–280. [Google Scholar] [CrossRef]
  91. Mai, W.; Usseglio-Viretta, F.; Colclasure, A.M.; Smith, K. Enabling fast charging of lithium-ion batteries through secondary-/dual-pore network: Part II—Numerical model. Electrochim. Acta 2020, 341, 136013. [Google Scholar] [CrossRef]
  92. Mei, W.; Chen, H.; Sun, J.; Wang, Q. The effect of electrode design parameters on battery performance and optimization of electrode thickness based on the electrochemical–thermal coupling model. Sustain. Energy Fuels 2019, 3, 148–165. [Google Scholar] [CrossRef]
  93. Meyer, C.; Bockholt, H.; Haselrieder, W.; Kwade, A. Characterization of the calendering process for compaction of electrodes for lithium-ion batteries. J. Mater. Process. Technol. 2017, 249, 172–178. [Google Scholar] [CrossRef]
  94. Myung, S.-T.; Maglia, F.; Park, K.-J.; Yoon, C.S.; Lamp, P.; Kim, S.-J.; Sun, Y.-K. Nickel-Rich Layered Cathode Materials for Automotive Lithium-Ion Batteries: Achievements and Perspectives. ACS Energy Lett. 2017, 2, 196–223. [Google Scholar] [CrossRef]
  95. Parikh, D.; Christensen, T.; Li, J. Correlating the influence of porosity, tortuosity, and mass loading on the energy density of LiNi0.6Mn0.2Co0.2O2 cathodes under extreme fast charging (XFC) conditions. J. Power Sources 2020, 474, 228601. [Google Scholar] [CrossRef]
  96. Rahe, C.; Kelly, S.T.; Rad, M.N.; Sauer, D.U.; Mayer, J.; Figgemeier, E. Nanoscale X-ray imaging of ageing in automotive lithium ion battery cells. J. Power Sources 2019, 433, 126631. [Google Scholar] [CrossRef]
  97. Rieger, B.; Schlueter, S.; Erhard, S.; Schmalz, J.; Reinhart, G.; Jossen, A. Multi-scale investigation of thickness changes in a commercial pouch type lithium-ion battery. J. Energy Storage 2016, 6, 213–221. [Google Scholar] [CrossRef]
  98. Sakti, A.; Michalek, J.J.; Fuchs, E.R.; Whitacre, J.F. A techno-economic analysis and optimization of Li-ion batteries for light-duty passenger vehicle electrification. J. Power Sources 2015, 273, 966–980. [Google Scholar] [CrossRef]
  99. Schneider, S.F.; Bauer, C.; Novák, P.; Berg, E.J. A modeling framework to assess specific energy, costs and environmental impacts of Li-ion and Na-ion batteries. Sustain. Energy Fuels 2019, 3, 3061–3070. [Google Scholar] [CrossRef]
  100. Yu, S.; Kim, S.; Kim, T.Y.; Nam, J.H.; Cho, W.I. Model Prediction and Experiments for the Electrode Design Optimization of LiFePO4/Graphite Electrodes in High Capacity Lithium-ion Batteries. Bull. Korean Chem. Soc. 2013, 34, 79–88. [Google Scholar] [CrossRef]
  101. Sheng, Y.; Fell, C.R.; Son, Y.K.; Metz, B.M.; Jiang, J.; Church, B.C. Effect of Calendering on Electrode Wettability in Lithium-Ion Batteries. Front. Energy Res. 2014, 2, 56. [Google Scholar] [CrossRef]
  102. AL-Shroofy, M.N. Understanding and Improving Manufacturing Processes for Making Lithium-Ion Battery Electrodes; University of Kentucky Libraries: Lexington, KY, USA, 2017. [Google Scholar]
  103. Son, B.; Ryou, M.-H.; Choi, J.; Kim, S.-H.; Ko, J.M.; Lee, Y.M. Effect of cathode/anode area ratio on electrochemical performance of lithium-ion batteries. J. Power Sources 2013, 243, 641–647. [Google Scholar] [CrossRef]
  104. Storch, M.; Fath, J.P.; Sieg, J.; Vrankovic, D.; Krupp, C.; Spier, B.; Riedel, R. Temperature and Lithium Concentration Gradient Caused Inhomogeneous Plating in Large-format Lithium-ion Cells. J. Energy Storage 2021, 41, 102887. [Google Scholar] [CrossRef]
  105. Sturm, J.; Rheinfeld, A.; Zilberman, I.; Spingler, F.; Kosch, S.; Frie, F.; Jossen, A. Modeling and simulation of inhomogeneities in a 18650 nickel-rich, silicon-graphite lithium-ion cell during fast charging. J. Power Sources 2019, 412, 204–223. [Google Scholar] [CrossRef]
  106. Ue, M.; Sakaushi, K.; Uosaki, K. Basic knowledge in battery research bridging the gap between academia and industry. Mater. Horizons 2020, 7, 1937–1954. [Google Scholar] [CrossRef]
  107. Ulvestad, A. A Brief Review of Current Lithium Ion Battery Technology and Potential Solid State Battery Technologies. arXiv 2018, arXiv:1803.04317. [Google Scholar]
  108. Vishnugopi, B.S.; Verma, A.; Mukherjee, P.P. Fast Charging of Lithium-ion Batteries via Electrode Engineering. J. Electrochem. Soc. 2020, 167, 090508. [Google Scholar] [CrossRef]
  109. Waldmann, T.; Scurtu, R.-G.; Richter, K.; Wohlfahrt-Mehrens, M. 18650 vs. 21700 Li-ion cells—A direct comparison of electrochemical, thermal, and geometrical properties. J. Power Sources 2020, 472, 228614. [Google Scholar] [CrossRef]
  110. Wang, F.; Tang, M. A Quantitative Analytical Model for Predicting and Optimizing the Rate Performance of Battery Cells. Cell Rep. Phys. Sci. 2020, 1, 100192. [Google Scholar] [CrossRef]
  111. Wang, H.; Zhang, Y.; Li, W.; Li, C.; Ouyang, M. Particles Released by Abused Prismatic Ni-rich Automotive Lithium-ion Batteries. WSEAS Trans. Syst. Control. 2020, 15, 30–38. [Google Scholar] [CrossRef]
  112. Wentker, M.; Greenwood, M.; Leker, J. A Bottom-Up Approach to Lithium-Ion Battery Cost Modeling with a Focus on Cathode Active Materials. Energies 2019, 12, 504. [Google Scholar] [CrossRef]
  113. Wood, D.L., III; Li, J.; Daniel, C. Prospects for reducing the processing cost of lithium ion batteries. J. Power Sources 2015, 275, 234–242. [Google Scholar] [CrossRef]
  114. Xu, M.; Reichman, B.; Wang, X. Modeling the effect of electrode thickness on the performance of lithium-ion batteries with experimental validation. Energy 2019, 186, 115864. [Google Scholar] [CrossRef]
  115. Yole Market Studies. Lithium Ion Battery Market & Technology Trends 2020: Market and Technology Report 2020; Yole Market Studies: Villeurbanne, France, 2020. [Google Scholar]
  116. Zhang, X.; He, J.; Zhou, J.; Chen, H.; Song, W.; Fang, D. Thickness evolution of commercial Li-ion pouch cells with silicon-based composite anodes and NCA cathodes. Sci. China Technol. Sci. 2021, 64, 83–90. [Google Scholar] [CrossRef]
  117. Zhang, Y.; Wang, H.; Li, W.; Li, C.; Ouyang, M. Size distribution and elemental composition of vent particles from abused prismatic Ni-rich automotive lithium-ion batteries. J. Energy Storage 2019, 26, 100991. [Google Scholar] [CrossRef]
  118. Zhao, Y.; Diaz, L.B.; Patel, Y.; Zhang, T.; Offer, G.J. How to Cool Lithium Ion Batteries: Optimising Cell Design using a Thermally Coupled Model. J. Electrochem. Soc. 2019, 166, A2849–A2859. [Google Scholar] [CrossRef]
  119. Zheng, H.; Li, J.; Song, X.; Liu, G.; Battaglia, V.S. A comprehensive understanding of electrode thickness effects on the electrochemical performances of Li-ion battery cathodes. Electrochim. Acta 2012, 71, 258–265. [Google Scholar] [CrossRef]
  120. Zheng, H.; Tan, L.; Liu, G.; Song, X.; Battaglia, V.S. Calendering effects on the physical and electrochemical properties of Li[Ni1/3Mn1/3Co1/3]O2 cathode. J. Power Sources 2012, 208, 52–57. [Google Scholar] [CrossRef]
  121. Zhu, P.; Slater, P.R.; Kendrick, E. Insights into architecture, design and manufacture of electrodes for lithium-ion batteries. Mater. Des. 2022, 223, 111208. [Google Scholar] [CrossRef]
  122. Thiel, C.; Schmidt, J.; Van Zyl, A.; Schmid, E. Cost and well-to-wheel implications of the vehicle fleet CO2 emission regulation in the European Union. Transp. Res. Part A Policy Pract. 2014, 63, 25–42. [Google Scholar] [CrossRef]
  123. Löbberding, H.; Wessel, S.; Offermanns, C.; Kehrer, M.; Rother, J.; Heimes, H.; Kampker, A. From Cell to Battery System in BEVs: Analysis of System Packing Efficiency and Cell Types. World Electr. Veh. J. 2020, 11, 77. [Google Scholar] [CrossRef]
  124. IEA. Electric Vehicles Initiative, and Clean Energy Minisatrial. In Global Supply Chains of EV Batteries; IEA: Paris, France, 2021; Available online: https://iea.blob.core.windows.net/assets/4eb8c252-76b1-4710-8f5e-867e751c8dda/GlobalSupplyChainsofEVBatteries.pdf (accessed on 10 December 2022).
  125. Schröder, R.; Glodde, A.; Aydemir, M.; Bach, G. Process to Increase the Output of Z-Folded Separators for the Manufacturing of Lithium-Ion Batteries. Appl. Mech. Mater. 2015, 794, 19–26. [Google Scholar] [CrossRef]
  126. Fink, H.; Fetzer, J.; Hore, S. Method for Producing an Electrode Stack for a Battery Cell and Battery Cell. U.S. Patent US10651508B2, 12 May 2020. [Google Scholar]
  127. Joong, K.C.; Bum, K.S.; Noh, L.S.; Chan, P.H. Method for stacking cells inside secondary battery and cell stack manufactured using same. Patent WO 2014/042424 A 1, 20 March 2014. [Google Scholar]
  128. Chang, T.-Y.; Chang, C.-C.; Kuo, H.C. High durability lithium-ion cells. U.S. Patent US8163421B2, 24 April 2012. [Google Scholar]
  129. Ueno, Y.; Mizuno, T.; Yamamoto, K.; Ohira, J.; Inoue, K.; Fujita, H.; Sano, H. Lithium-ion secondary battery and manufacturing method thereof. U.S. Patent US10424816B2, 24 September 2019. [Google Scholar]
  130. Kim, J.K.; Saito, A.; Kim, Y.K. Jelly-roll type electrode assembly, lithium secondary battery having the same, and method for manufacturing the same. U.S. Patent US7442465B2, 28 October 2008. [Google Scholar]
  131. Tran, H.Y.; Täubert, C.; Fleischhammer, M.; Axmann, P.; Küppers, L.; Wohlfahrt-Mehrens, M. LiMn2O4 Spinel/LiNi0.8Co0.15Al0.05O2 Blends as Cathode Materials for Lithium-Ion Batteries. J. Electrochem. Soc. 2011, 158, A556–A561. [Google Scholar] [CrossRef]
  132. Wang, J.; Yu, Y.; Li, B.; Zhang, P.; Huang, J.; Wang, F.; Zhao, S.; Gan, C.; Zhao, J. Thermal Synergy Effect between LiNi0.5Co0.2Mn0.3O2 and LiMn2O4 Enhances the Safety of Blended Cathode for Lithium Ion Batteries. ACS Appl. Mater. Interfaces 2016, 8, 20147–20156. [Google Scholar] [CrossRef]
  133. Wang, X.; Ding, Y.; Deng, Y.; Chen, Z. Ni-Rich/Co-Poor Layered Cathode for Automotive Li-Ion Batteries: Promises and Challenges. Adv. Energy Mater. 2020, 10, 1903864. [Google Scholar] [CrossRef]
  134. Andre, D.; Kim, S.-J.; Lamp, P.; Lux, S.F.; Maglia, F.; Paschos, O.; Stiaszny, B. Future generations of cathode materials: An automotive industry perspective. J. Mater. Chem. A 2015, 3, 6709–6732. [Google Scholar] [CrossRef]
  135. Zuo, X.; Zhu, J.; Müller-Buschbaum, P.; Cheng, Y.-J. Silicon based lithium-ion battery anodes: A chronicle perspective review. Nano Energy 2017, 31, 113–143. [Google Scholar] [CrossRef]
  136. Su, X.; Wu, Q.; Li, J.; Xiao, X.; Lott, A.; Lu, W.; Sheldon, B.W.; Wu, J. Silicon-Based Nanomaterials for Lithium-Ion Batteries: A Review. Adv. Energy Mater. 2014, 4, 1300882. [Google Scholar] [CrossRef]
  137. Herberz, M.; Hahnel, U.J.J.; Brosch, T. Counteracting electric vehicle range concern with a scalable behavioural intervention. Nat. Energy 2022, 7, 503–510. [Google Scholar] [CrossRef]
  138. Wu, F.; Maier, J.; Yu, Y. Guidelines and trends for next-generation rechargeable lithium and lithium-ion batteries. Chem. Soc. Rev. 2020, 49, 1569–1614. [Google Scholar] [CrossRef]
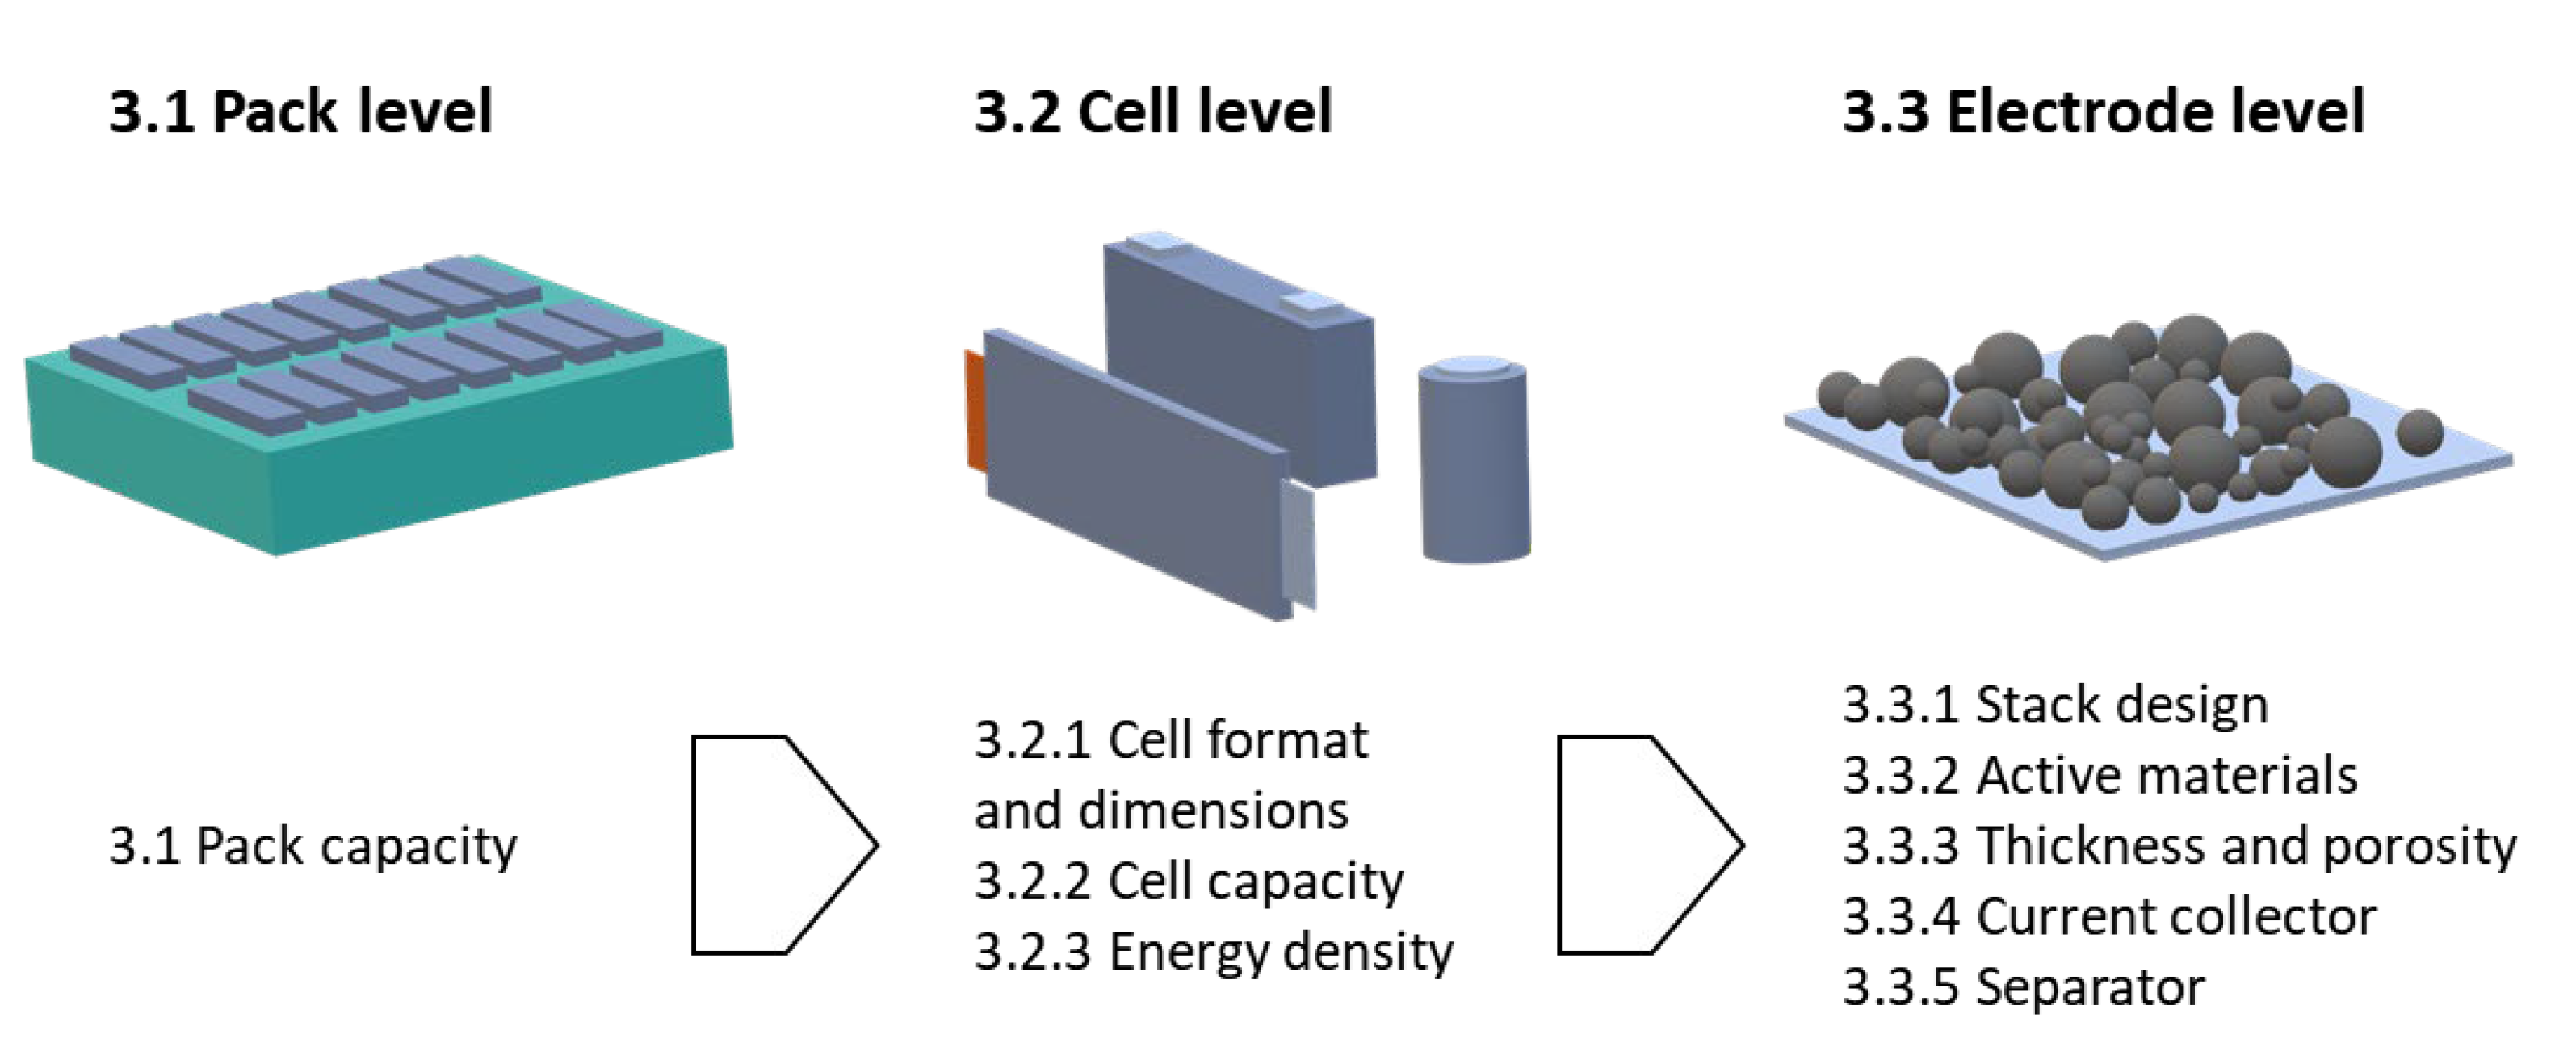
Figure 1. Structure of the data analysis from pack level to electrode level and reference to the respective subsections. Own illustration.
Batteries 09 00261 g001
Figure 2. Development of global vehicle-sales-weighted net battery pack capacities in kWh. Mean values ± 1 standard deviation. AB-segment (mini and small), CM segment (compact and multi-purpose), DEF segment (upper class), smaller SUVs (ABC segment), larger SUVs (DE segment), and total vehicles.
Batteries 09 00261 g002
Figure 3. Global MWh-weighted market share for pouch (dark green), prismatic (light green), and cylindrical cells (blue). Gray represents cells where the format cannot be assigned unambiguously.
Batteries 09 00261 g003
Figure 4. Evolution of geometrical cell format parameters (MWh-weighted) between 2010 and 2021. Mean values ± one standard deviation. Span (minimum and maximum value) in gray; (a) Prismatic-longest side; (b) Pouch-longest side; (c) Cylindrical-cell height; (d) Prismatic-shortest side; (e) Pouch-shortest side; (f) Cylindrical-diameter; (g) Prismatic-cell volume; (h) Pouch-cell volume; (i) Cylindrical-cell volume. A differentiation between LFP and NMC/NCA cells is provided for prismatic cells.
Batteries 09 00261 g004
Figure 5. Evolution of cell capacity in Ah between 2010 and 2021. Weighted by MWh and differentiated by cell format. Mean values ± one standard deviation. Span (minimum and maximum value) in gray; (a) Prismatic cells; (b) Pouch cells; (c) Cylindrical cells. A differentiation between LFP and NMC/NCA cells is provided for prismatic cells.
Batteries 09 00261 g005
Figure 6. Evolution of specific energy (in Wh/kg) and energy density (in Wh/L) between 2010 and 2021. Weighted by MWh and differentiated by cell format. Mean values ± one standard deviation. Span (minimum and maximum value) in gray; (a) Prismatic-specific energy; (b) Pouch-specific energy; (c) Cylindrical-specific energy; (d) Prismatic-energy density; (e) Pouch-energy density; (f) Cylindrical-energy density. A differentiation between LFP and NMC/NCA cells is provided for prismatic cells.
Batteries 09 00261 g006aBatteries 09 00261 g006b
Figure 7. Evolution of global market shares in % for different chemistries between 2010 and 2021. Weighted by MWh; (a) Cathode; (b) Anode.
Batteries 09 00261 g007
Figure 8. Temporal analysis of (a) the total cathode thickness (double-sided coating including current collector) in µm; (b) the cathode coating porosity in percentage; (c) the total anode thickness (double-sided coating including current collector) in µm; (d) the anode coating porosity in percentage. The boxplots show statistical parameters (lower quartile, median, upper quartile, whiskers with 1.5 interquartile range), individual data points differentiated by color for different formats, the mean value including error bar (±1 standard deviation), and the number of records.
Batteries 09 00261 g008aBatteries 09 00261 g008b
Figure 9. Temporal analysis of the current collector foil thickness in µm; (a) Aluminum foil, cathode side; (b) Copper foil, anode side. The boxplots show statistical parameters (lower quartile, median, upper quartile, whiskers with 1.5 interquartile range), individual data points differentiated by color for different formats, the mean value including error bar (±1 standard deviation), and the number of records.
Batteries 09 00261 g009
Figure 10. Temporal analysis of the total separator thickness (incl. coating) in µm. The boxplots illustrate statistical parameters (lower quartile, median, upper quartile, whiskers with 1.5 interquartile range), individual data points differentiated by color for different formats, the mean value including error bar (±1 standard deviation), and the number of records.
Batteries 09 00261 g010
Disclaimer/Publisher’s Note: The statements, opinions and data contained in all publications are solely those of the individual author(s) and contributor(s) and not of MDPI and/or the editor(s). MDPI and/or the editor(s) disclaim responsibility for any injury to people or property resulting from any ideas, methods, instructions or products referred to in the content.