Article

Effect of Water-Soluble CMC/SBR Binder Ratios on Si-rGO Composites Using µm- and nm-Sized Silicon as Anode Materials for Lithium-Ion Batteries

1
Chair of Electrochemical Process Engineering, University of Bayreuth, D-95447 Bayreuth, Germany
2
Bavarian Center for Battery Technology (BayBatt), University of Bayreuth, D-95447 Bayreuth, Germany
3
Department of Functional Materials, University of Bayreuth, D-95447 Bayreuth, Germany
*
Author to whom correspondence should be addressed.
These authors contributed equally to this work.
Batteries 2023, 9(5), 248; https://doi.org/10.3390/batteries9050248
Submission received: 24 March 2023 / Revised: 21 April 2023 / Accepted: 25 April 2023 / Published: 26 April 2023
(This article belongs to the Collection Advances in Battery Materials)

Abstract

:
Silicon-containing materials are still the most promising alternatives to graphite as the negative electrodes of lithium-ion batteries. However, the different Li+ storage mechanism combined with the high capacity result in new requirements for the passive electrode components, such as the binder. To ensure sufficient cycling stability, silicon must be embedded in a suitable carbonaceous matrix. For this purpose, we used a simple ball milling process with reduced graphene oxide (rGO) to produce Si-rGO composites with µm- and nm-sized silicon particles. The rGO was synthesized previously from a two-step thermal synthesis method developed in-house. Subsequently, electrodes with varying CMC/SBR ratios (3:1, 1:1, and 1:3) were prepared from the composites containing the different Si particle sizes. It was found that the optimal binder ratio depends on the size of the Si particles. For the nm-Si-rGO composite, a CMC/SBR ratio of 3:1 results in a total capacity over 51 cycles of 20.6 Ah g−1, which means an improvement of 20% compared to CMC/SBR = 1:3 (17.1 Ah g−1). In contrast, we demonstrate that for µm-Si-rGO composites with an optimal CMC/SBR ratio of 1:1 (13.0 Ah g−1), compared to nm-Si-rGO, a higher SBR content is beneficial for the cycling behavior. Moreover, a comparison with graphite from the literature indicates that a rGO-matrix reduces the need for SBR.

1. Introduction

Silicon is still considered the most promising material for the next generation of negative electrodes in lithium-ion batteries (LiB). The high theoretical specific energy density of silicon (Li15Si4, 3579 mAh g−1 [1]) could help in making the lithium-ion technology more attractive for new or large-scale applications, such as electric vehicles [2,3]. An increase in capacity could, for instance, facilitate the replacement of combustion engines in the transport sector.
However, some challenges are known to occur when using silicon as the anode material in LiBs. The high lithium-ion storage capacity results in a massive volume expansion of up to 300% during lithiation [4,5]. Using µm-sized silicon particles can lead to pulverization of the primary particles, followed by a delamination of the anode material from the current collector [6]. By using nanoscale primary particles, pulverization can be suppressed; however, this significantly increases the surface-to-volume ratio [4,7]. As a result of the high volume change, the solid–electrolyte interface (SEI) passivation layer is fractured with each lithiation and delithiation step, and new, fresh surfaces can be exposed, resulting in steady growth of the SEI during cycling [5].
In the literature, there are many concepts reported to mitigate the degradation of Si particles during cycling. The underlying principle of most strategies is to prevent free silicon–electrolyte interfaces. One possibility to achieve this is the encapsulation of Si particles in a carbon matrix, which should hinder the continuous expansion of the SEI as well as delamination effects [8,9,10].
Nevertheless, a clear differentiation between the degradation mechanisms is not possible yet, but it can be assumed that different particle sizes result in different requirements for the other components of the battery, such as the electrolyte or the binder. Unlike conventional graphite electrodes, polymeric binders have been shown to play an important role in mitigating the various degradation paths for silicon anodes [11]. While the initial focus of binder research was primarily on only preserving the electrode’s morphology, it has been shown that polymeric binders can help in stabilizing fractured silicon particles along with the SEI, significantly affecting the electrochemical performance [5].
The fundamental role of a binder is the cohesion of the single electrode components as well as their adhesion to the current collector. Especially at high mechanical stress rates, caused by high volume expansion, the binder plays a crucial role for the mechanical stability and for the long-term cycling performance [5,11]. In addition, to enable a sustainable and cost-effective manufacturing route, modern binder systems should be water-based [12,13]. Besides the next-generation Si anodes used for classical Li-ion batteries, the development of novel and environmentally friendly binders is also important for other battery types, such as a cross-linked phosphorylate binder for lithium–sulfur batteries [14].
For high-capacity silicon anodes, Hu et al. recently reported a water-based dual binder network that combines static chemical bonding with dynamic physical crosslinking, which enables a deformable network that is able to maintain the electrode structure [15]. Another possible and common water-based (dual) binder system for electrodes is carboxymethyl cellulose (CMC) [16,17], or a mixture of CMC and styrene–butadiene rubber (SBR) [5,12,18,19]. CMC on its own is an extremely stiff and brittle polymer [20], but the carboxylic acid groups can react with the -OH surface groups of silicon to form a strong chemical bond, helping to maintain the structure of the electrode during cycling [21,22]. Adding SBR increases the adhesion and enhances the flexibility of the electrode [23,24].
Next to the higher environmental friendliness and cost-efficiency, it has been shown that CMC/SBR mixtures lead to increased cycling stability of Si-containing anodes compared to conventional polyvinylidene difluoride (PVdF) binder systems [25,26]. By varying the ratio of the two components, the properties of the binder system in terms of cohesion, adhesion, porosity, and conductivity can be adjusted.
Fang et al. recently published an optimum CMC/SBR ratio (4:6 wt.%) for a Si/C composite using Si microparticles [27]. However, it can be assumed that this optimum is dependent on the particle size as well as on the carbon matrix that is used.
In this work, we show the influence of different CMC/SBR ratios on the performance of Si/rGO composites as future anode materials in LIBs with respect to two different silicon particle sizes, µm- and nm-sized silicon. As the carbon matrix we use reduced graphene oxide (rGO) from an in-house-developed two-step synthesis method.

2. Materials and Methods

2.1. Synthesis of prGO and rGO

The synthesis of reduced graphene oxide (rGO) was carried out using a two-step procedure. First, 2.5 g of graphite oxide (GO) (EXG R98 300, Graphit Kropfmühl, Hauzenberg, Germany) was added to a four-neck flask and rapidly heated to about 350 °C in an argon atmosphere (Ar, 99.999%, Rießner-Gase, Lichtenfels, Germany) using a heating mantle (PILZ, Heraeus, Hanau, Germany). The temperature was maintained for 15 min. After exfoliation, the material was cooled down to room temperature. The obtained material was subsequently denoted as partly reduced graphene oxide (prGO). In a second step, this material was further reduced in a tube furnace (Carbolite, Neuhausen, Germany) at 700 °C in Ar for 2 h (heating rate: 10 °C min−1) with subsequent cooling of the rGO to room temperature. In this work, one batch of synthesized rGO was used for all electrodes investigated. Therefore, a constant elemental composition (e.g., C/O ratio) can be assumed for all electrodes shown.

2.2. Synthesis of Si-rGO Composite Material and Milled rGO

Si-rGO composites were synthesized via a ball milling process. The starting materials were silicon particles in two different sized fractions (µm-Si: d50 = 4.55 µm, Wacker, Munich, Germany; nm-Si: d50 = 0.74 µm, Alfa Aesar, Haverhill, MA, USA) mixed with rGO at a ratio of 20 wt.% to 80 wt.% in an agitator bead mill (Simoloyer® CM01, Zoz, Wenden, Germany). Grinding with polyether ether ketone (PEEK) grinding balls (≈1500 balls, mballs ≈ 125 g, PEEK-450G, d = 5 mm, KGM Kugelfabrik, Fulda, Germany) in a PEEK grinding container was performed for 60 min at a rotor speed of 1500 rpm. The composites obtained were subsequently sieved into a fraction smaller than 45 µm by vibration sieving (AS 200 digit cA, Retsch, Haan, Germany) for 30 min. For a more detailed investigation of the influence of the grinding process on the properties, rGO was milled without the addition of silicon under the same conditions as well. This unsieved milled rGO fraction is referred to as rGO_milled. A fraction of this material was sieved in a subsequent step and is labelled rGO_milled_45µm. Both materials were used for referencing purposes to exclude the effects of both steps as potential artifacts.

2.3. Composite Electrode Preparation

The composite electrodes were prepared by mixing the active material (µm-Si-rGO or nm-Si-rGO), acetylene carbon black (CABOT, Apharetta, GA, USA), and binder at a mass ratio of 85:10:5. The binder fraction contained the binders Na-CMC (degree of substitution = 0.7, Mw~90.000, Sigma-Aldrich, St. Louis, MO, USA) and SBR (BM-400B, Zeon Corporation, Tokio, Japan). The binders were varied in the range of 1.25 wt.% to 3.75 wt.% and processed with an adjusted amount of water to form a binder paste. This paste was rested for one hour and then homogenized with a centrifugal mixer (ARE-250, Thinky Corporation, Laguna Hills, CA, USA) for 10 min at 1600 rpm. Subsequently, the active material and the conductive additive were added, followed by homogenization under the same conditions.
A doctor’s blade coating process (Coatmaster 509 MC, Erichsen, Hemer, Germany) was used to apply the paste on the copper current collector. The speed of the doctor’s blade (ZUA 2000, Zehntner, Sissach, Switzerland) was 5 mm s−1, while the wet film thickness was 250 µm. The electrode sheet was dried at room temperature for at least 24 h. Electrode coins (12 mm) were then punched (EL-Cut, EL-CELL, Hamburg, Germany) from the electrode foil and dried for 16 h at 110 °C in argon atmosphere in a tube furnace before assembly in the glovebox.

2.4. Cell Fabrication

The electrochemical studies were performed in a coin-cell-type half-cell setup (Swagelok cell), which was assembled in a glovebox (P-Box, Jacomex, Dagneux, France) with an argon atmosphere. The electrodes described in Section 2.3, a lithium foil (750 μm, Alfa Aesar, Haverhill, MA, USA) as a counter-electrode, and a Whatman GF/C glass microfiber filter (125 μm, Sigma Aldrich, St. Louis, MO, USA) as separator were used for this setup. A spring was additionally integrated into the cell structure to generate a constant pressure. To prevent damage on the lithium electrode, a nickel plate (99.2%, 500 µm, HMW Hauner, Röttenbach, Germany) was placed between the lithium electrode and the spring. Next, 150 µL of a 1 M LiPF6 solution dissolved in ethylene carbonate (EC) and dimethyl carbonate (DMC) at a 1:1 volume ratio served as the electrolyte (SelectityleTM LP 30, BASF, Ludwigshafen, Germany). We intentionally avoided known additives for Si anodes, such as fluoroethylene carbonate, to more clearly see the influence of the different binder compositions.

2.5. Electrochemical Testing

The electrochemical investigations of the cells were carried out using a BaSyTec CTS (Asselfingen, Germany) Lab battery tester. After a 24 h rest period after cell assembly, lithiation was performed in the first cycle at a constant current of 0.1 C to 0.01 V (termination criteria: U < 0.01 V for t > 1 s). In the first cycle, a constant voltage step was added for 10 h (at 0.01 V) to ensure complete lithiation. Subsequently, the first cycle was finished by delithiation at the same C- rate to 1.5 V (termination criteria: U > 1.5 V for t > 1 s) followed by a 30 min rest period. Afterwards, a galvanostatic cycling process was performed over 50 cycles (1.5 V < U < 0.01 V for t > 1 s at 0.1 C). Next, a rest period of 5 min was applied. Finally, a C-rate variation process of 0.2 C, 0.5 C, 1 C, and again 0.1 C was performed for 5 cycles each; the same termination criteria and resting times between the different C-rates were used. The C-rates were calculated based on the theoretical capacity levels of the composite electrodes with their respective proportions of the active components silicon (20 wt.%) and rGO (80 wt.%). For rGO and silicon, the theoretical capacity levels used were 372 mAh g−1 (LiC6 [28]) and 3579 mAh g−1 (Li15Si4 [1]), respectively. We measured each cell type three times and calculated a mean value with the standard deviation. The measured capacity levels refer to the active material (AM), where AM is the mass of the composites, i.e., Si and rGO. The areal mass loading rates of the electrodes are kept constant at 7.4 ± 0.4 mgAM cm−2 and 1.5 ± 0.1 mgSi cm−2, respectively, resulting in a theoretical areal capacity of 7.5 ± 0.4 mAh cm−2 for all Si-containing electrodes.

2.6. Analytics

A scanning electron microscope (SEM, Ultra plus, Zeiss, Jena, Germany) was used to determine the surface properties of the raw materials, the composites, and the electrodes. To identify the element distribution of the silicon particles in the rGO matrix, energy-dispersive X-ray analyses (EDX, NS7, Thermo Fisher Scientific, Waltham, MA, USA) were carried out on selected samples. Furthermore, the materials were characterized using an X-ray diffractometer (XRD, X’Pert MPD type: PW 3040/00, Philips PANalytical, Almelo, Netherlands); measurements were performed at room temperature in the range of 2θ = 10°–90° and the step size was 0.02° at a scanning speed of 10 s. The evaluations were performed using the X’Pert HighScore Plus software (PANalytical, Almelo, Netherlands). A CHNS elemental analysis (EA 3000, HEKAtech, Wegberg, Germany) was used to determine the degree of reduction of prGO and rGO. In addition, the particle sizes of the raw materials and the composites were determined using dynamic light scattering (Mastersizer 2000, Malvern Panalytical, Malvern, UK). The specific surface area of the materials used was determined using the nitrogen adsorption–desorption technique (ASAP 2010, Micromeritics, Unterschleißheim, Germany) based on the theory of Brunauer, Emmet, and Teller (BET). The silicon content of the Si-rGO composites after processing in the ball mill was determined using inductively coupled plasma optical emission spectroscopy (5800 ICP-OES, Agilent, Santa Clara, CA, USA). To determine the electrical conductivity rates under compression, the respective bulk powders as well as the prepared electrodes were placed under loading in a universal pressure testing machine (Series 5569, Instron, Noorwood, MA, USA). Conductivity measurements were performed using galvanostatic impedance spectroscopy (Reference 600, Gamry Instruments, Warminster, PA, USA) from 1000 to 10 Hz with an AC current of 0.05 mA. Each sample was measured three times at 0.1, 0.5, and 1 MPa. In addition, to be able to exclude the impact of the heterogeneous coating quality, three coins were measured for each electrode composition.

3. Results and Discussion

3.1. Characterization of GO, prGO, and rGO

Figure 1 illustrates SEM images of graphite oxide (GO), partially reduced graphene oxide (prGO), and reduced graphene oxide (rGO), as well as the results for the CHNS analysis, XRD analysis, and electrical conductivity of the bulk powders.
The SEM images reveal that GO underwent significant changes to its surface morphology due to thermal reduction. The pore-free structure of GO shown in Figure 1a can no longer be observed after the first reduction step at about 350 °C. As a result of the exfoliation of the graphene layers, honeycomb-shaped pores are clearly visible in prGO (Figure 1b). In good accordance with the SEM images, the BET analysis from Table 1 shows that the surface area increases significantly from 37 m2 g−1 to 474 m2 g−1 after exfoliation from GO to prGO, while there is no considerable change in particle size distribution (Table 1). A further thermal treatment of the prGO material at 700 °C leads to a continued reduction and a reduced size of the honeycomb pores of rGO (Figure 1c). This decrease in pore size is confirmed by the increase in BET surface area to 512 m2 g−1 (Table 1). Further evidence of the increasing thermal reduction from GO to prGO to rGO can be seen from the results of the CHNS analysis in Figure 1d. Thus, the carbon content continuously increases with progressive reduction from 59 wt.% (GO) via 83 wt.% (prGO) to 89 wt.% (rGO), whereas the oxygen content steadily decreases from 39 wt.% (GO) via 17 wt.% (prGO) to 10 wt.% (rGO) due to the increased release of H2O, CO2, and small amounts of CO [8,29]. In correlation with the increasing carbon content, the electrical conductivity from GO via prGO to rGO also increases steadily, as shown in Figure 1e. It should be noted that a measurement of the electrical conductivity of GO was not possible due to its low conductivity. Regardless of the applied pressure during the measurement, the electrical conductivity of rGO is consistently higher than prGO. The reason for this is the stronger re-graphitization and the further formation of the sp2 hybridized π-electron system [30,31]. The enhancement of the electrical conductivity with increasing pressure is due to the improved contact of the particles within the bulk, so that the highest electrical conductivity rate is obtained at 1 MPa for prGO with 41 S m−1 and for rGO with 58 S m−1. Lastly, the XRD analysis from Figure 1f confirms the thermal reduction of GO to rGO by shifting the 2θ reflection at 11.59° from GO to 24.69° for prGO to 25.97° for rGO, indicating a more pronounced reduction of GO [32,33]. As a result of the removal of oxygen functionalities, the lattice spacing could be significantly reduced [30,32]. In addition, the shifted reflex becomes sharper with further thermal treatment, confirming the re-formation of a well-ordered graphitic structure. The detected reflection for rGO is in good agreement with ICCD reference pattern file 04-016-0554 at 26.19° for graphite.

3.2. Characterization of the Si-rGO Composite Material

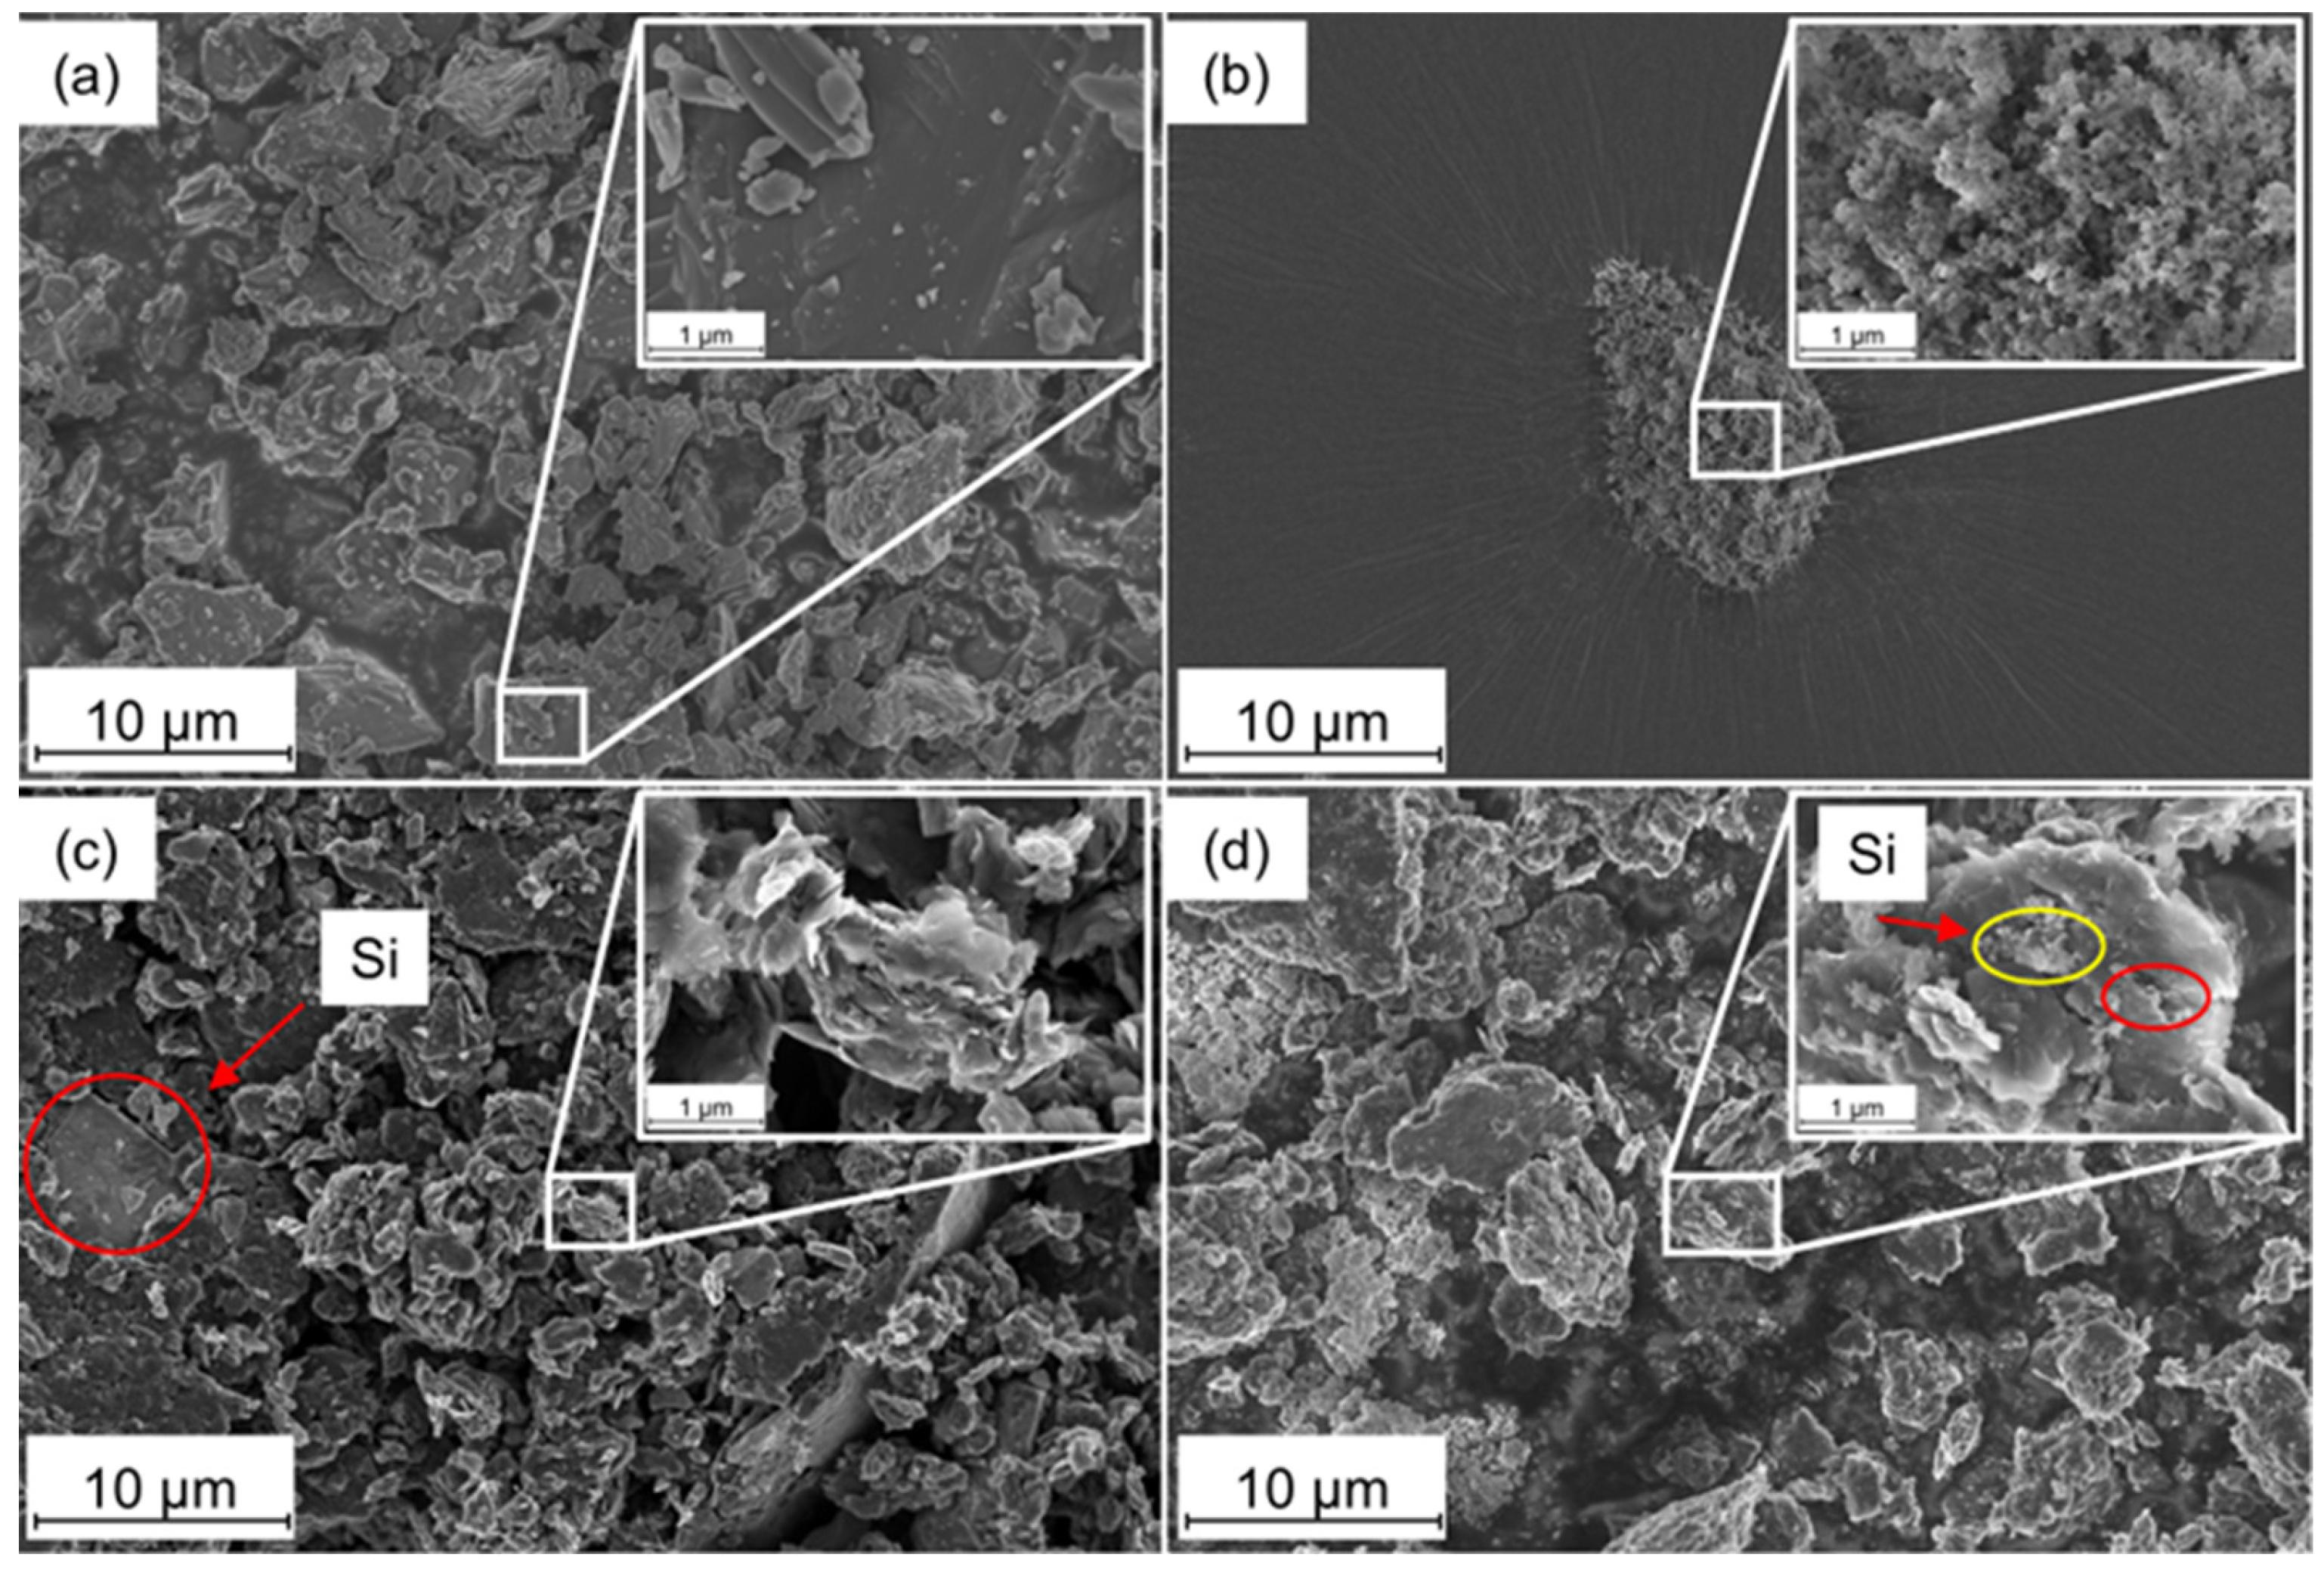
In Figure 2, the SEM images of the silicon raw materials µm-Si and nm-Si as well as the composites µm-Si-rGO and nm-Si-rGO received after the ball milling process are shown.
The µm-Si particles show a sharp-edged morphology without notable agglomeration (Figure 2a). The particle size determined by dynamic light scattering is d50 = 4.6 µm (Table 1), which agrees with the SEM image. In contrast, the nm-Si particles of Figure 2b show a strong tendency to agglomeration, which explains their relatively large particle size of d50 = 0.7 µm (Table 1). However, as can be seen from the magnified image (in Figure 2b), the particle size of the spherical primary particles is approximately 100 nm. Despite the agglomeration, the smaller particle size and higher surface-to-volume ratio lead to an increased BET surface area of the nm-Si particles of 48 m2 g−1 compared to the BET surface area of 3 m2 g−1 for the µm-Si particles (Table 1).
As shown in Figure 2c, the µm-Si particles are well integrated into the rGO after the mechanical synthesis process, although they are not completely wrapped by the rGO due to their large particle size, and some silicon is still accessible on its upper surface (marked in red). Furthermore, the zoomed image shows that the honeycomb pore structure of the rGO is no longer present after ball milling. This is also confirmed by the reduced BET surface area of 129 m2 g−1 for the composite compared to 176 m2 g−1 for the Si-free material rGO_milled (Table 1). Figure 2d demonstrates the absence of any agglomerates of nm-Si particles seen in Figure 2b, while the silicon particles are homogeneously incorporated into the rGO matrix. The magnified image (Figure 2d) indicates that some silicon particles are successfully placed inside the honeycomb pores of the rGO (Figure 1c) and are subsequently encapsulated by the mechanical process as expected (marked in red). However, nm-Si particles, which are merely superficially deposited on the rGO surface, are still present (marked in yellow). To show this partial encapsulation more clearly, we have added the enlarged figure from Figure 2d in higher magnification in the Supplementary Information (Figure S1). The Si contents of the Si-rGO composites are 17 wt.% for the µm-Si-rGO and 15 wt.% for the nm-Si-rGO (Table 1). To exclude the possibility that the reduced measured BET surface area of the composites was an artifact exclusively due to the incorporation of silicon, the rGO was milled without the addition of silicon as a reference. Since the BET surface area of rGO_milled_45µm is 161 m2 g−1 (Table 1), this indicates that the reduced surface area of the composites compared to the starting material rGO is mainly attributed to the mechanical preparation resulting in the sealing of the honeycomb pores.
In conclusion, Figure 2 shows that mechanical preparation of Si-rGO composites by ball milling, in particular with nm-Si particles and rGO, is possible, and the concept of encapsulating the silicon particles in an rGO matrix was successful. This is also confirmed by the XRD analysis of the starting materials and the synthesized composites shown in Figure 3.
As shown in Figure 3a, no relevant difference in the crystalline structure of the used µm- and nm-silicon particles can be observed, and the detected reflections are in good agreement with the ICCD reference pattern file 01-070-5680 for crystalline silicon. These reflections can also be seen in Figure 3b for both the µm-Si-rGO and the nm-Si-rGO composite. Moreover, the well-ordered graphitic structure of the rGO can also be observed for the composites, which confirms the formation of a composite of rGO and silicon particles without the destruction of the rGO structure during the mechanical preparation.
The electrical conductivity rates of the composites used as bulk powders are shown in Figure 4. The rGO prepared by ball milling without adding silicon is herein used as a benchmark.
First, similar to the electrical conductivity rates from Figure 1e, the conductivity rates of all samples increase with compression of the bulk powder samples due to the enhanced contact between the particles, resulting in the highest electrical conductivity rates for all samples at 1 MPa. In particular, rGO_milled_45µm shows the highest electrical conductivity rate of 62 S m−1. The Si-rGO composites demonstrate lower electrical conductivity rates of 43 S m−1 for the µm-Si-rGO and 38 S m−1 for the nm-Si-rGO. It is suggested that the lower conductivity rate of the composites compared to rGO is due to the low electrical conductivity of silicon (≈0.1 S m−1 [34]). The combination of the well-dispersed silicon and the higher BET surface area of the nm-Si particles compared to the µm-Si particles (see Table 1) results in slightly lower electrical conductivity for the nm-Si-rGO composite compared to the µm-Si-rGO composite. It can be expected that the electrical conductivity is mainly dominated by the conducting paths between rGO particles, which are affected more by the homogeneous dispersion of the silicon particles in the nm-Si-rGO as in the µm-Si-rGO. The results of the electrical conductivity tests confirm the observation from the SEM images (Figure 2) and the XRD analysis (Figure 3), demonstrating that the encapsulation of the silicon particles in the rGO matrix was successful.

3.3. Characterization of Si-rGO Composite Electrodes with Variations in CMC-/SBR-Binder Content

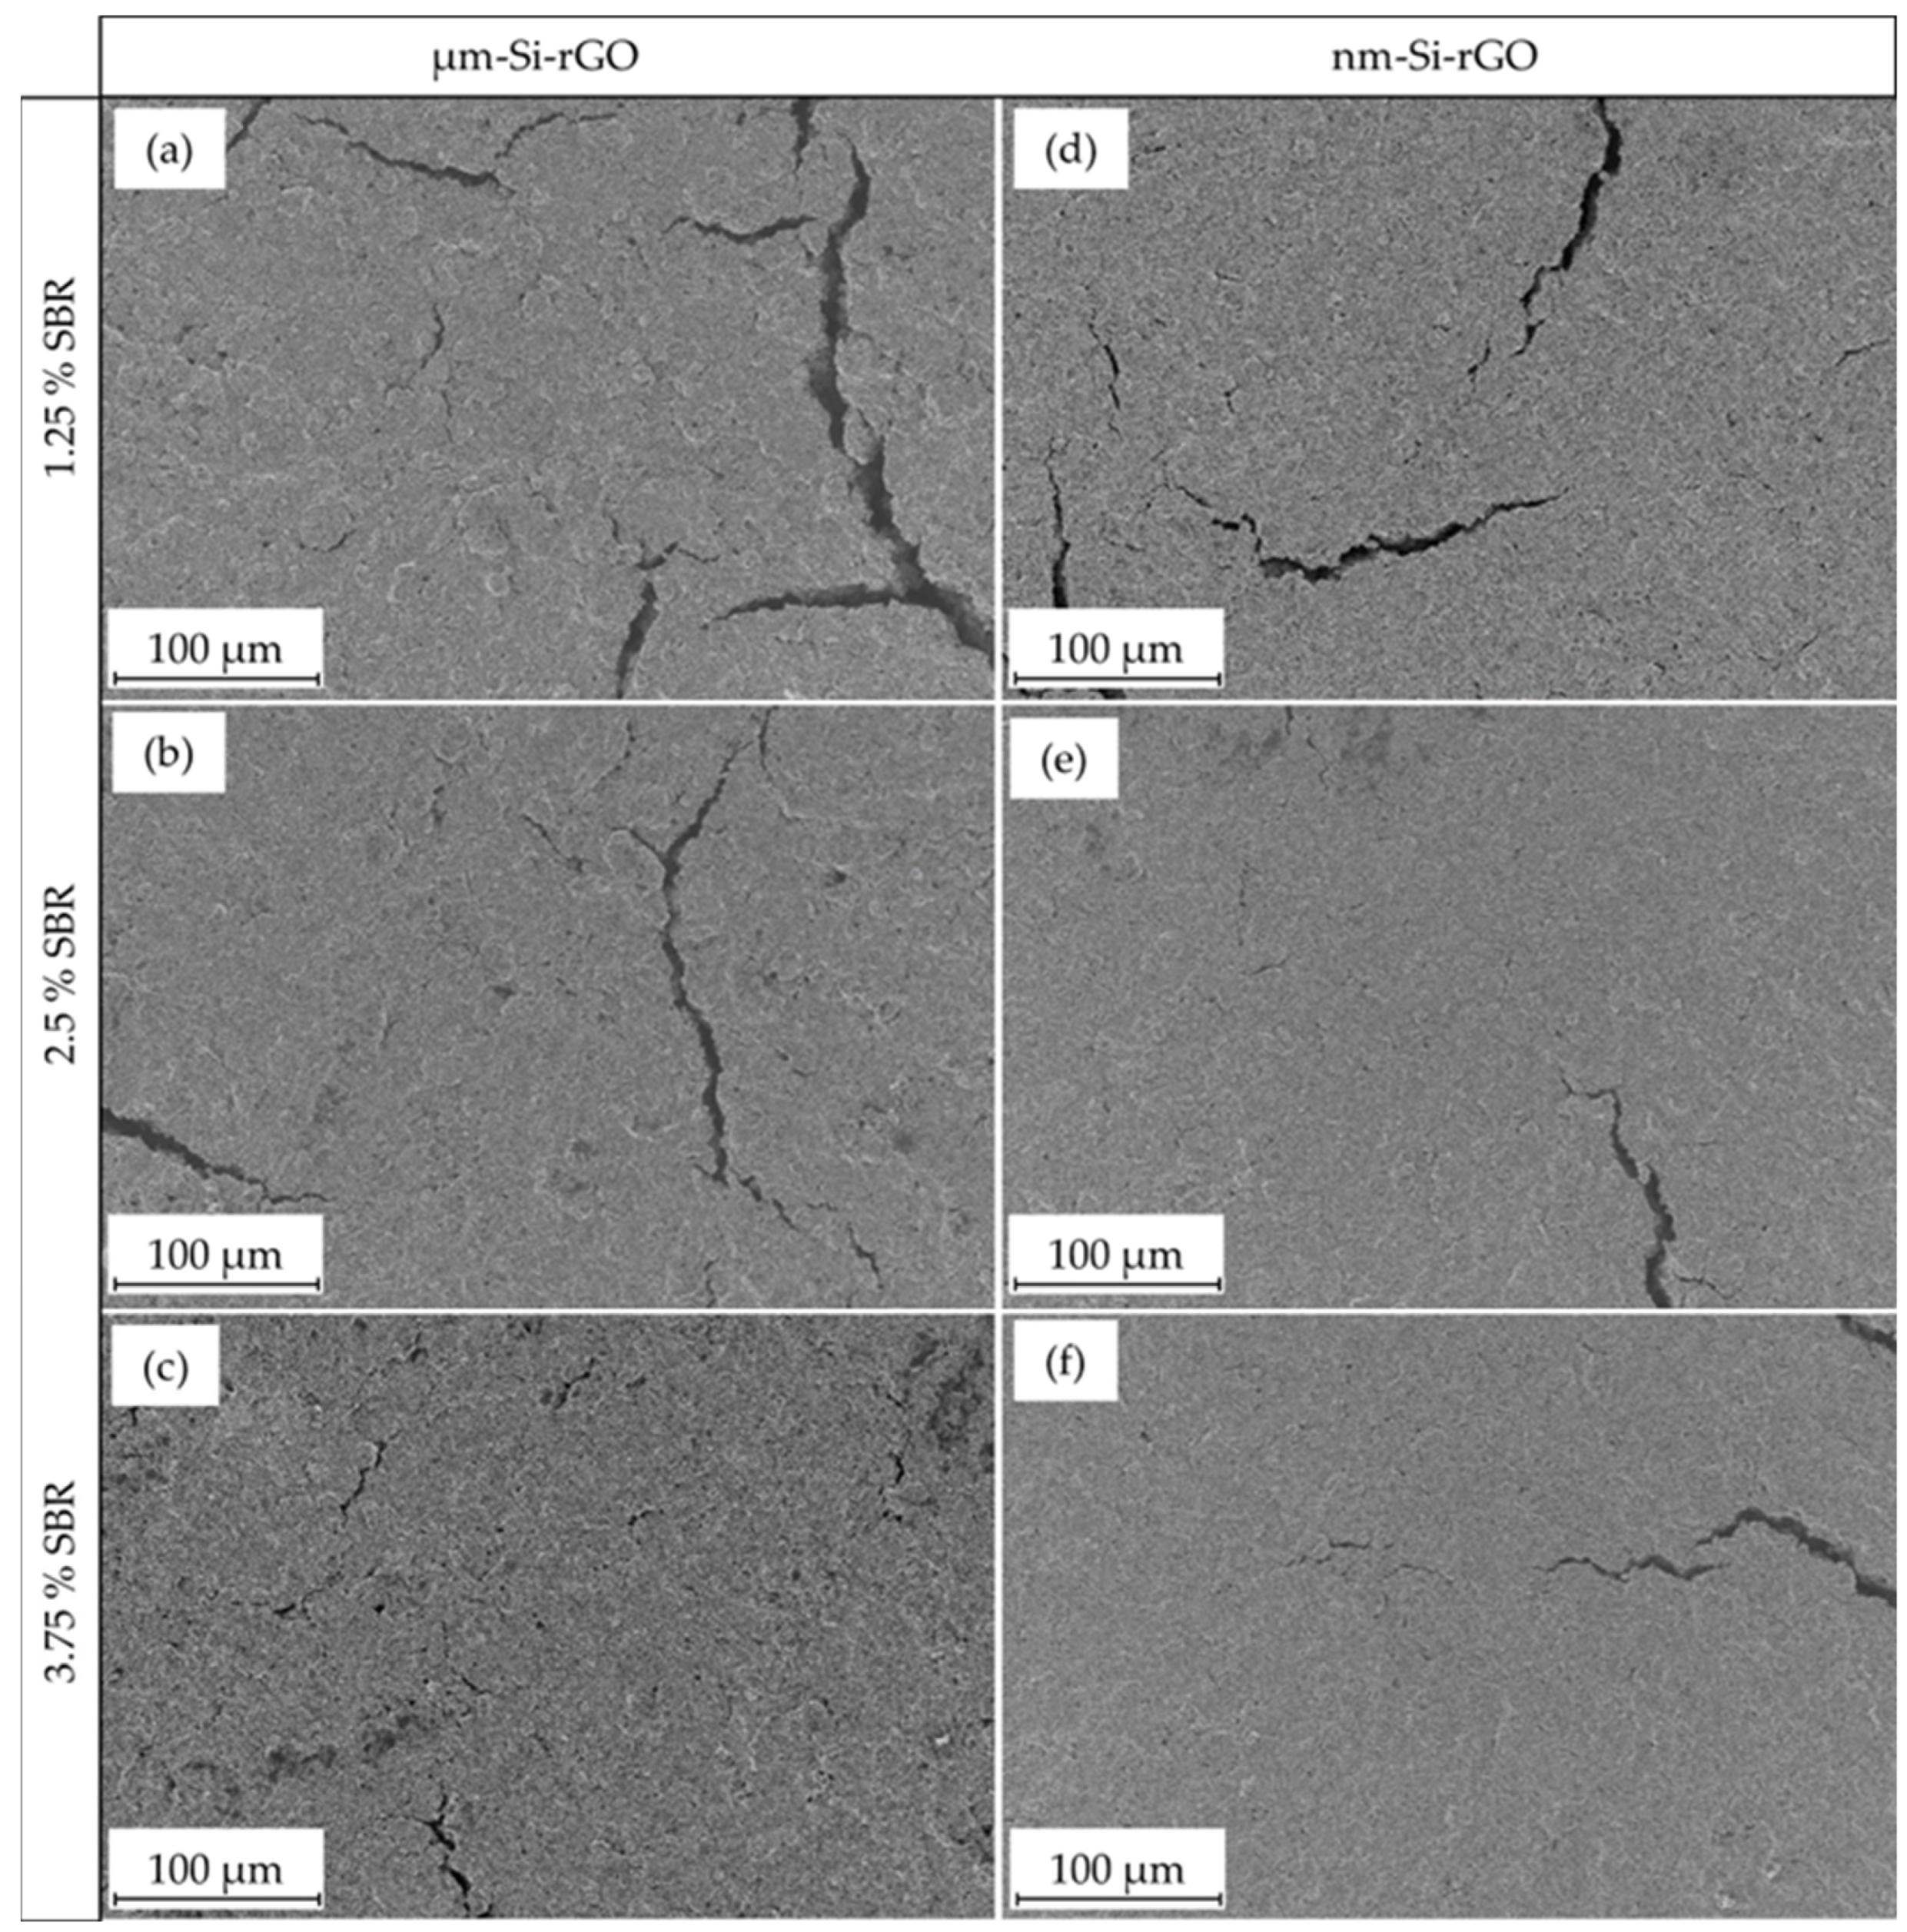
Figure 5 shows SEM images of the surfaces of the µm-Si-rGO and nm-Si-rGO composites processed into electrodes for different CMC-/SBR binder ratios.
A homogeneous coating could be achieved with all composites and binder compositions. Agglomerates or uncoated areas were not observed. Furthermore, no significant size effects were observed during processing. Homogeneous distributions of sodium from the Na-CMC binder can be found for all electrodes (see Supplementary Information, Figure S8). However, for the µm-Si-rGO, it can be seen that with increasing SBR binder contents, the cracking, which is clearly visible at 1.25 wt.% SBR (Figure 5a), steadily decreases over 2.5 wt.% SBR (Figure 5b) binder to 3.75 wt.% SBR (Figure 5c), resulting in a compact and low-porosity coating. This tendency can also be observed for the nm-Si-rGO composite, although the difference between 2.5 wt.% SBR and 3.75 wt.% SBR is marginal, so that the coatings can be considered equivalent. Significant differences in coating quality depending on the composite used are also not discernible, which allows their direct comparison.
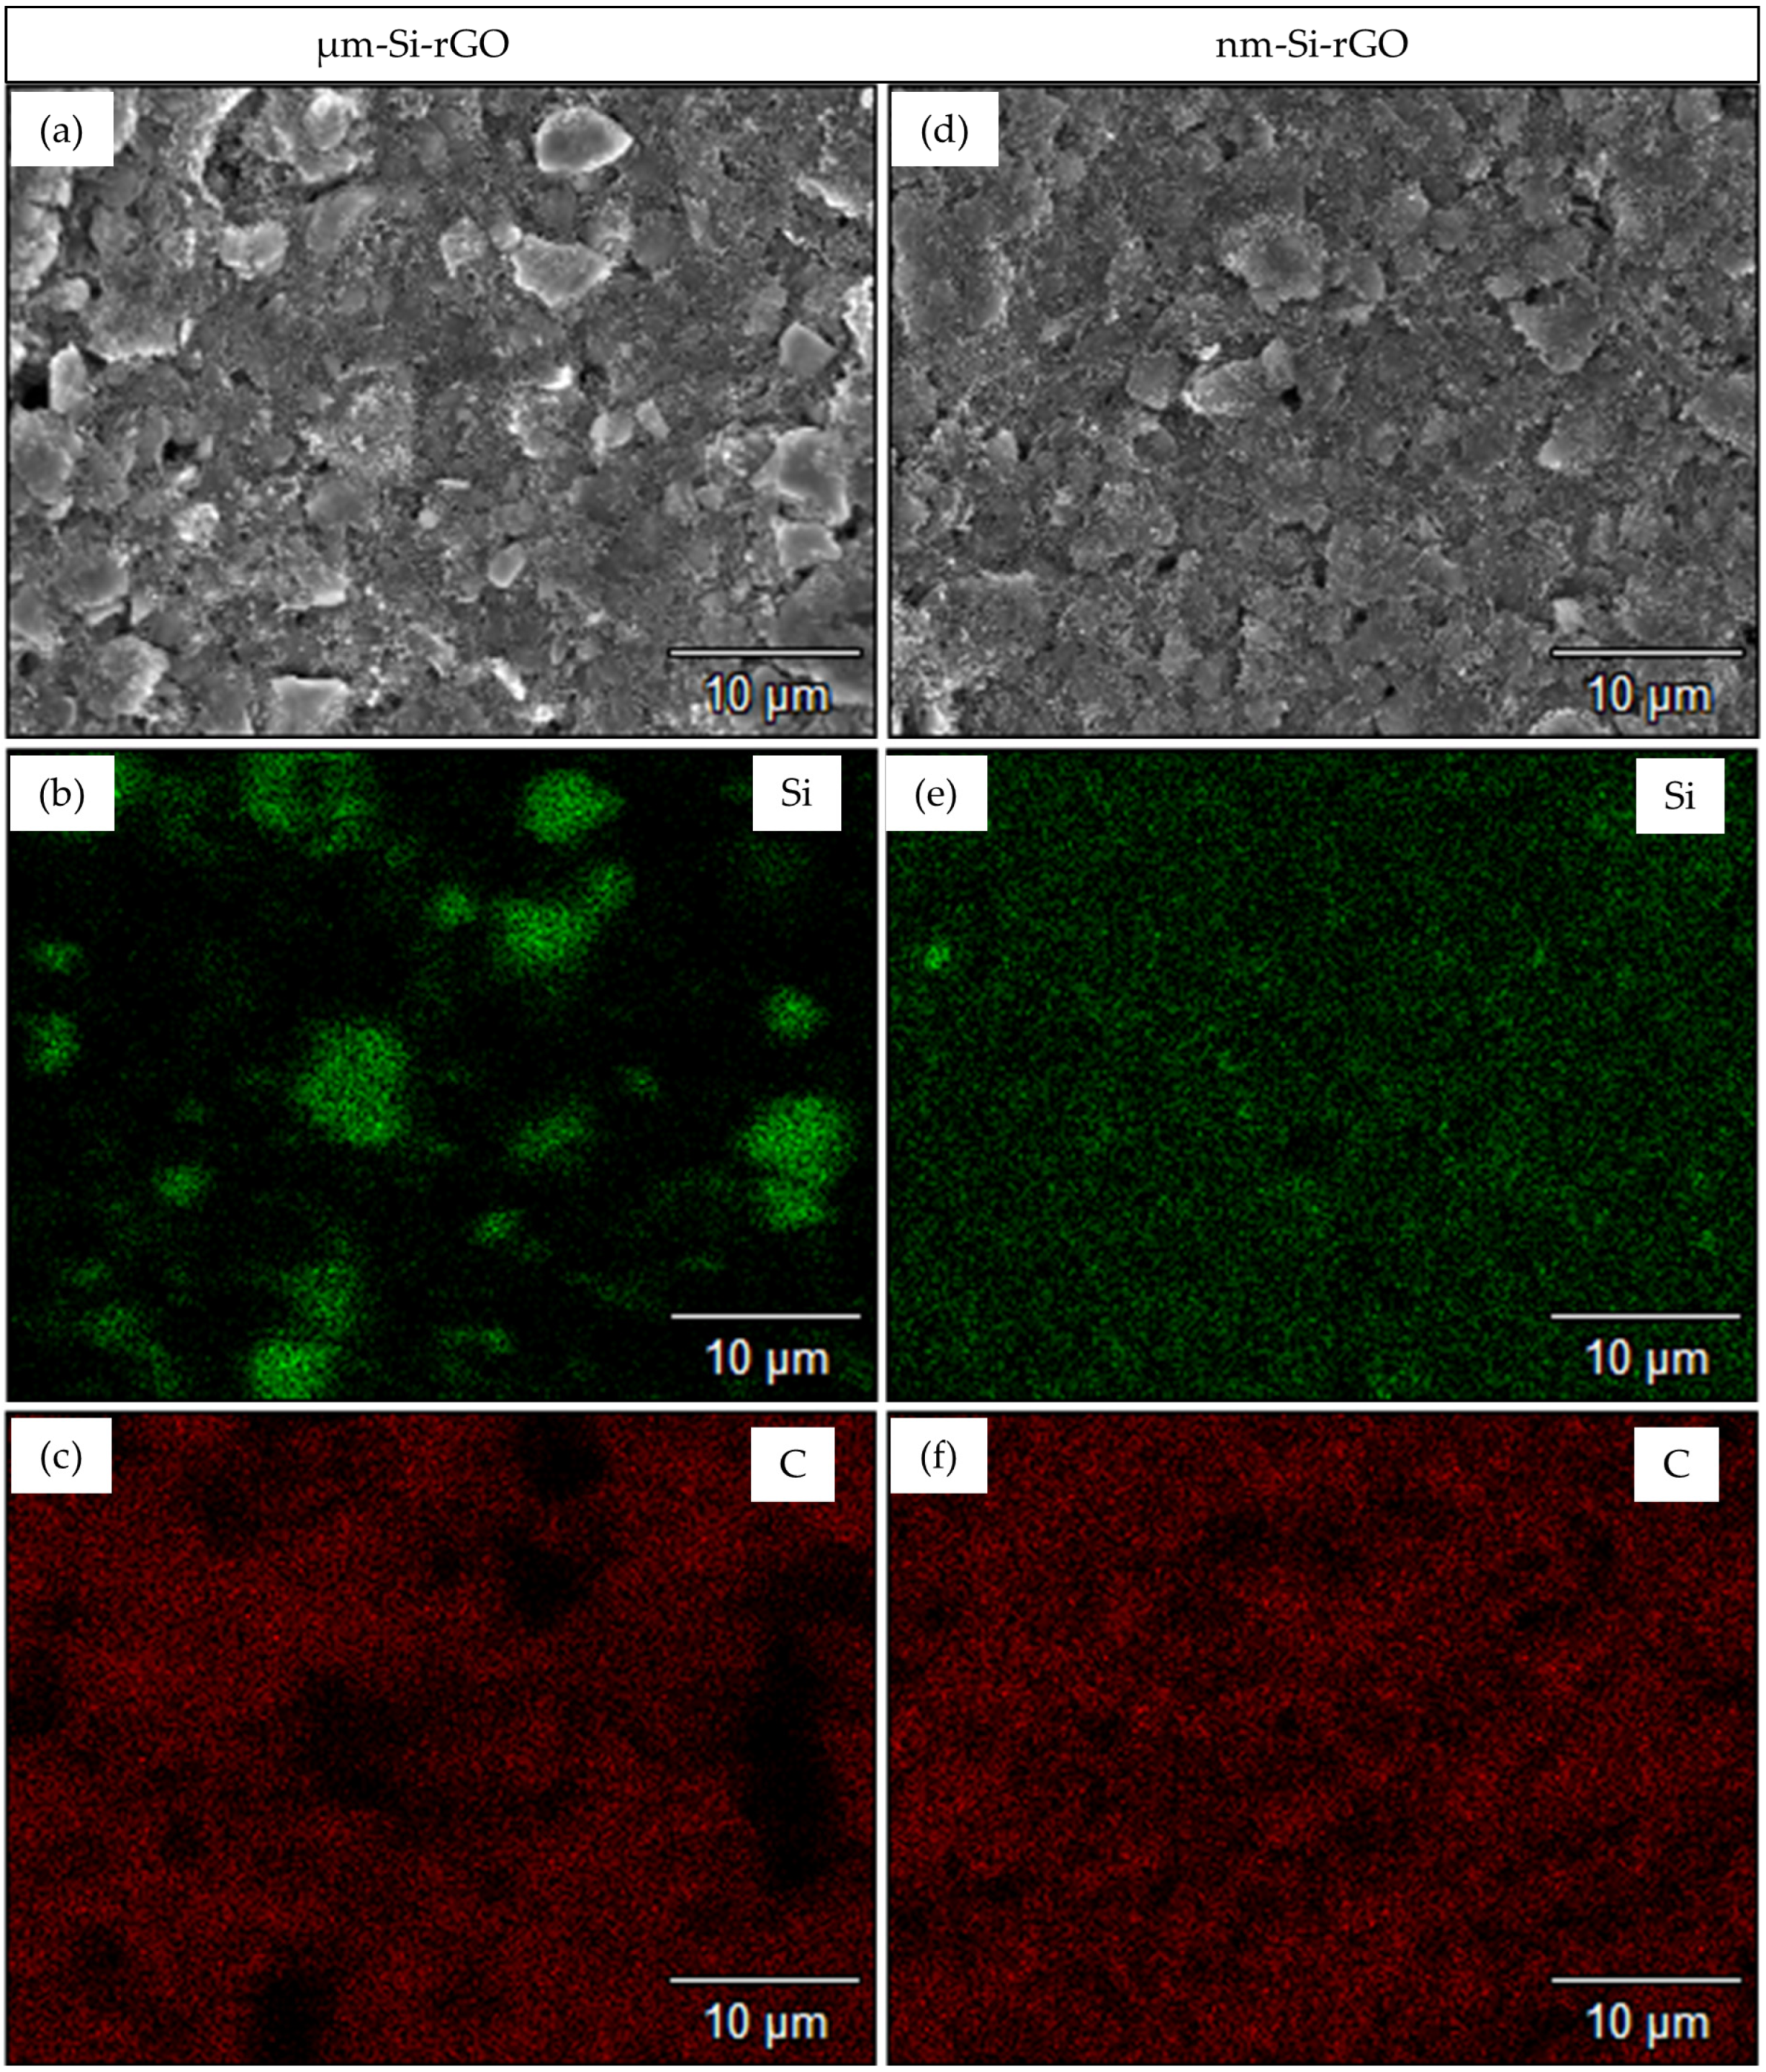
However, as exemplarily shown in Figure 6 for the binder composition consisting of 2.5 wt.% SBR and 2.5 wt.% CMC, the different silicon distribution becomes apparent using EDX mapping.
Although the µm-sized silicon is well embedded in the rGO-matrix (Figure 6a), it is inhomogeneously distributed (Figure 6b,c) due to its size (see Table 1). In contrast, the nm-silicon demonstrates good incorporation into the rGO matrix of the electrode (Figure 6d) as well as a homogeneous distribution over the electrode surface (Figure 6e,f). Larger agglomerates of the nm-silicon particles, as seen in the raw material (Figure 2b), were destroyed by the mechanical procedure and, by processing into an electrode paste with subsequent application in the doctor blade process.
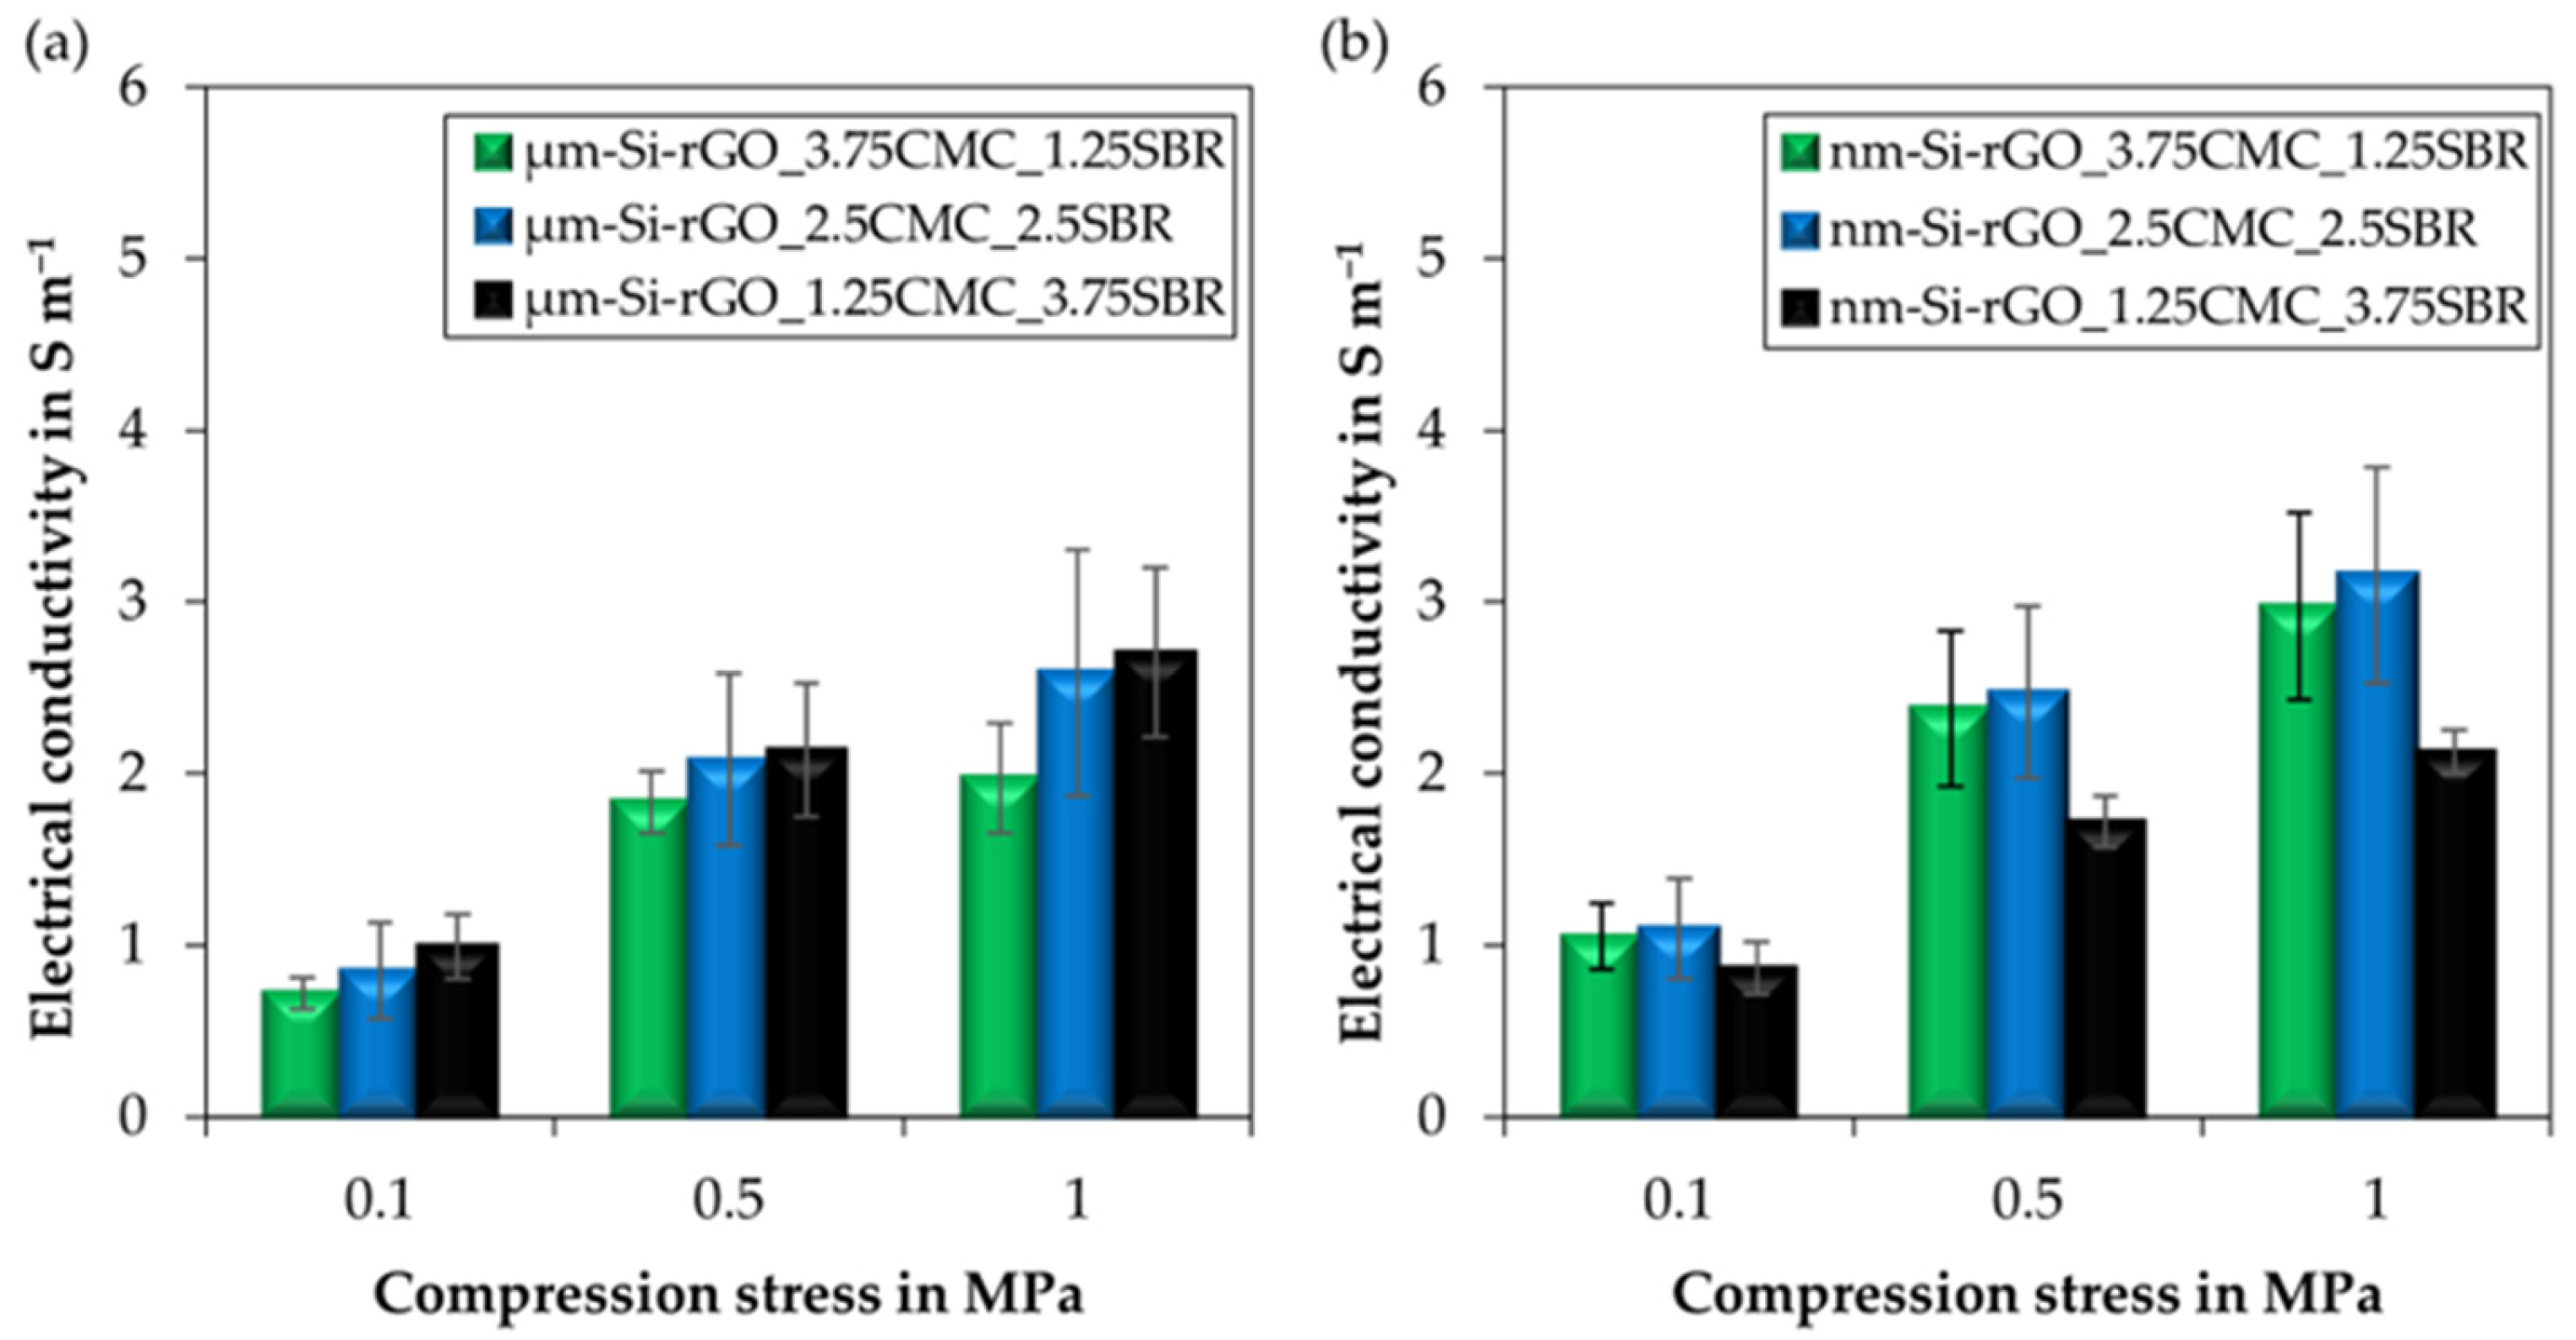
The electrical conductivity rates of the electrodes for the different SBR/CMC binder ratios of µm-Si-rGO and nm-Si-rGO as active material are shown in Figure 7.
As expected, and analogous to the measurements of the bulk powder (Figure 4), the electrical conductivity of all electrodes increases with compression of the electrodes, resulting in the highest electrical conductivity rates at 1 MPa. Furthermore, in the case of the µm-Si-rGO composite (Figure 7a), the electrical conductivity of the electrodes increases steadily from 2.0 S m−1 (µm-Si-rGO_3.75CMC_1.25SBR) to 2.6 S m−1 (µm-Si-rGO_2.5CMC_2.5SBR) and 2.7 S m−1 (µm-Si-rGO_1.25CMC_3.75SBR) as the SBR binder content increases and the Na-CMC binder content decreases. This increase was unexpected, since SBR is known to be a binder with poor electrical conductivity, and an increase in its content leads to lower electrical conductivity of the electrodes [35]. However, the measured increase may be related to the improved coating quality observed in Figure 5a–c, which agrees well with the literature findings, where an addition of SBR was shown to significantly improve adhesion [13,36]. The improvement of the coating quality with reduced cracking seems to improve the particle-to-particle contact as well as the contact to the current collector with increasing SBR binder contents, thereby contributing to increased electrical conductivity of the electrodes. The same behavior can initially be observed for the electrodes with the nm-Si-rGO composite, so that with increasing SBR binder content and improved coating quality with reduced cracking (see Figure 5d,e), the conductivity increases from 3.0 S m−1 (nm-Si-rGO_3.75CMC_1.25SBR) to 3.2 S m−1 (nm-Si-rGO_2.5CMC_2.5SBR) (Figure 7b). However, with a further increase in the SBR binder content to 3.75 wt.%, a significant decrease in electrical conductivity to 2.1 S m−1 (nm-Si-rGO_1.25CMC_3.75SBR) occurs. This decrease can only be observed for the nm-Si-rGO composite and could be attributed to the following circumstance. As shown in Figure 5e,f, the coating quality levels of the electrodes prepared with the nm-Si-rGO composite using SBR binder contents of 2.5 wt.% and 3.75 wt.% are almost identical. Thus, we assume that the electrical conductivity is not affected by poorer particle-to-particle contacts, so that the coatings can be considered equal. However, due to the increased content of 3.75 wt.% of the poorly conductive SBR binder, the electrical conductivity decreases, resulting in the lowest conductivity of the investigated nm-Si-rGO electrodes.
It should also be noted that in contrast to the composites (Figure 4), the nm-Si-rGO electrodes tend to have higher electrical conductivity than the electrodes processed with µm-Si-rGO. This indicates that the electrical conductivity of the porous electrodes is determined more by the successful formation of a conductive network than by the used active material [37].

3.4. Electrochemical Performance

3.4.1. Influence of Binder Composition on Electrode Performance for µm-Si-rGO as an Active Material

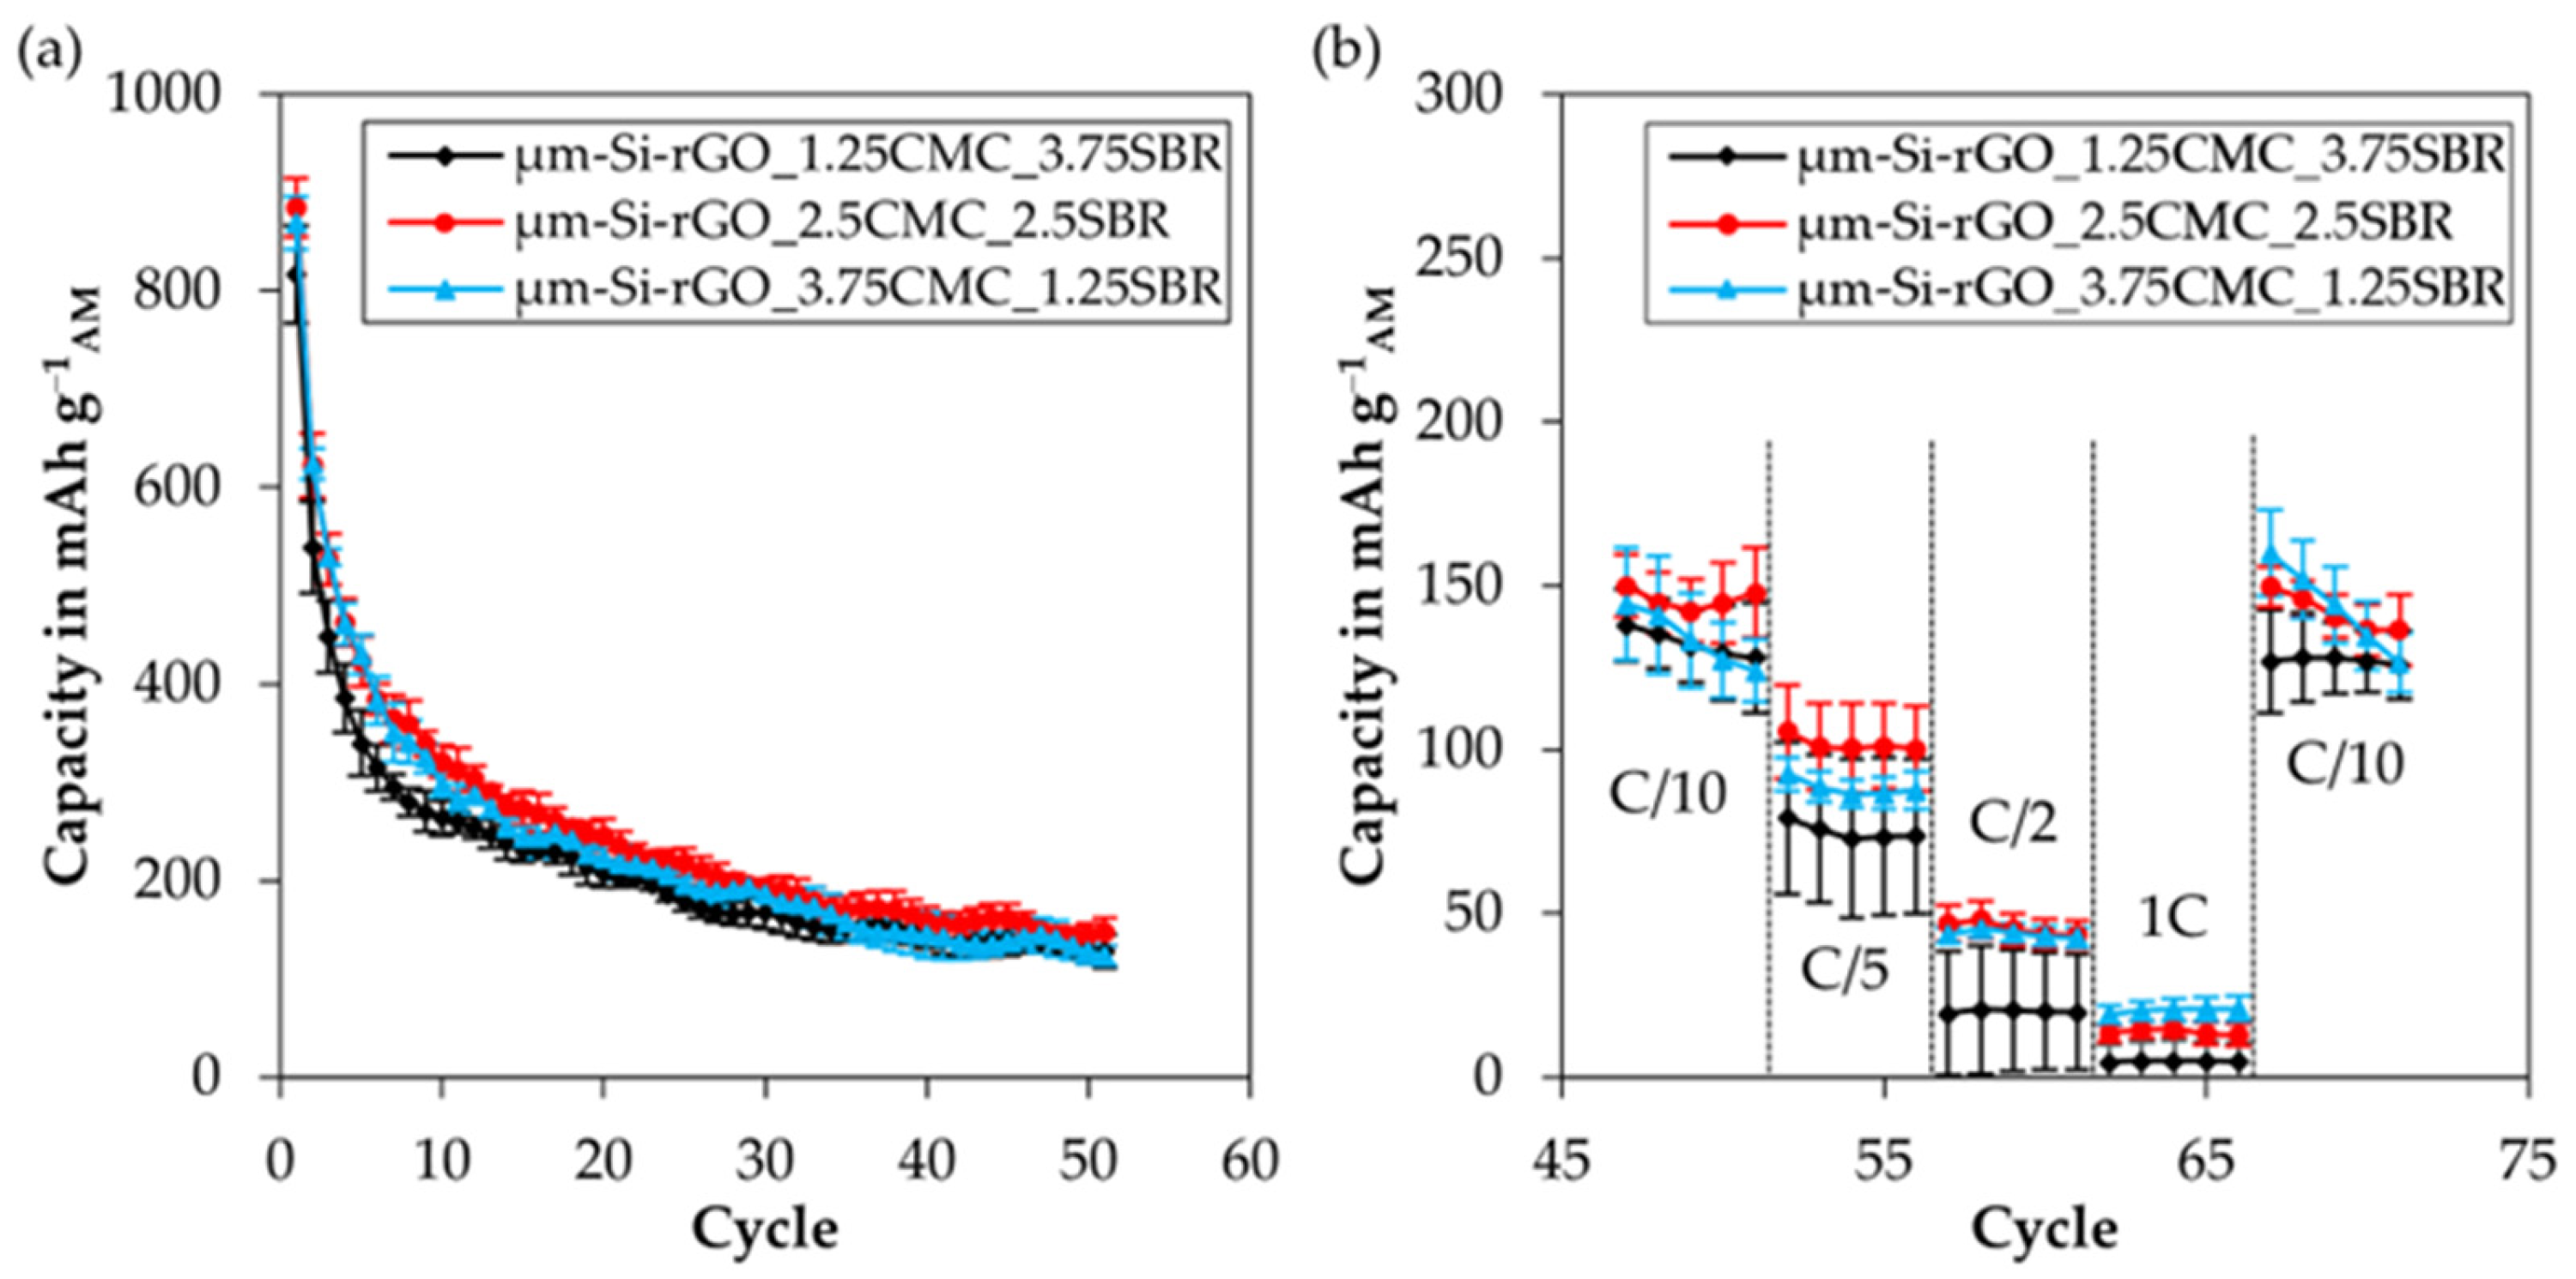
In Figure 8, the results of the galvanostatic cycling process at 0.1 C for 51 cycles (Figure 8a) are shown, as well as at 0.1 C, 0.2 C, 0.5 C, and 1 C as a function of the binder composition for the electrodes with µm-Si-rGO as the active material. For better visibility, only the delithiation capacity levels are shown. The lithiation capacity levels do not differ significantly and can be found in the Supplementary Information (Figure S3).
During galvanostatic cycling at a 0.1 C, a significant decrease in delithiation capacity can be observed for all electrodes over 51 cycles, especially within the first 10 cycles, regardless of the binder composition (Figure 8a). This strong degradation at the beginning of the cycling is assumed to be caused by the µm-silicon contained in the composite, due to the well-known degradation mechanisms (see Table 1). As the average particle size is 4.5 µm, pulverization effects cannot be excluded [7,38]. However, the delithiation capacity levels of the µm-Si composites in cycle 1 are not very different from those of the nm-sized silicon (see Figure 9). Furthermore, increased capacity loss (compared to nm-Si-rGO) occurs between the delithiation and the next lithiation step. This indicates that the delamination of the active material from the current collector or the conductive network as a result of the high volume decrease is the main reason for the stronger degradation [6]. In addition, but more independent of the particle size, the formation of the SEI layer also contributes significantly to the initial capacitance losses. This is in good agreement with recent publications about the failure mechanisms associated with Si-based anodes [38,39,40].
Although these degradation mechanisms can be observed for all binder compositions, they appear to be most evident for the binder composition with the highest SBR content of 3.75 wt.%, since this electrode exhibits both the lowest delithiation capacity of the µm-Si-rGO electrodes, with a total capacity of 11.1 Ah g−1 over 51 cycles, and the lowest coulomb efficiency of 46% in the first cycle (see Table 2). These results are unexpected, as this electrode shows not only the highest electrical conductivity (Figure 7a) but also the highest coating quality, without significant signs of cracking (Figure 5c). The poor electrochemical performance may be attributed to the following reasons. The large volume expansion of the silicon could lead to delamination of the active material from the current collector or the conductive network, especially in the case of a compact and dense coating without any micro-cracks (see Figure 5c), as less space is available for the volumetric expansion. Consequently, this may lead to irreversible capacity loss already at the beginning of the cycling, as confirmed by the lowest delithiation capacity of the µm-Si-rGO_1.25CMC_3.75SBR electrode in the first cycle (Figure 8a). Since the presence of cracks increases with increasing CMC contents (as shown in Figure 5), an enhancement of the coulomb efficiency (CE) in cycle 1 can be observed from CMC/SBR 3:1 > 1:1 > 1:3. Confirming this, the SEM images of all µm-Si-rGO electrodes show a much more porous structure after cycling than before (see Supplementary Information, Figure S5).
Furthermore, differential capacity plots can be found in the Supplementary Information. A clear shift of the lithiation potential to lower values for the µm-Si-rGO_1.25CMC_3.75SBR electrode can be observed already in the early stages of cycling, indicating increased voltage loss due to the above-mentioned reasons (low electrical conductivity and delamination effects).
In general, the CE values in cycle 1 are rather low for all electrodes investigated compared to other Si-C composites reported in the literature [41]. The relatively low CE values for the anodes in this study is less due to the silicon in the composite than to the rGO matrix used. The combination of the high surface area and the remaining oxygen in the rGO leads to a CE for Si-free rGO of less than 32% in the first cycle. The cycling results for rGO (2.5CMC_2.5SBR) are given in Figure S2 in the Supplementary Information.
As the cycling proceeds, all electrodes show a similar continuous loss of capacity from about cycle 10 onwards, irrespective of the binder composition, which is also confirmed by the approximately equal average coulomb efficiencies over cycles 2–51 of about 97% (see Table 2). However, the capacity loss from the tenth cycle onward is less significant than at the beginning of the cycling and is assumed to be mainly due to the increasing SEI layer formation.
At a binder composition of 2.5 wt.% CMC and 2.5 wt.% SBR, the highest cycling stability with the largest delithiation capacity of 13.0 Ah g−1 over 51 cycles is obtained for the µm-Si-rGO composite (Table 2). The reasons for the higher total delithiation capacity compared to the binder formulation with 3.75 wt.% CMC and 1.25 wt.% SBR may be the improved conductive network, which is indicated by the slightly increased electrical conductivity (see Figure 7a), as well as the generally better coating quality (see Figure 5a,b). In addition, the increased CE over cycles 2–51 implies that a higher content of flexible SBR seems to improve the compensation of the volume expansion over the total amount of 51 cycles. Thus, less active material is lost during the subsequent 50 cycles, resulting in an increased total delithiation capacity over 51 cycles.
The differential capacity plots confirm these observations, as the ratio of the Li2.0Si -> Si to Li3.5Si -> Li2.0Si delithiation reactions is significantly higher for µm-Si-rGO_2.5CMC_2.5SBR (see Supplementary Information, Figure S6). The enhancement of the follow-up reaction demonstrates clearly that more active material remains accessible during shrinkage.
In general, it can be noted that the average CE increases with the SBR content (CMC/SBR ratio of 3:1 < 1:1 < 1:3). Hence, with increasing cycle numbers, the relevance of the SBR grows steadily.
However, the C-rate variation (Figure 8b) shows that with increasing rates from C/10 through C/5 to C/2, the delithiation capacity levels between the binder formulations decrease progressively (µm-Si-rGO_2.5CMC_2.5SBR vs. µm-Si-rGO_3.75CMC_1.25SBR). At the 1 C-rate, the delithiation capacity of the electrode with 3.75 wt.% CMC is even above the delithiation capacity of the electrode with 2.5 wt.% CMC, although for all electrodes this is due to the increasing diffusion limitations with increasing C-rates at lower levels. Here, the diffusion limitation may explain the better performance of the electrode with the higher CMC content. We assume that the higher number of cracks within the coating (see Figure 5a) improves the Li+ diffusion into deeper layers of the electrode and facilitates the intercalation of Li+ ions, contributing to the increased performance, especially at high C-rates. This demonstrates that although a good coating with a higher content of flexible SBR is beneficial to reduce the continuous loss of active Si materials during cycling, a certain porosity is required, especially at high C-rates.
In addition to the electrochemical investigations already presented in this manuscript, galvanostatic impedance measurements were performed as well (Supplementary Information, Table S1). In good agreement with the conductivity measurements of the pristine electrodes (see Figure 7), no significant differences depending on the binder composition or Si particle size could be found either before or after cycling.

3.4.2. Influence of Binder Composition on Electrode Performance for nm-Si-rGO as an Active Material

Figure 9 illustrates the galvanostatic cycling results at 0.1 C for 51 cycles (Figure 9a) as well as at 0.1 C, 0.2 C, 0.5 C and 1 C as a function of binder composition (Figure 9b) for the electrodes with nm-Si-rGO as the active material. Again, only the delithiation capacity levels are shown here, as the lithiation capacity levels do not differ significantly. Nevertheless, the lithiation results can be found in the Supplementary Information (Figure S4).
Regardless of the binder composition, a continuous decrease in delithiation capacity over 51 cycles can be observed for all electrodes, which is assumed to be due to the increasing SEI layer formation, analogous to the results of the µm-Si-rGO electrodes (from cycle 2 onwards) [6]. In the last few years, many publications have reported that the continuous SEI growth is the main degradation mechanism, especially for nm-sized Si anode materials [42,43]. In fact, Kumar et al. and Vorauer et al. have recently demonstrated this using advanced electron microscopy tools [39,44].
Furthermore, for the nm-Si-rGO composite electrodes, it is confirmed that with a high SBR binder content of 3.75 wt.%, despite the good coating quality (see Figure 5f), the worst cycle stability is achieved. This results in a total delithiation capacity of only 17.1 Ah g−1 over 51 cycles. Again, this might be caused by poor diffusion of the Li+-ions into the compact coating, which occurs with increasing SBR binder contents (Figure 5f) combined with low electrical conductivity because of the high SBR content. Our assumption is confirmed by the decreasing Coulomb efficiencies with increasing SBR binder contents in the first cycle (see Table 2).
The maximum cycling stability with the largest delithiation capacity of 20.6 Ah g−1 is obtained for the nm-Si-rGO active material with a binder composition of 3.75 wt.% CMC and 1.5 wt.% SBR (Figure 9a). A chemical bonding between the carboxyl groups of CMC and the OH-terminated surface groups of Si may play an important role in the improved cycling stability, in agreement with Hochgatterer et al. [21]. Here, in contrast to the µm-sized particles, no increased content of flexible SBR is required, as the absolute volume expansion of the nanoparticles is significantly lower. As a result, both the CE of the first cycle and the average CE for the subsequent 50 cycles follow the trend for the CMC/SBR ratios of 3:1 > 1:1 > 1:3. Due to the higher electrical conductivity of CMC, the lithiation potential is the highest and the delithiation potential is the lowest for nm-Si-rGO_3.75CMC_1.25SBR (see Supplementary Information, Figure S7). This results in increased accessibility of the active material during constant current cycling (until the cut-off potential of 0.01 V is reached) and to a higher specific capacity.
The electrode with the highest CMC content also shows the best delithiation capacity of the investigated binder formulations at high C-rates (C/5, C/2, and 1 C) (Figure 9b). These results support the assumption that next to a good electrically conductive network, a certain level of cracking, as observed with this binder composition (see Figure 5d), is preferable for the electrochemical performance due to the increased facile diffusion and intercalation of Li+-ions deeper into active material layers. However, the specific capacity levels at higher C-rates are rather low for all electrodes, and we believe that this fading behavior is due to the continuous growth of the SEI, which leads to decreases in pore network volume and surface area, inhibiting the Li-ion diffusion [44].

3.4.3. Influence of the Silicon Particle Size on the Electrode Performance

Figure 10 summarizes the galvanostatic cycling results at 0.1 C for 51 cycles (Figure 10a) and at 0.1 C, 0.2 C, 0.5 C, and 1 C of the µm-Si-rGO and nm-Si-rGO electrodes used with their respective best binder compositions shown in Figure 8 and Figure 9.
The initial delithiation capacity levels of both composites are comparably high at the beginning of the cycling process (Figure 10a). However, the µm-Si-rGO electrode shows a significantly stronger decrease in delithiation capacity, especially in the first 10 cycles, due to the presumed degradation by pulverization and delamination from the current collector. As the cycling proceeds, a smaller decrease in delithiation capacity can be observed, corresponding to the capacity loss of the nm-Si-rGO composite. The total delithiation capacity over 51 cycles for the best µm-Si-rGO electrode is 13.0 Ah g−1, while the best nm-Si-rGO electrode shows 20.6 Ah g−1 (see Table 2). Furthermore, this composite shows a rather continuous decrease in capacity over 51 cycles. In addition to the absence of degradation due to pulverization, the lower degradation of the nm-Si-rGO electrode may also result from the improved encapsulation of the silicon particles in the rGO matrix, which could reduce the irreversible loss of capacity and the need for high contents of flexible SBR. Good encapsulation of the nm-Si particles is also indicated by the cycling at high C-rates seen in Figure 10b. Here, it can be observed that with increasing C-rates from C/10 via C/5 to C/2, the advantage of the nm-Si-rGO over the µm-Si-rGO is steadily reduced. At the 1 C-rate, the µm-Si-rGO shows an even higher capacity than the nm-Si-rGO. This may be explained by the diffusion limitation of the Li+-ions to the silicon particles, which are well encapsulated in the rGO matrix, making the formation of alloys more difficult, especially at high C-rates. Further, it can be assumed that the internal porosity of the electrode is increased as a result of the large volume expansion of the µm-Si particles. A high surface-to-volume ratio of the nanoparticles causes relatively greater SEI formation [4,7], which is particularly noticeable at higher C-rates (with constant current cycling and a fixed termination potential). Next, as shown in Figure 2, the µm-Si is mainly distributed on the surface of the composite, which may facilitate the diffusion of Li+-ions and the formation of alloys, especially at high currents. Post-mortem SEM analyses also indicated that the µm-Si-rGO composites had significantly higher porosity rates after cycling than the nm-Si rGO due to their higher volume expansion, regardless of the CMC/SBR ratio (see Supplementary Information, Figure S5). This confirms our assumption of facilitated Li+ diffusion, resulting in the better performance of the µm-Si sample at high current densities.

4. Conclusions

It can be summarized that electrodes could be successfully produced for both µm- and nm-sized silicon materials with different CMC/SBR-ratios (3:1, 1:1, and 1:3), allowing a comparison of the resulting electrochemical performance. Reduced graphene oxide (rGO) was used as the carbon matrix. This was synthesized from GO using a two-step thermal treatment (350 °C, 700 °C) in an argon atmosphere. The homogeneous distribution and encapsulation of silicon in the rGO matrix were successfully achieved with a simple ball milling approach for both composites, although it worked better for nm-Si.
For nm-Si-rGO composites, a CMC/SBR-ratio of 3:1 led to the best electrochemical performance due to allowing optimal electrical conductivity (lowest SBR content) and the highest internal porosity level (cracks within the coating).
In contrast, a ratio of CMC/SBR of 1:1 resulted in the best performance for the µm-Si-rGO composite. In the case of microscale silicon particles, it can be assumed that the stress on the binder system is significantly higher than in the case of nanoparticles as a result of the strong volume expansion. Therefore, the elastomeric SBR component seems to become more important, resulting in a different optimum CMC/SBR ratio, as the SBR is known to tolerate a greater degree of reversible volume expansion [19]. However, compared to the optimal CMC/SBR ratio of 2:3 [27] from the literature for Si/C composites using graphite as the carbon matrix, the SBR demand for rGO is lower. This indicates that in addition to the Si particle size, the carbon matrix does have a decisive influence on the binder requirements and the graphene-like rGO matrix lowers the required SBR fraction.
Overall, with this work we were able to demonstrate that the optimal binder ratio of CMC to SBR depends on the particle size of the used silicon in Si-rGO composites. Although it is expected that the exact CMC/SBR optimum has not been found in our experimental matrix, the further optimization or selection of other suitable binders depending on the Si particle size can be performed based on our results.

Supplementary Materials

The following supporting information can be downloaded at: https://www.mdpi.com/article/10.3390/batteries9050248/s1, Figure S1: Enlarged SEM micrograph (SE) of nm-Si-rGO at a magnification of 25,000×; Figure S2: Specific delithiation and lithiation capacities of the Si-free rGO electrode: (a) Constant current cycling at 0.1 C rate for 51 cycles and (b) C-rate variation at 0.1 C, 0.2 C, 0.5 C and 1 C; Figure S3: Specific lithiation capacities of the μm-Si-rGO electrodes: (a) Constant current cycling at 0.1 C rate for 51 cycles and (b) C-rate variation at 0.1 C, 0.2 C, 0.5 C and 1 C; Figure S4: Specific lithiation capacities of the nm-Si-rGO electrodes: (a) Constant current cycling at 0.1 C rate for 51 cycles and (b) C-rate variation at 0.1 C, 0.2 C, 0.5 C and 1 C; Figure S5: SEM micrographs of μm-Si-rGO_2.5CMC_2.5SBR and nm-Si-rGO_2.5CMC_2.5SBR before and after cycling; Figure S6: Differential capacity over potential for all μm-Si-rGO electrodes for cycle 5, 10, 20 and 50 (data is exemplarily taken from one cell each); Figure S7: Differential capacity over potential for all nm-Si-rGO electrodes for cycle 5, 10, 20 and 50. (data is exemplarily taken from one cell each); Figure S8: EDX mappings (C, Si and Na) of the μm- and nm-Si-rGO electrodes with the 2.5CMC_2.5SBR binder; Figure S9: Charge and Discharge curves between the termination criteria 0.01 and 1.5 V for all μm-Si-rGO electrodes in cycle 1, 5, 10, 20 and 50 (at C/10) as well as for the C-rates C/5 (cycle 55), C/2 (cycle 60), 1C (cycle 65) and C/10 again (cycle 70) (data is exemplarily taken from one cell each); Figure S10: Charge and Discharge curves between the termination criteria 0.01 and 1.5 V for all nm-Si-rGO electrodes in cycle 1, 5, 10, 20 and 50 (at C/10) as well as for the C-rates C/5 (cycle 55), C/2 (cycle 60), 1C (cycle 65) and C/10 again (cycle 70) (data is exemplarily taken from one cell each); Figure S11: Charge and Discharge curves between the termination criteria 0.01 and 1.5 V for Si-free rGO electrodes in cycle 1, 5, 10, 20 and 50 (at C/10) as well as for the C-rates C/5 (cycle 55), C/2 (cycle 60), 1C (cycle 65) and C/10 again (cycle 70) (data is exemplarily taken from one cell); Figure S12: Galvanostatic EIS curves of all investigated electrodes before and after cycling (f = 1 MHz–0.5 Hz; I = 0.2 mA). The results shown represent the mean values from 3 cells each; Table S1: Inner resistances of the different electrodes before and after cycling (71 full cycles) obtained from GEIS measurements (f = 1 MHz–0.5 Hz; I = 0.2 mA).

Author Contributions

Conceptualization, T.M., S.M., T.H. and C.R.; methodology, T.M., S.M. and M.R.; investigation, T.M., S.M. and M.R.; resources, C.R. and R.M.; data curation, T.M. and S.M.; writing—original draft preparation, T.M. and S.M.; writing—review and editing, C.R., R.M. and T.H.; visualization, T.H.; supervision, C.R.; project administration, C.R. and R.M.; funding acquisition, R.M. and C.R. All authors have read and agreed to the published version of the manuscript.

Funding

The authors gratefully acknowledge the Bavarian Center for Battery Technology (BayBatt) for funding this work.

Data Availability Statement

The data for this study are available on request from the corresponding author.

Acknowledgments

The authors would like to thank Wacker Chemie AG for providing the µm-Si and Graphit Kropfmühl GmbH for providing the GO raw material. Furthermore, the authors would like to thank the Keylab Electron and Optical Microscopy at the Bavarian Polymer Institute (BPI) for the SEM imaging (at Zeiss ULTRA-Plus). We also thank the technicians Gabriele Jena (Chair of Applied Mechanics and Fluid Mechanics, University of Bayreuth), Lena Geiling (Chair of Electrochemical Process Engineering, University of Bayreuth), and Birgitta Brunner (Chair of Chemical Engineering, University of Bayreuth) for their support. Furthermore, S.M., T.M. and T.H. thank the graduate school of the Bavarian Center for Battery Technology (BayBatt) for the ongoing support.

Conflicts of Interest

The authors declare no conflict of interest.

References

  1. Obrovac, M.N.; Christensen, L. Structural Changes in Silicon Anodes during Lithium Insertion/Extraction. Electrochem. Solid-State Lett. 2004, 7, A93. [Google Scholar] [CrossRef]
  2. Cui, Y. Silicon anodes. Nat. Energy 2021, 6, 995–996. [Google Scholar] [CrossRef]
  3. Houache, M.S.E.; Yim, C.-H.; Karkar, Z.; Abu-Lebdeh, Y. On the Current and Future Outlook of Battery Chemistries for Electric Vehicles—Mini Review. Batteries 2022, 8, 70. [Google Scholar] [CrossRef]
  4. Liu, N.; Lu, Z.; Zhao, J.; McDowell, M.T.; Lee, H.-W.; Zhao, W.; Cui, Y. A pomegranate-inspired nanoscale design for large-volume-change lithium battery anodes. Nat. Nanotech. 2014, 9, 187–192. [Google Scholar] [CrossRef] [PubMed]
  5. Kwon, T.-W.; Choi, J.W.; Coskun, A. The emerging era of supramolecular polymeric binders in silicon anodes. Chem. Soc. Rev. 2018, 47, 2145–2164. [Google Scholar] [CrossRef]
  6. Choi, J.W.; Aurbach, D. Promise and reality of post-lithium-ion batteries with high energy densities. Nat. Rev. Mater. 2016, 1, 16013. [Google Scholar] [CrossRef]
  7. Liu, X.H.; Zhong, L.; Huang, S.; Mao, S.X.; Zhu, T.; Huang, J.Y. Size-dependent fracture of silicon nanoparticles during lithiation. ACS Nano 2012, 6, 1522–1531. [Google Scholar] [CrossRef]
  8. Müllner, S.; Held, T.; Schmidt-Rodenkirchen, A.; Gerdes, T.; Roth, C. Reactive Spray Drying as a One-Step Synthesis Approach towards Si/rGO Anode Materials for Lithium-Ion Batteries. J. Electrochem. Soc. 2021, 168, 120545. [Google Scholar] [CrossRef]
  9. Zhang, X.; Wang, D.; Qiu, X.; Ma, Y.; Kong, D.; Müllen, K.; Li, X.; Zhi, L. Stable high-capacity and high-rate silicon-based lithium battery anodes upon two-dimensional covalent encapsulation. Nat. Commun. 2020, 11, 3826. [Google Scholar] [CrossRef] [PubMed]
  10. Luo, J.; Zhao, X.; Wu, J.; Jang, H.D.; Kung, H.H.; Huang, J. Crumpled Graphene-Encapsulated Si Nanoparticles for Lithium Ion Battery Anodes. J. Phys. Chem. Lett. 2012, 3, 1824–1829. [Google Scholar] [CrossRef]
  11. Deng, L.; Zheng, Y.; Zheng, X.; Or, T.; Ma, Q.; Qian, L.; Deng, Y.; Yu, A.; Li, J.; Chen, Z. Design Criteria for Silicon-Based Anode Binders in Half and Full Cells. Adv. Energy Mater. 2022, 12, 2200850. [Google Scholar] [CrossRef]
  12. Chen, H.; Ling, M.; Hencz, L.; Ling, H.Y.; Li, G.; Lin, Z.; Liu, G.; Zhang, S. Exploring Chemical, Mechanical, and Electrical Functionalities of Binders for Advanced Energy-Storage Devices. Chem. Rev. 2018, 118, 8936–8982. [Google Scholar] [CrossRef] [PubMed]
  13. Jeschull, F.; Brandell, D.; Wohlfahrt-Mehrens, M.; Memm, M. Water-Soluble Binders for Lithium-Ion Battery Graphite Electrodes: Slurry Rheology, Coating Adhesion, and Electrochemical Performance. Energy Technol. 2017, 5, 2108–2118. [Google Scholar] [CrossRef]
  14. Wang, H.; Zhang, G.; Chen, Y.; Zheng, P.; Yi, H.; Deng, Y.; Yang, Y.; Wang, C. Reversible cross-linked phosphorylate binder for recyclable lithium-sulfur batteries. Chem. Eng. J. 2023, 452, 139128. [Google Scholar] [CrossRef]
  15. Hu, L.; Zhang, X.; Li, B.; Jin, M.; Shen, X.; Luo, Z.; Tian, Z.; Yuan, L.; Deng, J.; Dai, Z.; et al. Design of high-energy-dissipation, deformable binder for high-areal-capacity silicon anode in lithium-ion batteries. Chem. Eng. J. 2021, 420, 129991. [Google Scholar] [CrossRef]
  16. Ding, N.; Xu, J.; Yao, Y.; Wegner, G.; Lieberwirth, I.; Chen, C. Improvement of cyclability of Si as anode for Li-ion batteries. J. Power Sources 2009, 192, 644–651. [Google Scholar] [CrossRef]
  17. Lee, J.-H.; Paik, U.; Hackley, V.A.; Choi, Y.-M. Effect of Carboxymethyl Cellulose on Aqueous Processing of Natural Graphite Negative Electrodes and their Electrochemical Performance for Lithium Batteries. J. Electrochem. Soc. 2005, 152, A1763. [Google Scholar] [CrossRef]
  18. Buqa, H.; Holzapfel, M.; Krumeich, F.; Veit, C.; Novák, P. Study of styrene butadiene rubber and sodium methyl cellulose as binder for negative electrodes in lithium-ion batteries. J. Power Sources 2006, 161, 617–622. [Google Scholar] [CrossRef]
  19. Liu, W.-R.; Yang, M.-H.; Wu, H.-C.; Chiao, S.M.; Wu, N.-L. Enhanced Cycle Life of Si Anode for Li-Ion Batteries by Using Modified Elastomeric Binder. Electrochem. Solid-State Lett. 2005, 8, A100. [Google Scholar] [CrossRef]
  20. Li, J.; Lewis, R.B.; Dahn, J.R. Sodium Carboxymethyl Cellulose: A Potential Binder for Si Negative Electrodes for Li-Ion Batteries. Electrochem. Solid-State Lett. 2007, 10, A17. [Google Scholar] [CrossRef]
  21. Hochgatterer, N.S.; Schweiger, M.R.; Koller, S.; Raimann, P.R.; Wöhrle, T.; Wurm, C.; Winter, M. Silicon/Graphite Composite Electrodes for High-Capacity Anodes: Influence of Binder Chemistry on Cycling Stability. Electrochem. Solid-State Lett. 2008, 11, A76. [Google Scholar] [CrossRef]
  22. Zhao, Y.-M.; Yue, F.-S.; Li, S.-C.; Zhang, Y.; Tian, Z.-R.; Xu, Q.; Xin, S.; Guo, Y.-G. Advances of polymer binders for silicon-based anodes in high energy density lithium-ion batteries. InfoMat 2021, 3, 460–501. [Google Scholar] [CrossRef]
  23. Wang, R.; Feng, L.; Yang, W.; Zhang, Y.; Zhang, Y.; Bai, W.; Liu, B.; Zhang, W.; Chuan, Y.; Zheng, Z.; et al. Effect of Different Binders on the Electrochemical Performance of Metal Oxide Anode for Lithium-Ion Batteries. Nanoscale Res. Lett. 2017, 12, 575. [Google Scholar] [CrossRef] [PubMed]
  24. Fitz, O.; Ingenhoven, S.; Bischoff, C.; Gentischer, H.; Birke, K.P.; Saracsan, D.; Biro, D. Comparison of Aqueous- and Non-Aqueous-Based Binder Polymers and the Mixing Ratios for Zn//MnO2 Batteries with Mildly Acidic Aqueous Electrolytes. Batteries 2021, 7, 40. [Google Scholar] [CrossRef]
  25. Li, T.; Yang, J.; Lu, S. Effect of modified elastomeric binders on the electrochemical properties of silicon anodes for lithium-ion batteries. Int. J. Miner. Metall. Mater. 2012, 19, 752–756. [Google Scholar] [CrossRef]
  26. Zuo, P.; Yang, W.; Cheng, X.; Yin, G. Enhancement of the electrochemical performance of silicon/carbon composite material for lithium ion batteries. Ionics 2011, 17, 87–90. [Google Scholar] [CrossRef]
  27. Fang, C.; Xiao, H.; Zheng, T.; Bai, H.; Liu, G. Organic Solvent Free Process to Fabricate High Performance Silicon/Graphite Composite Anode. J. Compos. Sci. 2021, 5, 188. [Google Scholar] [CrossRef]
  28. Shu, Z.X.; McMillan, R.S.; Murray, J.J. Electrochemical Intercalation of Lithium into Graphite. J. Electrochem. Soc. 1993, 140, 922–927. [Google Scholar] [CrossRef]
  29. Klemeyer, L.; Park, H.; Huang, J. Geometry-Dependent Thermal Reduction of Graphene Oxide Solid. ACS Mater. Lett. 2021, 3, 511–515. [Google Scholar] [CrossRef]
  30. Chen, C.-M.; Huang, J.-Q.; Zhang, Q.; Gong, W.-Z.; Yang, Q.-H.; Wang, M.-Z.; Yang, Y.-G. Annealing a graphene oxide film to produce a free standing high conductive graphene film. Carbon 2012, 50, 659–667. [Google Scholar] [CrossRef]
  31. Silva, K.K.H.d.; Huang, H.-H.; Joshi, R.; Yoshimura, M. Restoration of the graphitic structure by defect repair during the thermal reduction of graphene oxide. Carbon 2020, 166, 74–90. [Google Scholar] [CrossRef]
  32. Oliveira, A.E.F.; Braga, G.B.; Tarley, C.R.T.; Pereira, A.C. Thermally reduced graphene oxide: Synthesis, studies and characterization. J. Mater. Sci 2018, 53, 12005–12015. [Google Scholar] [CrossRef]
  33. Pan, Q.; Chung, C.-C.; He, N.; Jones, J.L.; Gao, W. Accelerated Thermal Decomposition of Graphene Oxide Films in Air via in Situ X-ray Diffraction Analysis. J. Phys. Chem. C 2016, 120, 14984–14990. [Google Scholar] [CrossRef]
  34. Zhang, C.; Wang, F.; Han, J.; Bai, S.; Tan, J.; Liu, J.; Li, F. Challenges and Recent Progress on Silicon-Based Anode Materials for Next-Generation Lithium-Ion Batteries. Small Struct. 2021, 2, 2100009. [Google Scholar] [CrossRef]
  35. Chong, J.; Xun, S.; Zheng, H.; Song, X.; Liu, G.; Ridgway, P.; Wang, J.Q.; Battaglia, V.S. A comparative study of polyacrylic acid and poly(vinylidene difluoride) binders for spherical natural graphite/LiFePO4 electrodes and cells. J. Power Sources 2011, 196, 7707–7714. [Google Scholar] [CrossRef]
  36. Park, J.; Willenbacher, N.; Ahn, K.H. How the interaction between styrene-butadiene-rubber (SBR) binder and a secondary fluid affects the rheology, microstructure and adhesive properties of capillary-suspension-type graphite slurries used for Li-ion battery anodes. Colloids Surf. A 2019, 579, 123692. [Google Scholar] [CrossRef]
  37. Gordon, R.; Orias, R.; Willenbacher, N. Effect of carboxymethyl cellulose on the flow behavior of lithium-ion battery anode slurries and the electrical as well as mechanical properties of corresponding dry layers. J. Mater. Sci 2020, 55, 15867–15881. [Google Scholar] [CrossRef]
  38. Liu, J.; Lee, S.Y.; Yoo, J.; Kim, S.; Kim, J.-H.; Cho, H. Real-Time Observation of Mechanical Evolution of Micro-Sized Si Anodes by In Situ Atomic Force Microscopy. ACS Mater. Lett. 2022, 4, 840–846. [Google Scholar] [CrossRef]
  39. Kumar, P.; Berhaut, C.L.; Zapata Dominguez, D.; de Vito, E.; Tardif, S.; Pouget, S.; Lyonnard, S.; Jouneau, P.-H. Nano-Architectured Composite Anode Enabling Long-Term Cycling Stability for High-Capacity Lithium-Ion Batteries. Small 2020, 16, e1906812. [Google Scholar] [CrossRef]
  40. Gutierrez, M.; Morcrette, M.; Monconduit, L.; Oudart, Y.; Lemaire, P.; Davoisne, C.; Louvain, N.; Janot, R. Towards a better understanding of the degradation mechanisms of Li-ion full cells using Si/C composites as anode. J. Power Sources 2022, 533, 231408. [Google Scholar] [CrossRef]
  41. Lee, J.; Moon, J.; Han, S.A.; Kim, J.; Malgras, V.; Heo, Y.-U.; Kim, H.; Lee, S.-M.; Liu, H.K.; Dou, S.X.; et al. Everlasting Living and Breathing Gyroid 3D Network in Si@SiOx/C Nanoarchitecture for Lithium Ion Battery. ACS Nano 2019, 13, 9607–9619. [Google Scholar] [CrossRef] [PubMed]
  42. Kim, J.; Chae, O.B.; Lucht, B.L. Perspective—Structure and Stability of the Solid Electrolyte Interphase on Silicon Anodes of Lithium-ion Batteries. J. Electrochem. Soc. 2021, 168, 30521. [Google Scholar] [CrossRef]
  43. Lee, J.G.; Kim, J.; Lee, J.B.; Park, H.; Kim, H.-S.; Ryu, J.H.; Jung, D.S.; Kim, E.K.; Oh, S.M. Mechanical Damage of Surface Films and Failure of Nano-Sized Silicon Electrodes in Lithium Ion Batteries. J. Electrochem. Soc. 2017, 164, A6103–A6109. [Google Scholar] [CrossRef]
  44. Vorauer, T.; Kumar, P.; Berhaut, C.L.; Chamasemani, F.F.; Jouneau, P.-H.; Aradilla, D.; Tardif, S.; Pouget, S.; Fuchsbichler, B.; Helfen, L.; et al. Multi-scale quantification and modeling of aged nanostructured silicon-based composite anodes. Commun. Chem. 2020, 3, 141. [Google Scholar] [CrossRef] [PubMed]
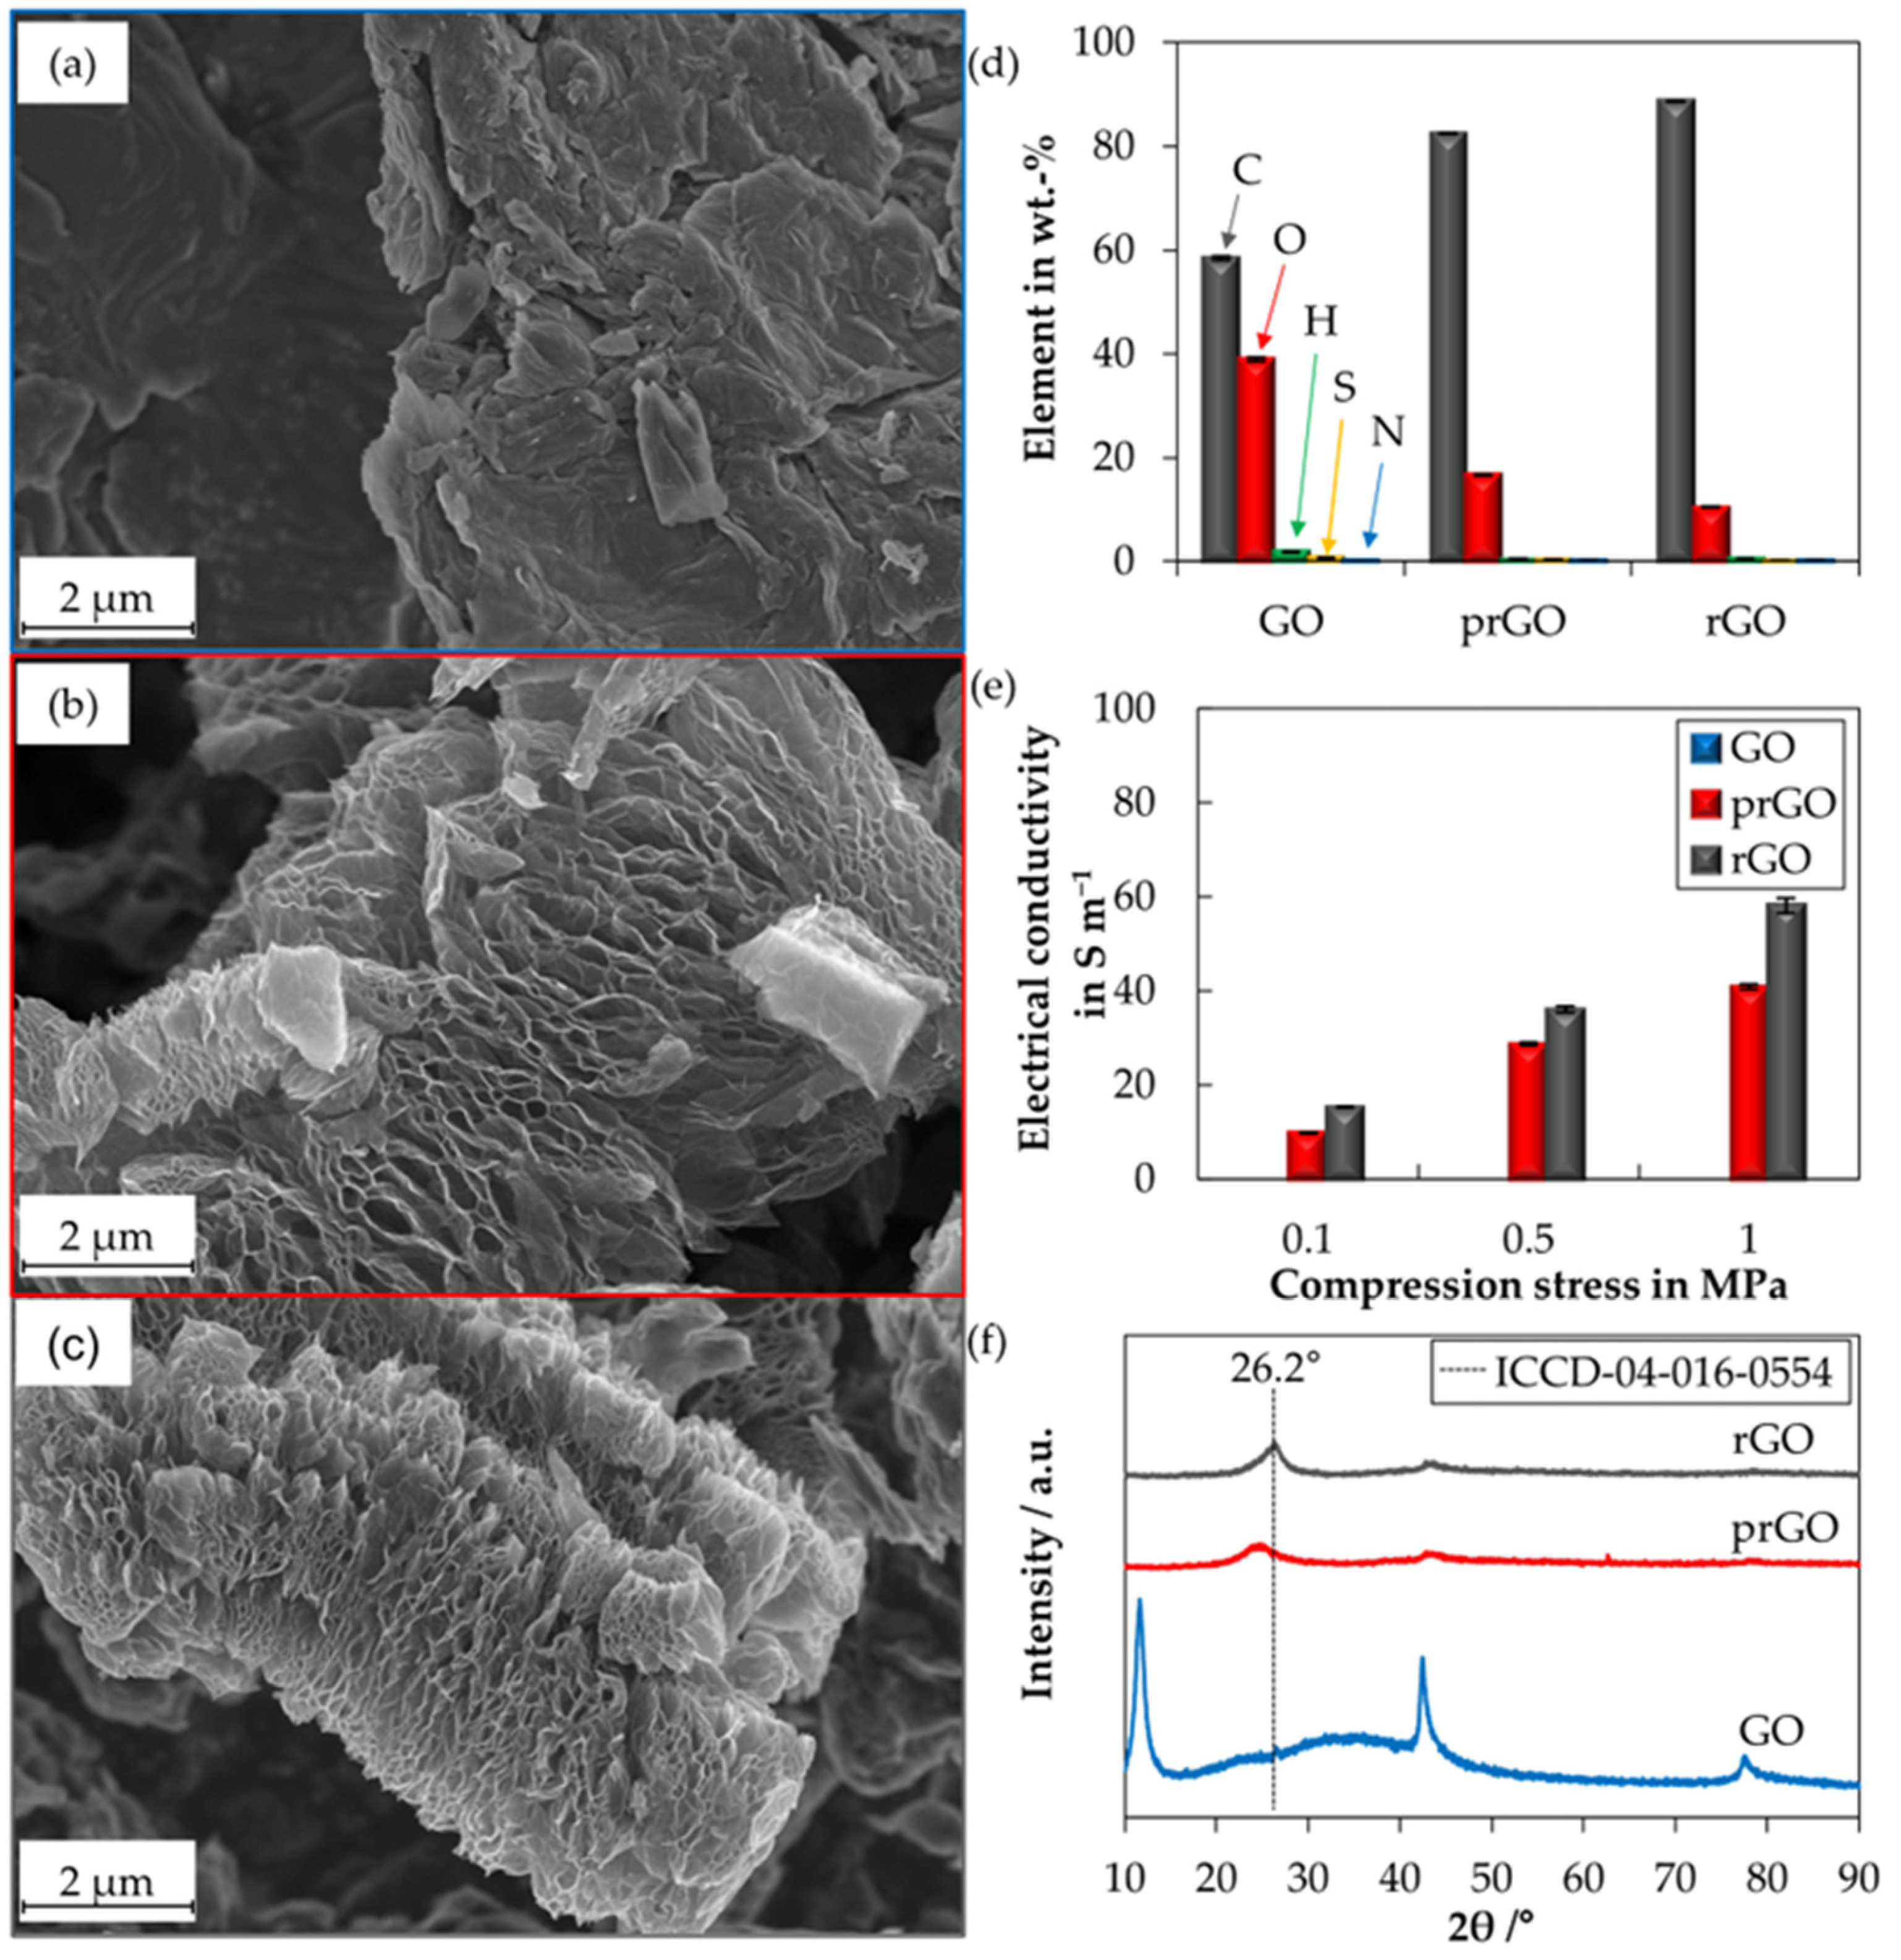
Figure 1. SEM micrographs (SE) of (a) GO, (b) prGO, (c) rGO, as well as the (d) CHNS data, (e) electrical conductivity results, and (f) XRD-analysis results for GO, prGO, and rGO.
Batteries 09 00248 g001
Figure 2. SEM micrographs (SE) of (a) µm-Si, (b) nm-Si, (c) µm-Si-rGO, and (d) nm-Si-rGO at magnifications of 2500× and 25,000×, respectively.
Batteries 09 00248 g002
Figure 3. The XRD analysis of (a) µm-Si and nm-Si, as well as of (b) rGO, µm-Si-rGO composite, and nm-Si-rGO composite (C is assigned to the ICCD reference pattern file 04-016-0554; Si is assigned to the ICCD reference pattern file 01-070-5680).
Batteries 09 00248 g003
Figure 4. Electrical conductivity results for rGO_milled_45µm, µm-Si-rGO composite, and nm-Si-rGO composite.
Batteries 09 00248 g004
Figure 5. SEM micrographs (SE) of the electrodes with different binder contents (wt.%) of (a) 3.75CMC_1.25SBR, (b) 2.5CMC_2.5SBR, and (c) 1.25CMC_3.75SBR for µm-Si-rGO and (d) 3.75CMC_1.25SBR, (e) 2.5CMC_2.5SBR, and (f) 1.25CMC_3.75SBR for nm-Si-rGO.
Batteries 09 00248 g005
Figure 6. SEM images of the electrodes with binder contents of 2.5 wt.% CMC and 2.5 wt.% SBR of (a) µm-Si-rGO, as well as the (d) nm-Si-rGO composite with corresponding EDX analyses for the distributions of (b,e) silicon and (c,f) carbon.
Batteries 09 00248 g006
Figure 7. Electrical conductivity of the electrodes for different CMC/SBR binder ratios with the active material (a) µm-Si-rGO and (b) nm-Si-rGO composite.
Batteries 09 00248 g007
Figure 8. Electrochemical performance of µm-Si-rGO electrodes: (a) constant current cycling at 0.1 the C-rate for 51 cycles with varying binder compositions and (b) C-rate variations at 0.1 C, 0.2 C, 0.5 C, and 1 C.
Batteries 09 00248 g008
Figure 9. Electrochemical performance of nm-Si-rGO electrodes: (a) constant current cycling at the 0.1 C-rate for 51 cycles with varying binder compositions and (b) C-rate variations at 0.1 C, 0.2 C, 0.5 C, and 1 C.
Batteries 09 00248 g009
Figure 10. Comparison of the electrochemical performances of the µm-Si-rGO and nm-Si-rGO electrodes: (a) constant current cycling at the 0.1 C-rate for 51 cycles of nm-Si-rGO_3.75CMC_1.25SBR and µm-Si-rGO_2.5CMC_2.5SBR as well as the (b) C-rate variations at 0.1 C, 0.2 C, 0.5 C, and 1 C.
Batteries 09 00248 g010
Table 1. Overview of the results of the BET analysis, particle size distribution, and ICP-OES analysis of the starting materials graphite oxide (GO), µm-Si, and nm-Si, as well as the synthesized samples partially reduced graphene oxide (prGO), reduced graphene oxide (rGO), milled rGO (rGO_milled), milled and sieved rGO (rGO_milled_45µm), µm-Si-rGO composite, and nm-Si-rGO composite.
SampleParameters
BET
in m2 g−1
d10
in µm
d50
in µm
d90
in µm
Si
in wt.%
GO36.51.74.49.3-
prGO474.32.45.210.6-
rGO512.02.35.211.0-
rGO_milled175.52.04.710.2-
rGO_milled_45µm161.01.94.411.4-
µm-Si2.91.14.69.2-
nm-Si47.70.20.71.6-
µm-Si-rGO129.31.44.414.417.4
nm-Si-rGO162.01.13.610.715.1
Table 2. Overview of the galvanostatic cycled electrodes and the obtained total delithiation capacity levels over 51 cycles, as well as the CE in the first cycle and the average CE over cycles 2-51.
SampleParameter
Total Delithiation Capacity (51 Cycles) in Ah   g AM 1 CE
(1st Cycle)
in %
Average CE
(Cycle 2–51)
in %
µm-Si-rGO_1.25CMC_3.75SBR11.1 ± 0.846.22 ± 1.1397.64 ± 0.06
µm-Si-rGO_2.5CMC_2.5SBR13.0 ± 0.751.01 ± 2.6097.51 ± 0.08
µm-Si-rGO_3.75CMC_1.25SBR12.2 ± 0.551.15 ± 1.4797.23 ± 0.17
nm-Si-rGO_1.25CMC_3.75SBR17.1 ± 0.748.89 ± 1.9597.09 ± 0.16
nm-Si-rGO_2.5CMC_2.5SBR17.4 ± 0.350.27 ± 0.7996.83 ± 0.03
nm-Si-rGO_3.75CMC_1.25SBR20.6 ± 0.652.88 ± 0.4596.95 ± 0.07
rGO_2.5CMC_2.5SBR12.7 ± 0.131.78 ± 1.0398.05 ± 0.06
Disclaimer/Publisher’s Note: The statements, opinions and data contained in all publications are solely those of the individual author(s) and contributor(s) and not of MDPI and/or the editor(s). MDPI and/or the editor(s) disclaim responsibility for any injury to people or property resulting from any ideas, methods, instructions or products referred to in the content.