

Charge Storage Mechanism of LixWO3 Hexagonal Tungsten Bronze in Aqueous Electrolytes

 , , , and
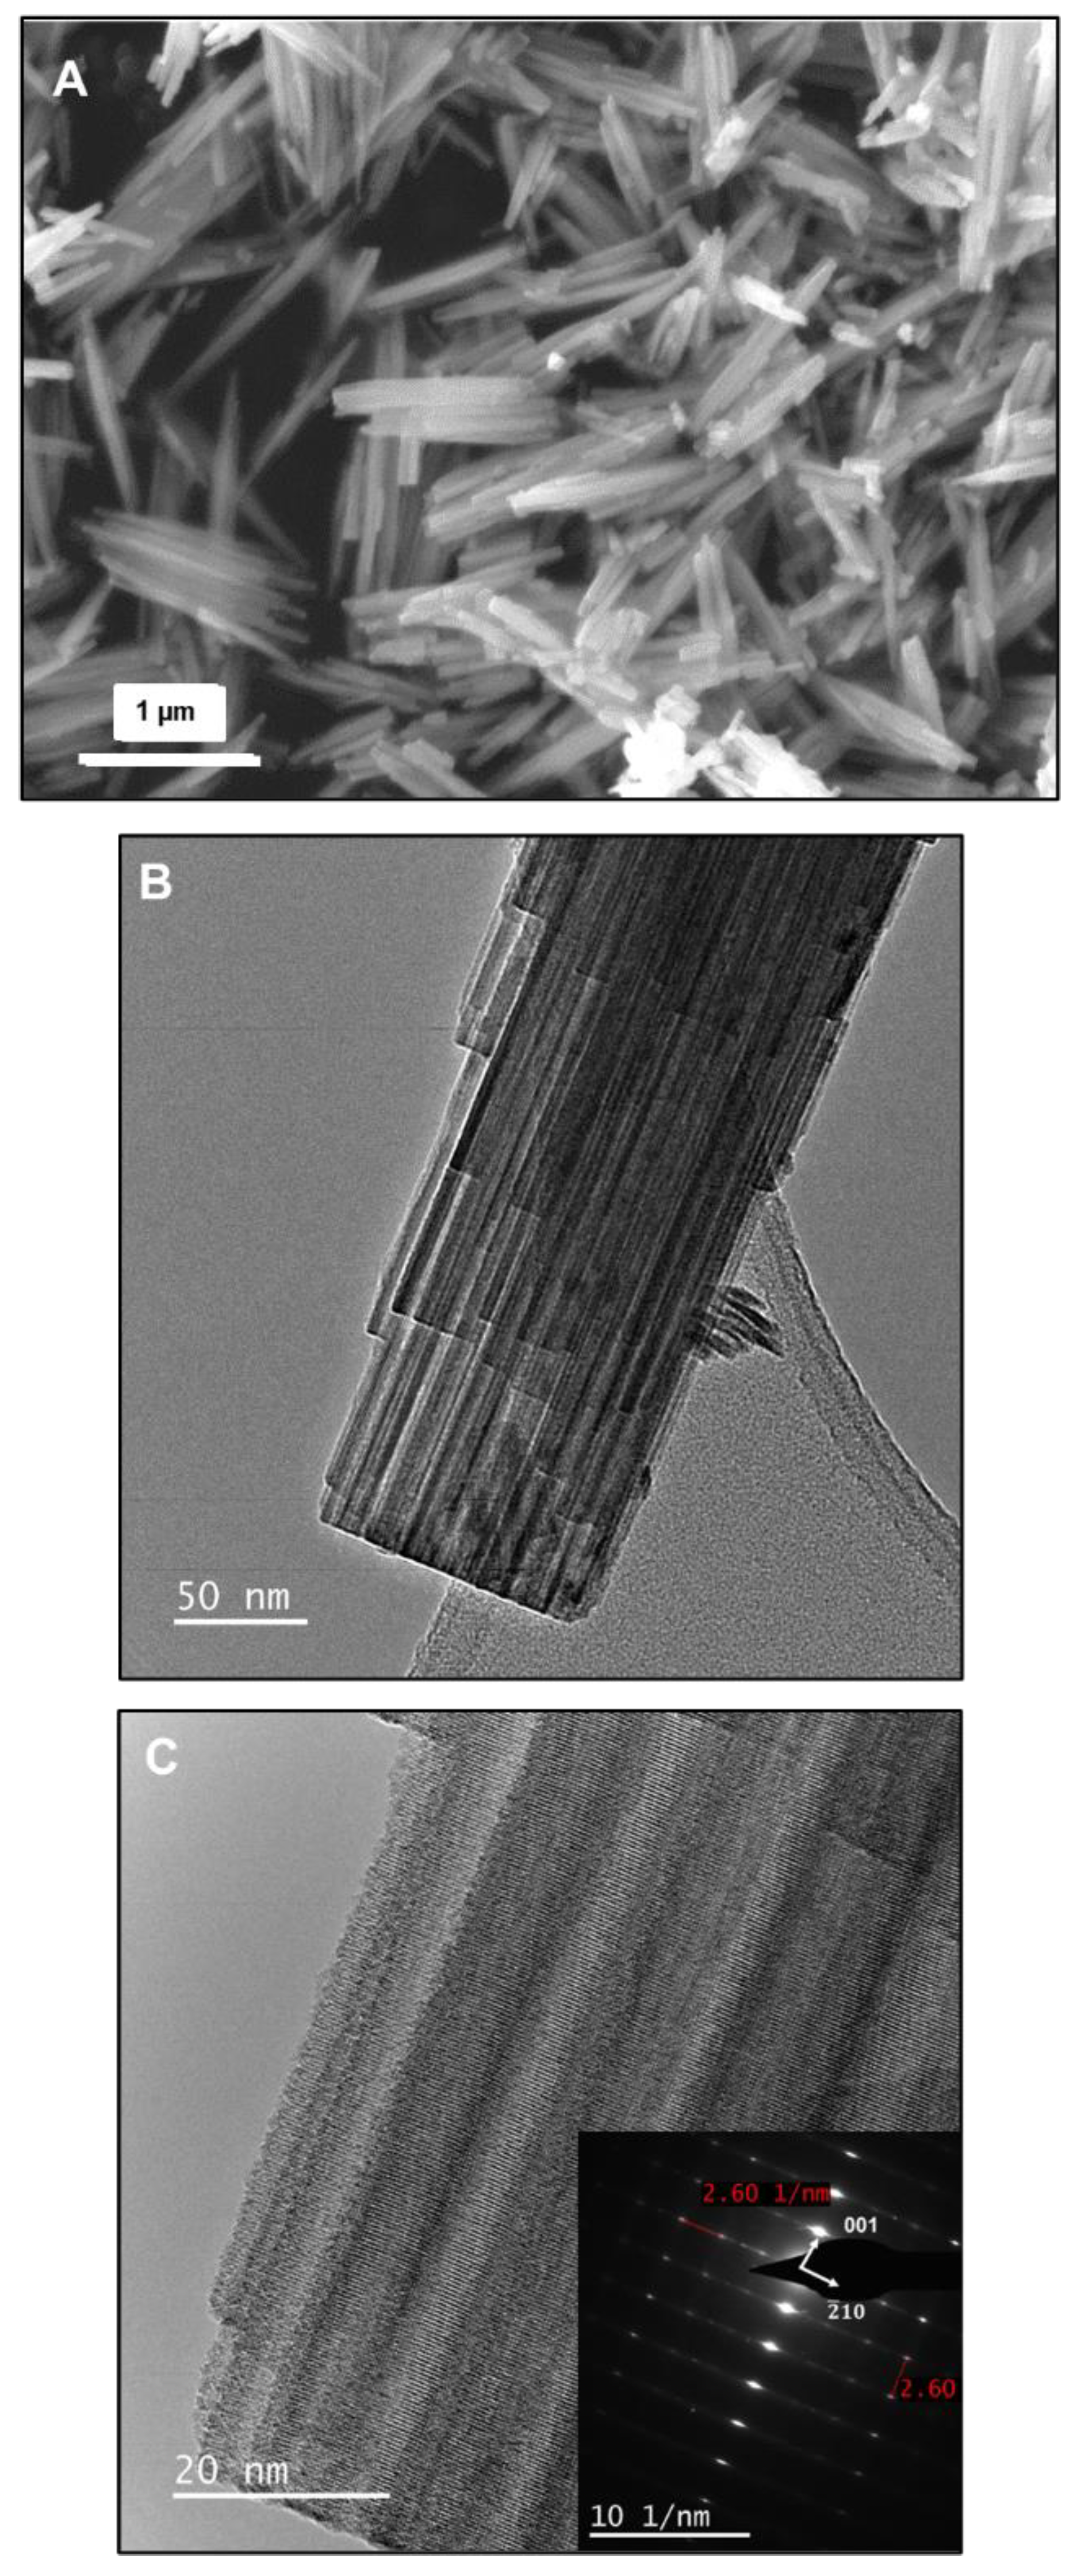
Abstract
1. Introduction
2. Materials and Methods
2.1. Hydrothermal Synthesis of Li-HTB
2.2. Physico-Chemical Characterization
2.3. Electrochemical Characterization and Electrode Preparation
2.4. In-Situ and Operando Setups
2.4.1. Electrochemical Quartz Crystal Microbalance (EQCM)
2.4.2. X-ray Absorption Spectroscopy
3. Results
3.1. Materials Characterization
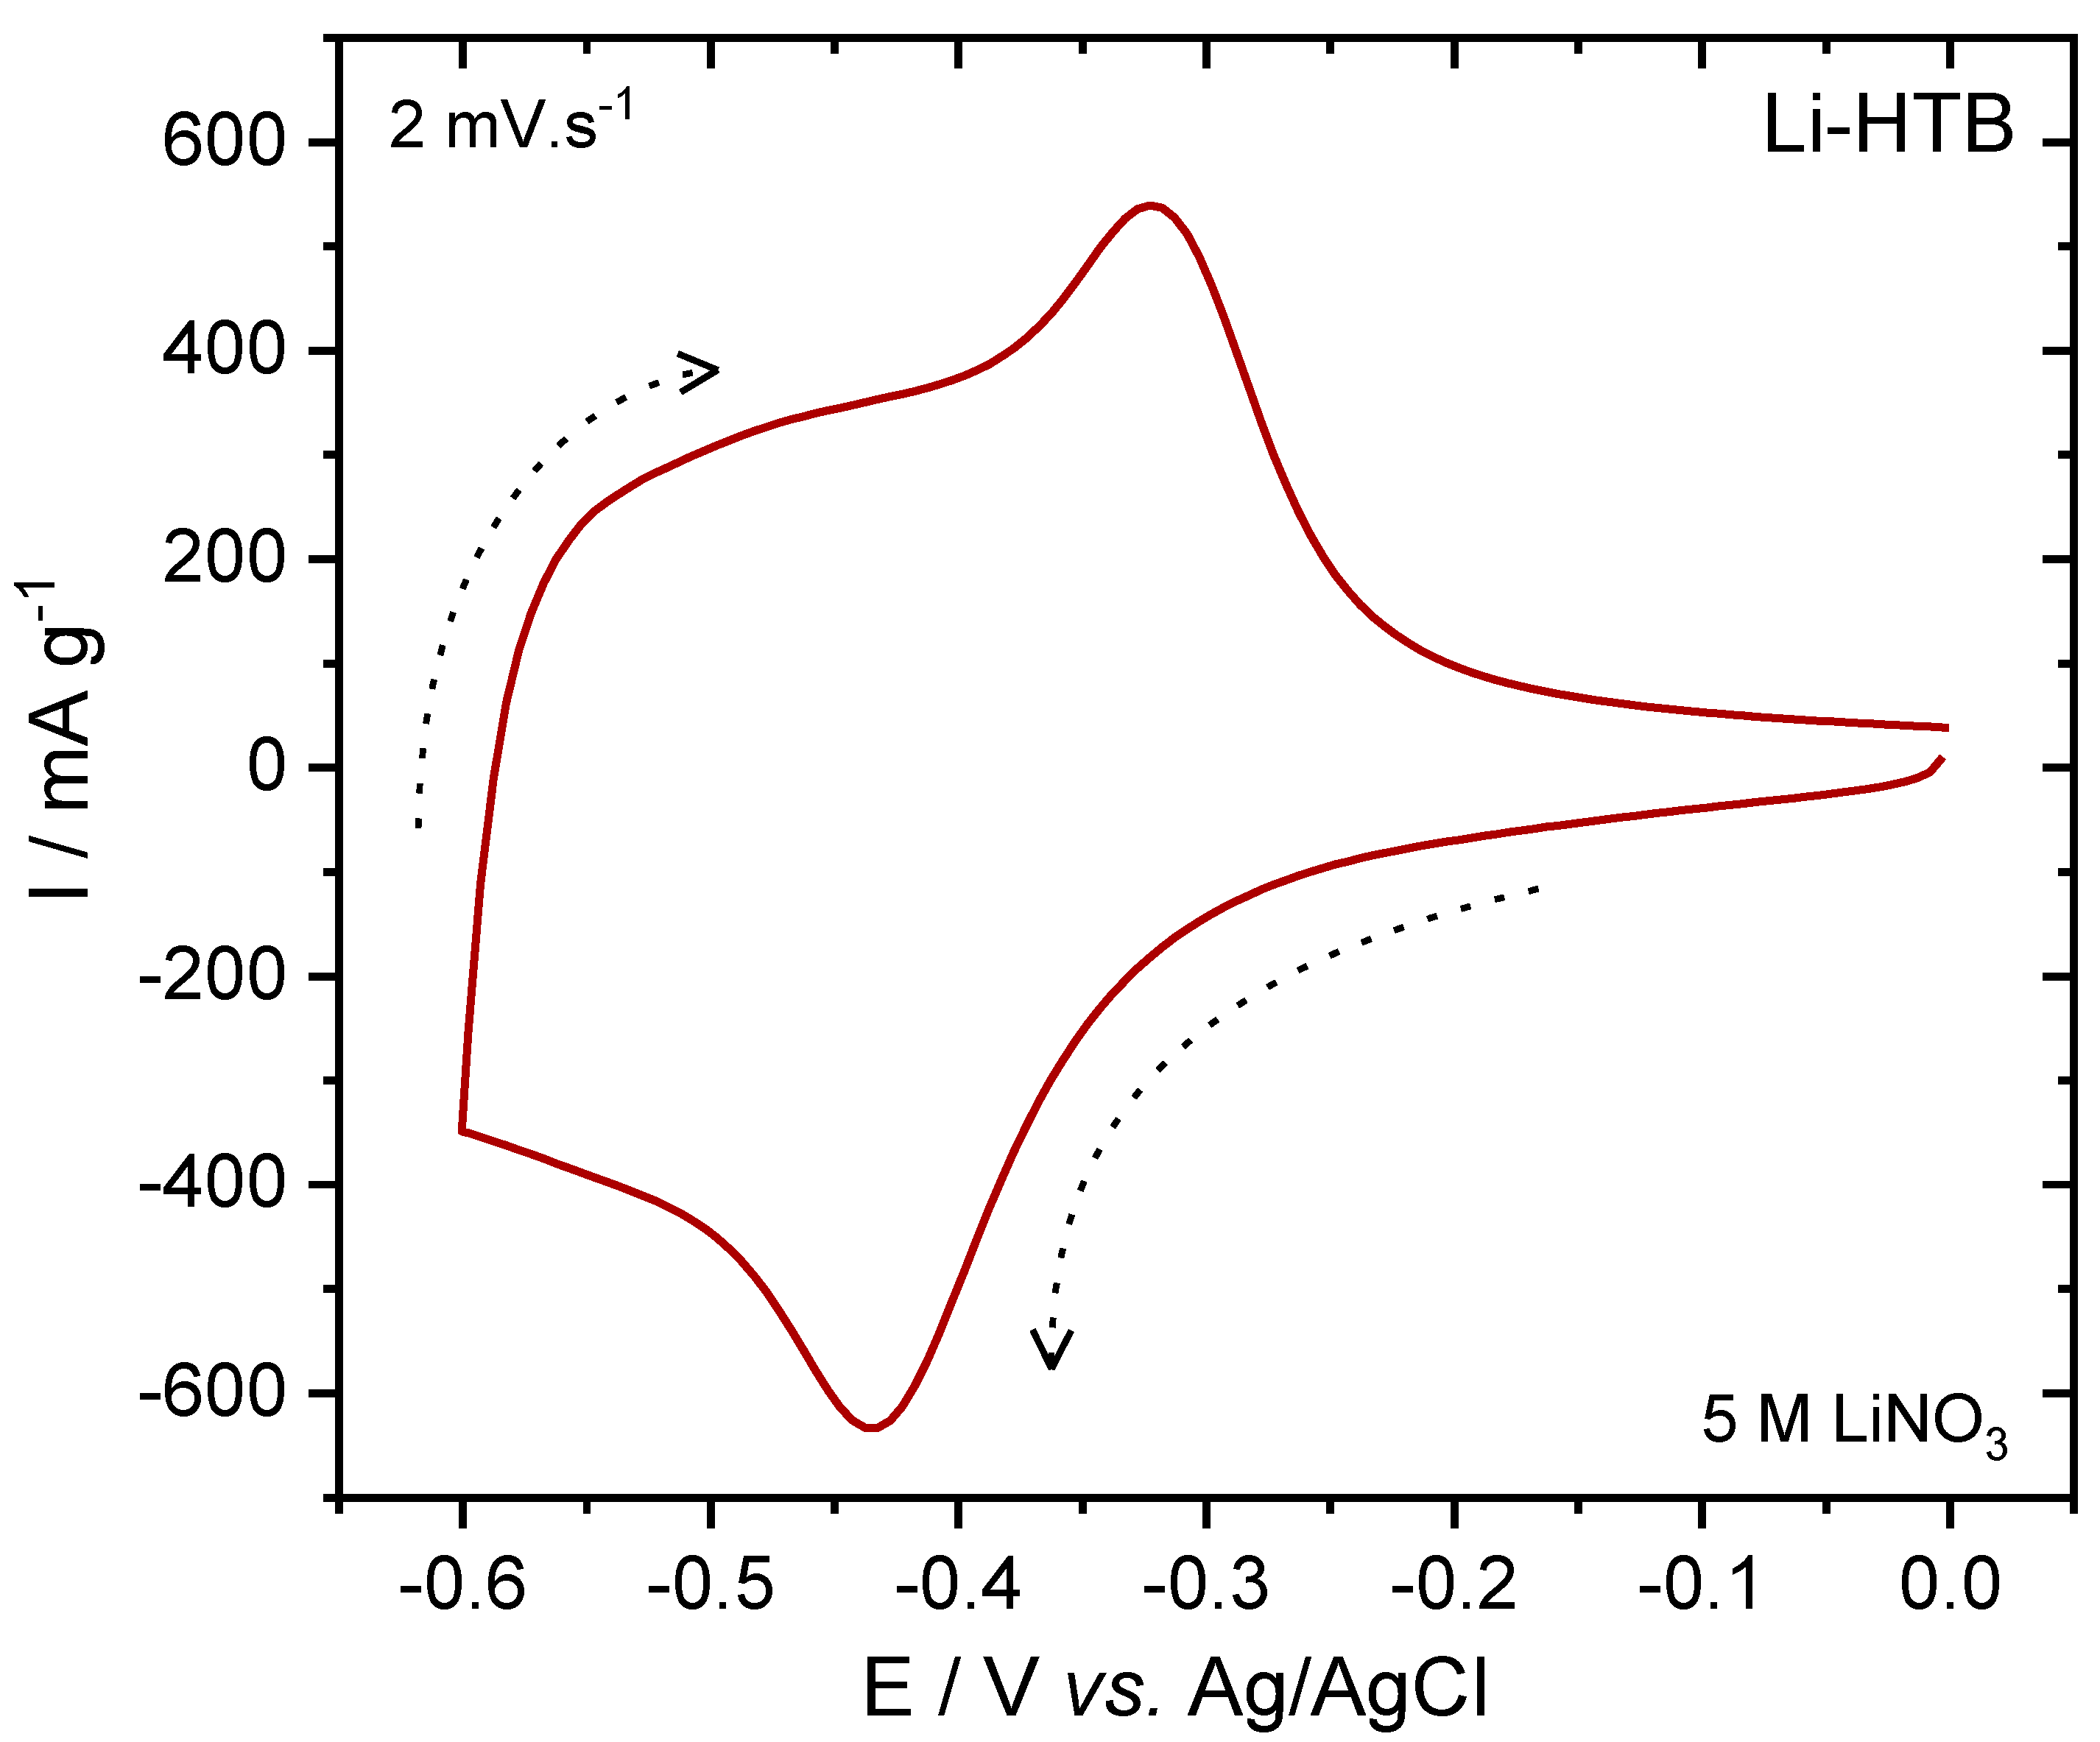
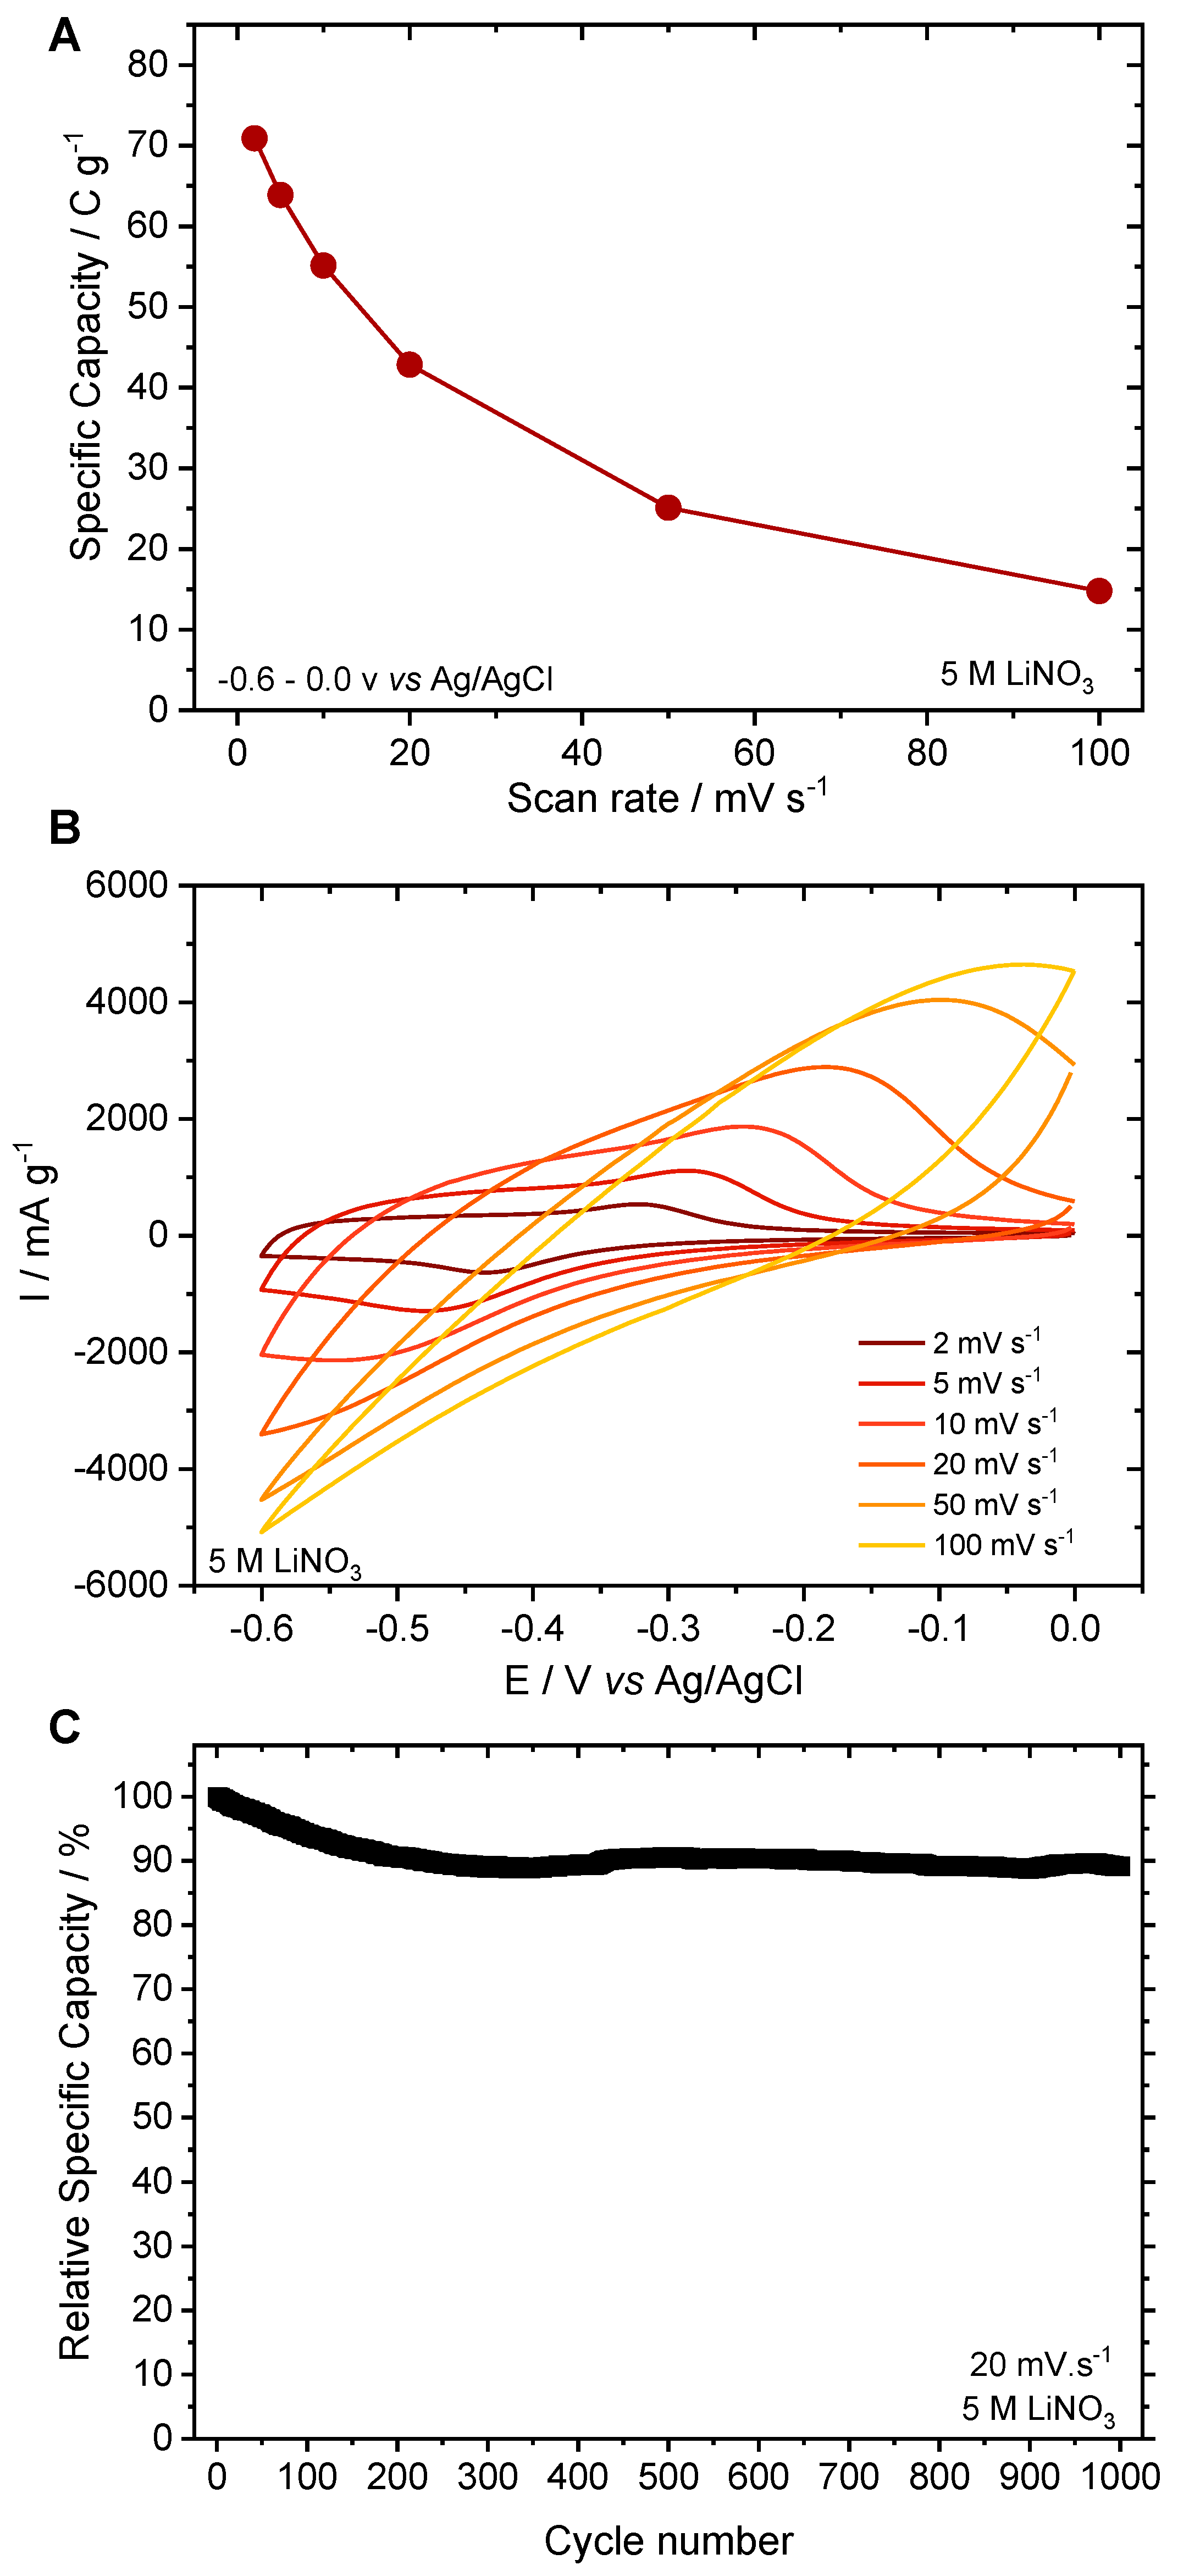
3.2. Electrochemical Characterization
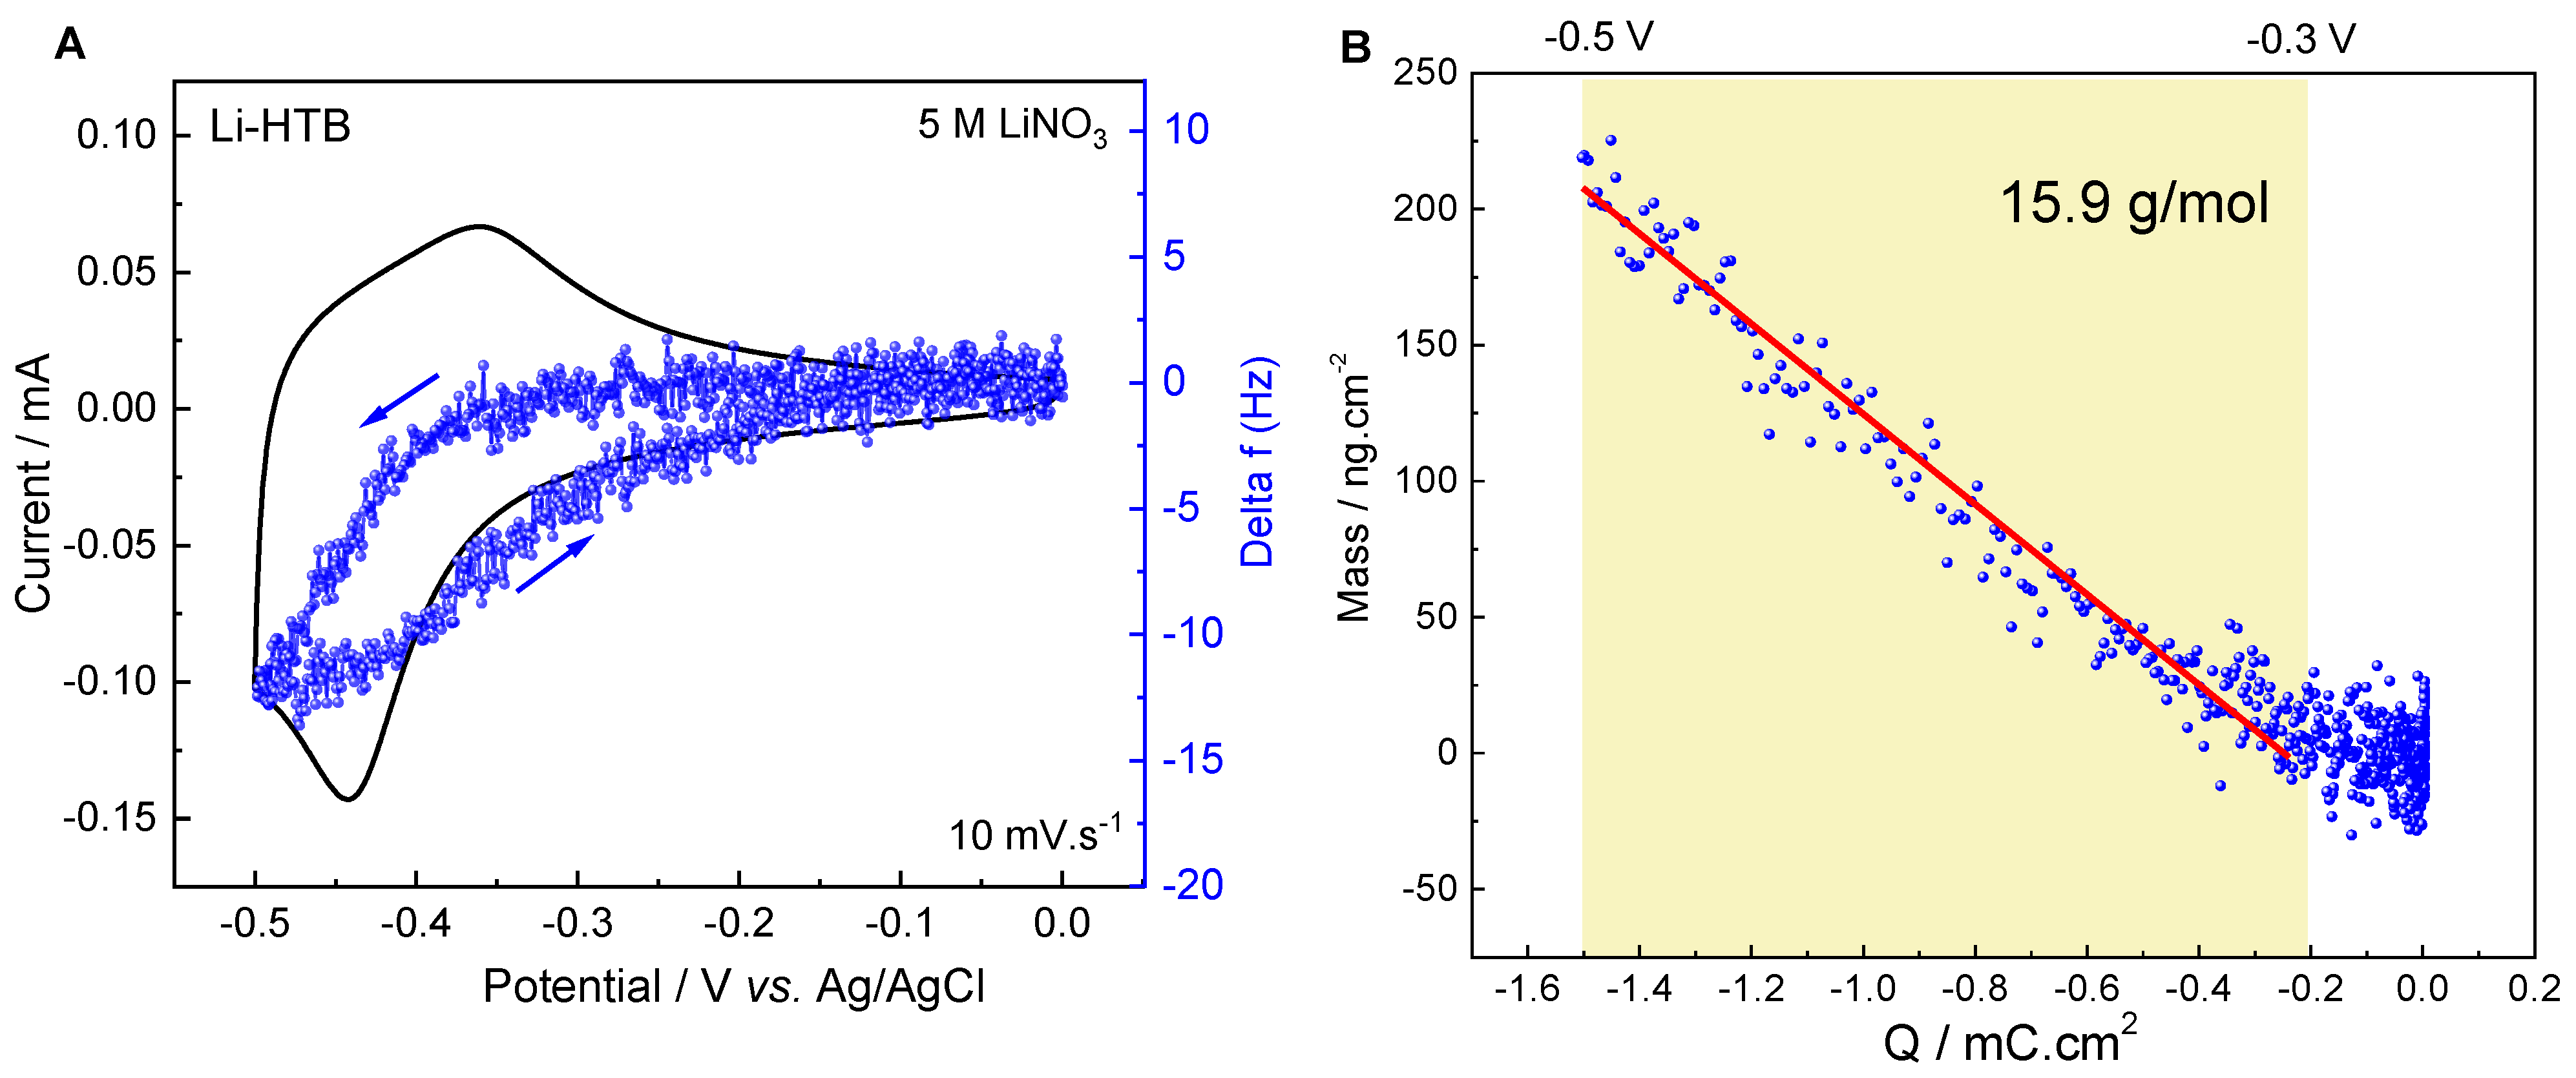
3.3. Charge Storage Mechanism Investigation
3.4. Electrochemical Study Using Various Concentrations of LiNO3
4. Conclusions
Supplementary Materials
Author Contributions
Funding
Data Availability Statement
Acknowledgments
Conflicts of Interest
References
- Dunn, B.; Kamath, H.; Tarascon, J.-M. Electrical Energy Storage for the Grid: A Battery of Choices. Science 2011, 334, 928–935. [Google Scholar] [CrossRef] [PubMed]
- Simon, P.; Gogotsi, Y. Perspectives for Electrochemical Capacitors and Related Devices. Nat. Mater. 2020, 19, 1151–1163. [Google Scholar] [CrossRef] [PubMed]
- Tarascon, J.-M.; Armand, M. Issues and Challenges Facing Rechargeable Lithium Batteries. Nature 2001, 414, 359–367. [Google Scholar] [CrossRef] [PubMed]
- Wang, J.; Polleux, J.; Lim, J.; Dunn, B. Pseudocapacitive Contributions to Electrochemical Energy Storage in TiO2 (Anatase) Nanoparticles. J. Phys. Chem. C 2007, 111, 14925–14931. [Google Scholar] [CrossRef]
- Kavan, L.; Kalbáč, M.; Zukalová, M.; Exnar, I.; Lorenzen, V.; Nesper, R.; Graetzel, M. Lithium Storage in Nanostructured TiO2 Made by Hydrothermal Growth. Chem. Mater. 2004, 16, 477–485. [Google Scholar] [CrossRef]
- Augustyn, V.; Simon, P.; Dunn, B. Pseudocapacitive Oxide Materials for High-Rate Electrochemical Energy Storage. Energy Environ. Sci. 2014, 7, 1597. [Google Scholar] [CrossRef]
- Brousse, T.; Bélanger, D.; Long, J.W. To Be or Not to Be Pseudocapacitive? J. Electrochem. Soc. 2015, 162, A5185–A5189. [Google Scholar] [CrossRef]
- Li, J.; Tang, Z.; Zhang, Z. Layered Hydrogen Titanate Nanowires with Novel Lithium Intercalation Properties. Chem. Mater. 2005, 17, 5848–5855. [Google Scholar] [CrossRef]
- Li, J.; Tang, Z.; Zhang, Z. H-Titanate Nanotube: A Novel Lithium Intercalation Host with Large Capacity and High Rate Capability. Electrochem. Commun. 2005, 7, 62–67. [Google Scholar] [CrossRef]
- Wei, M.; Wei, K.; Ichihara, M.; Zhou, H. High Rate Performances of Hydrogen Titanate Nanowires Electrodes. Electrochem. Commun. 2008, 10, 1164–1167. [Google Scholar] [CrossRef]
- Zhu, G.-N.; Wang, C.-X.; Xia, Y.-Y. Structural Transformation of Layered Hydrogen Trititanate (H2Ti3O7) to TiO2(B) and Its Electrochemical Profile for Lithium-Ion Intercalation. J. Power Sources 2011, 196, 2848–2853. [Google Scholar] [CrossRef]
- Wang, Y.; Hong, Z.; Wei, M.; Xia, Y. Layered H2Ti6O13-Nanowires: A New Promising Pseudocapacitive Material in Non-Aqueous Electrolyte. Adv. Funct. Mater. 2012, 22, 5185–5193. [Google Scholar] [CrossRef]
- Ohzuku, T.; Sawai, K.; Hirai, T. Electrochemistry of L-Niobium Pentoxide a Lithium/Non-Aqueous Cell. J. Power Sources 1987, 19, 287–299. [Google Scholar] [CrossRef]
- Brezesinski, K.; Wang, J.; Haetge, J.; Reitz, C.; Steinmueller, S.O.; Tolbert, S.H.; Smarsly, B.M.; Dunn, B.; Brezesinski, T. Pseudocapacitive Contributions to Charge Storage in Highly Ordered Mesoporous Group V Transition Metal Oxides with Iso-Oriented Layered Nanocrystalline Domains. J. Am. Chem. Soc. 2010, 132, 6982–6990. [Google Scholar] [CrossRef] [PubMed]
- Kim, J.W.; Augustyn, V.; Dunn, B. The Effect of Crystallinity on the Rapid Pseudocapacitive Response of Nb2O5. Adv. Energy Mater. 2012, 2, 141–148. [Google Scholar] [CrossRef]
- Augustyn, V.; Come, J.; Lowe, M.A.; Kim, J.W.; Taberna, P.-L.; Tolbert, S.H.; Abruña, H.D.; Simon, P.; Dunn, B. High-Rate Electrochemical Energy Storage through Li+ Intercalation Pseudocapacitance. Nat. Mater. 2013, 12, 518–522. [Google Scholar] [CrossRef]
- Zheng, H.; Ou, J.Z.; Strano, M.S.; Kaner, R.B.; Mitchell, A.; Kalantar-zadeh, K. Nanostructured Tungsten Oxide—Properties, Synthesis, and Applications. Adv. Funct. Mater. 2011, 21, 2175–2196. [Google Scholar] [CrossRef]
- Granqvist, C.G. Electrochromic Materials: Microstructure, Electronic Bands, and Optical Properties. Appl. Phys. A 1993, 57, 3–12. [Google Scholar] [CrossRef]
- Gao, T.; Jelle, B.P. Visible-Light-Driven Photochromism of Hexagonal Sodium Tungsten Bronze Nanorods. J. Phys. Chem. C 2013, 117, 13753–13761. [Google Scholar] [CrossRef]
- Gao, T.; Jelle, B.P. Electrochromism of Hexagonal Sodium Tungsten Bronze Nanorods. Sol. Energy Mater Sol. Cells. 2018, 177, 3–8. [Google Scholar] [CrossRef]
- Besnardiere, J.; Ma, B.; Torres-Pardo, A.; Wallez, G.; Kabbour, H.; González-Calbet, J.M.; Von Bardeleben, H.J.; Fleury, B.; Buissette, V.; Sanchez, C.; et al. Structure and Electrochromism of Two-Dimensional Octahedral Molecular Sieve h’-WO3. Nat. Commun. 2019, 10, 327. [Google Scholar] [CrossRef] [PubMed]
- Shinde, P.A.; Jun, S.C. Review on Recent Progress in the Development of Tungsten Oxide Based Electrodes for Electrochemical Energy Storage. ChemSusChem 2020, 13, 11–38. [Google Scholar] [CrossRef] [PubMed]
- Mitchell, J.B.; Lo, W.C.; Genc, A.; LeBeau, J.; Augustyn, V. Transition from Battery to Pseudocapacitor Behavior via Structural Water in Tungsten Oxide. Chem. Mater. 2017, 29, 3928–3937. [Google Scholar] [CrossRef]
- Mitchell, J.B.; Geise, N.R.; Paterson, A.R.; Osti, N.C.; Sun, Y.; Fleischmann, S.; Zhang, R.; Madsen, L.A.; Toney, M.F.; Jiang, D.; et al. Confined Interlayer Water Promotes Structural Stability for High-Rate Electrochemical Proton Intercalation in Tungsten Oxide Hydrates. ACS Energy Lett. 2019, 4, 2805–2812. [Google Scholar] [CrossRef]
- Magnéli, A. Tungsten Bronzes Containing Six-Membered Rings of WO6 Octahedra. Nature 1952, 169, 791–792. [Google Scholar] [CrossRef]
- Gerand, B.; Nowogrocki, G.; Guenot, J.; Figlarz, M. Structural Study of a New Hexagonal Form of Tungsten Trioxide. J. Solid State Chem. 1979, 29, 429–434. [Google Scholar] [CrossRef]
- Gerand, B.; Nowogrocki, G.; Figlarz, M. A New Tungsten Trioxide Hydrate, WO3*1/3H2O: Preparation, Characterization, and Crystallographic Study. J. Solid State Chem. 1981, 38, 312–320. [Google Scholar] [CrossRef]
- Reis, K.P.; Ramanan, A.; Whittingham, M.S. Hydrothermal Synthesis of Sodium Tungstates. Chem. Mater. 1990, 2, 219–221. [Google Scholar] [CrossRef]
- Reis, K.P.; Prince, E.; Whittingham, M.S. Rietveld Analysis of Sodium Tungstate Hydrate NaxWO3+x/2.YH2O, Which Has the Hexagonal Tungsten Bronze Structure. Chem. Mater. 1992, 4, 307–312. [Google Scholar] [CrossRef]
- Reis, K.P.; Ramanan, A.; Whittingham, M.S. Synthesis of Novel Compounds with the Pyrochlore and Hexagonal Tungsten Bronze Structures. J. Solid State Chem. 1992, 96, 31–47. [Google Scholar] [CrossRef]
- Kumagai, N.; Kumagai, N.; Tanno, K. Electrochemical and Structural Characteristics of Tungstic Acids as Cathode Materials for Lithium Batteries. Appl. Phys. A 1989, 49, 83–89. [Google Scholar] [CrossRef]
- Kumagai, N.; Matsuura, Y.; Kumagai, N.; Tanno, K. Kinetic and Structural Studies of the Electrochemical Insertion of Lithium into Hexagonal-Type x(A2O) WO3. J. Electrochem. Soc. 1992, 139, 3553–3558. [Google Scholar] [CrossRef]
- Pereira-Ramos, J.-P. Electrochemical Properties of Cathodic Materials Synthesized by Low-Temperature Techniques. J. Power Sources 1995, 54, 120–126. [Google Scholar] [CrossRef]
- Kumagai, N.; Kumagai, N.; Umetzu, Y.; Tanno, K.; Pereira-Ramos, J.P. Synthesis of Hexagonal Form of Tungsten Trioxide and Electrochemical Lithium Insertion into the Trioxide. Solid State Ion. 1996, 86–88, 1443–1449. [Google Scholar] [CrossRef]
- Gu, Z.; Ma, Y.; Zhai, T.; Gao, B.; Yang, W.; Yao, J. A Simple Hydrothermal Method for the Large-Scale Synthesis of Single-Crystal Potassium Tungsten Bronze Nanowires. Chem. Eur. J 2006, 12, 7717–7723. [Google Scholar] [CrossRef]
- Wang, J.; Khoo, E.; Lee, P.S.; Ma, J. Synthesis, Assembly, and Electrochromic Properties of Uniform Crystalline WO3 Nanorods. J. Phys. Chem. C 2008, 112, 14306–14312. [Google Scholar] [CrossRef]
- Lee, J.-S.; Liu, H.-C.; Peng, G.-D.; Tseng, Y. Facile Synthesis and Structure Characterization of Hexagonal Tungsten Bronzes Crystals. J. Cryst. Growth 2017, 465, 27–33. [Google Scholar] [CrossRef]
- Miao, B.; Zeng, W.; Hussain, S.; Mei, Q.; Xu, S.; Zhang, H.; Li, Y.; Li, T. Large Scale Hydrothermal Synthesis of Monodisperse Hexagonal WO3 Nanowire and the Growth Mechanism. Mater. Lett. 2015, 147, 12–15. [Google Scholar] [CrossRef]
- Petříček, V.; Dušek, M.; Palatinus, L. Crystallographic Computing System JANA2006: General Features. Z. Kristallogr. Krist. 2014, 229, 345–352. [Google Scholar] [CrossRef]
- Brousse, T.; Taberna, P.-L.; Crosnier, O.; Dugas, R.; Guillemet, P.; Scudeller, Y.; Zhou, Y.; Favier, F.; Bélanger, D.; Simon, P. Long-Term Cycling Behavior of Asymmetric Activated Carbon/MnO2 Aqueous Electrochemical Supercapacitor. J. Power Sources 2007, 173, 633–641. [Google Scholar] [CrossRef]
- Gogotsi, Y.; Simon, P. True Performance Metrics in Electrochemical Energy Storage. Science 2011, 334, 917–918. [Google Scholar] [CrossRef]
- Briois, V.; La Fontaine, C.; Belin, S.; Barthe, L.; Moreno, T.; Pinty, V.; Carcy, A.; Girardot, R.; Fonda, E. ROCK: The New Quick-EXAFS Beamline at SOLEIL. J. Phys. Conf. Ser. 2016, 712, 012149. [Google Scholar] [CrossRef]
- Goubard-Bretesché, N.; Crosnier, O.; Douard, C.; Iadecola, A.; Retoux, R.; Payen, C.; Doublet, M.; Kisu, K.; Iwama, E.; Naoi, K.; et al. Unveiling Pseudocapacitive Charge Storage Behavior in FeWO4 Electrode Material by Operando X-ray Absorption Spectroscopy. Small 2020, 16, 2002855. [Google Scholar] [CrossRef]
- Fleischmann, S.; Shao, H.; Taberna, P.-L.; Rozier, P.; Simon, P. Electrochemically Induced Deformation Determines the Rate of Lithium Intercalation in Bulk TiS2. ACS Energy Lett. 2021, 6, 4173–4178. [Google Scholar] [CrossRef]
- Trasatti, S. Effect of the Nature of the Metal on the Dielectric Properties of Polar Liquids at the Interface with Electrodes. A Phenomenological Approach. J. Electroanal. Chem. Interfacial Electrochem. 1981, 123, 121–139. [Google Scholar] [CrossRef]
- Ribnick, A.S.; Post, B.; Banks, E. Phase Transitions in Sodium Tungsten Bronzes. In Nonstoichiometric Compounds; Advances in Chemistry; American Chemical Society: Washington, DC, USA, 1963; Volume 39, ISBN 978-0-8412-0040-1. [Google Scholar]
- Dickens, P.G.; Whittingham, M.S. The Tungsten Bronzes and Related Compounds. Q. Rev. Chem. Soc. 1968, 22, 30. [Google Scholar] [CrossRef]
- Wu, Y.-C.; Taberna, P.-L.; Simon, P. Tracking Ionic Fluxes in Porous Carbon Electrodes from Aqueous Electrolyte Mixture at Various PH. Electrochem. Commun. 2018, 93, 119–122. [Google Scholar] [CrossRef]
- Shao, H.; Xu, K.; Wu, Y.-C.; Iadecola, A.; Liu, L.; Ma, H.; Qu, L.; Raymundo-Piñero, E.; Zhu, J.; Lin, Z.; et al. Unraveling the Charge Storage Mechanism of Ti3C2Tx MXene Electrode in Acidic Electrolyte. ACS Energy Lett. 2020, 5, 2873–2880. [Google Scholar] [CrossRef]
- Darwiche, A.; Murgia, F.; Fehse, M.; Mahmoud, A.; Iadecola, A.; Belin, S.; La Fontaine, C.; Briois, V.; Hermann, R.P.; Fraisse, B.; et al. Operando X-ray Absorption Spectroscopy Applied to Battery Materials at ICGM: The Challenging Case of BiSb’s Sodiation. Energy Storage Mater. 2019, 21, 1–13. [Google Scholar] [CrossRef]
- Robert, K.; Stiévenard, D.; Deresmes, D.; Douard, C.; Iadecola, A.; Troadec, D.; Simon, P.; Nuns, N.; Marinova, M.; Huvé, M.; et al. Novel Insights into the Charge Storage Mechanism in Pseudocapacitive Vanadium Nitride Thick Films for High-Performance on-Chip Micro-Supercapacitors. Energy Environ. Sci. 2020, 13, 949–957. [Google Scholar] [CrossRef]
- Khyzhun, O.Y. XPS, XES and XAS Studies of the Electronic Structure of Tungsten Oxides. J. Alloys Compd. 2000, 305, 1–6. [Google Scholar] [CrossRef]
- Pauporté, T.; Soldo-Olivier, Y.; Faure, R. In-situ X-ray Absorption Spectroscopy Study of Lithium Insertion into Sputtered WO3 Thin Films. J. Electroanal. Chem. 2004, 562, 111–116. [Google Scholar] [CrossRef]
- Nam, K.-W.; Kim, M.G.; Kim, K.-B. In-situ Mn K-Edge X-ray Absorption Spectroscopy Studies of Electrodeposited Manganese Oxide Films for Electrochemical Capacitors. J. Phys. Chem. C 2007, 111, 749–758. [Google Scholar] [CrossRef]
- Chang, J.-K.; Lee, M.-T.; Tsai, W.-T. In-situ Mn K-Edge X-ray Absorption Spectroscopic Studies of Anodically Deposited Manganese Oxide with Relevance to Supercapacitor Applications. J. Power Sources 2007, 166, 590–594. [Google Scholar] [CrossRef]
- Kuo, S.-L.; Lee, J.-F.; Wu, N.-L. Study on Pseudocapacitance Mechanism of Aqueous MnFe2O4 Supercapacitor. J. Electrochem. Soc. 2006, 154, A34–A38. [Google Scholar] [CrossRef]
- Fehse, M.; Iadecola, A.; Sougrati, M.T.; Conti, P.; Giorgetti, M.; Stievano, L. Applying Chemometrics to Study Battery Materials: Towards the Comprehensive Analysis of Complex Operando Datasets. Energy Storage Mater. 2019, 18, 328–337. [Google Scholar] [CrossRef]
- Suo, L.; Borodin, O.; Gao, T.; Olguin, M.; Ho, J.; Fan, X.; Luo, C.; Wang, C.; Xu, K. “Water-in-Salt” Electrolyte Enables High-Voltage Aqueous Lithium-Ion Chemistries. Science 2015, 350, 938–943. [Google Scholar] [CrossRef]
- Ohtaki, H.; Radnai, T. Structure and Dynamics of Hydrated Ions. Chem. Rev. 1993, 93, 1157–1204. [Google Scholar] [CrossRef]
- Rempe, S.B.; Pratt, L.R.; Hummer, G.; Kress, J.D.; Martin, R.L.; Redondo, A. The Hydration Number of Li + in Liquid Water. J. Am. Chem. Soc. 2000, 122, 966–967. [Google Scholar] [CrossRef]
- Marcus, Y. Effect of Ions on the Structure of Water: Structure Making and Breaking. Chem. Rev. 2009, 109, 1346–1370. [Google Scholar] [CrossRef]
- Järvinen, M. Application of Symmetrized Harmonics Expansion to Correction of the Preferred Orientation Effect. J. Appl. Crystallogr. 1993, 26, 525–531. [Google Scholar] [CrossRef]
- Slade, R.C.T.; West, B.C.; Hall, G.P. Chemical and Electrochemical Mixed Alkali Metal Insertion Chemistry of the Hexagonal Tungsten Trioxide Framework. Solid State Ion. 1989, 32–33, 154–161. [Google Scholar] [CrossRef]
- Oi, J.; Kishimoto, A.; Kudo, T.; Hiratani, M. Hexagonal Tungsten Trioxide Obtained from Peroxo-Polytungstate and Reversible Lithium Electro-Intercalation into Its Framework. J. Solid State Chem. 1992, 96, 13–19. [Google Scholar] [CrossRef]
- Hoffmann, R.; Hoppe, R. Zwei neue Ordnungs-Varianten des NaCl-Typs: Li4MoO5 und Li4WO5. Z. Anorg. Allg. Chem. 1989, 573, 157–169. [Google Scholar] [CrossRef]
- Fourquet, J.L.; Le Bail, A.; Gillet, P.A. LiNbWO6: Crystal Structure of Its Two Allotropic Forms. Mater. Res. Bull. 1988, 23, 1163–1170. [Google Scholar] [CrossRef]
- Pralong, V.; Venkatesh, G.; Malo, S.; Caignaert, V.; Baies, R.; Raveau, B. Electrochemical Synthesis of a Lithium-Rich Rock-Salt-Type Oxide Li5W2O7 with Reversible Deintercalation Properties. Inorg. Chem. 2014, 53, 522–527. [Google Scholar] [CrossRef]
- Tsai, W.-Y. Ion Adsorption in Porous Carbon: From Fundamental Studies to Supercapacitor Applications. Ph.D. Thesis, Université Toulouse III-Paul Sabatier, Toulouse, France, 2015. [Google Scholar]


Disclaimer/Publisher’s Note: The statements, opinions and data contained in all publications are solely those of the individual author(s) and contributor(s) and not of MDPI and/or the editor(s). MDPI and/or the editor(s) disclaim responsibility for any injury to people or property resulting from any ideas, methods, instructions or products referred to in the content. |
© 2023 by the authors. Licensee MDPI, Basel, Switzerland. This article is an open access article distributed under the terms and conditions of the Creative Commons Attribution (CC BY) license (https://creativecommons.org/licenses/by/4.0/).
Share and Cite
Espinosa-Angeles, J.C.; Quarez, E.; Mvele Eyé’a, L.-B.; Douard, C.; Iadecola, A.; Shao, H.; Taberna, P.-L.; Simon, P.; Crosnier, O.; Brousse, T. Charge Storage Mechanism of LixWO3 Hexagonal Tungsten Bronze in Aqueous Electrolytes. Batteries 2023, 9, 136. https://doi.org/10.3390/batteries9020136
Espinosa-Angeles JC, Quarez E, Mvele Eyé’a L-B, Douard C, Iadecola A, Shao H, Taberna P-L, Simon P, Crosnier O, Brousse T. Charge Storage Mechanism of LixWO3 Hexagonal Tungsten Bronze in Aqueous Electrolytes. Batteries. 2023; 9(2):136. https://doi.org/10.3390/batteries9020136
Chicago/Turabian StyleEspinosa-Angeles, Julio César, Eric Quarez, Louis-Béni Mvele Eyé’a, Camille Douard, Antonella Iadecola, Hui Shao, Pierre-Louis Taberna, Patrice Simon, Olivier Crosnier, and Thierry Brousse. 2023. "Charge Storage Mechanism of LixWO3 Hexagonal Tungsten Bronze in Aqueous Electrolytes" Batteries 9, no. 2: 136. https://doi.org/10.3390/batteries9020136
APA StyleEspinosa-Angeles, J. C., Quarez, E., Mvele Eyé’a, L.-B., Douard, C., Iadecola, A., Shao, H., Taberna, P.-L., Simon, P., Crosnier, O., & Brousse, T. (2023). Charge Storage Mechanism of LixWO3 Hexagonal Tungsten Bronze in Aqueous Electrolytes. Batteries, 9(2), 136. https://doi.org/10.3390/batteries9020136