Article

On the Relations between Lithium-Ion Battery Reaction Entropy, Surface Temperatures and Degradation

by
Lena Spitthoff
1,
Markus Solberg Wahl
1,
Jacob Joseph Lamb
1,
Paul Robert Shearing
1,2,
Preben J. S. Vie
1,3 and
Odne Stokke Burheim
1,*
1
Department of Energy and Process Engineering, Norwegian University of Science and Technology (NTNU), 7491 Trondheim, Norway
2
The Electrochemical Innovation Lab, Department of Chemical Engineering, University College London (UCL), London WC1E 7JE, UK
3
Institute for Energy Technology (IFE), 2027 Kjeller, Norway
*
Author to whom correspondence should be addressed.
Batteries 2023, 9(5), 249; https://doi.org/10.3390/batteries9050249
Submission received: 5 March 2023 / Revised: 2 April 2023 / Accepted: 18 April 2023 / Published: 26 April 2023
(This article belongs to the Section Battery Performance, Ageing, Reliability and Safety)

Abstract

:
Understanding and mitigating the degradation of batteries is important for financial as well as environmental reasons. Many studies look at cell degradation in terms of capacity losses and the mechanisms causing them. However, in this study, we take a closer look at how degradation affects heat sources in batteries, thereby requiring dynamic cooling strategies for battery systems throughout the battery life. In this work, we have studied and compared reversible (entropy-related) and non-reversible heat sources in a commercial LCO-graphite lithium-ion battery (LIB) alongside measuring the surface temperature as a function of the State of Health (SoH). In addition, we studied the effect of different thermal management strategies on both degradation and cooling efficiency. We found that entropic heating plays a major role in overall heat generation. This causes large variations in heat generation and battery temperature over both State of Charge (SoC) and charge versus discharge. The maximum battery temperature increases when the cell degrades as irreversible heat generation increases. Temperature variations over the cell thickness are substantial and increase drastically when the cell degrades. In addition, significant increases in thickness were observed as a result of cell degradation. Furthermore, cycling at elevated temperatures resulted in a larger thickness increase with significant gas production.

1. Introduction

Battery temperature is well known to affect both performance and degradation [1,2,3,4,5]. In addition, anisotropic heat generation and heat transport properties can result in large temperature gradients that increase current and State of Charge (SoC) inhomogeneities, which may further accelerate degradation [6,7,8,9,10,11,12]. Both the effect of temperature and temperature gradients on the degradation of lithium-ion batteries (LIBs) have been investigated in the literature. Several studies have shown that the best capacity retention occurs at moderate temperatures (i.e., around 15–25 °C), while the capacity loss is accelerated both at lower and higher temperatures. The main causes for this behavior are usually attributed to lithium plating at low temperatures and accelerated solid electrolyte interphase (SEI) growth at high temperatures [1,3,5].
More recent studies have focused on decoupling thermal and non-thermal effects and investigating the effect of temperature gradients. Xu et al. [13] aimed to decouple the thermal and non-thermal effects of the discharge rate on the degradation by the use of a customized proportional–integral–derivative-controlled (PID-controlled) thermal system to allow for a constant battery surface temperature. The study was conducted using 3.3 Ah pouch cells with lithium-cobalt-oxide (LCO) and lithium-nickel-cobalt-aluminium-oxide (NCA) blended cathode and a graphite anode. Comparing 3.3 Ah pouch cells (LCO-NCA blend/Graphite) cycled at a constant surface temperature of 45 °C with cells cycled at an ambient temperature of 45 °C, they found the thermal effect of a discharge rate of 3 C to be accountable for 26% of the capacity loss after 1100 cycles. Werner et al. [5,14] investigated the effect of inhomogeneous in-plane temperature distribution (both steady state and transient) on degradation during cycling. They pointed out that inhomogeneous aging mechanisms occur according to the local temperature. Cavalheiro et al. [7] and Malabet et al. [15] investigated the degradation in a cell stack with parallel-connected LIB with non-uniform temperature distribution. They found that inhomogeneous temperature distributions increased the thickness of the SEI layer inhomogeneously and contributed to the formation of lithium (Li) plating regions. In addition, they found that microstructural particle cracking and lithium plating was causing a drastical reduction in the anode porosity, hindering lithium diffusion and resulting in an abrupt failure of the middle cell. Carter et al. [6] showed that thermal gradients expedite degradation while the direction of the inter-electrode thermal gradient determines which electrode degrades. Troxler et al. [16] showed that when a temperature gradient was imposed over the cell thickness, the cell did not perform comparable to a cell at the uniform average temperate of this gradient, but rather similar to a cell at a higher temperature than the average temperature of this gradient. An increase in this gradient resulted in a larger deviation from the behavior of a cell with a uniform average temperature.
On the other hand, elevated temperature, as well as the cell heat generation rate, has also gained attention as a possible solution to improve fast charging or enable State of Health (SoH) estimation. Wang et al. [17] utilized the self-heating phenomenon to allow for fast charging at low-temperature environments by incorporating a passive Ni layer which allowed rapid heating of the adjacent cells. With this, they enabled charging at high temperatures and discharging at low temperatures while keeping the time spent at a high-temperature level as short as possible, achieving 2000 fast-charge cycles in energy-dense lithium-manganese-cobalt-oxide (NMC) LIB pouch cells. Carter et al. [18] pointed out the benefits of not only using external thermal management systems but rather engineering cell components with a focus on optimal thermal management, highlighting the importance of local temperature in cells. Yang et al. [19] proposed using the change in surface temperature during constant current charge to estimate the battery capacity by analyzing differential thermal voltammetry curves throughout the degradation process. Wu et al. [20] proposed using temperature variations induced by entropy change as an SoH estimator.
What is ultimately important when specifying a thermal management system, is that the battery temperature is kept in an optimal operating range both at Beginning-of-Life (BoL) and End-of-Life (EoL). As heat generation rates and internal heat transport change due to degradation, so do the requirements for the system. Knowledge of how degradation affects heat generation and heat transport (both internally and externally) is needed.
Heat generation is usually separated into reversible and irreversible heat generation. The irreversible heat generation is caused by transport resistance in the solid and electrolyte phase (Ohmic), charge transfer resistance, and mass transfer limitations [21]. In addition, there is heat released or absorbed reversibly. These reversible heat effects are entropy ( Δ S )-related (i.e., T Δ S F j ). The overall reversible heat effect is given by the entropy of the cell reaction [21,22]. Entropy change can either act as a heat sink or source. Irreversible heating due to the different cell resistances has been shown to increase at lower temperatures and as the cell ages [23,24,25]. Diaz et al. [24] experimentally confirmed an exponential decrease in irreversible heating with increasing temperature. This is in agreement with studies showing that both the Ohmic and charge transfer resistance decrease exponentially with increasing temperature, following the Arrhenius law [16]. Troxler et al. [16] found that a cell with a temperature gradient maintained over the thickness of the cell (through-plane) has a lower impedance than one at the same average temperature but with a uniform distribution. They attributed this observation to the non-linear relationship between temperature and charge transfer resistance as well as the inner structure of the cell. When the cell degrades, resistances increase, resulting in increased heat generation. Reversible heating has been shown to dominate the total heat generation at high temperatures and low currents [25]. Especially for LCO/graphite cells, reversible heating has been found to be responsible for a significant share of the total heat generation rate at the BoL. It impacts the battery temperature substantially [26,27]. Moreover, in certain SoC ranges, the reversible heat generation rate can be relatively high and dominate the total heat generation.
Several groups have studied the heat generation rate as a function of SoC [23,24,28,29]. In general, a substantial variation with SoC was found, but the heat generation SoC dependency appeared to be chemistry dependent. Liu et al. [23] found that the effect of degradation on the heat generation is more extreme during charge for an LCO/graphite cell.
The heat transport inside the battery is determined by the effective thermal conductivity of the full cell. The external heat transport depends on the cooling system used. It has been found that the most effective method of cooling a battery is surface cooling (i.e., through the side-faces of a pouch cell), either in contact with cooling blocks, by immersion in cooling liquids or convective air cooling [30]. In general, liquid cooling systems are more effective than air-based systems, although heavier and more complex [30,31]. One of the main drawbacks of surface cooling pouch cells is that it generates layer-to-layer non-uniformities with regard to cycling temperature, which has been found to reduce the performance and lifetime of the cells [7,32]. Due to the high thermal conductivity of the current collectors, tab cooling is therefore believed to give smaller thermal gradients if the cell and its cooling system are designed appropriately, and hence result in a more uniform current density [7,33].
In this paper, we present an experimental degradation study with a focus on changes in reversible and irreversible heat generation due to degradation. We compare the effectiveness of different thermal management systems during the lifetime of LIB by utilizing constant in-operando surface temperature measurement as well as investigating changes in the temperature distribution. Section 2 introduces the basic theory of heat generation, the entropy change of LIBs, and the relationship between degradation and battery temperature. Section 3 presents the experimental set-up. The results are presented in the following order: First, the entropy change of both BoL and EoL is presented (Section 4.1), and the reversible and irreversible heat generation as a function of SoH (Section 4.2). Section 4.3 to Section 4.5 present the measured surface temperature as a function of SoC (Section 4.3) and SoH (Section 4.4) as well as the temperature distribution (Section 4.5). Section 4.6 presents the capacity loss and resistance increase, and discusses the effect of thermal management systems and charging and discharging rates.

2. Theory

This section presents the required theory on heat generation, the entropy change of LIBs, and the relationship between degradation and battery temperature. The half-cell entropies of LCO (Section 2.2.1) and graphite (Section 2.2.2) are discussed, and a brief overview of entropy measurement techniques (Section 2.2.3) is presented. Section 2.3 discusses LIB degradation mechanisms with a focus on temperature dependencies.

2.1. Heat Generation

Bernardi et al. [34] derived a general energy balance for batteries. They showed that, for most cases, a simplified form is sufficient. This simplified form includes overpotential heat generation and entropic heat generation while neglecting heat generated by the enthalpy of mixing and reaction, as well as due to phase changes:
Q = Q r e v + Q i r r e v .
The reversible heat, Q r e v , can be calculated using the entropic coefficient U O C V T :
Q r e v = t U O C V T T I d t .
where U O C V is the open circuit voltage (OCV), T is the temperature, I is the current and t is the time.
The irreversible heat, Q i r r e v , is calculated from the overpotential. This is can be estimated from the difference between cell voltage (U) and OCV, integrated over a full cycle:
Q i r r e v = t U U O C V I d t .

2.2. Entropy

The intercalation in an LCO-Graphite LIB can be expressed as:
2 L i 0.5 C o O 2 + L i C 6 2 L i 0.5 + x C o O 2 + L i 1 2 x C 6 .
The corresponding entropy change of the full cell can be calculated from the half-cell entropy change:
Δ S c e l l = Δ S L i 0.5 + x C o O 2 + Δ S L i 1 2 x C 6 .
The entropy change of the full cell can also be estimated from the change in OCV with temperature:
Δ S c e l l n F U O C V T p , S o C
where n is the number of electrons per reaction, F is the Faraday constant.

2.2.1. Entropy Change of LCO

LCO (LixCoO2) has a layered rock-salt structure. Cobalt and Li atoms are located on octahedral sides. The structure consists of alternating layers of oxygen, cobalt, and Li atoms. Figure 1a presents the entropy change of LCO versus lithium metal. It is important to point out that studies have shown differences in measured entropy profiles for different commercial LCO used [35]. In general, a distinct negative entropy is observed at low electrode potentials. Thomas et al. [36] pointed out that this is aligned with the first-order phase transition from metal to semiconductor from x = 0.85 to 1.0. At medium to high electrode potentials, variations in entropy are reported—both positive and negative [35,36,37]. This is attributed to an order-disorder transition creating a monoclinic phase.

2.2.2. Entropy Change of Graphite

The intercation of Li atoms into graphite (LixC6) occurs through the formation of ordered stages. The entropy change for graphite versus Li metal is presented in Figure 1b. According to Thomas et al. [36], the entropy profile agrees well with the stage diagram, the entropy being constant where coexisting phases occur. The entropy of graphite versus Li metal is constant for 0.5 < x < 1.0 and corresponds to the coexistence of stages 1 and 2. The constant entropy for 0.25 < x < 0.5 is in agreement with the coexistence of 2 L and 2 at temperatures larger than 10 °C. For x < 0.25, there are no further plateaus. The entropy change from positive values to negative values in a rather sloping profile.

2.2.3. Measuring Entropy Change

The methods reported to measure entropy change can be classified into two groups: potentiometric [11,26,37,38,39,40] and calorimetric [41,42] measurements.
With the potentiometric method, entropy data are obtained by measuring the change in OCV as a function of temperature (based on Equation (6), Figure 2). The applied temperature variation has mostly been performed step-wise but linear temperature variations are also possible [37]. It is a discontinuous measurement of the entropy change consisting, in general, of the following steps: charge or discharge to a specific SoC, relaxation of the cell, and temperature variation while measuring the change in OCV. When using the full relaxation of the voltage after a charge and discharge to the OCV, the measurement becomes very time-consuming. Zhang et al. [39] reviewed the use of the potentiometric method to measure the change in entropy and found voltage relaxation times per SoC point of 3 h to 54 h. This results in measurements of several weeks to cover the full SoC range. A redesign of the measurement procedure has been suggested to save time [11,38]. Osswald et al. [11] showed that the measurement is sufficient even if the voltage is still relaxing towards equilibrium when compensating for the voltage drift. This improved potentiometric method with baseline correction allows for time reduction.
Calorimetric methods study the cell’s heat generation and estimate the entropy coefficient by analyzing the heat generation rates either by comparing temperature [43] or heat flux [44] from charge and discharge or by applying sinusoidal current [45].
In their review of entropy change measurement methods, Zhang et al. compared different methods in terms of trade-offs between time and accuracy. Zhang et al. [39] concluded that for batteries with lower internal resistance at low currents, a continuous measurement should be further studied. The potentiometric method was found to be most accurate for thin cells, while calorimetric methods required a further improvement of the signal-to-noise ratio, especially for large cells [40].

2.3. Degradation Mechanisms: Effect of Temperature

The degradation of an LIB is caused by several physiochemical processes that can occur simultaneously and both accelerate and mitigate each other. Battery degradation is often discussed on three different levels of detail. The directly observable effects are capacity and power loss. The most detailed level is the so-called degradation mechanisms. These mechanisms are often grouped into degradation modes which are defined based on how they impact the thermodynamic and kinetic behavior of the cell (e.g., the impact on the OCV curve). These modes are impedance increase, loss of active material (LAM), and loss of Li inventory (LLI). The loss of cyclable Li is to a large extent caused by the decomposition of the electrolyte due to the formation of the solid electrolyte interface (SEI) layer, electrolyte decomposition, and Li plating. LAM can be caused by the dissolution of active material and structural degradation, isolation of active particles and island formation, corrosion of the current collector, and electrode delamination. An increase in the cell impedance has been shown to be caused by the formation of passive films at the active particle surfaces, pore-clogging, as well as electrolyte conductivity losses and loss of electric contact [27,46].
The SEI layer initially forms during the first cycle and stops further reactions of the electrolyte at the anode surface. Nevertheless, the thickness of the SEI increases when the cell degrades due to various reasons [47]. Consequentially, capacity is irreversibly lost, as Li is trapped within the SEI. Additionally, the SEI layer is less conductive to Li ions, resulting in an impedance increase and therefore power fade. High temperatures increase the SEI growth rate. High currents lead to particle cracking and therefore new SEI formation [47]. Inhomogeneous conditions (e.g., inhomogeneous temperature distribution and current density) can lead to inhomogeneous SEI properties [9].
Plating is a side reaction during charging where Li ions are reduced and deposited as metallic Li on the anode surface instead of intercalating into it. Li plating can be exacerbated by low temperature, high SoC, high charge current, high cell voltage, and an insufficient amount of anode active material [47]. Local defects in the separator or in the anode, either due to manufacturing defects or that developed during use, have also been shown to cause plating [48,49,50]. Carter et al. [18] reported increased depositions in the presence of interelectrode temperature gradients even at conditions such as 35 °C and C/5.
Paarman et al. [9] pointed out that degradation mechanisms at the cathode (e.g., mechanical degradation disturbing electronic pathways and irreversible changes in the crystal structure), are less sensitive to temperature than those at the anode, but sensitive to the SoC range. As higher temperatures allow cells or materials to reach higher/lower SoC before the cutoff voltage is reached, degradation is rather indirectly accelerated. Wang et al. [17], on the other hand, pointed out that the cathode might benefit from high temperature when the rate is high as concentration gradients within the active material particles are reduced, resulting in less stress and irreversible particle cracking. An improved solid-state diffusivity due to high temperature reduces gradients, releases particle strain, and hence suppresses mechanical loss.

3. Experimental Section and Methodology

The cell used in this study is a pouch cell from Shenzhen Melasta Battery Co. (Shenzhen, China) with an LCO cathode and graphite anode yielding a nominal capacity of 6.55 Ah. The electrolyte is EC:EMC:DMC LiPF 6 with VC and PC. The cells contain 43 layers of double-coated LCO cathodes and 44 layers of double-coated graphite anodes, and a Z-folded separator. The dimensions of the cell and the tabs are presented in Table 1.

3.1. Degradation Study

The full cycle life test matrix is presented in Table 2. Ambient temperatures in the range of 5 to 45 °C were selected. In addition to cycling cells in temperature chambers at specified temperatures, different cooling strategies have been compared. All cells were cycled in the full SoC window, in the voltage range of 3–4.2 V. The charge was performed as constant current, constant voltage (CCCV) with a cut-off current of C/10. The discharge was either only constant current (CC) or constant power (CP). Both charge and discharge currents, as well as the cycling temperature, were selected based on the maximum and minimum values advised by the battery cell manufacturer.
For the degradation setup, different cooling systems were investigated. These systems are summarized in Figure 3. The first strategy (A) was the air cooling of the batteries inside a temperature chamber which corresponds to a set-up mostly seen in laboratory scale testing. A cell within a battery pack on the other hand would usually be surrounded by cells of similar temperature on all sides except where it is connected to the cooling system. To replicate surrounding cells, the cells were isolated in styrofoam from all but the cooled side (set-ups B, C, and D). The second set-up (B), was air-cooled inside a temperature chamber while all but one side (top side, cooling area of approx 54 cm 2 ) was insulated. The heat transfer coefficient was estimated to be 18 W/mK inside the temperature chambers. The third and fourth set-ups included water-cooling using Grant LT ecocool 100 circulating water bath. Set-up C cools the battery through one surface (top side, cooling area of approx 54 cm 2 ) with a cooling temperature of 24 °C. Set-up D cools the battery through the tabs with a cooling temperature of 12.5 °C (cooling area of approx 3.6 cm 2 ).
All cells were characterized at an ambient temperature of 25 ± 0.5 °C. The characterization included a 1 C cycle, a C/4 cycle, a C/20 cycle, and a high-power pulse characterization test (HPPC) to obtain the DC resistance in the cell. The HPPC test included alternating positive and negative 1 C pulses, both short and long. The short pulses were 5 s followed by a rest of 1 s with a logging frequency of 5 ms. The long pulses were 10 s followed by 3 min rest with a logging frequency of 0.5 s. The current was cut and the immediate voltage response was used for the calculation of the DC resistance. The characterization routine was performed periodically with intervals of 14 days, or for every 5%-point loss in SoH.

3.2. Temperature Measurements

All battery surface temperatures have been measured continuously using 10 kOhm thermistors. The measurement was performed at one point in the center of the top as marked in Figure 3. In addition, the temperature distribution over the battery surface was measured using IR thermal imaging (Xenics Gobi 640), both at BoL and EoL.

3.3. Entropy Measurement

The entropy of specific cells was measured both at BoL and EoL following the potentiometric procedure suggested by Osswald et al. [11] as introduced in Section 2.2.3.
The discharge to the required SoC was performed with C/10 at 30 °C. While the cell was at rest, the temperature was initially kept at the same temperature for 90 min. For the entropy measurement, the ambient temperature was then reduced to 25 °C, further to 20 °C and increased back to 30 °C, as shown in Figure 2. All temperature levels are kept for 25 min.

3.4. Heat Generation

The reversible and irreversible heat generation were estimated based on Equations (2) and (3). The C/20 potential was used as the pseudo-OCV for the calculation of the irreversible heat generation. For the calculation of the reversible heat, the surface temperature was used as an approximation of the battery temperature.

4. Results and Discussion

The results of the degradation study are presented and discussed in the following sections. Section 4.1 presents the entropy change at BoL and EoL. Section 4.2 presents the calculated irreversible and reversible heat generation for different operation conditions as a function of SoH. Section 4.3 analyzes the measured surface temperature as a function of SoC with a focus on the effect of reversible heating. Section 4.4 presents the surface temperature as a function of SoH and focuses on the effectiveness of different thermal management strategies and how it varies during the battery lifetime. Section 4.5 discusses the temperature distribution over the cell thickness and surface. Finally, we present the effect of degradation in terms of capacity loss and discuss the effect of the different operating conditions (Section 4.6).

4.1. Cell Entropy

Figure 4 presents the entropy coefficient versus SoC for cells at BoL and after degradation measured during discharge. The BoL profile (black) is very reproducible for different cells of the same type and similar to LCO/graphite cells reported in the literature [26,35]. It is distinctly negative at low SoC. The entropy coefficient increases with an increase in SoC. It approaches zero at 60% SoC while slightly decreasing again between 60 and 70% SoC. It becomes positive between 70 and 80% SoC. At a high SoC, the entropy coefficient is only slightly negative. For the cells cycled at 5 °C (blue), this profile appears to have changed slightly but is shifted to higher SoC (by around 10% SoC). Less clear trends can be observed for cells cycled at ambient temperatures and high temperatures. However, at an SoH of 80% (dark green and light orange) it appears that the profile is only slightly changed with a flattening of the curve between 20 and 35% SoC and the positive part widening while shifting to lower SoC. For the cells cycled until an SoH of around 60% (light green) the distinct negative entropy coefficient at low SoC increases more sharply as the SoC rises, and becomes positive between 60% and 90% SoC.

4.2. Reversible and Irreversible Heat Source

Figure 5 presents the reversible and irreversible heat generated over the course of a full charge (a,b,c) and discharge (d,e,f) as a function of SoH (calculated with Equations (2) and (3)). It is noticeable that the reversible heat is acting as a heat sink during charge and as a heat source during discharge. The reversible heat is around −2 kJ and 2 kJ at BoL for charge and discharge, respectively. It is not highly dependent on the cycling conditions although slightly smaller at lower temperatures, which is reasonable considering Equation (2). The absolute value decreases with a reduction in SoH as the charge/discharge becomes shorter.
At BoL, the irreversible heating increases with an increase in C rate (as expected, Equation (3)). At the BoL, the irreversible heating is smaller than the reversible heating for a 1 C discharge (Figure 5d)), while it is only smaller for the moderate and high temperature at 2 C discharge (Figure 5e)). This is in agreement with previous reports that at low currents and high temperatures entropic heating is dominating [23,25]. At higher rates and low temperatures, irreversible heating is larger than reversible heating. At the BoL, the irreversible heat generation is clearly the largest for low-temperature cells, as increased resistance at low-temperature results in larger overpotentials. This is in agreement with the higher cell resistances at low temperatures [16,23,24]. The only exceptions are the water-cooled cells (Figure 5c,f). Here, the generated heat is significantly larger, which is caused by a different type of tab connections with higher resistance. The irreversible heating increases with a decrease in SoH until it approaches a maximum. This can be observed for all C rates, and both charge and discharge. When the cells degrade and reduce in SOH, the resistance increases (more in Section 4.6) and the cycle length decreases. For cells cycled with 1 C, the irreversible heating becomes larger than the reversible heating around 88% SoH for low-temperature cells and around 82% SoH for high-temperature cells. For cells cycled with 2 C, irreversible heating becomes larger than reversible heating for moderate (15/25 °C) and high-temperature (35/45 °C) cells around 95% SoH. The trends and observations of the heat generation are discussed in more detail together with the measured surface temperature as a function of SoH in Section 4.4.
In summary, at the BoL, reversible heat generation is larger than irreversible heat generation for C rates ≤ 1 C as well as for moderate (15/25 °C) and high (35/45 °C) temperatures at 2 C. While reversible heat generation decreases linearly with a reduction in SoH (when integrated over the full charge or discharge), irreversible heat generation increases until it reaches a maximum.

4.3. Surface Temperature: SoC Effect

Figure 6 presents the measured surface temperature rise as well as the C rate for different operating conditions during discharge (Figure 6a) and charge (Figure 6b), both for constant current and constant power discharge. During the discharge, the surface temperature initially increases by 2–3 °C until an SoC around 85% before it decreases towards a local minimum at around 75–78% SoC. After this, it increases until fully discharged. The temperature rise is the largest (nearly 13 °C) for a CC discharge of 3 C and a constant power discharge of 73.6 W. The temperature rise of the cell insulated from one side and discharged with 2 C is very similar.
During charge, the surface temperature initially decreases until reaching a minimum at around 20 to 25% SoC. The decrease in temperature is the largest for cells charged with 1 C (2.7 ± 0.2 °C). The cell insulated from one side and charged with 2 C also shows a similar reduction in temperature. After the minimum, the surface temperature increases. For the cells charged with 2 C and 3 C, the surface temperature increases monotonic until a maximum is reached around 80% SoC. The maximum is reached before the current decreases during the CV phase of the charge, and is therefore not caused by the reduced current. For the cells charged with 1 C on the other hand, the surface temperature increases until around 50–55% SoC, before it is constant until 70% SoC and starts increasing again until reaching the maximum surface temperature around 80% SoC.
During charge (particularly 1 C), the surface temperature profile is clearly defined by reversible heating—trends of the entropy coefficient are clearly recognizable (compare Figure 4). The cooling of the cell at the beginning of charging is due to the distinct strong entropy coefficient at low SoC, which was observed to increase at medium SoC with a reduction between 60 and 70% SoC (Figure 4). This is in good agreement with the gradual increase in surface temperature until it becomes constant between 60 and 70% SoC. The maximum surface temperature is in agreement with the maximum of the entropy coefficient, although slightly shifted to a higher SoC. In addition, we can observe that for the largest parts of the charge, the surface temperature is lower than the ambient temperature. This is in agreement with the calculated heat generation at 1 C (Section 4.2), where at the BoL, the cooling due to reversible heating was stronger than the irreversible heating.
In addition, the local minimum surface temperature (around 75% SoC) during the discharging matches well with the maximum of the entropy coefficient. During the 1 C discharge, the surface temperature increases after the minimum before being almost constant between 40 and 60% SoC and then increasing again. This is in alignment with the entropy coefficient that decreases after the maximum and increases again to a higher value between 40 and 60% SoC before decreasing further. The surface temperature profile during discharge and charge over the SoC is in agreement with both surface temperature measurements and simulations presented by earlier studies for LCO/graphite LIB [23].
Figure 7 and Figure 8 present the surface temperature during discharge and charge, respectively, for C/4, 1 C, and 3 C, comparing the temperature profile at the BoL and EoL. This example is a cell cycled with 3 C, air-cooled from all sides at 25 °C. The SoH is 71% at EoL. For a low C rate of C/4 (red line), only a small temperature change is visible both at BoL and EoL as the amount of irreversible heat generated is smaller and the ambient cooling appears to be sufficient to remove most of the generated heat. While the surface temperature rise at the 1 C discharge only increases from 5 °C at BoL to 5.7 °C (light blue) at EoL, it is as much as 13 °C to 18.5 °C for a 3 C discharge (dark blue). This is in agreement with the calculated heat generation in Section 4.2, as well as previous studies showing that battery degradation had comparatively little effect for a discharge below 1 C, but clearly more significantly for higher discharge rates [23].
As already discussed, the surface temperature during charge is strongly affected by cooling effects due to reversible heating at the BoL (Figure 6b and Figure 8a). At the EoL on the other hand, irreversible heating clearly plays a larger role (Figure 8b). Although, at low SoC where the entropy coefficient is distinctly negative, a cooling effect for 1 C charge is still visible. Even though the minimum temperature increases from approximately 3 °C (at 25% SoC) below ambient to 1.5 °C (at 10% SoC) below ambient at higher SoC (where the entropy coefficient is smaller), it becomes impossible to recognize the course of the entropy coefficient in the surface temperature. Irreversible heating dominates over all cooling effects for 3 C at the EoL. The upper cut-off voltage is already reached at around 20% SoC for the 3 C charge due to larger overpotentials. However, although the current starts decreasing during the CV phase of the charge, the surface temperature keeps increasing until around 60–65% SoC and a C rate below 1.5 C. The maximum surface temperature rise increases from 5 °C at the BoL, to 7.5 °C at the EoL for a 3 C charge.
In summary, when looking at the surface temperature as a function of SoC at the BoL, features of the entropy coefficient are clearly recognizable, leading to substantial cooling during charge. After degradation, those features are clearly less recognizable as irreversible heating rates are increased, although at low C rates cooling during charging can still be observed.

4.4. Surface Temperature: SoH Effect

Figure 9 presents the maximum measured surface temperature versus cooling temperature both at the BoL (Figure 9a), and 80% SoH (Figure 9b). The data points are averaged over all cells cycled at those conditions and five cycles each. The black diagonal line, bisecting the plot, represents an ideal cooling where the cooling temperature equals the maximum battery surface temperature—meaning all heat transported to the battery surface is removed instantly. The further the data points deviate from this, the larger the temperature difference. For cells that were cooled within a ventilated temperature chamber from all sides, the maximum temperature appears to be mostly parallel with the diagonal. The maximum temperatures move further away from the diagonal with a higher C rate (as already observed in Section 4.3). It is noticeable that although this is mostly in parallel, it is slightly off for cells cycled at 5 °C. This is in agreement with the calculated heat generation in Section 4.2, as the heat generation was noticeably larger for low temperatures. It is also in agreement with previous findings in the literature [16,24,25]. Cells that were ambient-cooled only from one side (cycled at 2 C) behave comparably to cells cycled with a higher C rate. The water-cooling through one pouch-side appears to be more efficient than the ambient cooling; although, the cooling area is decreased. The water-cooling through the tabs, on the other hand, appears to be the least efficient, where the difference between the maximum surface temperature and cooling temperature is the most extreme (nearly 30 ° C ).
At 80% SoH (Figure 9b), all data points for discharge rates larger than 1 C moved further away from the diagonal (i.e., the maximum temperature has increased for all conditions). It is noticeable that the increase in maximum temperature appears to be more extreme for cells with higher cooling temperatures. In addition, the maximum temperature of the water-cooled cells was increased significantly which is in line with the calculated heat generation.
Figure 10 presents the maximum temperature versus the discharge time. This allows plotting both the change in maximum temperature with a reduction in SOH, as well as different operating conditions in one figure. Starting on the right-hand side around 60 min, the maximum temperature relates to cells cycled with 1 C. The reduction in discharge time is due to a reduction in SOH, while the discharge current is not changed. The same is observed for the other discharge times with the plots starting from 30 min representing 2 C and 49 W and starting from 20 min representing 3 C and 73.6 W. Some data points are missing due to problems with sensor placement and therefore with reproducibility. For all but the cells cooled with ambient air at 5 °C and cycled with 1 C, the maximum surface temperature increases with a decrease in SoH. Cells with different cooling systems than ambient air cooled from all sides, appear to have steeper increases in maximum surface temperature. It also appears that a higher C rate results in larger increases. For most cells with discharge currents larger than 1 C, the surface temperature appears to reach a maximum between 75% and 85% SoH. This is in agreement with the observations of the irreversible heat generation reaching a maximum (Section 4.2).
As was already discussed, the cells cooled with ambient air at 5 °C and cycled with 1 C have a larger difference between maximum temperature and cooling temperature, which was found to be in agreement with the calculated heat generation. Figure 5d) also showed that the irreversible heat generation during 1 C discharge, unlike for other cells, initially decreases until it starts rising below an SoH of 80%, while the reversible heat constantly decreases. This shows that the maximum surface temperature constantly decreases slightly until 80% SoH. On the other hand, for cells cycled at 15 °C and 25 °C, the irreversible heating is still increasing at 80% and 75% SoH, respectively, which is in agreement with the steady increase in the maximum surface temperature of those cells without reaching a maximum. Cells cooled with 45 °C ambient air showed an increase in irreversible heating between 93 ± 0.5% and 85 ± 1% SoH, which agrees well with the maximum measured surface temperature as it starts to increase first between 85 and 95% SoH.
For all cells discharged at 2 C and 49 W (initially approx. 30 min discharge time), it appears that the maximum temperature rise increases before reaching a steady state. This is in agreement with the observations of the calculated heat generation.
Moreover, for all cells cycled at 3 C and 73.6 W (initially approx. 20 min discharge time), apart from 3 C at 15 °C ambient, 3 C pouch water-cooled, it appears that the maximum temperature rise increases as the cells degrade before reaching a steady state.
In summary, the maximum battery temperature increases when the cell degrades. For cells cycled at a higher C rate a maximum is reached at an SoH between 75% and 85%.

4.5. Temperature Distribution

All results presented so far were based on a one-point surface temperature measurement. To allow for a better estimation of how representable this measurement is for the overall battery temperature in the course of the battery lifetime, this section focuses on the temperature distribution over the cell thickness when the cell is insulated from one side, as well as the thermal imaging of the surface temperature distribution.
Figure 11 presents the change in temperature during one full 2 C discharge and charge at the BoL and EoL of a cell that was only cooled from one side of the pouch with an ambient air temperature of 25 °C, including the rest phase that allows the cell to cool down (Table 2B). The bottom sensor (dashed line) is on the insulated side of the cell, while the top sensor (solid line) is on the cooled side. While Figure 11a presents the temperature rise, Figure 11b presents the difference between the top and bottom measurements. While the maximum temperature difference over the thickness of the cell is approx. 3 °C at end of discharge at the BoL, it increases to 8 °C at the EoL. The time required for the cell to cool back down to the starting temperature does not appear to be affected by the SoH (27 min at BoL, 28 min at EoL).
When it comes to variations in the temperature across the thickness of the cell, the changes in the thickness of the cells must be taken into account. For the cell in Figure 11, the thickness increased by 45% from the BoL to the EoL (66% SOH). In general, all cycled cells showed a significant increase in thickness. Generally, it is observed that higher temperatures result in larger thickness increases (Table 3). Increasing the C-rate from 1 C to 2 C increases the thickness, while when increasing further to 3 C, the thickness increase is less. Cells cycled at high temperatures showed obvious gassing, while low-temperature cells did not. Opening a selection of cells revealed that the anode thickness increased more drastically than the cathode. While for cells cycled at cold temperature (5 °C, 2 C specifically) the anode thickness increased by 15% while the cathode thickness did not change. For cells cycled at warm temperatures (45 °C, 1 C specifically) the anode thickness increased by 40–50% and the cathode thickness increased by 20%.
Figure 12 compares the surface temperature distribution at the BoL (red) with the distribution for cells at the EoL. The point resistor temperature measurements presented earlier were made in the center of the surface (as marked in Figure 3), at 64 mm from the tab end, and 21 mm from the side of the pouch. It is indicated by grey lines in Figure 12. It can be seen that the temperature does not vary much over the width of the cell (left side of Figure 12) both at the BoL and EoL, apart from the cell that was tab water-cooled. Over the length of the cell, there is some variation observable with the lowest temperature at the tabs. This is in agreement with previous studies. Zhang et al. [51] discussed the significant impact of tab arrangements on the temperature distribution in LIB pouch cells. For a similar tab arrangement to the cells used in this study, they found a similar distribution for a 2 C discharge with the third closest to the tabs being the coldest, while the two-thirds away from the tabs did not vary significantly in temperature. For the BoL cell, the temperature difference over the length is around 2.5 °C. For degraded cells, this difference increases to around 4 to 5 °C. For most cells, it appears that it is rather a third of the cell, closest to the tabs that have a reduced temperature, while the rest of the cell shows a variation of only around 1 °C from the measurement point (64 mm/21 mm). Again, the tab-cooled cell varies from this observation and has a rather steady temperature gradient. The tab water-cooled cell showed a significant increase in thickness with obvious gassing. The thickness increased by around 90% towards the tabs and bottom of the cell while the increase was as large as 140% (25 mm at EoL, 10.3 mm at BoL) at the center. After puncturing the cell within the glovebox, the thickness increase was reduced to around 70% and 76%, respectively.
In summary, it appears that the point temperature measurement appears to be fair for cells both at the BoL and EoL in length and width for around two-thirds of the cell as long as there is not too much gassing. The variation over the thickness of the cell on the other hand is more substantial. It is important to note that the temperature measured at the tabs is significantly lower than the actual maximum battery temperature and that this difference increases substantially with degradation.

4.6. Capacity Loss and Resistance Increase: Effect of Operation Conditions

Figure 13 presents the 1 C capacity at 25 °C versus FEC for all operating conditions and thermal management strategies investigated in this study. Plots with the same color and symbol are cells cycled at the same conditions. Figure 14 shows the amount of FEC before an SoH of 85% was reached versus the minimum and maximum surface temperature measured at the BoL. An 85% SOH was chosen to compare the cells due to the availability of data for all cells at this SoH. As expected, moderate temperatures (15/25 °C) give the longest cycle life [52]. The longest cycle life appears to be achieved when cells are ambient cooled at a temperature of 15 °C and 1 C charge and discharge rate. The degradation rate increases both for increased and decreased temperatures. The fastest capacity loss is observed for cells cycled at 5 °C and 2 C, followed by cells cycled at 45 °C and 1 C. The relationship between the FEC at 85% SOH and the minimum surface temperature appears to be linear between approx. 15 and 45 °C for all C rates. For cells cycled at an ambient temperature of 25 °C it appears that 1 C/1 C results in the longest cycle life, followed by asymmetric cycled cells with a 1 C charge and different discharge rates (in increasing order). A 73.6 W discharge has around the same discharge time as a 3 C discharge—both result in comparable cycle life, indicating that there is not a large difference between CC and CP discharge on the cycle life for this cell. The asymmetric cycled cells are followed by 2 C/2 C cycled cells both with and without insulation, and lastly, the cells cycled with the highest C rate (3 C/3 C). The insulation of the cell on all but one side does not appear to have a significant influence on the cycle life of the cell cooled with 25 °C ambient air, but it does reduce the cycle life of the cells cooled at 35 °C. Here, the insulation results in a similar cycle life of the cells cycled at 2 C with the insulation and the cells cycled with 3 C without insulation.
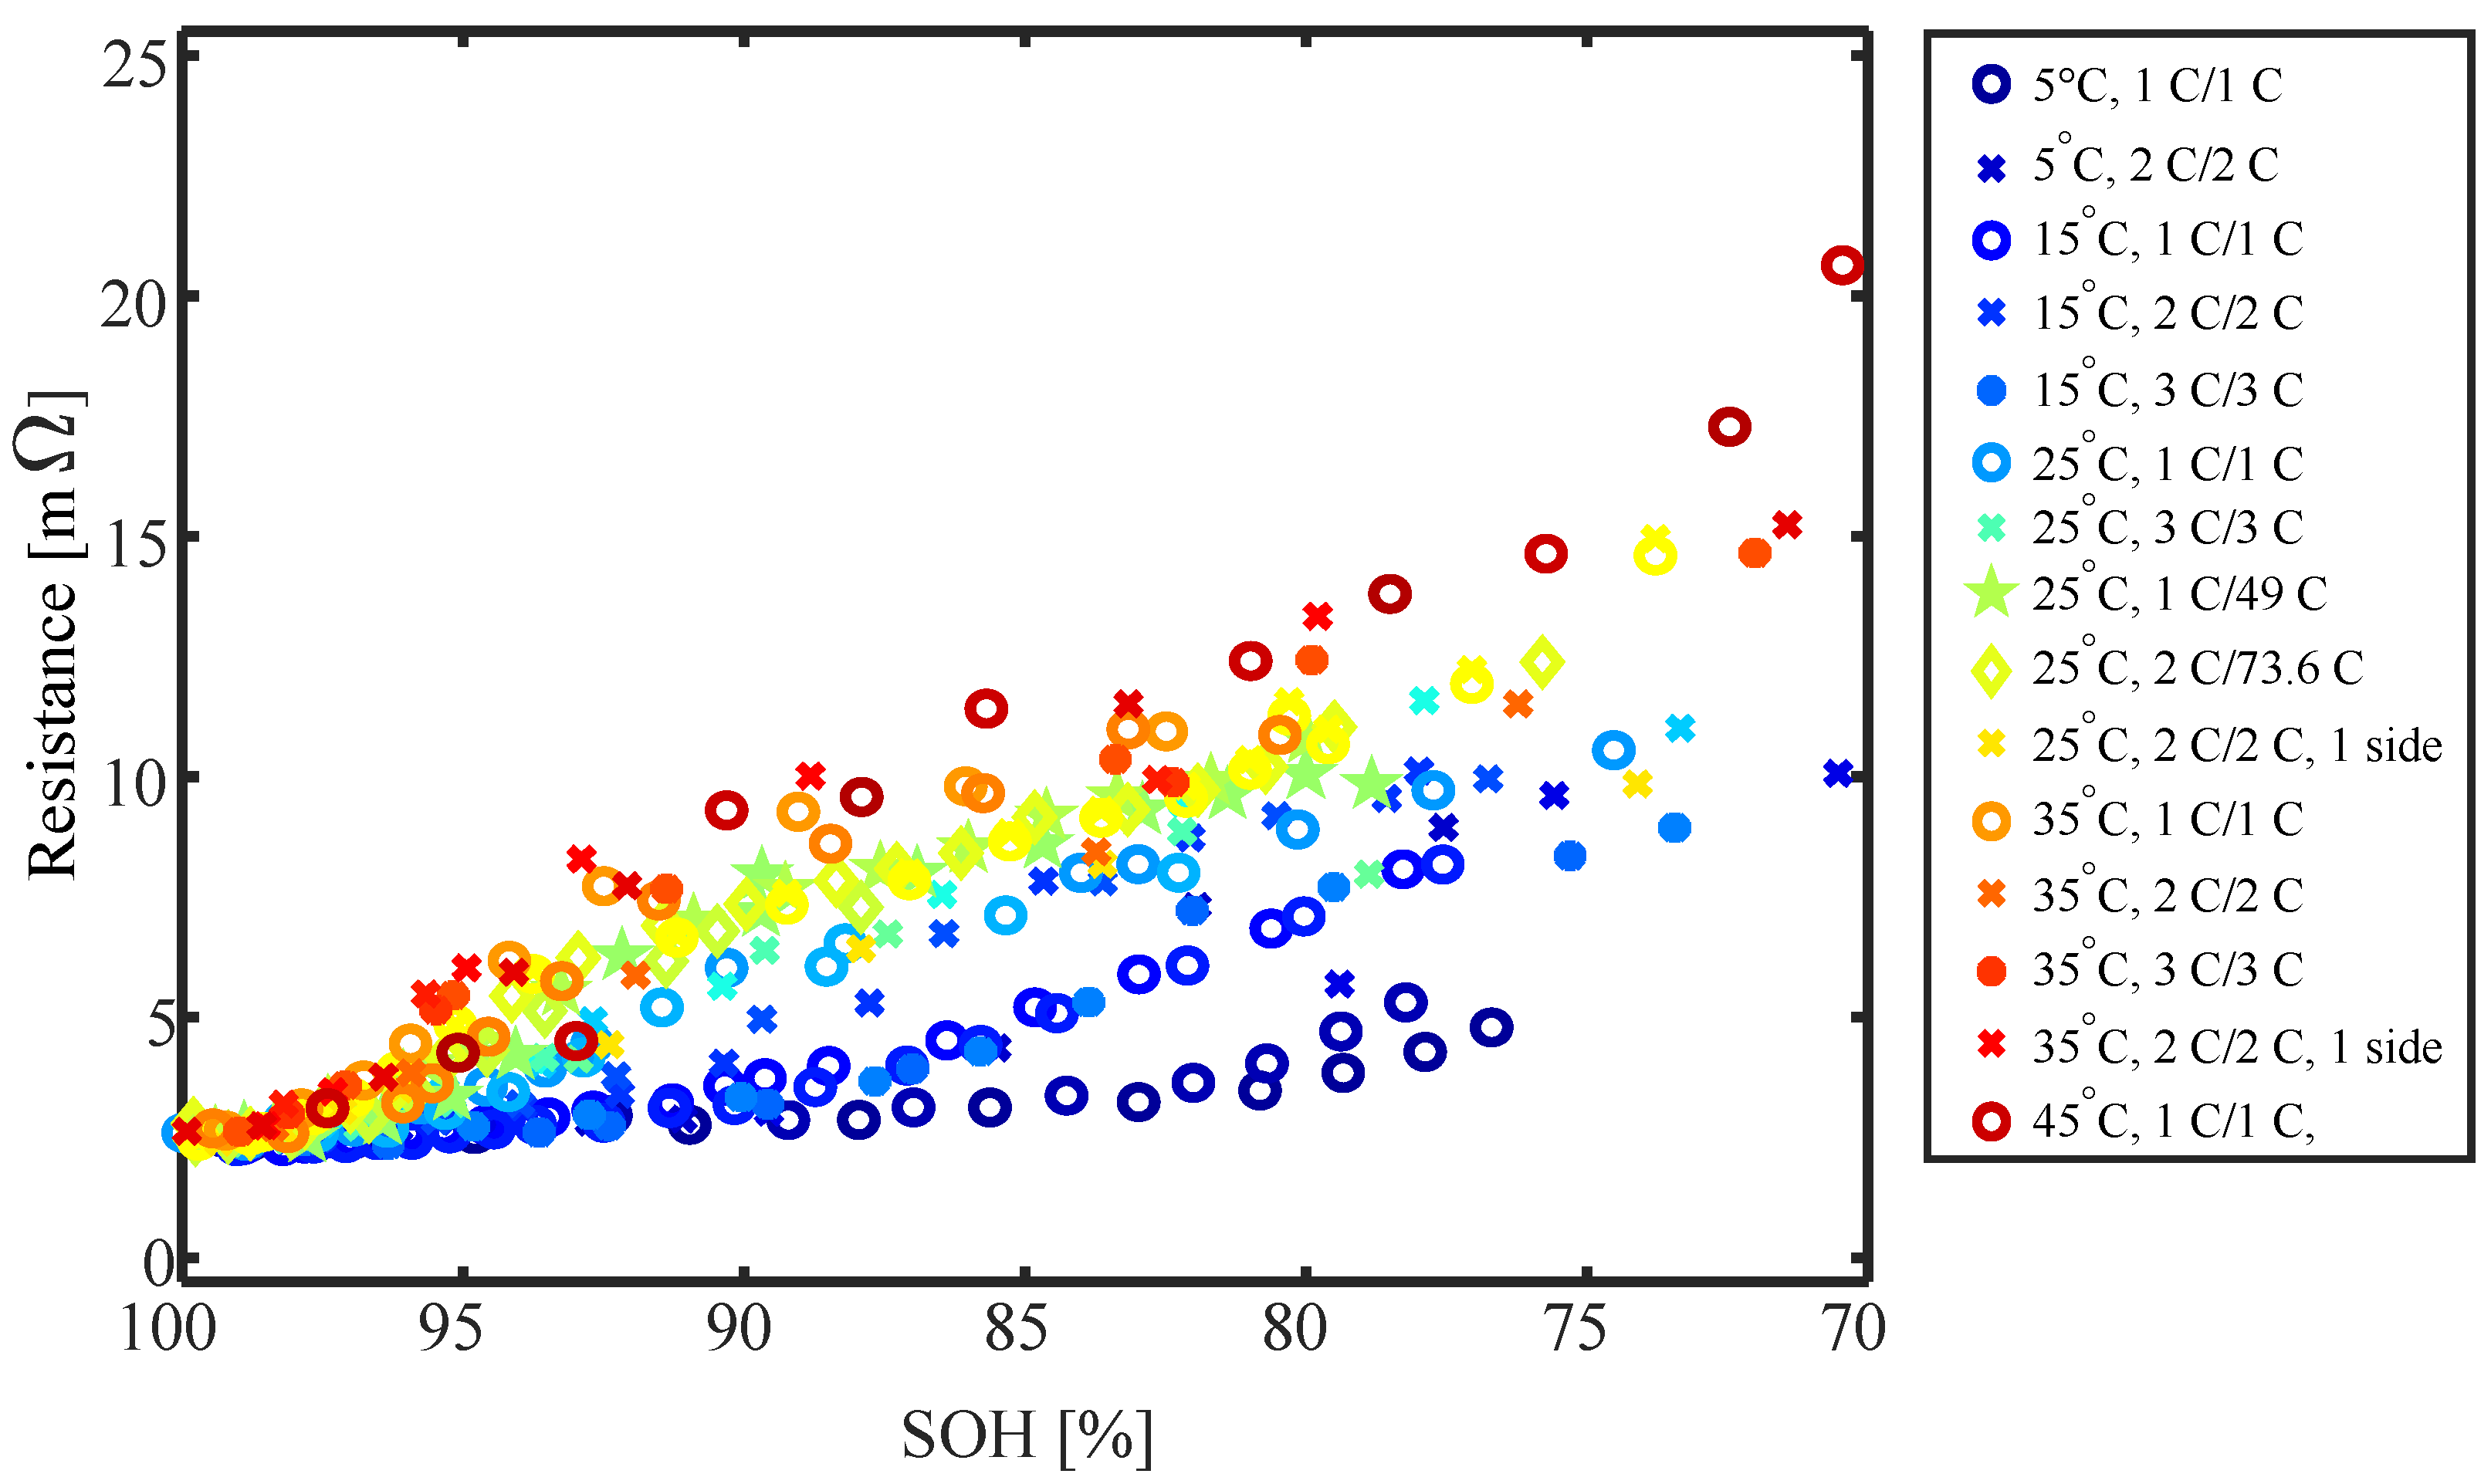
Figure 15 presents the internal resistance averaged over SoC versus SOH for all operating conditions and thermal management strategies investigated in this study. It appears that the resistance is strongly influenced by the thermal management strategy. The higher the temperature, the faster the resistance increases with SOH reduction. This becomes even more apparent looking at Figure 16, which presents the resistance at an SOH of 85% versus the minimum surface temperature measured at the BoL. While the resistance only increases around 20% for cells cycled at low temperature, it is more than 4 times the BoL value for high-temperature cells at 85% SoH. The relationship between the resistance increase and cycling temperature appears to be linear without a strong dependency on the C rate or power.

4.7. Summary and Discussion

In summary, when looking at the surface temperature as a function of SoC at the BoL, features of the entropy coefficient are clearly recognizable, leading to substantial cooling during charge. This was found to be in agreement with previous studies focusing on LCO-graphite cells [23]. After degradation, these features are clearly less recognizable as irreversible heating rates are increased; however, at low C rates, the cooling during charging can still be observed. It was observed that the maximum battery temperature increases when the cell degrades. For cells cycled at a higher C rate, a maximum is reached at an SOH between 75% and 85%. In order to keep the cells at the same temperature during their lifetime compared to the BoL, either the cooling temperature would need to be decreased or the heat transfer improved (e.g., by increasing the velocity of the cooling medium).
It was found that the point temperature measurement is fair for cells both at the BoL and EoL. This was the case both across the length and width of the majority of the cells, except for close to the tabs and as long as there was not too much gassing. The part closest to the tabs had the lowest temperature. On the other hand, the variation over the thickness of the cell was more substantial. It was approx. 3 °C at the end of a 2 C discharge at the BoL and increased to 8 °C at the EoL. This is likely due to a combination of increased heat generation, as well as a degradation in thermal transport properties. Spitthoff et al. [53] showed a reduction in the cell cooling efficiency of around 40% at the EoL. It is important to note that the temperature measured at the tabs is significantly lower than the actual maximum battery temperature and that this difference increases substantially with degradation.
The capacity fade behaved mostly as expected. Cells retained capacity best at moderate temperatures (15/25 °C) and showed accelerated capacity loss both at higher and lower temperatures. The capacity loss was also accelerated with increased charge and discharge rates. This compares to what has been reported in the literature [1,2,3,4,5]. The cycle life for CC and CP discharged cells was comparable when the total discharge time was similar. The insulation of the cell on all but one side does not appear to have a significant influence on the cycle life of the cell cooled with 25 °C ambient air, but it does reduce the cycle life of the cells cooled at 35 °C.
In general, all cycled cells showed a significant increase in thickness (16% to 50%). Generally, it was observed that higher temperatures resulted in larger thickness increases and increased gassing, while low-temperature cells did not show any obvious gassing. Increasing the C rate from 1 C to 2 C increased the thickness, while when increasing further to 3 C, the thickness increase is less. It was found that the anode showed a large increase in thickness for all operation conditions (30 to 60%), although it varied for the different conditions. However, the cathode showed no thickness changes for low-temperature operation but a thickness increase of up to 15% when cycled at moderate and high-temperature. This is in agreement with Du et al. [54]. Using X-ray tomography for a commercial LCO/graphite pouch cell they observed thickness increases due to degradation that was caused by a synergistic effect of the thickening of gas layers and electrodes. The sources of gassing are mainly electrolyte reduction (e.g., SEI formation) and electrode degradation [55,56]. Mattinen et al. [57] showed an increase in gas generation with an increase in C rate. They attributed this to the higher temperatures and the formed SEI being more stable when formed at lower currents. Evolved gas can lead to structural delamination that results in an impedance increase of the cell. This is in agreement with the linear relationship observed between resistance increase and cycling temperature (Figure 16).

5. Conclusions

This work assessed the effect of degradation on heat generation and temperature distribution in LIB. An improved understanding of how degradation is affected by heat terms is important to improve the long-term performance of BMS and pack construction, which should incorporate this also to improve the durability of batteries through better heat management. The main findings are:
  • For cells with LCO cathode, entropic heating plays a major role in the overall heat generation—causing large variations in heat generation rate and therefore surface temperature over the SoC.
  • The maximum battery temperature increases when the cell degrades as irreversible heat generation increases. A maximum is reached for cells cycled with C rates larger than 1 at an SOH between 75% and 85%.
  • Temperature variation over the thickness of the cell is more substantial than in-plane.
  • Heat generation increases when the SOH is reduced, and therefore cooling measures need to be intensified for degraded cells.
  • Cells retained capacity best at moderate temperatures and showed accelerated capacity loss both at high and low temperatures. The capacity loss was also accelerated with increased charge and discharge rates.
  • The cycle life for CC and CP discharged cells was comparable when the total discharge time was similar.
  • Degraded cells showed significant thickness increases. Higher temperatures resulted in larger thickness increases with obvious gassing.

Author Contributions

Conceptualization, L.S. and O.S.B.; methodology, L.S., J.J.L., M.S.W., P.J.S.V., P.R.S. and O.S.B.; formal analysis, L.S.; investigation, L.S.; writing—original draft preparation, L.S.; writing—review and editing, L.S., M.S.W., J.J.L., P.J.S.V., O.S.B. and P.R.S.; visualization, L.S.; supervision, O.S.B., P.J.S.V. and P.R.S. All authors have read and agreed to the published version of the manuscript.

Funding

This research was funded by Norges forsknigsråd grant number 281005, Norges Teknisk-Naturvitenskapelige Universitet grant number 68024013 and Royal Academy of Engineering grant number CiET1718/59.

Data Availability Statement

The data presented in this study are available on request from the corresponding author.

Acknowledgments

The authors are grateful to Christian Helledal Trandem and Colin Ringdalen MacDonald for setting up the rig for the cell water-cooling and Revolve NTNU for providing the Melasta battery cells.

Conflicts of Interest

The authors declare no conflict of interest.

References

  1. Waldmann, T.; Bisle, G.; Hogg, B.I.; Stumpp, S.; Danzer, M.A.; Kasper, M.; Axmann, P.; Wohlfahrt-Mehrens, M. Influence of cell design on temperatures and temperature gradients in lithium-ion cells: An in operando study. J. Electrochem. Soc. 2015, 162, A921. [Google Scholar] [CrossRef]
  2. Leng, F.; Tan, C.M.; Pecht, M. Effect of Temperature on the Aging rate of Li Ion Battery Operating above Room Temperature. Sci. Rep. 2015, 5, 12967. [Google Scholar] [CrossRef] [PubMed]
  3. Richter, F.; Kjelstrup, S.; Vie, P.J.; Burheim, O.S. Thermal conductivity and internal temperature profiles of Li-ion secondary batteries. J. Power Sources 2017, 359, 592–600. [Google Scholar] [CrossRef]
  4. Yang, N.; Zhang, X.; Shang, B.; Li, G. Unbalanced discharging and aging due to temperature differences among the cells in a lithium-ion battery pack with parallel combination. J. Power Sources 2016, 306, 733–741. [Google Scholar] [CrossRef]
  5. Werner, D.; Paarmann, S.; Wiebelt, A.; Wetzel, T. Inhomogeneous temperature distribution affecting the cyclic aging of Li-ion cells. Part II: Analysis and correlation. Batteries 2020, 6, 12. [Google Scholar] [CrossRef]
  6. Carter, R.; Kingston, T.A.; Atkinson, R.W., III; Parmananda, M.; Dubarry, M.; Fear, C.; Mukherjee, P.P.; Love, C.T. Directionality of thermal gradients in lithium-ion batteries dictates diverging degradation modes. Cell Rep. Phys. Sci. 2021, 2, 100351. [Google Scholar] [CrossRef]
  7. Cavalheiro, G.M.; Iriyama, T.; Nelson, G.J.; Huang, S.; Zhang, G. Effects of nonuniform temperature distribution on degradation of lithium-ion batteries. J. Electrochem. Energy Convers. Storage 2020, 17, 021101. [Google Scholar] [CrossRef]
  8. Spitthoff, L.; Gunnarshaug, A.F.; Bedeaux, D.; Burheim, O.; Kjelstrup, S. Peltier effects in lithium-ion battery modeling. J. Chem. Phys. 2021, 154, 114705. [Google Scholar] [CrossRef]
  9. Paarmann, S.; Schuld, K.; Wetzel, T. Inhomogeneous Aging in Lithium-Ion Batteries Caused by Temperature Effects. Energy Technol. 2022, 10, 2200384. [Google Scholar] [CrossRef]
  10. Sun, T.; Shen, T.; Zheng, Y.; Ren, D.; Zhu, W.; Li, J.; Wang, Y.; Kuang, K.; Rui, X.; Wang, S.; et al. Modeling the inhomogeneous lithium plating in lithium-ion batteries induced by non-uniform temperature distribution. Electrochim. Acta 2022, 425, 140701. [Google Scholar] [CrossRef]
  11. Osswald, P.J.; Rosario, M.d.; Garche, J.; Jossen, A.; Hoster, H.E. Fast and Accurate Measurement of Entropy Profiles of Commercial Lithium-Ion Cells. Electrochim. Acta 2015, 177, 270–276. [Google Scholar] [CrossRef]
  12. Grandjean, T.; Barai, A.; Hosseinzadeh, E.; Guo, Y.; McGordon, A.; Marco, J. Large format lithium ion pouch cell full thermal characterisation for improved electric vehicle thermal management. J. Power Sources 2017, 359, 215–225. [Google Scholar] [CrossRef]
  13. Xu, B.; Diao, W.; Wen, G.; Choe, S.Y.; Kim, J.; Pecht, M. Decoupling the thermal and non-thermal effects of discharge C-rate on the capacity fade of lithium-ion batteries. J. Power Sources 2021, 510, 230390. [Google Scholar] [CrossRef]
  14. Werner, D.; Paarmann, S.; Wiebelt, A.; Wetzel, T. Inhomogeneous temperature distribution affecting the cyclic aging of Li-ion cells. Part I: Experimental investigation. Batteries 2020, 6, 13. [Google Scholar] [CrossRef]
  15. Malabet, H.J.G.; Cavalheiro, G.M.; Iriyama, T.; Gabhart, A.; Nelson, G.J.; Zhang, G. Electrochemical and Post-Mortem Degradation Analysis of Parallel-Connected Lithium-Ion Cells with Non-Uniform Temperature Distribution. J. Electrochem. Soc. 2021, 168, 100507. [Google Scholar] [CrossRef]
  16. Troxler, Y.; Wu, B.; Marinescu, M.; Yufit, V.; Patel, Y.; Marquis, A.J.; Brandon, N.P.; Offer, G.J. The effect of thermal gradients on the performance of lithium-ion batteries. J. Power Sources 2014, 247, 1018–1025. [Google Scholar] [CrossRef]
  17. Wang, C.Y.; Liu, T.; Yang, X.G.; Ge, S.; Stanley, N.V.; Rountree, E.S.; Leng, Y.; McCarthy, B.D. Fast charging of energy-dense lithium-ion batteries. Nature 2022, 611, 485–490. [Google Scholar] [CrossRef]
  18. Carter, R.; Love, C.T. Using thermal energy to enable fast charging of energy-dense batteries. Joule 2022, 6, 2447–2449. [Google Scholar] [CrossRef]
  19. Yang, J.; Cai, Y.; Mi, C. Lithium-ion battery capacity estimation based on battery surface temperature change under constant-current charge scenario. Energy 2022, 241, 122879. [Google Scholar] [CrossRef]
  20. Wu, Y.; Jossen, A. Entropy-induced temperature variation as a new indicator for state of health estimation of lithium-ion cells. Electrochim. Acta 2018, 276, 370–376. [Google Scholar] [CrossRef]
  21. Rao, L.; Newman, J. Heat-generation rate and general energy balance for insertion battery systems. J. Electrochem. Soc. 1997, 144, 2697. [Google Scholar] [CrossRef]
  22. Førland, K.S.; Førland, T.; Ratkje, S.K. Irreversible Thermodynamics: Theory and Applications; John Wiley & Sons Incorporated: Hoboken, NJ, USA, 1988. [Google Scholar]
  23. Liu, G.; Ouyang, M.; Lu, L.; Li, J.; Han, X. Analysis of the heat generation of lithium-ion battery during charging and discharging considering different influencing factors. J. Therm. Anal. Calorim. 2014, 116, 1001–1010. [Google Scholar] [CrossRef]
  24. Diaz, L.B.; Hales, A.; Marzook, M.W.; Patel, Y.; Offer, G. Measuring Irreversible Heat Generation in Lithium-Ion Batteries: An Experimental Methodology. J. Electrochem. Soc. 2022, 169, 030523. [Google Scholar] [CrossRef]
  25. Song, M.; Hu, Y.; Choe, S.Y.; Garrick, T.R. Analysis of the heat generation rate of lithium-ion battery using an electrochemical thermal model. J. Electrochem. Soc. 2020, 167, 120503. [Google Scholar] [CrossRef]
  26. Viswanathan, V.V.; Choi, D.; Wang, D.; Xu, W.; Towne, S.; Williford, R.E.; Zhang, J.G.; Liu, J.; Yang, Z. Effect of entropy change of lithium intercalation in cathodes and anodes on Li-ion battery thermal management. J. Power Sources 2010, 195, 3720–3729. [Google Scholar] [CrossRef]
  27. Spitthoff, L.; Shearing, P.R.; Burheim, O.S. Temperature, ageing and thermal management of lithium-ion batteries. Energies 2021, 14, 1248. [Google Scholar] [CrossRef]
  28. Zhao, W.; Rohde, M.; Mohsin, I.U.; Ziebert, C.; Seifert, H.J. Heat generation in NMC622 coin cells during electrochemical cycling: Separation of reversible and irreversible heat effects. Batteries 2020, 6, 55. [Google Scholar] [CrossRef]
  29. Onda, K.; Kameyama, H.; Hanamoto, T.; Ito, K. Experimental study on heat generation behavior of small lithium-ion secondary batteries. J. Electrochem. Soc. 2003, 150, A285. [Google Scholar] [CrossRef]
  30. Chen, D.; Jiang, J.; Kim, G.H.; Yang, C.; Pesaran, A. Comparison of different cooling methods for lithium ion battery cells. Appl. Therm. Eng. 2016, 94, 846–854. [Google Scholar] [CrossRef]
  31. Zhao, Y.; Diaz, L.B.; Patel, Y.; Zhang, T.; Offer, G.J. How to Cool Lithium Ion Batteries: Optimising Cell Design using a Thermally Coupled Model. J. Electrochem. Soc. 2019, 166, A2849–A2859. [Google Scholar] [CrossRef]
  32. Hales, A.; Marzook, M.W.; Bravo Diaz, L.; Patel, Y.; Offer, G. The Surface Cell Cooling Coefficient: A Standard to Define Heat Rejection from Lithium Ion Battery Pouch Cells. J. Electrochem. Soc. 2020, 167, 020524. [Google Scholar] [CrossRef]
  33. Hales, A.; Diaz, L.B.; Marzook, M.W.; Zhao, Y.; Patel, Y.; Offer, G. The Cell Cooling Coefficient: A Standard to Define Heat Rejection from Lithium-Ion Batteries. J. Electrochem. Soc. 2019, 166, A2383–A2395. [Google Scholar] [CrossRef]
  34. Bernardi, D.; Pawlikowski, E.; Newman, J. A General Energy Balance for Battery Systems. J. Electrochem. Soc. 1985, 132, 5–12. [Google Scholar] [CrossRef]
  35. Williford, R.E.; Viswanathan, V.V.; Zhang, J.G. Effects of entropy changes in anodes and cathodes on the thermal behavior of lithium ion batteries. J. Power Sources 2009, 189, 101–107. [Google Scholar] [CrossRef]
  36. Thomas, K.E.; Newman, J. Heats of mixing and of entropy in porous insertion electrodes. J. Power Sources 2003, 119, 844–849. [Google Scholar] [CrossRef]
  37. Liebmann, T.; Heubner, C.; Schneider, M.; Michaelis, A. Investigations on the reversible heat generation rates of blended Li-insertion electrodes. J. Solid State Electrochem. 2019, 23, 245–250. [Google Scholar] [CrossRef]
  38. Hudak, N.S.; Davis, L.E.; Nagasubramanian, G. Cycling-induced changes in the entropy profiles of lithium cobalt oxide electrodes. J. Electrochem. Soc. 2014, 162, A315. [Google Scholar] [CrossRef]
  39. Zhang, X.F.; Zhao, Y.; Patel, Y.; Zhang, T.; Liu, W.M.; Chen, M.; Offer, G.J.; Yan, Y. Potentiometric measurement of entropy change for lithium batteries. Phys. Chem. Chem. Phys. 2017, 19, 9833–9842. [Google Scholar] [CrossRef]
  40. Thomas, K.E.; Bogatu, C.; Newman, J. Measurement of the entropy of reaction as a function of state of charge in doped and undoped lithium manganese oxide. J. Electrochem. Soc. 2001, 148, A570. [Google Scholar] [CrossRef]
  41. Eddahech, A.; Briat, O.; Vinassa, J.M. Thermal characterization of a high-power lithium-ion battery: Potentiometric and calorimetric measurement of entropy changes. Energy 2013, 61, 432–439. [Google Scholar] [CrossRef]
  42. Huang, Q.; Yan, M.; Jiang, Z. Thermal study on single electrodes in lithium-ion battery. J. Power Sources 2006, 156, 541–546. [Google Scholar] [CrossRef]
  43. Damay, N.; Forgez, C.; Bichat, M.P.; Friedrich, G. A method for the fast estimation of a battery entropy-variation high-resolution curve–Application on a commercial LiFePO4/graphite cell. J. Power Sources 2016, 332, 149–153. [Google Scholar] [CrossRef]
  44. Murashko, K.A.; Mityakov, A.V.; Mityakov, V.Y.; Sapozhnikov, S.Z.; Jokiniemi, J.; Pyrhönen, J. Determination of the entropy change profile of a cylindrical lithium-ion battery by heat flux measurements. J. Power Sources 2016, 330, 61–69. [Google Scholar] [CrossRef]
  45. Schmidt, J.P.; Weber, A.; Ivers-Tiffée, E. A novel and precise measuring method for the entropy of lithium-ion cells: ΔS via electrothermal impedance spectroscopy. Electrochim. Acta 2014, 137, 311–319. [Google Scholar] [CrossRef]
  46. Dubarry, M.; Truchot, C.; Liaw, B.Y. Synthesize battery degradation modes via a diagnostic and prognostic model. J. Power Sources 2012, 219, 204–216. [Google Scholar] [CrossRef]
  47. Edge, J.S.; O’Kane, S.; Prosser, R.; Kirkaldy, N.D.; Patel, A.N.; Hales, A.; Ghosh, A.; Ai, W.; Chen, J.; Jiang, J.; et al. Lithium Ion Battery Degradation: What you need to know. Phys. Chem. Chem. Phys. 2021, 23, 8200–8221. [Google Scholar] [CrossRef]
  48. Campbell, I.D.; Marzook, M.; Marinescu, M.; Offer, G.J. How observable is lithium plating? Differential voltage analysis to identify and quantify lithium plating following fast charging of cold lithium-ion batteries. J. Electrochem. Soc. 2019, 166, A725–A739. [Google Scholar] [CrossRef]
  49. Liu, Q.; Du, C.; Shen, B.; Zuo, P.; Cheng, X.; Ma, Y.; Yin, G.; Gao, Y. Understanding undesirable anode lithium plating issues in lithium-ion batteries. RSC Adv. 2016, 6, 88683–88700. [Google Scholar] [CrossRef]
  50. Liu, X.M.; Arnold, C.B. Effects of current density on defect-induced capacity fade through localized plating in lithium-ion batteries. J. Electrochem. Soc. 2020, 167, 130519. [Google Scholar] [CrossRef]
  51. Zhang, X.; Chang, X.; Shen, Y.; Xiang, Y. Electrochemical-electrical-thermal modeling of a pouch-type lithium ion battery: An application to optimize temperature distribution. J. Energy Storage 2017, 11, 249–257. [Google Scholar] [CrossRef]
  52. Waldmann, T.; Wilka, M.; Kasper, M.; Fleischhammer, M.; Wohlfahrt-Mehrens, M. Temperature dependent ageing mechanisms in Lithium-ion batteries—A Post-Mortem study. J. Power Sources 2014, 262, 129–135. [Google Scholar] [CrossRef]
  53. Spitthoff, L.; Wahl, M.S.; Vie, P.; Burheim, O.S. Thermal Transport in Lithium-Ion Batteries: The Effect of Degradation. unpublished.
  54. Du, W.; Owen, R.E.; Jnawali, A.; Neville, T.P.; Iacoviello, F.; Zhang, Z.; Liatard, S.; Brett, D.J.; Shearing, P.R. In-situ X-ray tomographic imaging study of gas and structural evolution in a commercial Li-ion pouch cell. J. Power Sources 2022, 520, 230818. [Google Scholar] [CrossRef]
  55. Michalak, B.; Sommer, H.; Mannes, D.; Kaestner, A.; Brezesinski, T.; Janek, J. Gas evolution in operating lithium-ion batteries studied in situ by neutron imaging. Sci. Rep. 2015, 5, 15627. [Google Scholar] [CrossRef] [PubMed]
  56. Rowden, B.; Garcia-Araez, N. A review of gas evolution in lithium ion batteries. Energy Rep. 2020, 6, 10–18. [Google Scholar] [CrossRef]
  57. Mattinen, U.; Klett, M.; Lindbergh, G.; Lindström, R.W. Gas evolution in commercial Li-ion battery cells measured by on-line mass spectrometry–Effects of C-rate and cell voltage. J. Power Sources 2020, 477, 228968. [Google Scholar] [CrossRef]
Figure 1. Entropy changes of LCO and Graphite versus Li metal in various charge states. Adapted from [35].
Batteries 09 00249 g001
Figure 2. Potential (blue) and temperature (orange) during entropy measurement. Dotted line is the temperature of the chamber, solid line is the battery surface temperature.
Batteries 09 00249 g002
Figure 3. Thermal Management Strategies. Red dots indicate the location of the continuous temperature measurement. The sketches show the top (left) and side view (right) of the cell.
Batteries 09 00249 g003
Figure 4. Entropy coefficient at BoL and EoL for different cycling conditions.
Batteries 09 00249 g004
Figure 5. Generated reversible (o) and irreversible (x) heat as a function of SoH.
Batteries 09 00249 g005
Figure 6. Surface temperature rise for different charge (1–3 C) and discharge currents (1–3 C) and power (49 W, 73.6 W) at BoL. The y-axis on the left side (blue) is the change in battery surface temperature compared to the starting temperature and the y-axis on the right side (orange) is the absolute C-rate.
Batteries 09 00249 g006
Figure 7. Surface temperature rise during discharge for different C rates (C/4, 1 C, 3 C) both at BoL and EoL (71% SOH). Solid lines present the temperature, dashed lines are the C rates.
Batteries 09 00249 g007
Figure 8. Surface temperature rise during charge for different C rates (C/4, 1 C, 3 C) both at BoL and EoL (71% SOH). Solid lines present the temperature, dashed lines are the C rates.
Batteries 09 00249 g008
Figure 9. Maximum surface temperature at BoL and 80% SoH as a function of cooling temperature.
Batteries 09 00249 g009
Figure 10. Maximum temperature versus discharge time, e.g., cells discharged with 1 C starting at 60 min. The minimum distance between two data points of one plot is a reduction of 5%-points in SOH, starting at 100% SoH.
Batteries 09 00249 g010
Figure 11. The relative change in temperature for the bottom (insulated side) and top sensor (a) and temperature difference between (insulated side) and top sensor at 2 C charge and discharge—both at BoL and EoL.
Batteries 09 00249 g011
Figure 12. Surface temperature distribution, cross-sections in width (left side) and length (right side) of the cells. The dotted lines in the inserted image visualize the location of the cross-section. The grey lines in the plots indicate where the one-point resistor temperature measurements were performed. The labels in the legend refer to the operation condition during the degradation study as well as SOH at the point of the measurement.
Batteries 09 00249 g012
Figure 13. 1 C capacity at 25 °C ambient temperature versus FEC for all cells and operation conditions used in the degradation study. If not specified otherwise in the legend, the cells were ambient cooled from all sides.
Batteries 09 00249 g013
Figure 14. FEC until 85% SOH (linearly interpolated) versus Minimum and Maximum Surface Temperature measured during duty cycling at BoL.
Batteries 09 00249 g014
Figure 15. DC resistance at 25 °C ambient temperature versus SOH for all cells and operation conditions of the degradation studies. If not specified otherwise in the legend, the cells were ambient-cooled from all sides.
Batteries 09 00249 g015
Figure 16. DC resistance at 25 °C ambient temperature and 85% SOH (linearly interpolated) versus the minimum surface temperature measured during duty cycling at BoL.
Batteries 09 00249 g016
Table 1. Cell and Tab Dimensions of the cell under study.
CellThickness10.7 ± 0.3 mm
Width42 ± 0.5 mm
Length127.5 ± 0.5 mm
Distance between tabs21 ± 1 mm
TabMaterialNickel-plated Copper
Thickness0.2 mm
Width12 mm
Length30 ± 1.5 mm
Table 2. Thermal management strategies and charging profiles investigated, number of cells, and additional measurements (E: entropy, IR: thermal imaging) specified.
Charge/Discharge RatesThermal Management
Ambient TemperatureCooling
Strategy
5 °C15 °C25 °C35 °C45 °C
CCCV charge -
CC discharge
(CCCV - CC)
1 C/3 C 2 A All-sides,
air-cooled
1 C2 (E:2)24 (E:3)2 (E)2 (E, IR)
2 C2 (E:2)25 (E:3, IR:2)2
3 C 2 (IR)23
CCCV - CP2 C/49 W 2 (IR)
2 C/76 W 2 (IR)
CCCV - CC2 C 2 (E)2 (E:2, IR) B One-side,
air-cooled
CCCV - CC3 C1 (IR)C One-side,
water-cooled
CCCV - CC3 C1 (IR)D Tab,
water-cooled
Table 3. Relative thickness increase compared to BoL at an SoH of 70 ± 2%.
T cool [°C]1 C2 C3 C
516 ± 3%23 ± 2%
15 25.5 ± 1.6%24%
2526.7 ± 1.2%44%41%
35 43 ± 4%
4550 ± 2%
Disclaimer/Publisher’s Note: The statements, opinions and data contained in all publications are solely those of the individual author(s) and contributor(s) and not of MDPI and/or the editor(s). MDPI and/or the editor(s) disclaim responsibility for any injury to people or property resulting from any ideas, methods, instructions or products referred to in the content.

