Article

Experimental Investigation on Reversible Swelling Mechanisms of Lithium-Ion Batteries under a Varying Preload Force

by
Emanuele Michelini
1,*,
Patrick Höschele
1,
Simon Franz Heindl
1,
Simon Erker
2 and
Christian Ellersdorfer
1
1
Vehicle Safety Institute, Graz University of Technology, Inffeldgasse 23/I, 8010 Graz, Austria
2
AVL List GmbH, Hans-List-Platz 1, 8020 Graz, Austria
*
Author to whom correspondence should be addressed.
Batteries 2023, 9(4), 218; https://doi.org/10.3390/batteries9040218
Submission received: 14 February 2023 / Revised: 20 March 2023 / Accepted: 31 March 2023 / Published: 4 April 2023
(This article belongs to the Special Issue Battery Safety: Recent Advances and Perspective)

Abstract

:
The safety of lithium-ion batteries has to be guaranteed over the complete lifetime considering geometry changes caused by reversible and irreversible swellings and degradation mechanisms. An understanding of the pressure distribution and gradients is necessary to optimize battery modules and avoid local degradation bearing the risk of safety-relevant battery changes. In this study, the pressure distribution of two fresh lithium-ion pouch cells was measured with an initial preload force of 300 or 4000  N . Four identical cells were electrochemically aged with a 300 or 4000  N  preload force. The irreversible thickness change was measured during aging. After aging, the reversible swelling behavior was investigated to draw conclusions on how the pressure distribution affected the aging behavior. A novel test setup was developed to measure the local cell thickness without contact and with high precision. The results suggested that the applied preload force affected the pressure distribution and pressure gradients on the cell surface. The pressure gradients were found to affect the locality of the irreversible swelling. Positions suffering from large pressure variations and gradients increased strongly in thickness and were affected in terms of their reversible swelling behavior. In particular, the edges of the investigated cells showed a strong thickness increase caused by pressure peaks.

1. Introduction

Lithium-ion batteries (LIBs) are increasingly widespread, largely due to the growing sales of electric vehicles (EVs) [1]. LIBs inherently suffer from safety risks and pose different hazards such as electrical, chemical and thermal hazards when abused [2,3,4]. To ensure high safety standards, the mechanical behavior of batteries throughout their service life must be investigated [5,6].
One of the critical mechanical parameters to address is the pressure distribution, which affects not only the performance but also the safety of the battery [7,8,9,10,11,12,13]. The influence of the pressure distribution is even more pronounced in next-generation Li-metal batteries, which experience larger volume changes than conventional LIBs [14,15,16]. An inhomogeneous pressure distribution may lead to a localized pore closure which promotes the occurrence of higher local current densities resulting in hot spots and a local overcharge causing a localized lithium plating [7,17,18,19,20,21,22]. Hot spots and lithium plating can lead to an accelerated inhomogeneous aging [23,24] and an increased risk of internal short circuit potentially culminating in a thermal runaway [25].
Lithium plating describes the deposition of metallic lithium that occurs preferably under specific conditions (e.g., low temperature, high current density) and was reviewed in the literature for instance by Lin et al. [26]. An accumulation of lithium ions exceeding the mass transfer limitations and the resulting inhomogeneity of the lithium distribution or a large overpotential trigger lithium plating [27]. Lithium plating is partly reversible, and the plated lithium can be reactivated under specific conditions [28,29]. Long resting periods after electrochemical cycling recover the homogeneity of the lithium distribution and favor a reactivation of metallic lithium encapsulated by passivating layers resulting in a recovery of the capacity [30,31]. An anode overhang by a geometrical overlap with respect to the cathode functions as a lithium-ion sink, compensates the high local current density [32] and can therefore prevent lithium plating especially on the border of the anode [33].
The pressure applied on the cells inside a module is highly affected by their continuous reversible and irreversible volume changes during their use [11,34]. Reversible swelling (a reversible volume change) is a result of lithiation and delithiation of the electrode’s active material [29,35,36,37,38]. Irreversible swelling (an irreversible volume change) is mainly caused by morphology changes, interphase growth, the formation of gas and passivating layers [11,29,34,39]. Graphite increases its thickness by about 10% [40,41] upon lithiation. However, the thickness increase considering reversible swelling decreases with the state of health (SOH) as a result of the loss of lithium inventory (LLI) [42,43].
LIBs cells for automotive applications are commonly assembled in a module to retain mechanical stability, safety and durability [44]. The module battery housing must withstand both external mechanical stresses (e.g., shock and vibration) and internal stresses (e.g., irreversible and reversible swelling) [37,45,46,47,48,49,50,51]. The initial preload force imposed by the battery housing directly affects the resulting internal pressure over the battery lifetime [44,47]. An excessive preload force should be avoided as it leads to a greater deterioration in battery life [17,18,37,45,52,53,54,55,56]. Similarly, a minimal or total absence of preload force also reduces the battery lifetime as it is necessary to maintain contact between the cells in order to prevent their deformation and a delamination of the layers [57,58,59,60,61,62,63,64,65,66,67]. Thus, maintaining the preload force within a certain range is beneficial to the long-term performance of the battery [8,45,53,54,68,69,70,71,72,73,74,75,76].
It has been shown that a pressure inhomogeneity causes localized aging and severe degradation, leading to safety-relevant changes in the battery cell. However, the literature has mostly focused on measuring the battery cell thickness globally or the force evolution during the electrochemical cycling, while the change in locality has so far only been investigated sporadically [8,53,77]. An in-depth understanding of the evolution of reversible swelling due to aging can be useful both for aging modeling and for improving the module design to optimize battery life and safety. This study aimed to investigate the influence of cell aging on the magnitude and locality of reversible swelling (i.e., thickness increase between 0% state of charge (SOC) and 100% SOC).

2. Materials and Methods
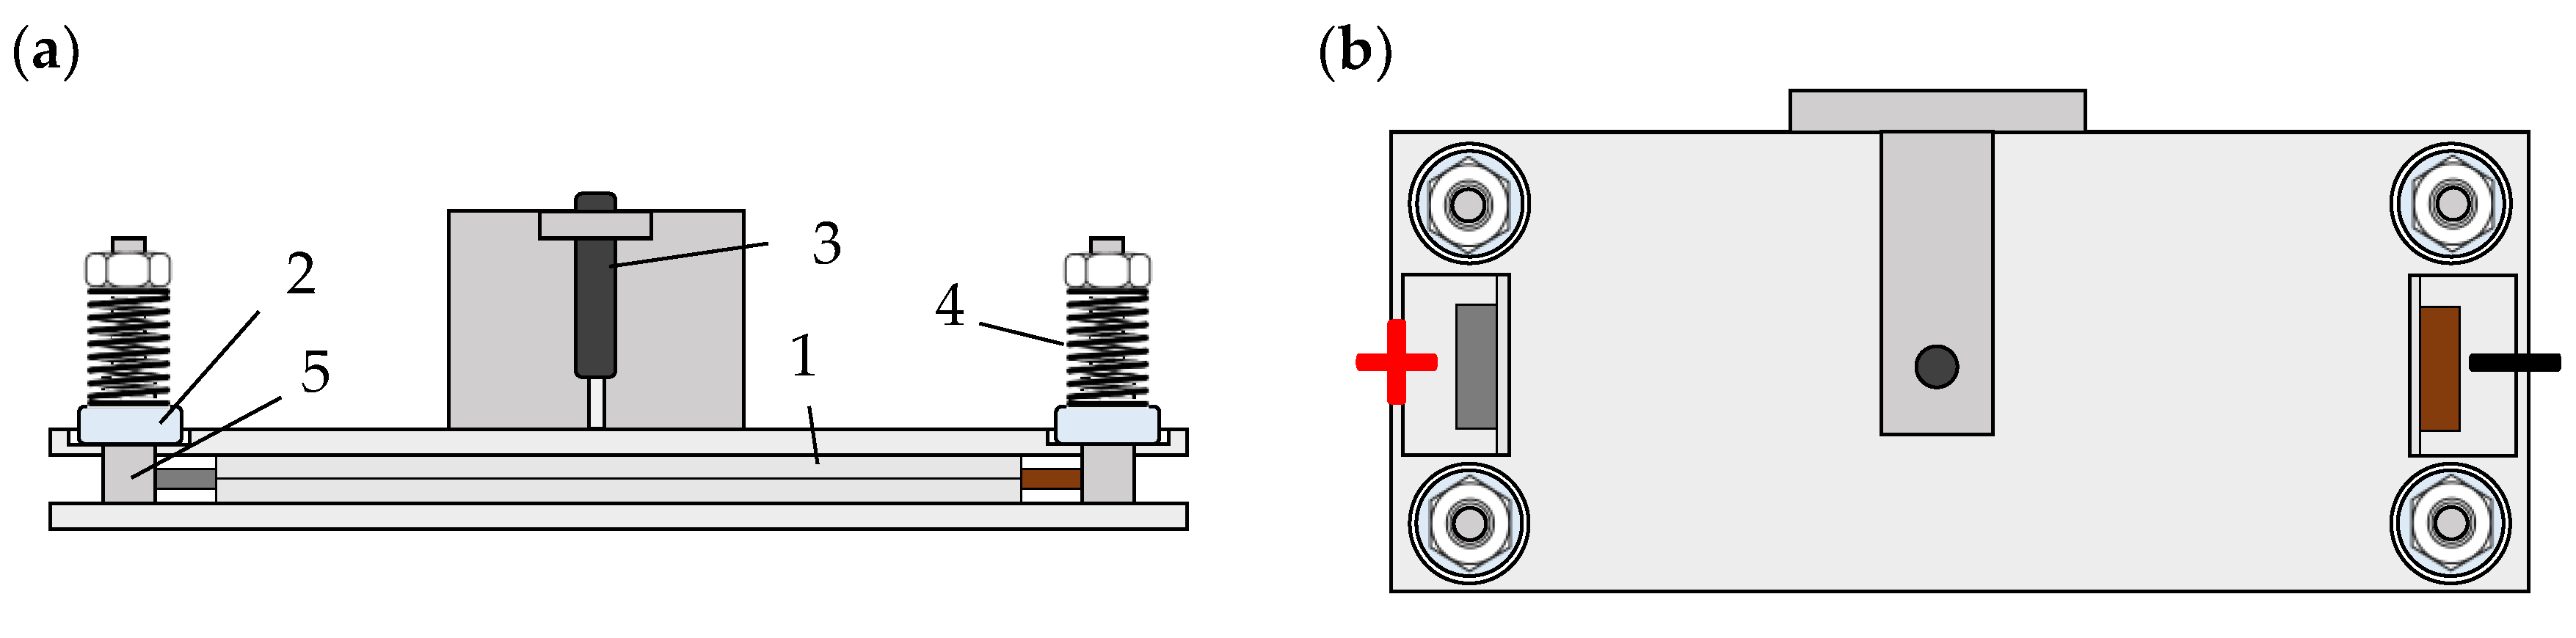
The pressure distribution at 0% SOC and 100% SOC of two fresh pouch cells, taken as reference, was measured under a preload force of 300  N  and 4000  N  applied at 30% SOC. The pressure distribution was used to correlate the change in the reversible swelling behavior with the aging mechanisms. Four other fresh pouch cells were electrochemically cycled with a preload force of either 300  N  or 4000  N  and a flexible bracing realized with springs. After cycling, the local thickness was measured on the aged cells and on the two fresh reference cells. The local thickness was measured without contact with high-precision capacitive distance sensors.

2.1. Specimen

The analyzed battery cells were commercial 60  A h  pouch cells with nickel–manganese–cobalt oxide cathode (NMC622) and a graphite anode. An overview of the cell specifications is given in Table 1. The outer dimensions of the cell were 300 × 110  m m . The jellyroll had dimensions of 260 × 90  m m  and a nominal thickness of 14.5  m m , according to its data sheet. The cells had 31 cathodes and 32 anodes with a total thickness of 172  μ m  and 208  μ m , respectively. The separator had a thickness of 15  μ m . A dissection of the cell revealed that separator sheets were placed between two anodes and one cathode or between two cathodes and one anode to form an electrode stack. One electrode stack after the other was wrapped inside a long separator sheet to form the jellyroll.

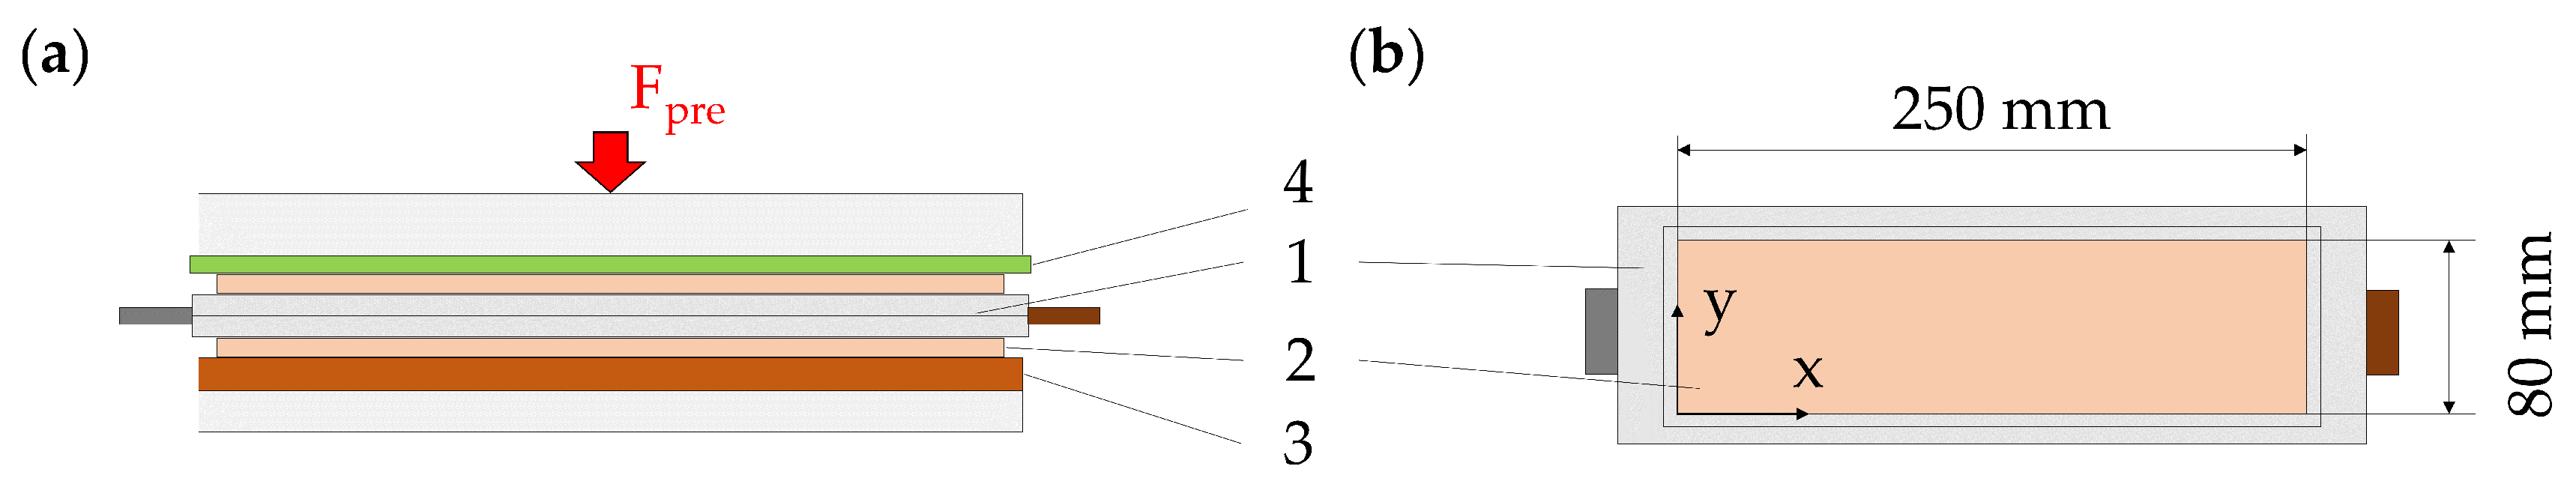
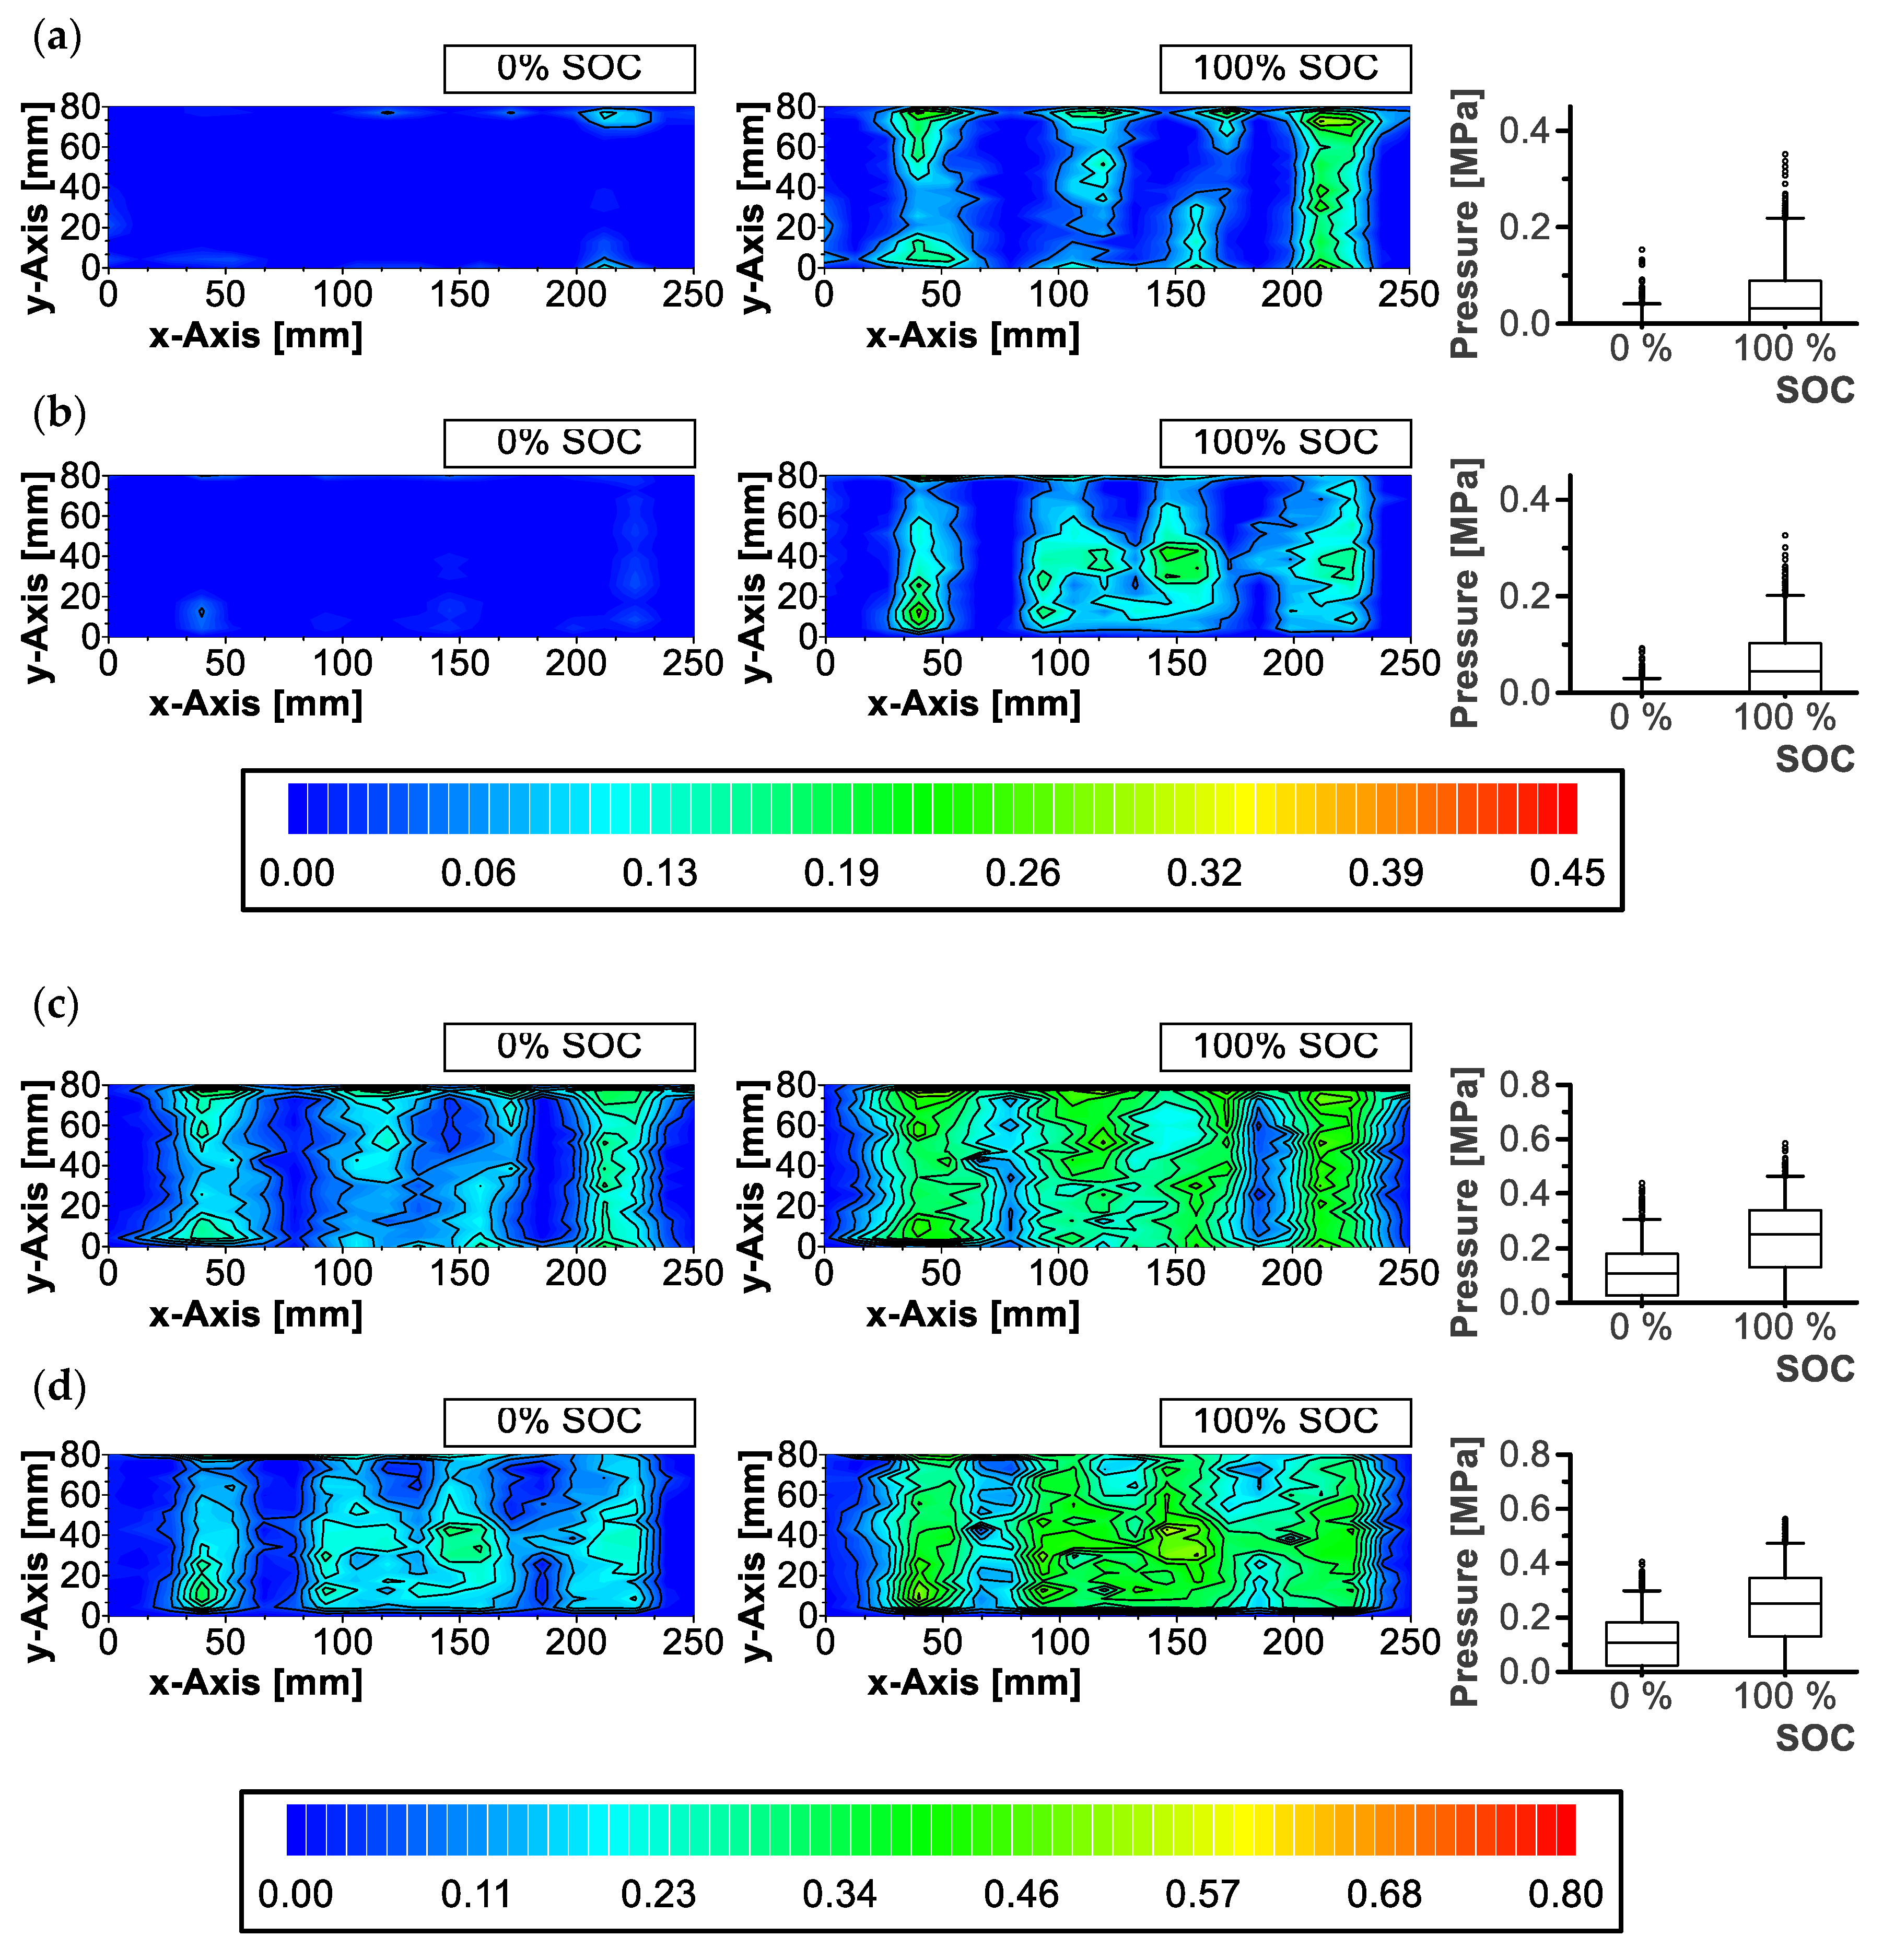
2.2. Pressure Distribution

The pressure distribution was measured with a pressure mapping sensor (Tekscan 5511). The pouch cells were fixed at an SOC of 30% with a preload force  F pre  of 300  N  or 4000  N  with a compression stamp with a velocity of 0.02  m m   s −1. After applying the preload force, a relaxation time of 30  min  was kept to account for mechanical relaxation [78]. After mechanical relaxation, the pouch cells were discharged with an electric load (Elektro-Automatik EA-EL 9080-340 B) using a constant current–constant voltage (CC-CV) protocol to a voltage of 2.5  V  corresponding to 0% SOC. A discharge current of 30  A  (0.5 C) and an abort current of 3  A  (0.05 C) were used. The pouch cells were consequently charged with 0.5 C with a power supply (Elektro-Automatik EA-PSI 9080-340) to 30%, 60%, 90% and 100% SOC with a relaxation time of 15  min . The charging procedure followed a CC-CV protocol when reaching the upper voltage limit of 4.2  V . The tests were repeated two times for each preload force and were performed with two fresh reference cells (F1, F2).
The test setup consisted of two aluminum plates and a test bed with an electric motor to apply a preload force. The pouch cells were placed between the aluminum plates and two compression pads (PORON® 4701-60 Polyurethane) with a thickness of 2  m m  that were placed on the top and bottom of the pouch cell. Figure A1 illustrates the compression force deflection curve of the used compression pads. The compression pads were slightly smaller (250 × 80  m m ) than the pouch cell’s surface to avoid an influence of the edges. Below the compression pad at the bottom, a sheet of phenolic paper (Pertinax®) with a thickness of 3  m m  was placed to provide electrical insulation between the pouch cell and the aluminum plate. The pressure mapping sensor was placed above the compression pad at the top. The test setup is illustrated in Figure 1.
The compression force was measured continuously with a load cell (Megatron KMB38) to calibrate the measured pressure distribution. The pressure mapping system was triggered externally to have time-synchronous signals. Additionally, cell voltage and tabs temperature were measured and logged throughout the process.

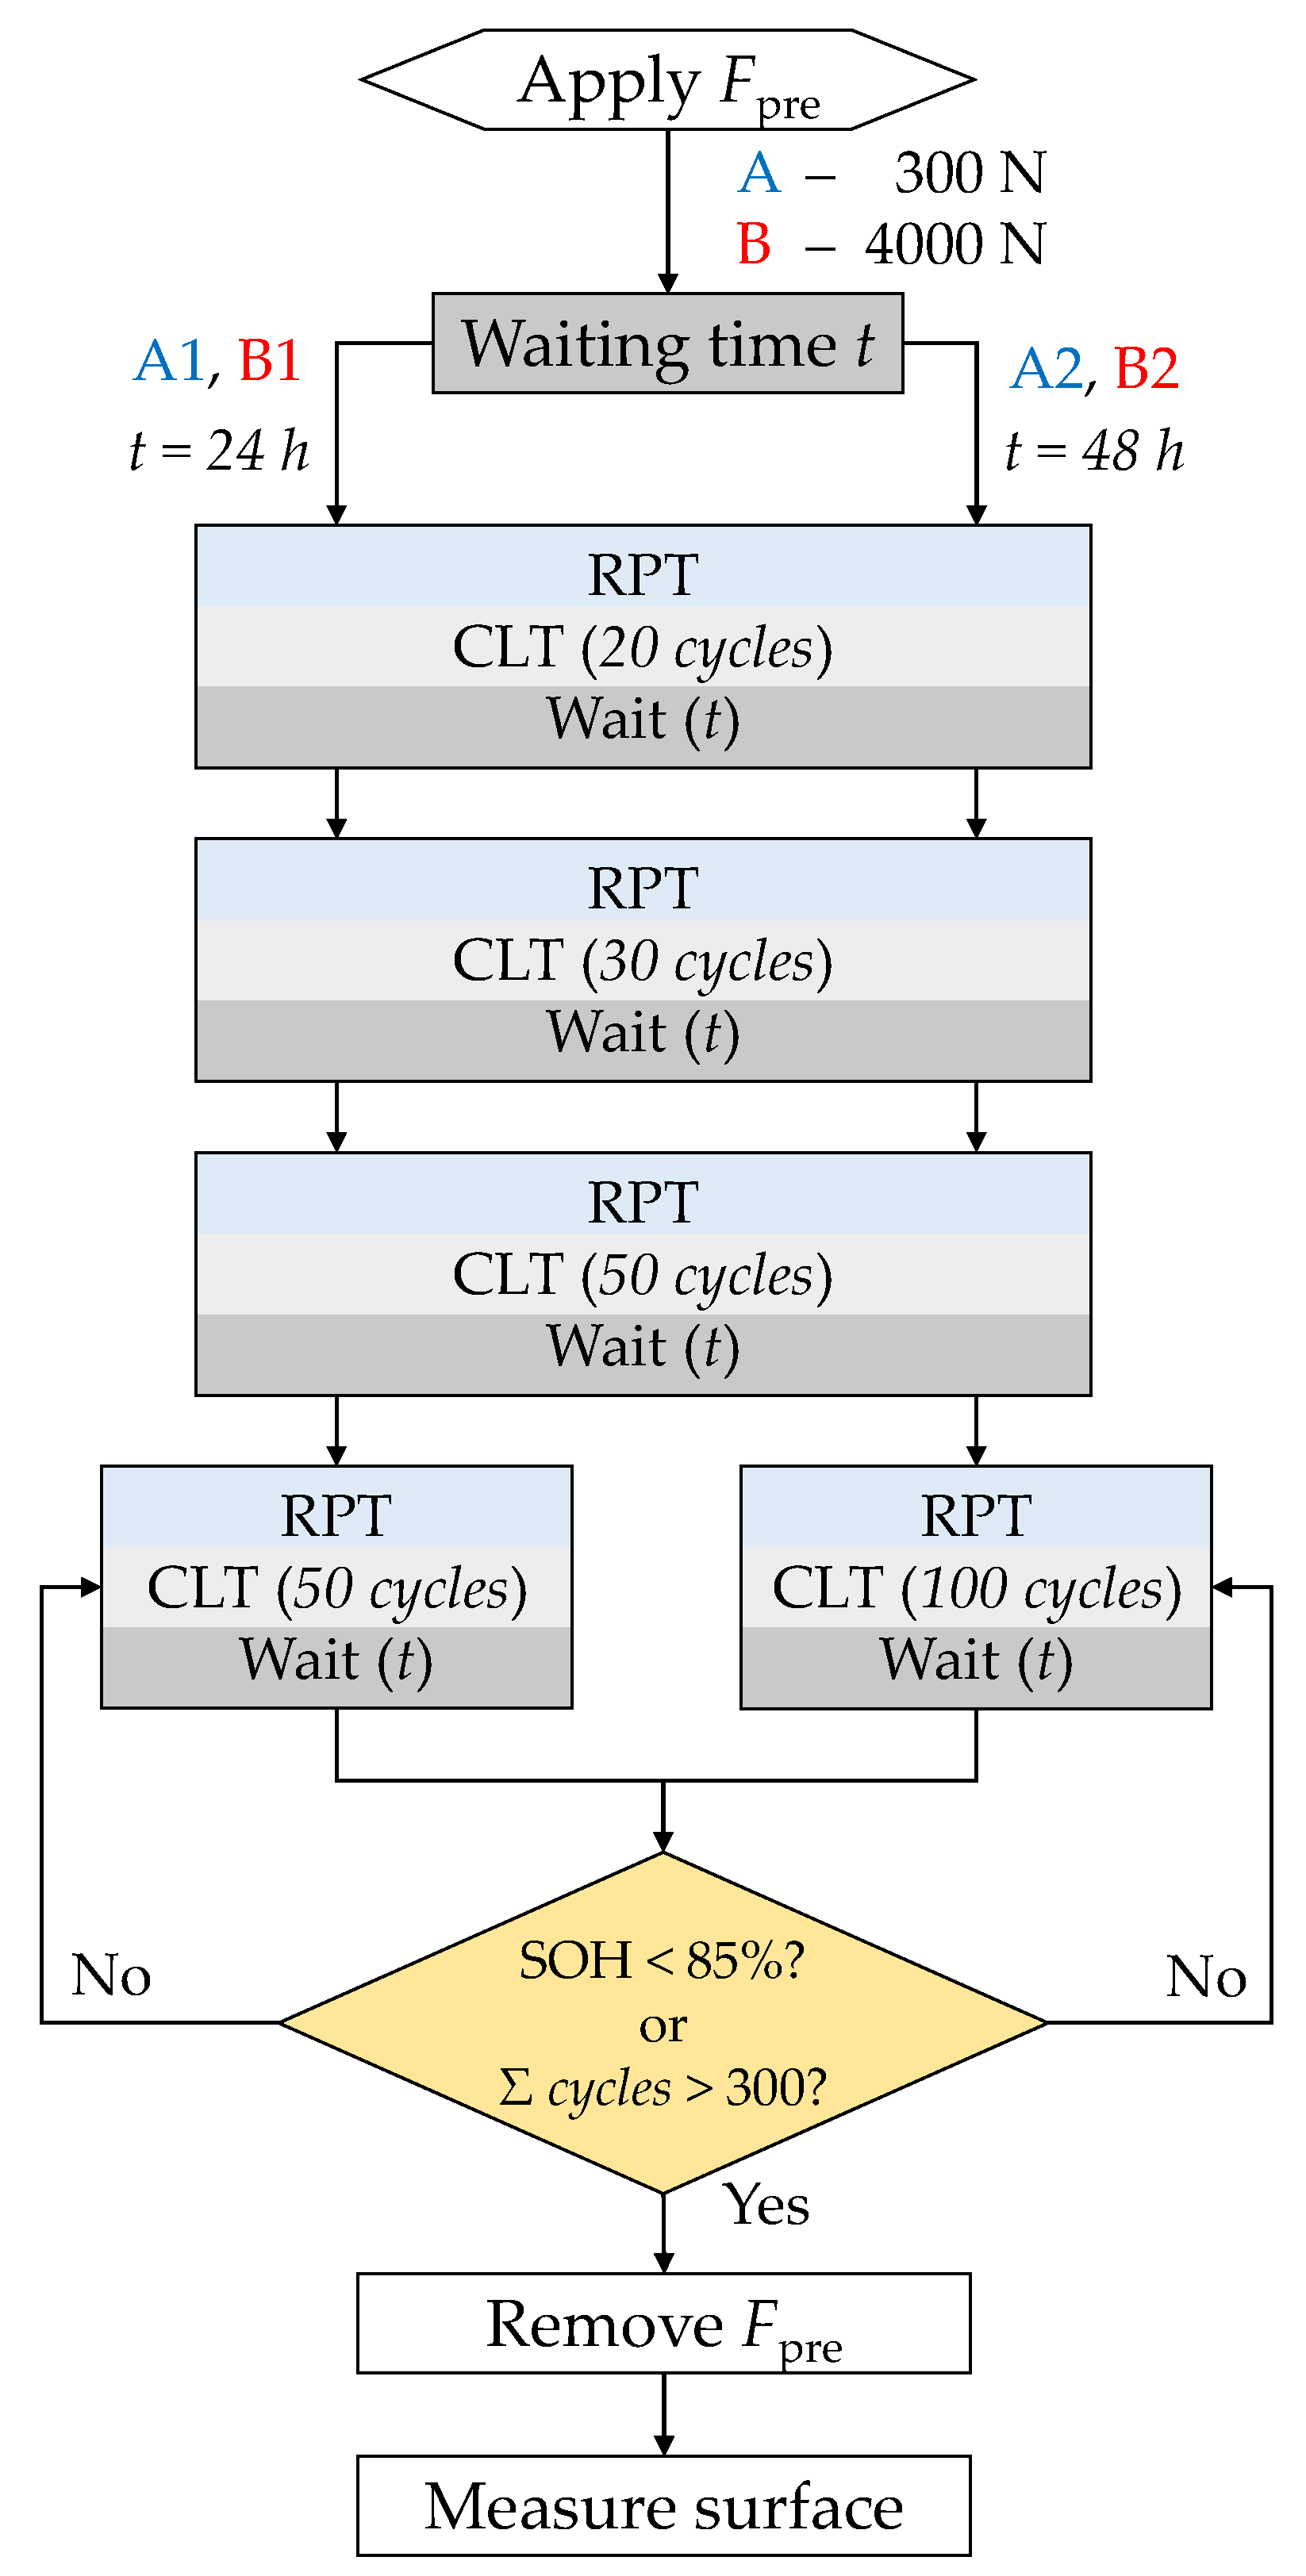
2.3. Aging Procedure

Four pouch cells were constrained in a constant-force spring-based bracing, shown in Figure 2, with a preload force  F pre  of either 300  N  (12.8  kPa ) or 4000  N  (170.9  kPa ) at 30% SOC. Two pouch cells were used for each preload force level (i.e., 300  N  and 4000  N ).
The test setup consisted of two aluminum plates that were guided with four shafts on the edges. Four springs were used to account for a realistic bracing. An overall spring stiffness of 31  N   m m −1 was chosen for the preload force  F pre  of 300  N . For the preload force  F pre  of 4000  N , an overall spring stiffness of 261  N   m m −1 was chosen. The spring stiffness was chosen to imitate the stiffness of commercial compression pads used in battery modules. Four load cells (Burster 8438-6010) were attached on the guiding shafts to set the initial preload force and measure the force evolution. An inductive displacement transducer (Schreiber Messtechnik SM210.10.1.K) was attached in the center of the top aluminum plate to measure the thickness of the pouch cell during electrochemical cycling.
The cycling procedure was conducted with a cell tester (Digatron MCT 200). The cycling procedure was performed inside a thermal chamber (Binder MK240) at 35  C  and consisted of several phases: reference performance test (RPT), cycle life test (CLT) and waiting phases.
RPT was defined in accordance with the USABC protocol [79] and was also used in other publications [80,81]. The RPT protocol consisted of 3 charge and discharge cycles between the upper and lower voltage limits of the pouch cells to determine the actual capacity. The cells were charged with 0.33 C and an abort current of C/20 within a CC-CV procedure. The discharge was performed with a CC procedure with a current of 1 C. After the 3 cycles, a discharge pulse with 3 C and a duration of 30  s  was applied.
The CLT consisted of a specific number of charge and discharge cycles, see Figure 3. Charging and discharging were performed with CC-CV with a charge rate of 0.5 C and an abort current of C/20 and with a CC with a discharge rate of 1.2 C, respectively. The voltage limits were set according to the RPT test to cycle the cells between 0% and 80% SOC. This SOC range was selected following preliminary studies in which rapid degradation was found while cycling over the entire SOC range (i.e., from 0% to 100% SOC), this result is also in line with the scientific literature [82]. Therefore, to reduce the effects of degradation, a reduced SOC range was chosen.
Figure 3 illustrates the overall cycling procedure. An RPT cycle was used to define the voltage limits for the following CLT phase. After the CLT, the cell was brought to 100% SOC and, after a waiting period of 24  h  or 48  h , the procedure continued with the RPT phase. Different waiting periods were selected to check the influence of different waiting periods on the capacity recovery [30]. This procedure was repeated until either 300 cycles were reached within the CLT or 85% SOH was measured within the RPT phase. The pouch cells A1 and A2 were cycled with an initial preload force  F pre  of 300  N  and had a waiting period of 24  h  or 48  h . The pouch cells B1 and B2 were cycled with an initial preload force  F pre  of 4000  N  and had a waiting period of 24  h  or 48  h .

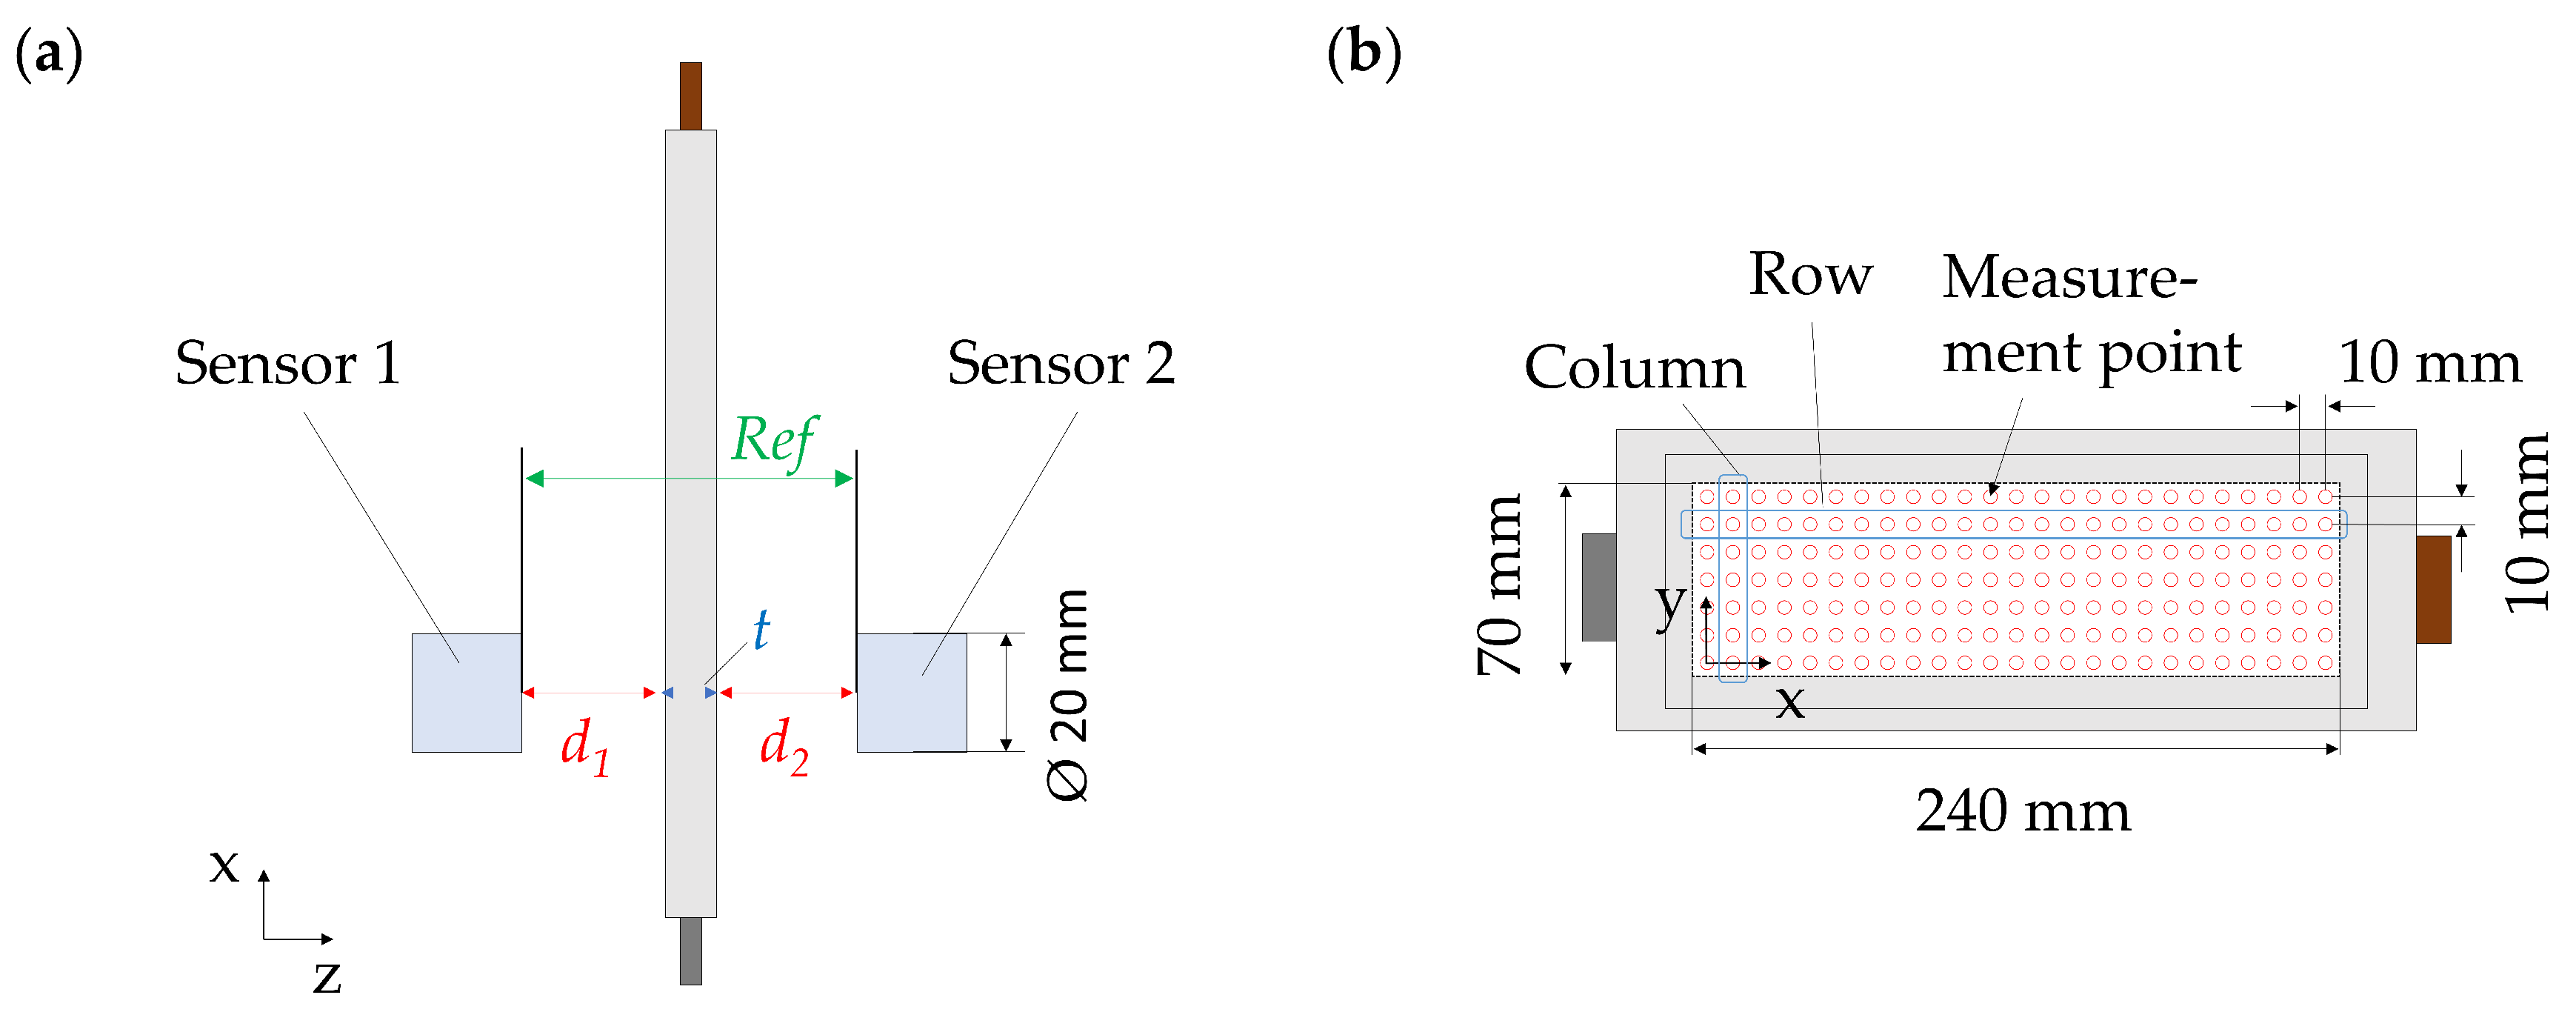
2.4. Local Thickness

A novel surface measurement method was developed to measure the local thickness in a contactless manner and determine the reversible swelling behavior of fresh and aged pouch cells. The pouch cells were fixed in a fixture that allowed a reproducible placement. Two opposing high-precision capacitive sensors (Micro-Epsilon CSE3) with an accuracy of ±0.012  μ m  were attached to a sensor holder. Alignment errors were reduced and the accuracy was increased by the use of two opposing sensors. Both pouch cell fixture and sensor holder were attached to a special test bed consisting of two movable axes. This allowed us to scan the pouch cell’s thickness at different locations. A reference length  R e f  was set with a gauge block to be able to calculate the thickness t of the cell from the distances  d 1  and  d 2  measured by the two capacitive sensors, see Figure 4a. The thickness was measured at 175 different points divided into 7 rows and 25 columns. The measured surface area covered 240 × 70  m m , as shown in Figure 4b. The complete cell surface could not be measured due to the sensor diameter (20  m m ).
The pouch cell’s surface was scanned at 0%, 30%, 60%, 90% and 100% SOC. The pouch cells were discharged with a CC-CV protocol with 0.5 C and an abort current of 0.05 C to 0% SOC. The surface was scanned after a relaxation time of 10 min. This strategy was used since the thickness tends to decrease after the charging/discharging phase. The cause of this phenomenon is the presence of thermal expansion and the diffusion of lithium ions [12,83]. The pouch cell’s thickness did not change significantly after the observance of the relaxation period, as found in a preliminary study. Charging was done with 0.5 C and a CC-CV protocol with an abort current of 0.05 C when the upper voltage limit was reached. The surface was measured on two fresh reference pouch cells (F1, F2) and on the four aged pouch cells (A1, A2, B1, B2) and were repeated twice to validate the measurement results.
The thickness in the center of the pouch cell was measured continuously during charging and discharging. Additionally, the voltage and temperature on the tabs was monitored with the same measurement equipment used for the pressure distribution. The same electric load and power supply as for the pressure distribution measurement were used for the charging and discharging of the pouch cells.
An evaluation method had to be defined to make statements about the homogeneity of the pouch cell’s surface. Figure 5a illustrates exemplary results for a thickness distribution. A pointwise evaluation of the thickness was conducted, and a histogram was created based on the measured thickness. A narrow histogram indicated a homogeneous surface. The histograms were transferred into a boxplot to make the comparability between measurement results easier, see Figure 5b. Q1 and Q3 were used to indicate the first and third quartiles of the evaluated data.
The percentage local thickness increase  Δ t local ( x , y )  was calculated with respect to the measured average thickness at 0% SOC  t avg ( SOC = 0 )  and is described in Equation (1).
Δ t local ( x , y ) = t local ( x , y ) t avg ( SOC = 0 )
t avg ( SOC = 0 )  was calculated by the arithmetic mean of the 175 measurement points. The local thickness  t local ( x , y )  was the measured thickness at the different x- and y-coordinates on the cell’s surface.

3. Results and Discussion

3.1. Pressure Distribution

Figure 6 illustrates the pressure distribution of the two fresh reference cells (F1, F2) at 0% and 100% SOC for the two different initial preload force levels  F pre  of 300  N  and 4000  N . At an initial preload force  F pre  of 300  N , most of the surface was unloaded at 0% SOC. This was also indicated by the boxplot with a median of 0  MPa  for both cells. On the bottom and top edge of the surface at around  y = 210 m m , two small pressure peaks of 0.15  MPa  could be observed for cell F1. The applied preload force was not large enough to flatten the unevenness of the pouch cell. When the pouch cells were charged to 100% SOC, a pressure could be measured along the edges and in the central area of the surface. The boxplots indicated a median of 0.03  MPa  ( Q 1 = 0 MPa Q 3 = 0.09 MPa ) and 0.04  MPa  ( Q 1 = 0 MPa Q 3 = 0.10 MPa ) for cells F1 and F2.
The pouch cells constrained with an initial preload force of  F pre  of 4000  N  showed a large pressure on the pouch cell’s edges at 0% SOC. The central area of the surface was for the most part mechanically loaded at 0% SOC as indicated by the boxplot with a median of 0.11  MPa  ( Q 1 = 0.03 MPa Q 3 = 0.18 MPa ) and 0.11  MPa  ( Q 1 = 0.02 MPa Q 3 = 0.18 MPa ) for cells F1 and F2. However, the right and left edges were not subjected to a mechanical load. Potential irregularities in the thickness, density and resulting mechanical properties of the compression pad might affect the observed pressure distribution. At 100% SOC, the pressure overall increased along the measured area. The boxplots indicated a similar interquartile range with a median of 0.25  MPa  ( Q 1 = 0.13 MPa Q 3 = 0.34 MPa ) and 0.25  MPa  ( Q 1 = 0.13 MPa Q 3 = 0.35 MPa ) for cells F1 and F2.
Strong pressure gradients could be found for an initial preload force  F pre  of 300  N  when charging and discharging. Figure A2 illustrates the pressure distribution with an adapted scale in order to distinguish local gradients. The pressure gradients could be attributed to unevenness of the pouch cells that were not flattened by the applied force. At an initial preload force  F pre  of 4000  N , smaller pressure gradients could be found as the surface appeared to be flattened by the applied force. The force was not high enough to also flatten the right and left edges of the pouch cells. Evaluating the pressure distribution revealed that the percentage difference between the maximum and average value was smaller for a larger initial preload force  F pre  when charging the battery cells from 0% to 100% SOC, suggesting a more homogeneous pressure distribution.

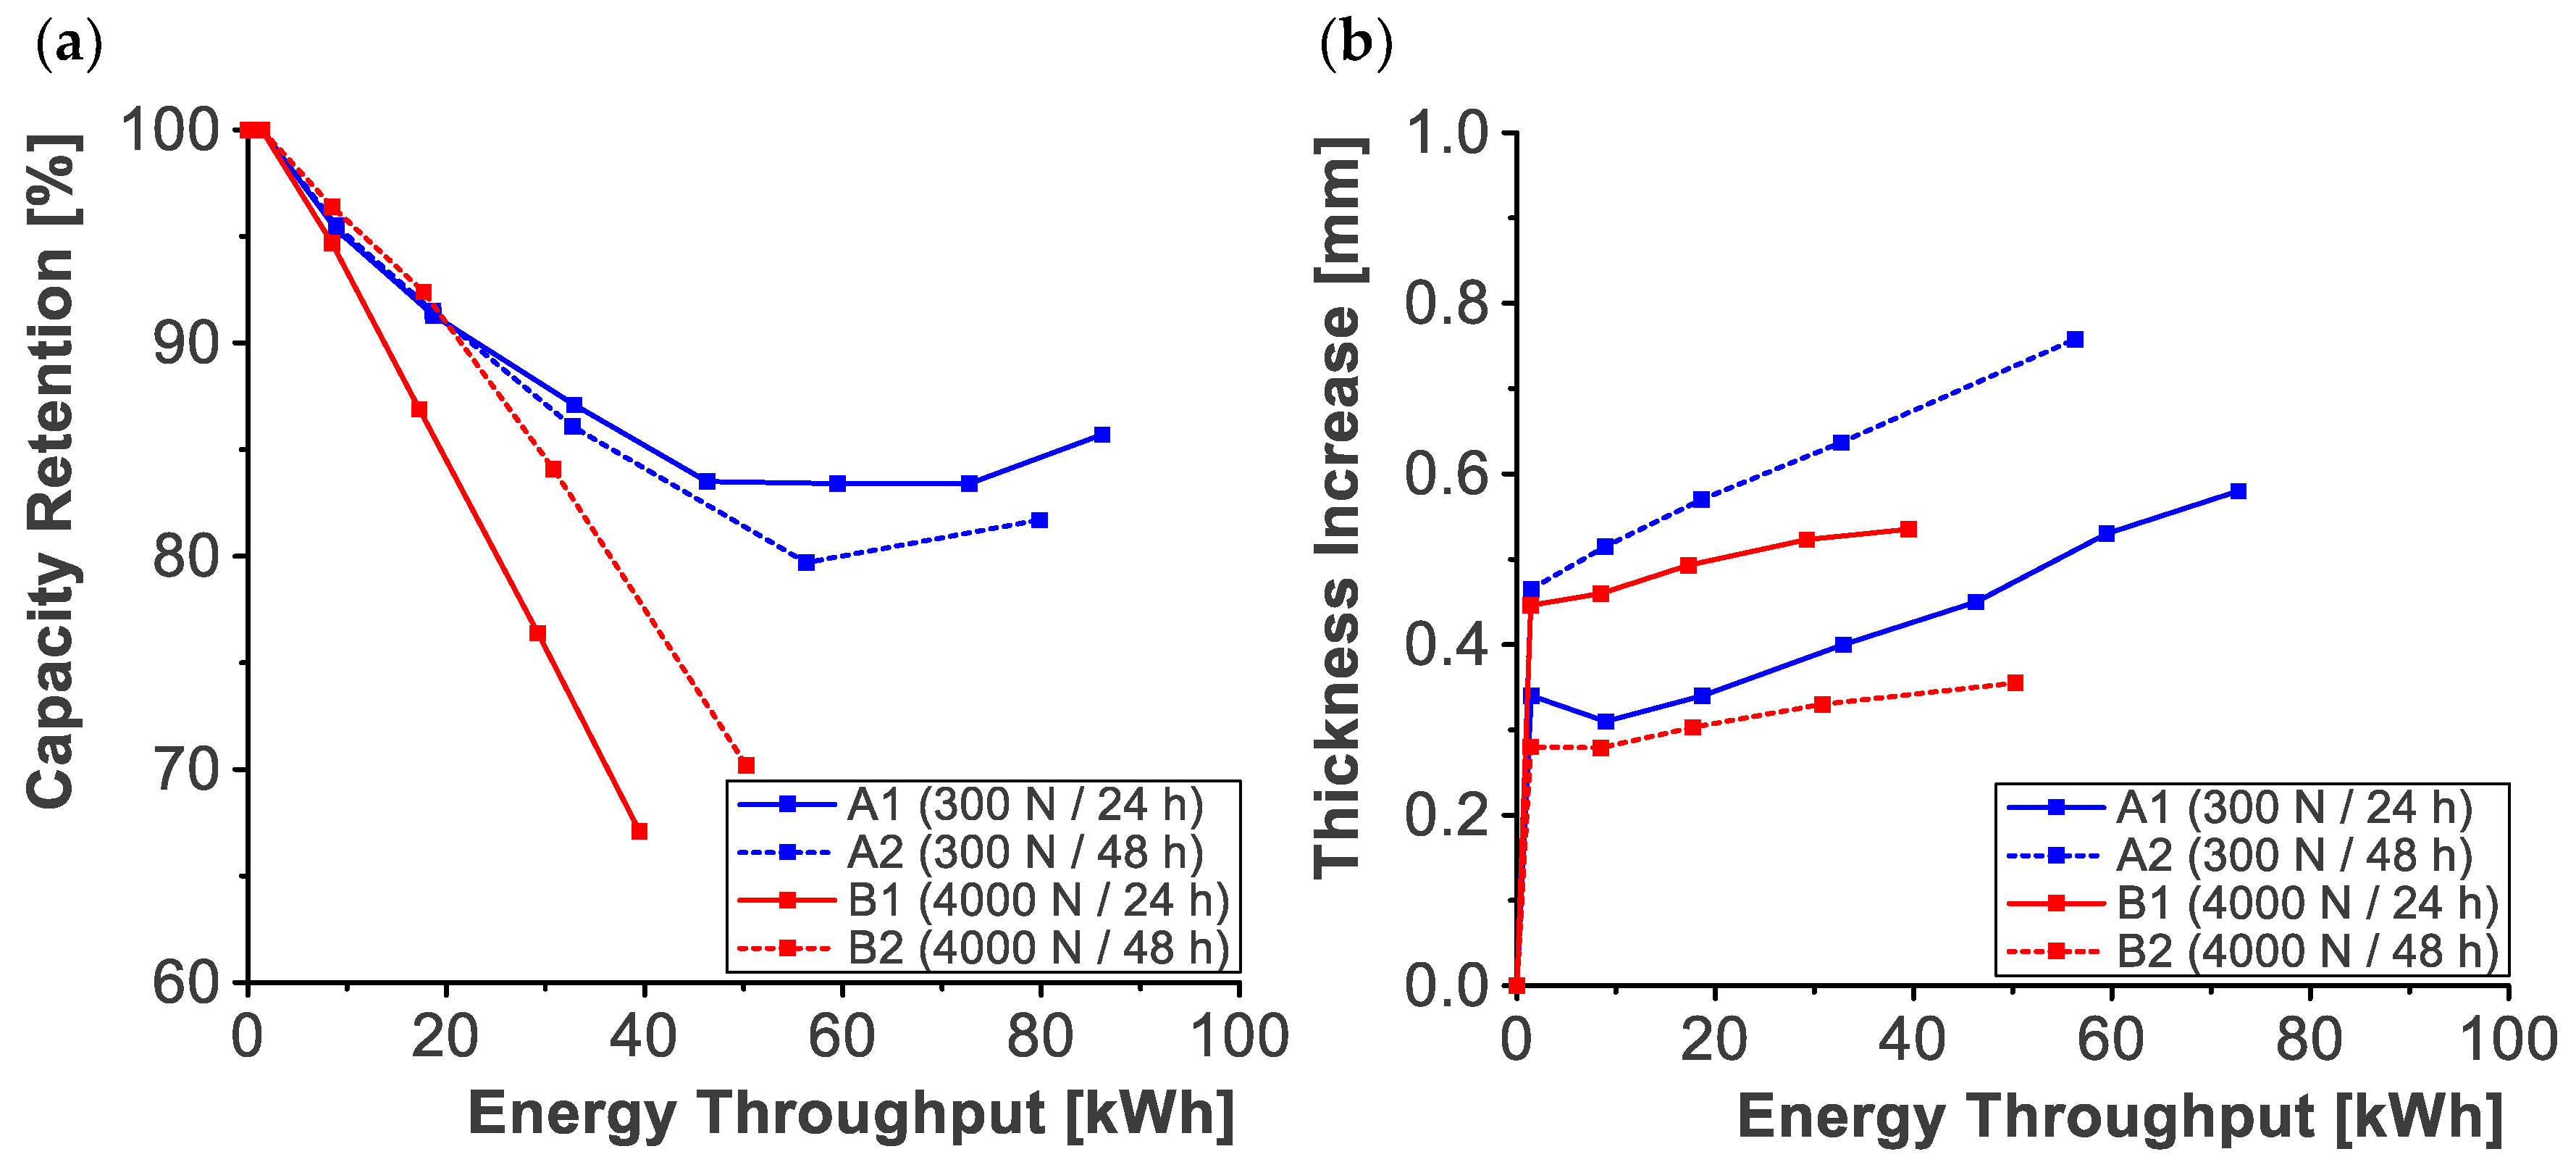
3.2. Aging Procedure

The electrochemical aging procedure caused a capacity fade of the tested pouch cells (A1, A2, B1, B2). Figure 7a illustrates the capacity retention of the pouch cells over the energy throughput. Pouch cells A1 and A2 with an initial preload force  F pre  of 300  N  showed a linear degradation in the first cycles. After 59  k W h  (225 cycles), pouch cell A1 stopped degrading and indicated a capacity retention of about 83.4% SOH. At the end of the aging procedure (86  k W h , 331 cycles), the capacity increased to 85.7% SOH. Pouch cell A2 showed a similar behavior with a linear degradation to 79.7% SOH upon reaching an energy throughput of 56  k W h  (221 cycles). The capacity increased as well for cell A2 to 81.7% SOH at the end of the aging procedure (80  k W h , 323 cycles). Pouch cells B1 and B2 with an initial preload force  F pre  of 4000  N  indicated a stronger degradation when compared to the other tested cells. Cell B1 had a slightly stronger degradation than cell B2. Cell B1 reached the abort criterion after an energy throughput of 39  k W h  (169 cycles) with a capacity retention of 67.1% SOH. The degradation rate for cell B2 increased after an energy throughput of 18  k W h  (61 cycles) and was similar to that of cells A1 and A2 before reaching that energy throughput. Cell B2 reached the abort criterion after an energy throughput of 50  k W h  with a capacity retention of 70.2% SOH. Table 2 summarizes the initial capacity measured after applying the preload force and the capacity retention at the end of the aging procedure.
Figure 7a shows a capacity plateau towards the end of the aging procedure for cells A1 and A2, initially constrained with a preload force  F pre  of 300  N . This capacity trend suggested that the aging was done at an optimal preload force. Conversely, in the case of applying too high (e.g., cells B1 and B2) or too low a preload force, the capacity would rapidly deteriorate [54]. A battery with an applied pressure too low is prone to delamination due to poor contact between the battery layers, whereas if the applied pressure is too high, it causes the separator pore closure and hinders ion transport, resulting in a high local current density and accelerated degradation [11]. Other effects such as the anode overhang effect or reversible lithium plating might superimpose the degradation mechanisms causing the observed capacity plateau, especially in combination with resting periods, and were found to cause a capacity recovery [30,31].
The reduced ion conductivity through the separator caused by a high preload force may also be the cause of the different initial cell capacities shown in Table 2, in which a difference in initial capacity between the cells with a preload force  F pre  of 300  N  and 4000  N  of approximately 1.6  A h  was observed.
The results suggested that the waiting time of 24  h  or 48  h  between the CTL and RPT phases did not affect the capacity retention trend of the pouch cells. This was expected as relaxation occurred in a shorter time frame. Calendar aging caused by longer waiting times could be excluded as the total waiting time was significantly lower than the cycling time. The pouch cells with an initial preload force  F pre  of 4000  N  had different degradation behaviors at the beginning of the cycling but the behaviors became similar after an initial phase.
The degradation mechanisms caused an irreversible thickness increase in the tested battery cells. Figure 7b illustrates the irreversible thickness increase over the energy throughput. The thickness increase considered referred to the absolute thickness increase measured at the end of the third RPT cycle relative to the thickness at the beginning of the cycling procedure. All cells indicated a strong thickness increase at the beginning of the aging procedure. This steep increase in thickness is already present in the scientific literature [52] and can be attributed to the reduction of the electrolyte on the surface of the anode, leading to the formation of the SEI layer on the outer surface of the carbon and causing an increase in volume [84]. This initial thickness increase appeared to be unrelated to the applied preload force and was not deterministic. This might be attributed to an additional mechanical relaxation caused by cycling. After the initial phase, the thickness increased linearly during cycling. The thickness increase rate was higher for pouch cells A1 and A2 with an initial preload force  F pre  of 300  N  than for cells B1 and B2 with a preload force  F pre  of 4000  N . For cells A1 and A2, at the end of the aging procedure, an increase in thickness of 5.46  m m  and 5.49  m m  could be measured, respectively. Cell A1 had a slight decrease in thickness after the initial phase, suggesting an additional relaxation. At the end of the cycling, cells B1 and B2 with an initial preload force  F pre  of 4000  N , increased their thickness by 5.27  m m  and 5.15  m m , respectively.

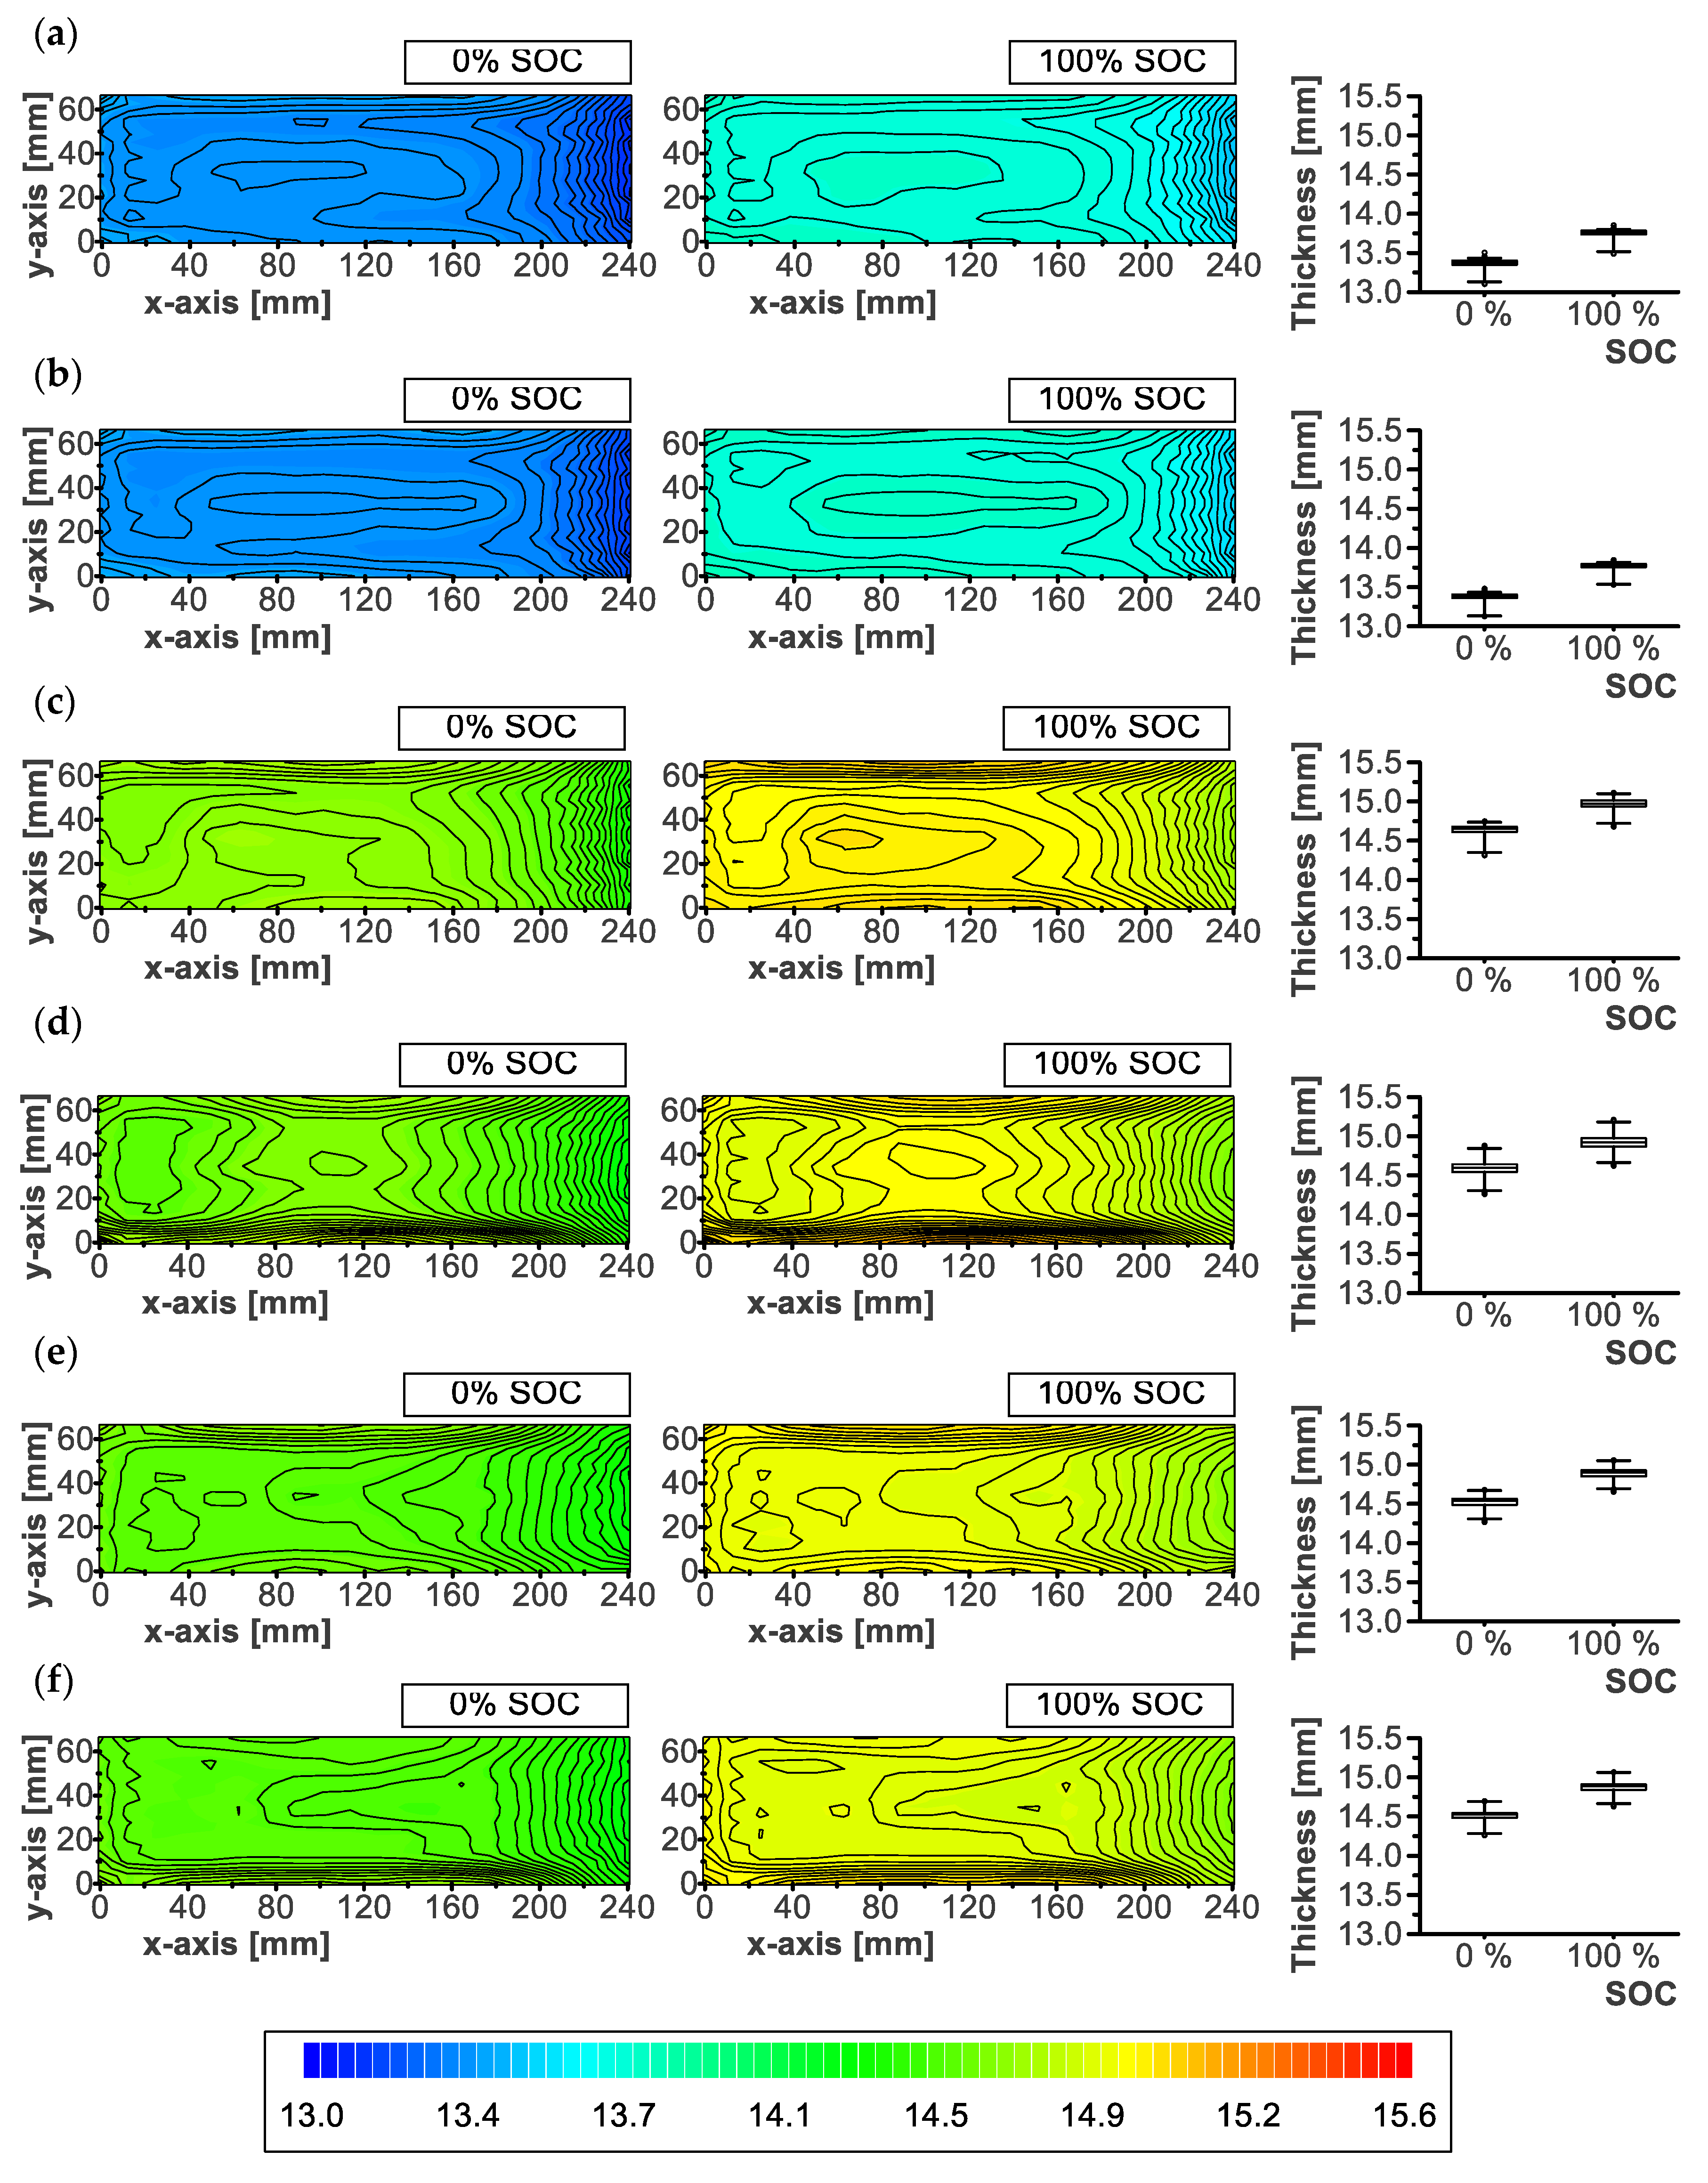
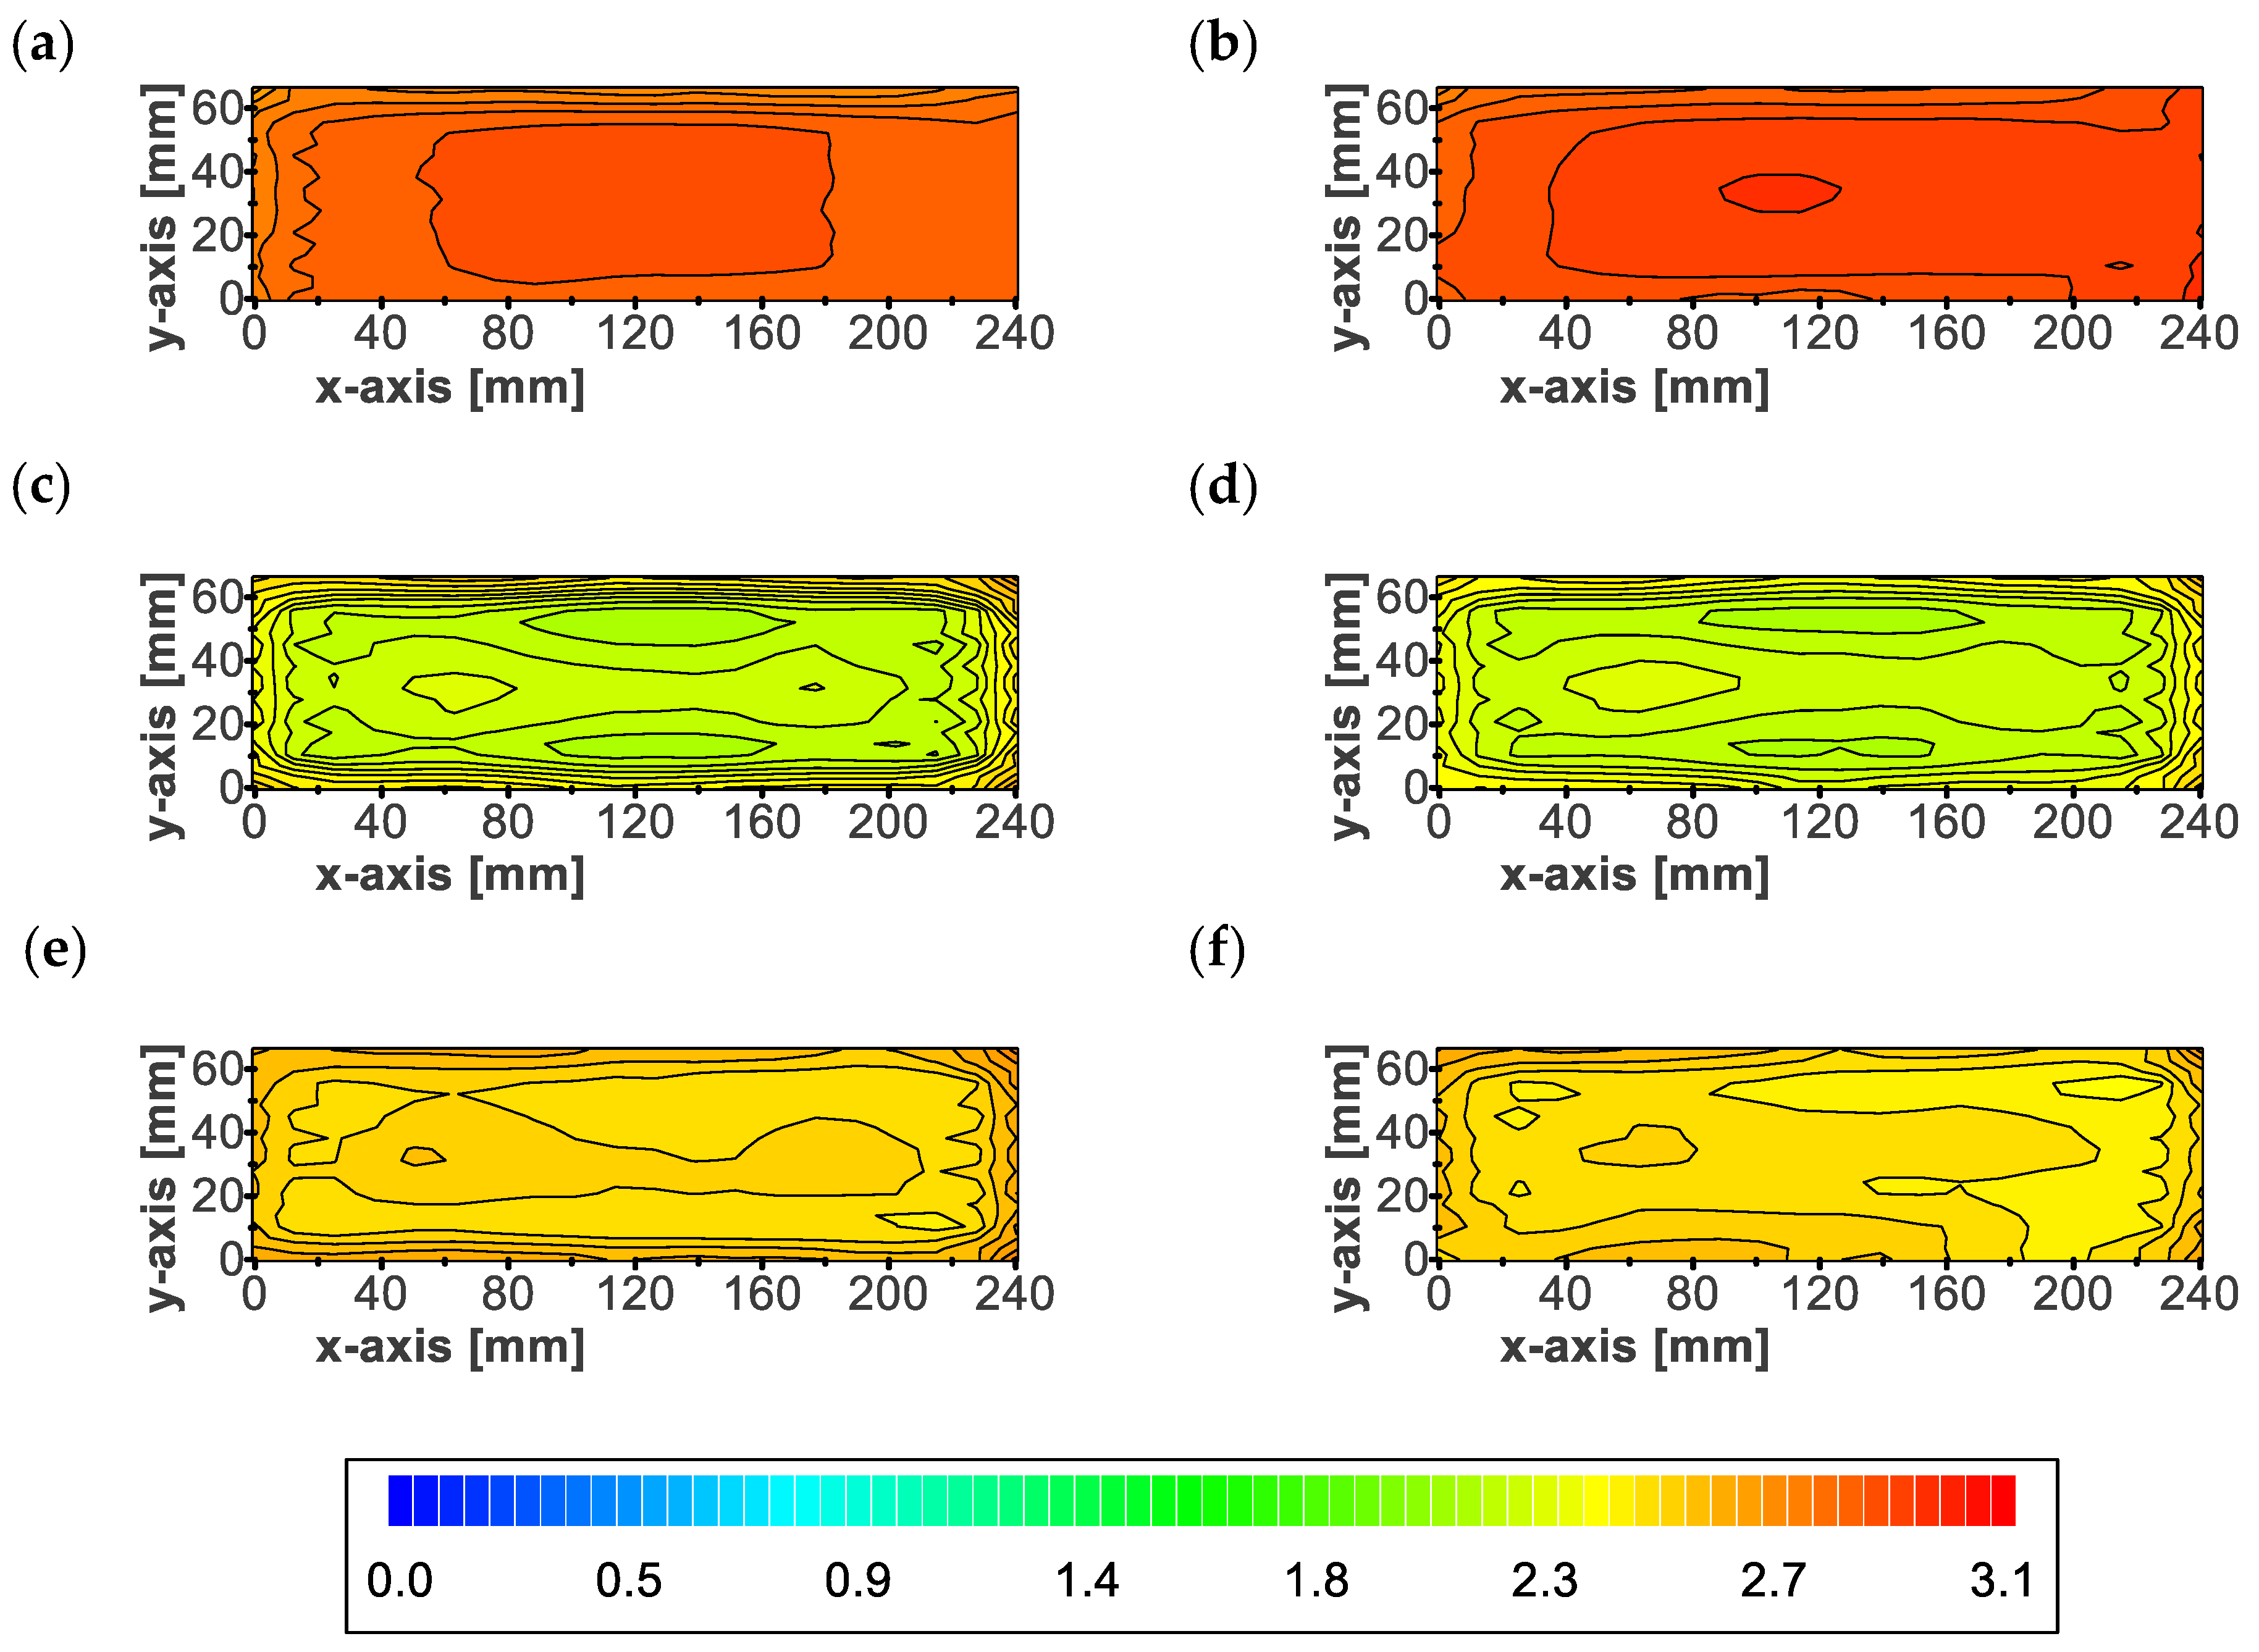
3.3. Local Thickness

The local thickness was measured after removing the preload force  F pre  on the two fresh reference pouch cells (F1, F2) and on the four aged pouch cells (A1, A2, B1, B2). Table 3 summarizes the average thickness of the tested pouch cells at 0% SOC. The average thickness was determined by the arithmetic average of the thickness measured for two repetitions at the 175 measurement points distributed over the pouch cell’s surface. The two fresh cells F1 and F2 had a similar average thickness with 13.37  m m  indicating a low manufacturing scatter. The aged cells had an average thickness of 14.56  m m  meaning an increase of 1.19  m m  compared to the fresh cells. A small difference could be observed within the group of aged cells for the two different preload force levels during electrochemical cycling.
The increase in the thickness of the aged cells differed from the increase in thickness measured during the aging procedure. The difference was attributed to the fact that in the former case the cell was free to expand and was mechanically relaxed while in the latter case, the measured thickness referred to the cell under an applied preload force.
The local thickness of the fresh and aged pouch cells gave more insights on the effect of the pressure distribution during aging. Figure 8 illustrates the local thickness of the investigated pouch cells at 0% and 100% SOC. The boxplots allowed for a statement about the homogeneity of the measured surface. The fresh pouch cells indicated a rather homogeneous thickness for 0% and 100% SOC, indicated by the narrow width of the boxplot (difference between lower and upper quantiles). The boxplot width of the fresh cells was 0.05  m m  and 0.04  m m  at 0% and 100% SOC, respectively.
The aged pouch cells revealed an inhomogeneity in the local thickness indicated by the boxplot width of 0.1  m m . The aged cells A1 and A2 had an increased thickness in the center and on the long edges of the cell. The pressure distribution measurement on fresh cells revealed a larger pressure in these areas. It can be assumed that pressure peaks influenced the local aging behavior and caused an accelerated degradation by mechanisms such as particle cracking or lithium plating [85]. A similar trend could be found for cells B1 and B2 even though another initial preload force was used during aging. This suggested that only pressure gradients caused the observed phenomenon. One hypothesis is that the evolution of the reversible swelling distribution is a consequence of the pressure distribution during aging.
Figure 9 illustrates the local percentage thickness increase from 0% to 100% SOC. The averaged local thickness at 0% SOC was taken as a reference. The fresh pouch cells F1 and F2 showed a rather homogeneous thickness increase as expected by considering the absolute thickness. On the edges, the fresh cells showed a reduced expansion. All aged cells indicated an inhomogeneity in the percentage thickness increase. A larger thickness increase could be observed in the central area of the cells and along the edges. Cells A1 and A2, aged with a preload force  F pre  of 300  N , showed a different behavior than that of cells B1 and B2 in terms of absolute values. The distribution and inhomogeneity were similar for the cells aged under different preload force levels  F pre .
The results indicated that aging changed the internal structure of the cells. The lower percentage thickness increase for aged cells when compared to fresh cells could be attributed to the lower content of cyclable lithium. Cyclable lithium is bound by degradation mechanisms such as lithium plating [86] causing an irreversible thickness increase. This is indicated also by the reduced SOH. Less available lithium leads to a lower potential of expansion, as the lithiation in active material and resulting structural lattice changes are the main cause for reversible swelling.

3.4. Limitations

The stiffness of the test bed was not evaluated and may differ from the stiffness of a real battery module. However, the stiffness of the test bed was expected to be very high when compared to the stiffness of the compression pads used. Therefore, the test bed stiffness was assumed to be negligible. The compression pads were used to get closer to the realistic boundary conditions imposed by the battery module. An example of an improved test bed is the one built by Deich et al. [47] being able to map different battery-module stiffness values.

4. Conclusions

In this study, the surface pressure distribution of two fresh pouch cells was measured with an initial preload force (300  N , 4000  N ) at different SOCs (0%, 100%). Four other fresh cells were electrochemically cycled with a specific aging procedure. Upon electrochemical cycling, the cells were constrained with an initial preload force  F pre  of 300  N  and 4000  N  to investigate the influence of pressure peaks on the degradation mechanism. The reversible swelling behavior was determined by local thickness measurements of the fresh and aged cells.
The pressure distribution revealed peaks up to 0.60  MPa  along the edges and in the central area of the fresh cells. These pressure peaks were expected to cause a local degradation resulting in a local increase in thickness.
The aging procedure was used to prove this hypothesis and showed a linear decrease in capacity for pouch cells with an initial preload force  F pre  of 4000  N . The capacity fading was faster than the one observed for pouch cells constrained with a preload force  F pre  of 300  N . At the lower initial preload force, first a linear capacity fading was observed, followed by a constant capacity retention over the energy throughput. Considering the irreversible thickness increase, a strong increase was observed in the beginning without having a deterministic behavior. After the initial phase, the cell thickness was increasing linearly over the energy throughput. The cells with an initial preload force  F pre  of 4000  N  revealed a slower increase in thickness when compared to the ones constrained with 300  N . From the local thickness measurements of unconstrained cells, the reversible swelling behavior was found to be different between fresh and aged cells. Fresh cells were characterized by a higher but more homogeneous increase in thickness, whereas a similar behavior was found among the cells that followed different aging procedures.
The following conclusion can be drawn from the presented study:
  • Thickness variations related to reversible swelling were conditioned by aging. An aged cell was characterized by a smaller increase in thickness and a different distribution.
  • The inhomogeneous irreversible thickness increase did not depend on the level of initial preload force and is expected to be dependent on pressure gradients during aging.
  • Positions with higher pressure were prone to irreversible thickness increase. In the case of the investigated pouch cells, these positions were along the edges and in the central area.
A homogeneous pressure distribution throughout the life cycle of the battery is essential to avoid large stress gradients throughout the cell surface. Pressure peaks might result in local degradation, leading to the generation of local hot spots and lithium plating. This results in the reduction of battery life and increases the potential of safety concerns associated with the battery. Hence, for both performance and safety reasons, it is crucial to optimize the automotive module design so that the pressure applied on the cells is homogeneous and kept in an optimal range. Further research is needed to investigate the causes leading to an inhomogeneous pressure on fresh and aged cells in order to reduce the associated risks.

Author Contributions

Conceptualization, E.M. and P.H.; methodology, E.M. and P.H.; software, E.M. and P.H.; validation, E.M.; formal analysis, E.M., P.H. and S.E.; investigation, E.M.; data curation, E.M. and S.E.; resources, S.E.; writing—original draft preparation, E.M. and P.H.; writing—review and editing, E.M., P.H., S.F.H. and S.E.; visualization, P.H.; supervision, S.F.H. and C.E.; project administration, S.F.H. and C.E.; funding acquisition, S.F.H. and C.E. All authors have read and agreed to the published version of the manuscript.

Funding

The presented work was conducted within the scope of the research project BonuS, a cooperation of the Vehicle Safety Institute at Graz University of Technology with the Institute for Chemistry and Technology of Materials at Graz University of Technology and AVL List GmbH, Graz. BonuS has received funding from AVL List GmbH, Graz and the Austrian Research Promotion Agency (FFG) (grant agreement no. 874834).

Data Availability Statement

The data presented in this study are available on request from the corresponding author. The data are not publicly available due to privacy restrictions.

Acknowledgments

Open Access Funding by the Graz University of Technology.

Conflicts of Interest

The authors declare no conflict of interest.

Abbreviations

The following abbreviations are used in this manuscript:
CC-CVConstant current–constant voltage
CLTCycle life test
EVElectric vehicle
LLILoss of lithium inventory
LIBLithium-ion battery
RPTReference performance test
SOCState of charge
SOHState of health

Appendix A

Appendix A.1

Figure A1 shows the compression force deflection curve of the compression pads used in the test setup shown in Figure 1.
Figure A1. Compression force deflection curve of the compression pad PORON® 4701-60 Polyurethane used to measure the pressure distribution.
Batteries 09 00218 g0a1

Appendix A.2

Figure A2 shows the pressure distribution of cells F1 and F2 at 0% SOC and 100% SOC with preload force of 300 N and 4000 N. In contrast to Figure 6, a different scale was used between 0% SOC and 100% SOC thus making the gradient at these SOCs more noticeable.
Figure A2. Pressure distribution  MPa  of the two fresh reference cells F1 and F2 at 0% and 100% SOC. (a) F1 and  F pre = 300 N . (b) F2 and  F pre = 300 N . (c) F1 and  F pre = 4000 N . (d) F2 and  F pre = 4000 N .
Batteries 09 00218 g0a2aBatteries 09 00218 g0a2b

References

  1. IEA. Global EV Outlook 2022; IEA: Paris, France, 2022. [Google Scholar]
  2. Feng, X.; Ouyang, M.; Liu, X.; Lu, L.; Xia, Y.; He, X. Thermal runaway mechanism of lithium ion battery for electric vehicles: A review. Energy Storage Mater. 2018, 10, 246–267. [Google Scholar] [CrossRef]
  3. Ouyang, D.; Chen, M.; Huang, Q.; Weng, J.; Wang, Z.; Wang, J. A Review on the Thermal Hazards of the Lithium-Ion Battery and the Corresponding Countermeasures. Appl. Sci. 2019, 9, 2483. [Google Scholar] [CrossRef] [Green Version]
  4. Chen, Y.; Kang, Y.; Zhao, Y.; Wang, L.; Liu, J.; Li, Y.; Liang, Z.; He, X.; Li, X.; Tavajohi, N.; et al. A review of lithium-ion battery safety concerns: The issues, strategies, and testing standards. J. Energy Chem. 2021, 59, 83–99. [Google Scholar] [CrossRef]
  5. Duan, J.; Tang, X.; Dai, H.; Yang, Y.; Wu, W.; Wei, X.; Huang, Y. Building safe lithium-ion batteries for electric vehicles: A review. Electrochem. Energy Rev. 2020, 3, 1–42. [Google Scholar] [CrossRef] [Green Version]
  6. Höschele, P.; Heindl, S.F.; Erker, S.; Ellersdorfer, C. Influence of reversible swelling and preload force on the failure behavior of a lithium-ion pouch cell tested under realistic boundary conditions. J. Energy Storage, 2023; in press. [Google Scholar]
  7. Bach, T.C.; Schuster, S.F.; Fleder, E.; Müller, J.; Brand, M.J.; Lorrmann, H.; Jossen, A.; Sextl, G. Nonlinear aging of cylindrical lithium-ion cells linked to heterogeneous compression. J. Energy Storage 2016, 5, 212–223. [Google Scholar] [CrossRef]
  8. Barai, A.; Tangirala, R.; Uddin, K.; Chevalier, J.; Guo, Y.; McGordon, A.; Jennings, P. The effect of external compressive loads on the cycle lifetime of lithium-ion pouch cells. J. Energy Storage 2017, 13, 211–219. [Google Scholar] [CrossRef] [Green Version]
  9. Daubinger, P.; Ebert, F.; Hartmann, S.; Giffin, G.A. Impact of electrochemical and mechanical interactions on lithium-ion battery performance investigated by operando dilatometry. J. Power Sources 2021, 488, 229457. [Google Scholar] [CrossRef]
  10. Klett, M.; Eriksson, R.; Groot, J.; Svens, P.; Ciosek Högström, K.; Lindström, R.W.; Berg, H.; Gustafson, T.; Lindbergh, G.; Edström, K. Non-uniform aging of cycled commercial LiFePO4//graphite cylindrical cells revealed by post-mortem analysis. J. Power Sources 2014, 257, 126–137. [Google Scholar] [CrossRef]
  11. Li, R.; Li, W.; Singh, A.; Ren, D.; Hou, Z.; Ouyang, M. Effect of external pressure and internal stress on battery performance and lifespan. Energy Storage Mater. 2022, 52, 395–429. [Google Scholar] [CrossRef]
  12. Rieger, B.; Erhard, S.V.; Rumpf, K.; Jossen, A. A New Method to Model the Thickness Change of a Commercial Pouch Cell during Discharge. J. Electrochem. Soc. 2016, 163, A1566–A1575. [Google Scholar] [CrossRef]
  13. Zhao, Y.; Patel, Y.; Hunt, I.A.; Kareh, K.M.; Holland, A.A.; Korte, C.; Dear, J.P.; Yue, Y.; Offer, G.J. Preventing lithium ion battery failure during high temperatures by externally applied compression. J. Energy Storage 2017, 13, 296–303. [Google Scholar] [CrossRef]
  14. Zhou, Y. External pressure: An overlooked metric in evaluating next-generation battery performance. Curr. Opin. Electrochem. 2022, 31, 100916. [Google Scholar] [CrossRef]
  15. Zhao, J.; Hong, M.; Ju, Z.; Yan, X.; Gai, Y.; Liang, Z. Durable Lithium Metal Anodes Enabled by Interfacial Layers Based on Mechanically Interlocked Networks Capable of Energy Dissipation. Angew. Chem. 2022, 61, e202214386. [Google Scholar] [CrossRef]
  16. Xu, W.; Wang, J.; Ding, F.; Chen, X.; Nasybulin, E.; Zhang, Y.; Zhang, J.G. Lithium metal anodes for rechargeable batteries. Energy Environ. Sci. 2014, 7, 513–537. [Google Scholar] [CrossRef]
  17. Cannarella, J.; Arnold, C.B. Ion transport restriction in mechanically strained separator membranes. J. Power Sources 2013, 226, 149–155. [Google Scholar] [CrossRef]
  18. Cannarella, J.; Arnold, C.B. The Effects of Defects on Localized Plating in Lithium-Ion Batteries. J. Electrochem. Soc. 2015, 162, A1365–A1373. [Google Scholar] [CrossRef] [Green Version]
  19. Fuchs, G.; Willenberg, L.; Ringbeck, F.; Sauer, D.U. Post-Mortem Analysis of Inhomogeneous Induced Pressure on Commercial Lithium-Ion Pouch Cells and Their Effects. Sustainability 2019, 11, 6738. [Google Scholar] [CrossRef] [Green Version]
  20. Mohanty, D.; Hockaday, E.; Li, J.; Hensley, D.K.; Daniel, C.; Wood, D.L. Effect of electrode manufacturing defects on electrochemical performance of lithium-ion batteries: Cognizance of the battery failure sources. J. Power Sources 2016, 312, 70–79. [Google Scholar] [CrossRef] [Green Version]
  21. Spingler, F.B.; Friedrich, S.; Kücher, S.; Schmid, S.; López-Cruz, D.; Jossen, A. The Effects of Non-Uniform Mechanical Compression of Lithium-Ion Cells on Local Current Densities and Lithium Plating. J. Electrochem. Soc. 2021, 168, 110515. [Google Scholar] [CrossRef]
  22. Xie, Y.; Wang, S.; Li, R.; Ren, D.; Yi, M.; Xu, C.; Han, X.; Lu, L.; Friess, B.; Offer, G.; et al. Inhomogeneous degradation induced by lithium plating in a large-format lithium-ion battery. J. Power Sources 2022, 542, 231753. [Google Scholar] [CrossRef]
  23. Arunachala, R.; Parthasarathy, C.; Jossen, A.; Garche, J. Inhomogeneities in Large Format Lithium Ion Cells: A Study by Battery Modelling Approach. ECS Trans. 2016, 73, 201–212. [Google Scholar] [CrossRef]
  24. Galatro, D.; Al-Zareer, M.; Da Silva, C.; Romero, D.A.; Amon, C.H. Thermal behavior of lithium-ion batteries: Aging, heat generation, thermal management and failure. Front. Heat Mass Transf. 2020, 14, 17. [Google Scholar] [CrossRef]
  25. Ren, D.; Feng, X.; Liu, L.; Hsu, H.; Lu, L.; Wang, L.; He, X.; Ouyang, M. Investigating the relationship between internal short circuit and thermal runaway of lithium-ion batteries under thermal abuse condition. Energy Storage Mater. 2021, 34, 563–573. [Google Scholar] [CrossRef]
  26. Lin, X.; Khosravinia, K.; Hu, X.; Li, J.; Lu, W. Lithium Plating Mechanism, Detection, and Mitigation in Lithium-Ion Batteries. Prog. Energy Combust. Sci. 2021, 87, 100953. [Google Scholar] [CrossRef]
  27. Zhao, X.; Yin, Y.; Hu, Y.; Choe, S.Y. Electrochemical-thermal modeling of lithium plating/stripping of Li(Ni0.6Mn0.2Co0.2)O2/Carbon lithium-ion batteries at subzero ambient temperatures. J. Power Sources 2019, 418, 61–73. [Google Scholar] [CrossRef]
  28. Bitzer, B.; Gruhle, A. A new method for detecting lithium plating by measuring the cell thickness. J. Power Sources 2014, 262, 297–302. [Google Scholar] [CrossRef]
  29. Bauer, M.; Wachtler, M.; Stöwe, H.; Persson, J.V.; Danzer, M.A. Understanding the dilation and dilation relaxation behavior of graphite-based lithium-ion cells. J. Power Sources 2016, 317, 93–102. [Google Scholar] [CrossRef]
  30. Epding, B.; Rumberg, B.; Jahnke, H.; Stradtmann, I.; Kwade, A. Investigation of significant capacity recovery effects due to long rest periods during high current cyclic aging tests in automotive lithium ion cells and their influence on lifetime. J. Energy Storage 2019, 22, 249–256. [Google Scholar] [CrossRef]
  31. Lewerenz, M.; Dechent, P.; Sauer, D.U. Investigation of capacity recovery during rest period at different states-of-charge after cycle life test for prismatic Li(Ni1/3Mn1/3Co1/3)O2-graphite cells. J. Energy Storage 2019, 21, 680–690. [Google Scholar] [CrossRef]
  32. Tang, M.; Albertus, P.; Newman, J. Two-Dimensional Modeling of Lithium Deposition during Cell Charging. J. Electrochem. Soc. 2009, 156, A390. [Google Scholar] [CrossRef]
  33. Spingler, F.B.; Naumann, M.; Jossen, A. Capacity Recovery Effect in Commercial LiFePO4/Graphite Cells. J. Electrochem. Soc. 2020, 167, 040526. [Google Scholar] [CrossRef]
  34. Liu, X.M.; Arnold, C.B. Effects of Cycling Ranges on Stress and Capacity Fade in Lithium-Ion Pouch Cells. J. Electrochem. Soc. 2016, 163, A2501–A2507. [Google Scholar] [CrossRef] [Green Version]
  35. Fu, R.; Xiao, M.; Choe, S.Y. Modeling, validation and analysis of mechanical stress generation and dimension changes of a pouch type high power Li-ion battery. J. Power Sources 2013, 224, 211–224. [Google Scholar] [CrossRef]
  36. Grimsmann, F.; Brauchle, F.; Gerbert, T.; Gruhle, A.; Knipper, M.; Parisi, J. Hysteresis and current dependence of the thickness change of lithium-ion cells with graphite anode. J. Energy Storage 2017, 12, 132–137. [Google Scholar] [CrossRef]
  37. Sauerteig, D.; Hanselmann, N.; Arzberger, A.; Reinshagen, H.; Ivanov, S.; Bund, A. Electrochemical-mechanical coupled modeling and parameterization of swelling and ionic transport in lithium-ion batteries. J. Power Sources 2018, 378, 235–247. [Google Scholar] [CrossRef]
  38. Zhao, Y.; Spingler, F.B.; Patel, Y.; Offer, G.J.; Jossen, A. Localized Swelling Inhomogeneity Detection in Lithium Ion Cells Using Multi-Dimensional Laser Scanning. J. Electrochem. Soc. 2019, 166, A27–A34. [Google Scholar] [CrossRef]
  39. Kovachev, G.; Ellersdorfer, C.; Gstrein, G.; Hanzu, I.; Wilkening, H.M.R.; Werling, T.; Schauwecker, F.; Sinz, W. Safety assessment of electrically cycled cells at high temperatures under mechanical crush loads. eTransportation 2020, 6, 100087. [Google Scholar] [CrossRef]
  40. Dahn, J.R.; Fong, R.; Spoon, M.J. Suppression of staging in lithium-intercalated carbon by disorder in the host. Phys. Rev. Condens. Matter 1990, 42, 6424–6432. [Google Scholar] [CrossRef] [Green Version]
  41. Yabuuchi, N.; Ohzuku, T. Novel lithium insertion material of LiCo1/3Ni1/3Mn1/3O2 for advanced lithium-ion batteries. J. Power Sources 2003, 119-121, 171–174. [Google Scholar] [CrossRef]
  42. Li, R.; Ren, D.; Guo, D.; Xu, C.; Fan, X.; Hou, Z.; Lu, L.; Feng, X.; Han, X.; Ouyang, M. Volume Deformation of Large-Format Lithium Ion Batteries under Different Degradation Paths. J. Electrochem. Soc. 2019, 166, A4106–A4114. [Google Scholar] [CrossRef]
  43. Sturm, J.; Spingler, F.B.; Rieger, B.; Rheinfeld, A.; Jossen, A. Non-Destructive Detection of Local Aging in Lithium-Ion Pouch Cells by Multi-Directional Laser Scanning. J. Electrochem. Soc. 2017, 164, A1342–A1351. [Google Scholar] [CrossRef]
  44. Choi, Y.H.; Lim, H.K.; Seo, J.H.; Shin, W.J.; Choi, J.H.; Park, J.H. Development of Standardized Battery Pack for Next-Generation PHEVs in Considering the Effect of External Pressure on Lithium-Ion Pouch Cells. SAE Int. J. Altern. Powertrains 2018, 7, 195–205. [Google Scholar] [CrossRef]
  45. Cannarella, J.; Arnold, C.B. Stress evolution and capacity fade in constrained lithium-ion pouch cells. J. Power Sources 2014, 245, 745–751. [Google Scholar] [CrossRef]
  46. Cannarella, J.; Arnold, C.B. State of health and charge measurements in lithium-ion batteries using mechanical stress. J. Power Sources 2014, 269, 7–14. [Google Scholar] [CrossRef]
  47. Deich, T.; Hahn, S.L.; Both, S.; Birke, K.P.; Bund, A. Validation of an actively-controlled pneumatic press to simulate automotive module stiffness for mechanically representative lithium-ion cell aging. J. Energy Storage 2020, 28, 101192. [Google Scholar] [CrossRef]
  48. Hahn, S.; Theil, S.; Kroggel, J.; Birke, K.P. Pressure Prediction Modeling and Validation for Lithium-Ion Pouch Cells in Buffered Module Assemblies. J. Energy Storage 2021, 40, 102517. [Google Scholar] [CrossRef]
  49. Mohan, S.; Kim, Y.; Siegel, J.B.; Samad, N.A.; Stefanopoulou, A.G. A Phenomenological Model of Bulk Force in a Li-Ion Battery Pack and Its Application to State of Charge Estimation. J. Electrochem. Soc. 2014, 161, A2222–A2231. [Google Scholar] [CrossRef] [Green Version]
  50. Oh, K.Y.; Epureanu, B.I.; Siegel, J.B.; Stefanopoulou, A.G. Phenomenological force and swelling models for rechargeable lithium-ion battery cells. J. Power Sources 2016, 310, 118–129. [Google Scholar] [CrossRef] [Green Version]
  51. Sauerteig, D.; Ivanov, S.; Reinshagen, H.; Bund, A. Reversible and irreversible dilation of lithium-ion battery electrodes investigated by in-situ dilatometry. J. Power Sources 2017, 342, 939–946. [Google Scholar] [CrossRef]
  52. Deich, T.; Storch, M.; Steiner, K.; Bund, A. Effects of module stiffness and initial compression on lithium-ion cell aging. J. Power Sources 2021, 506, 230163. [Google Scholar] [CrossRef]
  53. Müller, V.; Scurtu, R.G.; Richter, K.; Waldmann, T.; Memm, M.; Danzer, M.A.; Wohlfahrt-Mehrens, M. Effects of Mechanical Compression on the Aging and the Expansion Behavior of Si/C-Composite|NMC811 in Different Lithium-Ion Battery Cell Formats. J. Electrochem. Soc. 2019, 166, A3796–A3805. [Google Scholar] [CrossRef]
  54. Mussa, A.S.; Klett, M.; Lindbergh, G.; Lindström, R.W. Effects of external pressure on the performance and ageing of single-layer lithium-ion pouch cells. J. Power Sources 2018, 385, 18–26. [Google Scholar] [CrossRef]
  55. Peabody, C.; Arnold, C.B. The role of mechanically induced separator creep in lithium-ion battery capacity fade. J. Power Sources 2011, 196, 8147–8153. [Google Scholar] [CrossRef]
  56. Aufschläger, A.; Kücher, S.; Kraft, L.; Spingler, F.; Niehoff, P.; Jossen, A. High precision measurement of reversible swelling and electrochemical performance of flexibly compressed 5 Ah NMC622/graphite lithium-ion pouch cells. J. Energy Storage 2023, 59, 106483. [Google Scholar] [CrossRef]
  57. Agubra, V.A.; Fergus, J.W. The formation and stability of the solid electrolyte interface on the graphite anode. J. Power Sources 2014, 268, 153–162. [Google Scholar] [CrossRef]
  58. Blazek, P.; Westenberger, P.; Erker, S.; Brinek, A.; Zikmund, T.; Rettenwander, D.; Wagner, N.P.; Keckes, J.; Kaiser, J.; Kazda, T.; et al. Axially and radially inhomogeneous swelling in commercial 18650 Li-ion battery cells. J. Energy Storage 2022, 52, 104563. [Google Scholar] [CrossRef]
  59. Jaumann, T.; Balach, J.; Langklotz, U.; Sauchuk, V.; Fritsch, M.; Michaelis, A.; Teltevskij, V.; Mikhailova, D.; Oswald, S.; Klose, M.; et al. Lifetime vs. rate capability: Understanding the role of FEC and VC in high-energy Li-ion batteries with nano-silicon anodes. Energy Storage Mater. 2017, 6, 26–35. [Google Scholar] [CrossRef]
  60. Li, R.; Ren, D.; WANG, S.; XIE, Y.; Hou, Z.; LU, L.; Ouyang, M. Non-destructive local degradation detection in large format lithium-ion battery cells using reversible strain heterogeneity. J. Energy Storage 2021, 40, 102788. [Google Scholar] [CrossRef]
  61. Maranchi, J.P.; Hepp, A.F.; Evans, A.G.; Nuhfer, N.T.; Kumta, P.N. Interfacial Properties of the a Si Cu: Active–Inactive Thin-Film Anode System for Lithium-Ion Batteries. J. Electrochem. Soc. 2006, 153, A1246. [Google Scholar] [CrossRef]
  62. Matadi, B.P.; Geniès, S.; Delaille, A.; Waldmann, T.; Kasper, M.; Wohlfahrt-Mehrens, M.; Aguesse, F.; Bekaert, E.; Jiménez-Gordon, I.; Daniel, L.; et al. Effects of Biphenyl Polymerization on Lithium Deposition in Commercial Graphite/NMC Lithium-Ion Pouch-Cells during Calendar Aging at High Temperature. J. Electrochem. Soc. 2017, 164, A1089–A1097. [Google Scholar] [CrossRef]
  63. Mukhopadhyay, A.; Sheldon, B.W. Deformation and stress in electrode materials for Li-ion batteries. Prog. Mater. Sci. 2014, 63, 58–116. [Google Scholar] [CrossRef]
  64. Wünsch, M.; Kaufman, J.; Sauer, D.U. Investigation of the influence of different bracing of automotive pouch cells on cyclic liefetime and impedance spectra. J. Energy Storage 2019, 21, 149–155. [Google Scholar] [CrossRef]
  65. Xu, Z.; Rahman, M.M.; Mu, L.; Liu, Y.; Lin, F. Chemomechanical behaviors of layered cathode materials in alkali metal ion batteries. J. Mater. Chem. 2018, 6, 21859–21884. [Google Scholar] [CrossRef]
  66. Yan, P.; Zheng, J.; Gu, M.; Xiao, J.; Zhang, J.G.; Wang, C.M. Intragranular cracking as a critical barrier for high-voltage usage of layer-structured cathode for lithium-ion batteries. Nat. Commun. 2017, 8, 14101. [Google Scholar] [CrossRef] [Green Version]
  67. Zhang, N.; Tang, H. Dissecting anode swelling in commercial lithium-ion batteries. J. Power Sources 2012, 218, 52–55. [Google Scholar] [CrossRef]
  68. Gupta, A.; Kazyak, E.; Craig, N.; Christensen, J.; Dasgupta, N.P.; Sakamoto, J. Evaluating the Effects of Temperature and Pressure on Li/PEO-LiTFSI Interfacial Stability and Kinetics. J. Electrochem. Soc. 2018, 165, A2801–A2806. [Google Scholar] [CrossRef]
  69. Louli, A.J.; Genovese, M.; Weber, R.; Hames, S.G.; Logan, E.R.; Dahn, J.R. Exploring the Impact of Mechanical Pressure on the Performance of Anode-Free Lithium Metal Cells. J. Electrochem. Soc. 2019, 166, A1291–A1299. [Google Scholar] [CrossRef]
  70. Mao, Z.; Farkhondeh, M.; Pritzker, M.; Fowler, M.; Chen, Z. Calendar Aging and Gas Generation in Commercial Graphite/NMC-LMO Lithium-Ion Pouch Cell. J. Electrochem. Soc. 2017, 164, A3469–A3483. [Google Scholar] [CrossRef] [Green Version]
  71. Müller, V.; Scurtu, R.G.; Memm, M.; Danzer, M.A.; Wohlfahrt-Mehrens, M. Study of the influence of mechanical pressure on the performance and aging of Lithium-ion battery cells. J. Power Sources 2019, 440, 227148. [Google Scholar] [CrossRef]
  72. Wang, M.J.; Choudhury, R.; Sakamoto, J. Characterizing the Li-Solid-Electrolyte Interface Dynamics as a Function of Stack Pressure and Current Density. Joule 2019, 3, 2165–2178. [Google Scholar] [CrossRef]
  73. Weber, R.; Genovese, M.; Louli, A.J.; Hames, S.; Martin, C.; Hill, I.G.; Dahn, J.R. Long cycle life and dendrite-free lithium morphology in anode-free lithium pouch cells enabled by a dual-salt liquid electrolyte. Nat. Energy 2019, 4, 683–689. [Google Scholar] [CrossRef]
  74. Wilkinson, D.P.; Blom, H.; Brandt, K.; Wainwright, D. Effects of physical constraints on Li cyclability. J. Power Sources 1991, 36, 517–527. [Google Scholar] [CrossRef]
  75. Yin, X.; Tang, W.; Im Jung, D.; Phua, K.C.; Adams, S.; Lee, S.W.; Zheng, G.W. Insights into morphological evolution and cycling behaviour of lithium metal anode under mechanical pressure. Nano Energy 2018, 50, 659–664. [Google Scholar] [CrossRef]
  76. Zhang, X.; Wang, Q.J.; Harrison, K.L.; Jungjohann, K.; Boyce, B.L.; Roberts, S.A.; Attia, P.M.; Harris, S.J. Rethinking How External Pressure Can Suppress Dendrites in Lithium Metal Batteries. J. Electrochem. Soc. 2019, 166, A3639–A3652. [Google Scholar] [CrossRef] [Green Version]
  77. Zhong, X.; Yang, L.; Li, N.; Chu, Z.; Chen, J.; Zhu, S.; Song, W.L.; Ai, S.; Chen, H.S. In-situ characterizations and mechanism analysis of mechanical inhomogeneity in a prismatic battery module. J. Power Sources 2022, 548, 232053. [Google Scholar] [CrossRef]
  78. Von Kessel, O.; Deich, T.; Hahn, S.; Brauchle, F.; Vrankovic, D.; Soczka-Guth, T.; Birke, K.P. Mechanical impedance as a tool for electromechanical investigation and equivalent modeling of lithium-ion batteries. J. Power Sources 2021, 508, 230337. [Google Scholar] [CrossRef]
  79. USABC. Electric Vehicle Battery Test Procedures Manual: Revision 2; Lockheed Idaho Technologies Company: Idaho Falls, ID, USA, 1996. [Google Scholar]
  80. Sun, T.; Shen, T.; Zheng, Y.; Ren, D.; Zhu, W.; Li, J.; Wang, Y.; Kuang, K.; Rui, X.; Wang, S.; et al. Modeling the inhomogeneous lithium plating in lithium-ion batteries induced by non-uniform temperature distribution. Electrochim. Acta 2022, 425, 140701. [Google Scholar] [CrossRef]
  81. Zhu, Y.; Yan, F.; Kang, J.; Du, C.; Zhang, C.; Turkson, R.F. Fading analysis of the Li(NiCoMn)O2 battery under different SOC cycle intervals. Ionics 2017, 23, 1383–1390. [Google Scholar] [CrossRef]
  82. Preger, Y.; Barkholtz, H.M.; Fresquez, A.; Campbell, D.L.; Juba, B.W.; Romàn-Kustas, J.; Ferreira, S.R.; Chalamala, B. Degradation of Commercial Lithium-Ion Cells as a Function of Chemistry and Cycling Conditions. J. Electrochem. Soc. 2020, 167, 120532. [Google Scholar] [CrossRef]
  83. Sommer, L.W.; Kiesel, P.; Ganguli, A.; Lochbaum, A.; Saha, B.; Schwartz, J.; Bae, C.J.; Alamgir, M.; Raghavan, A. Fast and slow ion diffusion processes in lithium ion pouch cells during cycling observed with fiber optic strain sensors. J. Power Sources 2015, 296, 46–52. [Google Scholar] [CrossRef] [Green Version]
  84. Lee, J.H.; Lee, H.M.; Ahn, S. Battery dimensional changes occurring during charge/discharge cycles—Thin rectangular lithium ion and polymer cells. J. Power Sources 2003, 119–121, 833–837. [Google Scholar] [CrossRef]
  85. Li, X.; Zeng, T.; Qin, H.; Huo, R.; Liu, Y.; Wei, D.; Ding, X. Investigation of inhomogeneous degradation in large-format lithium-ion batteries. J. Energy Storage 2021, 42, 103113. [Google Scholar] [CrossRef]
  86. Hu, D.; Chen, L.; Tian, J.; Su, Y.; Li, N.; Chen, G.; Hu, Y.; Dou, Y.; Chen, S.; Wu, F. Research Progress of Lithium Plating on Graphite Anode in Lithium—Ion Batteries. Chin. J. Chem. 2021, 39, 165–173. [Google Scholar] [CrossRef]
Figure 1. (a) Sketch of the test setup including the pouch cell (1), compression pads (2), phenolic paper (3) and pressure mapping sensor (4). (b) Area covered by the compression pads.
Batteries 09 00218 g001
Figure 2. Sketch of the constant-force spring-based bracing used to apply the preload force on the cell upon aging. (a) Setup cross section, tested pouch cell (1), ring load cells (2), inductive displacement transducers (3), springs (4) and guiding shafts (5). (b) Setup top view.
Batteries 09 00218 g002
Figure 3. Aging procedure with RPT, CLT and wait phase with repetition until either 300 cycles or 85% SOH was reached.
Batteries 09 00218 g003
Figure 4. (a) Sketch of the measuring principle to obtain the cell thickness t. (b) Sketch of the 175 measurement points along the cell surface.
Batteries 09 00218 g004
Figure 5. (a) Exemplary thickness distribution with the row- and columnwise evaluation of the thickness. (b) Transformation of the thickness histogram into a boxplot.
Batteries 09 00218 g005
Figure 6. Pressure distribution in  MPa  of two fresh reference cells F1 and F2 at 0% and 100% SOC with (a) F1 and  F pre = 300 N , (b) F2 and  F pre = 300 N , (c) F1 and  F pre = 4000 N  and (d) F2 and  F pre = 4000 N .
Batteries 09 00218 g006
Figure 7. (a) Capacity retention over energy throughput during the aging procedure. (b) Irreversible thickness increase over energy throughput during the aging procedure.
Batteries 09 00218 g007
Figure 8. Local thickness of pouch cells in  m m  for 0% and 100% SOC averaged over two repetitions. Boxplots of local thickness. (a) F1. (b) F2. (c) A1. (d) A2. (e) B1. (f) B2.
Batteries 09 00218 g008
Figure 9. Local percentage thickness increase in pouch cells in % from 0% to 100% SOC averaged over two repetitions. (a) F1. (b) F2. (c) A1. (d) A2. (e) B1. (f) B2.
Batteries 09 00218 g009
Table 1. Specifications of the tested cell.
ParameterValue
Nominal capacity60   A h
Dimension300 × 110 × 14.5   m m
Cathode/anode materialNMC622/graphite
Min. voltage2.5   V
Max. voltage4.2   V
Anode thickness208   μ m
Cathode thickness172   μ m
Separator thickness15   μ m
Layers of cathodes/anodes31/32
Table 2. Capacity retention of pouch cells after the aging procedure.
Cell   F pre Initial Capacity under  F pre No. of CyclesCapacity Retention
( N )(Ah)(-)(%)
A130059.533185.7
A230059.732381.7
B1400058.116967.1
B2400058.021970.2
Table 3. Average thickness  t avg ( SOC = 0 )  measured at 0% SOC.
Cell   t avg ( SOC = 0 ) Average
(mm)(mm)
FreshF113.3613.37
F213.37
AgedA114.5914.56
A214.63
B114.52
B214.51
Disclaimer/Publisher’s Note: The statements, opinions and data contained in all publications are solely those of the individual author(s) and contributor(s) and not of MDPI and/or the editor(s). MDPI and/or the editor(s) disclaim responsibility for any injury to people or property resulting from any ideas, methods, instructions or products referred to in the content.

