Article

Improvement on the Use of Se@C in Batteries by Synergistic Effect of Nano-Confinement and C-Se Bond

1
Henan Provincial Key Laboratory of Micro and Nano Energy Storage and Conversion Materials, Henan Provincial Engineering Laboratory of Micro and Nano Energy Materials and Devices, and Henan International Joint Laboratory of Nano Energy and Catalytic Materials, Xuchang University, Xuchang 461002, China
2
Guangxi Key Laboratory of Electrochemical Energy Materials, Guangxi University, Nanning 530004, China
3
Henan Kelong New Energy Co., Ltd., Xinxiang 453000, China
*
Authors to whom correspondence should be addressed.
Batteries 2023, 9(3), 143; https://doi.org/10.3390/batteries9030143
Submission received: 10 January 2023 / Revised: 10 February 2023 / Accepted: 10 February 2023 / Published: 21 February 2023

Abstract

:
In order to alleviate the cyclic attenuation caused by the dissolution of poly-selenides in lithium/sodium storage devices, quantitative selenium was slowly evaporated on the surface of sodium citrate derived carbon (SCDC) at low temperature, and simultaneously the element Se was doped. Benefiting from the synergistic effects of the domain-limiting effect of embedded nanopores on Se nanoparticles and the stability of SCDC with Se doped during the embedding and stripping of Na ions, Se@C versus sodium metal exhibits high second specific capacity of 485 mAh·g−1 and unexpected stability at 0.1 A g−1 and 1 A g−1. Se@C versus lithium metal exhibits high second specific capacity of 1185 mAh·g−1 at 0.1 A g−1 and excellent stability. Together with the simple and application of synthesis method, Se@C composite is expected to become an anode material for large sodium/lithium storage devices.

Graphical Abstract

1. Introduction

As one of many energy storage systems, lithium-ion batteries (LIBs) have been widely used in various fields due to its advantages of high energy density, long cycle life and without memory effect [1,2,3]. Frustratingly, the application of LIBs in large-scale energy storage devices is seriously limited by the restricted lithium re-sources and substantial security issue [4,5,6]. In comparison, with many advantages of abundant sodium resources, wide distribution, low price, and physicochemical properties similar to LIBs, sodium ion batteries (SIBs) were expected as a supplement to achieve scale energy storage applications [7,8,9]. However, the scale application of SIBs is hampered by the shortage of electrode materials with superior comprehensive performance. Although through various measures such as nano-crystallization [10,11,12] and surface modification [13,14,15,16,17] of electrode materials, the doping and recombination of heterogeneous elements [18,19,20], the addition of different auxiliary additives to electrolyte [21,22,23,24,25,26] and so on, the performances of LIBs and SIBs have got some promotion. Unfortunately, most of these current measures have defects such as complex process, high cost, and difficult mass production. Therefore, the exploration of improvement measures with simple and low energy consumption is still the focus of current exploration in LIBs and SIBs. Therefore, in this work, a one-step thermal evaporation process at relatively low temperature was applied to realize the loading and doping of selenium.
Besides these mentioned above, the exploitation of electrode materials with overall electrochemical properties is still the key factor to further elevate the comprehensive performance of LIBs and SIBs [27,28,29,30], especially anode materials, where many challenging issues derived from applicability and electrochemical kinetics need to be overcome. For example, a typically commercialized graphite anode for LIBs is not conducive to sodium ions intercalation due to the unstable structure of Na+-insertion compound of graphite. Therefore, metal alloys, oxides, sulfides, Ti-based intercalation compounds, and carbonaceous materials have been vigorously investigated. Undeniably, among these materials mentioned, carbonaceous materials were considered one of the most promising anode materials [31,32,33]. Especially the carbon composites doped with various heterogeneous elements do not have enlarged interlayer distance, and electronic structure and crystal structure are also regulated, but their defect sites are increased [34,35,36,37,38,39,40]. For example, the doping of nitrogen [38,39,40], phosphorus [41,42], sulfur [43,44,45], and selenium [46,47,48,49,50] has been shown to be effective in enhancing the physical and chemical properties and lithium/sodium storage of carbon materials. In particular, selenium doping is expected to be a general measure due to the advantages of high theoretical volume specific capacity (3253 mAh/cm3), good conductivity (1 × 10⁻³ S/m), and stable existence in carbonate electrolyte [48,49]. For example, Zhao et al. achieved a lithium-selenium battery with a high reversible specific capacity of 545 mAh g−1 and an excellent cyclic stability of 1500 cycles at a current density of 0.5 C (1 C = 675 mA g−1) through the construction of heteroatoms (N and O) dual-doped hierarchical porous carbon (HDHPC) with interconnected macro/meso/micropores [32]. Unfortunately, the volume of selenium expands during the discharging process, and the dissolution of mesophase selenides in electrolyte result in the rapid decay of its capacity.
To effectively alleviate the above problems, based on the advantages of nano-effect in regulating the electronic energy states and the physical and chemical properties of nanoparticles [48,49,50,51,52], this work takes full advantage of the confinement of selenium nanoparticles by sodium citrate-derived carbon (SCDC) nanopores to improve the comprehensive performance of Se@C composites for lithium/sodium storage, and through low-temperature, slow-evaporation of Se at 400 °C, Se@SCDC composite was successfully constructed to realize the loading of selenium element on the surface of sodium citrate derived carbon (SCDC), the doping in crystal, and embedding in nanopores. When paired with lithium and sodium metal to assemble lithium- and sodium–selenium button cell, Se@SCDC composite showed high specific capacity and excellent stability.

2. Results

To make the synthesis of Se@SCDC as simple and feasible as possible, the commercial selenium powder and SCDC material with various mass ratios of 3/1, 4/1, 5/1, 6/1, and 7/1 were thoroughly ground and mixed, and laid in the porcelain crucible, and then pushed into the central constant temperature zone of the furnace. After a subsequent pyrolysis process at 400 °C for 3 h with a heating rate of 1 °C min−1 in Ar gas at a flow rate of 40 mL min−1, black powder was achieved. The synthesis principal of Se@SCDC composite was illustrated in Figure 1. Just as in Figure 1, SCDC with hierarchical pore structure achieves the doping of selenium to carbon rings in selenium vapor while embedding singlet selenium in the hierarchical pores.

2.1. Characteristic of Morphology of Se@SCDC

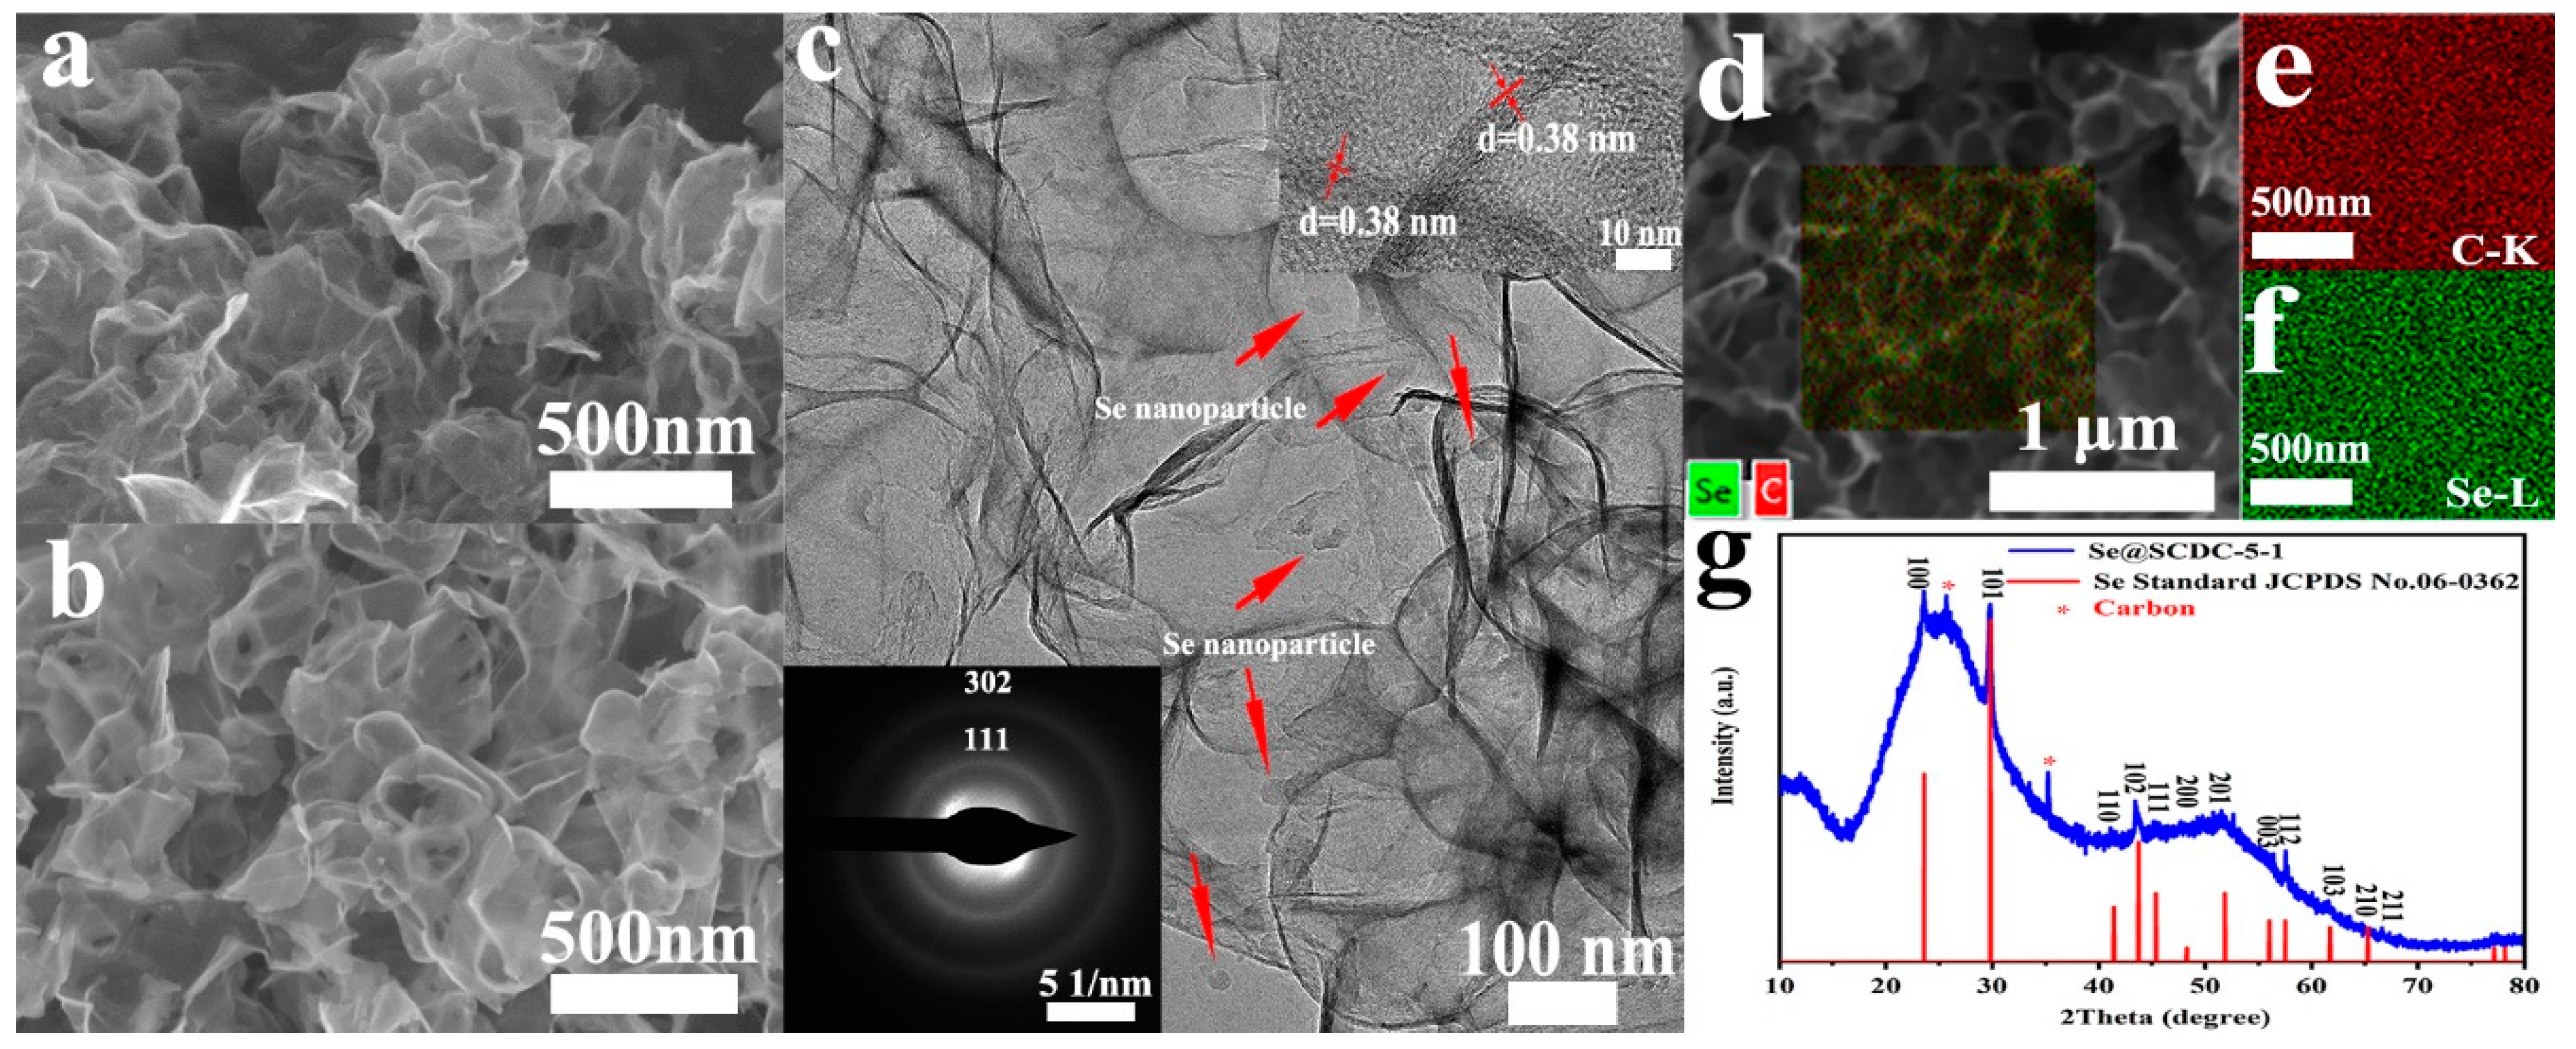
First of all, the morphologies of Se@SCDC with various Se mass loading were compared. As Figure S1 shows, with the increase of Se loading, the Se nanoparticles gradually spread over the surface of SCDC and increased in size, which is probably an important factor affecting the change of sodium storage properties of materials with different Se loading. To further clarify the morphologies of SCDC before and after selenium loaded and doped, FESEM and TEM of SCDC and Se@SCDC-5-1 were also contrasted, as shown in Figure 2a–c. It was found that Se nanoparticles with the size range from 10–30 nm were evenly distributed on the surface of Se@SCDC-5-1 composite compared to the bare surface of SCDC (Figure S2), which indicated that Se nanoparticles were successfully loaded on the surface and embedded in the nanopores of SCDC. The high-resolution TEM images of Se@SCDC-5-1 composite (Figure 2c in the upper right corner) shows that the crystal plane spacing is 0.38 nm, which is favorable for stripping and embedding sodium ions. The electron diffraction spectrum shows the polycrystalline structure of Se@SCDC-5-1, as the bottom left corner of Figure 2c displayed, and the diffraction aperture corresponds to the lattice plane (111) and (302) of Se (JCPDS No.06-0362) from inside to outside, which was verified by X-ray diffraction of Se and C in Figure 2g and Figure S3a. The distribution map of EDS survey for C and Se elements in Se@SCDC-5-1 indicates that C and Se elements are evenly distributed. Furthermore, the EDS spectra of the samples prepared with various mass ratio of C and Se (mc/mSe) are presented in Figure S2c, the value of mc/mSe showed a generally increasing trend except for the mass ratio 1/6 of carbon/selenium raw material, which probably is caused by uneven distribution of holes and defects since the EDS test does not show a good ground-variation pattern and its test range is narrow. As a supplement to EDS testing, the proportion of C and Se elements for Se@SCDC-5-1 by thermogravimetric analysis was also investigated, and the result shows that the mass ratio of C/Se is 59.75%, which is higher than 19.99% of Se@SCDC-4-1 and lower than 74.18% of Se@SCDC-6-1 and 80.60% of Se@SCDC-7-1 (Figure S3b). This is dominantly due to the surface of SCDC reached the saturation of selenium loading with the increase of selenium content. Therefore, after the Se load saturated, the further increase of Se loading will lead to the increase in size of Se nanoparticles, as exhibited in Figure S1.

2.2. Analysis of Physicochemical Properties of Se@SCDC

To further demonstrate the successful loading and doping of Se, the Raman and XPS spectra of Se@SCDC-5-1 were analyzed, as Figure 3a–d exhibited. In particular, it should be noted that the obtained spectra were calibrated to be C 1s as 284.6 eV. There was an obvious characteristic peak of Se element at the wave number of 250 cm−1 in Raman as shown in Figure 3a, which proved the loading of Se nanoparticles on the surface of SCDC and the embedment of Se nanoparticles in nanopores. While two characteristic peaks at 1300 cm−1 and 1590 cm−1 are respectively corresponding to the defects and graphitized structure of graphene-like SCDC material, ID/IG is 2.9 after fitting through origin software. Compared with the Raman spectra of SCDC shown in Figure S3c, that of Se@SCDC-5-1 shows one characteristic peak of Se, in which Se element was dopped. This manifests the existence of defects in favor of lithium/sodium storage. Figure 3b presents the survey XPS of Se@SCDC-5-1 composite with C/Se mass ratio of 1/5, including characteristic peaks of O 1s at 580 eV and C 1s at 280 eV. There are also present four characteristic peaks of Se, which are respectively Se 3s at 225 eV, 3p at 162 eV and 178 eV, and 3d at 50 eV [49]. The high-resolution XPS spectrum of C 1s in Figure 3c indicates that there are C-C, C-H, and C=C bonds at 284.8 eV and 285.3 eV, C=O bonds at 286.3 eV and O=C-O bonds at 289.0 eV in SCDC. Figure 3d shows the high resolution XPS spectrum of Se, the peak at 58 eV corresponds to elemental selenium, while the hummocky peak at 56.1 eV attributes to the Se 3d 5/2 and Se 3d 3/2. The peak at 59.0 eV was considered to be the Se 3d peak of SeOx compound [51,52]. According to reference 46, as compared to the 3d5/2 and 3d3/2 peaks of pure Se, those of Se shift to higher binding energies in Se@SCDC, respectively. These shifts are due to the variety in the electron cloud density of Se, indicating that Se and other atoms in the composite (C and O) form bonds. Due to the existing selenium covalent bonds, the formation and dissolution of poly-selenides were effectively inhibited.

2.3. Comparison of the Electrochemical Performances of Se@SCDC Anode

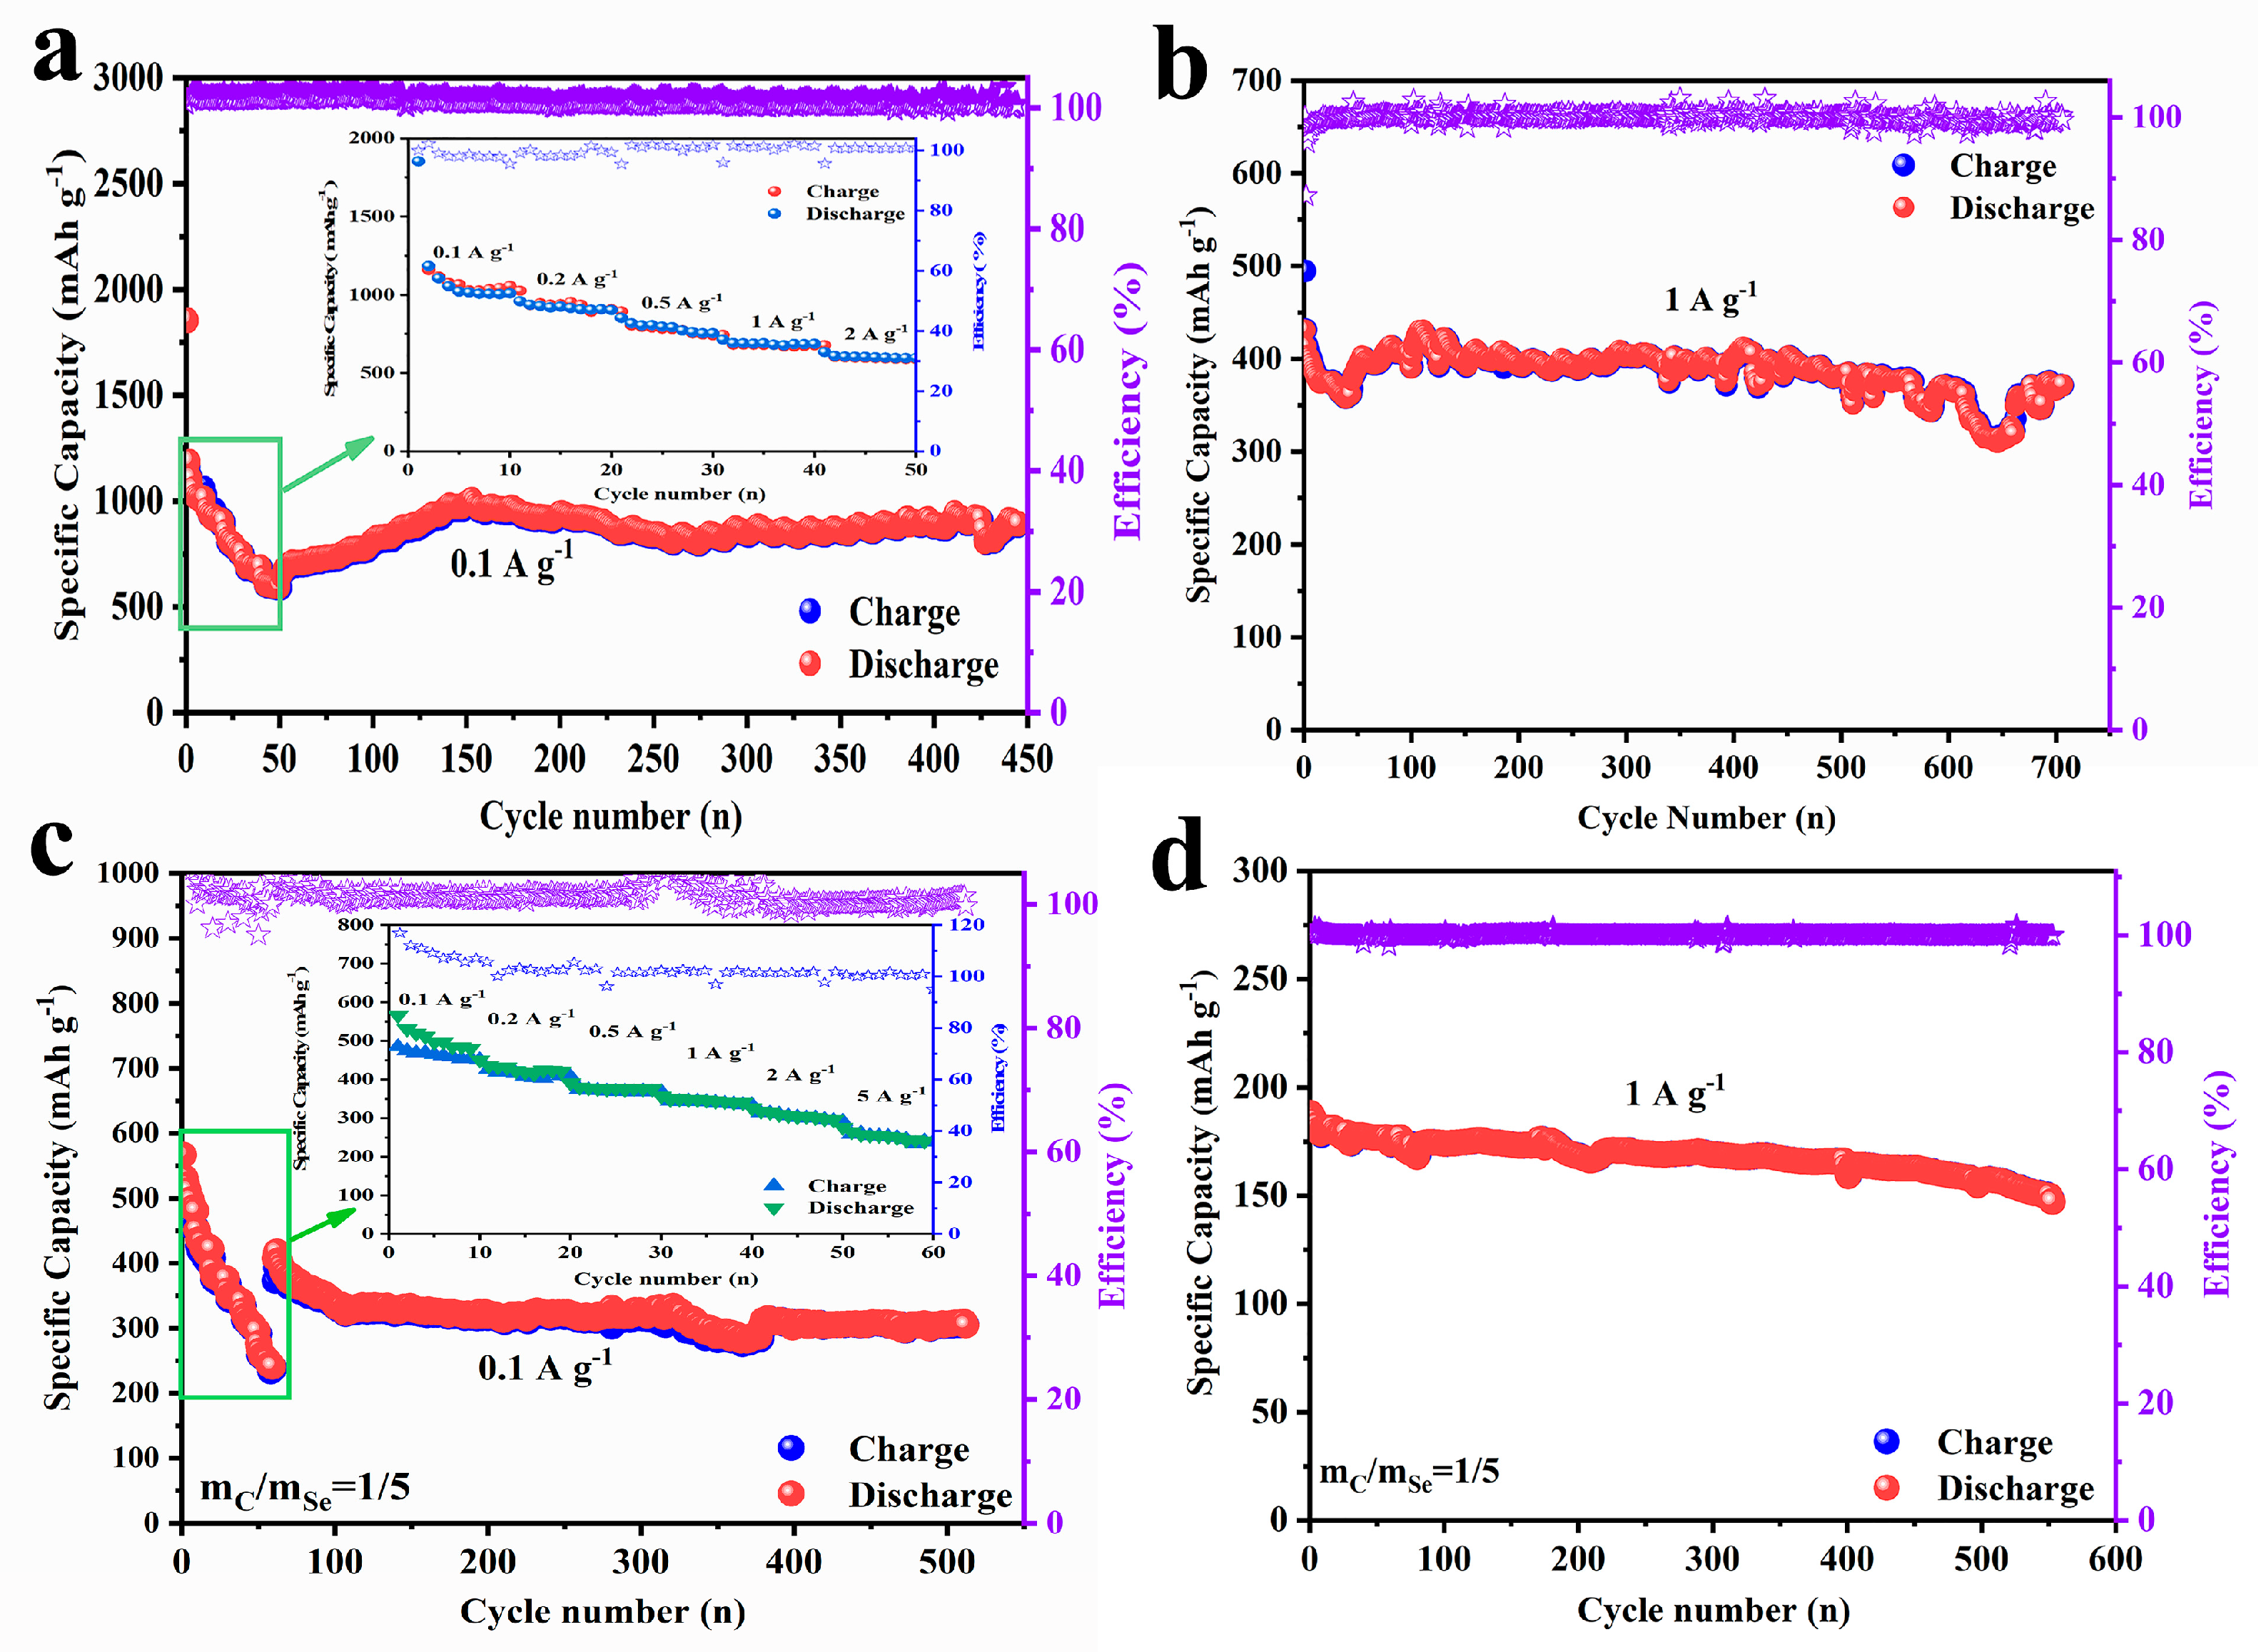
In view of the unique physical properties of Se@SCDC-5-1 composites, it is necessary to further test its electrochemical properties. Figure 4 shows the gradient characteristics between 0.01 and 3.0 V and cyclic stability of Se@SCDC-5-1/Li or Se@SCDC-5-1/Na. As shown in the gradient diagram Figure 4a and Figure S5a, Se@SCDC-5-1/Li at 0.1 A g−1 presents separately an initial discharge specific capacity of 1853 mAh g−1, the first and second charge specific capacity of 1159 and 1185 mAh g−1. It was worth noting that the gradient performance test began with discharge, here the second charge process was the first charge process. When the current density transfers to 0.2, 0.5, 1.0 to 2.0 A g−1, the specific capacities still keep 959 mAh g−1, 903 mAh g−1, 755 mAh g−1, 687 mAh g−1, respectively. When the current density turns back to 0.1 A g−1 again, Se@SCDC-5-1 remains a high specific capacity of 699 mAh g−1, as displayed in Figure 4a, inset Figure 4a and Figure S5b. Then the specific capacity continuously increases to 1000 mAh g−1 after 150 cycles, this increase in capacity during cycling is mainly attributed to gradual activation of Se@SCDC materials [53,54]. And then the specific capacity stabilizes at about 800 mAh g−1. After 450 cycles, the capacity is slightly increased to 891 mAh g−1, which dominantly attributes to the complete activation of the active material. While Se@SCDC-5-1/Li at 1 A g−1 shown in Figure 4b presents separately a first discharge specific capacity of 500 mAh g−1, a second charge specific capacity of 439 mAh g−1 is seen. Even after 720 cycles, the charge specific capacity of Se@SCDC-5-1/Li remains specific capacity of 398 mAh g−1.
As well-known, SIBs have similar electrochemical properties to LIBs [1,2,3]. Therefore, it is necessary to determine the sodium storage characteristics of Se@SCDC-5-1. Figure S5c shows the voltage-specific capacity curves for the first charge and discharge of Se@SCDC-5-1/Na at 0.1 A g−1. The first discharging curve shows an obvious plateau at about 0.80 V, which is mainly attributed to the reduction peak of CV curve. In addition, by comparing the charging and discharging curves of lithium, it is found that there is no significant charging and discharging platform for lithium. This comes dominantly down to the intense volume respiration causes SEI fracture on Se@SCDC-5-1 electrode, further triggering side reactions between the electrolyte and the freshly exposed Se [55]. Figure 4c and Figure S5d exhibit the charge/discharge rates from 0.1, 0.2, 0.5, 1.0, 2.0 to 5.0 A g−1 (inset Figure 4c) and the cyclic performance for Se@SCDC-5-1/Na at 0.1 A g−1 after 530 cycles directly collected after the above rate-performance tested. Compared with other Se@SCDC materials (Figure S6a), Se@SCDC-5-1 presents the highest sodium storage gradient capacities of 520 mAh g−1 at 0.1 A g−1, 451 mAh g−1 at 0.2 A g−1, 392 mAh g−1 at 0.5 A g−1, 357 mAh g−1 at 1 A g−1, 327 mAh g−1 at 2 A g−1, 277 mAh g−1 at 5 A g−1. When the current density turns to 0.1 A g−1, Se@SCDC-5-1 remains the specific capacity of 417 mAh g−1, which is the optimum value compared with 242 mAh g−1 of Se@SCDC-3-1, 191 mAh g−1 of Se@SCDC-4-1, 387 mAh g−1 of Se@SCDC-6-1 and 264 mAh g−1 of Se@SCDC-7-1 (Figure S6b). The specific capacity of Se@SCDC tends to increase initially and then decrease with the increase of carbon to selenium mass ratio. This may be primarily due to the fact that the amount of Se is just saturated on the surface and inside the hole of SCDC. Reducing the mass ratio of SCDC and Se feedstock will not achieve optimal Se loading and doping, while increasing the mass ratio of SCDC and Se materials will lead to the increase of the size of monomeric Se on the surface of SCDC and the formation of polyselenide, which will be detrimental to the overall performance of Se@SCDC. In addition, Se@SCDC-5-1/Na presents prominent cyclic stability (Figure 4d) after 560 cycles at 1 A g−1, and high-capacity retention of 189 mAh g−1. The exceptional sodium storage properties of Se@SCDC-5-1 objectively ascribe to these factors that the nano-size Se particles embedded and loaded accelerate the stripping and embedding of sodium ions, and the formation of Se-C covalent bond effectively inhibits the dissolution of polyselenides. Including the comparisons above, the lithium and sodium storage performances of SCDC and Se (Figure S6c,d) were also contrasted. These results mentioned above indicate that the lithium and sodium storage capacity of Se@SCDC-5-1 is optimum when contrasted to that of SCDC and Se at 0.1 A g−1, which further verifies that the synergistic effect of nanoconfinement effect and Se-doped effectively improved the sodium storage properties of Se@SCDC. This can be clarified by the comparison of BET and the distribution of pore diameters of SCDC and Se@SCDC, as shown in Figure S7. In addition, the lithium and sodium storage properties of Se@SCDC prepared in this work were compared with those of other carbon-selenium composites (Figure S8). The result demonstrates that Se@SCDC exhibits better lithium storage properties (Figure S8a) compared to sodium storage properties (Figure S8b).

2.4. Electrode Dynamic Analysis of Se@SCDC-5-1

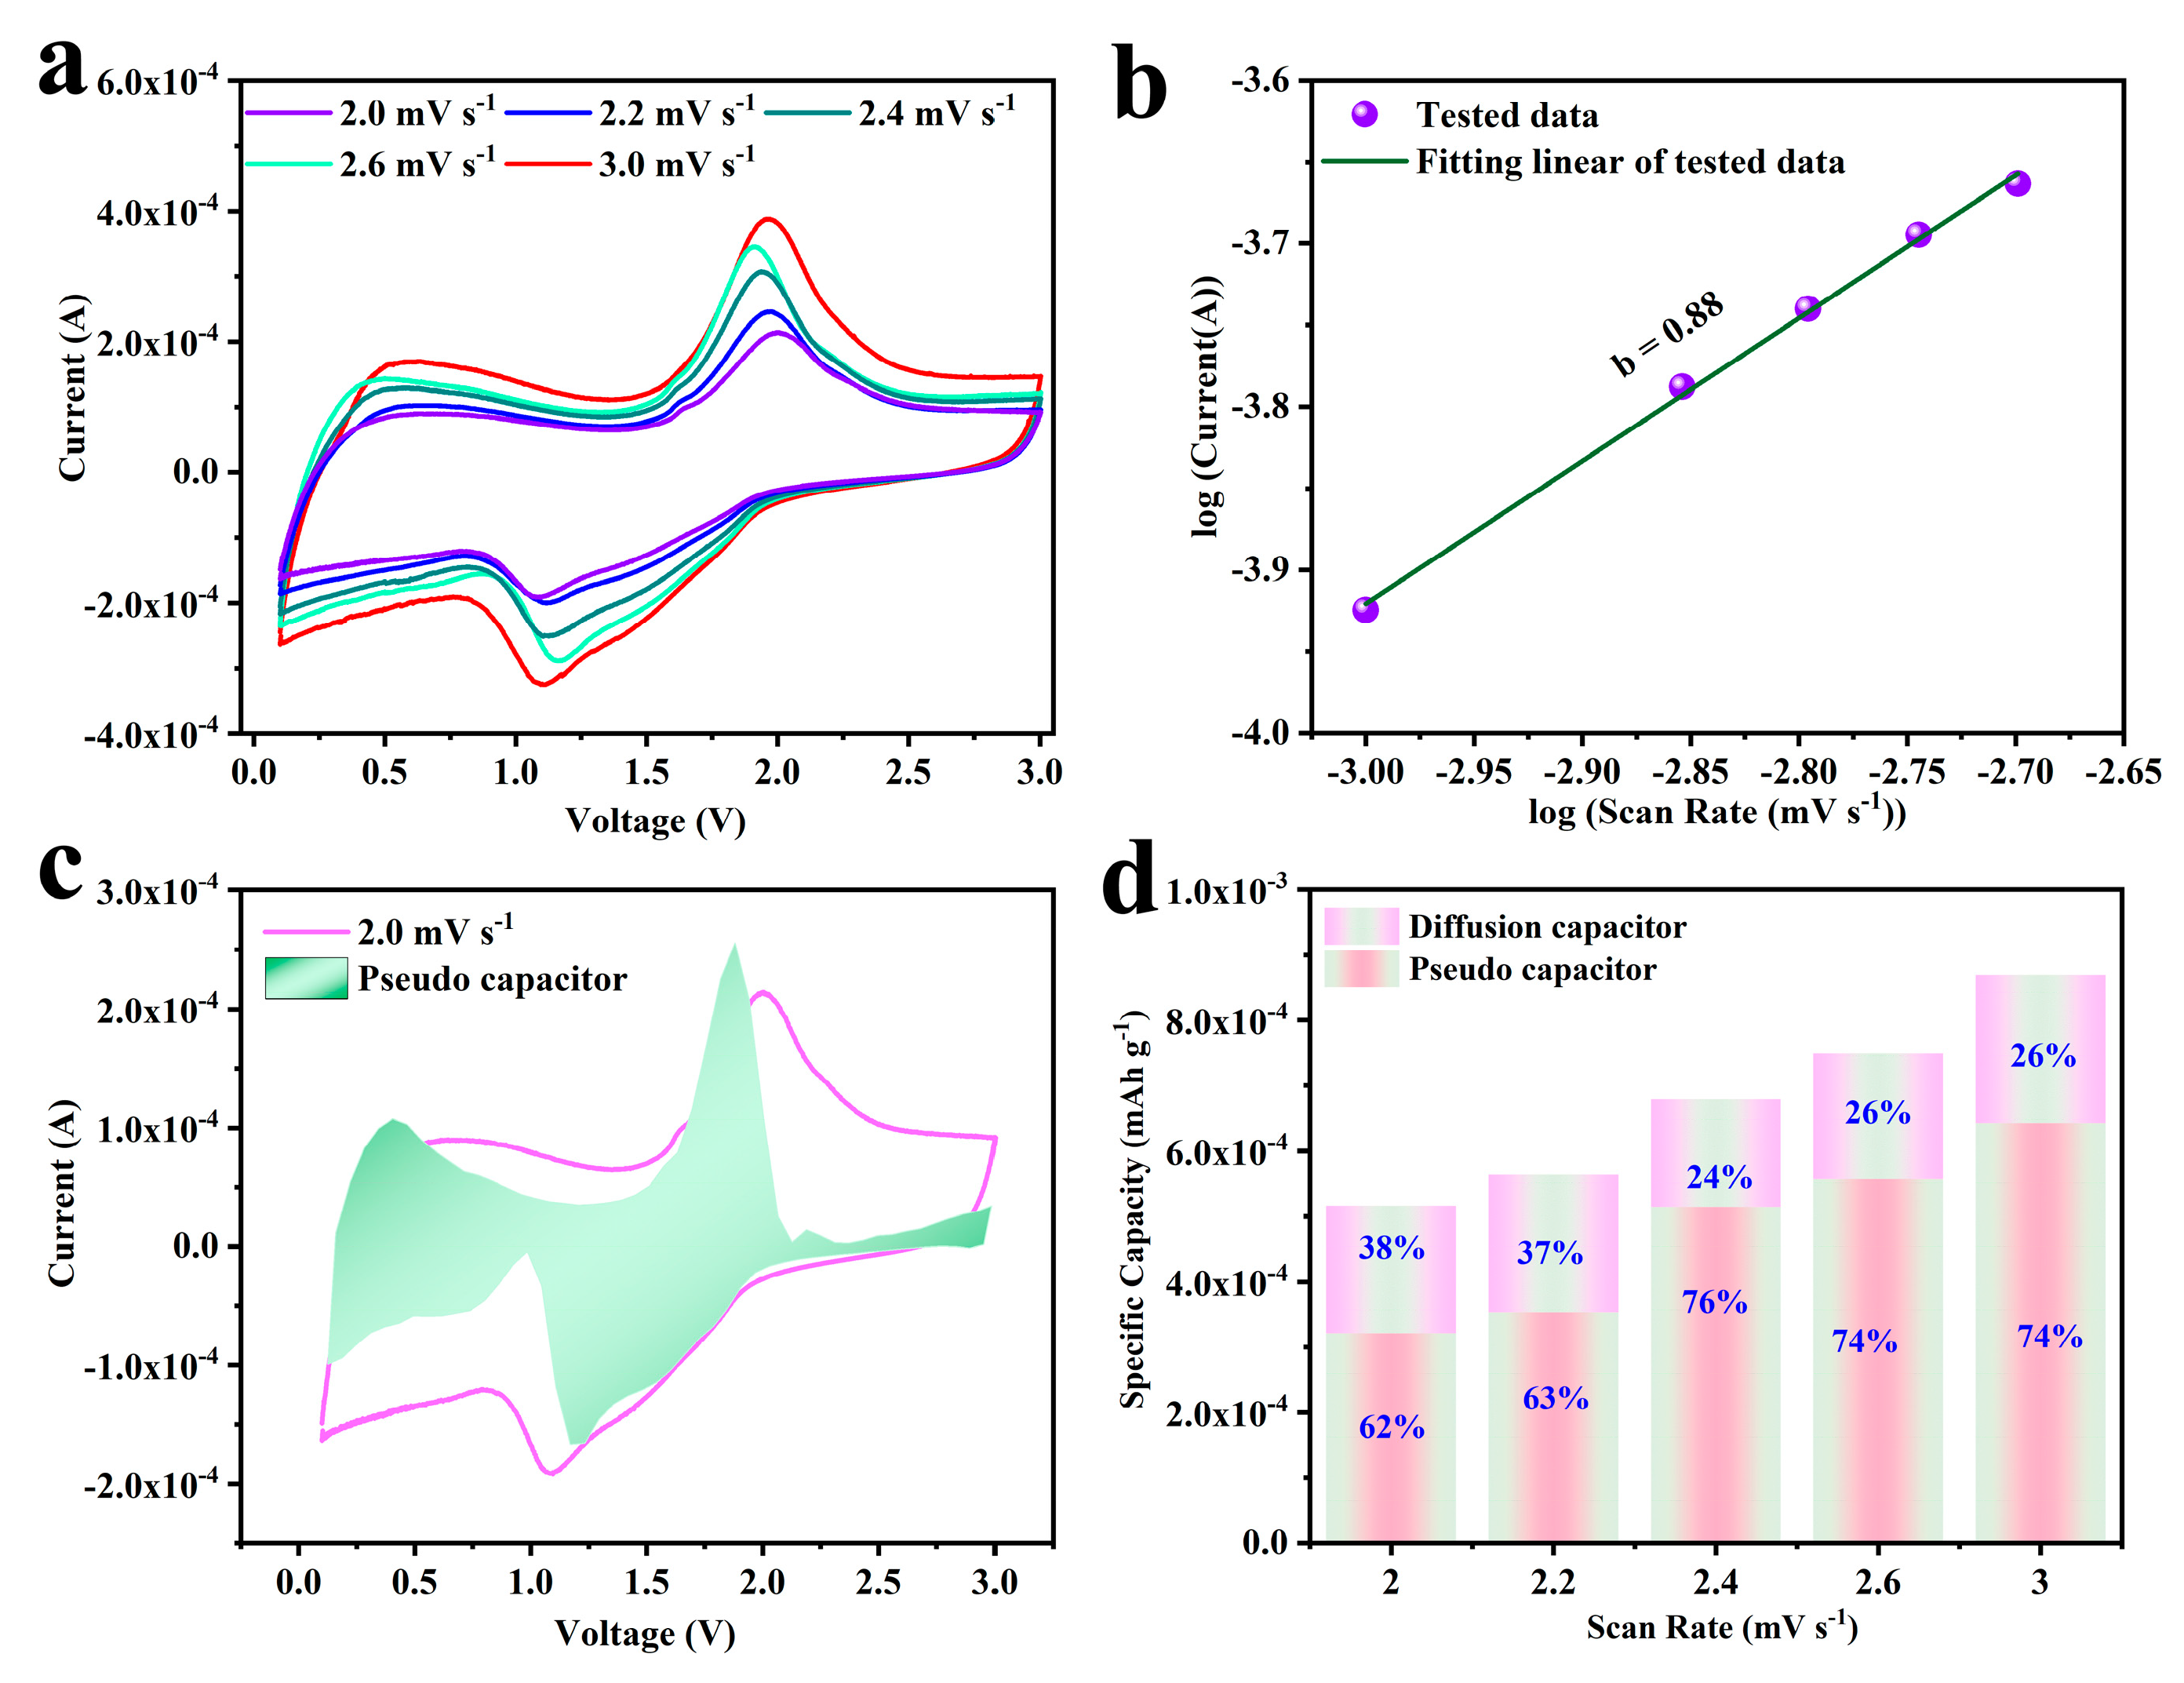
Cyclic voltammetry (CV) is often measured to explore the sodium storage kinetics of materials. Figure 5a displays the CV curves for Se@SCDC versus Na metal under various scan rate of 2.0 mV s−1, 2.2 mV s−1, 2.4 mV s−1, 2.6 mV s−1, and 3.0 mV s−1. There are a pair of redox peaks at 2.0 V and 1.2 V for 2.0 mV s−1, which respectively corresponding to the insertion/extraction of sodium ions of Se@SCDC. While the position of the redox peaks slightly migrated with the increase of sweep rate. To further reveal the sodium storage mechanism of Se@SCDC-5-1 composite, the current contributed by stripped and adsorbed sodium ions are extracted from the total charge by means of the calculation of pseudo-capacitance separation developed by Bruce group [56]. It is worth mentioning that in order to avoid the influence of carbon polarization at low voltage (<0.08 V) (Figure 5a,c) on fitting results, the voltage range of testing and fitting CV was adjusted to 0.08–3.0 V, and the abnormal data at 2.8 mV s−1 were deleted. First, on account of Equation (1), the logarithms of peak current (i) measured at different sweep speeds (Figure 5a) are linearly fitted to the logarithms of these sweep speeds (ν), and the slope of the fitted line is the b value in Equation (1).
i = aνb
In this fitting, b value is 0.88 (Figure 5b). Refer to Brezesinski et al. [56], b value close to 1 indicates that the electrochemical behavior of the electrode is dominantly occupied by surface adsorption and desorption. When b value is less than or equal to 0.5, the electrochemical behavior is classified as the stripping and embedding of sodium ions. Figure 5c,d shows the pseudo-capacitance region diagram of 2.0 mV s−1 and the normalized capacitance ratio histogram of 2.2 mV s−1, 2.4 mV s−1, 2.6 mV s−1, and 3.0 mV s−1. In particular, the CV was performed with voltages ranging from 0.08 to 3.0 V at 0.2 V per sweep interval. Subsequently, to distinguish the proportion of diffusion behavior and pseudo-capacitor behavior, related calculations according to Wu et al. [57] are carried out based on Equation (2). Here ν is the scan rate, i(V) was the response current at a given voltage.
i(V)/ν0.5 = k1ν0.5 + k2
Finally, the fitting results prove that at 2.0 mV s−1, 2.2 mV s−1, 2.4 mV s−1, 2.6 mV s−1, and 3.0 mV s−1 scanning speeds, pseudo-capacitance dedicates separately to 62%, 63%, 76%, 74%, and 74% of the total charge due to a great deal of defects and appropriate plane spacing. This typical pseudo-capacitance behavior relieves the constraint of lithium and sodium ions diffusion kinetics, which is beneficial to achieving excellent electrochemical characteristics.
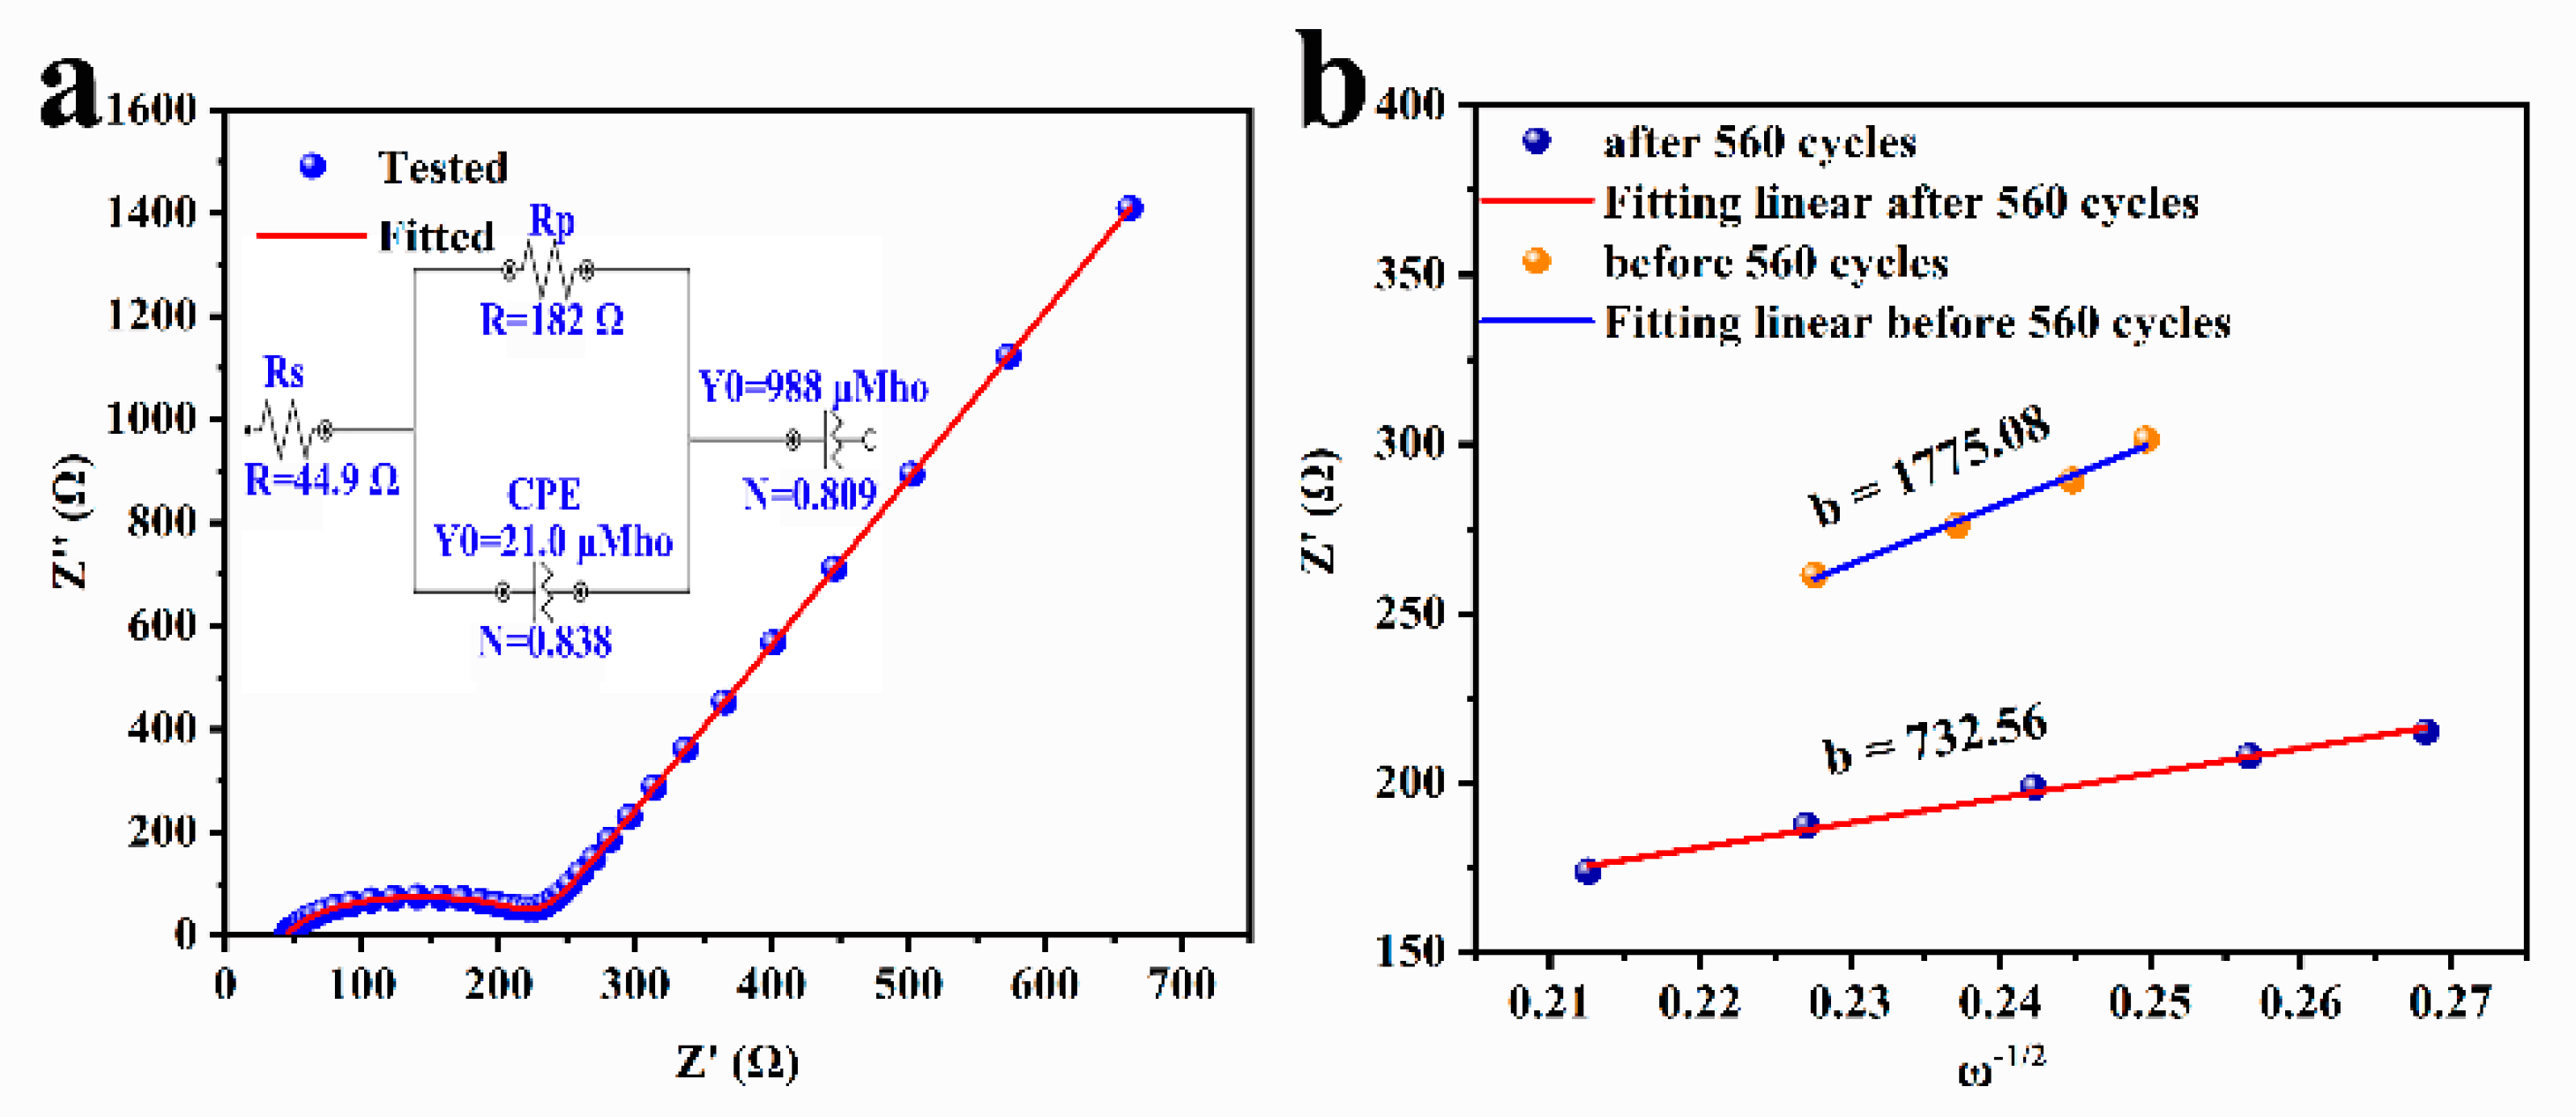
The impedance of active material is an important index to evaluate the performance of this material. In this manuscript, Nyquist diagrams before and after 10 cycles for Se@SCDC-5-1 as work electrode and Na metal as counter and reference electrode were investigated. The Nyquist diagrams include a flattened semicircle in medium and high frequency areas and an inclined line in low frequency region, as Figure 6a presented. The former is related to the charge transfer process (Rct) on the interface between electrode and electrolyte, the latter is related to the Warburg impedance (Zw) associated with the diffusion of sodium ions in Se@SCDC-5-1. Rs represents the dissolution resistance, while the constant phase element (CPE) refers to the double layer capacitance. The resistance for Se@SCDC-5-1 as tested electrode and Na metal as counter and reference electrode present low Rct after 560 cycles, which further manifests that the nanoconfinement effect of Se nanoparticles and formation of Se covalent bond enhance the ionic transportation of Se@SCDC-5-1, as can be seen from linear fitting with ω−1/2 as X-axis and Z’ as Y-axis in Figure 6b.
As well-known, the diffusion coefficient (DNa) for Se@SCDC-5-1/Na as work electrode and Na metal as counter and reference electrode before and after 10 cycles is a critical parameter to evaluate the electrode, DNa and satisfy the following law [57]:
DNa = (R2T2)/(2A2n4F4C2σ2)
In Equation (3), R, T, A, n, F, C, and σ are respectively the gas constant (8.314 J mol−1 K−1), the absolute temperature (298 K), the surface area of electrode (1.5386 cm2), the number of electrons transferred per molecule (Na2Se is the product after Se embedded sodium ion, n is 2), the Faraday constant (96500 C mol−1), the molar concentration of 1 mol L−1 for Na+ ions, and the Warburg factor σ relates to Z’ as Equation (4) shows, and its value refers to the slope of the linear fitting with ω−1/2 X-axis and Z’ Y-axis in the low frequency region.
Z’ = Rs + Rct + σ−0.5
As can be seen from Figure 6b, the slopes b of Se@SCDC-5-1/Na half-cell before and after 10 cycles by linear fitting with ω−1/2 as X-axis and Z’ as Y-axis are separately 732.56 and 1775.08. And then the two b values are substituted into Equation (3), and the calculated DNa is 3.49 × 10⁻²⁰ and 5.96 × 10⁻²¹ respectively, which demonstrates that the dissolution of poly-selenides was limited to some extent due to the confined effect of nano-pores and the stability of C-Se bond.
To further verify the excellent electrochemical performance of Se@SCDC-5-1, the optical photographs of membrane infiltrated with initial electrolyte and after 100 cycles were contrasted, as shown in Figure S8c. The result indicates that there was no significant difference in color between the two membranes, which demonstrates that the dissolution of poly-selenide was effectively inhibited. Furthermore, the morphology of Se@SCDC-5-1/Na before and after 100 cycles were also compared. As Figure S8a,b present, compared with the morphology of the polar plate without circulation, granular synapses appeared on the Se@SCDC surface after 100 cycles, which is mainly caused by the expansion of nano-Se particles and solid electrolyte interface on the surface of Se@SCDC during the process of cycling. The electron diffraction energy spectrum (EDS) was also determined, as Figure S8d–f demonstrates, the element of C and Se is also evenly distributed.

3. Conclusions

In conclusion, by means of a simple cryogenic evaporation process, selenium nanoparticles were successfully embedded in the nanopores of SCDC, and Se elements were doped in the carbon chain of SCDC, Se@SCDC composites with various loads were achieved. These composites/Li or Na were assembled to coin cells. Profiting from the optimization of the physical and chemical properties of Se caused by the nano-confinement effect and the inhibition of the carbon-selenium bond on the dissolution of poly-selenides, Se@SCDC presents better the mass specific capacity than SCDC and pure Se materials. Especially, Se@SCDC-5-1/Li exhibits the optimum initial discharge specific capacity of 1853 mAh g−1 at 0.1 A g−1 and high cycling specific capacity of 398 mAh g−1 after 720 cycles at 1 A g−1, Se@SCDC-5-1/Na exhibits the optimum mass specific capacity of 520 mAh g−1 at 0.1 A g−1 and stability of 530 cycles, compared with Se@SCDC materials with other mass ratio of carbon and selenium. The analysis of electrochemical kinetic mechanism shows that Se@SCDC-5-1 shows excellent pseudo-capacitance characteristic. This work provides a reference for the exploration of Se and carbon composite with unexpected comprehensive electrochemical performance.

4. Materials and Methods

All the reagents, including KOH (Macklin, Shanghai, China), Se powder (Alpha chemical reagent), and trisodium citrate (Beijing Chemical Reagent Factory) can be directly used without further purification. To accelerate the dissolution rate in deionized water, the reagents involved were manually ground until no particle is felt by hand.

4.1. Preparation of SCDC and Se@SCDC

The synthesis process [58] of sodium citrate derived carbon (SCDC) was as follows: 2 g trisodium citrate dihydrate powder was first spread out in a porcelain crucible, then was pushed into the central constant temperature zone of the furnace. After a subsequent pyrolysis process at 800 °C for 2 h with a heating rate of 5 °C min−1 in Ar at a flow rate of 40 mL min−1, a kind of black powder was obtained. The powder acquired was washed with 500 mL deionized water of 90 °C, and then dried overnight in oven at 70 °C. The powder dried was mixed with 3 mg mL−1 KOH aqueous solution at the mass ratio of 1/4, and ultrasound for 15 min, and then was stirred and dried under the constant temperature of 90 °C. A homogenous mixture was obtained. Subsequently, the mixture was laid flat in the porcelain boat, then transferred into the constant temperature zone of vacuum tube furnace. Then the furnace enclosed with the porcelain boat was heated at 800 °C for 1 h with a heating rate of 5 °C min−1 in Ar, and then cooled down to room temperature. Finally, the products were collected, ground, and washed several times with 2 M HCl, 500 mL deionized water at 90 °C and ethanol. After dried in the oven at 70 °C for 12 h, the activated SCDC was achieved.
The preparation of Se@SCDC: after the commercial selenium powder and SCDC powder with various mass ratio of 4/1, 5/1, 6/1, and 7/1 are thoroughly ground and mixed, and laid in the porcelain crucible, and then were pushed into the central constant temperature zone of the furnace. After a subsequent pyrolysis process at 400 °C for 3 h with a heating rate of 1 °C min−1 in Ar at a flow rate of 40 mL min−1, some black powders were achieved. These powders obtained were separately denoted as Se@SCDC-3-1, Se@SCDC-4-1, Se@SCDC-5-1-1, Se@SCDC-6-1, Se@SCDC-7-1.

4.2. Instrumentation and Sample Analysis

The crystallographic information of these samples prepared was explored by powder X-ray diffraction (XRD, Bruker D8 ADVANCE) with Cu Ka radiation (λ = 1.54016 Å). Field emission scanning electronic microscopy (FESEM, JSM-6701F) was employed to test the surface morphologies and microstructure of SCDC and Se@SCDC. Transmission electron microscopy (TEM) and high-resolution TEM (HRTEM) were carried out by using HITACHI-H7650 and JEM-2100F (JEOL) instruments, operated with an electron kinetic energy of 200 kV. Surface analysis of the samples studied was performed by employing XPS (Perkin-Elmer PHI-5702 photoelectronic spectrometer with Al target). It needs to be highlighted that the high-resolutions of Pass Energy was 50 eV. Thermogravimetry was determined on NETZSCH5 at 5 °C per minute between room temperature and 500 °C.

4.3. Electrochemical Preparation and Electrochemical Measurements

The electrochemical tests were collected at room temperature of 25 °C using two-electrode coin cells (type: 2032) with lithium or sodium disc serving as the contrary electrodes and the reference electrodes. For fabrication of Se@SCDC anode, 80 wt% active material, 10 wt% carbon black (Super-P) and 10 wt% polyvinylidenefluoride (PVDF) in methyl-2-pyrrolidone (NMP) were well dispersed and then coated on the surface of current collector Al foil pressed and punched to 14 mm diameter. After vacuum heating at 90 °C for 14 h, the electrodes with an area loading of 0.65 mg cm−2 were obtained. The electrolyte used in LIBs or SIBs was separate, 1 M LiPF6 or 1 M NaClO4 in a 1:1:1 (v/v/v) mixture of ethylene carbonate (EC), diethyl carbonate (DMC), and ethyl methyl carbonate (EMC), added with 2% (mass ratio) fluoroethylene carbonate (FEC). The cell assemble was performed in an argon-filled glove box with both H2O and O2 less than 0.1 ppm. The cyclic voltammograms (CV) tests were conducted with scan rates for 1.4 mV s−1, 1.6 mV s−1, 1.8 mV s−1 and 2.0 mV s−1. Electrochemical impedance spectroscopy (EIS) was determined by using PGSTAT302N (Metrohm Co., Ltd., Herisau, Switzerland) in the frequency range from 0.1 MHz to 0.05 Hz with an amplitude of 5 mV. Galvanostatic charge/discharge and cyclic stability measurements were performed in the potential window of 0.1 V to 3.0 V on a Neware BTS-5V10mA battery test system (Shenzhen Electronics Co., Ltd., Shenzhen, China).
No animals or humans, and other studies that require ethical approval were included in this research.

Supplementary Materials

The following supporting information can be downloaded at: https://www.mdpi.com/article/10.3390/batteries9030143/s1, References [59,60,61,62,63,64,65,66,67] are cited in the supplementary materials. Figure S1: Low-resolution images of FESEM for Se@SCDC with various mass ratios of Se/C: (a) mSe/mC = 4/1; (b) mSe/mC = 5/1; (c) mSe/mC = 6/1; (d) mSe/mC = 7/1. Figure S2: low-resolution and (b) high-resolution TEM of SCDC. Figure S3: (a) the XPS survey; (b) Se 3d spectrum, and (c) the ratio of atomic% for SCDC/Se of Se@SCDC materials with mSe/mC = 3/1; mSe/mC = 4/1; mSe/mC = 5/1 and mSe/mC = 6/1. Figure S4: (a) X-ray diffraction of Se and Se@SCDC materials with different mass ratios of Se/C; (b) thermogravimetric analysis of Se@SCDC materials with different mass ratios of Se/C; (c) the Raman spectra of SCDC; (d) the high-resolution XPS spectrum of Se 3p. Figure S5: The voltage-specific capacity curves of Se@SCDC-5-1/Li (a) initial cycles; (b) from 50th to 150th at 0.1 A g−1; (c) first charge and discharge curves and (d) the voltage-specific capacity curves of Se@SCDC-5-1/Na corresponds to gradient charge/discharge rates of Se@SCDC-5-1 composite from 0.1, 0.2, 0.5, 1.0, 2.0 to 5.0 A g−1 inset Figure 4c. Figure S6: (a) Gradient charge-discharge characteristic of Se@SCDC with various mass ratios of Se/C; (b) cyclic stability at 0.1 A g−1 of Se@SCDC with various mass ratios of Se/C; (c) cyclic stability at 0.1 A g−1 of Se@SCDC, C or Se /Li; (d) cyclic stability at 0.1 A g−1 of Se@SCDC, C or Se/Na. Figure S7: (a) The adsorption and desorption iso-thermal curves and (b) pore size distribution of SCDC and Se@SCDC materials. Figure S8: Cyclic voltammetry curves Se@SCDC-5-1/Na for 1.0 mV s−1, 1.2 mV s−1, 1.4 mV s−1, 1.6 mV s−1, and 1.8 mV s−1 between 0.1 and 3.0 V. Figure S9: (a) The optical photograph of electrolyte and (b) ex-situ SEM and (c) the electron diffraction energy spectrum (EDS) determined by FESEM; element distribution map of (d) C and (e) Se of Se@SCDC-5-1/Na after 100 cycles.

Author Contributions

Conceptualization, L.W. and C.Y. (Changchun Yang); methodology, L.W.; validation, W.L. and B.S. formal analysis, H.Y.; investigation, B.Z. and K.L.; resources, H.L.; data curation, L.W. and Q.Y.; writing—original draft preparation, L.W.; writing—review and editing, P.L. and W.F.; visualization, C.Y. (Chuan Yao); supervision, S.G. and H.L.; project administration, S.G. and Y.X.; funding acquisition, Y.G., Z.Z., L.W. and P.L. All authors have read and agreed to the published version of the manuscript.

Funding

This research was funded by National Research Project Cultivation Fund of Xuchang University (2022GJPY017) and Open project of GuangXi Key Laboratory of Electrochemical Energy Materials (2022CXTD007).

Institutional Review Board Statement

Not applicable.

Informed Consent Statement

Not applicable.

Data Availability Statement

Not applicable.

Conflicts of Interest

Y.X. was employed by Henan Kelong New Energy Co. Ltd. The other authors declare that the research was conducted in the absence of any commercial or financial relationships that could be construed as a potential conflict of interest.

References

  1. Di Lecce, D.; Verrelli, R.; Hassoun, J. Lithium-Ion Batteries for Sustainable Energy Storage: Recent Advances Towards New Cell Configurations. Green Chem. 2017, 19, 3442–3467. [Google Scholar] [CrossRef]
  2. Li, M.; Lu, J.; Chen, Z.; Amine, K. 30 Years of Lithium-Ion Batteries. Adv. Mater. 2018, 30, 1800561. [Google Scholar] [CrossRef] [Green Version]
  3. Nayak, P.K.; Yang, L.; Brehm, W.; Adelhelm, P. From Lithium-Ion to Sodium-Ion Batteries: Advantages, Challenges, and Surprises. Angew. Chem. Int. Ed. 2018, 57, 102–120. [Google Scholar] [CrossRef] [PubMed]
  4. Tarascon, J.-M.; Armand, M. Issues and Challenges Facing Rechargeable Lithium Batteries. Nature 2001, 414, 359–367. [Google Scholar] [CrossRef]
  5. Wu, H.B.; Lou, X.W.D. Metal-Organic Frameworks and Their Derived Materials for Electrochemical Energy Storage and Conversion: Promises and Challenges. Sci. Adv. 2017, 3, 9252. [Google Scholar] [CrossRef] [Green Version]
  6. Turcheniuk, K.; Singhal, V.; Yushin, G. Ten Years Left to Redesign Lithium-Ion Batteries. Nature 2018, 559, 467. [Google Scholar] [CrossRef] [Green Version]
  7. Liu, Y.; Dai, H.; An, Y.; Fu, L.; An, Q.; Wu, Y. Facile and Scalable Synthesis of a Sulfur, Selenium and Nitrogen Co-Doped Hard Carbon Anode for High Performance Na- and K-Ion Batteries. J. Mate. Chem. A 2020, 8, 14993–15001. [Google Scholar] [CrossRef]
  8. Zhang, W.; Jin, H.; Du, Y.; Zhang, Y.; Wang, Z.; Zhang, J. Hierarchical Lamellar-Structured MnO2@Graphene for High Performance Li, Na and K Ion Batteries. Chem. Select. 2020, 5, 12481–12486. [Google Scholar] [CrossRef]
  9. Yan, J.; Li, H.; Wang, K.; Jin, Q.; Lai, C.; Wang, R.; Cao, S.; Han, J.; Zhang, Z.; Su, J.; et al. Ultrahigh Phosphorus Doping of Carbon for High-Rate Sodium Ion Batteries Anode. Adv. Energy Mater. 2021, 11, 2003911. [Google Scholar] [CrossRef]
  10. Kim, S.-W.; Seo, D.-H.; Ma, X.; Ceder, G.; Kang, K. Electrode Materials for Rechargeable Sodium-Ion Batteries: Potential Alternatives to Current Lithium-Ion Batteries. Adv. Energy Mater. 2012, 2, 710–721. [Google Scholar] [CrossRef]
  11. Andersen, H.L.; Djuandhi, L.; Mittal, U.; Sharma, N. Strategies for the Analysis of Graphite Electrode Function. Adv. Energy Mater. 2021, 11, 2102693. [Google Scholar] [CrossRef]
  12. Chaudhary, M.; Tyagi, S.; Gupta, R.K.; Singh, B.P.; Singhal, R. Surface Modification of Cathode Materials for Energy Storage Devices: A Review. Surf. Coat. Technol. 2021, 412, 127009. [Google Scholar] [CrossRef]
  13. Luo, W.; Chen, X.; Xia, Y.; Chen, M.; Wang, L.; Wang, Q.; Li, W.; Yang, J. Surface and Interface Engineering of Silicon-Based Anode Materials for Lithium-Ion Batteries. Adv. Energy Mater. 2017, 7, 1701083. [Google Scholar] [CrossRef]
  14. Jo, C.-H.; Jo, J.-H.; Yashiro, H.; Kim, S.-J.; Sun, Y.-K.; Myung, S.-T. Bioinspired Surface Layer for the Cathode Material of High-Energy-Density Sodium-Ion Batteries. Adv. Energy Mater. 2018, 8, 1702942. [Google Scholar] [CrossRef]
  15. Piao, J.-Y.; Gu, L.; Wei, Z.; Ma, J.; Wu, J.; Yang, W.; Gong, Y.; Sun, Y.-G.; Duan, S.-Y.; Tao, X.-S.; et al. Phase Control on Surface for the Stabilization of High Energy Cathode Materials of Lithium Ion Batteries. J. Am. Chem. Soc. 2019, 141, 4900–4907. [Google Scholar] [CrossRef] [Green Version]
  16. Chae, S.; Choi, S.H.; Kim, N.; Sung, J.; Cho, J. Integration of Graphite and Silicon Anodes for the Commercialization of High-Energy Lithium-Ion Batteries. Angew. Chem. Int. Ed. Engl. 2020, 59, 110–135. [Google Scholar] [CrossRef] [Green Version]
  17. Yu, C.-X.; Li, Y.; Wang, Z.-H.; Wang, X.-R.; Bai, Y.; Wu, C. Surface Engineering Based on in Situ Electro-Polymerization to Boost the Initial Coulombic Efficiency of Hard Carbon Anode for Sodium-Ion Battery. Rare Met. 2022, 41, 1616–1625. [Google Scholar] [CrossRef]
  18. Xu, Y.; Li, Q.; Pang, H. Recent Advances in Metal Organic Frameworks and Their Composites for Batteries. Nano Futures 2020, 4, 032007. [Google Scholar] [CrossRef]
  19. Zeng, Z.; Jiang, X.; Li, R.; Yuan, D.; Ai, X.; Yang, H.; Cao, Y. A Safer Sodium-Ion Battery Based on Nonflammable Organic Phosphate Electrolyte. Adv. Sci. 2016, 3, 1600066. [Google Scholar] [CrossRef] [Green Version]
  20. Xu, Q.; Yang, Y.; Shao, H. Enhanced Cycleability and Dendrite-Free Lithium Deposition by Addition of Sodium Ion in Electrolyte for Lithium Metal Batteries. Electrochim. Acta 2018, 271, 617–623. [Google Scholar] [CrossRef]
  21. Morales, D.; Ruther, R.E.; Nanda, J.; Greenbaum, S. Ion Transport and Association Study of Glyme-Based Electrolytes with Lithium and Sodium Salts. Electrochim. Acta 2019, 304, 239–245. [Google Scholar] [CrossRef]
  22. Conway, B.; Jewell, K.; Tanner, C. Flexible Lithium-Ion Conducting Composite Electrolyte. Batter. Supercaps 2020, 3, 653–657. [Google Scholar] [CrossRef]
  23. Kartha, T.R.; Mallik, B.S. Ionic Conductance and Viscous Drag in Water-in-Salt Electrolytes for Lithium and Sodium Ion Batteries and Supercapacitors. Mater. Today Commun. 2020, 25, 101588. [Google Scholar] [CrossRef]
  24. Puthirath, A.B.; Tsafack, T.; Patra, S.; Thakur, P.; Chakingal, N.; Saju, S.K.; Baburaj, A.; Kato, K.; Babu, G.; Narayanan, T.N.; et al. Lithium, Sodium and Magnesium Ion Conduction in Solid State Mixed Polymer Electrolytes. Phys. Chem. Chem. Phys. 2020, 22, 19108–19119. [Google Scholar] [CrossRef]
  25. Allam, O.; Cho, B.W.; Kim, K.C.; Jang, S.S. Application of Dft-Based Machine Learning for Developing Molecular Electrode Materials in Li-Ion Batteries. RSC Adv. 2018, 8, 39414–39420. [Google Scholar] [CrossRef] [PubMed] [Green Version]
  26. Sun, Y.; Guo, S.; Zhou, H. Exploration of Advanced Electrode Materials for Rechargeable Sodium-Ion Batteries. Adv. Energy Mater. 2018, 9, 1800212. [Google Scholar] [CrossRef]
  27. Xiao, B.; Soto, F.A.; Gu, M.; Han, K.S.; Song, J.; Wang, H.; Engelhard, M.H.; Murugesan, V.; Mueller, K.T.; Reed, D.; et al. Lithium-Pretreated Hard Carbon as High-Performance Sodium-Ion Battery Anodes. Adv. Energy Mater. 2018, 8, 1801441. [Google Scholar] [CrossRef]
  28. Sivajee Ganesh, K.; Purusottam Reddy, B.; Jeevan Kumar, P.; Hussain, O.M. Influence of Zr Dopant on Microstructural and Electrochemical Properties of LiCoO2 Thin Film Cathodes by Rf Sputtering. J. Electroanal. Chem. 2018, 828, 71–79. [Google Scholar] [CrossRef]
  29. Pitcheri, R.; Theophile, N.; Sangaraju, S.; Haekyoung, K. Graphene based magnetite carbon nanofiber composites as anodes for high-performance Li-ion batteries. New J. Chem. 2023, 47, 482–490. [Google Scholar] [CrossRef]
  30. Yuan, Y.; Chen, Z.; Yu, H.; Zhang, X.; Liu, T.; Xia, M.; Zheng, R.; Shui, M.; Shu, J. Heteroatom-Doped Carbon-Based Materials for Lithium and Sodium Ion Batteries. Energy Storage Mater. 2020, 32, 65–90. [Google Scholar] [CrossRef]
  31. Zhang, H.; Huang, Y.; Ming, H.; Cao, G.; Zhang, W.; Ming, J.; Chen, R. Recent Advances in Nanostructured Carbon for Sodium-Ion Batteries. J. Mater. Chem. A 2020, 8, 1604–1630. [Google Scholar] [CrossRef]
  32. Zhao, X.; Yin, L.; Zhang, T.; Zhang, M.; Fang, Z.; Wang, C.; Wei, Y.; Chen, G.; Zhang, D.; Sun, Z.; et al. Heteroatoms Dual-Doped Hierarchical Porous Carbon-Selenium Composite for Durable Li-Se and Na-Se Batteries. Nano Energy 2018, 49, 137–146. [Google Scholar] [CrossRef]
  33. Li, Y.; Chen, M.; Liu, B.; Zhang, Y.; Liang, X.; Xia, X. Heteroatom Doping: An Effective Way to Boost Sodium Ion Storage. Adv. Energy Mater. 2020, 10, 2000927. [Google Scholar] [CrossRef]
  34. Zhang, Z.; Zhao, X.; Li, J. SnSe/Carbon Nanocomposite Synthesized by High Energy Ball Milling as an Anode Material for Sodium-Ion and Lithium-Ion Batteries. Electrochim. Acta 2015, 176, 1296–1301. [Google Scholar] [CrossRef]
  35. Balogun, M.-S.; Luo, Y.; Qiu, W.; Liu, P.; Tong, Y. A Review of Carbon Materials and Their Composites with Alloy Metals for Sodium Ion Battery Anodes. Carbon 2016, 98, 162–178. [Google Scholar] [CrossRef]
  36. Yang, X.; Zhang, Z. Carbon-Coated Vanadium Selenide as Anode for Lithium-Ion Batteries and Sodium-Ion Batteries with Enhanced Electrochemical Performance. Mater. Lett. 2017, 189, 152–155. [Google Scholar] [CrossRef]
  37. Zhao, Y.; Wang, L.P.; Sougrati, M.T.; Feng, Z.; Leconte, Y.; Fisher, A.; Srinivasan, M.; Xu, Z. A Review on Design Strategies for Carbon Based Metal Oxides and Sulfides Nanocomposites for High Performance Li and Na Ion Battery Anodes. Adv. Energy Mater. 2017, 7, 1601424. [Google Scholar] [CrossRef]
  38. Sheng, W.; Zhang, P.; Li, W.; Zhang, T.; Tan, D.; Li, Y.; Wang, F.; Zhuang, X.; Feng, X.; Jordan, R. Mussel-Inspired Nitrogen-Doped Porous Carbon as Anode Materials for Sodium-Ion Batteries. Energy Technol. 2019, 7, 1800763. [Google Scholar] [CrossRef]
  39. Gomez-Martin, A.; Martinez-Fernandez, J.; Ruttert, M.; Winter, M.; Placke, T.; Ramirez-Rico, J. An Electrochemical Evaluation of Nitrogen-Doped Carbons as Anodes for Lithium Ion Batteries. Carbon 2020, 164, 261–271. [Google Scholar] [CrossRef]
  40. Huang, J.; Lin, Y.; Ji, M.; Cong, G.; Liu, H.; Yu, J.; Yang, B.; Li, C.; Zhu, C.; Xu, J. Nitrogen-Doped Porous Carbon Derived from Foam Polystyrene as an Anode Material for Lithium-Ion Batteries. Appl. Surf. Sci. 2020, 504, 144398. [Google Scholar] [CrossRef]
  41. Fu, Y.; Wei, Q.; Zhang, G.; Sun, S. Advanced Phosphorus-Based Materials for Lithium/Sodium-Ion Batteries: Recent Developments and Future Perspectives. Adv. Energy Mater. 2018, 8, 1703058. [Google Scholar] [CrossRef]
  42. Liu, W.; Zhi, H.; Yu, X. Recent Progress in Phosphorus Based Anode Materials for Lithium/Sodium Ion Batteries. Energy Storage Mater. 2019, 16, 290–322. [Google Scholar] [CrossRef]
  43. Liu, Y.; Qiao, Y.; Wei, G.; Li, S.; Lu, Z.; Wang, X.; Lou, X. Sodium Storage Mechanism of N, S Co-Doped Nanoporous Carbon: Experimental Design and Theoretical Evaluation. Energy Storage Mater. 2018, 11, 274–281. [Google Scholar] [CrossRef]
  44. Wan, H.; Ju, X.; He, T.; Chen, T.; Zhou, Y.; Zhang, C.; Wang, J.; Xu, Y.; Yao, B.; Zhuang, W.; et al. Sulfur-Doped Porous Carbon as High-Capacity Anodes for Lithium and Sodium Ions Batteries. J. Alloys Compd. 2021, 863, 158078. [Google Scholar] [CrossRef]
  45. Ma, G.; Ning, G.; Wei, Q. S-Doped Carbon Materials: Synthesis, Properties and Applications. Carbon 2022, 195, 328–340. [Google Scholar] [CrossRef]
  46. Kim, J.K.; Kang, Y.C. Encapsulation of Se into Hierarchically Porous Carbon Microspheres with Optimized Pore Structure for Advanced Na-Se and K-Se Batteries. ACS Nano 2020, 14, 13203–13216. [Google Scholar] [CrossRef]
  47. Yang, B.; Liu, S.; Fedoseeva, Y.V.; Okotrub, A.V.; Makarova, A.A.; Jia, X.; Zhou, J. Engineering Selenium-Doped Nitrogen-Rich Carbon Nanosheets as Anode Materials for Enhanced Na-Ion Storage. J. Power Sources 2021, 493, 229700. [Google Scholar] [CrossRef]
  48. Zhou, J.; Chen, M.; Wang, T.; Li, S.; Zhang, Q.; Zhang, M.; Xu, H.; Liu, J.; Liang, J.; Zhu, J.; et al. Covalent Selenium Embedded in Hierarchical Carbon Nanofibers for Ultra-High Areal Capacity Li-Se Batteries. iScience 2020, 23, 100919. [Google Scholar] [CrossRef] [Green Version]
  49. Tian, H.; Tian, H.; Wang, S.; Chen, S.; Zhang, F.; Song, L.; Liu, H.; Liu, J.; Wang, G. High-Power Lithium–Selenium Batteries Enabled by Atomic Cobalt Electrocatalyst in Hollow Carbon Cathode. Nat. Commun. 2020, 11, 5025. [Google Scholar] [CrossRef] [PubMed]
  50. Sun, W.; Guo, K.; Fan, J.; Min, Y.; Xu, Q. Confined Selenium in N-Doped Mesoporous Carbon Nanospheres for Sodium-Ion Batteries. ACS Appl. Mater. Interfaces 2021, 13, 16558–16566. [Google Scholar] [CrossRef]
  51. Rajamanickam, D.; Dhatshanamurthi, P.; Shanthi, M. Preparation and characterization of SeO2/TiO2 composite photocatalyst with excellent performance for Sunset Yellow azo dye degradation under natural sunlight illumination. Spectrochim. Acta A Mol. Biomol. Spectrosc. 2015, 138, 389–498. [Google Scholar] [CrossRef] [PubMed]
  52. Mohsen, S.; Sudhakar, S.; David, L. XPS Study of Some Selected Selenium Compounds. J. Electron Spectrosc. 1986, 40, 329–337. [Google Scholar] [CrossRef]
  53. Huang, Q.; Wang, S.; Zhang, Y.; Yu, B.; Hou, L.; Su, G.; Ma, S.; Zou, J.; Huang, H. Hollow carbon nanospheres with extremely small size as anode material in lithium-ion batteries with outstanding cycling stability. J. Phys. Chem. C 2016, 120, 3139–3144. [Google Scholar] [CrossRef]
  54. Dong, J.; Zhang, T.; Zhang, D.; Zhang, W.; Zhang, H.; Liu, R.; Yao, M.; Liu, B. Remarkable cycle-activated capacity increasing in onion-like carbon nanospheres as lithium battery anode material. Nanotechnology 2016, 28, 035704. [Google Scholar] [CrossRef]
  55. Cheng, L.; Ma, C.; Lu, W.; Wang, X.; Yue, H.; Zhang, D.; Xing, Z. A Graphitized Hierarchical Porous Carbon as an Advanced Cathode Host for Alkali Metal-Selenium Batteries. Chem. Eng. 2022, 433, 133527. [Google Scholar] [CrossRef]
  56. Brezesinski, T.; Wang, J.; Tolbert, S.H.; Dunn, B. Ordered Mesoporous Alpha-MoO3 with Iso-Oriented Nanocrystalline Walls for Thin-Film Pseudocapacitors. Nat. Mater. 2010, 9, 146–151. [Google Scholar] [CrossRef]
  57. Wu, L.; Yang, J.O.; Guo, S.; Yao, L.; Li, H.; Zhang, S.; Yue, H.; Cai, K.; Zhang, C.; Yang, C.; et al. Pseudocapacitive Trimetal Fe0.8CoMnO4 Nanoparticles@Carbon Nanofibers as High-Performance Sodium Storage Anode with Self-Supported Mechanism. Adv. Funct. Mater. 2020, 30, 2001718. [Google Scholar] [CrossRef]
  58. Yang, B.; Chen, J.; Lei, S.; Guo, R.; Li, H.; Shi, S.; Yan, X. Spontaneous growth of three-dimensional framework carbon from sodium citrate for high energy- and power-density and long-life sodium-ion hybrid capacitors. Adv. Energy Mater. 2018, 8, 1702409. [Google Scholar] [CrossRef]
  59. Hong, Y.; Kang, Y. Selenium-Impregnated Hollow Carbon Microspheres as Efficient Cathode Materials for Lithium-Selenium Batteries. Carbon 2017, 111, 198–206. [Google Scholar] [CrossRef]
  60. Zhao, D.; Wang, L.; Qiu, M.; Zhang, N. Amorphous Se Restrained by Biomass-Derived Defective Carbon for Stable Na-Se Batteries. ACS Appl. Energy Mater. 2021, 4, 7219–7225. [Google Scholar] [CrossRef]
  61. Wang, B.; Zhang, J.; Xia, Z.; Fan, M.; Lv, C.; Guang, L.; Tian, G.; Li, X. Polyaniline-coated selenium/carbon composites encapsulated in graphene as efficient cathodes for Li-Se batteries. Nano Res. 2018, 11, 2460–2469. [Google Scholar] [CrossRef]
  62. Mukkabla, R.; Deshagani, S.; Meduri, P.; Deepa, M.; Ghosal, P. Selenium/Graphite Platelet Nanofiber Composite for Durable Li-Se Batteries. ACS Energy Lett. 2017, 2, 1288–1295. [Google Scholar] [CrossRef] [Green Version]
  63. Zhang, S.; Wang, W.; Xin, S.; Ye, H.; Yin, Y.; Guo, Y. Graphitic Nanocarbon-Selenium Cathode with Favorable Rate Capability for Li-Se Batteries. ACS Appl. Mater. Interfaces 2017, 9, 8759–8765. [Google Scholar] [CrossRef] [PubMed]
  64. Feng, N.; Xiang, K.; Xiao, L.; Chen, W.; Zhu, Y.; Liao, H.; Chen, H. Se/CNTs microspheres as improved performance for cathodes in Li-Se batteries. J. Alloys Compd. 2019, 786, 537–543. [Google Scholar] [CrossRef]
  65. Dong, W.; Wang, C.; Li, C.; Xia, F.; Yu, W.; Wu, L.; Mohamed, H.; Hu, Z.; Liu, J.; Chen, L.; et al. The free-standing N-doped Murray carbon framework with the engineered quasi-optimal Se/C interface for high-Se-loading Li/Na-Se batteries at elevated temperature. Mater. Today Energy 2021, 21, 100808. [Google Scholar] [CrossRef]
  66. Wu, X.; Chen, X.; Wu, H.; Xie, B.; Wang, D.; Wang, R.; Zhang, X.; Piao, Y.; Diao, G.; Chen, M. Encapsulation of Se in dual-wall hollow carbon spheres: Physical confinement and chemisorption for superior Na-Se and K-Se batteries. Carbon 2022, 187, 354–364. [Google Scholar] [CrossRef]
  67. Kim, J.; Kang, Y. Deliberate introduction of mesopores into microporous activated carbon toward efficient Se cathode of Na-Se batteries. Int. J. Energy Res. 2022, 46, 3396–3408. [Google Scholar] [CrossRef]
Figure 1. Synthesis principal of Se@SCDC composites.
Batteries 09 00143 g001
Figure 2. (a) FESEM of SCDC; (b) SEM of Se@SCDC-5-1 composite; (c) the low magnification TEM of Se@SCDC-5-1 composite (inset, the upper right corner is high-resolution TEM image; the bottom left corner is electron diffraction spectra); (d) the electron diffraction energy spectrum (EDS) determined by FESEM; (e,f) element distribution map of C and Se; (g) X-ray diffraction spectrum of Se@SCDC-5-1 composite.
Batteries 09 00143 g002
Figure 3. (a) Raman spectra of Se@SCDC-5-1 composite with C/Se mass ratio of 1/5; (b) survey XPS spectrum; (c,d) high-resolution XPS spectrum of C 1s and Se 3d.
Batteries 09 00143 g003
Figure 4. (a) Cyclic performance for Se@SCDC-5-1/Li after 450 cycles directly tested after charge/discharge rates from 0.1, 0.2, 0.5, 1.0, 2.0 A g−1 (inset, charge/discharge rates for Se@SCDC-5-1/Li from 0.1, 0.2, 0.5, 1.0 to 2.0 A g−1); (b) cyclic performance for Se@SCDC-5-1/Li at 1 A g−1 for 720 cycles; (c) cyclic performance for Se@SCDC-5-1/Na after 530 cycles directly tested after charge/discharge rates from 0.1, 0.2, 0.5, 1.0, 2.0, 5.0 A g−1 (inset, charge/discharge rates of Se@SCDC-5-1 composite from 0.1, 0.2, 0.5, 1.0, 2.0 to 5.0 A g−1); (d) cyclic performance for Se@SCDC-5-1/Na at 1 A g−1 for 560 cycles.
Batteries 09 00143 g004
Figure 5. (a) Cyclic voltammetry (CV) curves of Se@SCDC/Na for 2.0 mV s−1, 2.2 mV s−1, 2.4 mV s−1, 2.6 mV s−1, and 3.0 mV s−1; (b) linear fitting of the logarithm of sweep velocity and peak current; (c) pseudo-capacitance region diagram of 2.0 mV s−1; (d) the normalized capacitance ratio histogram of 2.0 mV s−1, 2.2 mV s−1, 2.4 mV s−1, 2.6 mV s−1, and 3.0 mV s−1.
Batteries 09 00143 g005
Figure 6. (a) Nyquist figure tested and fitted for Se@SCDC-5-1 as tested electrode and Na metal as counter and reference electrode before 560 cycles (inset, the equivalent circuit before 560 cycles); (b) the scatter plots and corresponding linear fitting with ω−1/2 as X-axis and Z’ as Y-axis.
Batteries 09 00143 g006
Disclaimer/Publisher’s Note: The statements, opinions and data contained in all publications are solely those of the individual author(s) and contributor(s) and not of MDPI and/or the editor(s). MDPI and/or the editor(s) disclaim responsibility for any injury to people or property resulting from any ideas, methods, instructions or products referred to in the content.