Article

Lithium-Ion Battery State of Health Estimation with Multi-Feature Collaborative Analysis and Deep Learning Method

1
College of Automotive Engineering, Jilin University, Changchun 130022, China
2
School of Transportation Science and Engineering, Beihang University, Beijing 102206, China
3
China Software Testing Center, Beijing 100038, China
4
School of Mechanical Engineering, University of Science and Technology Beijing, Beijing 100083, China
5
State Key Laboratory of Automotive Safety and Energy, Tsinghua University, Beijing 100084, China
6
Dyson School of Design Engineering, Imperial College London, London SW7 2AZ, UK
7
State Key Laboratory of Automotive Simulation and Control, Jilin University, Changchun 130022, China
*
Author to whom correspondence should be addressed.
Batteries 2023, 9(2), 120; https://doi.org/10.3390/batteries9020120
Submission received: 26 December 2022 / Revised: 2 February 2023 / Accepted: 6 February 2023 / Published: 8 February 2023
(This article belongs to the Special Issue Feature Papers to Celebrate the First Impact Factor of Batteries)

Abstract

:
The accurate estimation of the battery state of health (SOH) is crucial for the dependability and safety of battery management systems (BMS). The generality of existing SOH estimation methods is limited as they tend to primarily consider information from single-source features. Therefore, a novel method for integrating multi-feature collaborative analysis with deep learning-based approaches is proposed in this research. First, several battery degradation features are obtained through differential thermal voltammetry (DTV) analysis, singular value decomposition (SVD), incremental capacity analysis (ICA), and terminal voltage characteristic (TVC) analysis. The features highly related to SOH are selected as inputs for the deep learning model based on the results of a Pearson correlation analysis. The SOH estimation is achieved by developing a deep learning framework cored by long short-term memory (LSTM) neural network (NN), which integrates multi-source features as an input. A suggested method is validated using NASA and Oxford Battery Degradation datasets. The results demonstrate that the presented model provides great SOH estimation accuracy and generality, where the maximum root mean square error (RMSE) is less than 1%. Based on a cloud computing platform, the proposed method can be applied to provide a real-time prediction of battery health, with the potential to enhance battery full lifespan management.

1. Introduction

Lithium-ion batteries are deployed in a multitude of applications, including portable electronics, electric vehicles (EVs), and energy storage devices [1,2,3]. As the performance of LIBs declines nonlinearly, it becomes a system’s safety risk and limits the usage of electrical devices [4,5,6,7]. It also restricts the continuous use of LIBs as a secondary energy storage medium [8,9,10]. Therefore, the precise prediction of the state of health (SOH) is essential for EVs and sustainable energy application developments.
SOH is one of the metrics that reflects battery health in terms of available capacity. Studies have shown that battery degradation is a sophisticated physicochemical process [11,12,13]. The process is simultaneously influenced by internal and external elements of the battery [14]. Due to the complex operating conditions, the accumulation of internal side reaction products leads to shifts in electrochemical equilibrium, which makes the battery degradation process highly non-linear [15]. Due to the requirements of non-destructive detection, it is challenging to obtain SOH by direct measurement and experimental approaches. These methods need intricately constructed experiments and voluminous data [16,17]. Moreover, direct measurement and experimental approaches are frequently difficult to converge quickly and prone to signal distortions [18,19]. These issues render the above methods unsuitable for complicated, dynamic, real-time operations and practical applications.
Diverse methods have been investigated to provide accurate SOH estimation, including model-based methods and data-driven methods. The model-based method can be generally categorized into the equivalent circuit model (ECM) [20,21,22] and the electrochemical model [23,24,25]. Electrochemical models are more appropriate than ECM models for estimating SOH. Electrochemical models are developed to simulate the degradation of a battery by incorporating mathematical descriptions of the underlying physical and chemical processes that occur within the battery during operation. Capacity loss is estimated by simulating the recyclable lithium-ion loss and the functional material loss of electrodes throughout cycles. Jin et al. [26] derived a reduced-order degradation model for electrode materials based on an effective physical loss mechanism and obtained the battery capacity. Li et al. [27] estimated the battery SOH by calculating the loss of active lithium-ions across aging cycles and incorporating SEI growth corrections into a single particle model. The model-based methods are equipped with the advantage of high interpretability. However, the significant computational cost limits the adoption of these approaches on mobile devices with limited real-time computing power. In addition, the lack of detail caused by model simplification leads to a distinct disparity between the estimated and true values. Meanwhile, increasing model complexity to improve the estimation performance leads to a discernible declining marginal utility. Therefore, deploying the model-based model on the cloud with sufficient computing resources, acquiring the SOH with actual measurement data, and filtering methods on the mobile side have garnered interest [28,29]. Although the application of these approaches achieves a balance between computing expense and estimating accuracy, their efficacy is still constrained by the electrochemical model. As a result, it is incompetent to complex and dynamic working conditions by using electrochemical models.
Recent developments in the machine learning field have provided a promising solution to SOH estimation. Data-driven methods are adaptable to dynamic operating conditions since they are not restricted by intricate physical specifics. Many studies have utilized machine learning approaches to achieve SOH estimation based on degradation features. Richardson et al. [30] designed a Gaussian process regression method to calculate SOH. Hu et al. [31] utilized k-nearest neighbor regression to capture capacity dependence based on five features. As a crucial component of data-driven methodologies, deep learning techniques are being used to estimate SOH. Khumprom et al. [32] used a Deep Neural Networks (DNN) approach to predict the SOH and the RUL of LIBs, revealing the excellence of deep learning methods. Li et al. [33] proposed a variant long short-term memory (LSTM) neural network (NN) to enhance the model performance of battery SOH prediction. Hong et al. [34] applied a battery degradation model using LSTM NN for SOH estimation on actual EVs. The above data-driven methods can achieve accuracy in estimating SOH. However, the use of input data that lacks physical relevance can impede the interpretability of these models and restrict their applicability in certain scenarios. As a result, it becomes challenging to comprehend the underlying physical processes that lead to the degradation of the battery.
The effectiveness of data-driven methods is highly dependent on the supplied data. Obtaining features highly related to the degradation process is decisive for the effectiveness of a data-driven model. The incremental capacity analysis (ICA) is one of the critical degradation feature analysis methods. Lin et al. [35] proposed a method for predicting the SOH of a battery by dividing the IC curve into voltage segments and using a back-propagation neural network for each segment to achieve high-precision online SOH estimation. In addition, Zhang et al. [36] and Li et al. [37] also employed IC analysis for SOH estimation. All these works achieved excellent estimation results. However, the IC analysis only contains information on the current and voltage, not temperature. It can only partially capture the relationship between the external signal and internal activities since the internal phase change of the battery is expressed as heat [38]. Therefore, mining temperature information to connect the microscopic degradation process and the signal change has become one of the focuses. Battery degradation can be characterized microscopically through the type and intensity of internal phase change. Macroscopically, external signal characteristics can be used to measure the phase change. The differential thermal voltammetry (DTV) method is proposed to connect the internal phase change and the external signal characteristics [39,40,41]. By incorporating the temperature and voltage characteristics through the DTV method, non-destructive tracking of battery degradation can be realized.
However, data-driven algorithms with single-source information are susceptible to local optima and noise sensitivity, resulting in an accuracy reduction. To eliminate the limitations of single-source information, Dai et al. [42] extracted multiple degradation features based on IC and voltage characteristic analysis. They adopted a neural network with a prior knowledge-based optimization strategy to realize SOH prediction. Patil et al. [43] applied a multi-level support vector machine to forecast the battery SOH after obtaining numerous derived features from voltage and temperature profiles. Wang et al. [44] employed DTV analysis and Gaussian Process Regression (GPR), which effectively extracted features that had a strong correlation with the SOH of LiCoO2 batteries by combining the temperature and voltage information of the batteries. The above works achieved excellent accuracy in SOH estimation. The integration of all relevant data sources, including temperature, current, and voltage, is crucial in the analysis of battery degradation. A comprehensive examination of these factors can facilitate a better understanding of the degradation mechanism. In addition, deep learning methods have high robustness to noise and practical applications due to their ability to learn complex and non-linear relationships between inputs and outputs through multiple layers of abstraction. The validation for different types of battery material is significant. Therefore, the generality can be validated.
In this research, a SOH estimate method based on multi-feature collaborative analysis and deep learning is proposed. First, several degradation features are gathered using DTV, SVD, ICA, and TVC analysis. After that, the input features of the deep learning model are selected using Pearson correlation analysis. To enhance the performance of the LSTM-based deep learning model, the dropout and RMSprop techniques are employed. Based on the NASA and Oxford battery degradation datasets, experiments are conducted. The experimental results demonstrate the generality of the presented model, showing that the proposed method achieves estimation accuracy in each experimental case. This work offers a method that employs a combination of multi-feature collaborative analysis and deep learning methods for the estimation of SOH. The utilization of multi-feature collaborative analysis facilitates the full consideration of various data sources pertaining to LIBs, thereby yielding a model with generality. Furthermore, as the cloud computing platform develops, the suggested method may contribute to real-time online SOH estimation on various systems. Under the architecture of Cyber Hierarchy and Interactional Network (CHAIN), this work contributes to implementing functions (e.g., real-time SOX estimate, safety management, and early defect notification) for the cloud battery management system (BMS) [45,46,47].
The main contributions of this paper are as follows: (1) Multi-feature collaborative analysis method is used for in-depth mining of voltage, current, and temperature data. (2) The characteristic signal analysis approach is incorporated to enhance the quality of model input data while simultaneously lowering data size. (3) Based on the DTV and ICA method, the connection between microscopic phase change and the macroscopic signal is developed, enabling the model input to be physically interpretable. (4) The use of the SVD method is proposed to reduce the dimensionality of data while reinforcing features that are crucial for degradation analysis, allowing for more efficient analysis while preserving the important information.

2. Multi-Feature Analysis

In this section, DTV, singular value decomposition (SVD), IC, and terminal voltage characteristic (TVC) are analyzed with the NASA and Oxford battery degradation datasets. Based on the analyses, multiple degradation features have been selected as alternative features for correlation analysis.

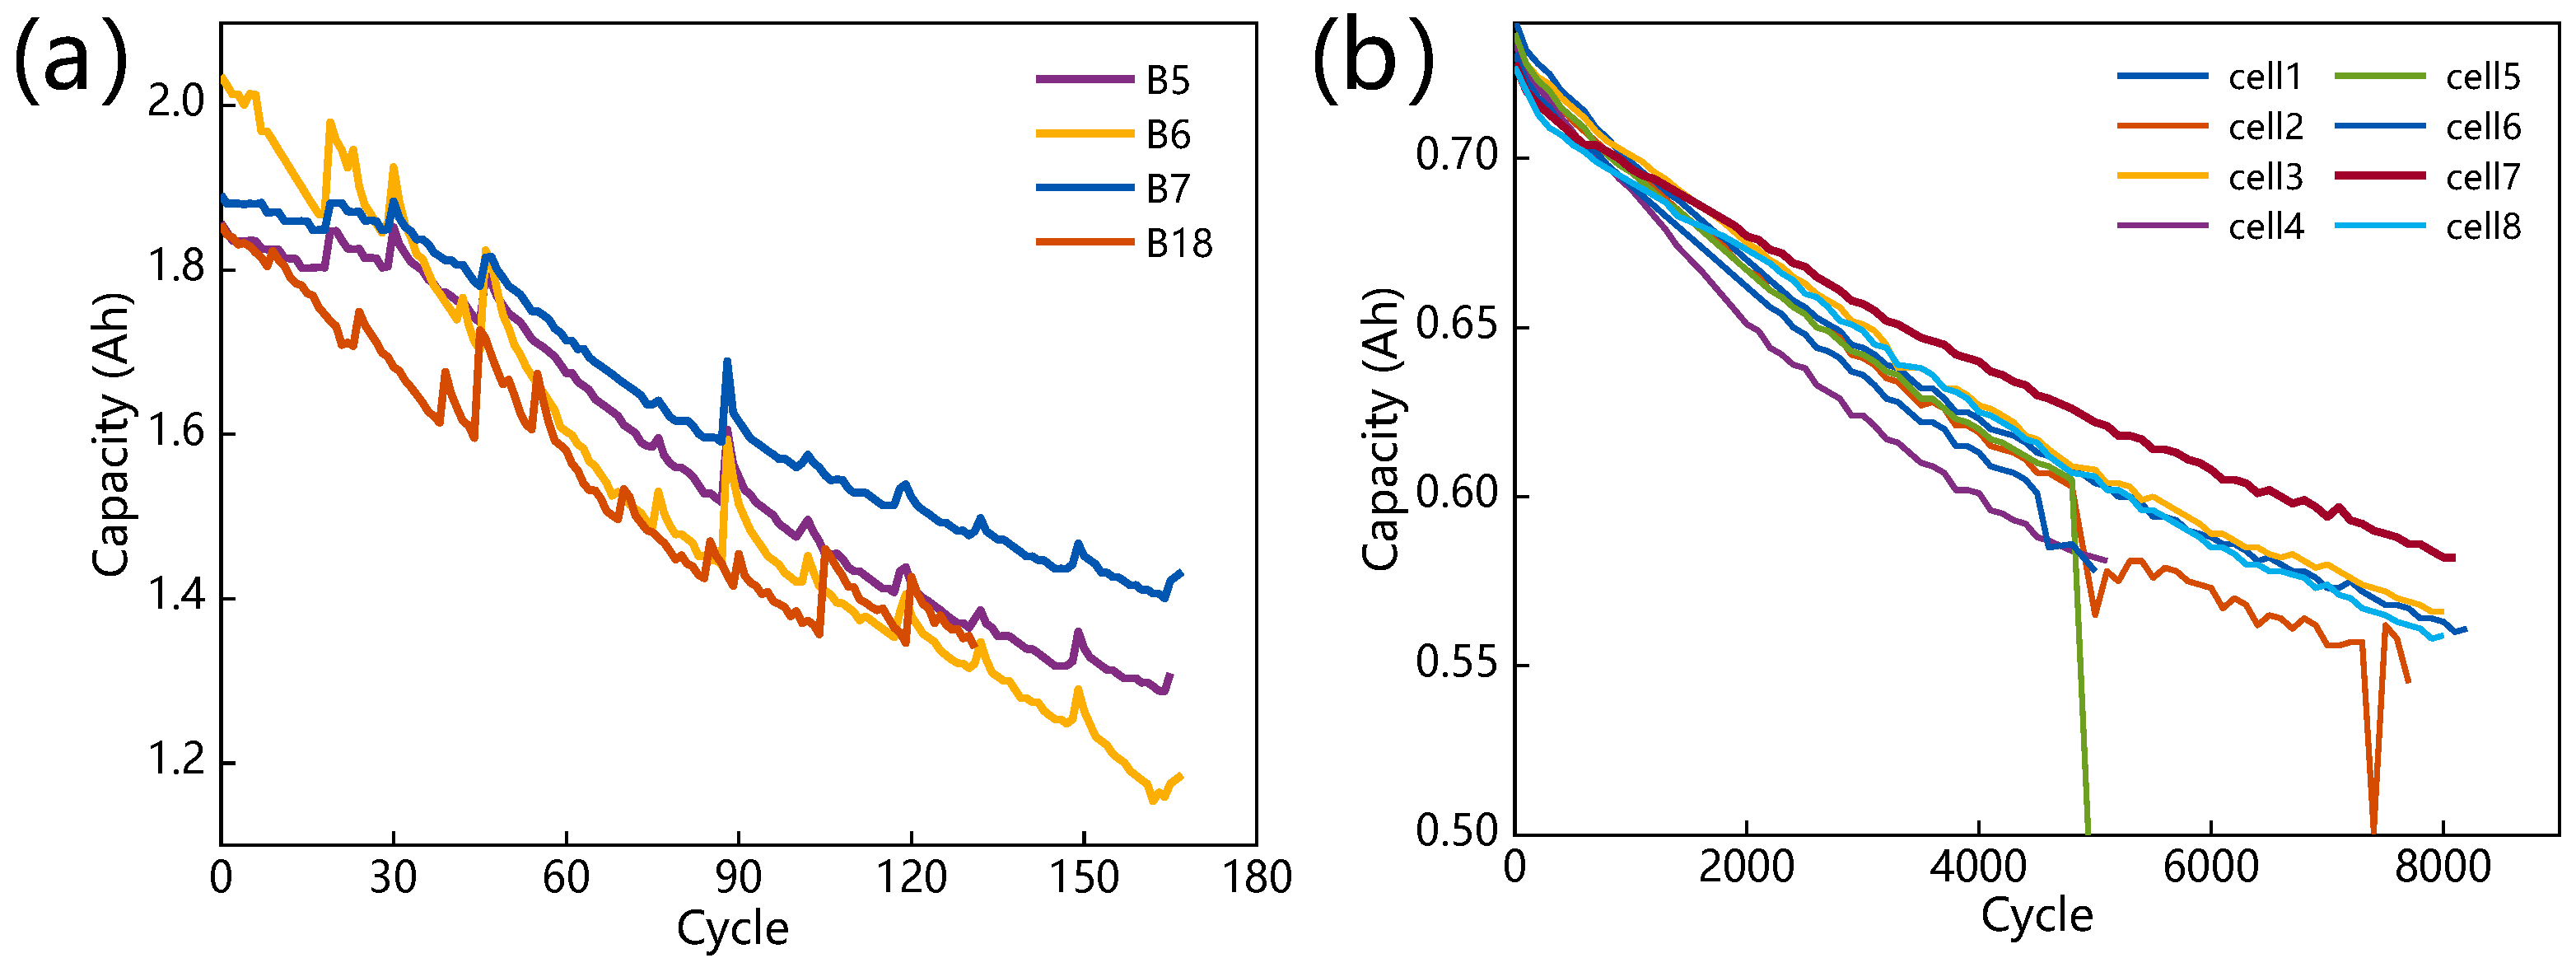
2.1. Battery Degradation Dataset

The experiment conducted four second-generation 18650-size lithium batteries (B5, B6, B7, and B18) with identical LiCoO2 composite materials sourced from the NASA Ames Prognostics Center of Excellence [48]. The degradation of the batteries was evaluated under three conditions, including constant-current and constant-voltage charge (CC-CV) mode and constant-current discharge at 24 °C. The CC-CV charging process was the same for all four batteries, with the current set at 1.5 A until the voltage reached 4.2 V and ceasing once the current dropped below 20 mA during the constant-voltage period. The temperature was divided into three parts based on the current load. Subsequently, the batteries were discharged with a constant current of 2A until the voltages reached the predetermined values of 2.7 V for B5, 2.5 V for B6, 2.2 V for B7, and 2.5 V for B18. The experimental particulars are provided in Table 1. Figure 1a shows the degradation of the capacity of these four batteries with cycles. It can be noted that there is a discernible capacity rebound rather than a monotonic capacity drop as the number of cycles increases, which makes SOH estimation challenging.
The Oxford capacity degradation dataset was compiled by the University of Oxford [49,50]. This paper selects eight batteries with a rated capacity of 740 mAh, designated cells 1 through 8. The temperature of the experiments was maintained at 40 °C. Each cell was repeatedly charged under 2C CC settings and discharged under dynamic circumstances to simulate driving situations. Every 100 cycles, a 1C CC charge/discharge cycle was used to measure the battery capacity. Table 2 displays detailed experimental information. The capacity trajectory of these eight batteries is shown in Figure 1b. Overall, the capacity of the Oxford dataset is a smooth decline. However, the capacity curves of cell 2 and cell 5 show an unexplained plunge, which may be attributable to alterations in operating conditions. Hence, cells 1, 3, 4, 6, 7, and 8 are chosen for training and testing the model in this research.

2.2. Feature Analysis
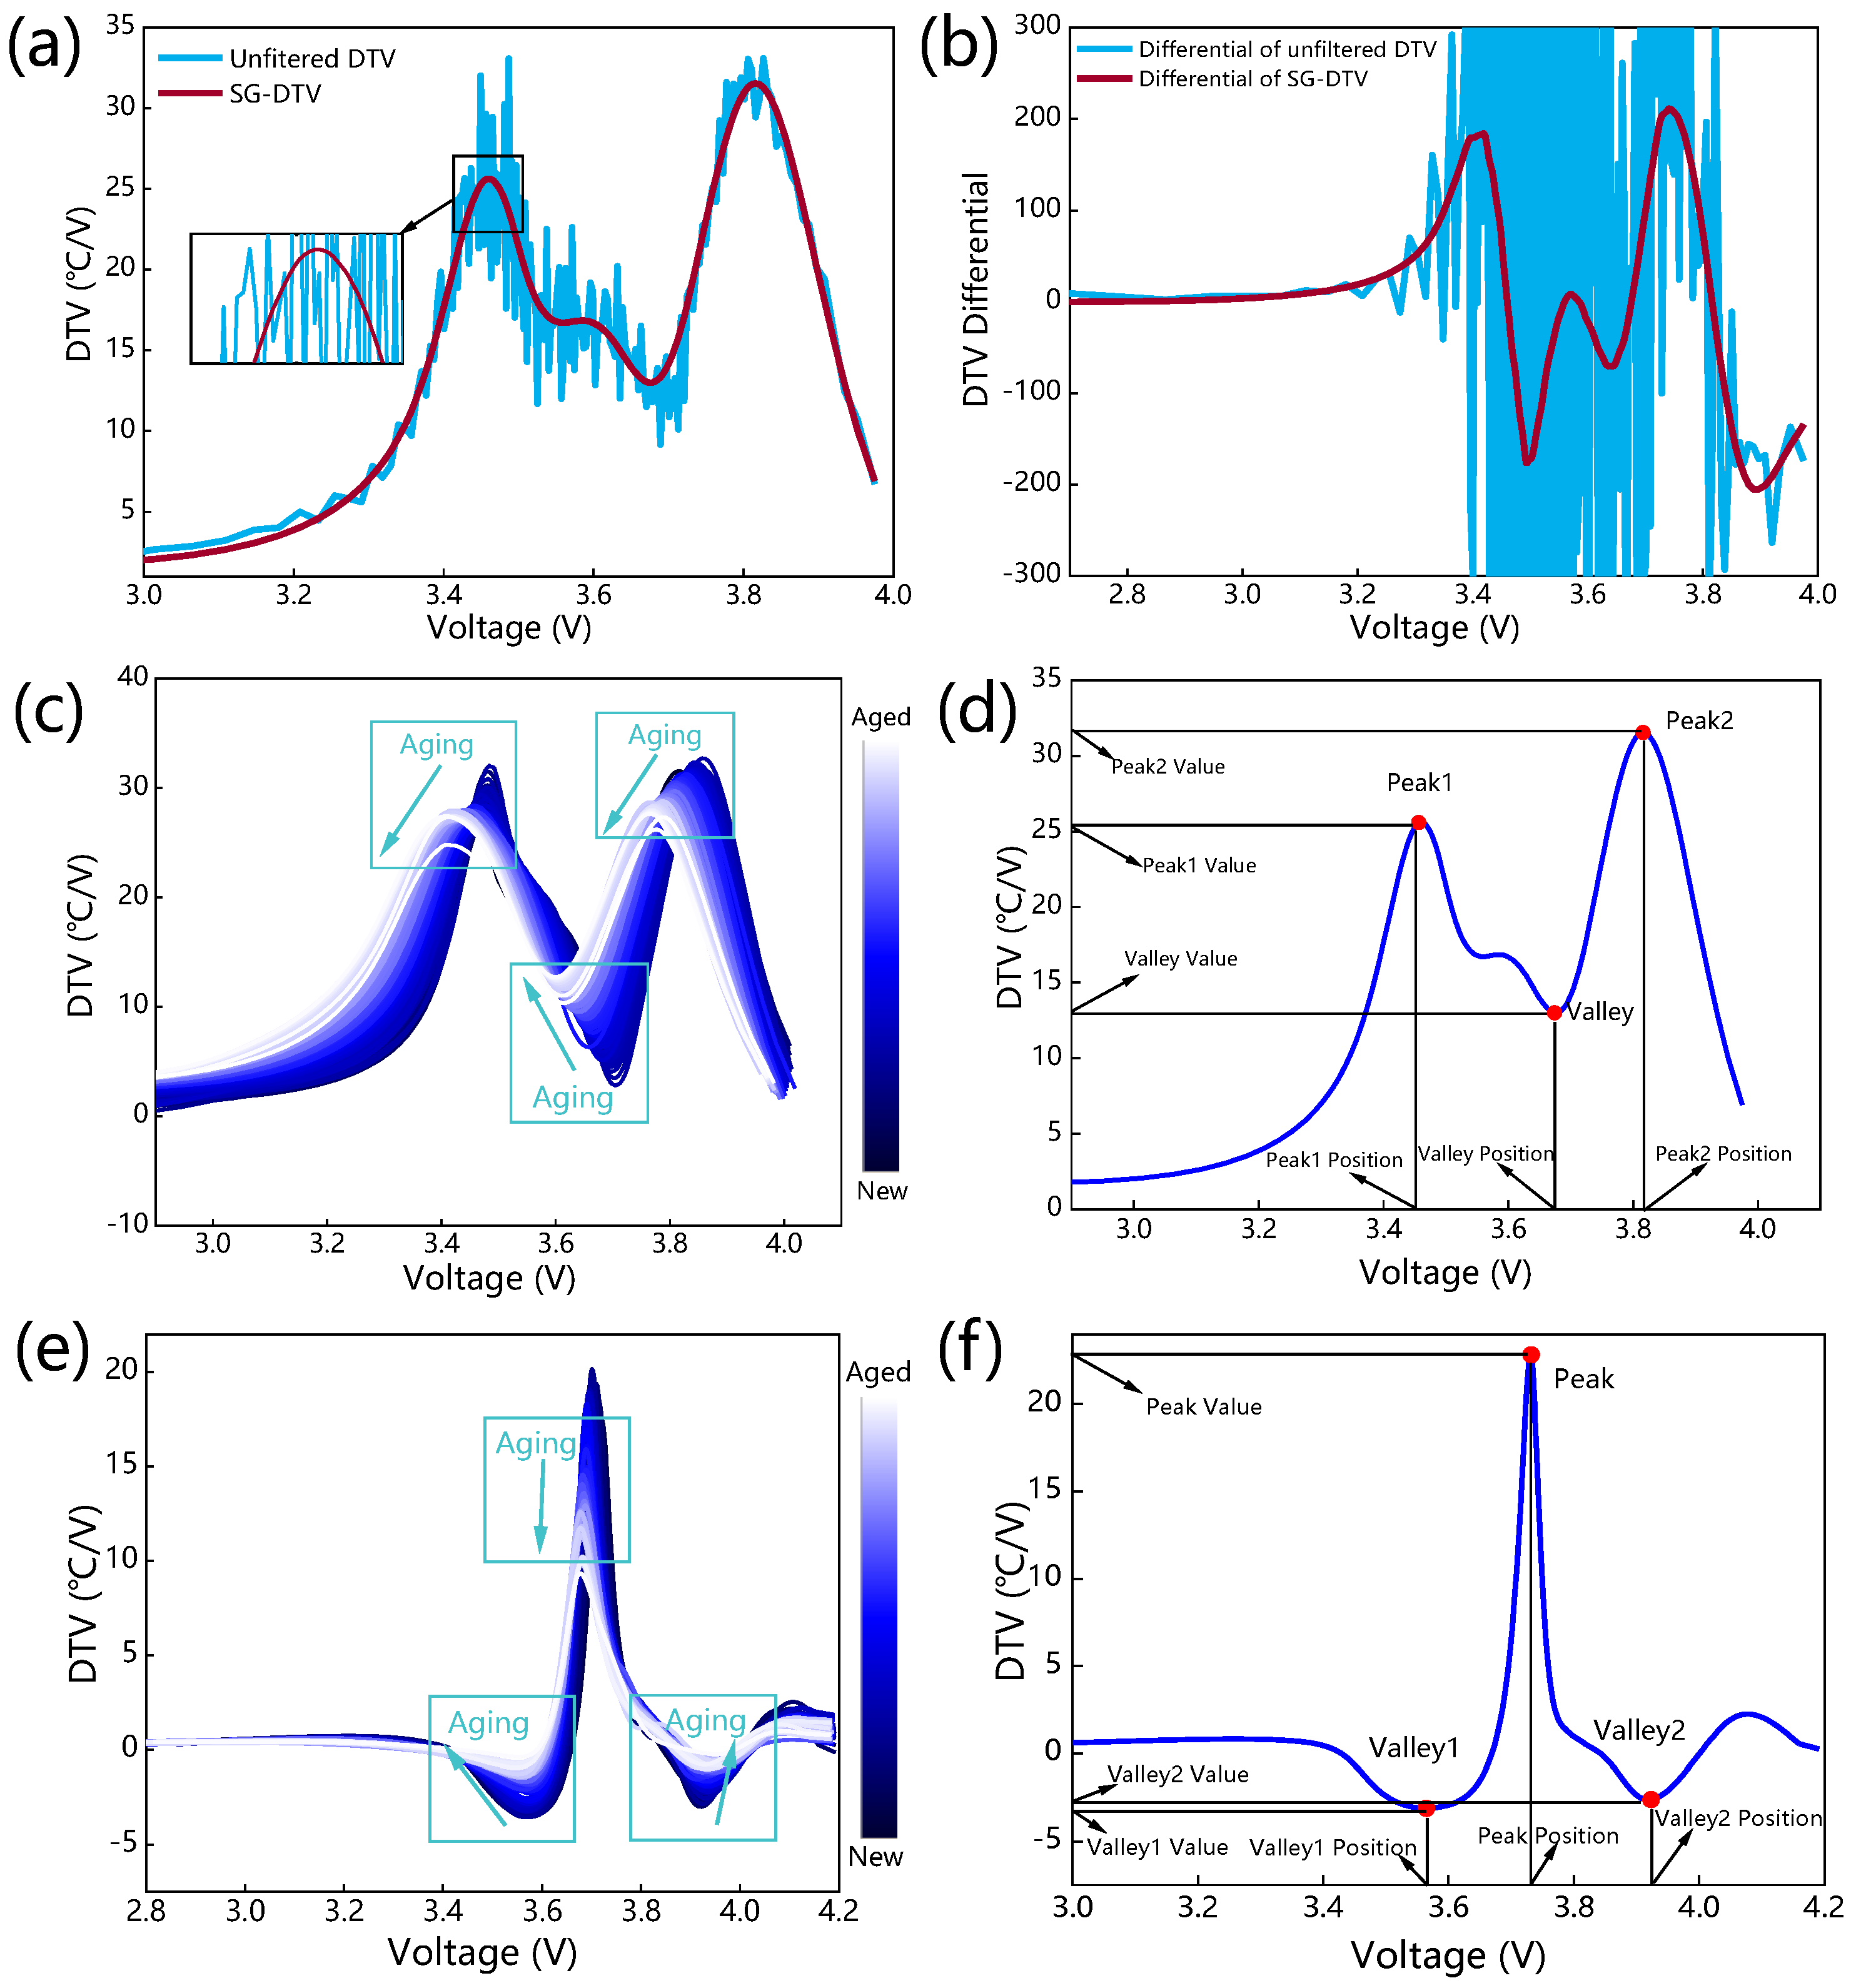
2.2.1. DTV Analysis

Studies have demonstrated a strong correlation between battery deterioration and microscopic entropy change [40,51], and the variation in temperature distribution can have a significant impact on the degradation of the battery over time [38]. The primary factors contributing to the decline of the maximum charge storage capacity of LIBs as a function of temperature within a specific operating range have been identified as the formation and alteration of surface films on the electrodes, as well as structural and phase transformations of the electrode material [52]. As battery degradation progresses, the positive and negative electrodes may exist in various phase combinations. These phase transitions can lead to changes in the system’s entropy, which can be identified by observing inflection points on the DTV curve. The DTV curve’s peak position can indicate the peak potential during charge/discharge stages, shifts in peak position can indicate changes in impedance and stoichiometry, peak height can indicate the maximum heating rate, peak width can indicate the potential window of the phase combinations in the electrodes, and peak area can provide information on the heat generated during charge/discharge stages. The DTV can be calculated as:
DTV = d T / d t d V / d t = d T d V
where V represents the terminal voltage, T is the temperature, and t is the sampling time. The utilization of the DTV method allows for the identification of the degree and type of phase change within the electrode material through the analysis of changes in temperature and voltage. This information is crucial for understanding the entropy change in the system, which dictates the degradation stage of the battery.
However, in practical applications, the temperature and voltage data are vulnerable to external factors such as operating conditions, making the differential signals noise-sensitive. Therefore, filtering methods are necessary to obtain clear DTV signals for degradation feature analysis. In this paper, the Savitzky Golay (SG) filtering method is operated to filter the DTV curves to maintain the shape of the curve while removing the noise. The SG filtering method is expressed as follows:
y i = j = M j = M 1 N C j x i + j
where x i represents the original input signals, y i is the output signals after the filter, C j is the coefficient in SG filtering, and N is the number of convolution integers. The value of N is equal to the size of the smoothing window, which is equal to 2M + 1.
Figure 2a illustrates the comparison results of DTV curves before and after filtering. The filtering results reveal the effectiveness of the SG filtering method. Specifically, it effectively smooths the curves while retaining the shapes of features. The results of DTV differential curves before and after filtering are shown in Figure 2b. Clearly, the DTV differential curve is still smooth after filtering, further demonstrating the applicability of SG filtering to DTV analysis.
The DTV curves change continuously during degradation, and features can be obtained. Figure 2c shows the evolution of DTV curves over the battery B5 cycles in the NASA dataset. Throughout the degradation stages of the battery, the DTV curves exhibit two peaks and one trough. In addition, the change in peaks and valleys shows a distinct directionality. The peak values fall gradually while the peak positions shift progressively to the left. Simultaneously, the value of the valley grows, and its position shifts to the left. The curve shape changes correspond to the actual battery degradation process. As illustrated in Figure 2d, the peaks and the valley are selected as alternative DTV analysis features. The left peak value and position are denoted as FV1 and FV2, the valley value and position as FV3 and FV4, and the right peak value and position as FV5 and FV6, respectively. Figure 2e shows the evolution of the DTV curves of cell 1 of the Oxford dataset. The DTV curves of the Oxford dataset distinctly exhibit one peak and two valleys throughout the degradation stages of the battery, which is different from battery B5. With the deepening of battery degradation, the valley values increase, and the valley positions gradually move to both ends. Meanwhile, the peak values decrease while the positions gradually shift to the left. Therefore, as shown in Figure 2f, the peak and valleys of the DTV curve of the Oxford dataset are taken as the alternative features. It is noteworthy that the DTV curve shape of the Oxford dataset differs from that of the NASA dataset due to the substantial difference in experimental conditions. For the Oxford dataset, FV1 and FV2 represent the left valley value and location, FV3 and FV4 represent the peak value and position, and FV5 and FV6 represent the right valley value and position.

2.2.2. SVD Analysis

As a fundamental matrix decomposition technique, the SVD method condenses the information in complex matrices by using simpler matrices, achieving data compression while preserving the information’s characteristics. The SVD approach is applicable in several situations, including data downscaling and feature extraction, due to its practical data compression impact. External measurement data can characterize the degree of battery degradation. Large data quantities and minor changes in measurement data might hinder the performance of the deep learning model. Consequently, the SVD approach is applied to the numerical processing of the external measurement data of the battery in order to compress data while reinforcing the degradation features. Suppose that matrix A is an m × m matrix of any size, and AAT and ATA are symmetric matrices of size m × m and n × n, respectively. If AAT = PΛ1PT and ATA = QΛ2QT, the SVD of matrix A can be described as follows:
A = P Σ Q T
where P and QT are square matrices of size m × m and n × n, respectively, Σ is the diagonal matrix of size m × n, which means that all matrix elements are 0 except those on the main diagonal. The elements on the main diagonal of the Σ matrix are called singular values. Thus, the SVD compresses matrix A of size m × n into singular values, which can be utilized as degradation features.
In this study, SVD was applied to both voltage and temperature data for each discharge cycle, resulting in the extraction of two singular values for each cycle as feature vectors, thus compressing the voltage and temperature data. This method of applying SVD to the voltage and temperature data can compress the amount of data being measured and reduce the input burden on the model. By extracting the singular values as feature vectors, labeled FV7 and FV8, it reduces the dimensionality of data and eliminates less important or redundant information, making it more efficient for the model to process.

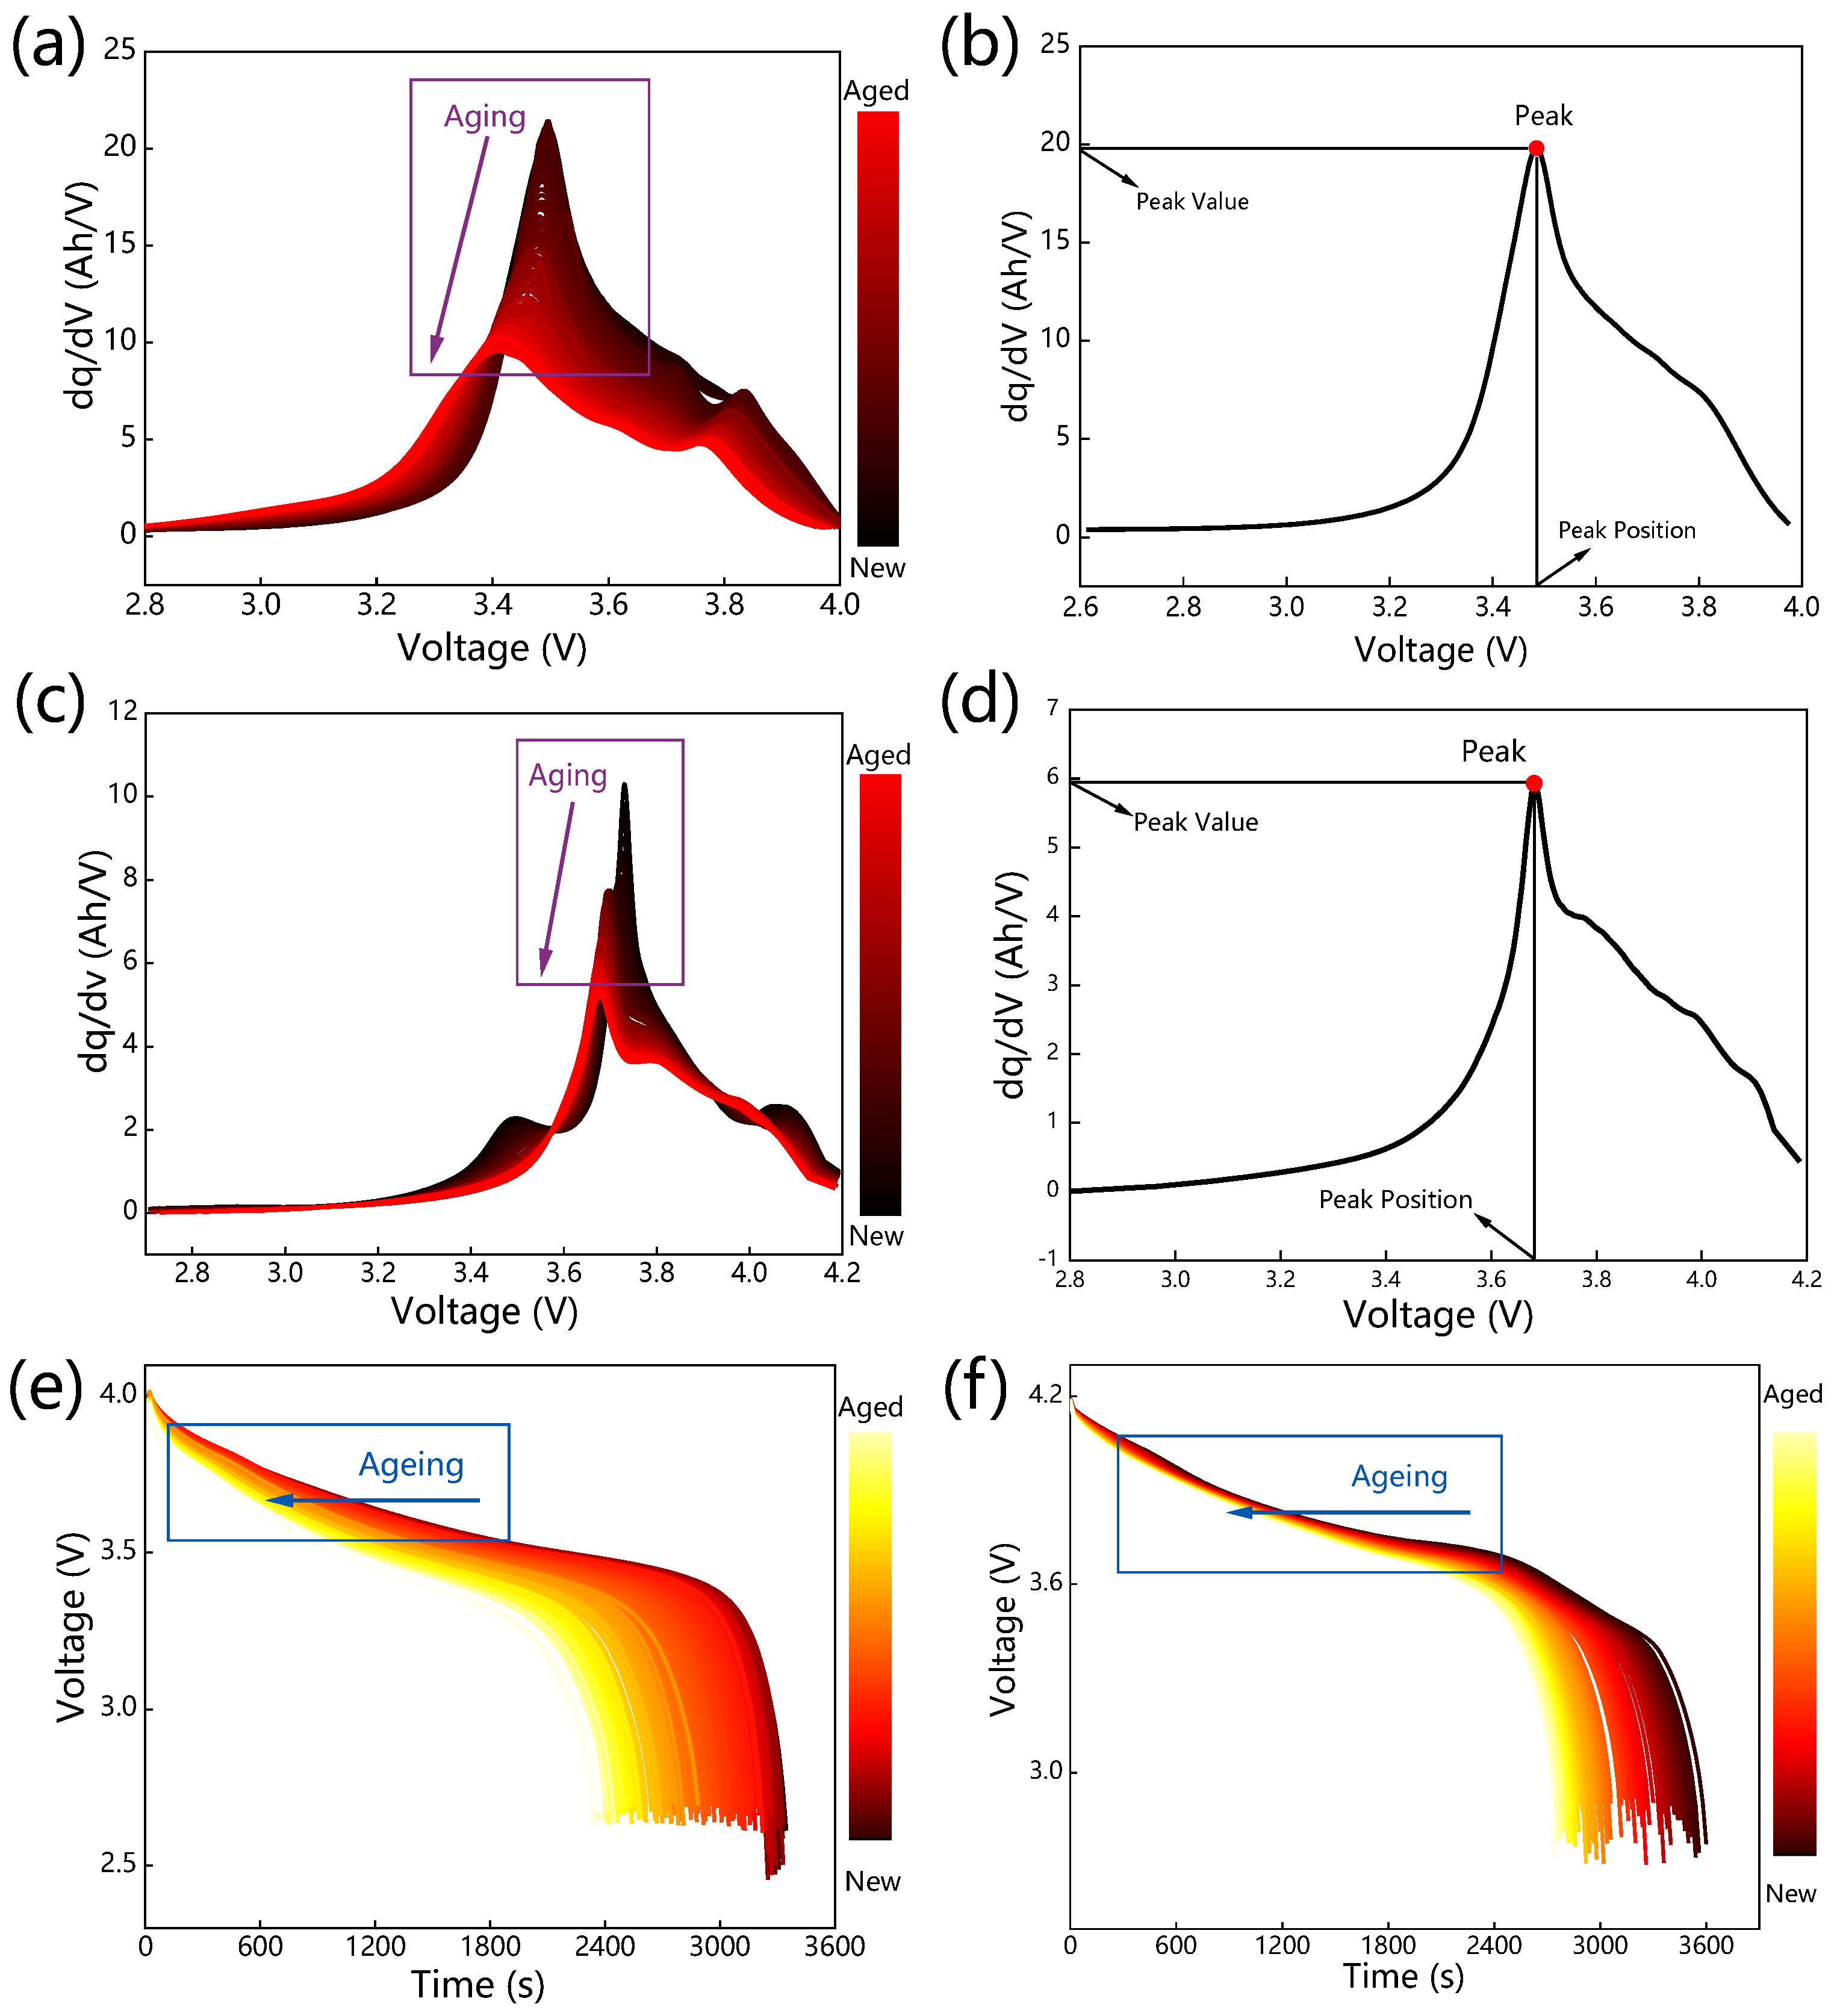
2.2.3. IC and TVC Analyses

As a commonly used feature analysis method to describe the battery degradation process, the IC curve can characterize the battery deterioration from the electrode level and has a high resolution for the battery charge and discharge platform area. The IC curve is defined as the incremental battery capacity of successive voltage increments, and its mathematical representation is as follows:
d Q d V = I × d t d V = I × d t d V
where Q , I , V , t are the discharge capacity, current, voltage, and time, respectively.
In actual applications, the measured values of current and voltage are accompanied by noises, which can generate undesirable variations in the IC curve and therefore impact the extraction of features. This paper applies the SG filtering method to filter the IC curve. The IC curves change continuously during the battery degradation process, and the degradation features can be obtained. Figure 3a illustrates the evolution of IC curves during the cycles of battery B5 in the NASA dataset. In addition, it has been discovered that a complete IC curve has a significant peak throughout the degradation process and that as the battery degrades, the peak value of the IC curve is constantly falling and shifting to the left. These phenomena indicate that the peak of the IC curve can be used as a feature to characterize battery degradation. Figure 3b shows the features within the IC curve of the battery in the NASA dataset. The peak value and position are extracted as alternative features for SOH estimation. The evolution of IC curves during the aging cycles of battery cell 1 in the Oxford dataset is illustrated in Figure 3c. The IC curves of the Oxford and NASA datasets contain a single peak, and their shapes, including the peak’s trend, are comparable. Figure 3d shows the IC feature variables of the battery. Similarly, the feature variables are identical to those in the NASA dataset. In this research, the peak value and position of the IC curves based on NASA and Oxford datasets are denoted as FV9 and FV10, respectively.
In addition to the three feature analysis approaches described above, this work presents a straightforward way for obtaining battery degradation features through TVC analysis. The discharge time in the same operating terminal voltage range falls continually during the CC situation, which can be used to characterize the battery deterioration as the battery degrades. The expression of TVC is shown as follows:
TVC V l o w , V h i g h = t l o w t h i g h
where V l o w is the lower cut-off voltage value and V h i g h the higher cut-off voltage value during the CC condition. t l o w and t h i g h are the end and start times of the discharge process between V l o w and V h i g h , respectively.
As shown in Figure 3e,f, the voltage curve shifts to the left during the degradation process, and the degradation features can be obtained. Figure 3e shows the evolution of the voltage-time curve throughout the degradation stages of the battery B5 in the NASA dataset. Changes in voltage during the early discharge process are relatively gradual. As the depth of discharge increases, the discharge curve reaches an inflection point, after which the battery enters a highly nonlinear zone. In this paper, the feature is utilized as an alternative feature, marked as FV11, based on both NASA and Oxford datasets. Figure 3f shows the evolution of the voltage-time curves of the whole discharge process during the degradation process of the cell 1 battery in the Oxford dataset. Different material types and loading conditions can have an impact on the behavior of the batteries over time. Due to the significant differences in the battery material types and operating conditions between the NASA dataset and the Oxford dataset, the voltage range selected for TVC features differs between the two datasets. The voltage range used for the NASA dataset is (3.5, 3.9), while for the Oxford dataset, it is (3.7, 4.1). Selecting a voltage range within which the battery voltage changes are relatively stable and smooth rather than experiencing rapid drops can facilitate better feature analysis and characterization of battery aging. This can lead to a more accurate and reliable assessment of the battery’s performance and degradation over time.

3. Methodology

In this section, the framework and process of the proposed deep learning model for SOH estimation are described in detail, including the feature selection and model construction.

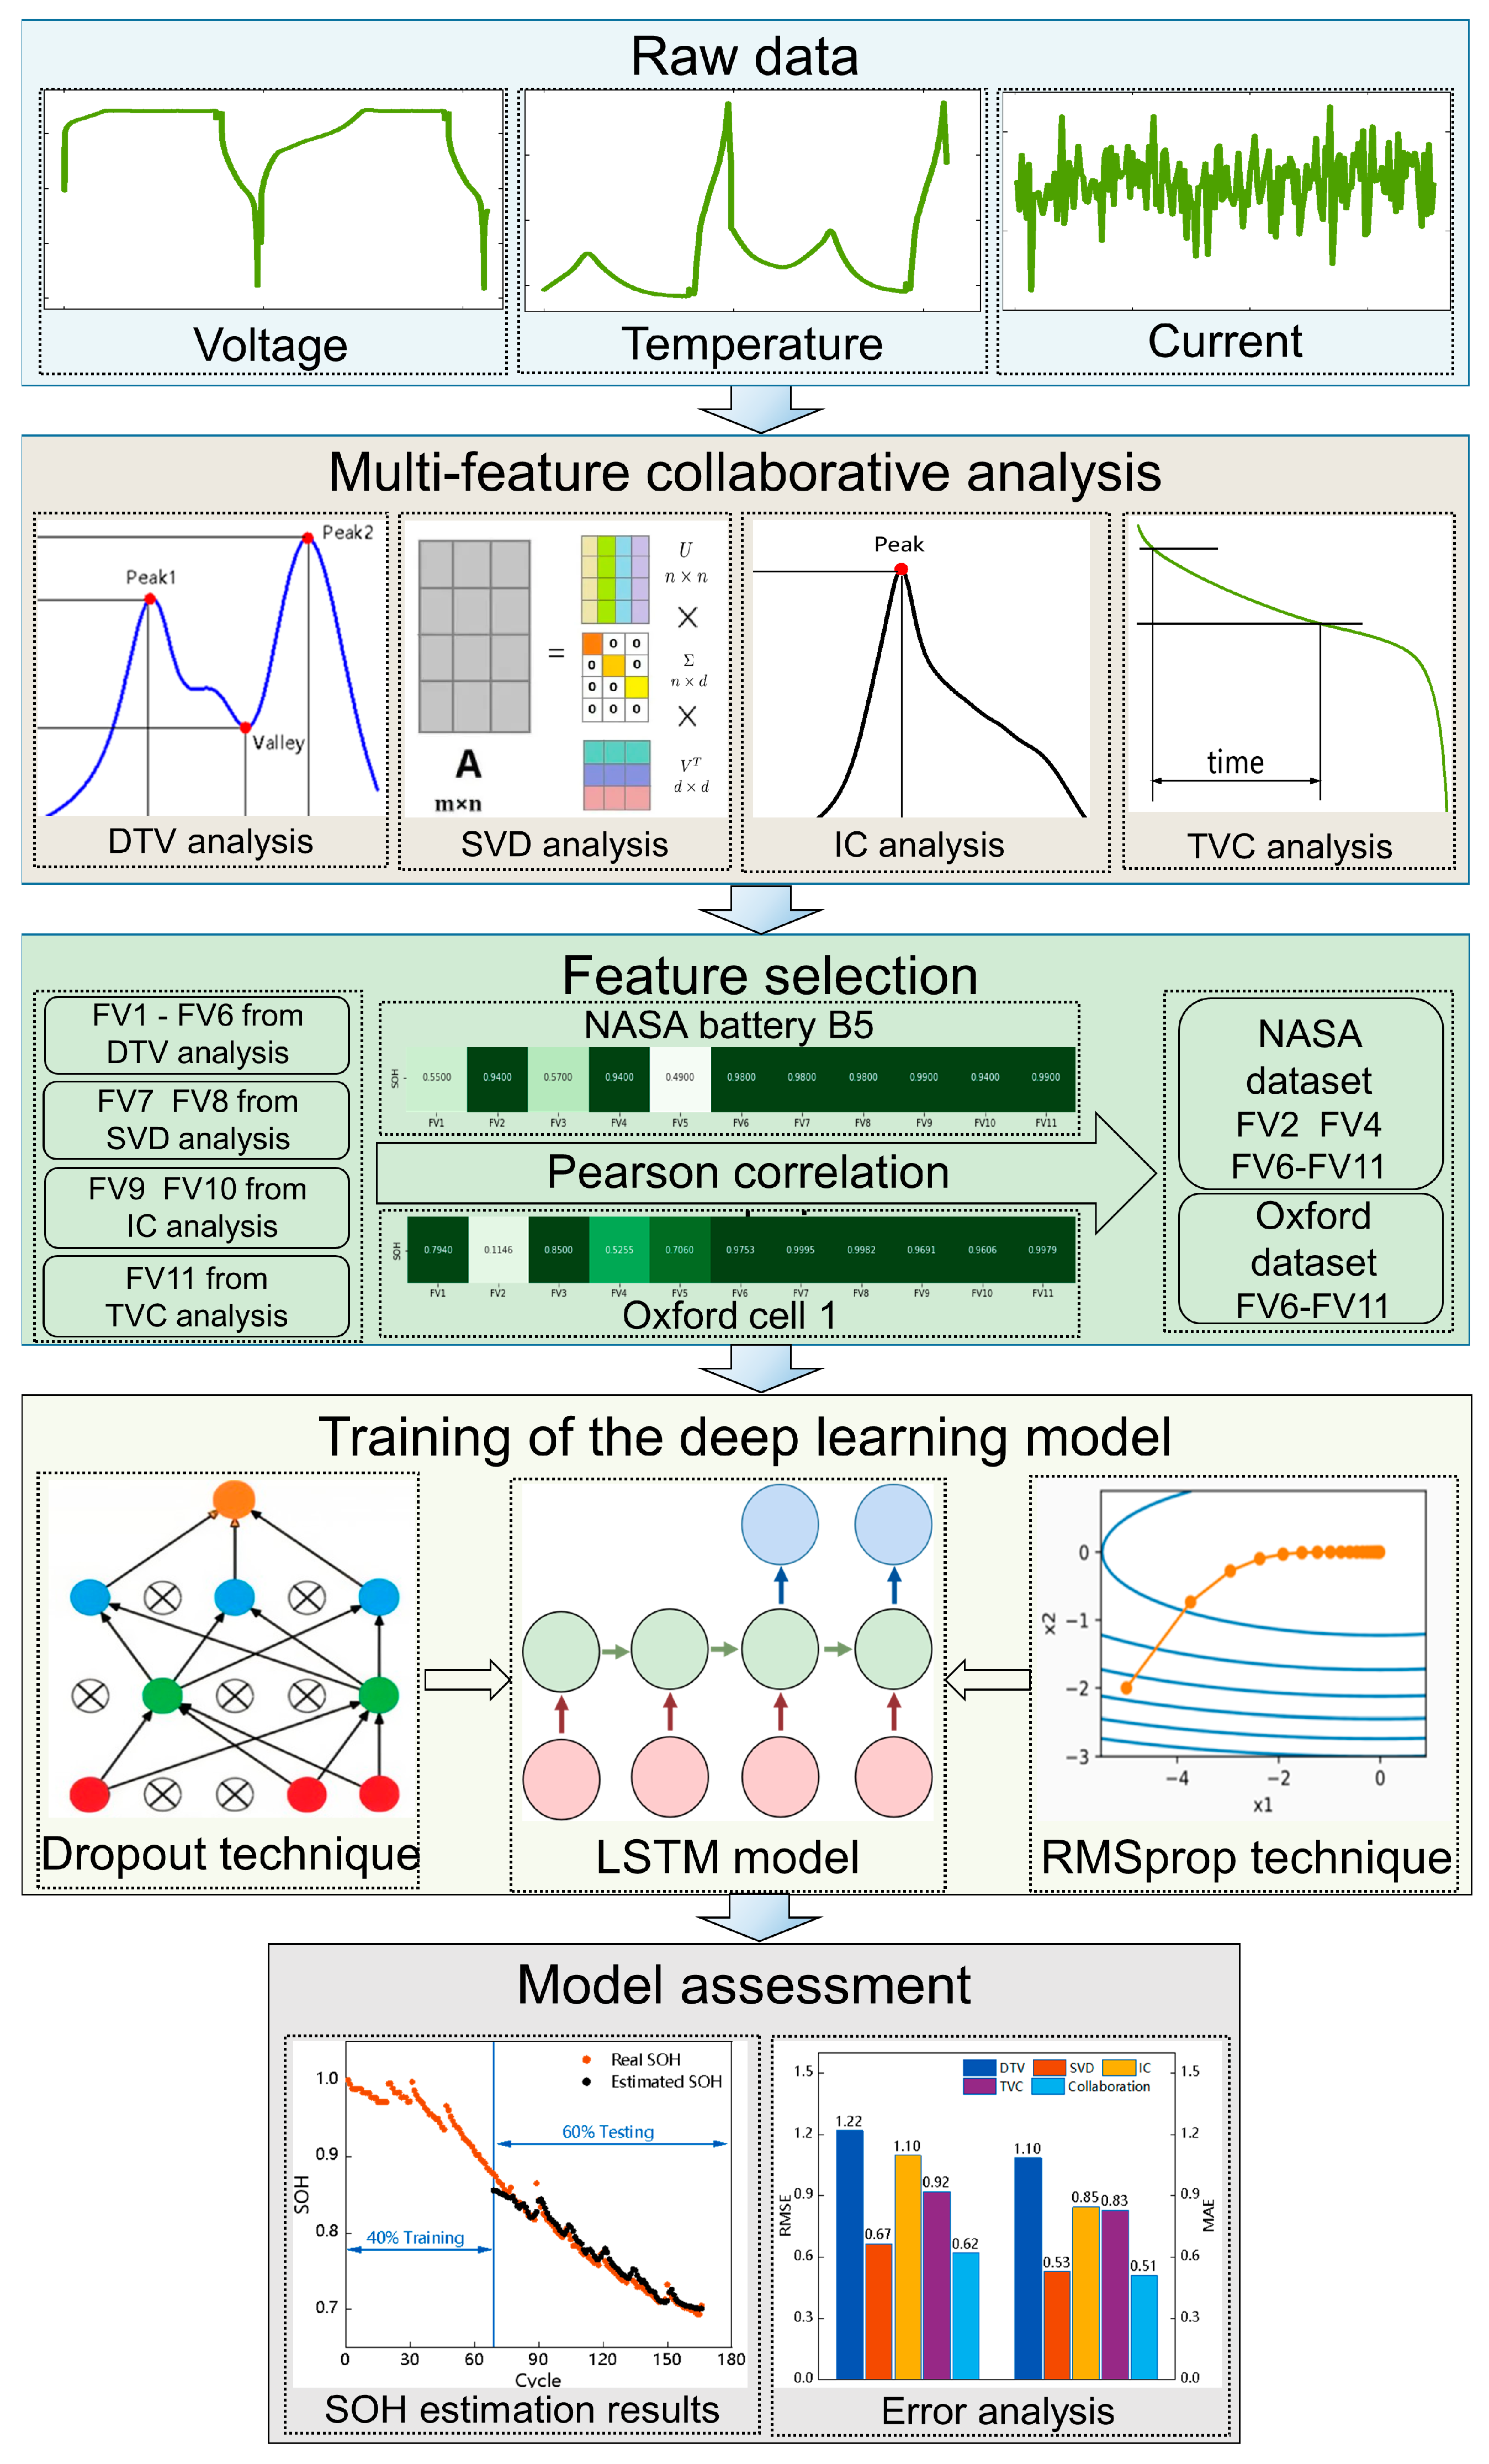
3.1. Framework of Multi-Feature SOH Prediction

Figure 4 illustrates the proposed framework for battery SOH estimation based on multi-feature collaborative analysis and deep learning methods. The framework consists of five components: raw data acquisition, multi-feature analysis, feature selection, deep learning model construction, and assessment of the proposed model. In the first and second parts of the framework, data acquisition and degradation feature analysis are carried out, and four sets of alternative features are extracted using DTV, SVD, IC, and TVC, respectively. The procedure is discussed detailed in Section 2. In the third component of the framework, Pearson correlation analysis is used to pick alternative features with high correlation as the final features, which are the inputs of the LSTM NN model. The LSTM NN is constructed and trained in the fourth part, with the dropout technique applied to restrain overfitting and the RMSprop algorithm from achieving rapid convergence. In the fifth part, the predicted SOH is compared to the actual SOH. Root mean square error (RMSE) and mean absolute error (MAE) analyses are performed to evaluate the model performances.

3.2. Feature Selection

Based on the multi-feature collaborative analysis in the previous section, eleven alternative features are obtained based on both the NASA and Oxford datasets. In order to further screen out high-quality features as the inputs of the LSTM model, the correlation between the alternative features and SOH is calculated using Pearson correlation analysis. The calculation can be described as follows:
ρ x y = i = 1 p x i x ¯ y i y ¯ i = 1 p x i x ¯ 2 i = 1 p y i y ¯ 2
where x i and x ¯ represent the feature value and the mean value of the feature variable, respectively. y i and y ¯ represent the SOH value and the mean SOH value, respectively. P represents the number of samples. ρ x y is the correlation coefficient between the specific feature and SOH. The value of ρ x y is between −1 and 1. In this study, a feature selection technique was implemented on the training set in order to identify features that exhibited a strong correlation with the SOH of the battery. Subsequently, the selected features were employed for predicting the SOH of the test set. The correlation coefficient is utilized as a metric to evaluate the strength of the association between the features and the SOH. A high correlation coefficient, approaching 1, implies a strong correlation. The correlation values for the NASA dataset are shown in Table 3, while the correlation values for the Oxford dataset are shown in Table 4. As a result, the features FV2, FV4, and FV6 to 11 are selected as the input features for the NASA dataset, while FV6 to 11 are chosen for the Oxford dataset.

3.3. Model Structure

In this paper, the LSTM NN model is trained as the core of the deep learning model for battery degradation prediction. As a variant of recurrent neural network (RNN), the LSTM NN could effectively mitigate the problems of gradient disappearance and gradient explosion of simple RNN and capture the long-term dependence between inputs and outputs. The LSTM unit accepts the inputs and unrolls them in time, learning from each time step of the input sequence. Each LSTM unit controls the input, forgetting, and output of information via its input gate, forgetting gate, and output gate, respectively. The forward propagation process of each LSTM unit at time step t is as follows:
f t = σ W f x t , h t 1 + b f
i t = σ W i x t , h t 1 + b i
o t = σ W o x t , h t 1 + b o
C t ˜ = tan h ( W c x t , h t 1 + b c )
C t = f t × C t 1 + i t × C t ˜
h t = o t × tan h ( C t )
where i t , f t , o t are respectively the output of the input gate, forgetting gate, and output gate. σ and t a n h are the sigmoid and hyperbolic tangent activation functions; W and b are the weight matrix and bias vector, respectively, which are continuously learned and updated during training. x t is the input to the LSTM unit in the current time step. In addition, h t and h t 1 are the hidden output of the neuron at the current time step and the previous time step, respectively. C t 1 is the memory of the neuron at the previous moment, C t ˜ is the newly generated memory of the neuron, and C t is the current memory state of the neuron.
Compared to simple RNNs, which decay exponentially to the past inputs, the LSTM controls the neuron memory through the forgetting gate and input gate. The continuous updating of the internal parameters of the forgetting gate and input gate enables dynamic selection to recall correct information and forget redundant information, hence facilitating a more accurate correlation between input features and battery SOH. Since battery degradation is a long-term process, it is inevitable that duplicate information will emerge. Through the above structure, the LSTM NN improves the prediction performance of the deep learning model by forgetting redundant information and screening out the appropriate information. Consequently, the LSTM NN can successfully prevent gradient disappearance and gradient explosion, reflecting the long-term relationship between the input features and battery degradation.
Overfitting has been one of the primary issues with the deep learning approach. In this paper, the dropout technique is used to reduce overfitting and enhance model performance by randomly resting neurons. Specifically, during the forward propagation of the NN, each neuron is allowed to rest with a specific probability p. Through this process, a randomly smaller NN is generated from the original NN structure, reducing the model’s complexity while severing the connection between some neurons. While addressing the issue of overfitting, the dropout strategy might lower the number of learned parameters and increase convergence speed. Moreover, the optimization method of the NN is critical, as it dictates how the NN executes the learning process, hence influencing convergence speed, characteristics, and model performance. It has been demonstrated that the RMSprop approach is effective for RNNs [53]. The RMSprop method offers a quicker convergence rate than other optimization techniques and is appropriate for RNNs. In this research, the RMSprop approach is employed as an optimizer for the LSTM model.

4. Results and Discussion

In this section, the SOH prediction results are described, and the accuracy and generality of the proposed model are validated based on both NASA and Oxford datasets.

4.1. Evaluation Index

In order to quantitatively evaluate the prediction results, RMSE and MAE are utilized to describe the error between the real SOH and the predicted SOH. The expression of RMSE is given by Equation (13), and the expression of MAE is given by Equation (14):
RMSE = 1 N i = 1 N ( Q ^ i Q i ) 2
MAE = 1 N i = 1 N Q ^ i Q i
where Q ^ i represents the predicted value, Q i represents the true value, and N represents the number of cycles.
In this paper, the battery SOH can be calculated from the remaining capacity of the battery, and the expression is as follows:
SOH = Q current / Q initial
where Q current represents the current capacity of the battery and Q initial represents the initial capacity. The SOH of a new battery is 1, and the SOH value gradually decreases as the battery ages.

4.2. Results Based on the NASA Dataset

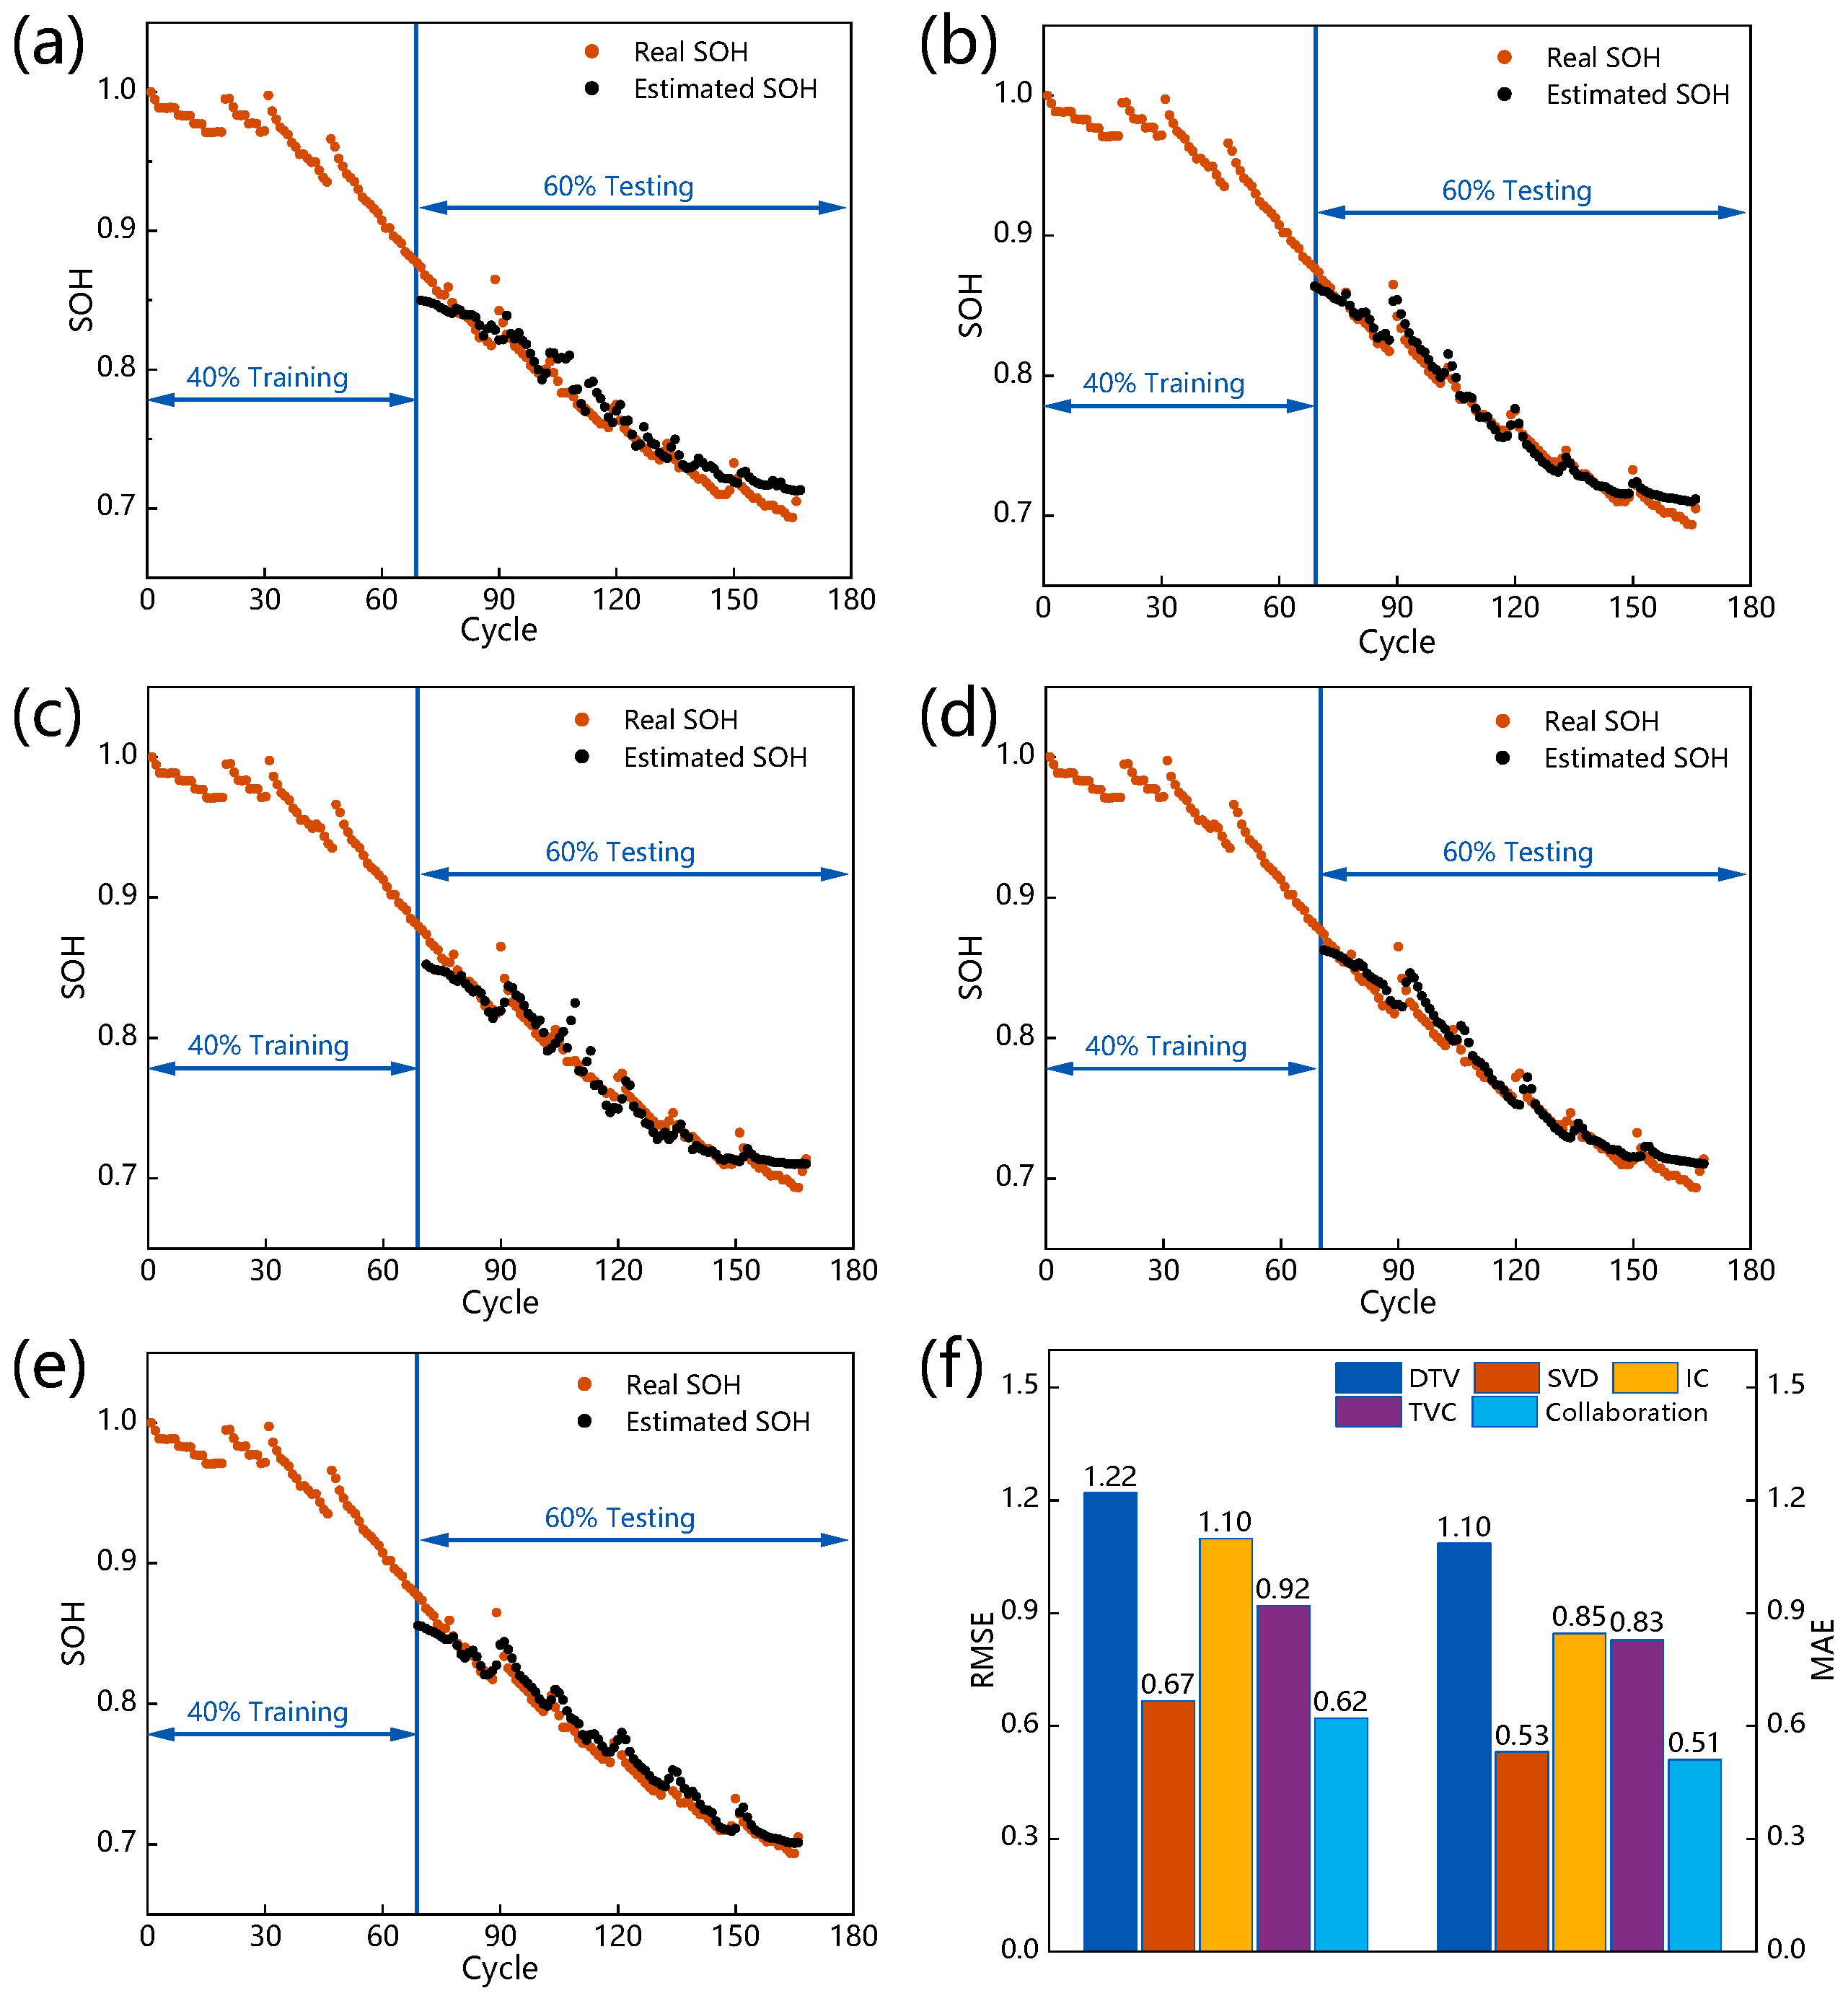
4.2.1. Results with Different Features

In this subsection, the comparison between single-feature and multi-feature analysis is conducted based on the battery B5 of the NASA dataset. The first 40% of data are used as the training set to derive the parameters of the LSTM NN model, while the remaining 60% is used as the testing set to evaluate the performance of the model. From the original battery data, each feature analysis method obtains a feature set, and the collaboration features are the fusion of all feature sets. Figure 5 shows the results of the SOH prediction based on different feature sets and feature collaboration. Figure 5a–e shows the detailed results with two colored lines for each subplot. The orange line indicates the actual SOH, whereas the black line indicates the expected SOH. Figure 5f is a bar chart displaying the RMSE and MAE for each case.
As shown in Figure 5f, each case achieves good prediction results. The highest error results are the RMSE of 1.22% and MAE of 1.10%. As illustrated in Figure 5a–e, the model accurately predicts the degradation trend of the battery SOH. The capacity rebound phenomenon is accurately captured based on the NASA dataset, reflecting the superiority of the selected features. In addition, models based on the DTV and IC analysis obtain the estimated results with RMSEs of 1.22% and 1.10%, respectively. Compared with models based on other feature analysis methods, their error values are the highest. The differential operation of DTV and IC analysis notably amplifies the noise of the measurement data, resulting in a loss of accuracy. Although the SG filtering method is applied to remove the noise and achieve curve smoothing, the influence of noise cannot be ignored entirely. In contrast, the SVD method achieves the best prediction results among the single-feature analysis with an RMSE of 0.67%, indicating that the compressed data using the SVD method still characterizes the battery degradation well. The feature set of TVC analysis achieves an RMSE of 0.92%, revealing that with the deepening of battery degradation, the change in battery discharge voltage-time curves can characterize battery degradation well through the simple feature obtained by TVC analysis. Noting that the model with the multi-feature collaborative analysis achieves the best prediction results, reaching an RMSE of 0.62% and an MAE of 0.51%. The results demonstrate the predictive accuracy superiority of the suggested method. The collaborative features contain more information on the degradation of various variables, enabling the deep learning model to characterize the battery degradation better. In addition, the single-feature analysis could be sensitive to the data quality. Due to the comprehensive consideration of several different methods, the multi-feature collaborative analysis method could avoid the extreme situation that single-feature analysis could be disturbed by serious data quality, indicating that the proposed method has stronger robustness compared to the single-feature analysis method.

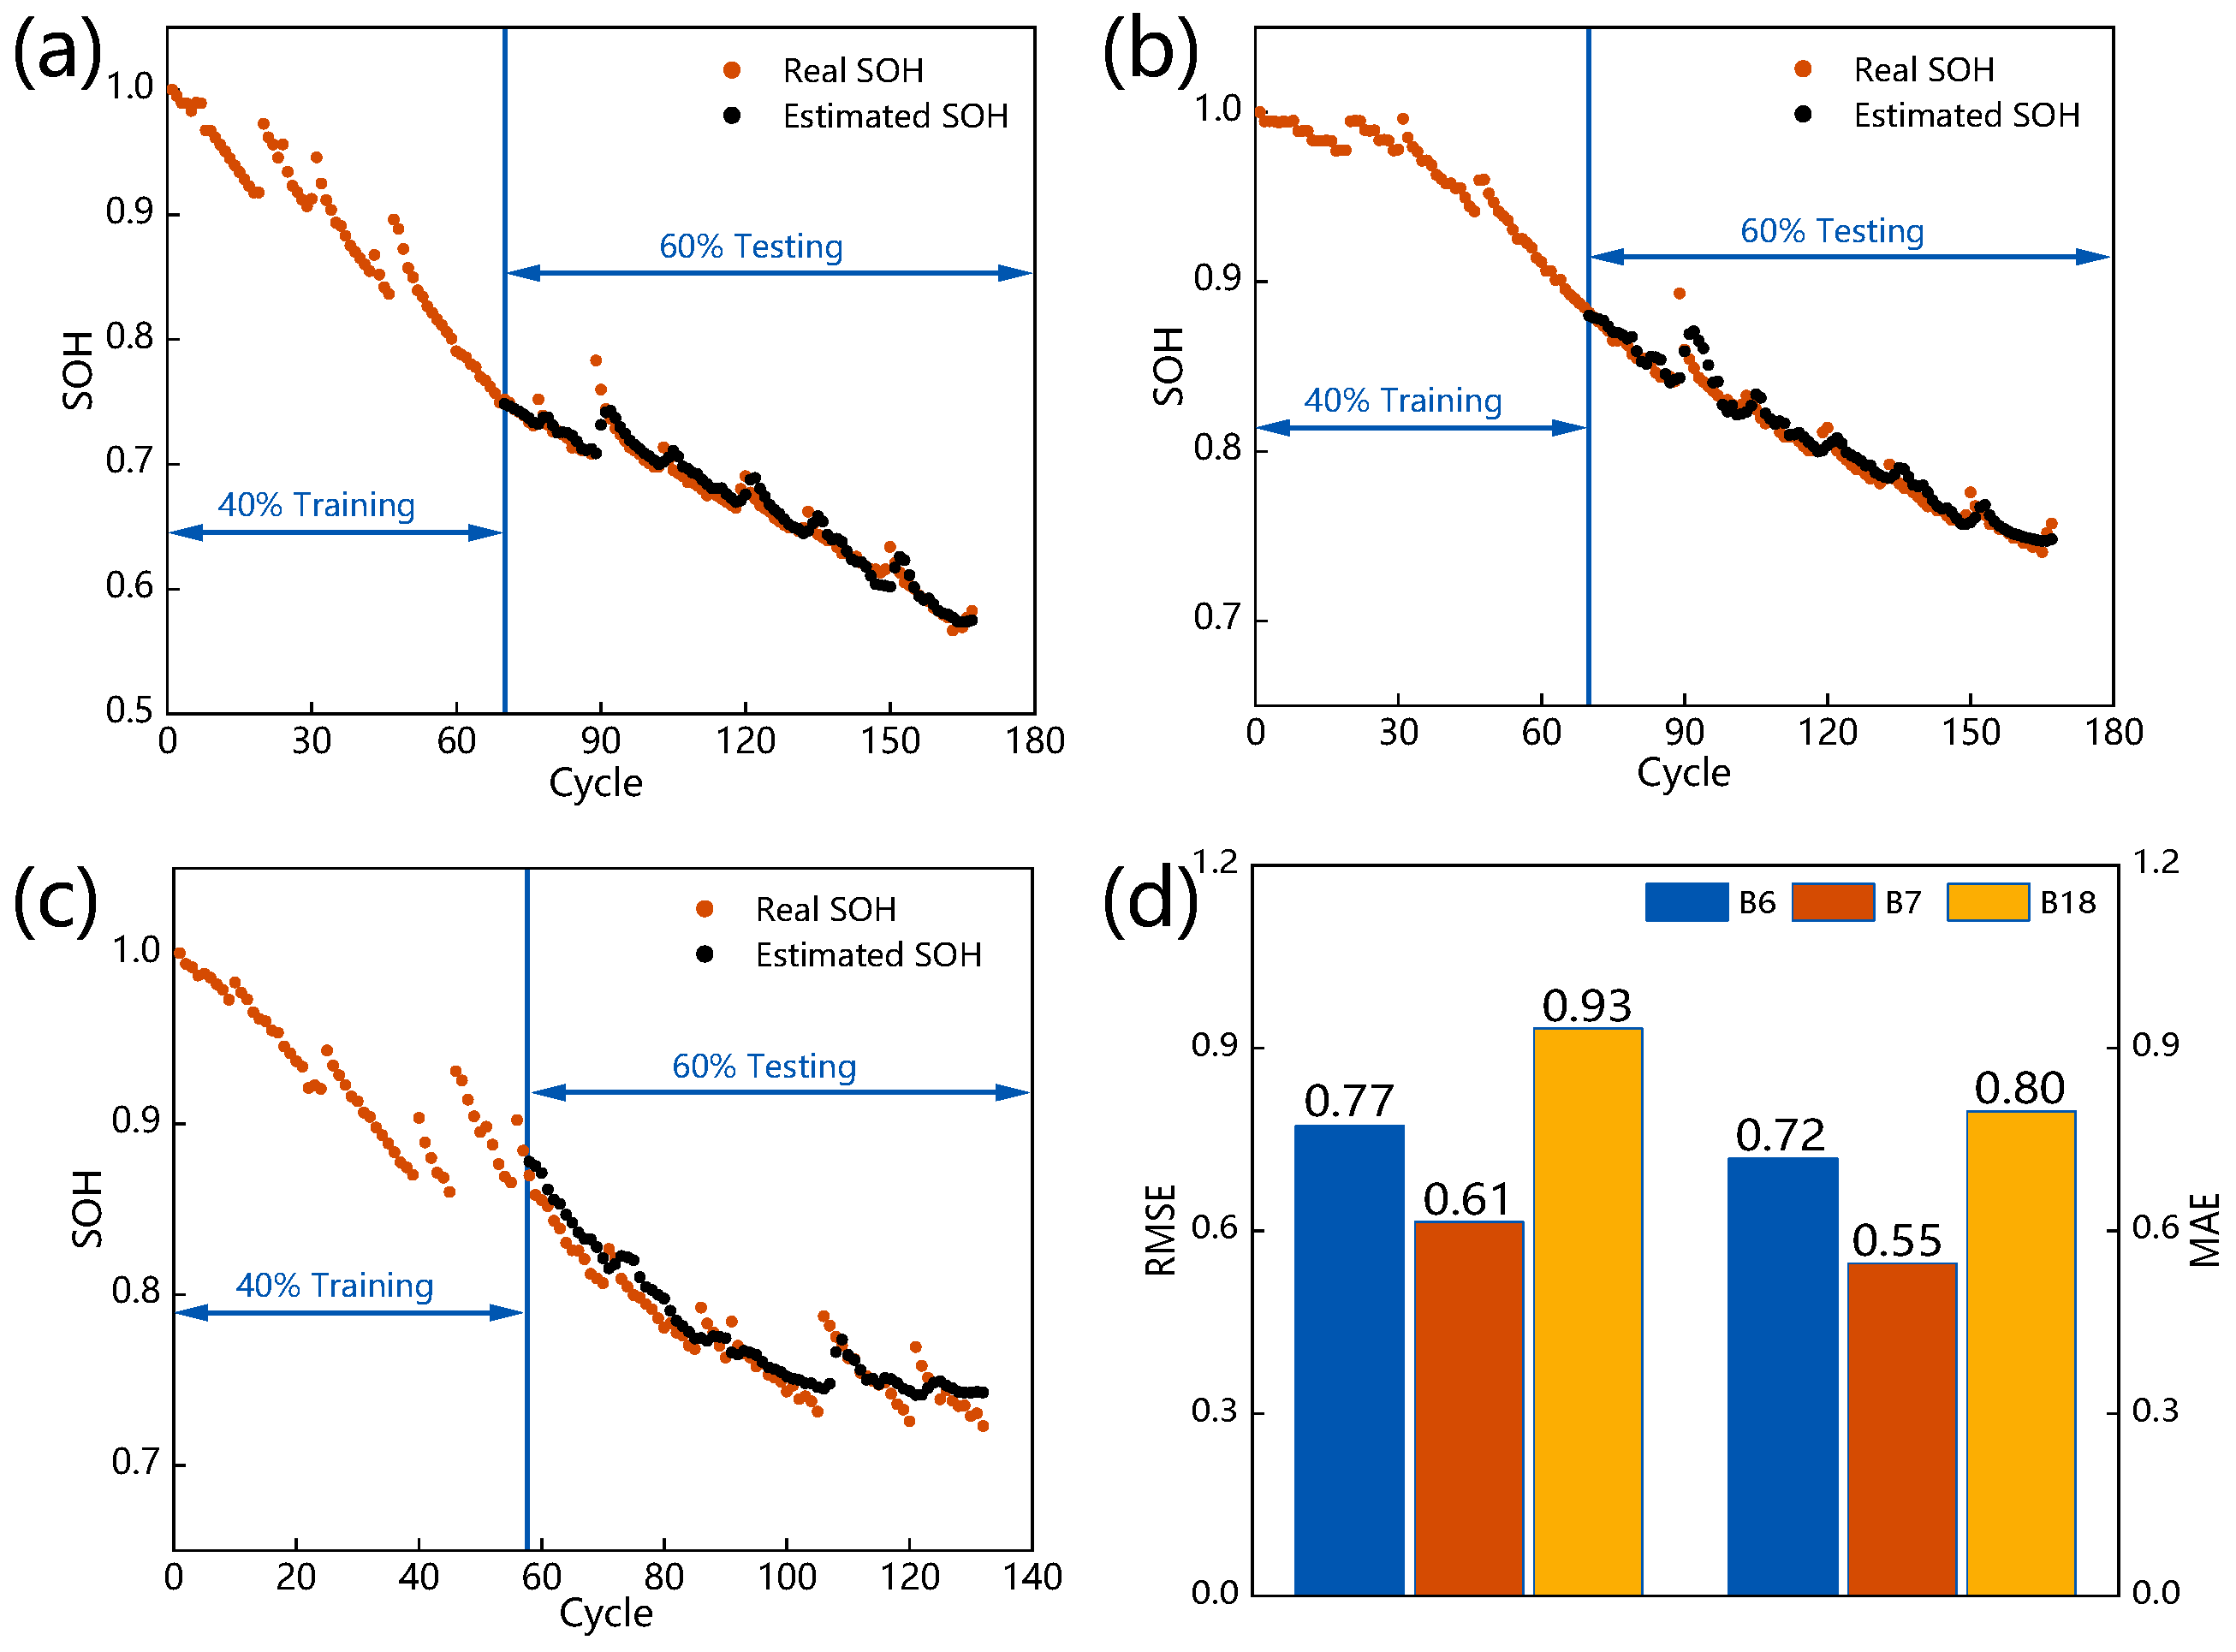
4.2.2. Results Based on Different Batteries

In this subsection, the generality of the model based on the multi-feature collaborative analysis method is validated based on the batteries B6, B7, and B18 of the NASA dataset. Figure 6 displays the results of the predicted SOH on different batteries. Figure 6a–c shows the detailed prediction results. Figure 6d describes the RMSE and MAE.
As shown in Figure 6d, the results based on different batteries reach a maximum RMSE of 0.93% and a maximum of 0.80%, which provides good overall prediction results and demonstrates the model’s dependability and generality. As shown in Figure 6a–c, the model based on the multi-feature collaborative analysis method achieves accurate SOH prediction in all cases, reflecting the superiority of the proposed method. The collaborative features contain more degradation information compared with a single feature. While the single feature is easily disturbed by the data quality and the measurement conditions of different experiments, the multi-feature collaborative method can nevertheless accurately predict the SOH of different batteries, reflecting the model’s generality. From the detailed prediction results, the model also accurately captures the battery capacity rebound phenomenon, reflecting the proposed method’s advantage. Specifically, the collaborative features can accurately analyze the various changing behaviors of the battery SOH and precisely construct the mapping relation between the features and SOH. The above results can demonstrate the generality of the multi-feature collaborative analysis method.

4.3. Results Based on the Oxford Dataset

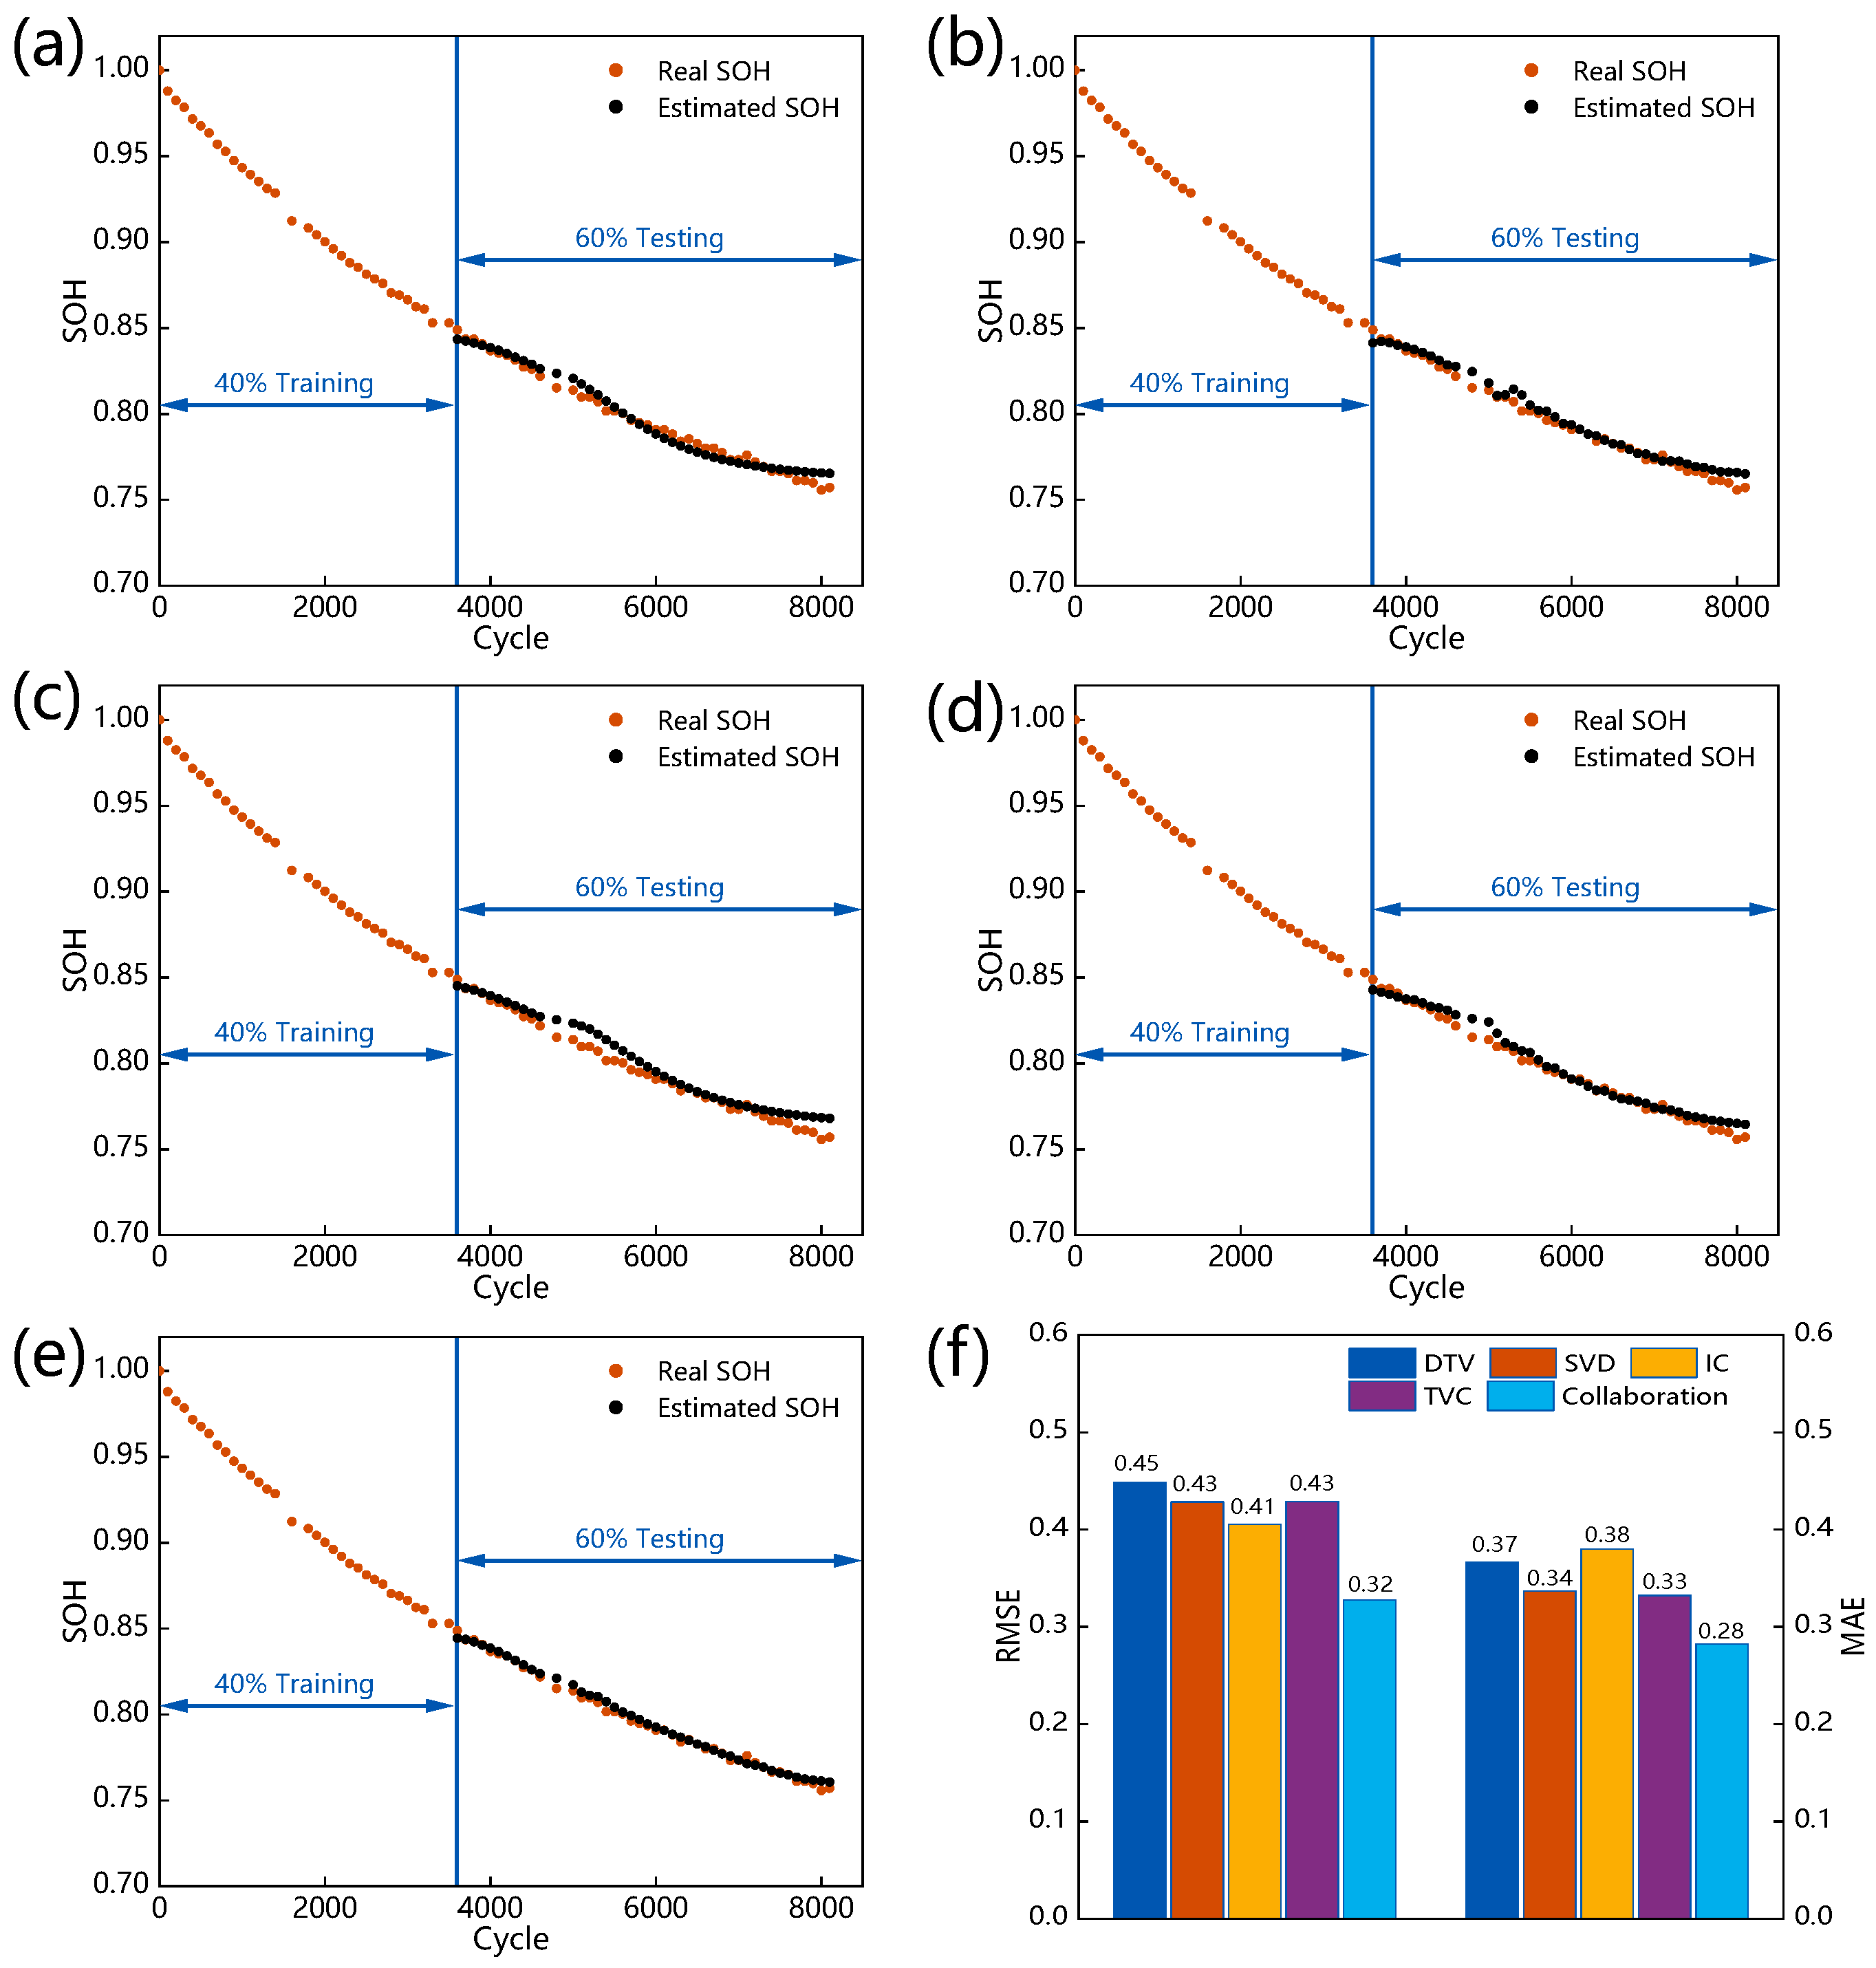
4.3.1. Results with Different Features

In this subsection, the comparison with the single-feature analysis and multi-feature analysis is performed based on the Oxford dataset cell 1. Figure 7a–e illustrates the detailed results of the model SOH prediction. Figure 7f shows the RMSE and MAE. As shown in Figure 7f, each case achieves accurate SOH prediction, getting a maximum RMSE of 0.45% and a maximum MAE of 0.39%. In addition, the prediction results on the Oxford dataset are significantly better than those on the NASA dataset. This phenomenon is because the Oxford dataset battery SOH is a smooth decline and does not exhibit a significant capacity rebound, making it easier to achieve SOH prediction on this dataset. The models based on each feature analysis achieve balanced prediction results, indicating that the selected features have an excellent ability to characterize battery degradation. The model based on IC analysis achieves the lowest RMSE of 0.41%. The IC analysis responds to internal battery degradation through external current and voltage measurement parameters. The results imply that the feature provides a good link between the measurement parameters and the battery’s microscopic changes. In contrast, the model based on DTV analysis achieves the highest RMSE of 0.45%. The DTV method links the temperature and voltage measurement data with the internal entropy change in the battery. However, due to the challenges of measuring the temperature data and its vulnerability to noise interference, DTV analysis is more susceptible to being disturbed by measurement noise. Despite this, the DTV analysis model still gets an RMSE of 0.45%, indicating that the DTV analysis can link the internal entropy change with the external measurement parameters and characterize the battery degradation well. Noting that the model based on the multi-feature collaborative analysis method still achieves the best prediction results, with RMSE of 0.32% and MAE of 0.28%, which may be related to the model based on the multi-feature collaborative method has more information to describe degradation. The above results reflect the reliability and generality of the proposed method.

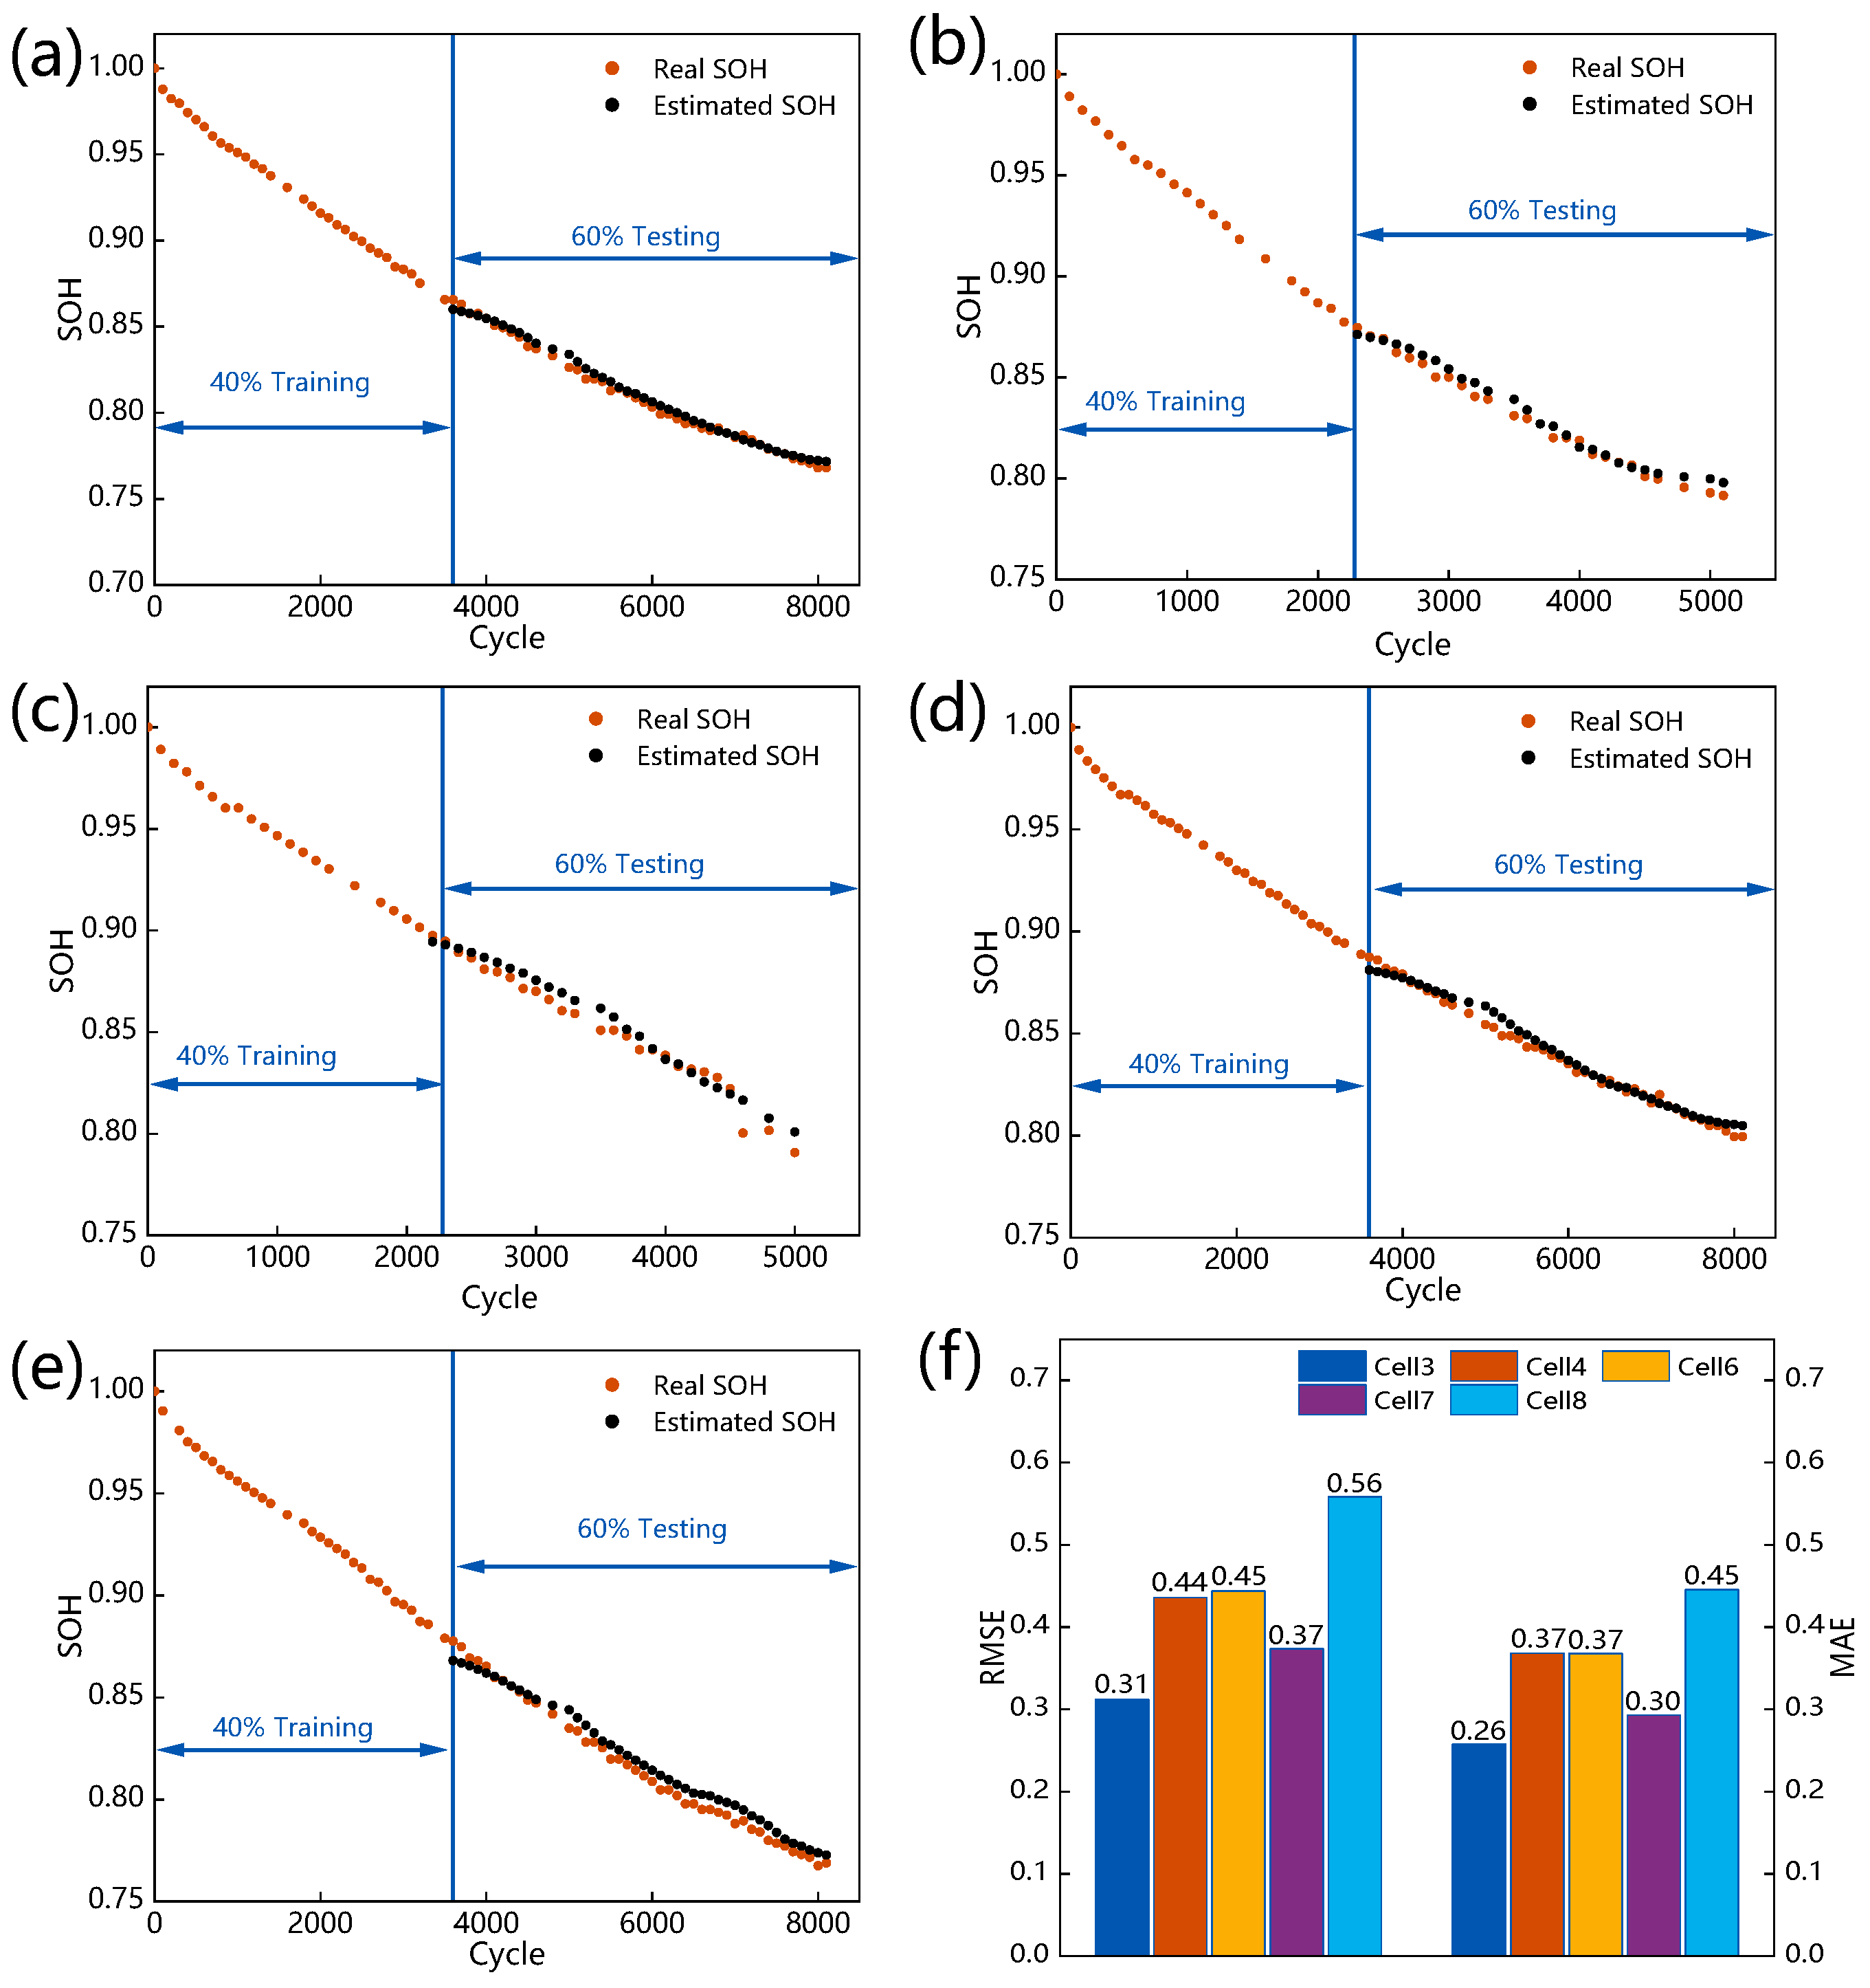
4.3.2. Results on Different Battery

In this subsection, the generality of the multi-feature collaborative analysis method is further validated based on the Oxford dataset cell 3, cell 4, cell 6, cell 7, and cell 8. Figure 8a–e shows the detailed prediction results of the proposed method. Figure 8f shows the RMSE and MAE. As shown in Figure 8f, the model based on the multi-feature collaborative analysis method achieves accurate SOH prediction on each cell, getting a maximum RMSE of 0.56% and a maximum MAE of 0.45%. The results demonstrate the generality of the proposed method, which may be attributable to the fact that the collaborative features contain more degradation information to characterize battery degradation than a single-feature set. As shown in Figure 8a–e, it can be seen that the real curve of SOH in this dataset is smooth, and there is no capacity rebound phenomenon. Different from the above results based on the NASA dataset in which the predicted SOH shows a sightly rebound, the predicted SOH on this dataset is similar to the real SOH with a smooth decline. The results suggest that the proposed method can adequately capture the change in battery SOH in diverse material system batteries and varied battery SOH change behaviors, demonstrating the method’s dependability and generality.

4.4. Compared with Other Methods

Table 5 and Table 6 show the prediction results of the proposed method in this paper and compare them with other works that were studied based on the NASA battery dataset and the Oxford battery dataset, respectively. These studies employed data-driven algorithms and some hybrid algorithms to establish a battery degradation model. Ref. [54] used voltage and current as features; a Support Vector Regression (SVR) and an Adaptive Dropout LSTM were established to predict the battery’s SOH. Ref. [43] used DTV as the input feature, and a GPR model was constructed to predict the battery’s SOH, achieving excellent results on the NASA dataset. Ref. [55] used the time interval of the equal charging voltage rising (DV_DT) as the input feature, and an LSSVM-ECM model and an EDM model were constructed and tested on both the NASA and the Oxford datasets. Ref. [56] constructed SVM, MLR, GPR, and Fusion of SVM MLR GPR models and tested them on the Oxford dataset. The designed method has a high SOH prediction accuracy on different datasets. It benefits from the input features provided by the multi-feature analysis method and the excellent ability of the LSTM network to solve the long-term dependency time series problem. The comparison results indicate that the designed SOH prediction method has good prediction performance.

4.5. Discussions

The study proposes a method that employs a combination of multi-feature collaborative analysis and deep learning methods for the estimation of the SOH of LIBs with a high level of precision. The synthesis of diverse information sources, such as temperature, current, and voltage, plays a crucial role in the assessment of battery degradation. A thorough analysis of these variables can contribute to a deeper insight into the degradation process. Furthermore, it is crucial to verify the results for various types of battery materials to establish their general applicability. The use of multi-feature collaborative analysis allows for the examination of multiple sources of information related to the LIBs, resulting in a model with robust generality. Note that the proposed method is validated under specific experimental conditions (CC-CV). However, in practice, the operating conditions of the battery may be uncertain due to varying environments. The inherent uncertainty and imprecision of dynamic loading conditions present significant challenges in the extraction of high-related features for the input of the deep learning model, which can negatively impact the correlation between the extracted features and the structural health, thereby compromising the accuracy of the model. However, the proposed method combines multiple data resources. In the event of a failure of one feature analysis, the utilization of other feature extractors can potentially mitigate the impact and maintain the functionality of the model.
The utilization of deep learning models in the field of battery SOH estimation poses several challenges, particularly in terms of deployment on resource-constrained devices such as electric vehicles. An approach to mitigate the challenges associated with the deployment of deep learning models for SOH prediction on resource-constrained devices is to leverage the computational resources of a cloud-based platform for training the model and to enable its usage through data transmission to the target device. By leveraging the computational resources available on cloud-based platforms to analyze features and train the proposed deep learning-based model, it is feasible to achieve real-time prediction of battery state. In the process of selecting an appropriate model for a particular task, some simple machine learning models may prove to be more effective in terms of prediction accuracy. However, in certain cases, more complex machine learning models, such as LSTM NN in this study, may outperform their simpler counterparts. This is due to the increased complexity of LSTM, which allows it to more effectively capture the relationship between the input data and the SOH, resulting in improved generalization capabilities. The results of this study demonstrate that the proposed method is capable of achieving an acceptable level of accuracy for the estimation of various types of LIBs through the effective extraction of relevant battery information via a multi-feature collaborative analysis method. However, further research is needed to investigate the generality of this method to other types of LIBs.

5. Conclusions

In this study, a LIBs SOH estimation framework based on a deep learning method with collaborative multi-feature analysis is provided. In such a framework, the physical-derived features are combined, and a deep learning model is utilized to estimate battery SOH efficiently. DTV, SVD, IC, and TVC analysis were used to attain the degradation features to describe battery degradation and increase the models’ generality thoroughly. Based on the results of the feature analysis, the Pearson correlation analysis is then used to select features as the input of the deep learning model cored by LSTM NN. In addition, the dropout and RMSprop techniques are implemented into such a framework, which improves the model’s performance. In order to verify the generality of the multi-feature collaborative analysis method, the NASA and Oxford battery degradation datasets are selected for validation and error analysis. The experiment results demonstrate that the method has high estimation accuracy and generality, where the maximum root mean square error (RMSE) is less than 1%. The proposed method can reduce the dependence of the estimation accuracy on the data scale while considering the interpretability of the estimation results. With the continuous improvement of cloud technology, this study provides valuable improvements to the battery SOH estimation method, which boosts the interpretability and generality of the deep learning model. On the basis of the Cyber Hierarchy and Interactional Network (CHAIN) architecture, it is anticipated that the deep learning model paired with the multi-feature collaborative analysis approach could be implemented on a cloud platform.

Author Contributions

Formal analysis, H.X.; Funding acquisition, X.H., X.L. and S.C.; Investigation, W.W.; Methodology, X.Y., B.M. and W.W.; Project administration, X.L. and S.C.; Software, B.M. and B.Z.; Validation, F.L.; Visualization, H.X.; Writing—original draft, X.Y.; Writing—review and editing, X.Y., X.H. and S.C. All authors have read and agreed to the published version of the manuscript.

Funding

This paper was financially supported by the Science and Technology Development Project of Jilin province (20200501012GX) and the National Natural Science Foundation of China (No. 52102470).

Data Availability Statement

The data presented in this study are openly available at the NASA Ames Center of Excellence Diagnostic Center and Oxford university research archive.

Acknowledgments

The authors would like to acknowledge Shuimu Tsinghua Scholar Program for funding this work for Xiao Hua.

Conflicts of Interest

The authors declare no conflict of interest.

References

  1. Zhou, C.C.; Su, Z.; Gao, X.-L.; Cao, R.; Yang, S.-C.; Liu, X.-H. Ultra-high-energy lithium-ion batteries enabled by aligned structured thick electrode design. Rare Met. 2022, 41, 14–20. [Google Scholar] [CrossRef]
  2. Zuo, L.; Zuo, L.; Lu, D.; Yang, T.; Yue, D.; Li, W.; Ma, Q.; Chen, Y.; Zheng, C.; Wu, X. Recent achievements of free-standing material and interface optimization in high-energy-density flexible lithium batteries. Carbon Neutralization 2022, 1, 316–345. [Google Scholar] [CrossRef]
  3. Li, J.J.; Zhang, L.; Doyle-Davis, K.; Li, R.Y.; Sun, X.L. Recent advances and strategies in the stabilization of single-atom catalysts for electrochemical applications. Carbon Energy 2020, 2, 488–520. [Google Scholar] [CrossRef]
  4. Cao, R.; Cheng, H.; Jia, X.; Gao, X.; Zhang, Z.; Wang, M.; Li, S.; Zhang, C.; Ma, B.; Liu, X.; et al. Non-invasive Characteristic Curve Analysis of Lithium-ion Batteries Enabling Degradation Analysis and Data-Driven Model Construction: A Review. Automot. Innov. 2022, 5, 146–163. [Google Scholar] [CrossRef]
  5. Xiong, R.; Pan, Y.; Shen, W.X.; Li, H.L.; Sun, F.C. Lithium-ion battery aging mechanisms and diagnosis method for automotive applications: Recent advances and perspectives. Renew. Sustain. Energy Rev. 2020, 131, 110048. [Google Scholar] [CrossRef]
  6. Yang, S.; Cheng, H.; Wang, M.; Lyu, M.; Gao, X.; Zhang, Z.; Cao, R.; Li, S.; Lin, J.; Hua, Y.; et al. Multi-scale Battery Modeling Method for Fault Diagnosis. Automot. Innov. 2022, 5, 400–414. [Google Scholar] [CrossRef]
  7. Chen, S.; Gao, Z.; Sun, T. Safety challenges and safety measures of Li-ion batteries. Energy Sci. Eng. 2021, 9, 1647–1672. [Google Scholar] [CrossRef]
  8. Meng, J.H.; Cai, L.; Stroe, D.I.; Luo, G.Z.; Sui, X.; Teodorescu, R. Lithium-ion battery state-of-health estimation in electric vehicle using optimized partial charging voltage profiles. Energy 2019, 185, 1054–1062. [Google Scholar] [CrossRef]
  9. Guo, L.Z.; Sun, J.F.; Wei, J.X.; Liu, Y.; Hou, L.R.; Yuan, C.Z. Conductive metal-organic frameworks: Recent advances in electrochemical energy-related applications and perspectives. Carbon Energy 2020, 2, 203–222. [Google Scholar] [CrossRef]
  10. Zhang, L.; Liu, L.; Gao, X.; Pan, Y.; Liu, X.; Feng, X. Modeling of Lithium plating in lithium ion batteries based on Monte Carlo method. J. Power Source 2022, 541, 231568. [Google Scholar] [CrossRef]
  11. Safari, M.; Morcrette, M.; Teyssot, A.; Delacourt, C. Life-Prediction Methods for Lithium-Ion Batteries Derived from a Fatigue Approach I. Introduction: Capacity-Loss Prediction Based on Damage Accumulation. J. Electrochem. Soc. 2010, 157, A713. [Google Scholar] [CrossRef]
  12. Yu, H.; Yang, L.; Zhang, L.; Li, J.; Liu, X. Parallel battery pack charging strategy under various ambient temperatures based on minimum lithium plating overpotential control. iScience 2022, 25, 104243. [Google Scholar] [CrossRef]
  13. Pang, M.-C.; Yang, K.; Brugge, R.; Zhang, T.; Liu, X.; Pan, F.; Yang, S.; Aguadero, A.; Wu, B.; Marinescu, M.; et al. Interactions are important: Linking multi-physics mechanisms to the performance and degradation of solid-state batteries. Mater. Today 2021, 49, 145–183. [Google Scholar] [CrossRef]
  14. Iurilli, P.; Brivio, C.; Carrillo, R.E.; Wood, V. Physics-Based SoH Estimation for Li-Ion Cells. Batteries 2022, 8, 204. [Google Scholar] [CrossRef]
  15. Bian, X.L.; Liu, L.C.; Yan, J.Y.; Zou, Z.; Zhao, R.K. An open circuit voltage-based model for state-of-health estimation of lithium-ion batteries: Model development and validation. J. Power Source 2020, 448, 400–414. [Google Scholar] [CrossRef]
  16. Dubarry, M.; Berecibar, M.; Devie, A.; Ansean, D.; Omar, N.; Villarreal, I. State of health battery estimator enabling degradation diagnosis: Model and algorithm description. J. Power Source 2017, 360, 59–69. [Google Scholar] [CrossRef]
  17. Gao, Z.; Xie, H.; Yang, X.; Niu, W.; Li, S.; Chen, S. The Dilemma of C-Rate and Cycle Life for Lithium-Ion Batteries under Low Temperature Fast Charging. Batteries 2022, 8, 234. [Google Scholar] [CrossRef]
  18. Aykol, M.; Gopal, C.B.; Anapolsky, A.; Herring, P.K.; van Vlijmen, B.; Berliner, M.D.; Bazant, M.Z.; Braatz, R.D.; Chueh, W.C.; Storey, B.D. Perspective-Combining Physics and Machine Learning to Predict Battery Lifetime. J. Electrochem. Soc. 2021, 168, 030525. [Google Scholar] [CrossRef]
  19. Merla, Y.; Wu, B.; Yufit, V.; Brandon, N.P.; Martinez-Botas, R.F.; Offer, G.J. Extending battery life: A low-cost practical diagnostic technique for lithium-ion batteries. J. Power Source 2016, 331, 224–231. [Google Scholar] [CrossRef]
  20. Feng, T.H.; Yang, L.; Zhao, X.W.; Zhang, H.D.; Qiang, J.X. Online identification of lithium-ion battery parameters based on an improved equivalent-circuit model and its implementation on battery state-of-power prediction. J. Power Source 2015, 281, 192–203. [Google Scholar] [CrossRef]
  21. Dai, H.F.; Xu, T.J.; Zhu, L.T.; Wei, X.Z.; Sun, Z.C. Adaptive model parameter identification for large capacity Li-ion batteries on separated time scales. Appl. Energy 2016, 184, 119–131. [Google Scholar] [CrossRef]
  22. Lai, X.; Zheng, Y.J.; Sun, T. A comparative study of different equivalent circuit models for estimating state-of-charge of lithium-ion batteries. Electrochim. Acta 2018, 259, 566–577. [Google Scholar] [CrossRef]
  23. Thompson, A.W. Economic implications of lithium ion battery degradation for Vehicle-to-Grid (V2X) services. J. Power Source 2018, 396, 691–709. [Google Scholar] [CrossRef]
  24. Yu, H.; Li, J.; Ji, Y.; Pecht, M. Life-cycle parameter identification method of an electrochemical model for lithium-ion battery pack. J. Energy Storage 2022, 47, 103591. [Google Scholar] [CrossRef]
  25. Zhang, L.; Chen, S.; Wang, W.; Yu, H.; Xie, H.; Wang, H.; Yang, S.; Zhang, C.; Liu, X. Enabling dendrite-free charging for lithium batteries based on transport-reaction competition mechanism in CHAIN framework. J. Energy Chem. 2022, 75, 408–421. [Google Scholar] [CrossRef]
  26. Jin, X.; Vora, A.; Hoshing, V.; Saha, T.; Shaver, G.; Garcia, R.E.; Wasynczuk, O.; Varigonda, S. Physically-based reduced-order capacity loss model for graphite anodes in Li-ion battery cells. J. Power Source 2017, 342, 750–761. [Google Scholar] [CrossRef]
  27. Li, J.; Adewuyi, K.; Lotfi, N.; Landers, R.G.; Park, J. A single particle model with chemical/mechanical degradation physics for lithium ion battery State of Health (SOH) estimation. Appl. Energy 2018, 212, 1178–1190. [Google Scholar] [CrossRef]
  28. Dong, H.C.; Jin, X.N.; Lou, Y.B.; Wang, C.H. Lithium-ion battery state of health monitoring and remaining useful life prediction based on support vector regression-particle filter. J. Power Source 2014, 271, 114–123. [Google Scholar] [CrossRef]
  29. Li, Y.; Wei, Z.B.; Xiong, B.Y.; Vilathgamuwa, D.M. Adaptive Ensemble-Based Electrochemical-Thermal Degradation State Estimation of Lithium-Ion Batteries. IEEE Trans. Ind. Electron. 2022, 69, 6984–6996. [Google Scholar] [CrossRef]
  30. Richardson, R.R.; Osborne, M.A.; Howey, D.A. Gaussian process regression for forecasting battery state of health. J. Power Source 2017, 357, 209–219. [Google Scholar] [CrossRef]
  31. Hu, C.; Jain, G.; Zhang, P.Q.; Schmidt, C.; Gomadam, P.; Gorka, T. Data-driven method based on particle swarm optimization and k-nearest neighbor regression for estimating capacity of lithium-ion battery. Appl. Energy 2014, 129, 49–55. [Google Scholar] [CrossRef]
  32. Khumprom, P.; Yodo, N. A Data-Driven Predictive Prognostic Model for Lithium-ion Batteries based on a Deep Learning Algorithm. Energies 2019, 12, 660. [Google Scholar] [CrossRef]
  33. Li, P.H.; Zhang, Z.J.; Xiong, Q.Y.; Ding, B.C.; Hou, J.; Luo, D.C.; Rong, Y.J.; Li, S.Y. State-of-health estimation and remaining useful life prediction for the lithium-ion battery based on a variant long short term memory neural network. J. Power Source 2020, 459, 228069. [Google Scholar] [CrossRef]
  34. Hong, J.C.; Wang, Z.P.; Chen, W.; Wang, L.Y.; Lin, P.; Qu, C.H. Online accurate state of health estimation for battery systems on real-world electric vehicles with variable driving conditions considered. J. Clean. Prod. 2021, 294, 125814. [Google Scholar] [CrossRef]
  35. Lin, H.Y.; Kang, L.Y.; Xie, D.; Linghu, J.Q.; Li, J. Online State-of-Health Estimation of Lithium-Ion Battery Based on Incremental Capacity Curve and BP Neural Network. Batteries 2022, 8, 29. [Google Scholar] [CrossRef]
  36. Zhang, S.Z.; Zhai, B.Y.; Guo, X.; Wang, K.K.; Peng, N.A.; Zhang, X.W. Synchronous estimation of state of health and remaining useful lifetime for lithium-ion battery using the incremental capacity and artificial neural networks. J. Energy Storage 2019, 26, 100951. [Google Scholar] [CrossRef]
  37. Li, X.Y.; Yuan, C.G.; Wang, Z.P. State of health estimation for Li-ion battery via partial incremental capacity analysis based on support vector regression. Energy 2020, 203, 117852. [Google Scholar] [CrossRef]
  38. Leng, F.; Tan, C.M.; Pecht, M. Effect of Temperature on the Aging rate of Li Ion Battery Operating above Room Temperature. Sci. Rep. 2015, 5, 12967. [Google Scholar] [CrossRef]
  39. Shibagaki, T.; Merla, Y.; Offer, G.J. Tracking degradation in lithium iron phosphate batteries using differential thermal voltammetry. J. Power Source 2018, 374, 188–195. [Google Scholar] [CrossRef]
  40. Merla, Y.; Wu, B.; Yufit, V.; Brandon, N.P.; Martinez-Botas, R.F.; Offer, G.J. Novel application of differential thermal voltammetry as an in-depth state-of-health diagnosis method for lithium-ion batteries. J. Power Source 2016, 307, 308–319. [Google Scholar] [CrossRef] [Green Version]
  41. Wang, W.; Zhang, L.; Yu, H.; Yang, X.; Zhang, T.; Chen, S.; Liang, F.; Wang, H.; Lu, X.; Yang, S.; et al. Early Prediction of the Health Conditions for Battery Cathodes Assisted by the Fusion of Feature Signal Analysis and Deep-Learning Techniques. Batteries 2022, 8, 151. [Google Scholar] [CrossRef]
  42. Dai, H.D.; Zhao, G.C.; Lin, M.Q.; Wu, J.; Zheng, G.F. A Novel Estimation Method for the State of Health of Lithium-Ion Battery Using Prior Knowledge-Based Neural Network and Markov Chain. IEEE Trans. Ind. Electron. 2019, 66, 7706–7716. [Google Scholar] [CrossRef]
  43. Patil, M.A.; Tagade, P.; Hariharan, K.S.; Kolake, S.M.; Song, T.; Yeo, T.; Doo, S. A novel multistage Support Vector Machine based approach for Li ion battery remaining useful life estimation. Appl. Energy 2015, 159, 285–297. [Google Scholar] [CrossRef]
  44. Wang, Z.; Yuan, C.; Li, X. Lithium Battery State-of-Health Estimation via Differential Thermal Voltammetry With Gaussian Process Regression. IEEE Trans. Transp. Electrif. 2021, 7, 16–25. [Google Scholar] [CrossRef]
  45. Zhang, L.S.; Gao, X.L.; Liu, X.H.; Zhang, Z.J.; Cao, R.; Cheng, H.C.; Wang, M.Y.; Yan, X.Y.; Yang, S.C. CHAIN: Unlocking informatics-aided design of Li metal anode from materials to applications. Rare Met. 2022, 41, 1477–1489. [Google Scholar] [CrossRef]
  46. Yang, S.; He, R.; Zhang, Z.; Cao, Y.; Gao, X.; Liu, X. CHAIN: Cyber Hierarchy and Interactional Network Enabling Digital Solution for Battery Full-Lifespan Management. Matter 2020, 3, 27–41. [Google Scholar] [CrossRef]
  47. Yang, S.; Zhang, Z.; Cao, R.; Wang, M.; Cheng, H.; Zhang, L.; Jiang, Y.; Li, Y.; Chen, B.; Ling, H.; et al. Implementation for a cloud battery management system based on the CHAIN framework. Energy AI 2021, 5, 100088. [Google Scholar] [CrossRef]
  48. Goebel, K.; Saha, B.; Saxena, A.; Celaya, J.R.; Christophersen, J.P. Prognostics in Battery Health Management. IEEE Instrum. Meas. Mag. 2008, 11, 33–40. [Google Scholar] [CrossRef]
  49. Birkl, C. Diagnosis and Prognosis of Degradation in Lithium-Ion Batteries. Ph.D. Thesis, University of Oxford, Oxford, UK, 2017. [Google Scholar]
  50. Birkl, C. Oxford Battery Degradation Dataset 1. Ph.D. Thesis, University of Oxford, Oxford, UK, 2017. [Google Scholar]
  51. Wu, B.; Yufit, V.; Merla, Y.; Martinez-Botas, R.F.; Brandon, N.P.; Offer, G.J. Differential thermal voltammetry for tracking of degradation in lithium-ion batteries. J. Power Source 2015, 273, 495–501. [Google Scholar] [CrossRef]
  52. Cavalheiro, G.; Iriyama, T.; Nelson, G.; Huang, S.; Zhang, G. Effects of Non-Uniform Temperature Distribution on Degradation of Lithium-ion Batteries. J. Electrochem. Energy Convers. Storage 2019, 17, 021101. [Google Scholar] [CrossRef]
  53. Tong, Z.; Miao, J.; Tong, S.; Lu, Y. Early prediction of remaining useful life for Lithium-ion batteries based on a hybrid machine learning method. J. Clean. Prod. 2021, 317, 128265. [Google Scholar] [CrossRef]
  54. Zheng, S.; Ristovski, K.; Farahat, A.; Gupta, C. Long Short-Term Memory Network for Remaining Useful Life estimation. In Proceedings of the 2017 IEEE International Conference on Prognostics and Health Management (ICPHM), Dallas, TX, USA, 19–21 June 2017; pp. 88–95. [Google Scholar]
  55. Zhang, J.a.; Wang, P.; Gong, Q.; Cheng, Z. SOH estimation of lithium-ion batteries based on least squares support vector machine error compensation model. J. Power Electron. 2021, 21, 1712–1723. [Google Scholar] [CrossRef]
  56. Lin, M.; Wu, D.; Meng, J.; Wu, J.; Wu, H. A multi-feature-based multi-model fusion method for state of health estimation of lithium-ion batteries. J. Power Source 2022, 518, 230774. [Google Scholar] [CrossRef]
Figure 1. Capacity data of LIBs: (a) NASA; (b) Oxford.
Batteries 09 00120 g001
Figure 2. DTV analysis: (a) Comparison of unfiltered DTV and DTV curves smoothed by SG; (b) Differential of unfiltered DTV curves and DTV curves smoothed by SG; (c) DTV curves and (d) DTV feature variables of battery B5 in the NASA dataset; (e) DTV curves and (f) DTV feature variables of cell 1 in the Oxford dataset.
Batteries 09 00120 g002
Figure 3. IC and TVC analysis: (a) IC curves and (b) IC feature variables of battery B5 in the NASA dataset; (c) IC curves and (d) IC feature variables of cell 1 in the Oxford dataset; (e) Time-voltage curves for battery B5 in the NASA dataset and (f) Time-voltage curves for cell 1 in the Oxford dataset.
Batteries 09 00120 g003
Figure 4. The flowchart of the multi-features fusion SOH prediction framework.
Batteries 09 00120 g004
Figure 5. Results on NASA battery B5 based on different methods: (a) DTV. (b) SVD. (c) IC. (d) TVC. (e) Multi-feature collaboration. (f) MAE and RMSE analyses.
Batteries 09 00120 g005
Figure 6. Results on NASA battery based on collaborative features: (a) B6; (b) B7; (c) B18; (d) MAE and RMSE analyses.
Batteries 09 00120 g006
Figure 7. Results on Oxford cell1 based on different methods: (a) DTV. (b) SVD. (c) IC. (d) TVC. (e) Multi-feature collaboration. (f) MAE and RMSE analyses.
Batteries 09 00120 g007
Figure 8. Results on Oxford battery based on collaborative features: (a) Cell 3; (b) Cell 4; (c) Cell 6; (d) Cell 7; (e) Cell 8; (f) MAE and RMSE analyses.
Batteries 09 00120 g008
Table 1. Specific cycle condition of the NASA dataset.
BatteryB5B6B7B18
Cathode materialNCA
Nominal capacity [Ah]2222
Charge cut-off voltage [V]4.24.24.24.2
Discharging cut-off voltage [V]2.72.52.22.5
Charge rate0.75C0.75C0.75C0.75C
Discharge rate1C1C1C1C
Table 2. Specific cycle condition of the Oxford dataset.
Technical SpecificationsCycling Tests
Anode materialGraphiteCharge testCC charge at 2C
Cathode materialLCO/NCO
Nominal capacity [Ah]0.74
Nominal voltage [V]3.7
Discharge cut-off voltage [V]2.7Discharge testArtemis drive cycle discharge
Charge cut-off voltage [V]4.2
Table 3. Pearson correlation coefficients between feature variables and SOH for the NASA dataset.
MethodDTVSVDICTVC
FeaturesFV1FV2FV3FV4FV5FV6FV7FV8FV9FV10FV11
B50.550.940.570.940.490.980.980.980.990.940.99
B60.110.980.830.950.700.980.970.980.980.980.99
B70.410.920.330.870.060.970.980.990.980.920.98
B180.500.910.930.830.740.980.990.980.990.950.99
Table 4. Pearson correlation coefficients between feature variables and SOH for the Oxford dataset.
MethodDTVSVDICTVC
FeaturesFV1FV2FV3FV4FV5FV6FV7FV8FV9FV10FV11
Cell10.800.110.850.530.710.980.990.990.950.970.98
Cell30.880.290.830.220.820.970.980.990.940.950.96
Cell40.840.430.860.530.710.980.990.990.930.950.98
Cell60.860.080.830.550.520.970.990.970.830.950.99
Cell70.900.640.910.180.600.970.980.990.840.940.99
Cell80.950.610.960.020.900.970.990.990.930.920.98
Table 5. RMSE of SOH estimation result on the NASA dataset.
MethodProportion of Training SetFeatureRMSE (%)
#5#6#7#18
Ours40%Multiple features0.620.770.610.93
SVR [54]50%Voltege, Current3.3---
AD-LSTM [54]30%Voltege, Cur-rent3.03.32.0-
GPR [44]20%DTV0.270.280.320.31
LSSVM-ECM [55]-DV_DT-2.51.7-
EDM [55]-11.32.7-
Table 6. RMSE of SOH estimation result on the Oxford dataset.
MethodProportion of Training SetFeatureRMSE (%)
#1#2#3#4#5#6#7#8
Ours40%Multi-features0.32-0.310.440.45-0.370.56
SVM [56]-Voltage
Temperature
ICA
0.852.330.750.580.640.930.590.57
MLR [56]-0.842.020.730.550.600.970.370.43
GPR [56]-0.942.110.810.450.510.940.530.62
Fusion of SVM MLR GPR [56]-0.700.790.570.420.480.860.510.51
LSSVM-ECM [55]-DV_DT-0.910.65-0.310.501.470.29
EDM [55]-1.650.96-1.941.463.231.39
Disclaimer/Publisher’s Note: The statements, opinions and data contained in all publications are solely those of the individual author(s) and contributor(s) and not of MDPI and/or the editor(s). MDPI and/or the editor(s) disclaim responsibility for any injury to people or property resulting from any ideas, methods, instructions or products referred to in the content.

