

Triggering and Characterisation of Realistic Internal Short Circuits in Lithium-Ion Pouch Cells—A New Approach Using Precise Needle Penetration


Abstract
:1. Introduction
1.1. Structure
1.2. General Initial Considerations
- Development and application of a method for the reliable replication of realistic single-layer ISCs in lithium-ion pouch cells.
- Detailed characterisation of many ISCs by several measurement techniques in different time ranges.
- Discovering the Partial Thermal Runaway as a new and very interesting failure characteristic.
- Creation of a knowledge base for the ISC which should be used, e.g., for the further development of failure detection methods or for an improved risk assessment in the future.
2. Material
2.1. Cells
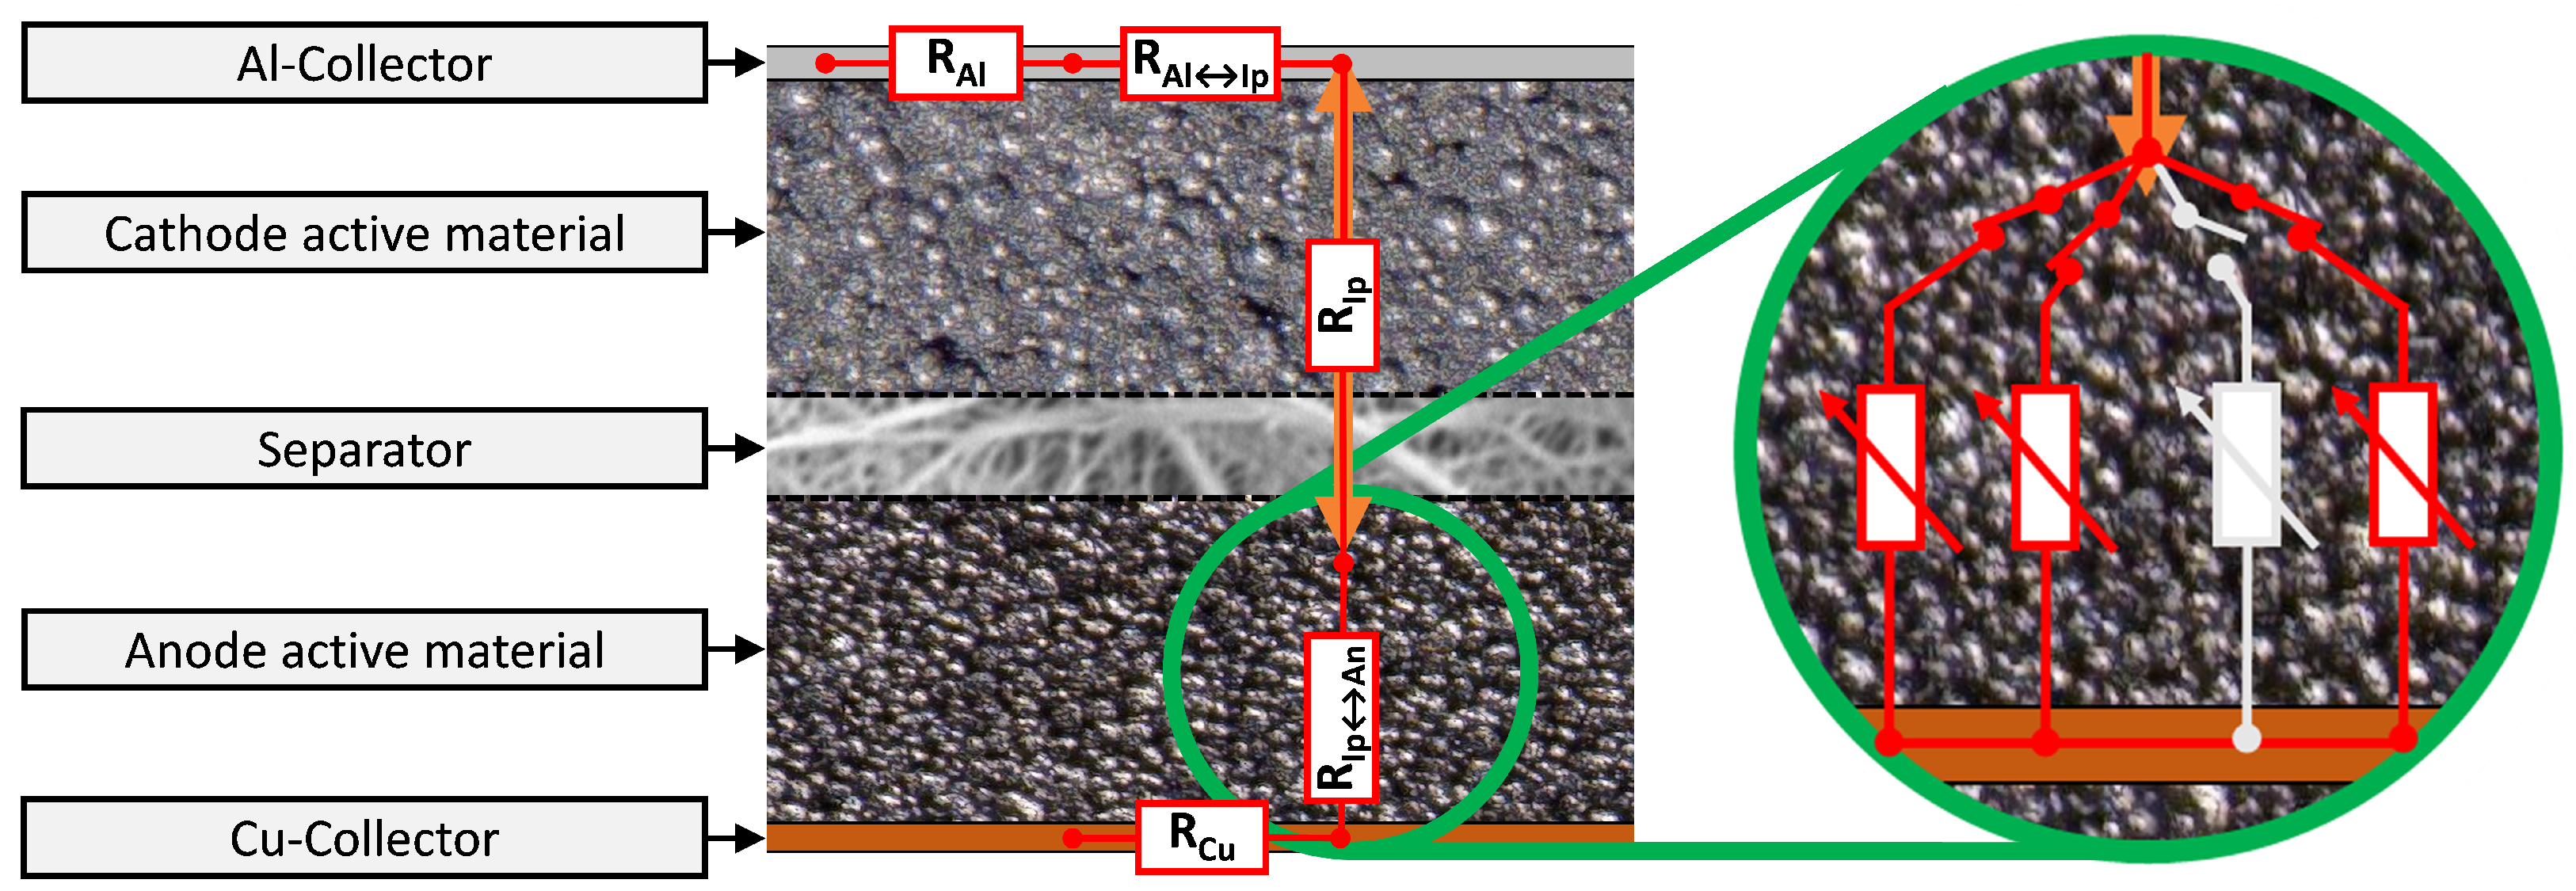
- Creation of most critical ISC contact condition (Al↔An) by needle penetration requires:
- (a)
- A pouch cell;
- (b)
- A cathode as the outermost electrode.
- Investigation of the known inhomogeneous failure characteristic of an ISC cannot be sensibly conducted at small (laboratory) cells [45,89,90] but with a cell capacity close to application values to generate transferable results. The corresponding ISC risk rises with the capacity due to lower cell-internal resistance and larger currents [31,32,91].
2.2. Surrounding Cell Conditions
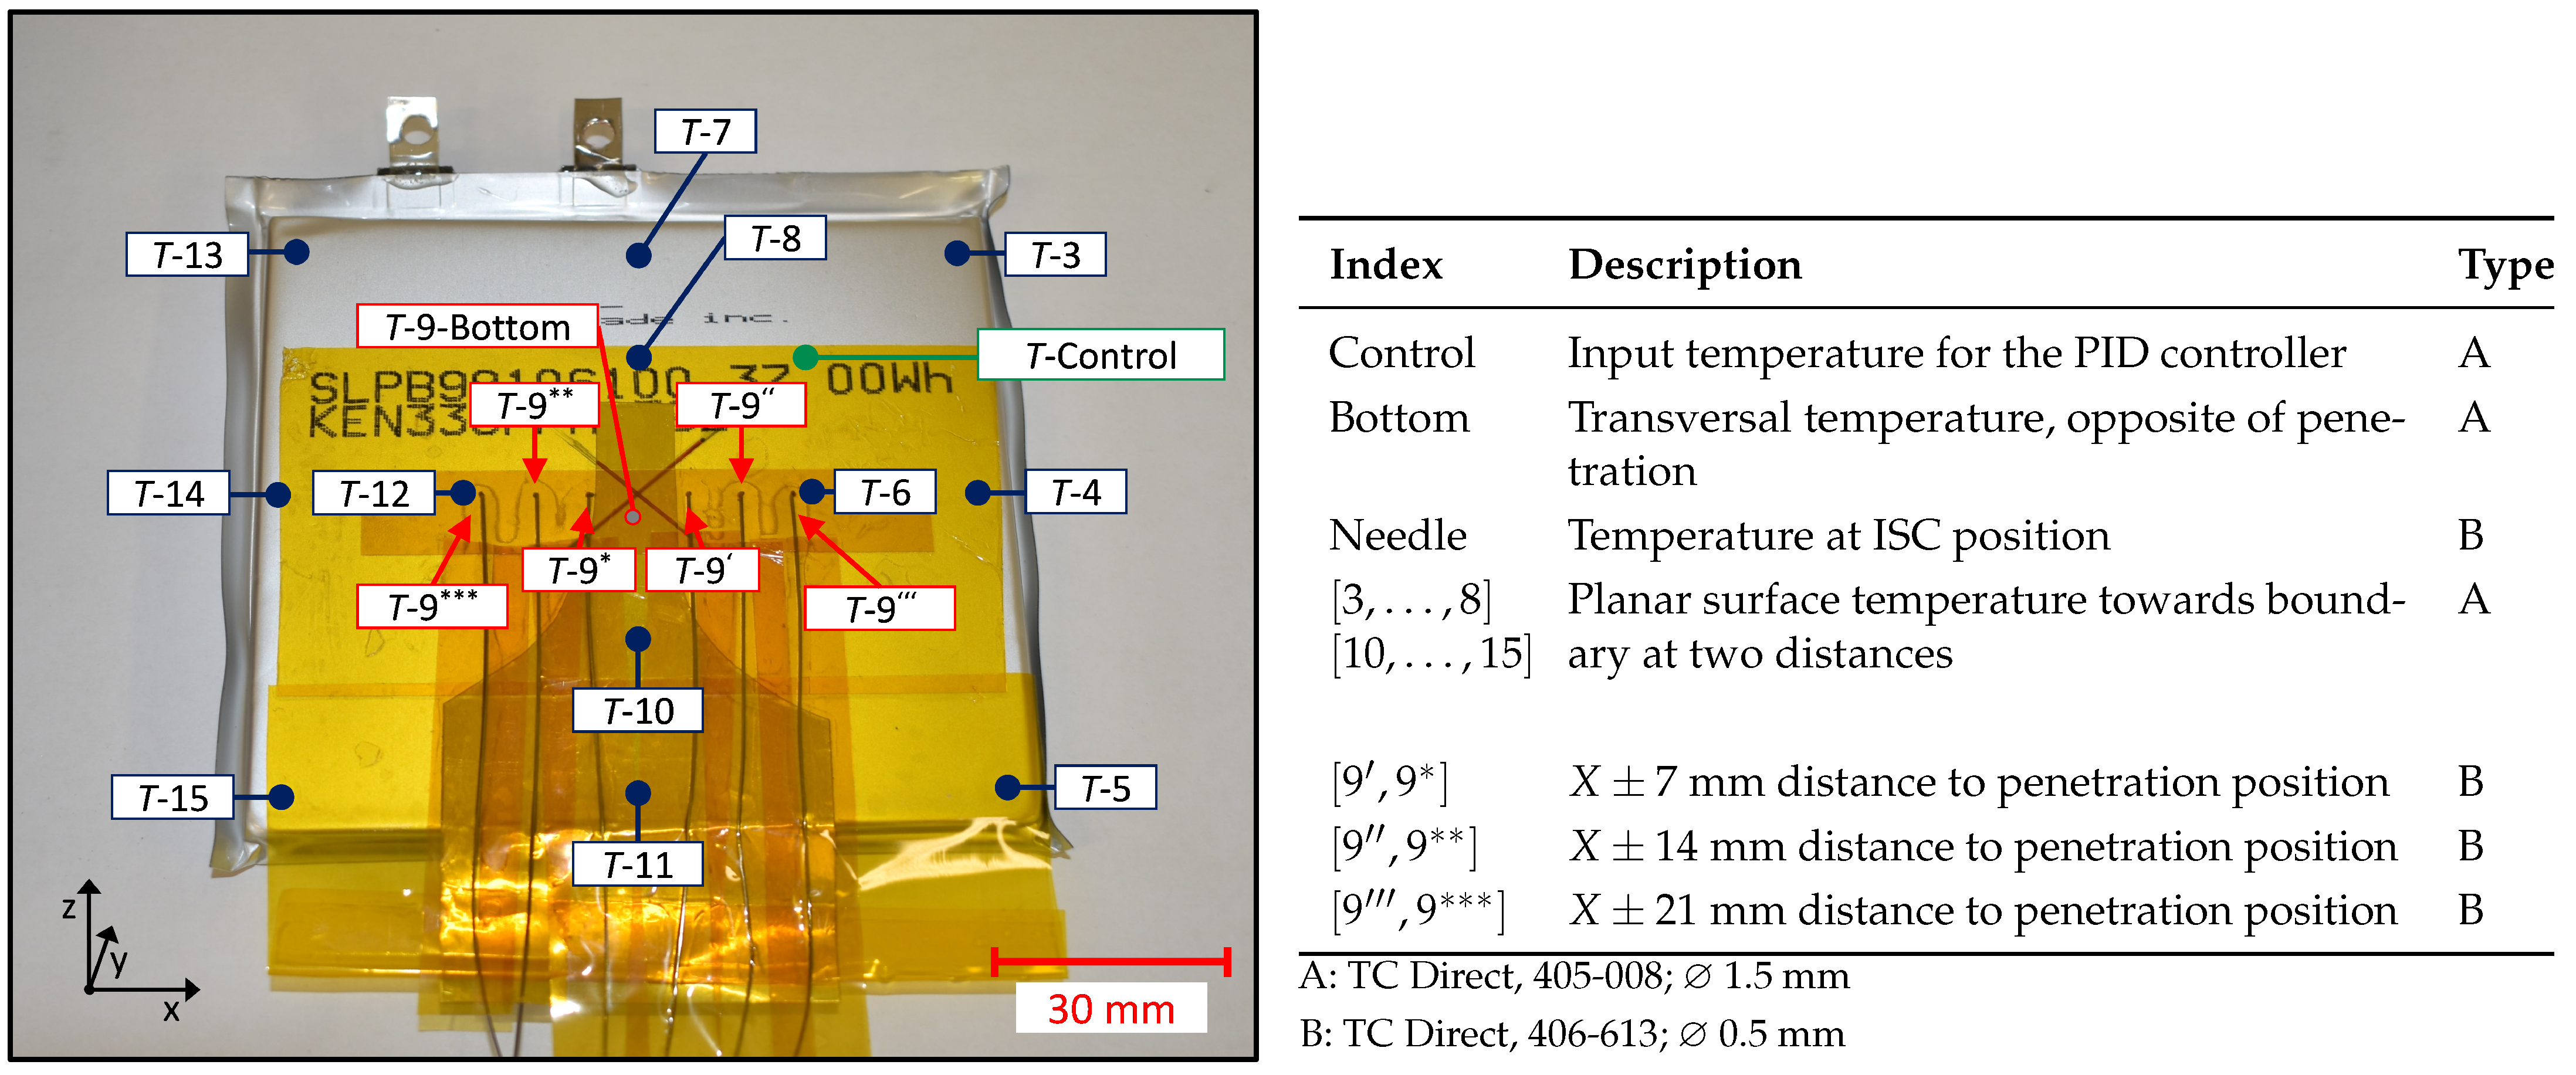
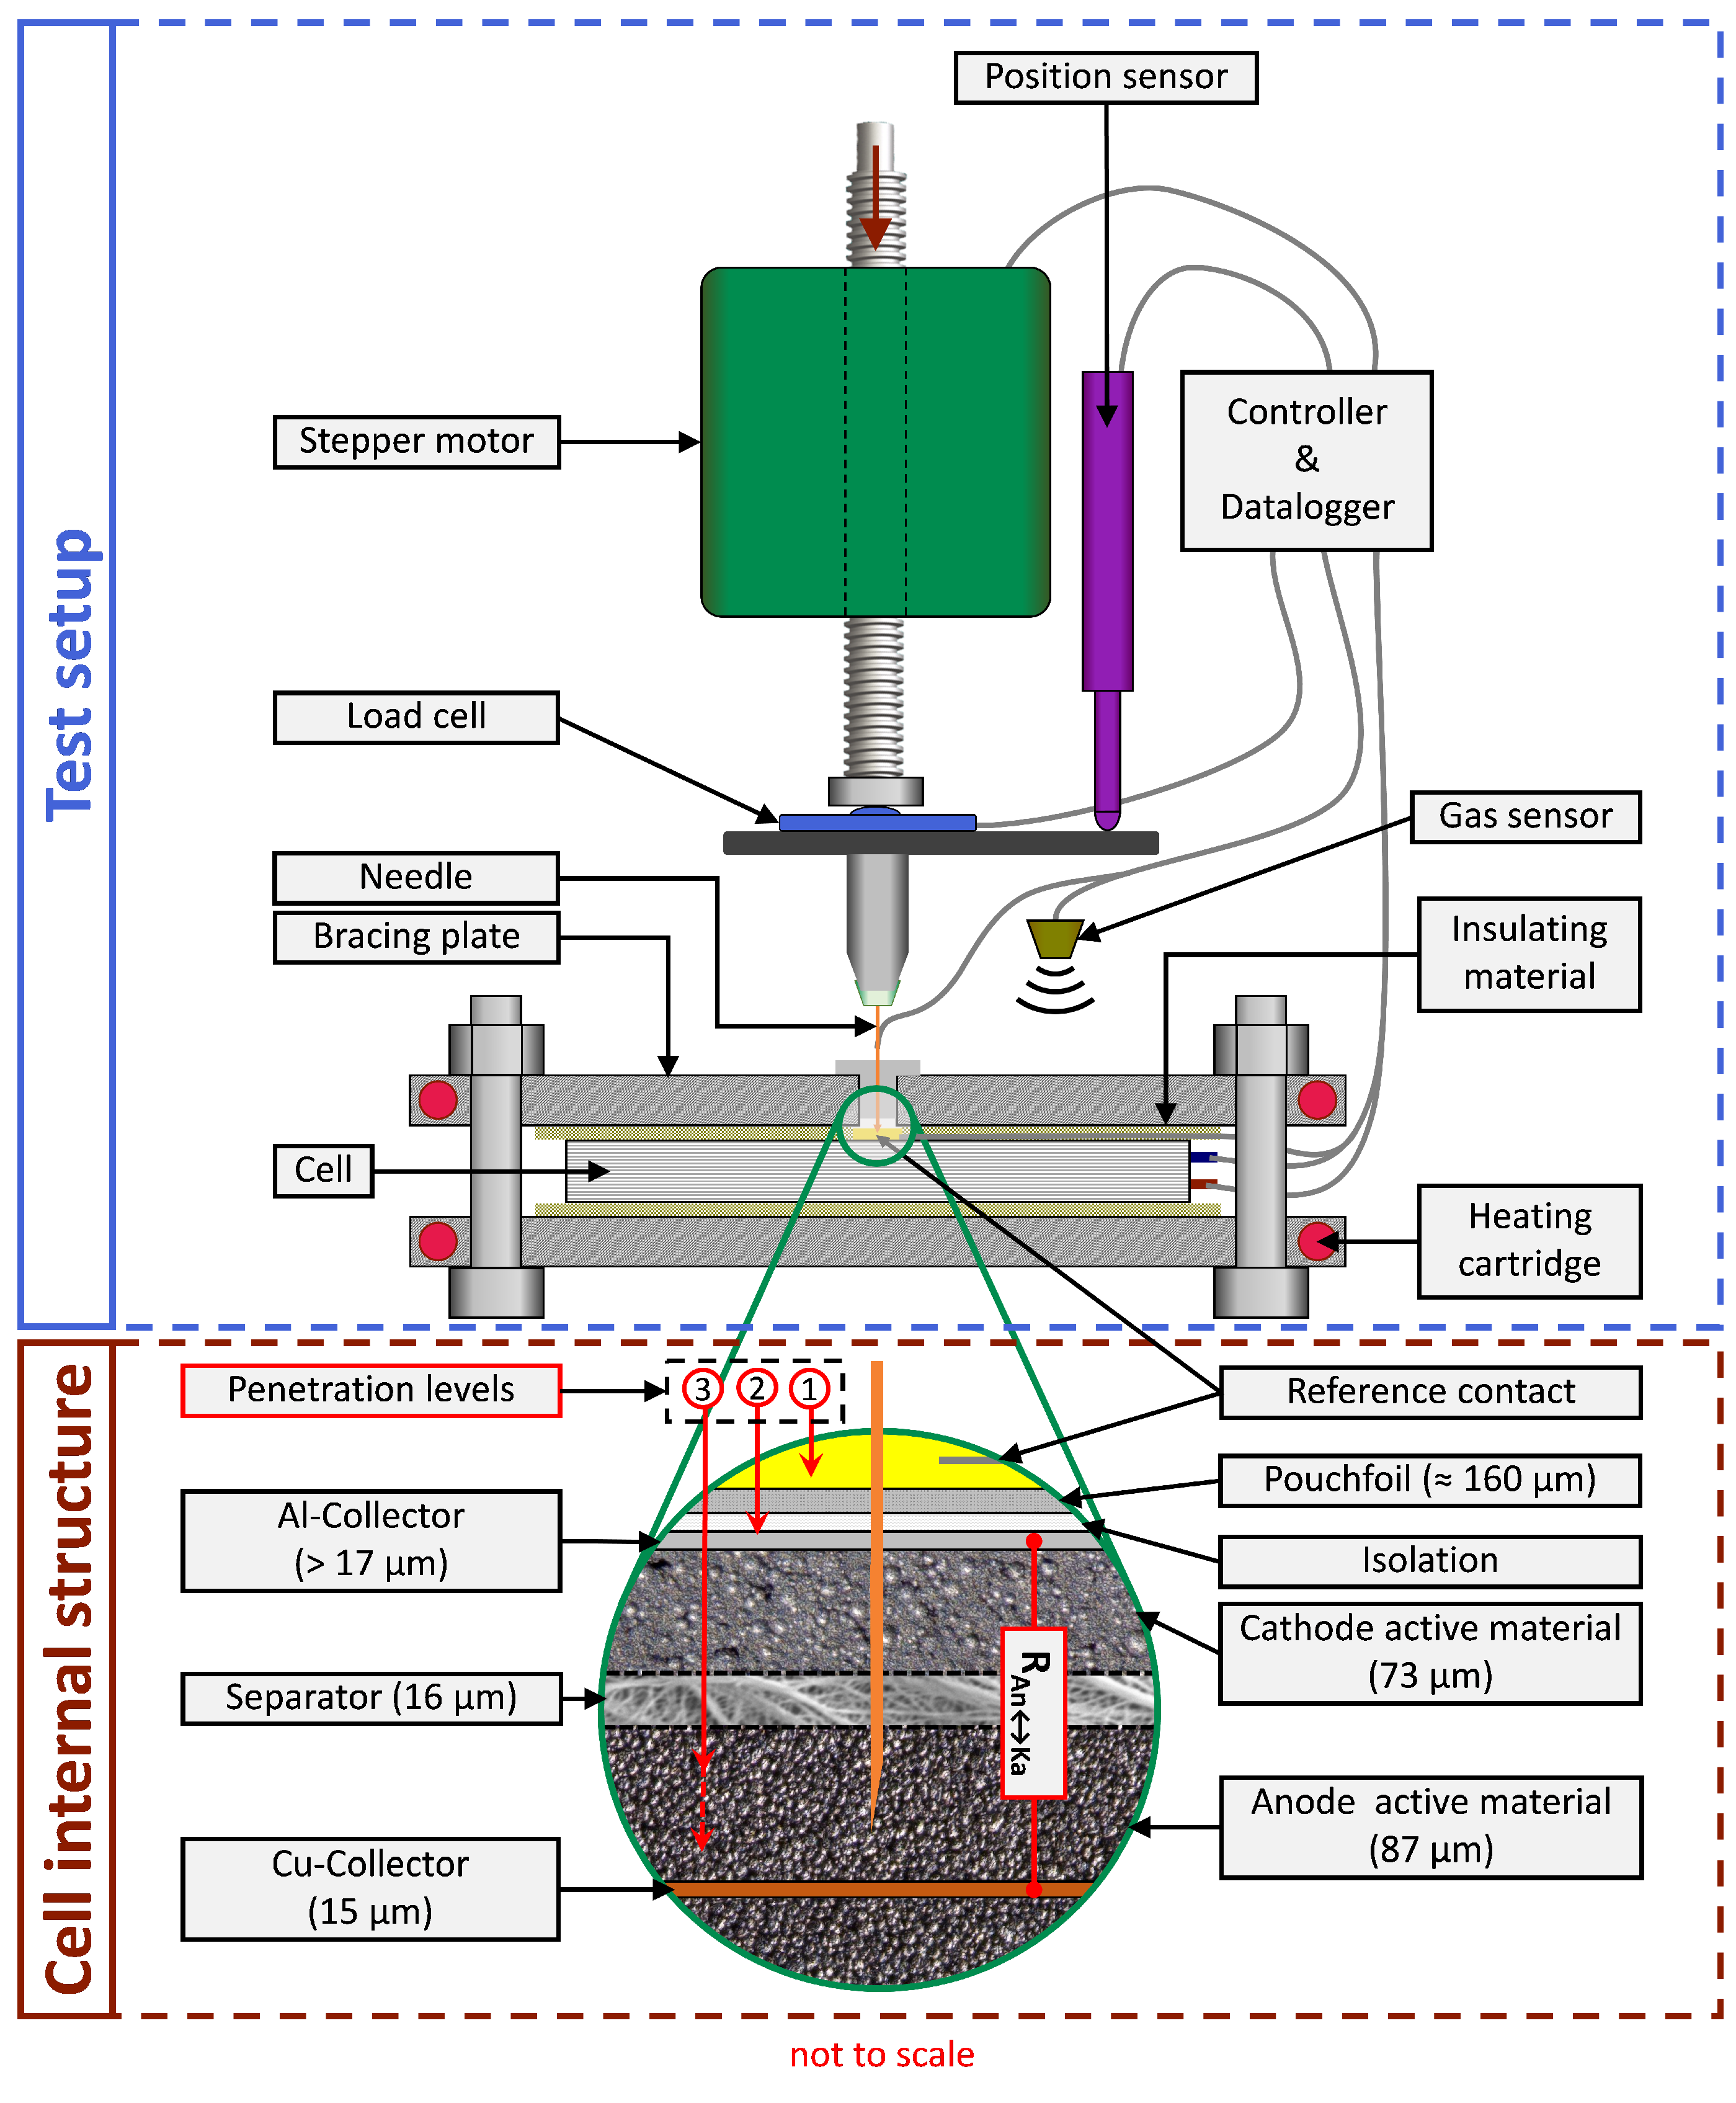
2.3. Temperature Measurement
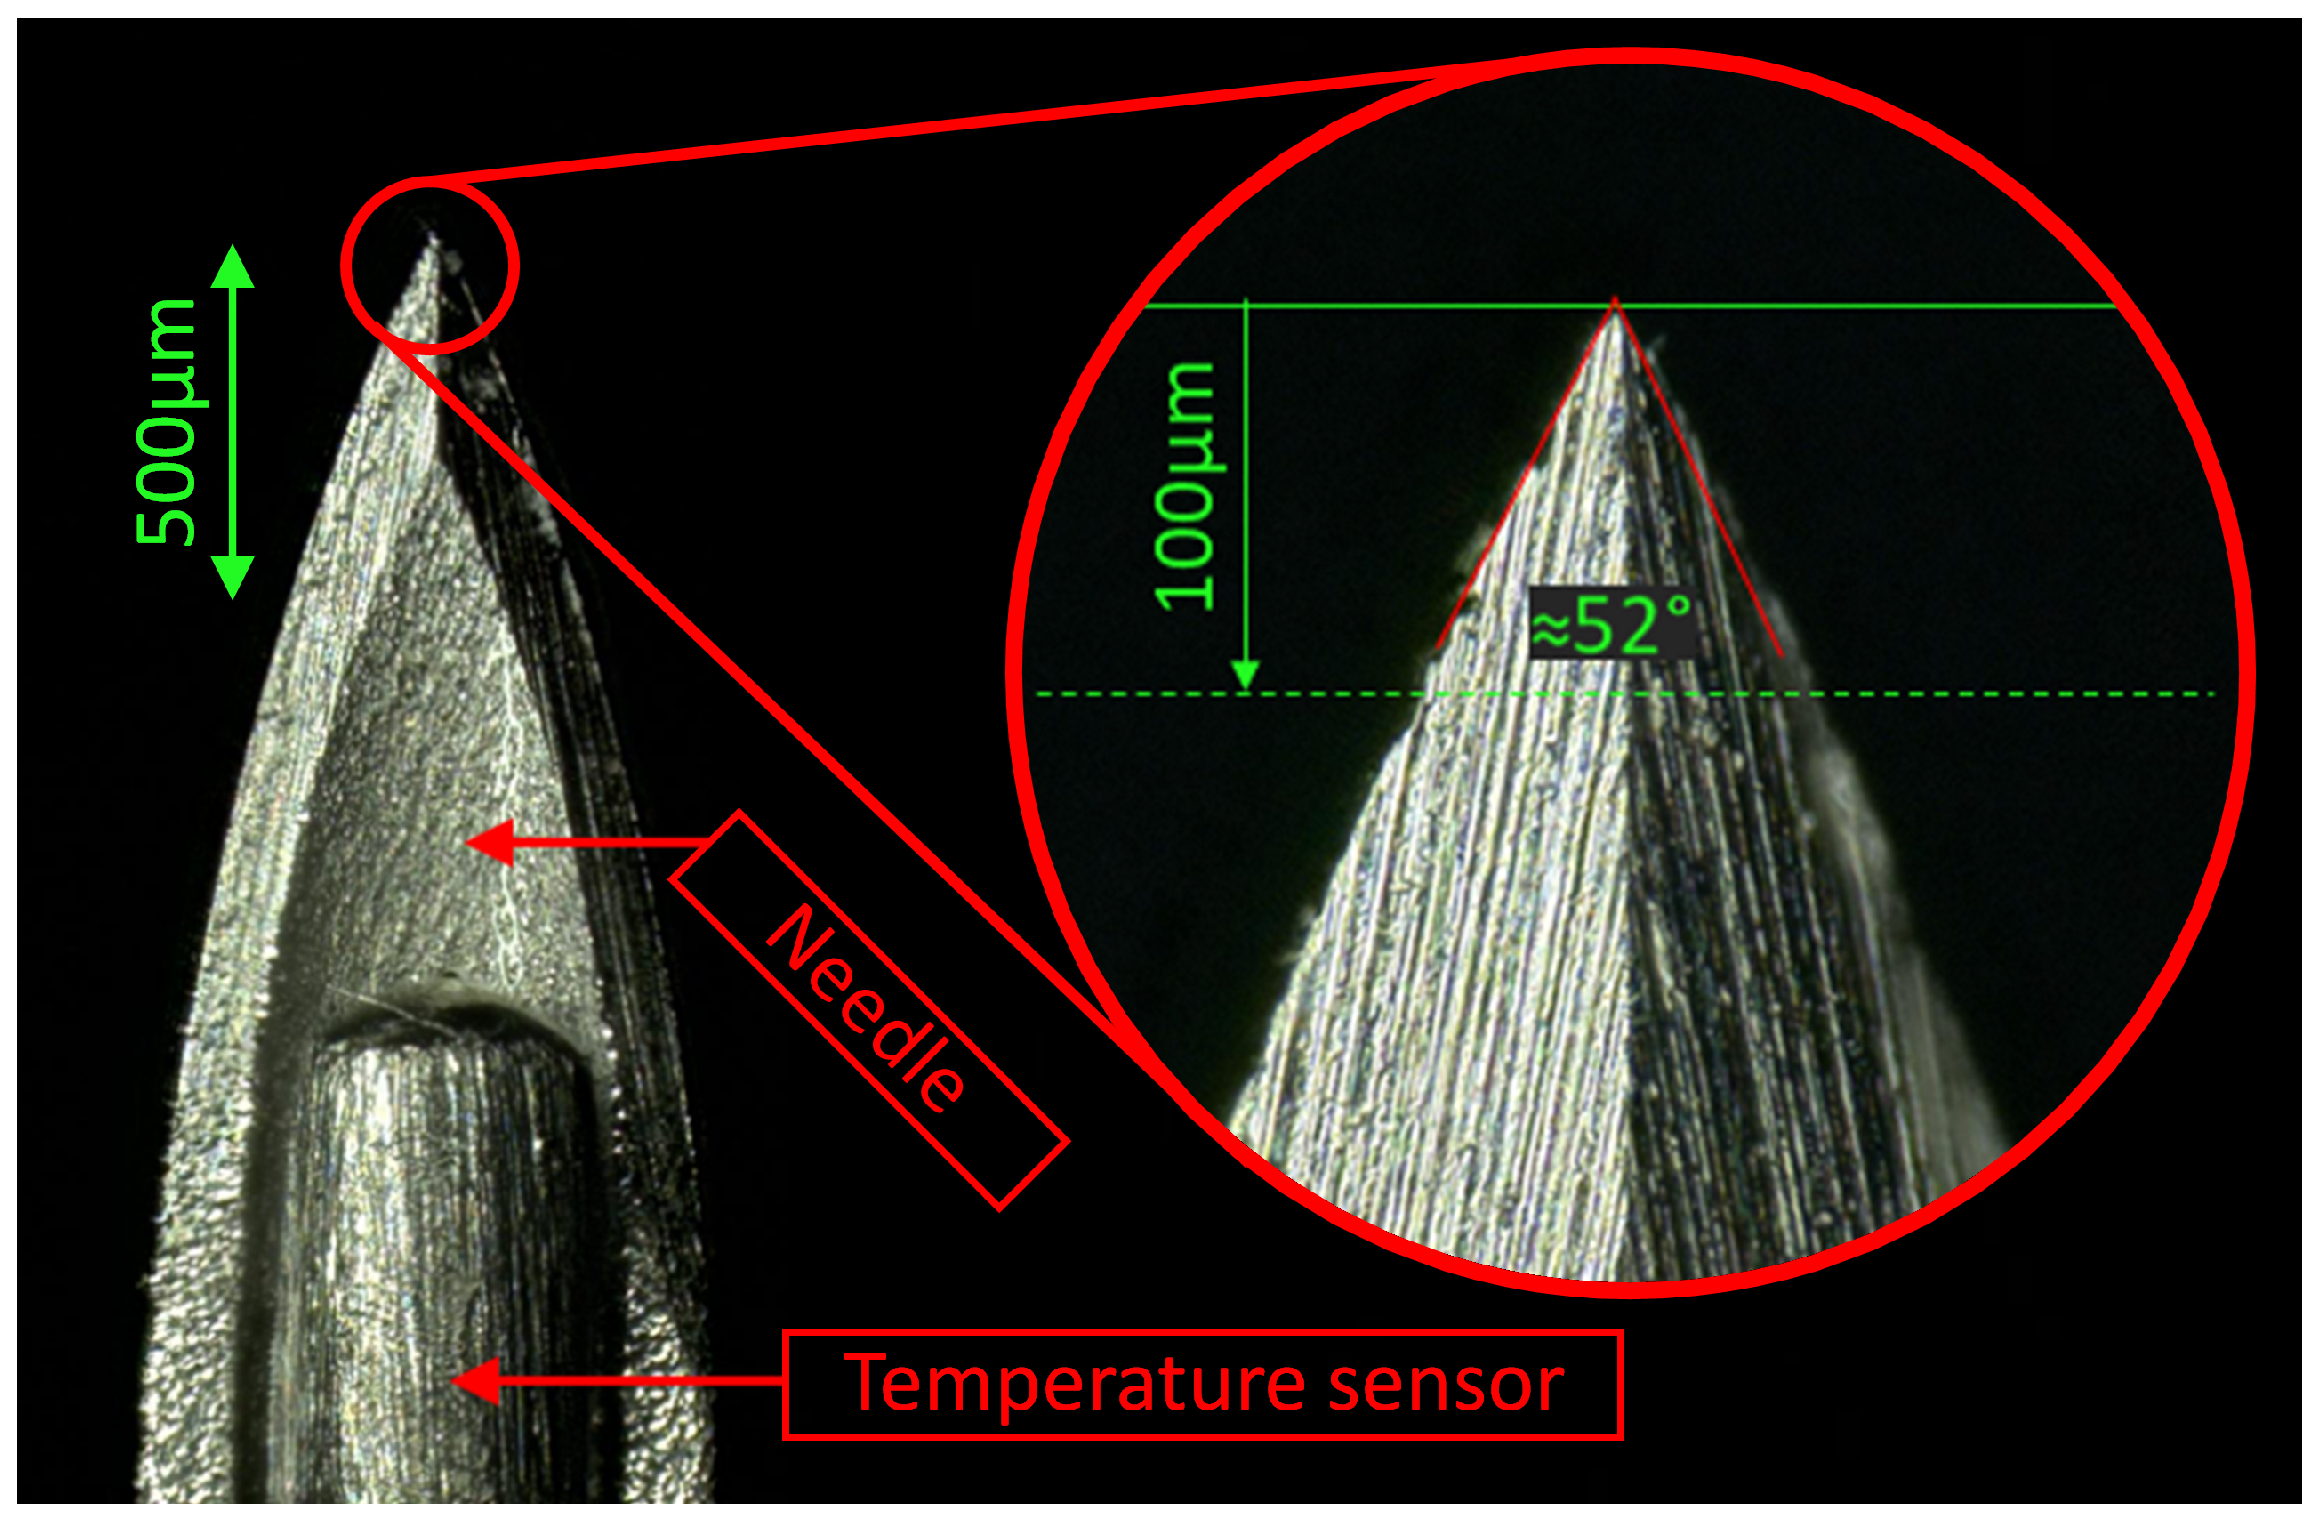
2.4. Needle Design
2.5. General Experimental Setup
3. Method
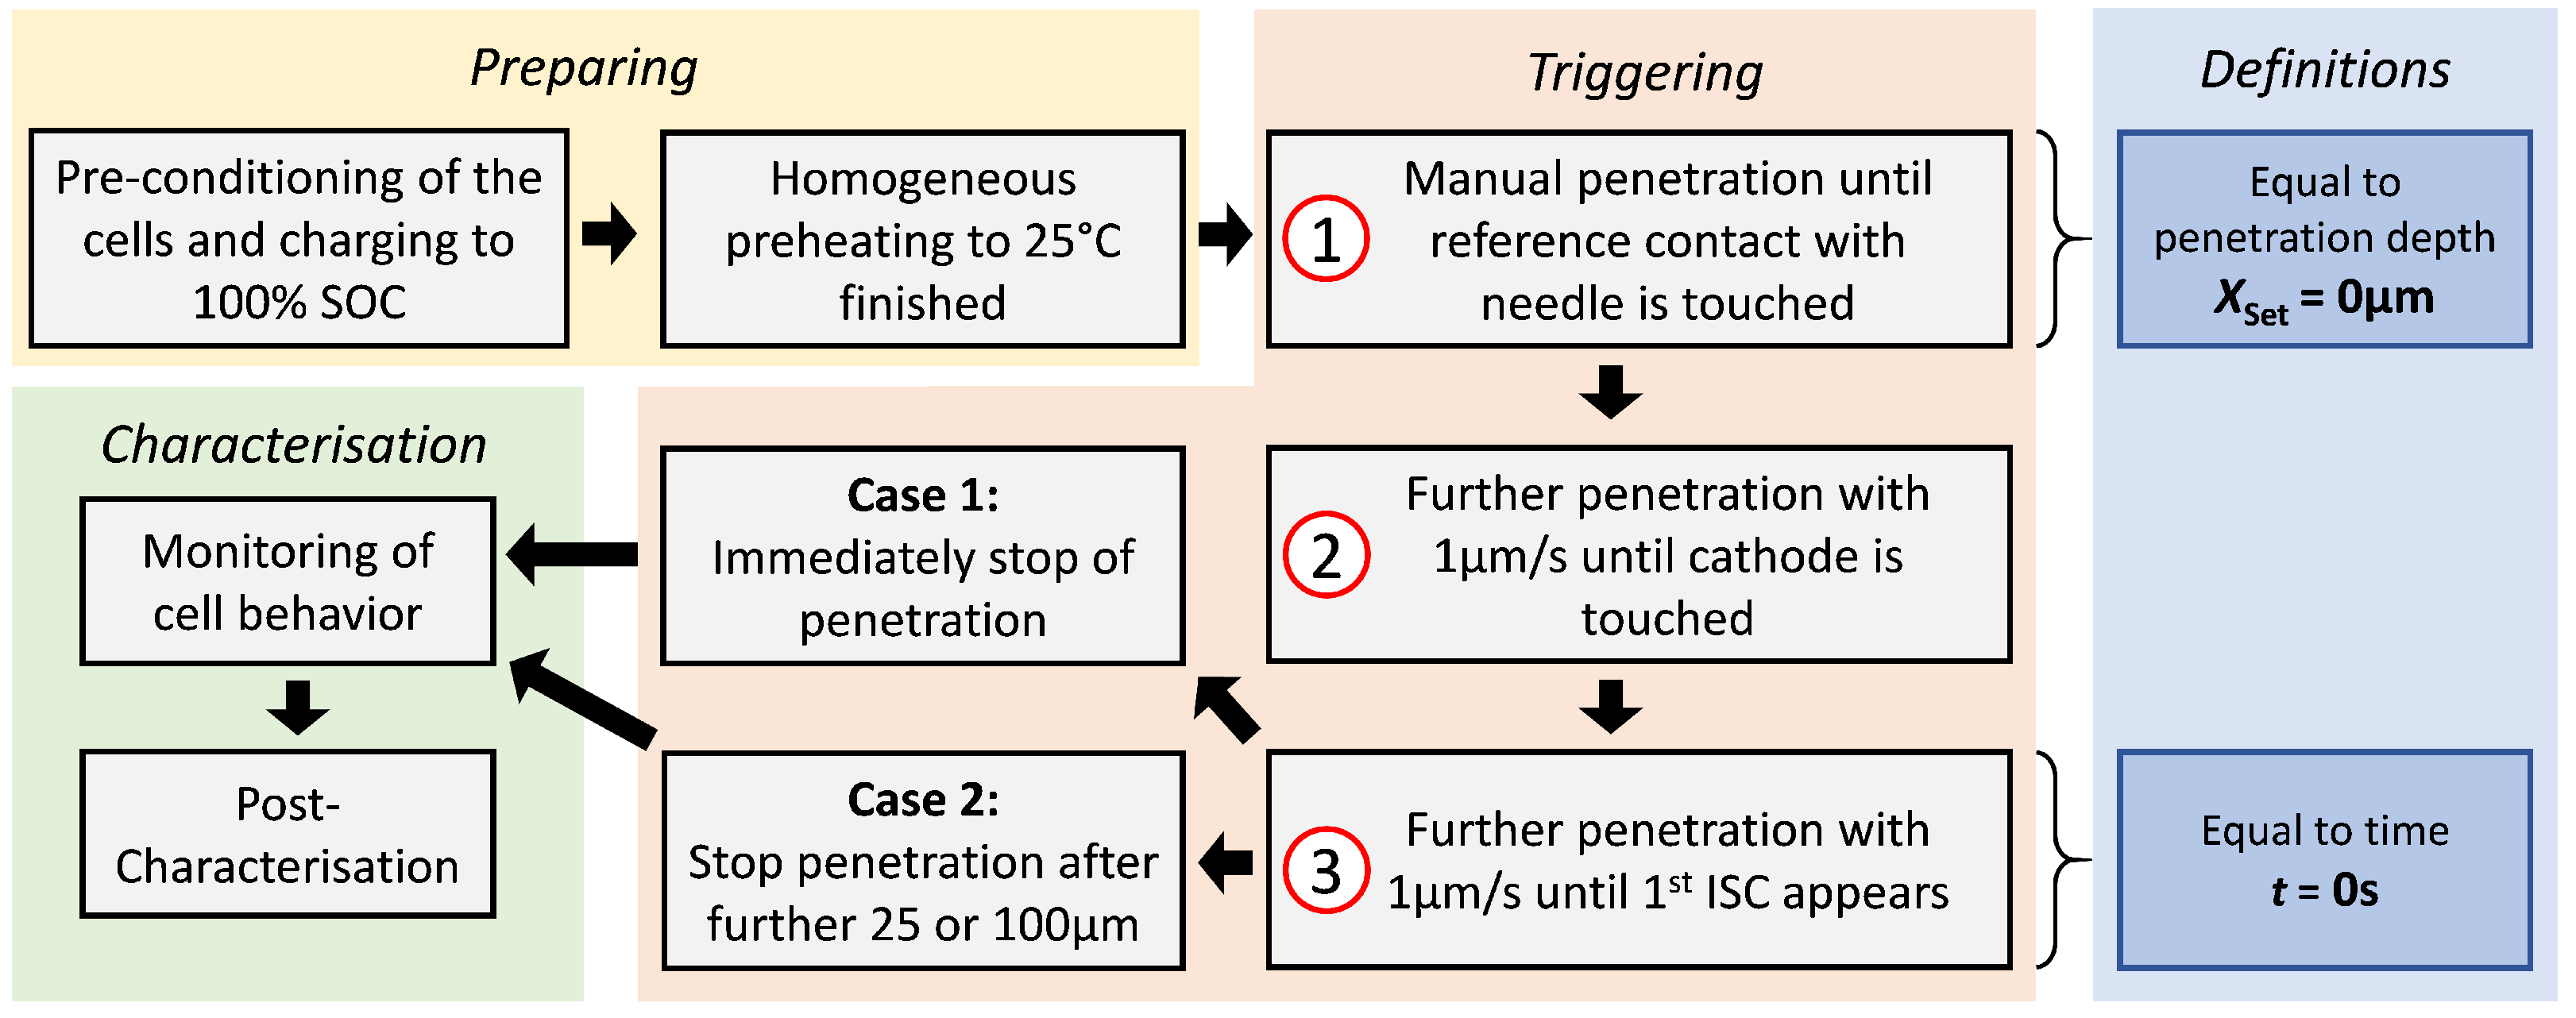
3.1. Experimental Procedure
3.2. Key Features to Describe the Short-Term Characteristics
3.3. Post-Characterisation
3.3.1. Electrochemical Post-Characterisation
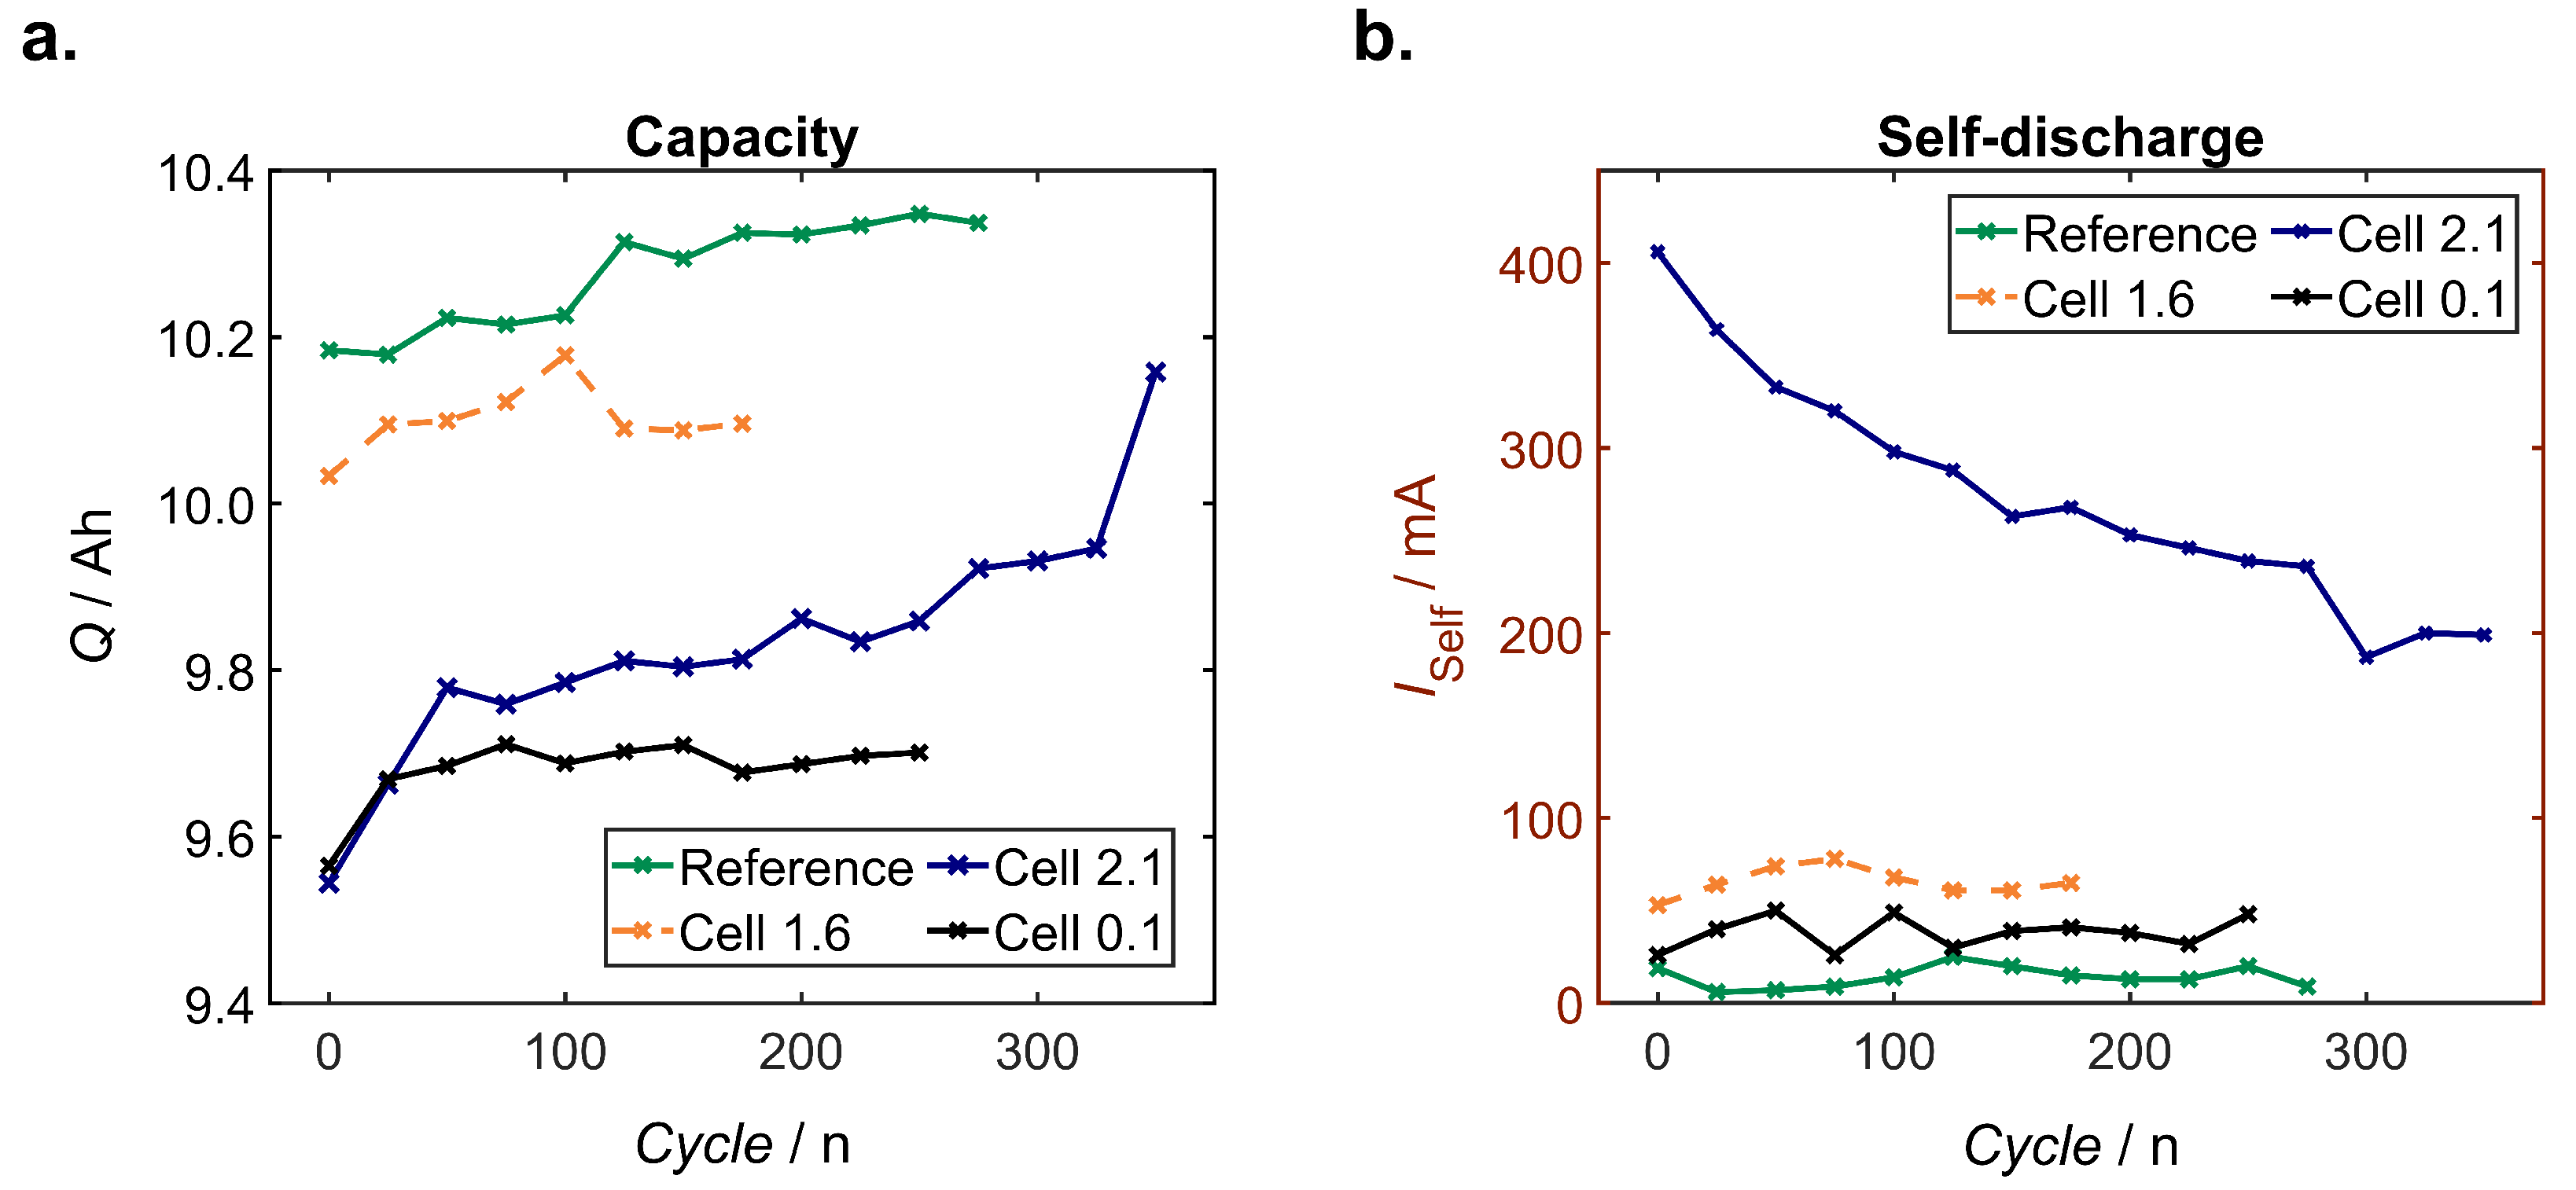
Self-Discharge
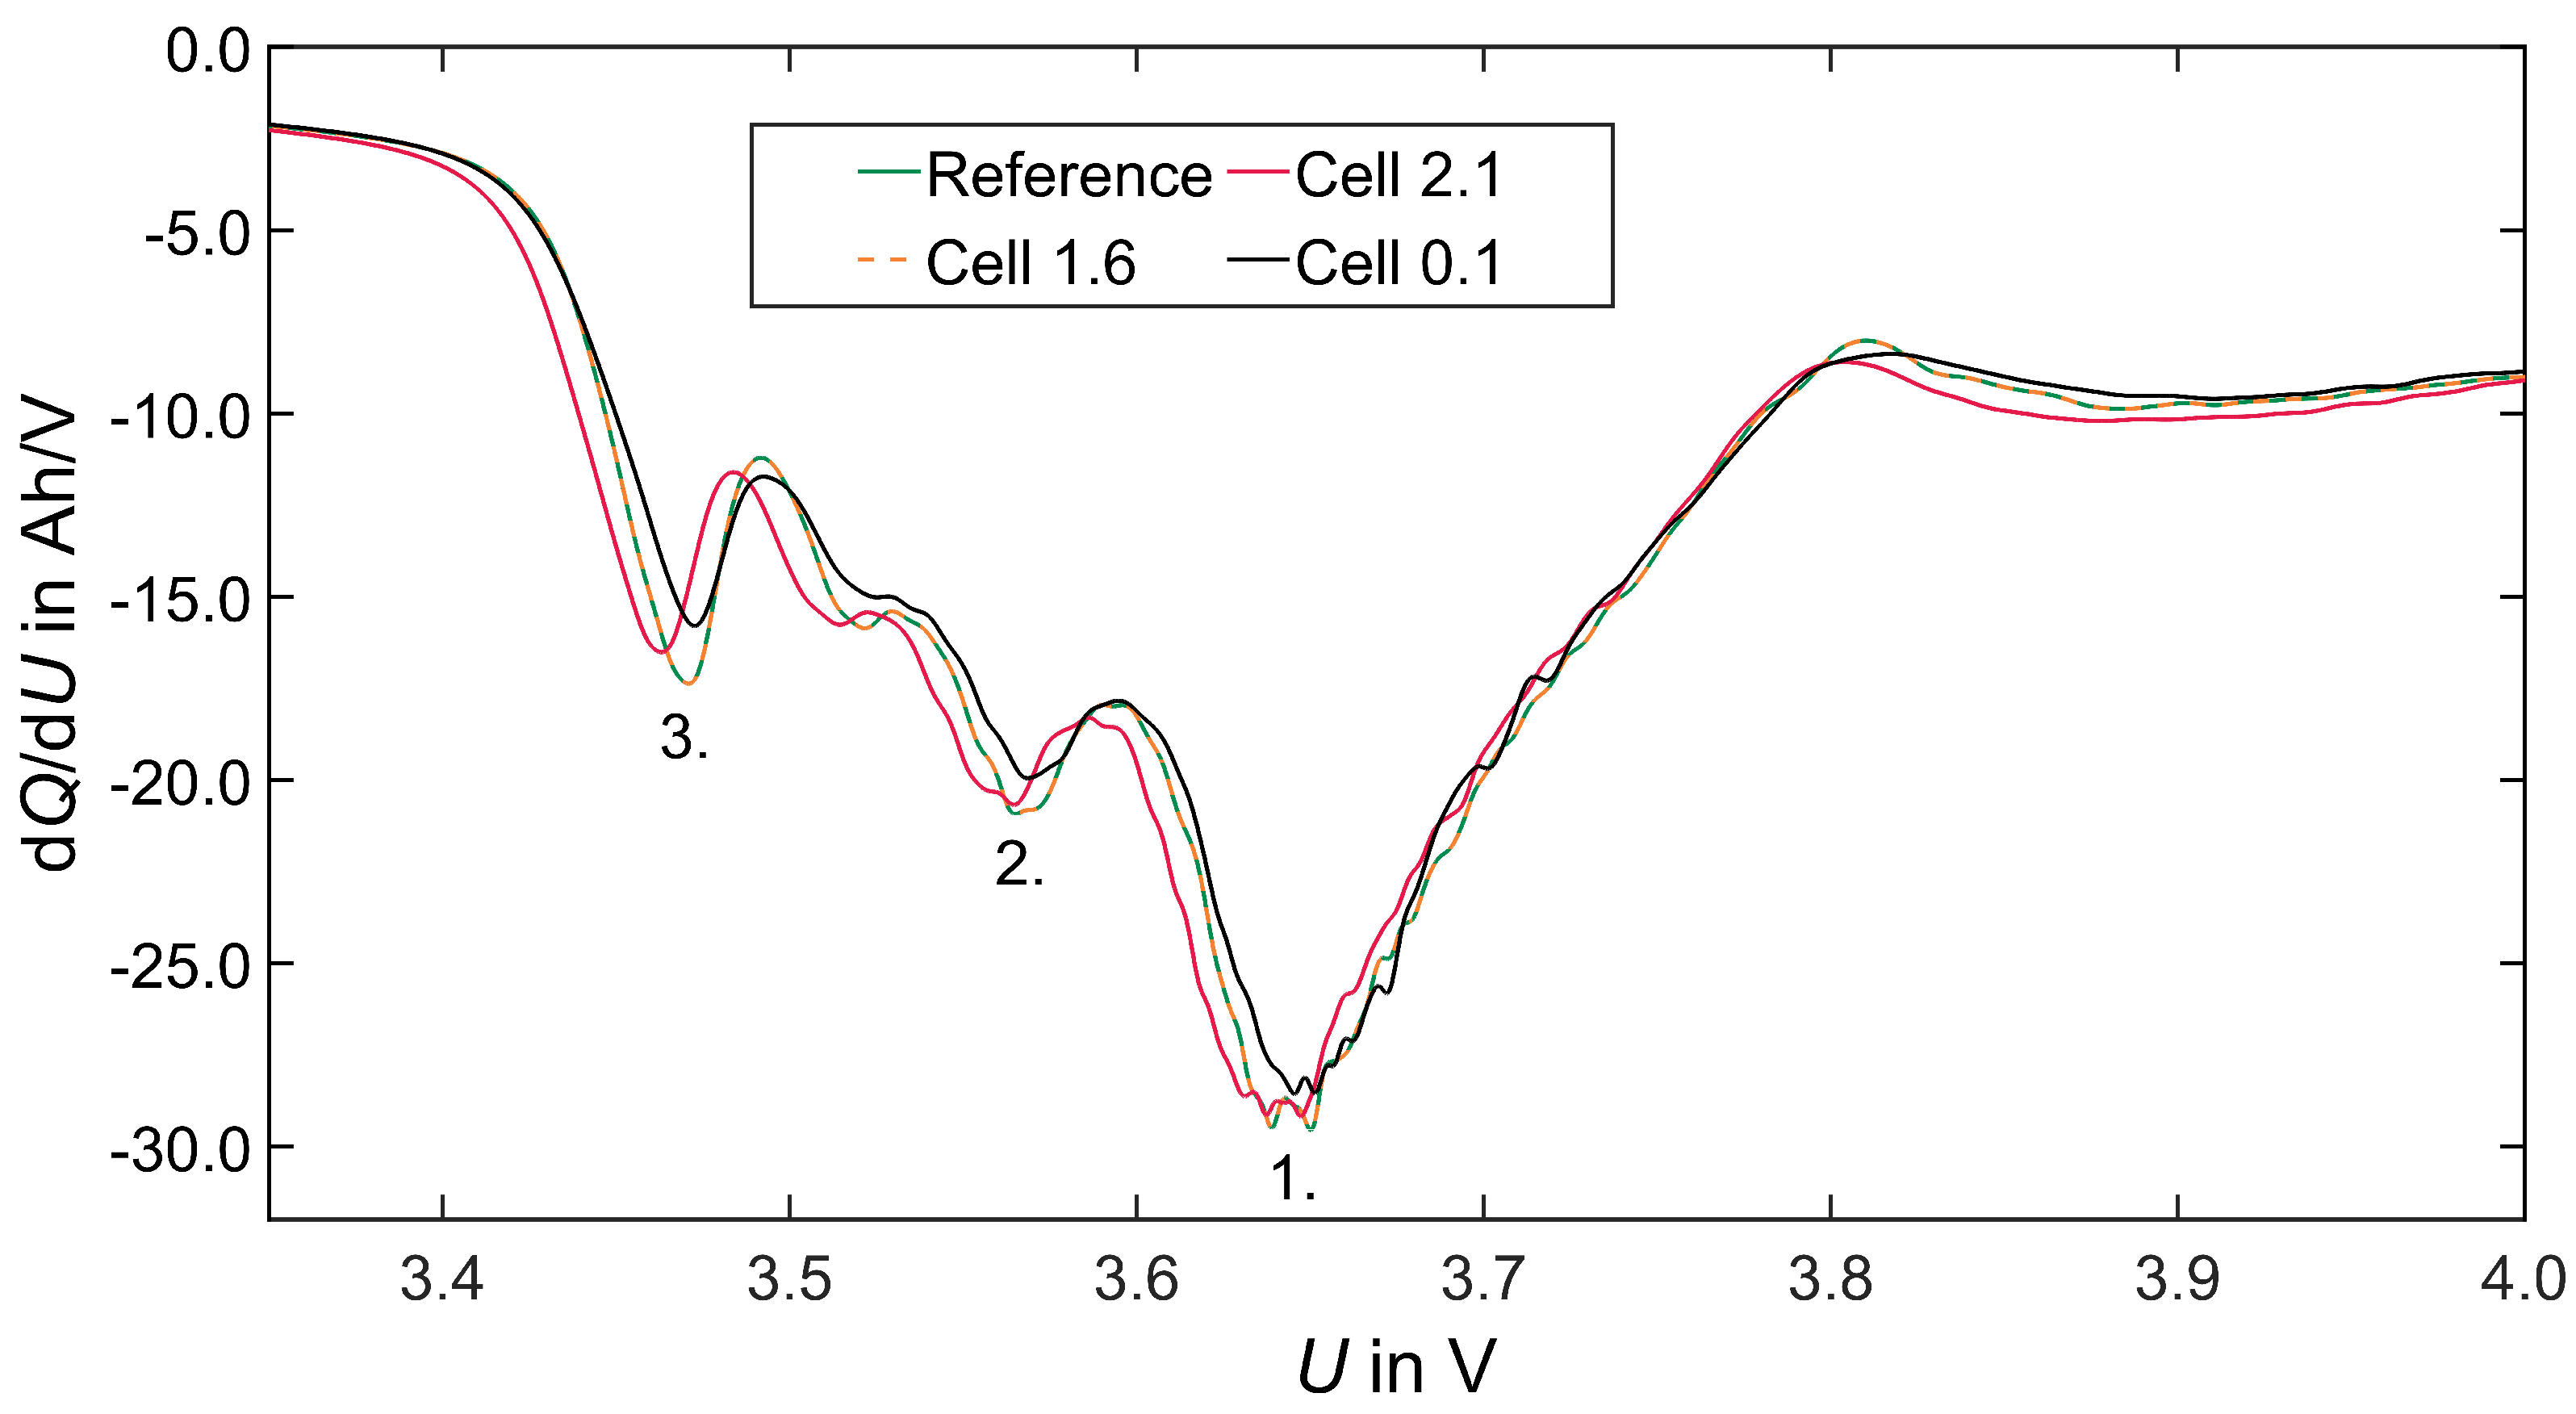
Incremental Capacity Analysis (ICA)
Pulse Characterisation
Cyclic Stability
3.3.2. Post-Abuse Analysis
- Photographing the considered layer;
- Determining the melted separator area using a millimetre paper as a scale reference;
- Checking if collector foil is pierced (yes/no).
4. Results
4.1. General Short Circuit Development and Characterisation
4.1.1. Geometric Trigger Conditions
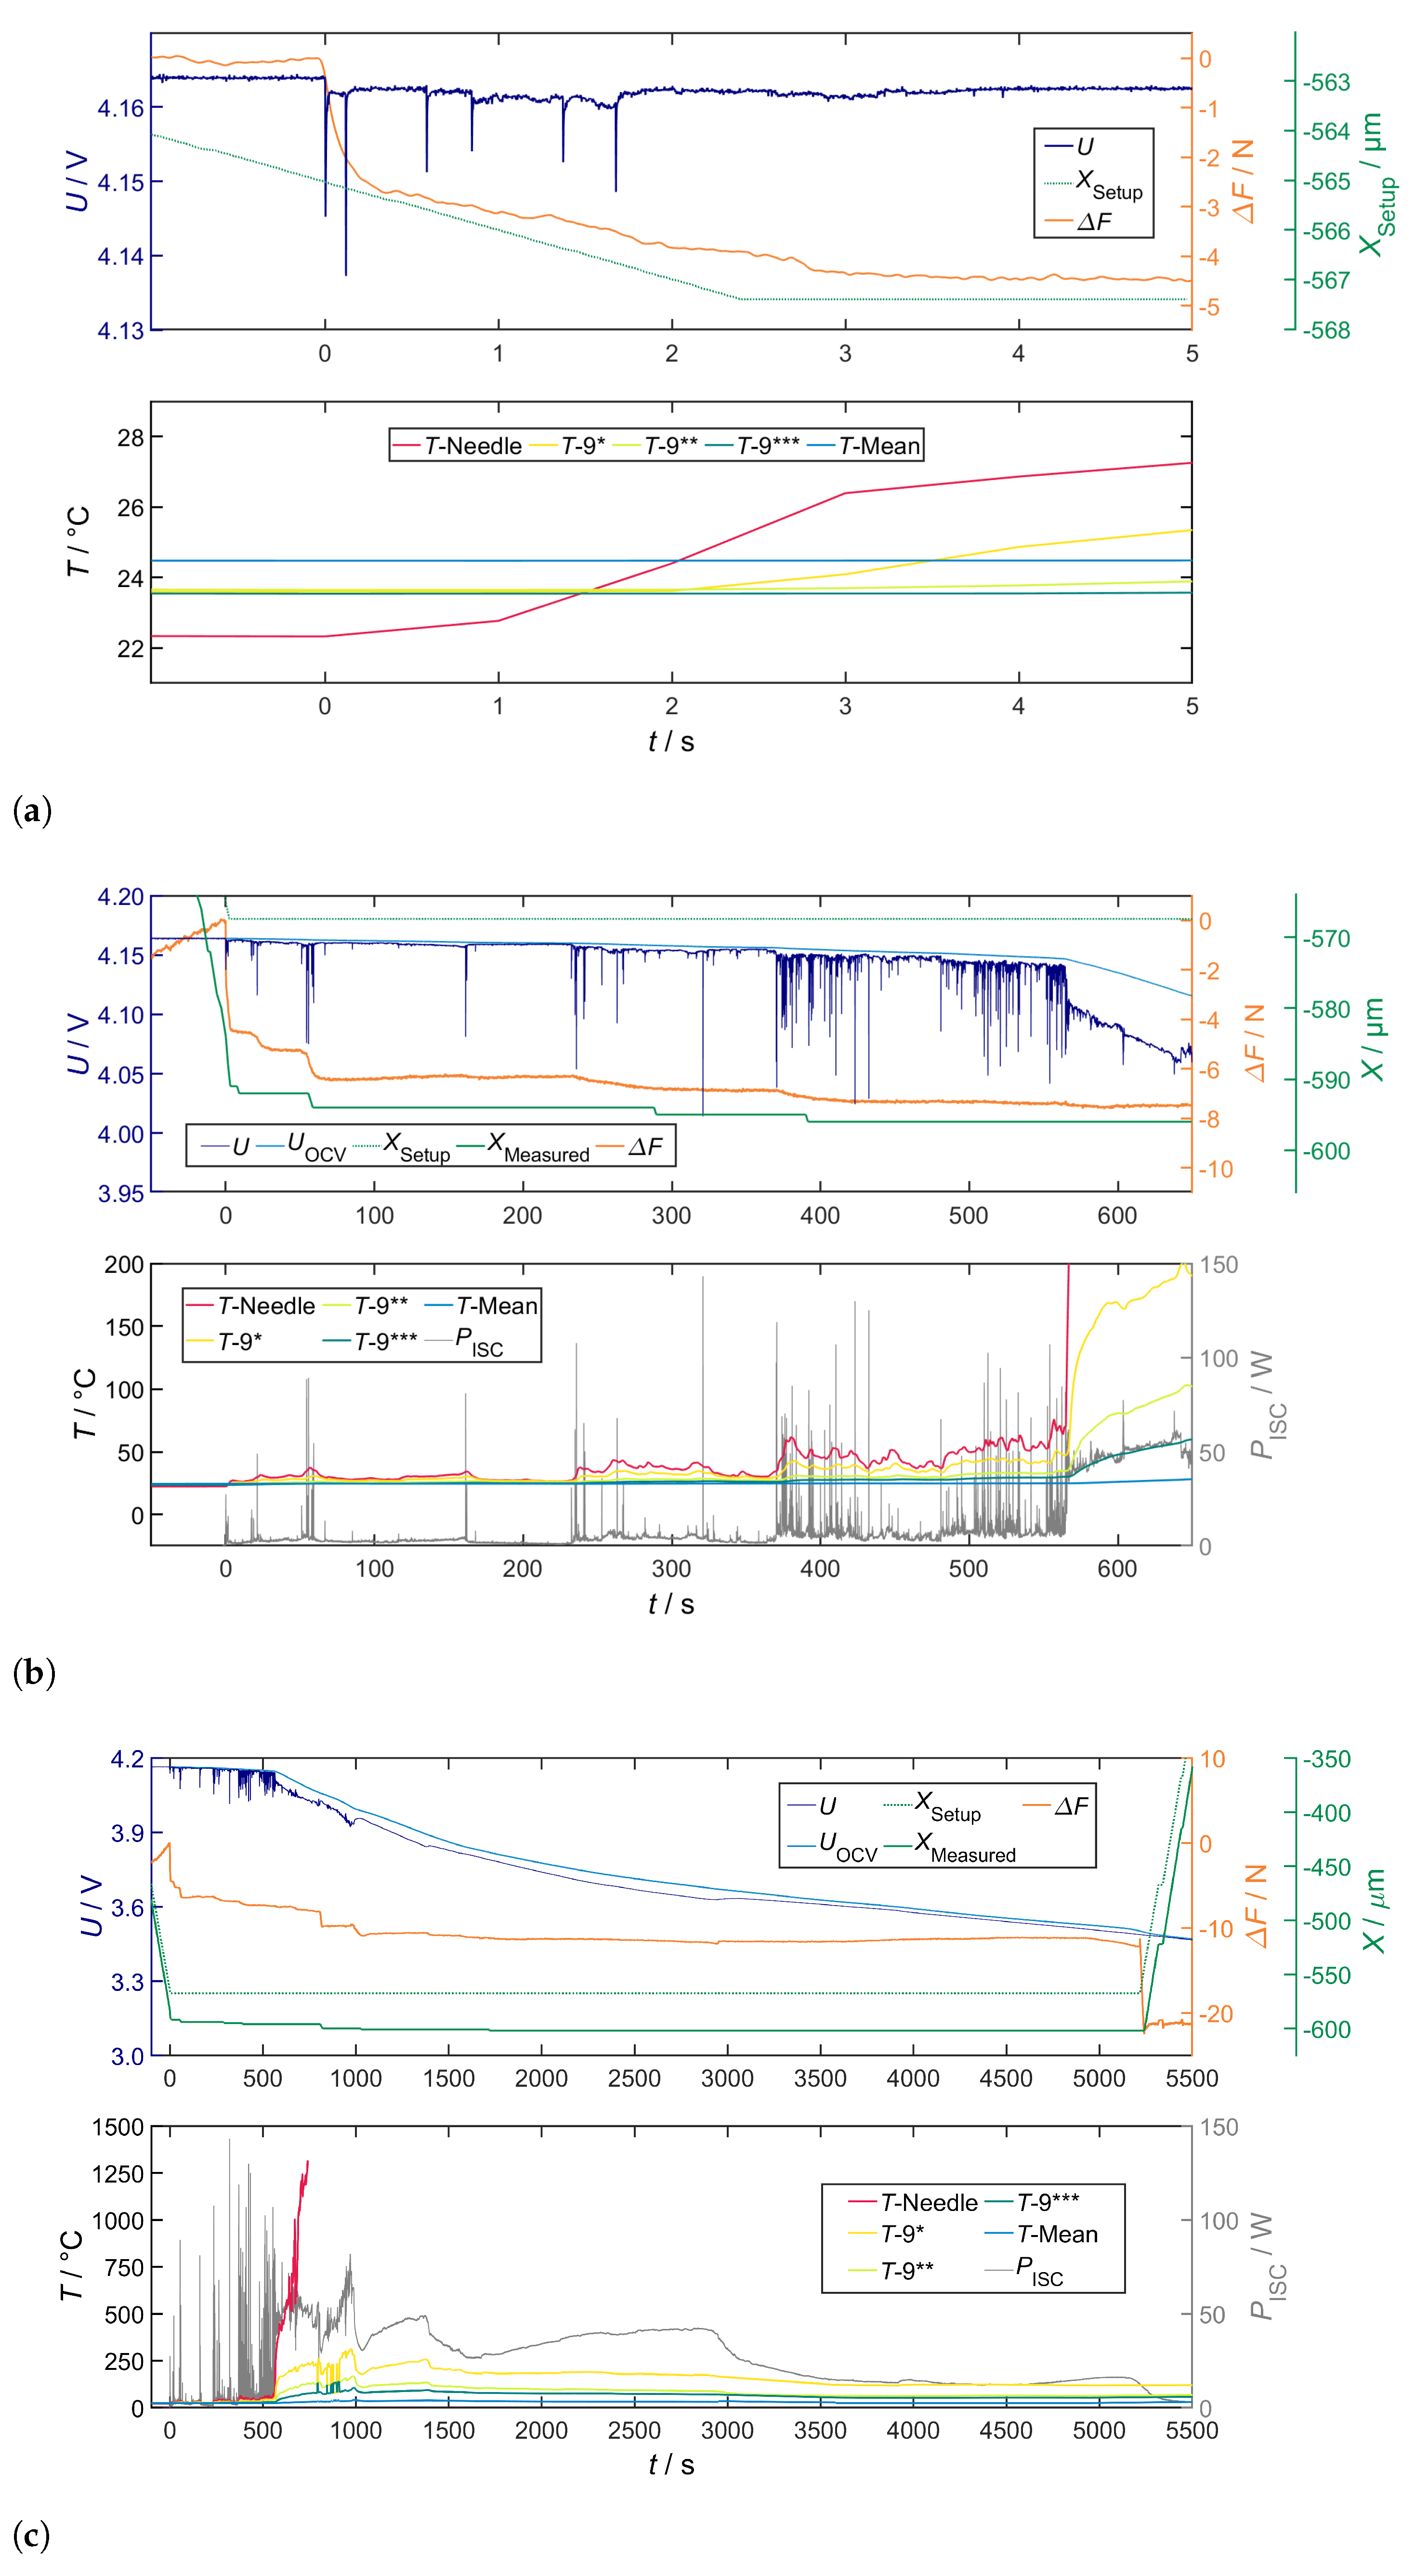
4.1.2. General Characteristic
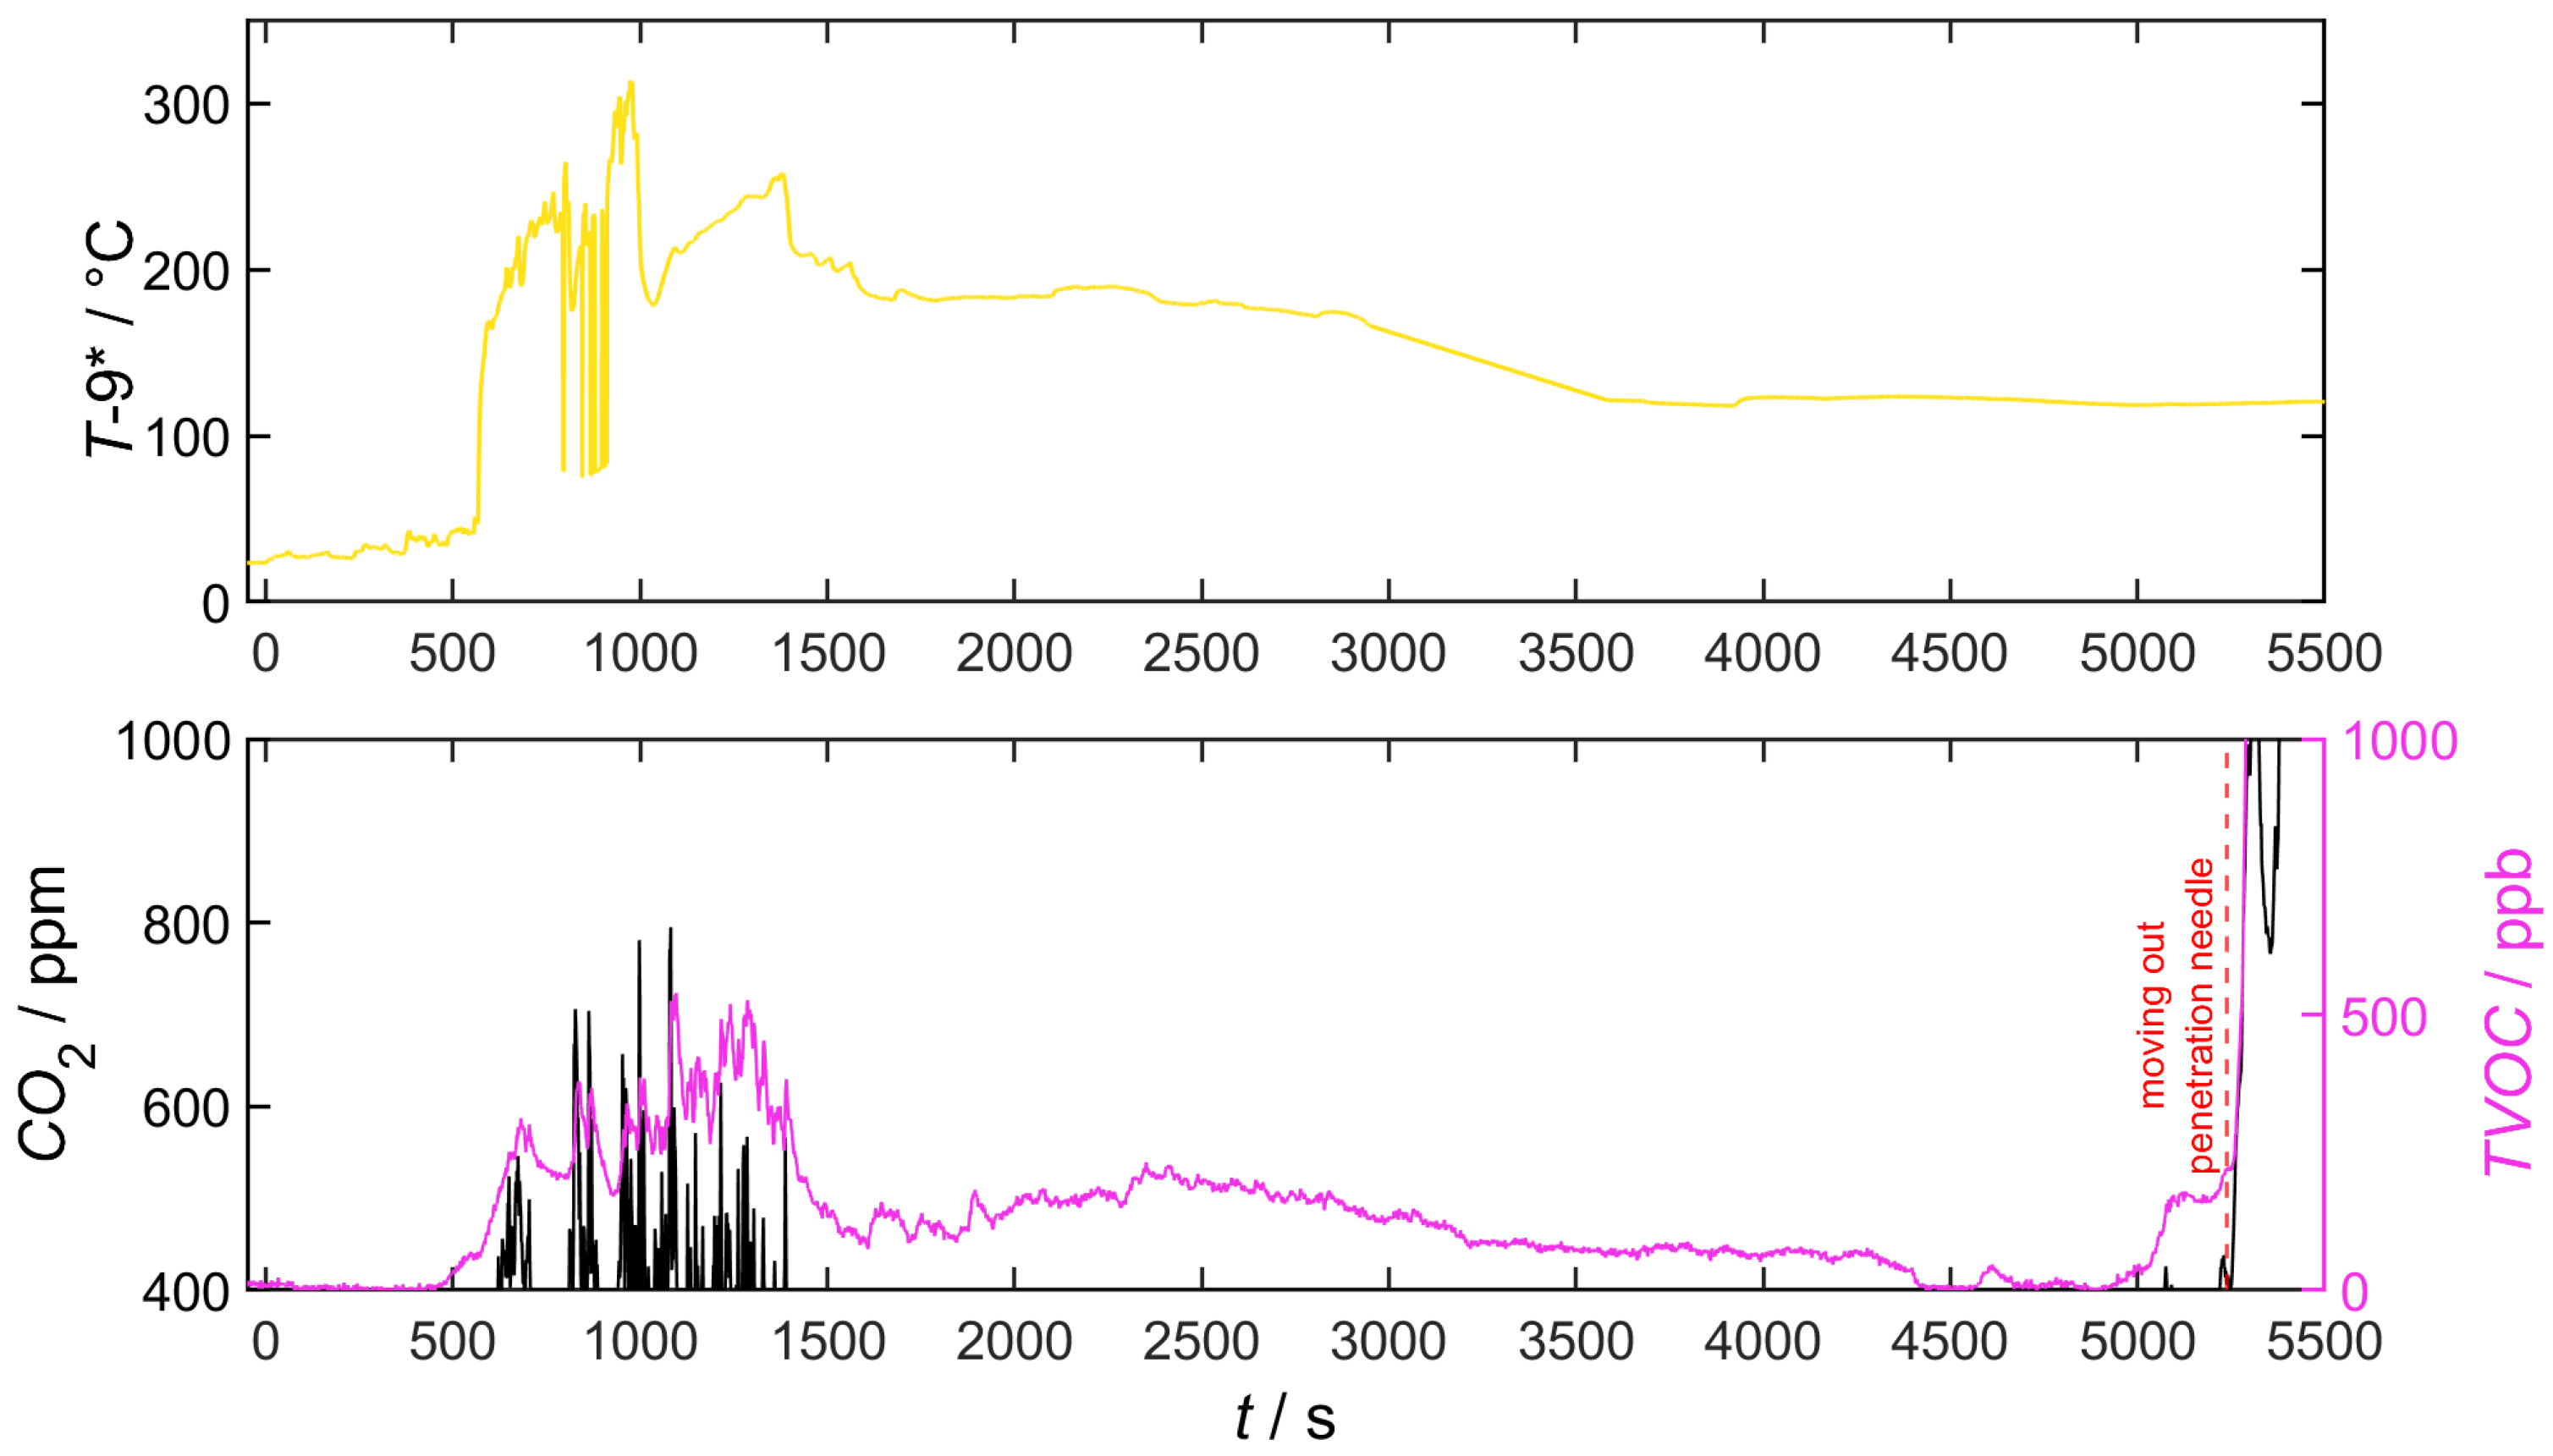
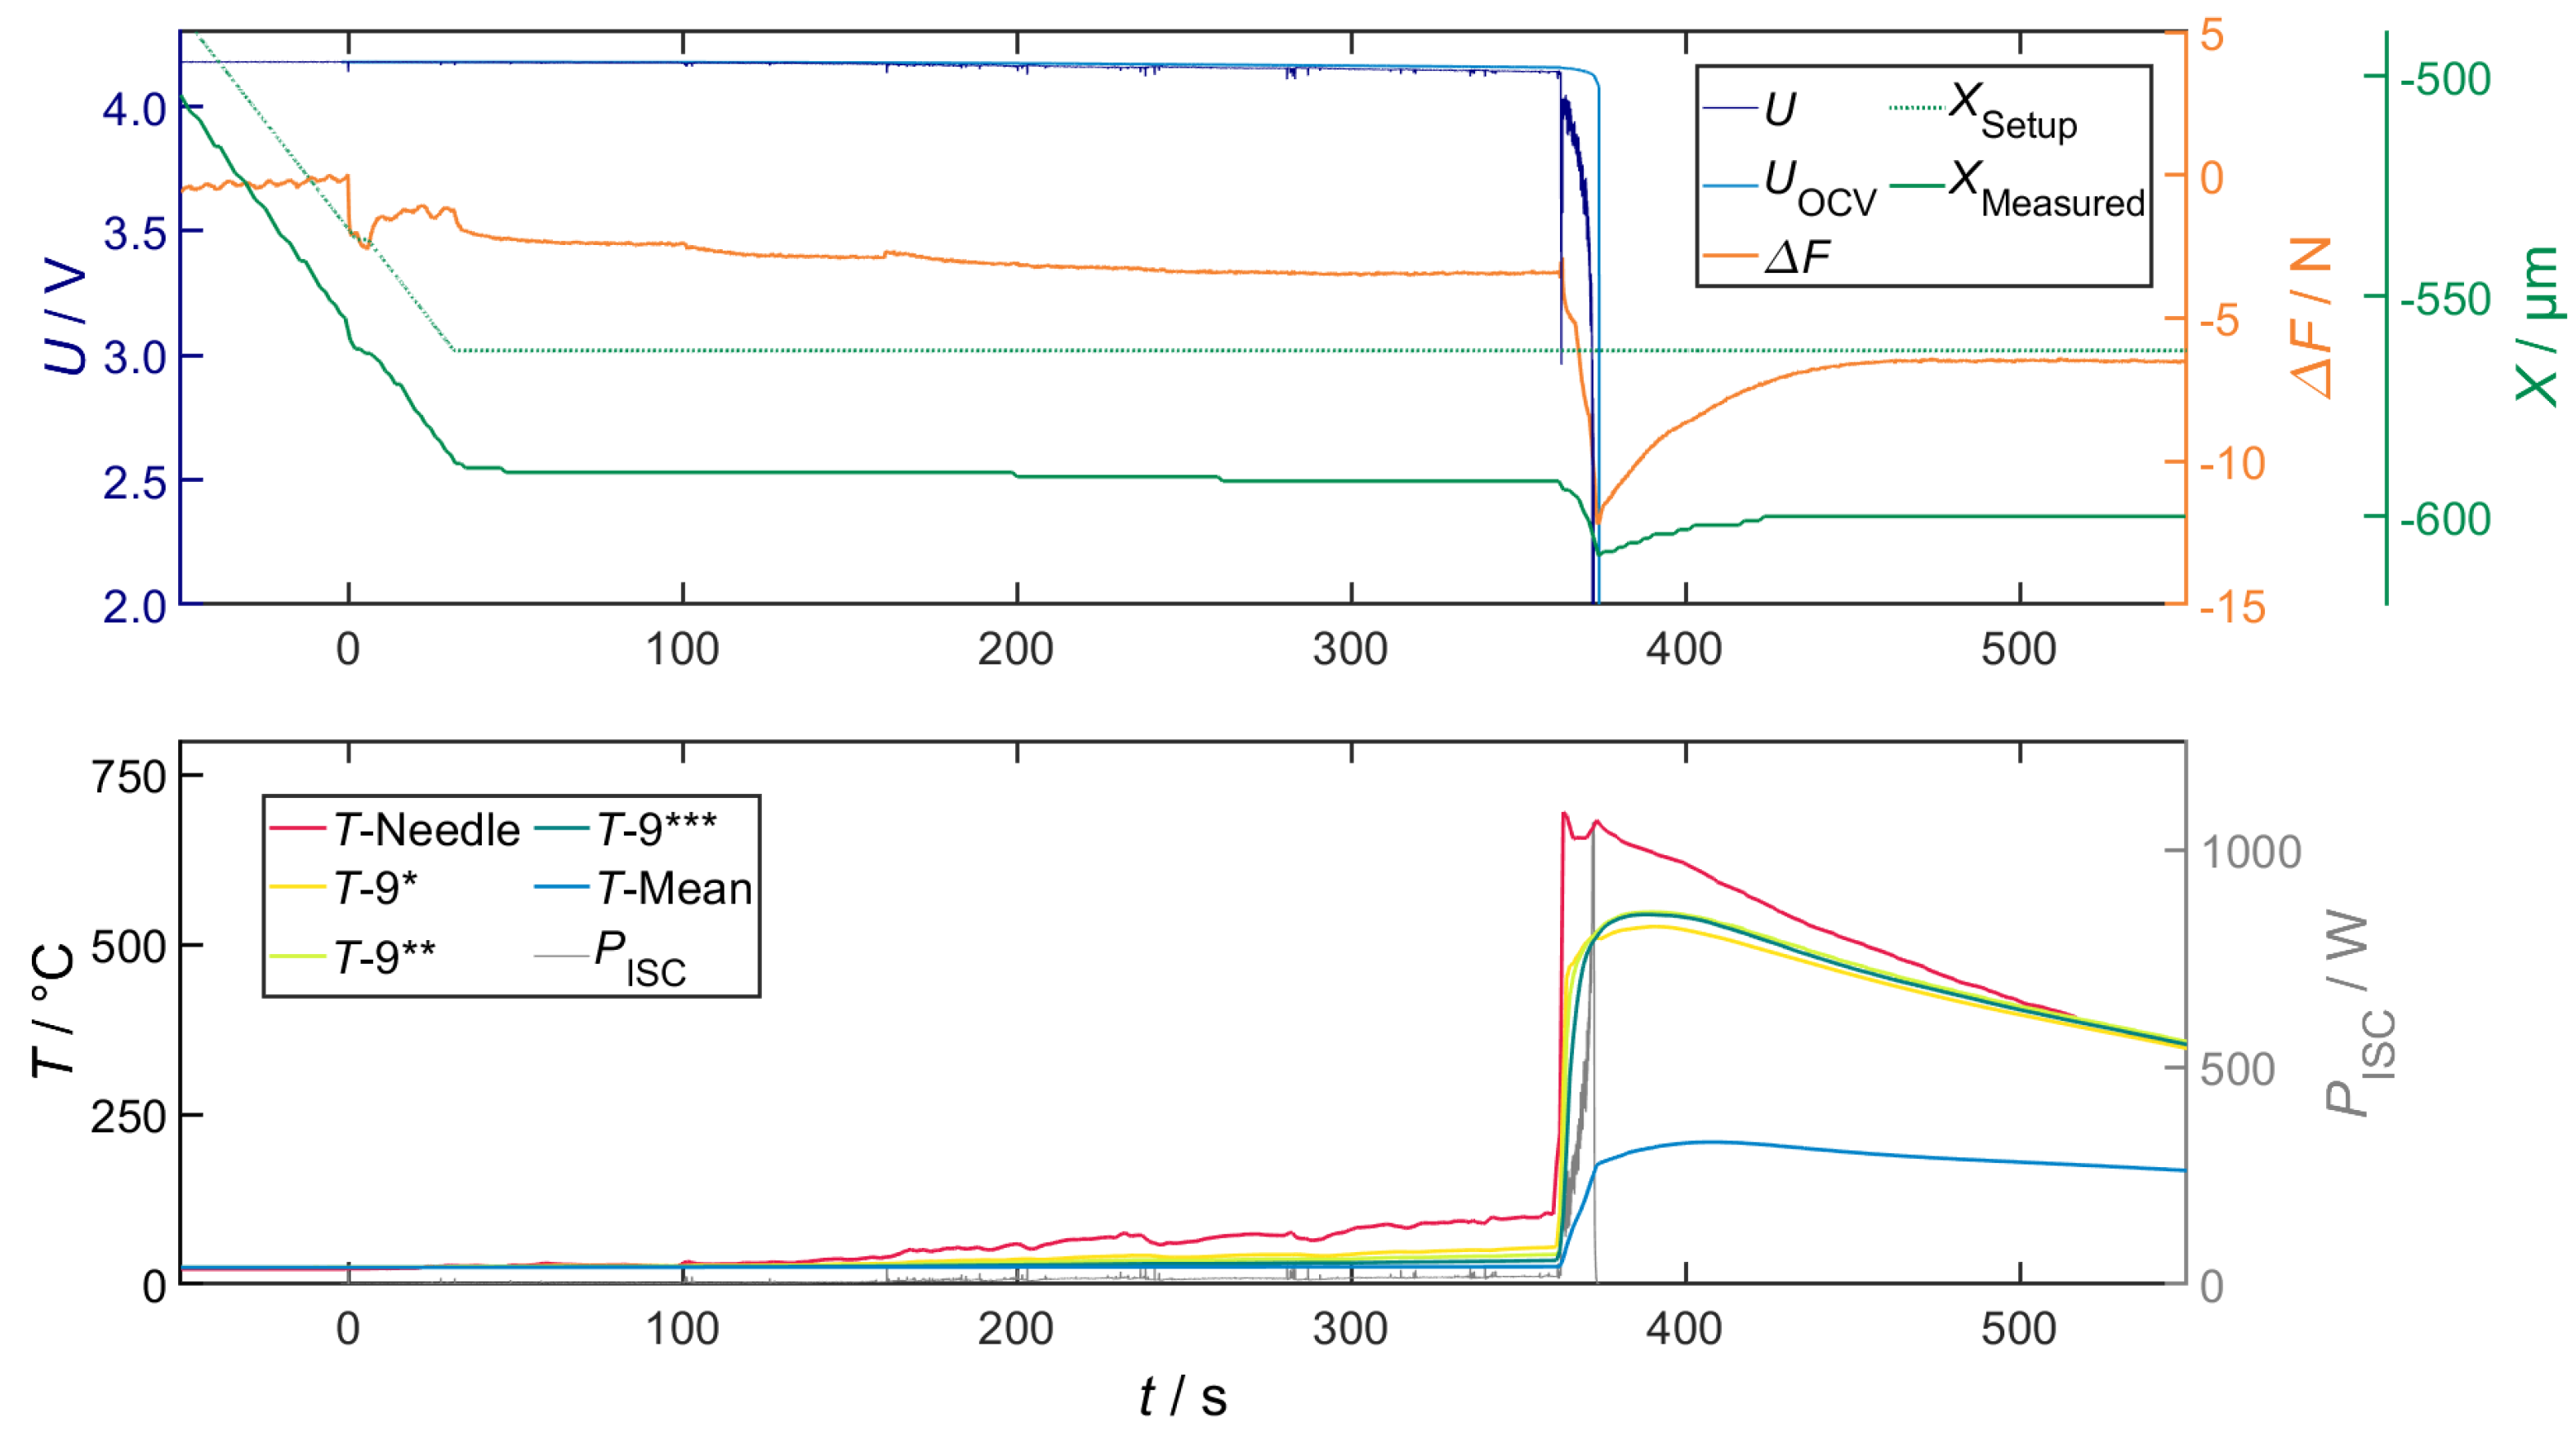
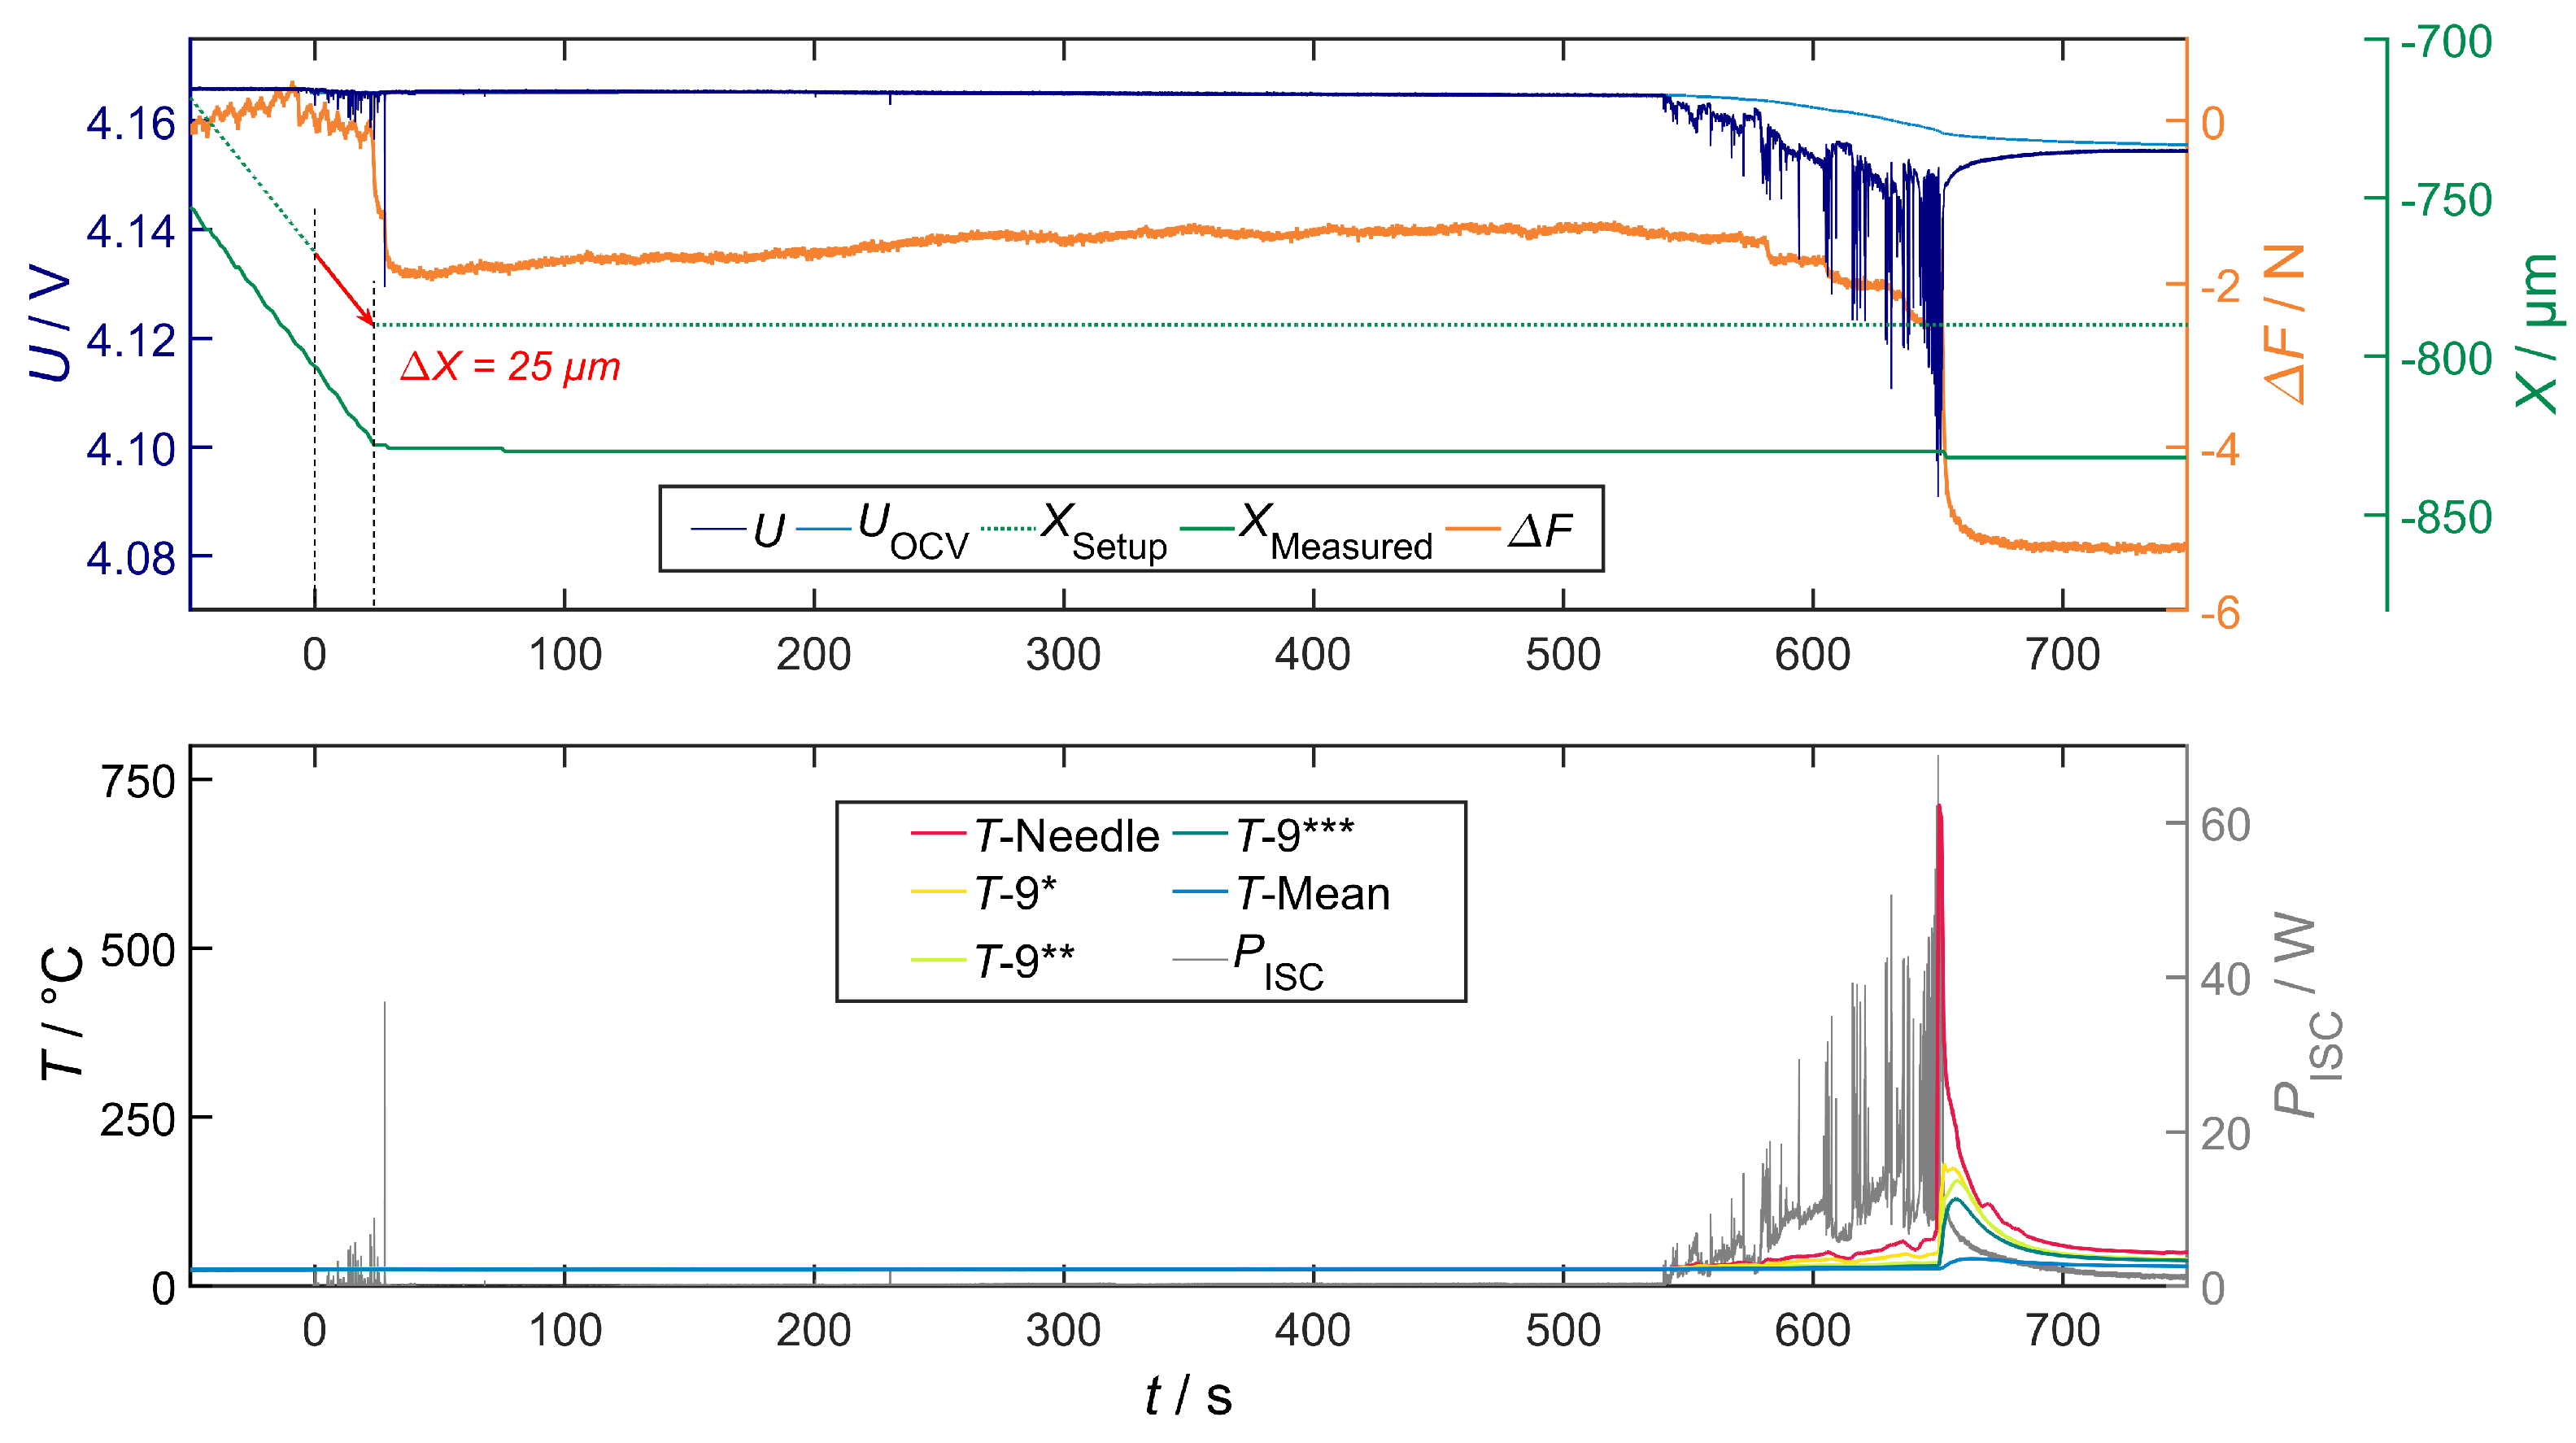
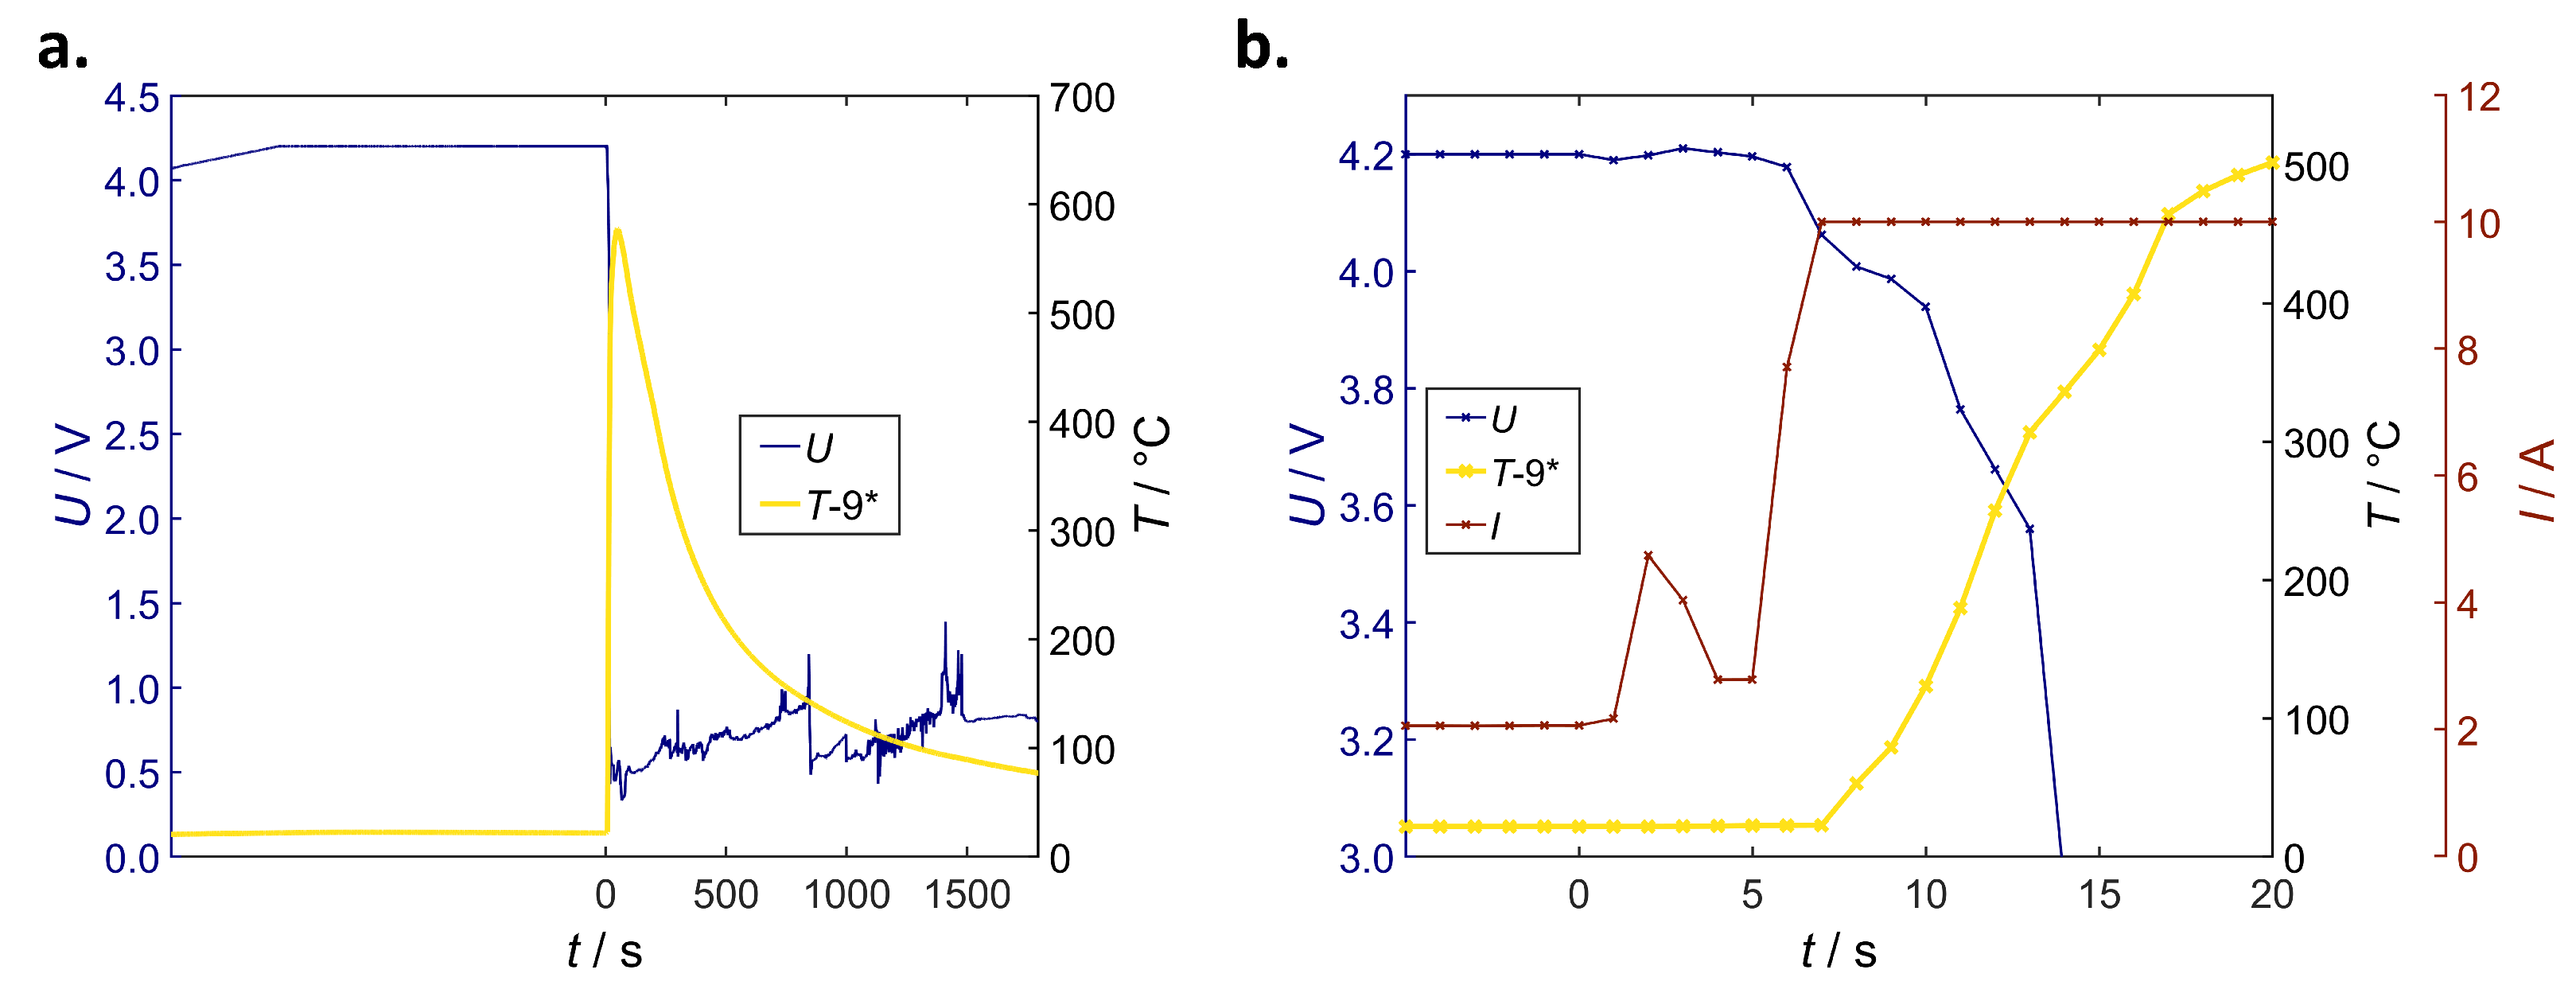
Correlation of Voltage Drop, Joule Heat and Temperature
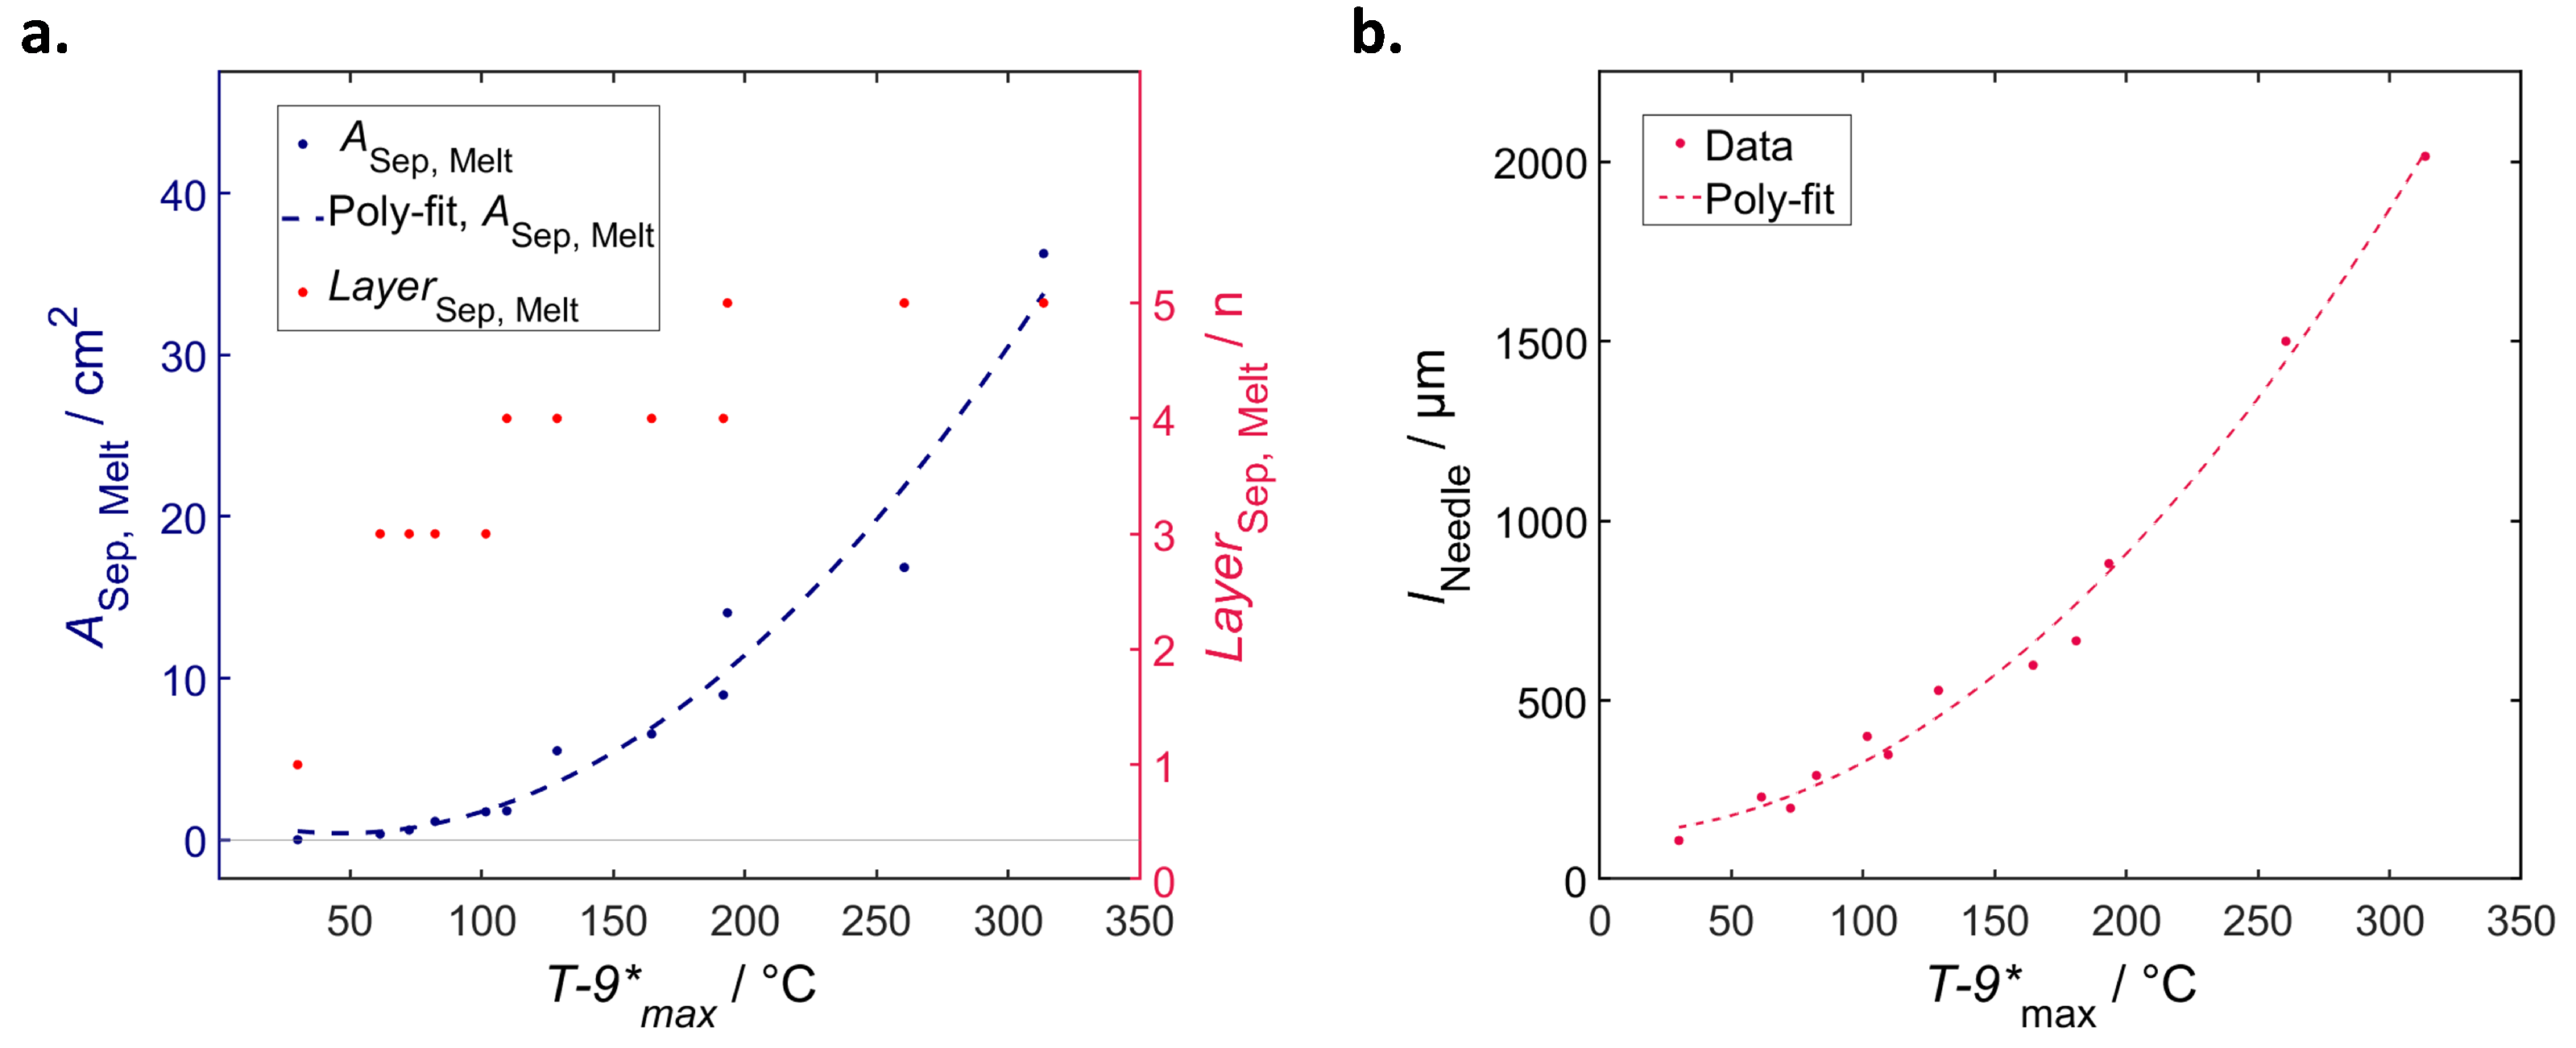
Correlation of Temperature and Local Structural Damage
Overall Characteristics
4.2. Influence of Penetration Depth
4.2.1. Penetration Depth of 0 m
- In experiments 1.2–1.6, there was a dynamic development of the ISC (type IIa), in which the most severe ISC occured within 116 s (cell 1.2) and 337 s (cell 1.3) after the first ISC.
- The maximum internal short-circuit currents of cells 1.2–1.6 were between 11 A and 38 A.
- Local temperatures () above the decomposition temperature ( °C) of the cell components did not necessarily lead to a TR (cell 1.6). The measured temperatures at the needle were typically above 500 °C.
- The characteristic formation of a constant ISC for type IIa occurred with a clear delay (567 to 992 s) in the high SOC (85 to 97%).
- Corresponding to the highest temperatures, a mass loss of 0.3% was measurable only for cell 1.3 ( °C) and of 3.52% in case of cell 1.6 ( °C).
4.2.2. Penetration Depth of 25 m
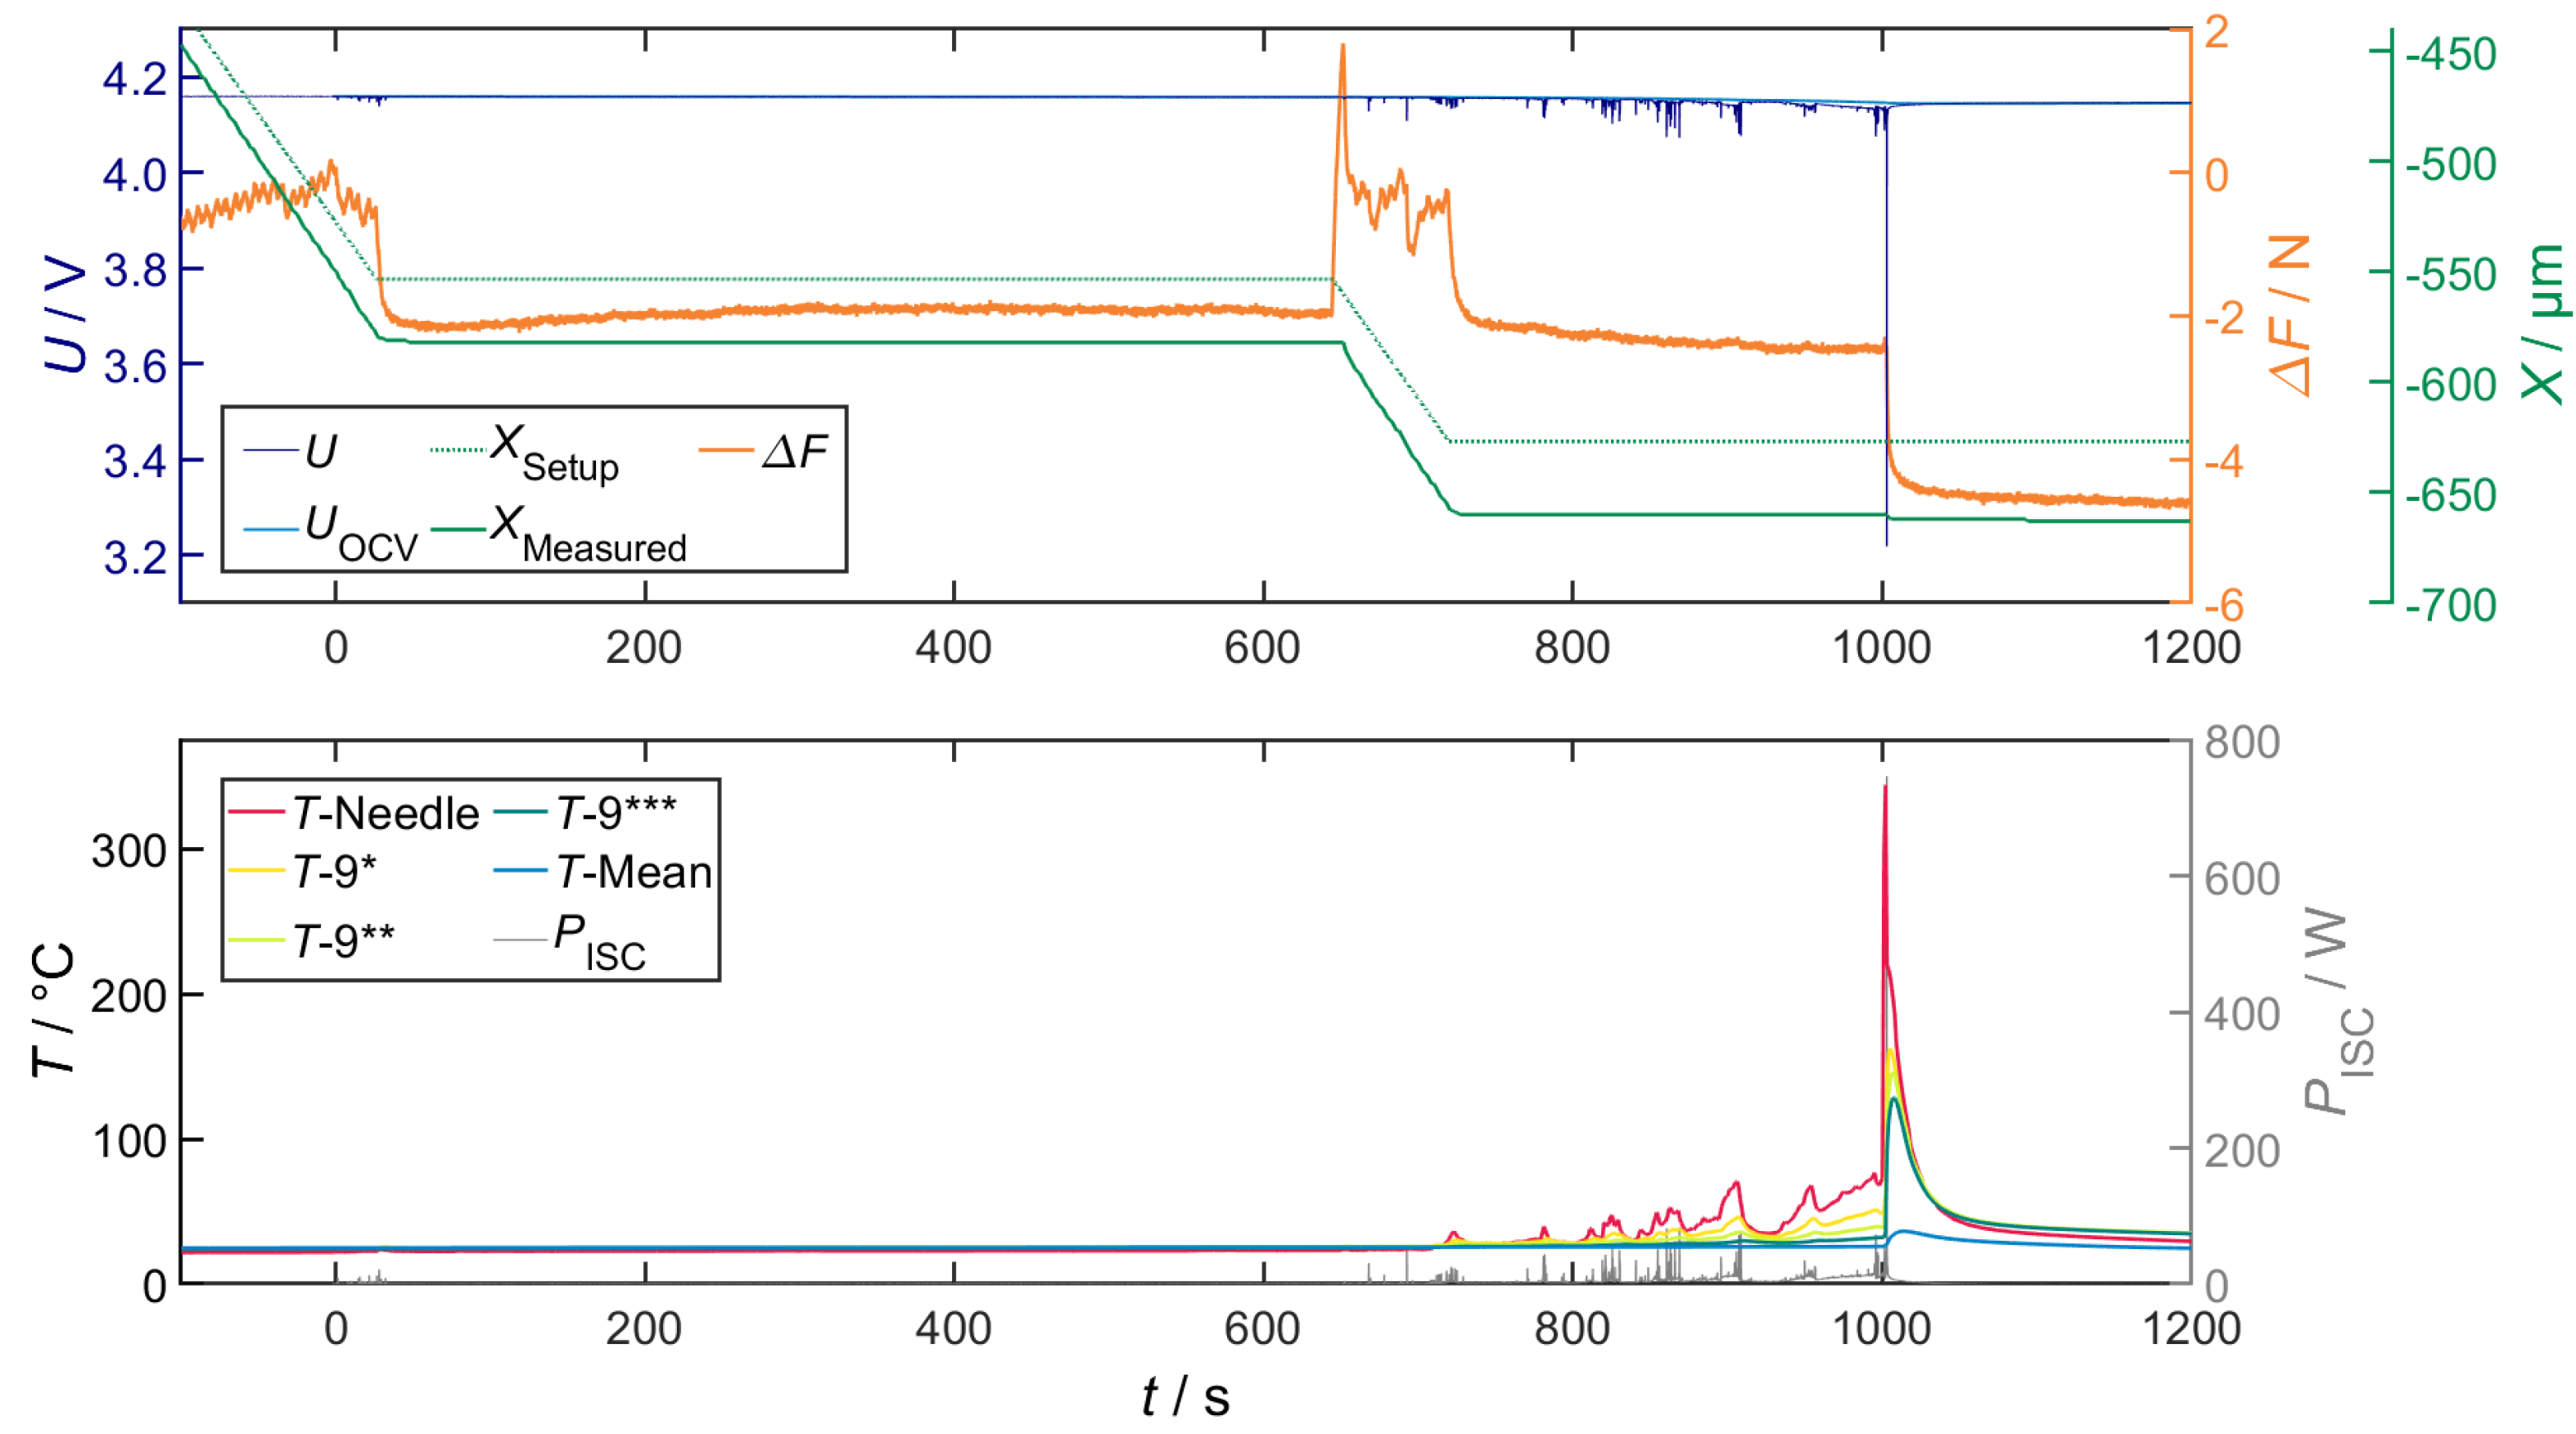
- In the experiments of cells 2.1–2.5, the most severe ISC with a joule heat () from 48 to 80 W was in the same range. However, the time of occurrence was very different (cf. for cell 2.3 and for cell 2.4).
- The characteristics of cell 2.1–2.5 correspond to type IIa, which only appeared with a significant time delay (500 to 965 s).
- Cell 2.6 showed an abrupt drop of the voltage below 3 V after 363 s. The released maximum joule heat was 884 W. At this point, the cell was still almost fully charged, with over 98% SOC. The heat released by the powerful ISC initiated exothermic side reactions and caused a TR. Just 9 s later, the cell voltage dropped to 0 V (type IIb). The corresponding curves are shown in the Appendix A in Figure A2.
4.2.3. Penetration Depth of 100 m
- In four out of six tested cells, a TR developed from the dynamic ISC (type IIb). Here, the joule heat () of the ISC was more than 800 W;
- Many cell components combust in the TR, and consequently, the cell mass was reduced by 52 to 58%. The maximum temperature () was between 540 to 607 °C;
- For cells 3.1 and 3.2, a constant ISC (type IIa) developed from the dynamic ISC behaviour. This process occurred with a significant delay of more than 36 min for cell 3.1.
4.3. Summary and Interpretation of the Short-Term ISC Behaviour
4.4. Electrochemical Post-Characterisation
4.4.1. Self-Discharge
4.4.2. Electrochemical Behaviour via ICA (and Pulse)
4.4.3. Cycle Stability
4.5. Post-Abuse Analysis
4.5.1. Cell 1.6
4.5.2. General Correlations
4.5.3. Cell 2.4 and 0.1 (Partial Thermal Runaway)
4.5.4. Cell with TR
5. Conclusions
Author Contributions
Funding
Institutional Review Board Statement
Informed Consent Statement
Data Availability Statement
Acknowledgments
Conflicts of Interest
Abbreviations
| Al | Aluminium |
| An | Anode |
| C | C-Rate |
| Ca | Cathode |
| CC | Constant Current |
| Cu | Copper |
| CV | Constant Voltage |
| ICA | Incremental Capacity Analysis |
| ISC | Internal Short Circuit |
| Li | Lithium |
| LIB | Lithium-Ion Battery |
| max | Maximum |
| melt | Melting |
| min | Minimum |
| NMC | Nickel Manganese Cobalt |
| OCV | Open-Circuit Voltage |
| Sep | Separator |
| SOC | State of Charge |
| SOH | State of Health |
| TP | Thermal Propagation |
| TR | Thermal Runaway |
| TVOC | Total Volatile Organic Compounds |
| UL | Underwriters Laboratories |
Appendix A
References
- Tidblad, A.A.; Edström, K.; Hernández, G.; de Meatza, I.; Landa-Medrano, I.; Jacas Biendicho, J.; Trilla, L.; Buysse, M.; Ierides, M.; Horno, B.P.; et al. Future Material Developments for Electric Vehicle Battery Cells Answering Growing Demands from an End-User Perspective. Energies 2021, 14, 4223. [Google Scholar] [CrossRef]
- Yoshino, A. The Lithium-ion Battery: Two Breakthroughs in Development and Two Reasons for the Nobel Prize: Essay. Bull. Chem. Soc. Jpn. 2022, 95, 195–197. [Google Scholar] [CrossRef]
- Abu, S.M.; Hannan, M.A.; Hossain Lipu, M.S.; Mannan, M.; Ker, P.J.; Hossain, M.J.; Mahlia, T.I. State of the art of lithium-ion battery material potentials: An analytical evaluations, issues and future research directions. J. Clean. Prod. 2023, 394, 136246. [Google Scholar] [CrossRef]
- Degen, F. Lithium–ion battery cell production in Europe: Scenarios for reducing energy consumption and greenhouse gas emissions until 2030. J. Ind. Ecol. 2023, 27, 964–976. [Google Scholar] [CrossRef]
- Tran, M.K.; Mevawalla, A.; Aziz, A.; Panchal, S.; Xie, Y.; Fowler, M. A Review of Lithium-Ion Battery Thermal Runaway Modeling and Diagnosis Approaches. Processes 2022, 10, 1192. [Google Scholar] [CrossRef]
- Bravo Diaz, L.; He, X.; Hu, Z.; Restuccia, F.; Marinescu, M.; Barreras, J.V.; Patel, Y.; Offer, G.; Rein, G. Review—Meta-Review of Fire Safety of Lithium-Ion Batteries: Industry Challenges and Research Contributions. J. Electrochem. Soc. 2020, 167. [Google Scholar] [CrossRef]
- Chombo, P.V.; Laoonual, Y. A review of safety strategies of a Li-ion battery. J. Power Sources 2020, 478, 228649. [Google Scholar] [CrossRef]
- Wang, Q.; Mao, B.; Stoliarov, S.I.; Sun, J. A review of lithium ion battery failure mechanisms and fire prevention strategies. Prog. Energy Combust. Sci. 2019, 73, 95–131. [Google Scholar] [CrossRef]
- Qiu, M.; Liu, J.; Cong, B.; Cui, Y. Research Progress in Thermal Runaway Vent Gas Characteristics of Li-Ion Battery. Batteries 2023, 9, 411. [Google Scholar] [CrossRef]
- Amano, K.O.A.; Hahn, S.K.; Butt, N.; Vorwerk, P.; Gimadieva, E.; Tschirschwitz, R.; Rappsilber, T.; Krause, U. Composition and Explosibility of Gas Emissions from Lithium-Ion Batteries Undergoing Thermal Runaway. Batteries 2023, 9, 300. [Google Scholar] [CrossRef]
- Bruchhausen, M.; Pfrang, A.; Kriston, A.; Podias, A. Thermal Runaway Criteria: GTR-EVS, 22.-25.03.2022. p. 33. Available online: https://wiki.unece.org/display/trans/EVS+23rd+session?preview=%2F153583774%2F161841212%2FEVS23-E1TP-0100+%5BEC%5DThermal+runaway+criteria.pdf (accessed on 11 April 2022).
- Ruiz, V.; Pfrang, A. JRC Exploratory Research: Safer Li-Ion Batteries by Preventing Thermal Propagation: Workshop Report: Summary & Outcomes: EUR 29384 EN; EU Publications: Luxembourg, 2018. [Google Scholar] [CrossRef]
- Börger, A.; Mertens, J.; Wenzl, H. Thermal runaway and thermal runaway propagation in batteries: What do we talk about? J. Energy Storage 2019, 24, 100649. [Google Scholar] [CrossRef]
- Feng, X.; Sun, J.; Ouyang, M.; Wang, F.; He, X.; Lu, L.; Peng, H. Characterization of penetration induced thermal runaway propagation process within a large format lithium ion battery module. J. Power Sources 2015, 275, 261–273. [Google Scholar] [CrossRef]
- Srinivasan, R.; Thomas, M.E.; Airola, M.B.; Carkhuff, B.G.; Frizzell-Makowski, L.J.; Alkandry, H.; Reuster, J.G.; Oguz, H.N.; Green, P.W.; La Favors, J.; et al. Preventing Cell-to-Cell Propagation of Thermal Runaway in Lithium-Ion Batteries. J. Electrochem. Soc. 2020, 167, 020559. [Google Scholar] [CrossRef]
- Chen, Y.; Kang, Y.; Zhao, Y.; Wang, L.; Liu, J.; Li, Y.; Liang, Z.; He, X.; Li, X.; Tavajohi, N.; et al. A review of lithium-ion battery safety concerns: The issues, strategies, and testing standards. J. Energy Chem. 2021, 59, 83–99. [Google Scholar] [CrossRef]
- Feng, X.; Ouyang, M.; Liu, X.; Lu, L.; Xia, Y.; He, X. Thermal runaway mechanism of lithium ion battery for electric vehicles: A review. Energy Storage Mater. 2018, 10, 246–267. [Google Scholar] [CrossRef]
- Feng, X.; Ren, D.; He, X.; Ouyang, M. Mitigating Thermal Runaway of Lithium-Ion Batteries. Joule 2020, 4, 743–770. [Google Scholar] [CrossRef]
- Gandoman, F.H.; Jaguemont, J.; Goutam, S.; Gopalakrishnan, R.; Firouz, Y.; Kalogiannis, T.; Omar, N.; van Mierlo, J. Concept of reliability and safety assessment of lithium-ion batteries in electric vehicles: Basics, progress, and challenges. Appl. Energy 2019, 251, 113343. [Google Scholar] [CrossRef]
- Zhang, J.; Zhang, L.; Sun, F.; Wang, Z. An Overview on Thermal Safety Issues of Lithium-ion Batteries for Electric Vehicle Application. IEEE Access 2018, 6, 23848–23863. [Google Scholar] [CrossRef]
- Xiong, R.; Ma, S.; Li, H.; Sun, F.; Li, J. Toward a Safer Battery Management System: A Critical Review on Diagnosis and Prognosis of Battery Short Circuit. iScience 2020, 23, 101010. [Google Scholar] [CrossRef]
- Challa, V. How to Prevent Li-Ion Battery Failures: Real-World Applications of Physics of Failure Solving—Today’s Technology Challenges: Design for Reliability. In Proceedings of the DfR’s 2018 Design for Reliability Conference, Baltimore, MD, USA, 19–21 March 2018. [Google Scholar]
- Lai, X.; Jin, C.; Yi, W.; Han, X.; Feng, X.; Zheng, Y.; Ouyang, M. Mechanism, modeling, detection, and prevention of the internal short circuit in lithium-ion batteries: Recent advances and perspectives. Energy Storage Mater. 2021, 35, 470–499. [Google Scholar] [CrossRef]
- Liu, B.; Jia, Y.; Li, J.; Yin, S.; Yuan, C.; Hu, Z.; Wang, L.; Li, Y.; Xu, J. Safety issues caused by internal short circuits in lithium-ion batteries. J. Mater. Chem. A 2018, 6, 21475–21484. [Google Scholar] [CrossRef]
- Zhang, G.; Wei, X.; Tang, X.; Zhu, J.; Chen, S.; Dai, H. Internal short circuit mechanisms, experimental approaches and detection methods of lithium-ion batteries for electric vehicles: A review. Renew. Sustain. Energy Rev. 2021, 141, 110790. [Google Scholar] [CrossRef]
- Tübke, J.; Pinkwart, K.; Hendricks, C.E.; Fuentevilla, D.A.; Doering, H.; Garche, J.; Liebau, V.; Xuning, F.; Minggao, O.; Languang, L.; et al. 12 Li-Secondary Battery: Damage Control. In Electrochemical Power Sources: Fundamentals, Systems, and Applications. Li-Battery Safety; Garche, J., Brandt, K., Eds.; Elsevier: San Diego, CA, USA, 2019; pp. 507–629. [Google Scholar] [CrossRef]
- Matthew Gordon. Foreign Metallic Particle Contamination in EV Cell Manufactuting. In Proceedings of the AABC Europe 2023, Mainz, Germany, 19–22 June 2023. [Google Scholar]
- Grabow, J.; Klink, J.; Benger, R.; Hauer, I.; Beck, H.P. Particle Contamination in Commercial Lithium-Ion Cells—Risk Assessment with Focus on Internal Short Circuits and Replication by Currently Discussed Trigger Methods. Batteries 2023, 9, 9. [Google Scholar] [CrossRef]
- Ruiz, V.; Pfrang, A.; Kriston, A.; Omar, N.; van den Bossche, P.; Boon-Brett, L. A review of international abuse testing standards and regulations for lithium ion batteries in electric and hybrid electric vehicles. Renew. Sustain. Energy Rev. 2018, 81, 1427–1452. [Google Scholar] [CrossRef]
- Lai, X.; Yao, J.; Jin, C.; Feng, X.; Wang, H.; Xu, C.; Zheng, Y. A Review of Lithium-Ion Battery Failure Hazards: Test Standards, Accident Analysis, and Safety Suggestions. Batteries 2022, 8, 248. [Google Scholar] [CrossRef]
- Brodd, R.J. Batteries for Sustainability: Selected Entries from the Encyclopedia of Sustainability Science and Technology; Springer: New York, NY, USA, 2013. [Google Scholar] [CrossRef]
- Chen, M.; Bai, F.; Lin, S.; Song, W.; Li, Y.; Feng, Z. Performance and safety protection of internal short circuit in lithium-ion battery based on a multilayer electro-thermal coupling model. Appl. Therm. Eng. 2019, 146, 775–784. [Google Scholar] [CrossRef]
- Tran, M.K.; Fowler, M. A Review of Lithium-Ion Battery Fault Diagnostic Algorithms: Current Progress and Future Challenges. Algorithms 2020, 13, 62. [Google Scholar] [CrossRef]
- Zhang, X.; Chen, S.; Zhu, J.; Gao, Y. A Critical Review of Thermal Runaway Prediction and Early-Warning Methods for Lithium-Ion Batteries. Energy Mater. Adv. 2023, 4, 0008. [Google Scholar] [CrossRef]
- Liaw, B.Y.; Wang, F.; Wei, Y.; Garche, J.; Brandt, K. Managing Safety Risk by Manufacturers. In Electrochemical Power Sources: Fundamentals, Systems, and Applications. Li-Battery Safety; Garche, J., Brandt, K., Eds.; Elsevier: San Diego, CA, USA, 2019; pp. 267–378. [Google Scholar] [CrossRef]
- Liu, B.; Jia, Y.; Yuan, C.; Wang, L.; Gao, X.; Yin, S.; Xu, J. Safety issues and mechanisms of lithium-ion battery cell upon mechanical abusive loading: A review. Energy Storage Mater. 2020, 24, 85–112. [Google Scholar] [CrossRef]
- Smoke Event, VH-PRX, Sydney Airport, 25 November 2011: ATSB TRANSPORT SAFETY REPORT. Available online: https://reports.aviation-safety.net/2011/20111125_SF34_VH-PRX.pdf (accessed on 20 September 2023).
- Goodman, J.K.S.; Miller, J.T.; Kreuzer, S.; Forman, J.; Wi, S.; Choi, J.m.; Oh, B.; White, K. Lithium-ion cell response to mechanical abuse: Three-point bend. J. Energy Storage 2020, 28, 101244. [Google Scholar] [CrossRef]
- Zhu, J.; Wierzbicki, T.; Li, W. A review of safety-focused mechanical modeling of commercial lithium-ion batteries. J. Power Sources 2018, 378, 153–168. [Google Scholar] [CrossRef]
- Xia, Y.; Wierzbicki, T.; Sahraei, E.; Zhang, X. Damage of cells and battery packs due to ground impact. J. Power Sources 2014, 267, 78–97. [Google Scholar] [CrossRef]
- Wu, H.; Zhuo, D.; Kong, D.; Cui, Y. Improving battery safety by early detection of internal shorting with a bifunctional separator. Nat. Commun. 2014, 5, 5193. [Google Scholar] [CrossRef] [PubMed]
- Zhu, R.; Feng, J.; Guo, Z. In Situ Observation of Dendrite Behavior of Electrode in Half and Full Cells. J. Electrochem. Soc. 2019, 166, A1107–A1113. [Google Scholar] [CrossRef]
- Hogrefe, C.; Waldmann, T.; Hölzle, M.; Wohlfahrt-Mehrens, M. Direct observation of internal short circuits by lithium dendrites in cross-sectional lithium-ion in situ full cells. J. Power Sources 2023, 556, 232391. [Google Scholar] [CrossRef]
- Guo, R.; Lu, L.; Ouyang, M.; Feng, X. Mechanism of the entire overdischarge process and overdischarge-induced internal short circuit in lithium-ion batteries. Sci. Rep. 2016, 6, 30248. [Google Scholar] [CrossRef]
- Liu, L.; Feng, X.; Zhang, M.; Lu, L.; Han, X.; He, X.; Ouyang, M. Comparative study on substitute triggering approaches for internal short circuit in lithium-ion batteries. Appl. Energy 2020, 259, 114143. [Google Scholar] [CrossRef]
- Badmos, O.; Kopp, A.; Bernthaler, T.; Schneider, G. Image-based defect detection in lithium-ion battery electrode using convolutional neural networks. J. Intell. Manuf. 2020, 31, 885–897. [Google Scholar] [CrossRef]
- Qian, G.; Monaco, F.; Meng, D.; Lee, S.J.; Zan, G.; Li, J.; Karpov, D.; Gul, S.; Vine, D.; Stripe, B.; et al. The role of structural defects in commercial lithium-ion batteries. Cell Rep. Phys. Sci. 2021, 2, 100554. [Google Scholar] [CrossRef]
- Wu, Y.; Saxena, S.; Xing, Y.; Wang, Y.; Li, C.; Yung, W.; Pecht, M. Analysis of Manufacturing-Induced Defects and Structural Deformations in Lithium-Ion Batteries Using Computed Tomography. Energies 2018, 11, 925. [Google Scholar] [CrossRef]
- Samsung Newsroom U.S. Samsung Announces Cause of Galaxy Note7 Incidents in Press Conference. 2017. Available online: https://news.samsung.com/us/Samsung-Electronics-Announces-Cause-of-Galaxy-Note7-Incidents-in-Press-Conference (accessed on 23 January 2017).
- Spielbauer, M.; Steinhardt, M.; Singer, J.; Aufschläger, A.; Bohlen, O.; Jossen, A. Influence of Breathing and Swelling on the Jelly-Roll Case Gap of Cylindrical Lithium-Ion Battery Cells. Batteries 2023, 9, 6. [Google Scholar] [CrossRef]
- Willenberg, L.K.; Dechent, P.; Fuchs, G.; Sauer, D.U.; Figgemeier, E. High-Precision Monitoring of Volume Change of Commercial Lithium-Ion Batteries by Using Strain Gauges. Sustainability 2020, 12, 557. [Google Scholar] [CrossRef]
- Carter, R.; Klein, E.J.; Atkinson, R.W.; Love, C.T. Mechanical collapse as primary degradation mode in mandrel-free 18650 Li-ion cells operated at 0 °C. J. Power Sources 2019, 437, 226820. [Google Scholar] [CrossRef]
- Mohanty, D.; Hockaday, E.; Li, J.; Hensley, D.K.; Daniel, C.; Wood, D.L. Effect of electrode manufacturing defects on electrochemical performance of lithium-ion batteries: Cognizance of the battery failure sources. J. Power Sources 2016, 312, 70–79. [Google Scholar] [CrossRef]
- Kurfer, J.; Westermeier, M.; Tammer, C.; Reinhart, G. Production of large-area lithium-ion cells—Preconditioning, cell stacking and quality assurance. CIRP Ann. 2012, 61, 1–4. [Google Scholar] [CrossRef]
- Randall, C. BMW Recalls Multiple PHEV Models. 2020. Available online: https://www.electrive.com/2020/10/13/bmw-recalls-multiple-phev-models/ (accessed on 20 September 2023).
- Rheinfeld, J.A.G. Performance and Safety of Lithium-Ion Electrodes and Cells: Modeling, Simulation, and Validation at Elevated Temperatures and Currents. Doctoral Dissertation, Technische Universität München, München, Germany, 2019. [Google Scholar]
- Cai, T.; Stefanopoulou, A.G.; Siegel, J.B. Modeling Li-Ion Battery Temperature and Expansion Force during the Early Stages of Thermal Runaway Triggered by Internal Shorts. J. Electrochem. Soc. 2019, 166, A2431–A2443. [Google Scholar] [CrossRef]
- Klink, J.; Grabow, J.; Orazov, N.; Benger, R.; Hauer, I.; Beck, H.P. Systematic Approach for the Test Data Generation and Validation of ISC/ESC Detection Methods. Batteries 2023, 9, 339. [Google Scholar] [CrossRef]
- Volck, T.; Sinz, W.; Gstrein, G.; Breitfuss, C.; Heindl, S.; Steffan, H.; Freunberger, S.; Wilkening, M.; Uitz, M.; Fink, C.; et al. Method for Determination of the Internal Short Resistance and Heat Evolution at Different Mechanical Loads of a Lithium Ion Battery Cell Based on Dummy Pouch Cells. Batteries 2016, 2, 8. [Google Scholar] [CrossRef]
- Santhanagopalan, S.; Ramadass, P.; Zhang, J. Analysis of internal short-circuit in a lithium ion cell. J. Power Sources 2009, 194, 550–557. [Google Scholar] [CrossRef]
- Zhang, Z.J.; Ramadass, P.; Fang, W. Safety of Lithium-Ion Batteries. In Lithium-Ion Batteries; Elsevier: Amsterdam, The Netherlands, 2014; pp. 409–435. [Google Scholar] [CrossRef]
- Keyser, M.; Darcy, E. Internal Short-Circuit Instigator in Lithium Ion Cells, 8-9.03.2018. Available online: https://rechargebatteries.org/wp-content/uploads/2020/01/2-Initiation-presentation-MDBTC_matthew_keyser-nrel-nasa_internal_short_circuit_instigator_in_lithium_ion_cells_03_2018.pdf (accessed on 20 September 2023).
- Zhang, L.; Xu, M.; Zhao, P.; Wang, X. A Computational Study on the Critical Ignition Energy and Chemical Kinetic Feature for Li-Ion Battery Thermal Runaway; WCX World Congress Experience: SAE Technical Paper; SAE International: Warrendale, PA, USA, 2018. [Google Scholar] [CrossRef]
- Zhang, M.; Liu, L.; Stefanopoulou, A.; Siegel, J.; Lu, L.; He, X.; Ouyang, M. Fusing Phenomenon of Lithium-Ion Battery Internal Short Circuit. J. Electrochem. Soc. 2017, 164, A2738–A2745. [Google Scholar] [CrossRef]
- Chen, M.; Ye, Q.; Shi, C.; Cheng, Q.; Qie, B.; Liao, X.; Zhai, H.; He, Y.; Yang, Y. New Insights into Nail Penetration of Li–Ion Batteries: Effects of Heterogeneous Contact Resistance. Batter. Supercaps 2019, 2, 874–881. [Google Scholar] [CrossRef]
- Jia, Y.; Liu, B.; Hong, Z.; Yin, S.; Finegan, D.P.; Xu, J. Safety issues of defective lithium-ion batteries: Identification and risk evaluation. J. Mater. Chem. A 2020, 8, 12472–12484. [Google Scholar] [CrossRef]
- Yokoshima, T.; Mukoyama, D.; Maeda, F.; Osaka, T.; Takazawa, K.; Egusa, S.; Naoi, S.; Ishikura, S.; Yamamoto, K. Direct observation of internal state of thermal runaway in lithium ion battery during nail-penetration test. J. Power Sources 2018, 393, 67–74. [Google Scholar] [CrossRef]
- Wang, H.; Lara-Curzio, E.; Rule, E.T.; Winchester, C.S. Mechanical abuse simulation and thermal runaway risks of large-format Li-ion batteries. J. Power Sources 2017, 342, 913–920. [Google Scholar] [CrossRef]
- Mao, B.; Chen, H.; Cui, Z.; Wu, T.; Wang, Q. Failure mechanism of the lithium ion battery during nail penetration. Int. J. Heat Mass Transf. 2018, 122, 1103–1115. [Google Scholar] [CrossRef]
- Diekmann, J.; Doose, S.; Weber, S.; Münch, S.; Haselrieder, W.; Kwade, A. Development of a New Procedure for Nail Penetration of Lithium-Ion Cells to Obtain Meaningful and Reproducible Results. J. Electrochem. Soc. 2020, 167, 090504. [Google Scholar] [CrossRef]
- Ma, T.; Chen, L.; Liu, S.; Zhang, Z.; Xiao, S.; Fan, B.; Liu, L.; Lin, C.; Ren, S.; Wang, F. Mechanics-morphologic coupling studies of commercialized lithium-ion batteries under nail penetration test. J. Power Sources 2019, 437, 226928. [Google Scholar] [CrossRef]
- Lamb, J.; Orendorff, C.J. Evaluation of mechanical abuse techniques in lithium ion batteries. J. Power Sources 2014, 247, 189–196. [Google Scholar] [CrossRef]
- Finegan, D.P.; Darcy, E.; Keyser, M.; Tjaden, B.; Heenan, T.M.M.; Jervis, R.; Bailey, J.J.; Malik, R.; Vo, N.T.; Magdysyuk, O.V.; et al. Characterising thermal runaway within lithium-ion cells by inducing and monitoring internal short circuits. Energy Environ. Sci. 2017, 10, 1377–1388. [Google Scholar] [CrossRef]
- Zhang, M.; Du, J.; Liu, L.; Stefanopoulou, A.; Siegel, J.; Lu, L.; He, X.; Xie, X.; Ouyang, M. Internal Short Circuit Trigger Method for Lithium-Ion Battery Based on Shape Memory Alloy. J. Electrochem. Soc. 2017, 164, A3038–A3044. [Google Scholar] [CrossRef]
- Orendorff, C.J.; Roth, E.P.; Nagasubramanian, G. Experimental triggers for internal short circuits in lithium-ion cells. J. Power Sources 2011, 196, 6554–6558. [Google Scholar] [CrossRef]
- Keyser, M.; Darcy, E.; Shoesmith, M.; McCarthy, B. NREL/NASA Internal Short-Circuit Instigator in Lithium Ion Cells. In Proceedings of the 228th ECS Conference, Phoenix, AZ, USA, 11–15 October 2015. [Google Scholar]
- Huang, S.; Du, X.; Richter, M.; Ford, J.; Cavalheiro, G.M.; Du, Z.; White, R.T.; Zhang, G. Understanding Li-Ion Cell Internal Short Circuit and Thermal Runaway through Small, Slow and In Situ Sensing Nail Penetration. J. Electrochem. Soc. 2020, 167, 090526. [Google Scholar] [CrossRef]
- Kim, G.H.; Smith, K.; Ireland, J.; Pesaran, A. Fail-safe design for large capacity lithium-ion battery systems. J. Power Sources 2012, 210, 243–253. [Google Scholar] [CrossRef]
- Klink, J.; Hebenbrock, A.; Grabow, J.; Orazov, N.; Nylén, U.; Benger, R.; Beck, H.P. Comparison of Model-Based and Sensor-Based Detection of Thermal Runaway in Li-Ion Battery Modules for Automotive Application. Batteries 2022, 8, 34. [Google Scholar] [CrossRef]
- Klink, J.; Grabow, J.; Orazov, N.; Benger, R.; Börger, A.; Ahlberg Tidblad, A.; Wenzl, H.; Beck, H.P. Thermal fault detection by changes in electrical behaviour in lithium-ion cells. J. Power Sources 2021, 490. [Google Scholar] [CrossRef]
- Abaza, A.; Ferrari, S.; Wong, H.K.; Lyness, C.; Moore, A.; Weaving, J.; Blanco-Martin, M.; Dashwood, R.; Bhagat, R. Experimental study of internal and external short circuits of commercial automotive pouch lithium-ion cells. J. Energy Storage 2018, 16, 211–217. [Google Scholar] [CrossRef]
- Ribière, P.; Grugeon, S.; Morcrette, M.; Boyanov, S.; Laruelle, S.; Marlair, G. Investigation on the fire-induced hazards of Li-ion battery cells by fire calorimetry. Energy Environ. Sci. 2012, 5, 5271–5280. [Google Scholar] [CrossRef]
- Kvasha, A.; Gutiérrez, C.; Osa, U.; de Meatza, I.; Blazquez, J.A.; Macicior, H.; Urdampilleta, I. A comparative study of thermal runaway of commercial lithium ion cells. Energy 2018, 159, 547–557. [Google Scholar] [CrossRef]
- Bitzer, B.; Gruhle, A. A new method for detecting lithium plating by measuring the cell thickness. J. Power Sources 2014, 262, 297–302. [Google Scholar] [CrossRef]
- Waldmann, T.; Hogg, B.I.; Wohlfahrt-Mehrens, M. Li plating as unwanted side reaction in commercial Li-ion cells—A review. J. Power Sources 2018, 384, 107–124. [Google Scholar] [CrossRef]
- Zhu, X.; Wang, H.; Allu, S.; Gao, Y.; Cakmak, E.; Hopkins, E.J.; Veith, G.M.; Wang, Z. Investigation on capacity loss mechanisms of lithium-ion pouch cells under mechanical indentation conditions. J. Power Sources 2020, 465, 228314. [Google Scholar] [CrossRef]
- Feng, X.; Zheng, S.; Ren, D.; He, X.; Wang, L.; Liu, X.; Li, M.; Ouyang, M. Key Characteristics for Thermal Runaway of Li-ion Batteries. Energy Procedia 2019, 158, 4684–4689. [Google Scholar] [CrossRef]
- Zubi, G.; Dufo-López, R.; Carvalho, M.; Pasaoglu, G. The lithium-ion battery: State of the art and future perspectives. Renew. Sustain. Energy Rev. 2018, 89, 292–308. [Google Scholar] [CrossRef]
- Zhao, W.; Luo, G.; Wang, C.Y. Modeling Nail Penetration Process in Large-Format Li-Ion Cells. J. Electrochem. Soc. 2015, 162, A207–A217. [Google Scholar] [CrossRef]
- Yokoshima, T.; Mukoyama, D.; Maeda, F.; Osaka, T.; Takazawa, K.; Egusa, S. Operando Analysis of Thermal Runaway in Lithium Ion Battery during Nail-Penetration Test Using an X-ray Inspection System. J. Electrochem. Soc. 2019, 166, A1243–A1250. [Google Scholar] [CrossRef]
- Hsin, W.; Edga, L.C. Thermal Runaway Risk Assessment by Mechanically Induced Internal Short Circuit. Available online: https://www.prba.org/wp-content/uploads/Internal-short-circuit-BatterySafetyCouncil-Jan2017.pdf (accessed on 20 September 2023).
- Li, A.; Yuen, A.C.Y.; Wang, W.; de Cachinho Cordeiro, I.M.; Wang, C.; Chen, T.B.Y.; Zhang, J.; Chan, Q.N.; Yeoh, G.H. A Review on Lithium-Ion Battery Separators towards Enhanced Safety Performances and Modelling Approaches. Molecules 2021, 26, 478. [Google Scholar] [CrossRef]
- Schledde, D. Modellbasierte Identifikation von physikalischen Parametern zur Bestimmung der Veränderung charakteristischer Eigenschaften einer C/NMC Lithium-Ionen-Zelle durch Alterungsmechanismen zur Anwendung in Batteriemanagementsystemen: Eine empirische Studie. Doctoral Dissertation, Universität Kassel, Kassel, Germany, 2017. [Google Scholar] [CrossRef]
- Zhou, L.; Xing, L.; Zheng, Y.; Lai, X.; Su, J.; Deng, C.; Sun, T. A study of external surface pressure effects on the properties for lithium–ion pouch cells. Int. J. Energy Res. 2020, 44, 6778–6791. [Google Scholar] [CrossRef]
- Ma, S.; Jiang, M.; Tao, P.; Song, C.; Wu, J.; Wang, J.; Deng, T.; Shang, W. Temperature effect and thermal impact in lithium-ion batteries: A review. Prog. Nat. Sci. Mater. Int. 2018, 28, 653–666. [Google Scholar] [CrossRef]
- Höschele, P.; Heindl, S.F.; Erker, S.; Ellersdorfer, C. Influence of reversible swelling and preload force on the failure behavior of a lithium-ion pouch cell tested under realistic boundary conditions. J. Energy Storage 2023, 65, 107228. [Google Scholar] [CrossRef]
- Hahn, A.; Doose, S.; Saathoff, D.; Kwade, A. Effect of External Compression on the Thermal Runaway of Lithium-Ion Battery Cells during Crush Tests: Insights for Improved Safety Assessment. Batteries 2023, 9, 404. [Google Scholar] [CrossRef]
- Cannarella, J.; Arnold, C.B. Stress evolution and capacity fade in constrained lithium-ion pouch cells. J. Power Sources 2014, 245, 745–751. [Google Scholar] [CrossRef]
- Barai, A.; Tangirala, R.; Uddin, K.; Chevalier, J.; Guo, Y.; McGordon, A.; Jennings, P. The effect of external compressive loads on the cycle lifetime of lithium-ion pouch cells. J. Energy Storage 2017, 13, 211–219. [Google Scholar] [CrossRef]
- Präzision in der Injektion und Applikation: Mit B. Braun Einmalspritzen und Einmalkanülen. Available online: https://www.bbraun.ch/content/dam/catalog/bbraun/bbraunProductCatalog/CW_CH/de-ch/b9/spritzen-und-kanuelen0.pdf (accessed on 20 September 2023).
- DIN EN 1.4301; Stainless Steel X5CrNi18-10 Material Equivalent, Properties, Chemical Composition. European EN Standards—BSI and DIN Standards: Plzen, Czech Republic, 2023.
- Finegan, D.P.; Tjaden, B.; Heenan, T.M.M.; Jervis, R.; Di Michiel, M.; Rack, A.; Hinds, G.; Brett, D.J.L.; Shearing, P.R. Tracking Internal Temperature and Structural Dynamics during Nail Penetration of Lithium-Ion Cells. J. Electrochem. Soc. 2017, 164, A3285–A3291. [Google Scholar] [CrossRef]
- Hunt, I.A.; Zhao, Y.; Patel, Y.; Offer, J. Surface Cooling Causes Accelerated Degradation Compared to Tab Cooling for Lithium-Ion Pouch Cells. J. Electrochem. Soc. 2016, 163, A1846–A1852. [Google Scholar] [CrossRef]
- Essl, C.; Golubkov, A.W.; Fuchs, A. Influence of Aging on the Failing Behavior of Automotive Lithium-Ion Batteries. Batteries 2021, 7, 23. [Google Scholar] [CrossRef]
- Sazhin, S.V.; Dufek, E.J.; Gering, K.L. Enhancing Li-Ion Battery Safety by Early Detection of Nascent Internal Shorts. ECS Trans. 2017, 73, 161–178. [Google Scholar] [CrossRef]
- Seo, M.; Goh, T.; Koo, G.; Park, M.; Kim, S.W. Detection of Internal Short Circuit in Li-ion Battery by Estimating its Resistance. In Proceedings of the 4th IIAE International Conference on Intelligent Systems and Image Processing 2016 (ICISIP2016), Kyoto, Japan, 8–12 September 2016; pp. 212–217. [Google Scholar] [CrossRef]
- Barai, A.; Uddin, K.; Dubarry, M.; Somerville, L.; McGordon, A.; Jennings, P.; Bloom, I. A comparison of methodologies for the non-invasive characterisation of commercial Li-ion cells. Prog. Energy Combust. Sci. 2019, 72, 1–31. [Google Scholar] [CrossRef]
- Han, X.; Ouyang, M.; Lu, L.; Li, J. A comparative study of commercial lithium ion battery cycle life in electric vehicle: Capacity loss estimation. J. Power Sources 2014, 268, 658–669. [Google Scholar] [CrossRef]
- Grabow, J.; Benger, R.; Beushauen, L.; Deblon, F. Advanced filtering for Incremental Capacity Analysis applied to various lithium-ion batteries. In Proceedings of the Advanced Battery Power, Aachen, Germany, 2–4 April 2019. [Google Scholar]
- Schmidt, J.P.; Ivers-Tiffée, E. Pulse-fitting—A novel method for the evaluation of pulse measurements, demonstrated for the low frequency behavior of lithium-ion cells. J. Power Sources 2016, 315, 316–323. [Google Scholar] [CrossRef]
- Cannarella, J.; Arnold, C.B. The Effects of Defects on Localized Plating in Lithium-Ion Batteries. J. Electrochem. Soc. 2015, 162, A1365–A1373. [Google Scholar] [CrossRef]
- Grabow, J.; Orazov, N.; Benger, R.; Hauer, I.; Beck, H.-P. Influence of compression condition on the behaviour of lithium-ion cells in the event of an external short-circuit. In Proceedings of the AABC Europe Mainz, Mainz, Germany, 19–22 June 2023. [Google Scholar] [CrossRef]
- Zhao, R.; Liu, J.; Gu, J. A comprehensive study on Li-ion battery nail penetrations and the possible solutions. Energy 2017, 123, 392–401. [Google Scholar] [CrossRef]
- Bruchhausen, M.; Hildebrand, S.; Kriston, A.; Ruiz, V.; Podias, A.; Pfrang, A. Evaluation of detection criteria for thermal runaway experiments on commercial cells for electric vehicles. Energy Rep. 2023, 10, 510–519. [Google Scholar] [CrossRef]
- Feng, X.; Zheng, S.; Ren, D.; He, X.; Wang, L.; Cui, H.; Liu, X.; Jin, C.; Zhang, F.; Xu, C.; et al. Investigating the thermal runaway mechanisms of lithium-ion batteries based on thermal analysis database. Appl. Energy 2019, 246, 53–64. [Google Scholar] [CrossRef]
- Zavalis, T.G.; Behm, M.; Lindbergh, G. Investigation of Short-Circuit Scenarios in a Lithium-Ion Battery Cell. J. Electrochem. Soc. 2012, 159, A848–A859. [Google Scholar] [CrossRef]
- Hatchard, T.D.; MacNeil, D.D.; Basu, A.; Dahn, J.R. Thermal Model of Cylindrical and Prismatic Lithium-Ion Cells. J. Electrochem. Soc. 2001, 148, A755. [Google Scholar] [CrossRef]
- Ren, D.; Liu, X.; Feng, X.; Lu, L.; Ouyang, M.; Li, J.; He, X. Model-based thermal runaway prediction of lithium-ion batteries from kinetics analysis of cell components. Appl. Energy 2018, 228, 633–644. [Google Scholar] [CrossRef]
- Reid, G.; Julve, J. Second Life-Batterien als flexible Speicher für Erneuerbare Energien: Kurzstudie Im Auftrag Des Bundesverbandes Erneuerbare Energie e.V. und der Hannover Messe; Bundesverband Erneuerbare Energie e.V.: Berlin, Germany, 2016. [Google Scholar]
- Smith, B. Chevrolet Volt Battery Incident Overview Report. Accid. Reconstr. J. 2013, 23, 31–37. [Google Scholar]
- Dubarry, M.; Truchot, C.; Liaw, B.Y. Synthesize battery degradation modes via a diagnostic and prognostic model. J. Power Sources 2012, 219, 204–216. [Google Scholar] [CrossRef]
- Lewerenz, M.; Münnix, J.; Schmalstieg, J.; Käbitz, S.; Knips, M.; Sauer, D.U. Systematic aging of commercial LiFePO4|Graphite cylindrical cells including a theory explaining rise of capacity during aging. J. Power Sources 2017, 345, 254–263. [Google Scholar] [CrossRef]
- Yang, S.; Wang, W.; Lin, C.; Shen, W.; Li, Y. Investigation of Internal Short Circuits of Lithium-Ion Batteries under Mechanical Abusive Conditions. Energies 2019, 12, 1885. [Google Scholar] [CrossRef]
- Feng, X.; Zheng, S.; He, X.; Wang, L.; Wang, Y.; Ren, D.; Ouyang, M. Time Sequence Map for Interpreting the Thermal Runaway Mechanism of Lithium-Ion Batteries With LiNixCoyMnzO2 Cathode. Front. Energy Res. 2018, 6, 264. [Google Scholar] [CrossRef]


| High Relevance for Application | Unknown ISC Characteristics | Limited Options for Failure Containment |
|---|---|---|
| Parameter | Symbol | Value |
|---|---|---|
| Chemistry | - | Graphite/NMC (111) |
| Nominal capacity | 10 Ah | |
| Nominal voltage | 3.7 V | |
| Upper voltage limit | 4.2 V | |
| Lower voltage limit | 2.7 V | |
| Internal resistance (1 kHz) | ≤4 m | |
| Charge current | | | 5 A|20 A |
| Discharge current | || | 5 A|20 A|30 A |
| Dimensions | l|w|t | 102 mm|107 mm|10 mm |
| Weight | m | 0.210 kg |
| Parameter | Symbol | Manufacturer | Model | Accuracy | Sample Rate |
|---|---|---|---|---|---|
| Cell voltage | Omega | OMB-DAQ-2408 | ±300 V | 500 Hz | |
| Needle force | F | Burster | 8526-6002 | ±0.5% | 500 Hz |
| Travel distance (setup) | Kokomotion | NEMA 23 (step-motor) | ±1 m | - | |
| MForce Micro Plus Motion-Control | - | 10 to 25 Hz | |||
| Travel distance (measured) | Heidenhein | ST3078 | ±1 m | 1 Hz | |
| Gas concentration | - | Sensirion | SGP 30 | ±15% | 1 Hz |
| Temperature (see Figure 2) | T | Pico Technology | TC-08 | ±1.5 °C | 1 Hz |
| Resistance † | R | Keithley | 2000 Series | <0.015% | - |
| Mass | m | A&D | EK-i | 0.1 g | - |
| Needle dimension | Keyence | VHX-5000 (digital microscope) | - | - |
| Cell No. | ||||||
|---|---|---|---|---|---|---|
| 0 μm | 1.1 | 1.2 | 1.3 | 1.4 | 1.5 | 1.6 |
| 25 μm | 2.1 | 2.2 | 2.3 | 2.4 | 2.5 | 2.6 |
| 100 μm | 3.1 | 3.2 | 3.3 | 3.4 | 3.5 | 3.6 |
| Feature | Symbol | Unit | |
|---|---|---|---|
| ISC-Severity | Minimum ISC resistance (see Equation 2)) | ||
| Maximum ISC current | A | ||
| Maximum joule heat | W | ||
| Time of maximum ISC | s | ||
| State of charge maximum ISC | % | ||
| General ISC-Characteristics | Maximum temperature | °C | |
| ISC type (see Figure 1) | ISC-Type | - | |
| Time of characteristic ISC behaviour | s | ||
| SOC of characteristic ISC behaviour | % | ||
| Relative mass loss | % |
| I | II | |
|---|---|---|
| Until Contact with the First Anode | After Contact with the Second Cathode | |
| (Penetration Depth ➂ = 0 μm) | (Complete Penetration of the first Anode) | |
| Magnification: 1000x | Magnification: 100x | |
| first Seperator |  | 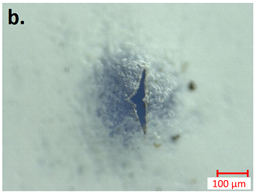 |
| first Anode | 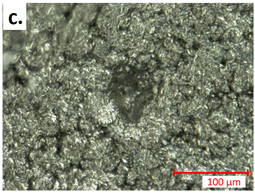 | 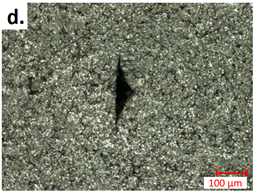 |
| Feature | Unit | 100% SOC, Penetration Depth after First ISC = 0 μm | |||||
|---|---|---|---|---|---|---|---|
| 1.1 | 1.2 | 1.3 | 1.4 | 1.5 | 1.6 | ||
| 0.616 | 0.368 | 0.351 | 0.265 | 0.262 | 0.113 | ||
| A | 6.7 | 11.3 | 11.7 | 14.4 | 15.7 | 37.7 | |
| W | 28 | 47 | 48 | 59 | 65 | 143 | |
| s | 0.49 | 116 | 337 | 299 | 228 | 321 | |
| % | >99 | >99 | >99 | >99 | >99 | >99 | |
| °C | <30 | 72 | 192 | 102 | 129 | 314 | |
| ISC-Type | - | I | IIa | IIa | IIa | IIa | IIa |
| s | 18.4 | 576 | 939 | 877 | 777 | 992 | |
| % | >99 | 96.7 | 91.6 | 94.0 | 92.1 | 84.9 | |
| % | 0 | 0 | 0.3 | 0 | 0 | 3.5 | |
| Feature | Unit | 100% SOC, Penetration Depth after First ISC = 25 μm | |||||
|---|---|---|---|---|---|---|---|
| 2.1 | 2.2 | 2.3 | 2.4 | 2.5 | 2.6 | ||
| 0.356 | 0.318 | 0.270 | 0.243 | 0.207 | 0.010 | ||
| A | 11.6 | 12.9 | 15.1 | 16.8 | 19.7 | 298.4 | |
| W | 48 | 53 | 62 | 69 | 80 | 884 | |
| s | 172 | 147 | 9 | 650 | 136 | 363 | |
| % | >99 | >99 | >99 | >99 | >99 | ||
| °C | 82 | 61 | 110 | 181 | 261 | 527 | |
| ISC-Type | - | IIa | IIa | IIa | IIa | IIa | IIb (TR) |
| s | 905 | 500 | 680 | 664 | 965 | 372 | |
| % | 95.8 | 97.9 | 94.0 | 99.3 | 88.3 | 96.0 | |
| % | 0.1 | 0 | 0 | 0.1 | 0.3 | 54.88 | |
| Feature | Unit | 100% SOC, Penetration Depth after First ISC = 100 μm | |||||
|---|---|---|---|---|---|---|---|
| 3.1 | 3.2 | 3.3 | 3.4 | 3.5 | 3.6 | ||
| 0.201 | 0.192 | 0.012 | 0.011 | 0.009 | 0.007 | ||
| A | 20.4 | 21.3 | 260.5 | 289.3 | 312.1 | 362.5 | |
| W | 83.6 | 87.2 | 812.1 | 870.9 | 909.7 | 971.5 | |
| s | 676 | 348 | 941 | 362 | 327 | 646 | |
| % | >99 | >99 | 98.7 | >98.4 | 98.5 | 96.0 | |
| °C | 165 | 193 | 540 | 555 | 556 | 607 | |
| ISC-Type | - | IIa | IIa | IIb (TR) | IIb (TR) | IIb (TR) | IIb (TR) |
| s | 2188 | 731 | 948 | 371 | 337 | 655 | |
| % | 84.7 | 89.7 | 98.0 | 96.1 | 96.0 | 93.5 | |
| % | 0 | 0.4 | 53.8 | 51.6 | 52.7 | 57.6 | |
| Unit | 0.1 † | 1.1 | 1.6 | 2.1 | 2.4 | 3.1 | Ref. | ||
|---|---|---|---|---|---|---|---|---|---|
| Feature | ISC-Type | IIa | I | IIa | IIa | IIa | IIa | - | |
| °C | 162 | < 30 | 314 | 82 | 181 | 165 | - | ||
| Characterisation | Self-discharge | ✓ | ✓ | ✓ | ✓ | ✓ | ✓ | ✓ | |
| Electrochemical behaviour via ICA (and pulse) | ✓ | ✓ | ✓ | ✓ | |||||
| Cycle stability | ✓ | ✓ | ✓ | ✓ | |||||
| Post-abuse analysis | ✓ | ✓ | ✓ | ✓ | ✓ | ✓ |
| Unit | 0.1 † | 1.1 | 1.6 | 2.1 | 2.4 | 3.1 | Ref. | |
|---|---|---|---|---|---|---|---|---|
| ISC-Type | IIa | I | IIa | IIa | IIa | IIa | - | |
| °C | 162 | <30 | 314 | 82 | 181 | 165 | - | |
| Self-discharge | mA | 22 | <0.5 | 19 | 800–400 | 4 | 900–2200 | <0.5 |
| Visual damage | −− | ++ | − | + | −− | O | - | |
| - | <0.01 | 36.3 | 1.1 | 196.8 | 6.5 | - | ||
| - | - | 1 | 5 | 3 | 3 | 4 | - | |
| m | 732 | 110 | 2015 | 291 | 666 | 598 | - |
Disclaimer/Publisher’s Note: The statements, opinions and data contained in all publications are solely those of the individual author(s) and contributor(s) and not of MDPI and/or the editor(s). MDPI and/or the editor(s) disclaim responsibility for any injury to people or property resulting from any ideas, methods, instructions or products referred to in the content. |
© 2023 by the authors. Licensee MDPI, Basel, Switzerland. This article is an open access article distributed under the terms and conditions of the Creative Commons Attribution (CC BY) license (https://creativecommons.org/licenses/by/4.0/).
Share and Cite
Grabow, J.; Klink, J.; Orazov, N.; Benger, R.; Hauer, I.; Beck, H.-P. Triggering and Characterisation of Realistic Internal Short Circuits in Lithium-Ion Pouch Cells—A New Approach Using Precise Needle Penetration. Batteries 2023, 9, 496. https://doi.org/10.3390/batteries9100496
Grabow J, Klink J, Orazov N, Benger R, Hauer I, Beck H-P. Triggering and Characterisation of Realistic Internal Short Circuits in Lithium-Ion Pouch Cells—A New Approach Using Precise Needle Penetration. Batteries. 2023; 9(10):496. https://doi.org/10.3390/batteries9100496
Chicago/Turabian StyleGrabow, Jens, Jacob Klink, Nury Orazov, Ralf Benger, Ines Hauer, and Hans-Peter Beck. 2023. "Triggering and Characterisation of Realistic Internal Short Circuits in Lithium-Ion Pouch Cells—A New Approach Using Precise Needle Penetration" Batteries 9, no. 10: 496. https://doi.org/10.3390/batteries9100496
APA StyleGrabow, J., Klink, J., Orazov, N., Benger, R., Hauer, I., & Beck, H.-P. (2023). Triggering and Characterisation of Realistic Internal Short Circuits in Lithium-Ion Pouch Cells—A New Approach Using Precise Needle Penetration. Batteries, 9(10), 496. https://doi.org/10.3390/batteries9100496