Article

Effect of the Calcination Duration on the Electrochemical Properties of Na2Ti3O7 as Anode Material for Na-Ion Batteries

1
GREENMAT, CESAM Research Unit, Chemistry Department, University of Liège, Quartier Agora, 13Allée du 6 Août, 4000 Liège, Belgium
2
Laboratory of Mineralogy, Geology Research Unit, University of Liège, 4000 Liège, Belgium
3
Chimie ParisTech—CNRS, Institut de Recherche de Chimie, PSL University, Paris, 11 Rue Pierre et Marie Curie, 75005 Paris, France
*
Authors to whom correspondence should be addressed.
Present address: Umicore, Umicore Research, Development & Innovation, 2250 Olen, Belgium.
Batteries 2023, 9(10), 495; https://doi.org/10.3390/batteries9100495
Submission received: 31 July 2023 / Revised: 19 September 2023 / Accepted: 23 September 2023 / Published: 27 September 2023
(This article belongs to the Special Issue High-Performance Materials for Sodium-Ion Batteries)

Abstract

:

Highlights

  • NTO heat-treated 48 h displays more ordered structure and less surface contamination.
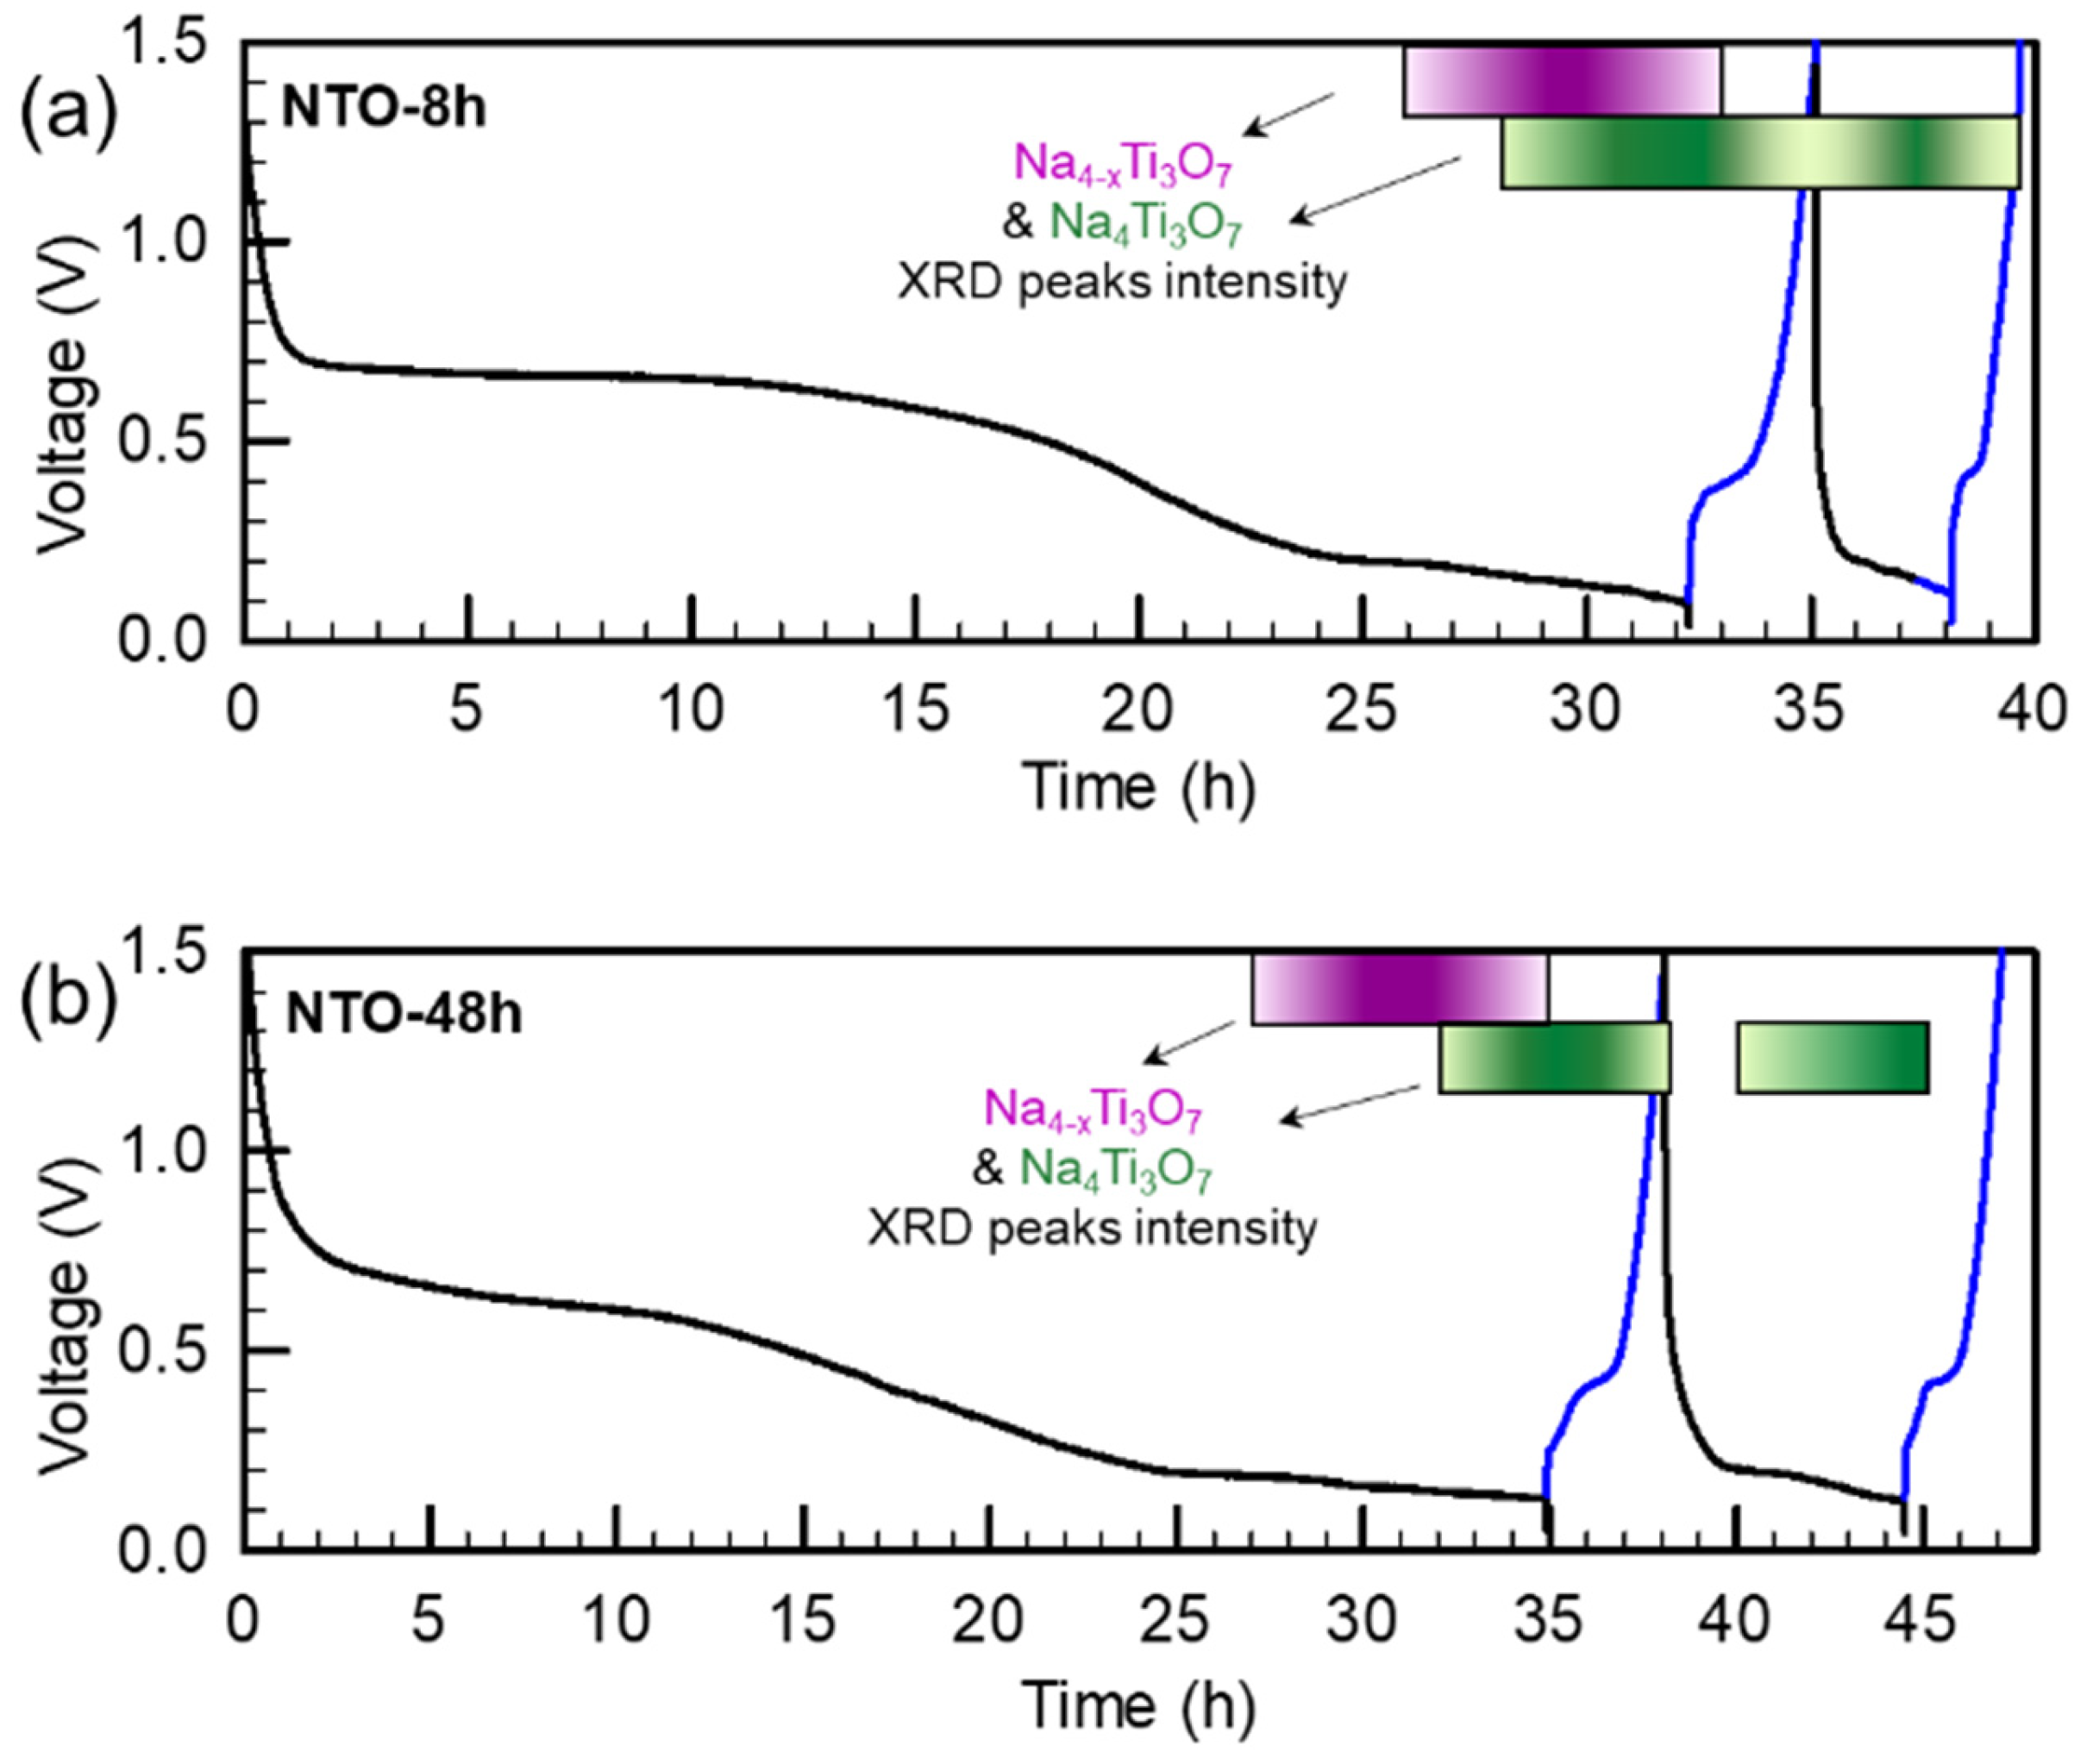
  • Sodium insertion involves formation of two phases Na4-xTi3O7 and Na4Ti3O7 as evidenced by Operando XRD.
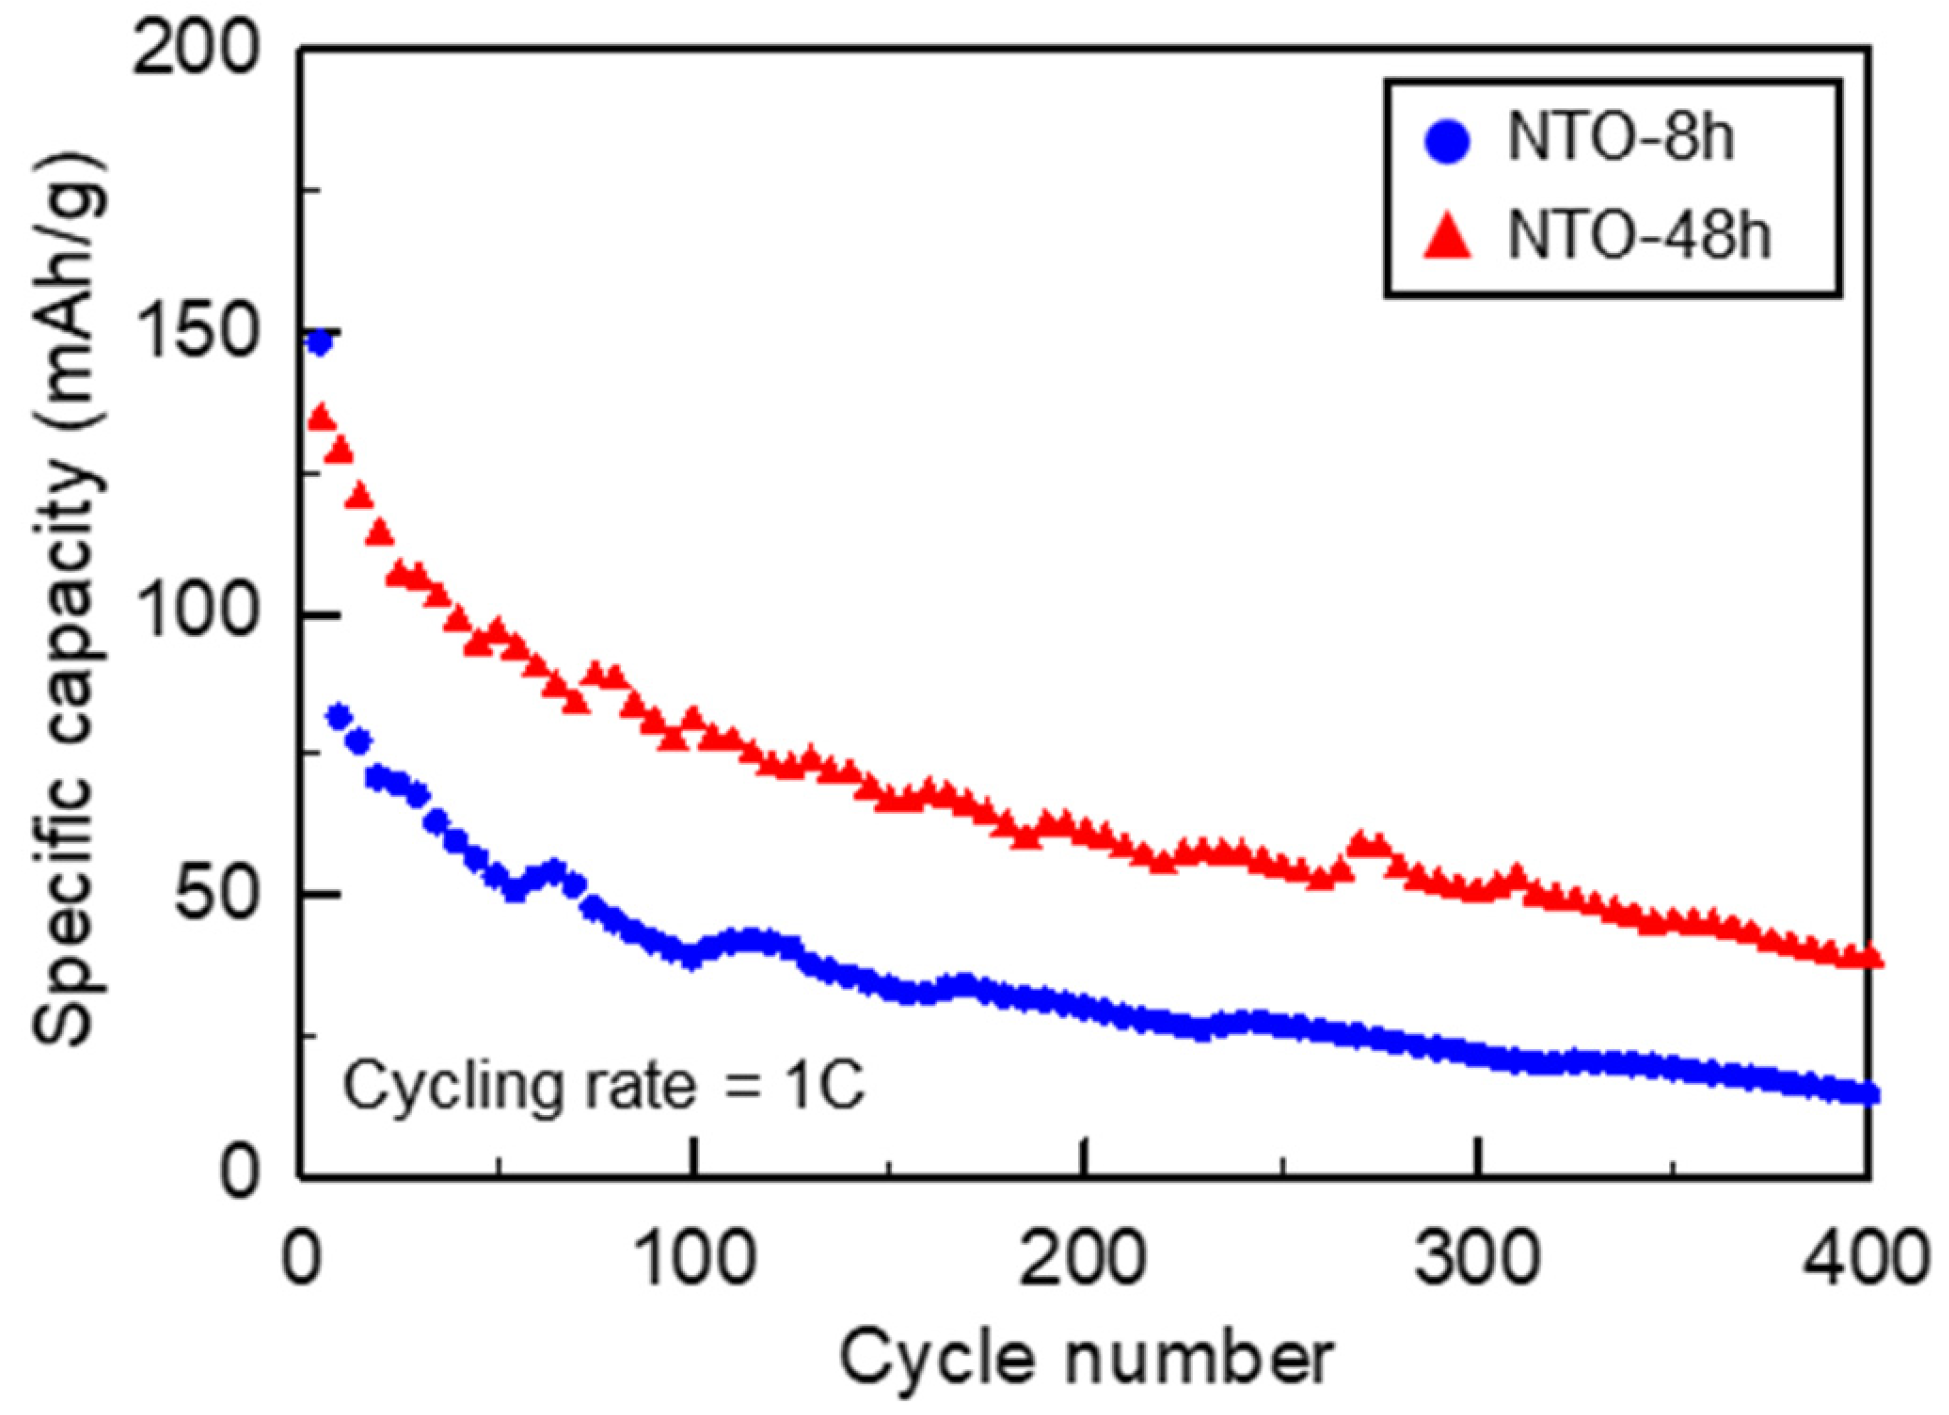
  • The increase in the calcination time leads to better reversibility of sodiation/desodiation and higher capacity.

Abstract

The growing interest in Na-ion batteries as a “beyond lithium” technologies for energy storage drives the research for high-performance and environment-friendly materials. Na2Ti3O7 (NTO) as an eco-friendly, low-cost anode material shows a very low working potential of 0.3 V vs. Na+/Na but suffers from poor cycling stability, which properties can be significantly influenced by materials synthesis and treatment. Thus, in this work, the influence of the calcination time on the electrochemical performance and the reaction mechanism during cycling were investigated. NTO heat-treated for 48 h at 800 °C (NTO-48h) demonstrated enhanced cycling performance in comparison to NTO heat-treated for only 8 h (NTO-8h). The pristine material was thoroughly characterized by X-ray diffraction, laser granulometry, X-ray photoelectron spectroscopy, and specific surface area measurements. The reaction mechanisms induced by sodiation/desodiation and cycling were investigated by operando XRD. Electrochemical impedance spectroscopy was used to evidence the evolution of the solid electrolyte interface layer (SEI) and modification of charge transfer resistances as well as the influence of cycling on capacity decay. The evolution of the crystallographic structure of NTO-48h revealed a more ordered structure and lower surface contamination compared to NTO-8h. Moreover, the residual Na4Ti3O7 phase detected after the sodium extraction step in NTO-8h seems correlated to the lower electrochemical performance of NTO-8h compared to NTO-48h.

1. Introduction

Due to the growing stress on the economic viability of Li-ion batteries as the dominant technology for energy storage devices, Na-ion batteries have emerged as a promising low-cost chemistry for energy storage. Indeed, sodium is a much more abundant element than lithium in the Earth’s crust. The lower energy density of Na is expected to mostly confine it to large-scale storage systems for grid storage applications [1,2,3,4]. To succeed in this transition, efficient electrode materials with high electrochemical performance need to be developed and their reaction mechanisms during the operation of the battery have to be well understood.
Right now the most common active anode materials for NIBs are hard carbons [5,6]. Despite these favorable properties, non-carbonaceous alternatives are also under investigation for cases where thermal stability is prioritized [7,8]. Na2Ti3O7 (NTO) is considered as a promising anode material for Na-ion batteries due to its low working potential of 0.3 V vs. Na+/Na [2,9] among intercalation oxide category materials. It can deliver theoretically 178 mAh/g with the intercalation of two additional sodium ions into its layer structure: Na2Ti3O7 + 2Na+ + 2e → Na4Ti3O7, so that 2/3 of the Ti4+ ions are reduced to Ti3+ ions [2,9,10]. Next to these advantages, NTO suffers from low electronic conductivity, limited cycling stability and poor capacity retention. These problems lead to a deterioration of the electrochemical performance [10,11,12].
As it was recently pointed out by Kulova et al. [13], the origins of these problems are various and sometimes even contradictory. Wang et al. [14] reported that, even if the crystal structure of NTO is very stable, the cycle irreversibility could be related to problems of Na+ extraction, then progressive saturation of intercalation sites by Na+ ions until inhibition of ionic transport and migration. According to Rudola et al. [15], diffusion problems could explain the capacity drop at high cycling rates: due to kinetic limitation, Na+ ions would have no time to intercalate/deintercalated into the structure of NTO. On the other hand, even if the delivered capacity of the material decreases with the increase in the cycling rate, Pan et al. [16] observed an increase in capacity fading at low current density because side reactions consuming large amounts of sodium have more time to occur. Incidental reactions with the carbon black [11,17,18] and/or with electrolyte [11,16,18,19] and/or binders [20] were also pointed as the origin of the first cycle irreversibility. Structural instability of the intercalated Na4Ti3O7 phase was reported by Xu et al. [17]. By contrast, Nava-Avendaño et al. [11] confirmed the good mechanical stability of this phase and reported that the exchange of Na+ by H+ ions during electrode preparation or storage of NTO material had no negative effect on the electrochemical performance because the H+ ions were further replaced by Na+ ions from the electrolyte [11]. Pan et al. [16] evidenced the formation of an intermediate phase during sodium intercalation into the NTO structure. Two close voltage plateaus at 0.289 and 0.403 V were observed during the first charge process but the first plateau disappeared during the following cycles. By reducing the particles size with a ball-milling step, the formation of the intermediate phase was suppressed and the electrochemical performance improved. The formation of an intermediate phase during the first cycle was also largely discussed by Rudola et al. [21]. According to these authors, the pathway Na2Ti3O7 ↔ Na3-xTi3O7 should be favored instead of the fully sodiated pathway Na2Ti3O7 ↔ Na4Ti3O7 because the polarization phenomena is alleviated, which leads to improved material stability and higher capacity retention.
In addition, the temperature of the heat treatment influences the crystallographic structure and purity of sodium titanates [15,22]. It should be noted that crystallographic structure and defects affect the electrochemical performance of NTO [23,24]. Moreover, both in the literature [25] and in our previous work [26], the higher capacities were obtained by NTO synthesized at 1000 °C than at 800 °C. If the temperature of the heat treatment affects electrochemical performance [25,26,27], it can be expected that the duration of the heat treatment could also impact the electrochemical properties.
Here, the investigation of the effect of the heat-treatment conditions (8 h or 48 h at 800 °C) on the electrochemical properties of the Na2Ti3O7 anode material is presented. Indeed, new clarifications on the sodiation/desodiation mechanism in Na2Ti3O7 induced by cycling in half-cell configuration, using operando XRD are demonstrated. Although a few previous works by in situ [2,25] or ex situ XRD [21] already showed the charge/discharge process in NTO, we provide new insights in different electrochemical performances of NTO influenced by cycling and heat treatment durations (8 h and 48 h). The operando XRD measurements are complemented by other characterization results by means of ex situ XRD, XPS, laser granulometry, BET specific surface area, scanning electron microscopy, cyclic voltammetry and galvanostatic cycling) aiming at a comprehensive and complete view of the structural, morphological, surface and electrochemical properties.

2. Materials and Methods

2.1. Materials

TiO2 (Degussa P25, 99.5+%), Duramax D-3005 (ammonium salt of a polyelectrolyte, dispersing agent kindly provided by Dow Chemical), Na2CO3 (Sigma Aldrich, Belgium), carbon black (50% compressed Alpha Aesar, Germany), multiwall carbon nanotubes (CNT, 3 wt % dispersion ORGACYL™ NMP0502 (Nanocyl, Sambreville, Belgium), carbon black (CB Alpha Aesar, 50% compressed), N-methyl-2-pyrrolidone (NMP, Sigma Aldrich), polyvinylidene fluoride (PVDF, Sigma Aldrich), NaClO4 (Sigma Aldrich), propylene carbonate (PC, Sigma Aldrich) and ethylene carbonate (EC, Sigma Aldrich) were used as received.

2.2. Synthesis

An aqueous suspension containing the TiO2 (10 wt %) and Na2CO3 precursors in a stoichiometric ratio was prepared as described in our previous work [26]. The spray-drying synthesis step was conducted in the air using a Niro Mobile Minor spray-dryer with a bifluid nozzle. The inlet temperature was set at 190 °C to target an outlet temperature of 110–120 °C. The flow rate was set at 25 mL/min and the air pressure at 1 bar. The as-sprayed powders were then heated at 800 °C for 8 h (NTO-8h) or 48 h (NTO-48h).

2.3. Characterization

2.3.1. Structure Characterization by XRD

The structural properties of the Na2Ti3O7 powders of samples NTO-8h and NTO-48h were investigated by using the powder XRD technique. The samples were deposited on a zero-background silicon sample holder and then inserted in a Bruker D8-Eco diffractometer equipped with a copper X-ray tube (CuKα radiation wavelength = 1.5418 Å, 40 kV, 30 m), (Bruker AXS GmbH, Karlsruhe, Germany). The radiation was filtered with a Ni filter, in order to completely remove the Kbeta contribution. Scans in the range of 10 to 100° 2θ, with a step of 0.02° 2θ, and with a counting time of 10 s/step, were realized. The Bruker software TOPAS 4.2 (Bruker AXS GmbH, Karlsruhe, Germany) was then used to perform the Rietveld refinement of the XRD patterns. Experimental details concerning the refinements are given in Table S1. Starting atomic coordinates, unit-cell parameters and the space group were taken from the work of Yakubovich & Kireev [28]. After the refinement of experimental parameters (scale factor, unit-cell parameters, background, zero-point, sample displacement, absorption, roughness, FWHM, profile, and preferred orientation), atomic coordinates were released carefully, and the site occupancy factors for Ti and Na atoms were refined. Displacement parameters were constrained to 1 for all atoms.

2.3.2. Particles Size and Morphology

Particle size and morphological properties were evaluated by laser granulometry Malvern Mastersizer 2000 Hydro (GEMINI, Apeldoorn, The Netherlands) and scanning electron microscopy ESEM Philips XL-30 at 15 kV (FEI XL30 ESEM-FEG, FEI, Eindhoven The Netherlands). The BET specific surface area was determined from N2 sorption isotherms measured at 77 K for relative pressure P/P0 between 0 and 0.3 with a Micromeritics Asap 2020 Plus instrument (Micromeritics Instrument Corp., Norcross, USA). Degassing was applied for 180 min at 150 °C with a heating ramp of 10 °C/min. The Rouquerol criteria were used to select the pressure range used to estimate the BET surface [29] and set the pressure range under N2 from 0 to 0.3 with a 0.03 step.

2.3.3. Surface Chemical Characterization XPS

X-ray photoelectron spectroscopy analysis was performed using an XPS Thermo Electron Escalab 250 spectrometer (Thermo Electron Corp., Warwickshire, UK) operating at 2 × 10⁻⁹ mbar vacuum during analysis. The spectrometer was calibrated with Au 4f7/2 at 84.1 eV. A monochromatic, micro-focusing, Al Kα X-ray source ( = 1486.6 eV) was used. All analyses were conducted with a 500-μm X-ray spot size beam with a take-off angle of 90° to the sample surface. The survey spectra were performed with a pass energy of 100 eV and high-resolution core level spectra (Ti 2p, O 1s, Na 1s, C 1s) with a pass energy of 20 eV. The spectra fitting was performed using the AvantageTM software (Thermo Electron Corp., Warwickshire, UK). For the peak fitting a Shirley type background and Lorentzian/Gaussian 30/70 peak shape was applied.

2.3.4. Cell Preparation and Electrochemical Tests

The working electrode was prepared by dispersing NTO, CB, CNT, and PVDF binder in NMP solvent (NTO:C:PVDF = 70:20:10 wt.; CB:CNT = 1:3) with planetary miller Retsch PM400/2 (Haan, Germany) using zirconia balls with a diameter of 1.5 mm at 400 rpm during 20 min and then at 250 rpm during 60 min. The slurry was tape-casted Byko-drive XL, V (BYK-Gardner Europe, ALTANA Group, Geretsried, Germany) on copper foil and dried at 110 °C for 12 h under the vacuum to remove the solvent.
Metallic Na was used as a reference and counter electrode. The electrolyte consists of a 1 M solution of NaClO4 in a mixture of PC:EC (v:v = 1:1) solvent and glass fiber Whatman was used as a separator. Electrochemical measurements were performed in coin cell configuration (2032) with a multichannel BTS Neware Potentiostat (cycling) and a multichannel BioLogic VMP3 Potentiostat (cyclic voltammetry) in a voltage window of 0.05–1.5 V vs. Na+/Na.

2.3.5. Operando X-ray Diffraction

The working electrode was prepared by dispersing NTO and carbon black powders in an agate mortar. Electrochemical operando XRD was performed in Bragg-Brentano geometry using a Bruker D8 Twin-Twin 40 kV, 30 mA (Bruker AXS GmbH, Karlsruhe, Germany) diffractometer with Cu Kalpha radiation and Lynxeye XET 1D-detector (Bruker, Karlsruhe, Germany). A specific cell with a beryllium window (Figure S1) was used as described by Leriche et al. [30]. XRD data were collected in the 10–48° 2θ-range with a 0.02° step-size and a 1.8 s/strip step time. A full XRD scan was collected in 1 h, while the cycling of the material was performed at a rate of C/20. For the Rietveld refinement, the XRD patterns were fitted using the TOPAS software by applying the fundamental parameters approach to model the instrumental contribution. The structural model was taken from the PDF4+ database (# 04-015-7486) [28]. Occupation factors were fitted for sodium sites and fixed titanium and oxygen sites. It should be noted that due to the low resolution of the operando XRD patterns, the plots of the site occupation factors (SOF) of sodium were used to show trends.

2.3.6. Electrochemical Impedance Spectroscopy (EIS)

EIS measurements were performed at room temperature in three-electrode Swagelok configuration with NTO-8h and NTO-48h electrodes and metallic Na as a reference and counter electrode using a Biologic VMP3. EIS measurements were obtained in a frequency range from 1 MHz to 10 mHz (6 points per decade) at OCV and different voltages in discharge and charge for the first and second cycles.

3. Results and Discussion

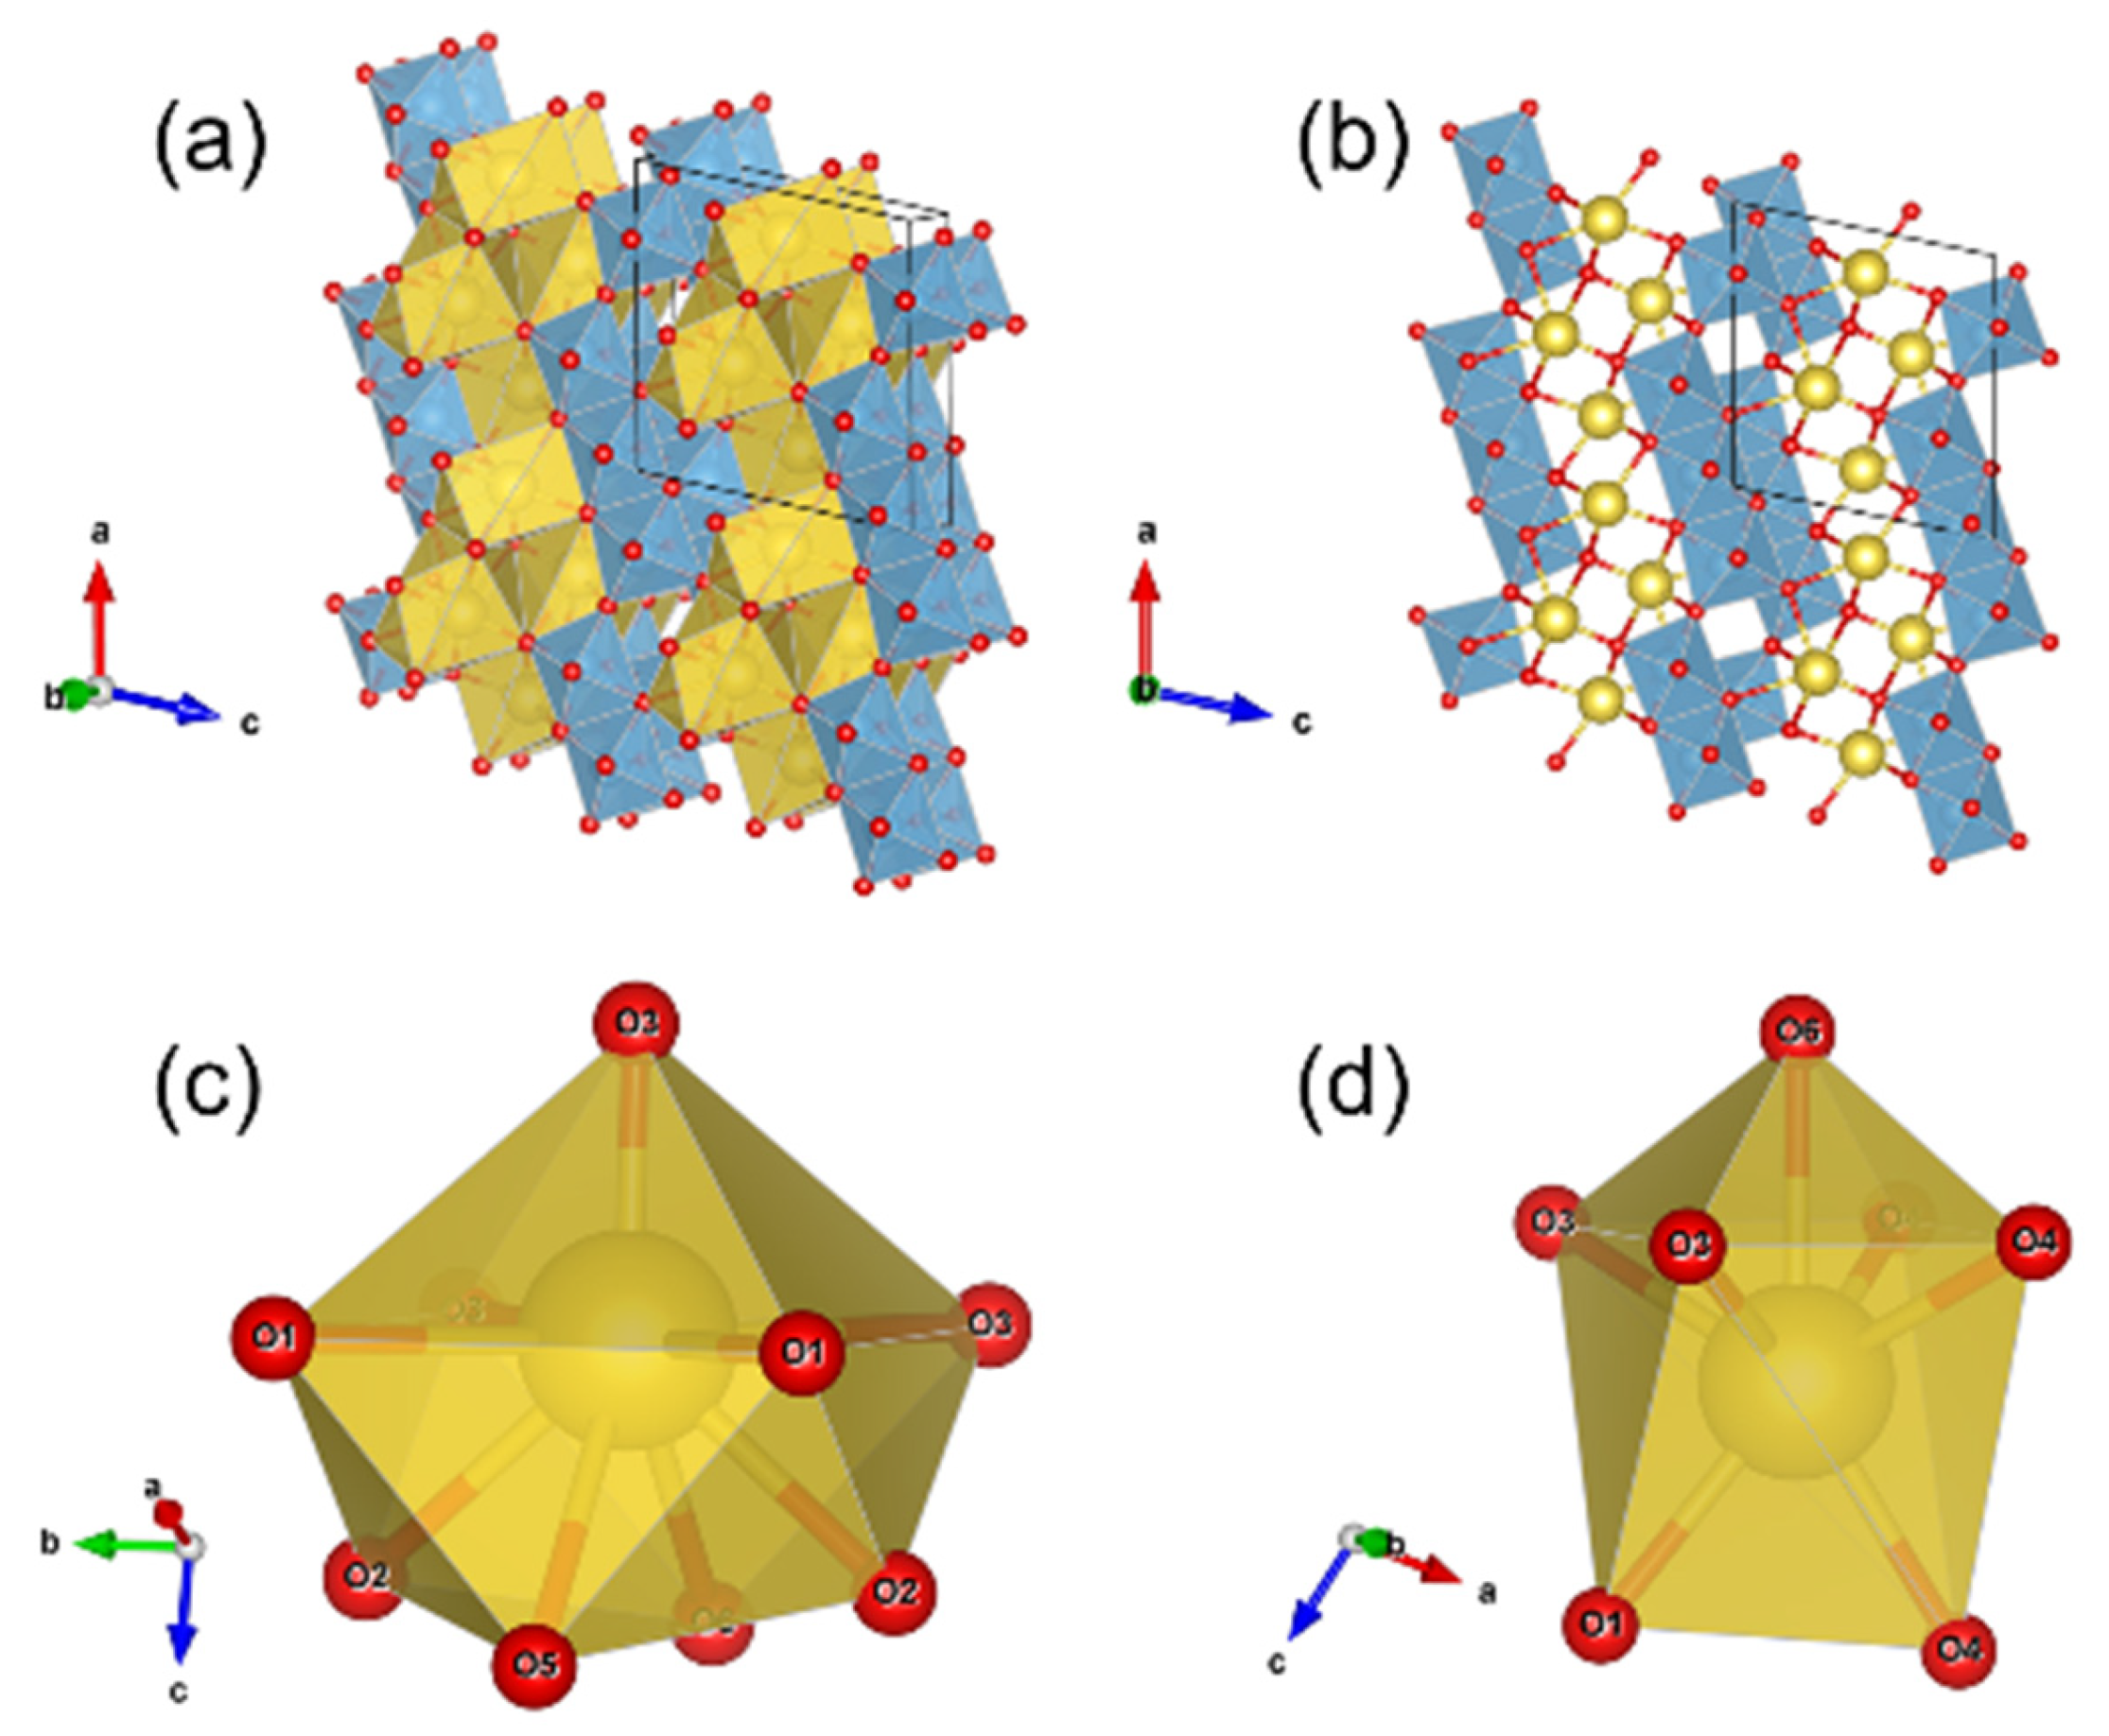
3.1. Structural Properties of the NTO Pristine Materials

The structural analysis of the pristine NTO-8h (Figure S2) and NTO-48h (Figure S3) samples was performed by XRD using the Rietveld refinement method. The final RBragg values were 5.32% and 3.92% for NTO-8h and NTO-48h samples, respectively (Table S1). The atomic coordinates, temperature factors, site occupancies, and selected bond distances are summarized in Tables S2 and S3. The structure model for NTO-48h sample fits better than for NTO-8h, as shown by lower RBragg values and lower standard deviations for all parameters (Tables S1–S3). The Na2Ti3O7 structure is similar to those described by Andersson & Wadsley (JCPDS # 04-009-3663) [31] and by Yakubovich & Kireev (JCPDS # 04-015-7486) [28]. It consists of edge-sharing TiO6 octahedra forming ribbons aligned along the b axis (Figure 1a). These zig-zag ribbons show three octahedra of width, which are connected to adjacent ribbons by sharing octahedral corners. These connected ribbons form octahedral kinked sheets align parallel to the (001) plane (Figure 1b).
Between the octahedral Ti-bearing sheets, the Na atoms are localized in two types of crystallographic sites: the Na1O9 site (Figure 1c) and the Na2O7 site (Figure 1c). The Na1O9 polyhedron geometry is quite complex, which can be described as a square pyramid with four supplementary oxygen localized at the opposite of the pyramid apex (Figure 1c). The Na2O7 polyhedron corresponds to a square pyramid with its square face adjusted on the square face of a trigonal prism (Figure 1d).
Bond-valence sums were calculated according to the parameters of Brown & Altermatt [32], and indicate values close to 4 for Ti and to 1 for Na atoms (Table S3). This confirms the cation distributions, as well as the valence state of Ti. The bond-valence sum for Na2 is significantly lower than that of Na1 (Table S3), confirming the lower site occupancy factor of Na2 (Table S2). Bond-valence sums for oxygen atoms are between 1.83 and 2.12 (NTO-8h) and between 1.72 and 2.13 (NTO-48h), in good agreement with the valence of oxygen. The site occupancy factors for Na1, Ti1, Ti2, and Ti3 for NTO-48h, are close to 1, confirming the distributions of these cations in the crystal structure (Table S2).
As described by Papp et al. [22], the temperature of the heat treatment can influence the crystallographic structure of sodium titanates. Surprisingly, it was previously reported by Rudola et al. [15] that increasing the heat treatment from 10 h to 20 h and from 10 h to 40 h, at 800 °C, depending on the sodium precursor, can lead to a decrease in the purity of Na2Ti3O7 material. By extension, the duration of the heat treatment could impact the structure and the purity of the material prepared in this work.
Yakubovich & Kireev [32] described in detail the distortion of the TiO6 octahedra in the Na2Ti3O7 structure. The authors explain that, due to the very dense packing of TiO6 octahedra, a relatively strong distortion appears, mainly of the Ti2O6 and Ti3O6 polyhedra. In these polyhedra, a very short titanyl bond occurs, with a Ti-O distance around 1.70–1.75 Å. At the opposite, a very long bond forms with Ti-O around 2.18–2.25 Å. In the investigated compounds herein, the differences between Ti-O bond distances are less pronounced, leading to octahedral, and not pyramidal, coordination polyhedra.
In order to better evaluate the polyhedral distortion, bond-length distortion coefficients (BLD) were calculated according to the method established by Renner & Lehmann [32]. BLD coefficients are between 4.4 and 6.5% for TiO6 octahedra, indicating a global low distortion for these sites (Table S3). Ti1O6 shows distortion coefficients of 6.47% (NTO-8h) and 6.01% (NTO-48h), significantly higher than the BLD values for Ti2O6 and Ti3O6 polyhedra (Table S3). This observation is in contradiction with Yakubovich & Kireev [28], who demonstrated that the Ti1O6 octahedra is more distorted than the Ti2O6 and Ti3O6 octahedra.
Concerning the sodium sites, BLD coefficients indicate that the Na1O9 site is strongly distorted, with values of 7.37 (NTO-8h) and 7.50% (NTO-48h), while the Na2O7 site is less distorted, with BLD values of 2.85% (NTO-8h) and 2.90% (NTO-48h) (Table S3).
A comparison of the distortion coefficients, between the two samples, indicates that the sodium sites do not show significant variations in their distortion with the increase in the calcination duration. On the contrary, the TiO6 octahedra are significantly less distorted when the synthesis duration increases (Table S3). These observations indicate that: (1) the increase in the synthesis duration leads to ordered structure, with less distorted coordination polyhedra, and (2) the distortion of framework TiO6 polyhedra is more affected by modifications of the synthesis conditions than the extra-framework NaOx polyhedra.

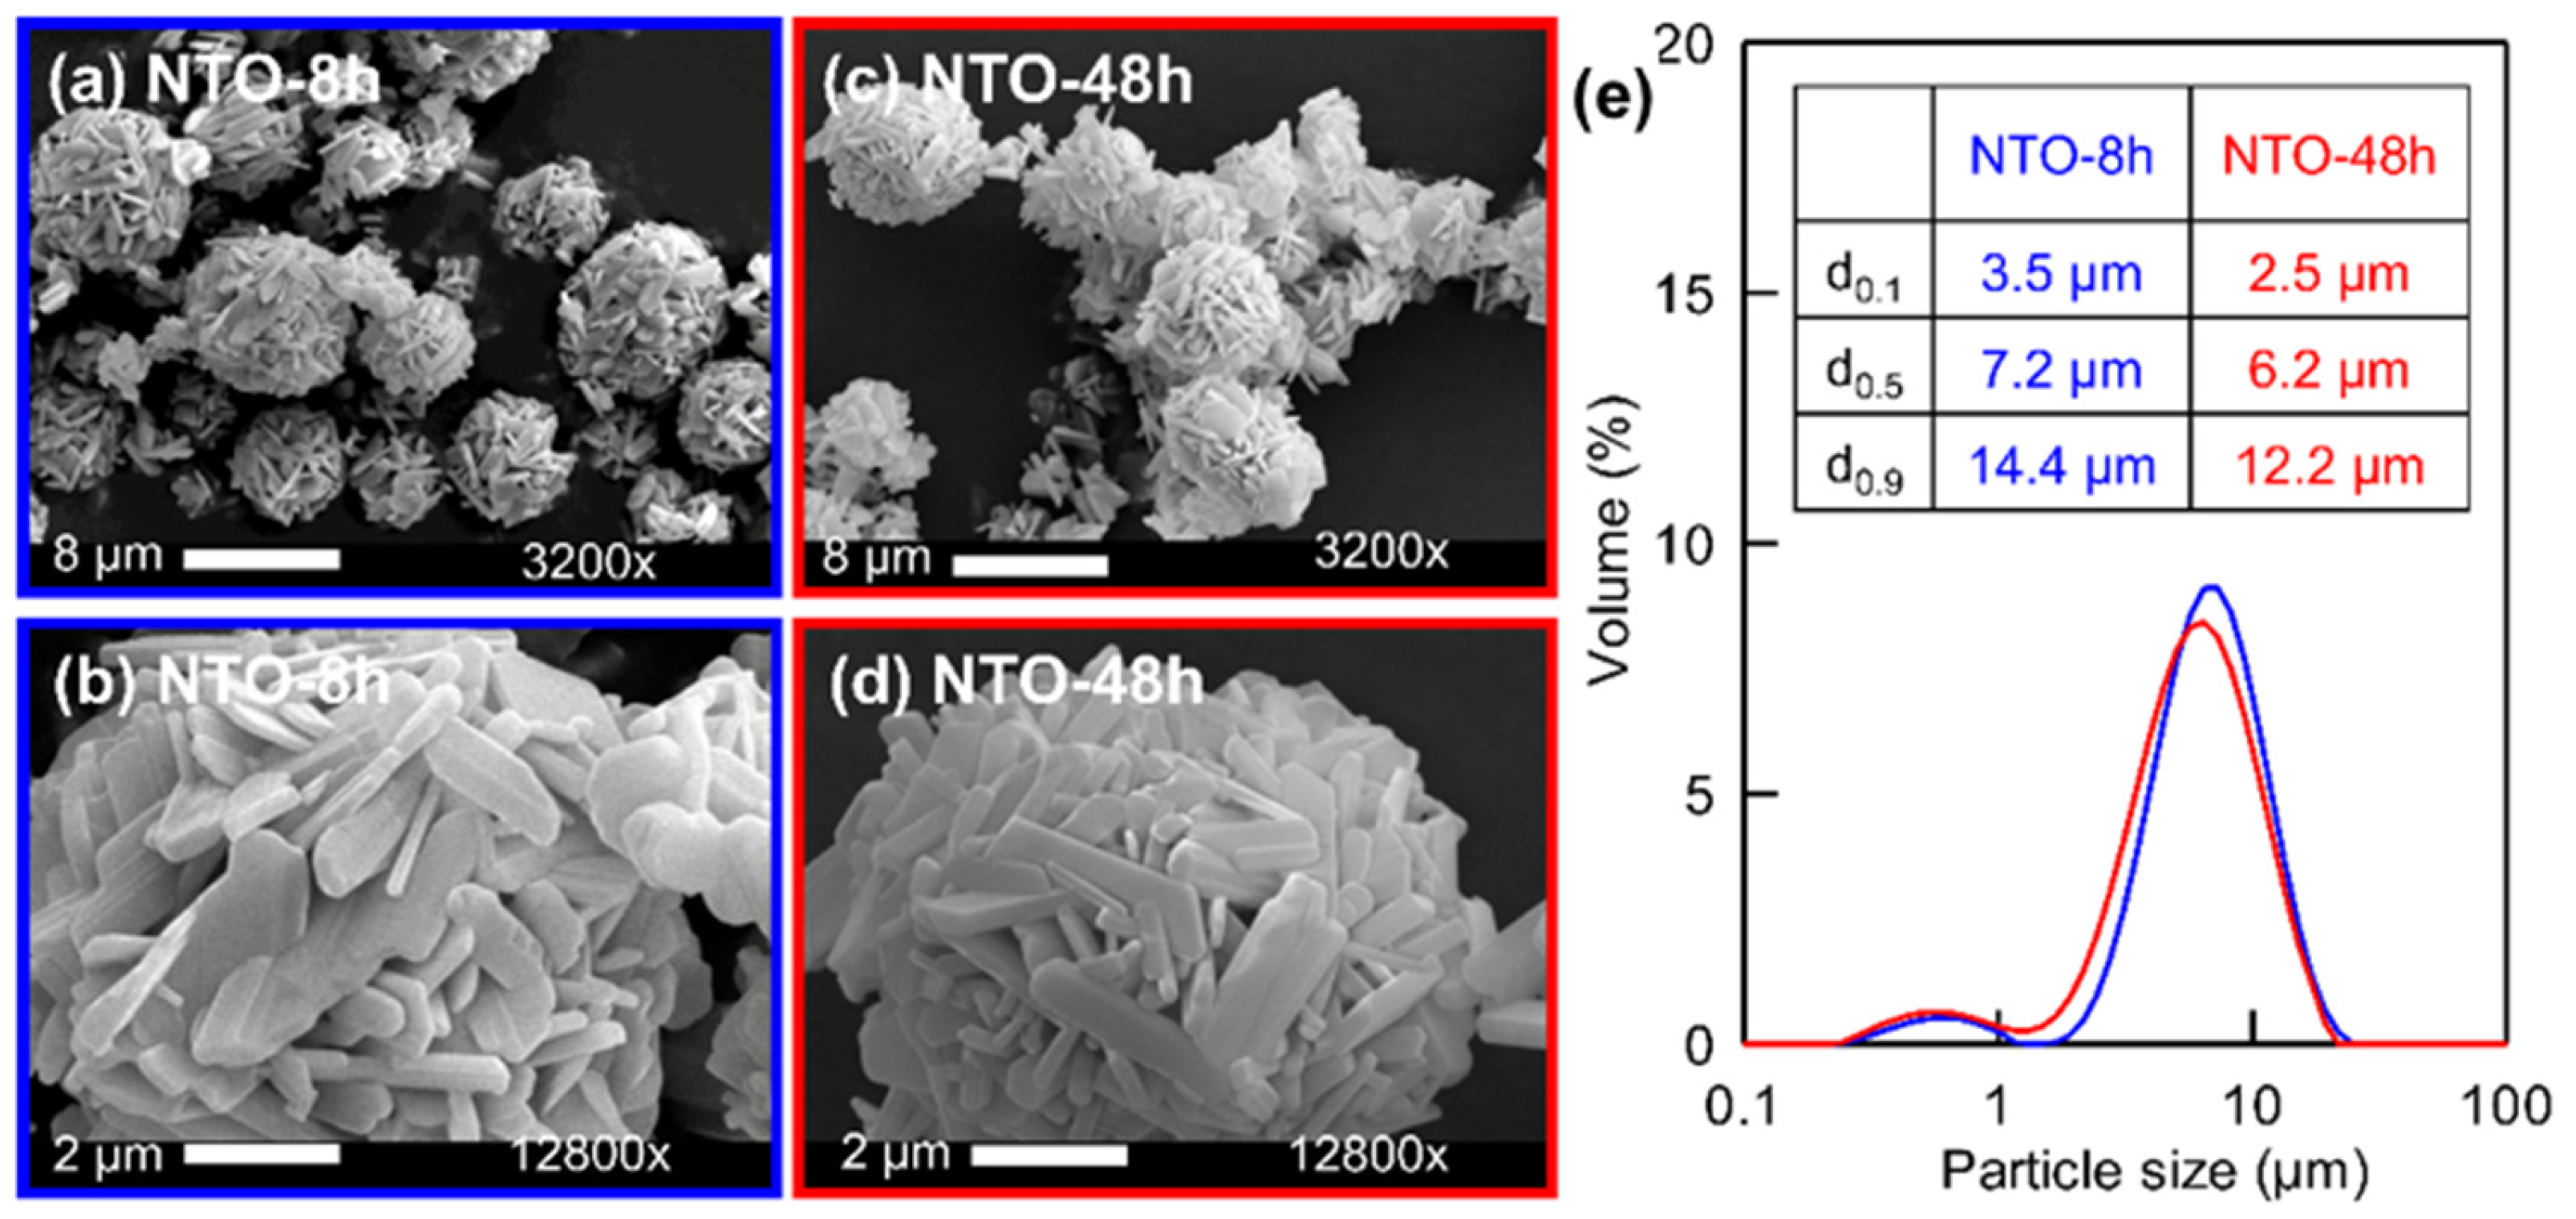
3.2. Microstructure of the Raw Materials

Scanning electron microscopy was used to determine the morphological properties of the NTO particles for both samples. It can be observed that NTO particles are rod- and platelet-like shape particles in the size range of 0.1–0.8 µm width and 0.1–5 µm length regardless of the heat treatment time (Figure 2a–d). These primary particles are agglomerated forming spheres due to the spray-drying process. These results are similar to the NTO spray-drying synthesis process reported previously [18,26]. Nevertheless, this work [18] describes severe particles aggregation and broken spray-dried spheres when increasing the heating time from 5 h to 10 h at 800 °C. Here in our work, no aggregation is observed when increasing the heating time to 48 h for NTO-48h material produced (Figure 2c,d).
The laser granulometry measurements provided complete particle size distribution (Figure 2e) of the spray-dried sphere, after heat-treatment. The d0.5 value is 7.2 µm for NTO-8h and 6.1 µm for NTO-48h. This slight difference is probably due to the sintering effect, enhanced for NTO-48h due to the longer heat treatment duration. The specific surface area measured by BET is equal to 4.28 m2/g (NTO-8h) and 3.64 m2/g (NTO-48h). NTO-48h shows a little lower specific surface area probably due to shrinkage. Nevertheless, during the electrode preparation, the spheres will be grounded (deagglomeration of the primary particles) to increase the specific surface area and ensure a better contact with the electrolyte, leading to enhanced ionic diffusion.

3.3. Chemical Characterisation by XPS

The surface chemical characterization of the pristine NTO-8h and NTO-48h were performed by XPS and the spectra (Ti 2p, O 1s and Na 1s) are presented in Figure 3. For Ti, spin-orbit components (Ti 2p3/2 and Ti 2p1/3) with a splitting value of 5.7 eV are present (Figure 3a,b). The Ti 2p3/2 peak at binding energy of 458.2 eV indicates the presence of Ti4+ [33,34,35], which is in agreement with the existence of Ti4+ in Na2Ti3O7 as demonstrated by previous XPS on the NTO material [15,36].
Similar shapes of Na 1s peaks at 1472.3 eV are observed for both samples. However, it should be noted that the Na 1s peak is overlapped with the Ti LMM Auger peaks at the lowest and the highest binding energies (as shown in Figure 3f). The modified Auger parameter for Na was determined from the energy shift between the Na 1s photoelectron line and the Na KL23L23 Auger line (α′ = KENaKL23L23 + BENa 1s= (-BENaKL23L23) + BENa 1s). The kinetic energy of Na KL23L23 was similar for both samples of around 990.9 eV. Similar modified Auger parameter for both samples of 2062.2 eV indicates the presence of the same chemical state of sodium in Na2Ti3O7 [37,38].
Both samples also display similar shapes of O 1s spectra. Four O 1s peaks can be distinguished: the first one at 529.7 eV attributed to Ti-O bonding, the higher binding energy peak at 531.6 eV corresponding to OH− (hydroxyl group) and C−O bond, the third one at 533.4 eV assigned to O−C=O species, and the highest binding energy peak at 534.9 eV assigned to Na KLL Auger line [33,34,35]. The presence of C-O related species originates from organic, surface contaminations usually present on sample surfaces exposed to the ambient air. Their presence can be also confirmed from the decomposition of C 1s peak. Thus, from a decomposition of O 1s peaks and C 1s, a lower quantity of surface contamination can be observed for sample NTO-48h than for NTO-8h. Moreover, higher discrepancies in stoichiometry of O/Ti and O/Na on the surface of NTO-8h were also observed, indicating some deficiencies in oxygen in Na2Ti3O7.

3.4. Electrochemical Properties

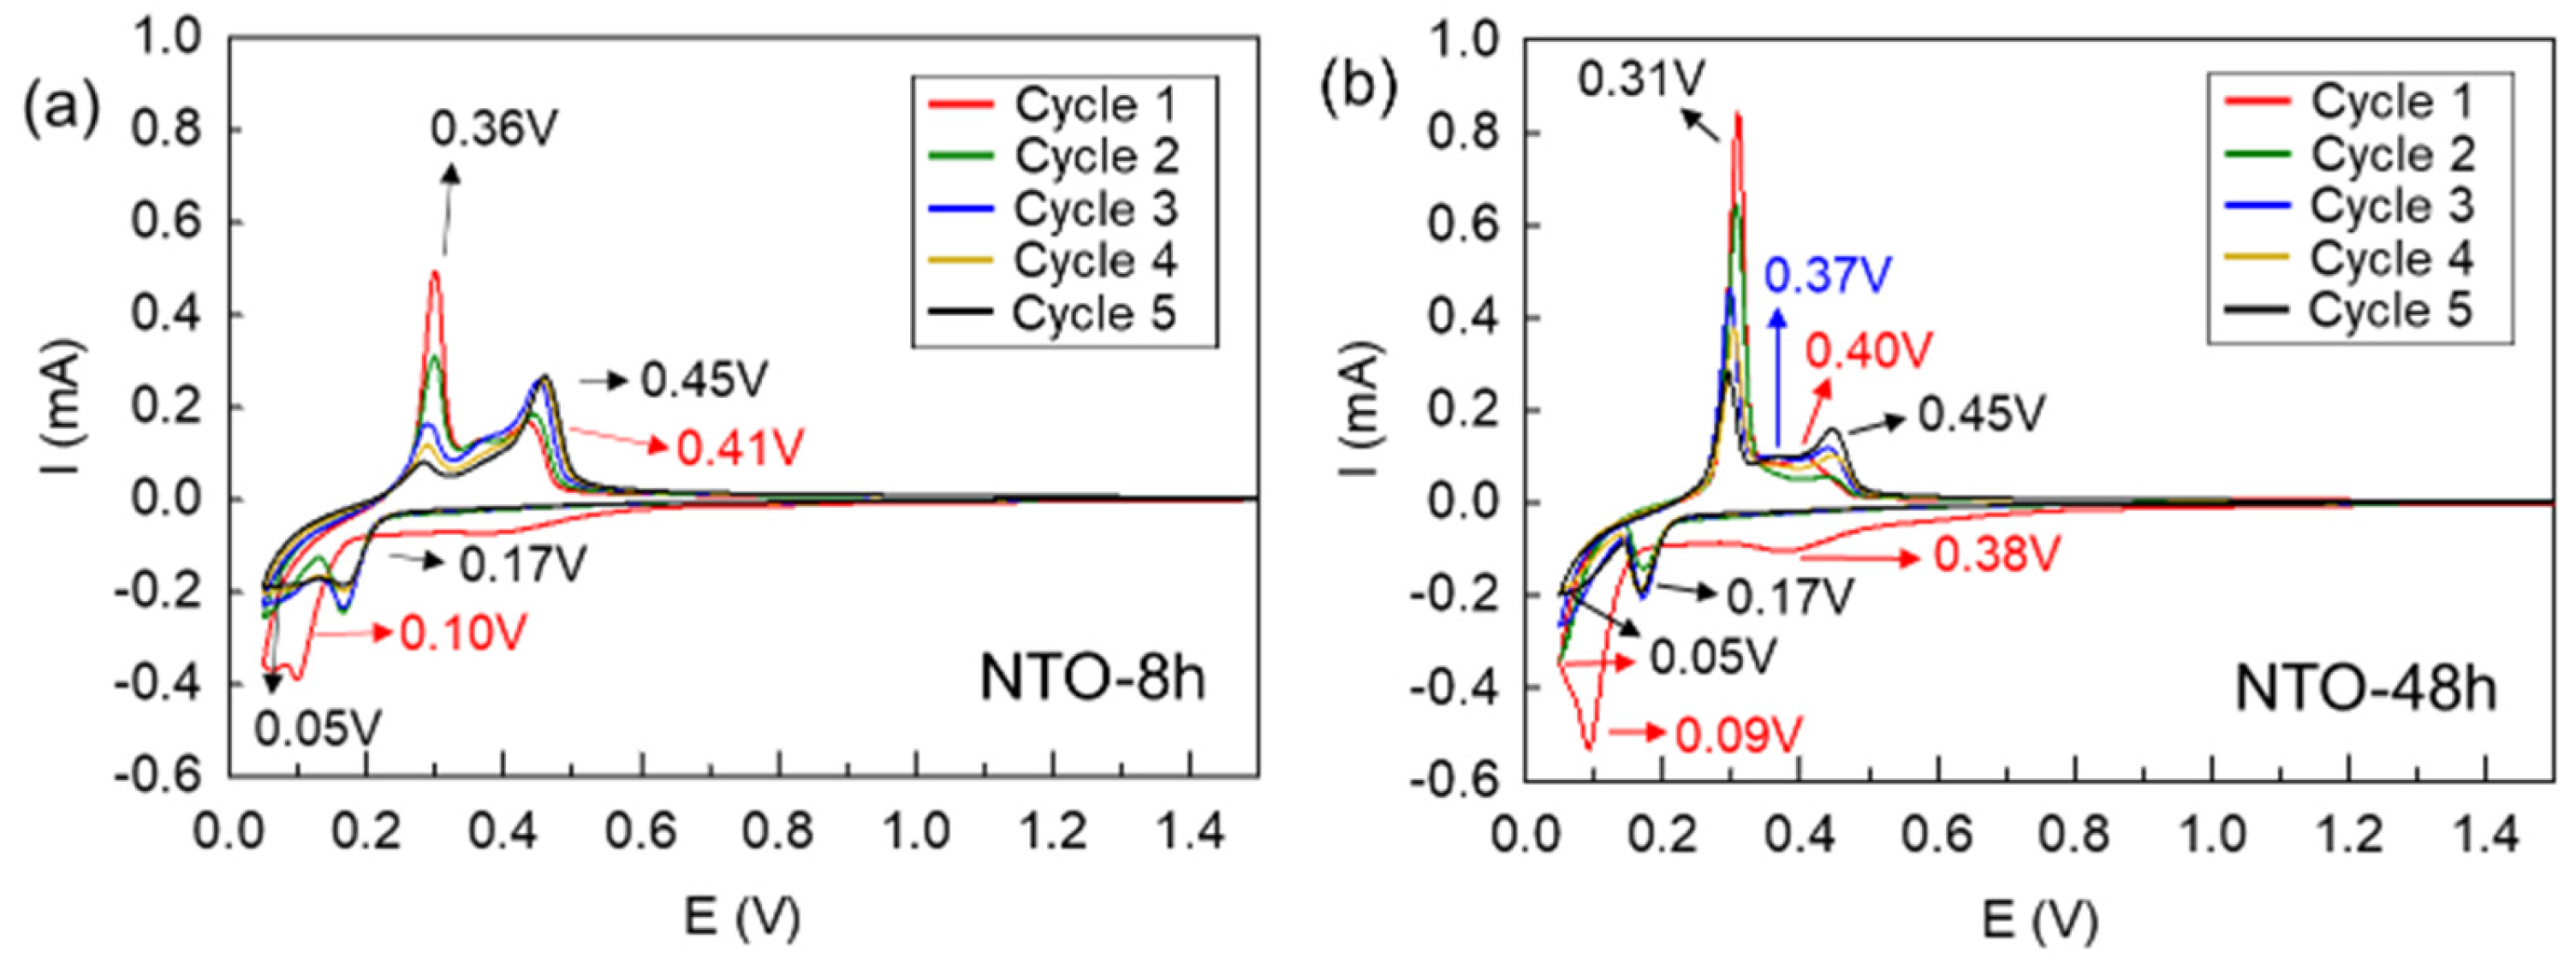
3.4.1. Cyclic Voltammetry

To gain insight into the electrochemical behavior of NTO-8h and NTO-48h as anode materials, cyclic voltammetry was conducted in the voltage range of 0.05–1.5 V vs. Na+/Na (Figure 4a,b). The general shape of the CV curves is comparable to results reported in several previous studies [13,16,18,39]. During the first reduction process (red), two peaks correspond to Na+ insertion at 0.10 and 0.05 V for NTO-8h and at 0.09 and 0.05 V for NTO-48h according to the following Equations (1) and (2), which is consistent with the literature [13]:
First peak:    Na2Ti3O7 + xNa → Na4-xTi3O7
Second peak:  Na4-xTi3O7 + yNa → Na4Ti3O7
The additional reduction peak at the higher voltage of 0.41 V (NTO-8h) or 0.38 V (NTO-48h) is attributed to the formation of SEI (Solid Electrolyte Interface) and side reactions with carbon black [2,13,15,18,19]. During the next cycles, the reduction peak corresponding to the SEI layer formation and side reactions is not anymore observed and the Na+ insertion peaks at 0.05 V and 0.17 V can be still present. These results are very similar to the results of Kulova et al. [13], who also showed two peaks of sodiation at 0.04 and 0.12 V.
By contrast, the oxidation process for NTO-8h is very different than for NTO-48h. For NTO-8h, at the first cycle, oxidation occurs in three steps: 0.30 V, 0.38 V, and 0.46 V. The previous investigations [13] reported the presence of one peak at 0.33 V, which was described as a superposition of two or three peaks. In this study, the peak at 0.30 V is more intense than the other peaks and decreases gradually during the following cycles. The second peak at 0.36 V seems to disappear progressively in favor of the peak at 0.45 V up to complete extinction at the fourth cycle. According to the literature, this phenomenon can be related to the irreversibility of Na+ extraction process but also to the structural evolution and phase modifications [13,15].
For NTO-48h, at the first cycle only two peaks are noticeable at 0.31 and 0.40 V. As for NTO-8h, the intensity of the first peak diminished progressively over the cycles. At the second cycle, the peak at 0.40 V vanished and another one appeared at 0.45 V. The third cycle (in blue) is different because a new peak at 0.37 V (not well marked, as for NTO-8h) appears. The intensity of these two new peaks increases gradually in the fourth and fifth cycles. This result is similar to the observations of Rudola et al. [15], where the oxidation peak at 0.28 V decreased, while the intensity of the one at 0.44 V increased. These phenomena could be related to structural changes during electrochemical cycling [16] but also to the multi-step sodium insertion/extraction process that implies the formation of an intermediate phase Na4-xTi3O7 [13,21]. This will be further discussed in Section 3.4.4.
It should be also noticed that for NTO-48h (Figure 5b) the intensities of reduction and oxidation peaks are higher than for the NTO-8h sample (Figure 5a), which implies better electrochemical performance of the NTO-48h sample related probably to its more ordered structure as aforementioned in Section 3.1. The electrochemical performances are further discussed in the following Section 3.4.2.

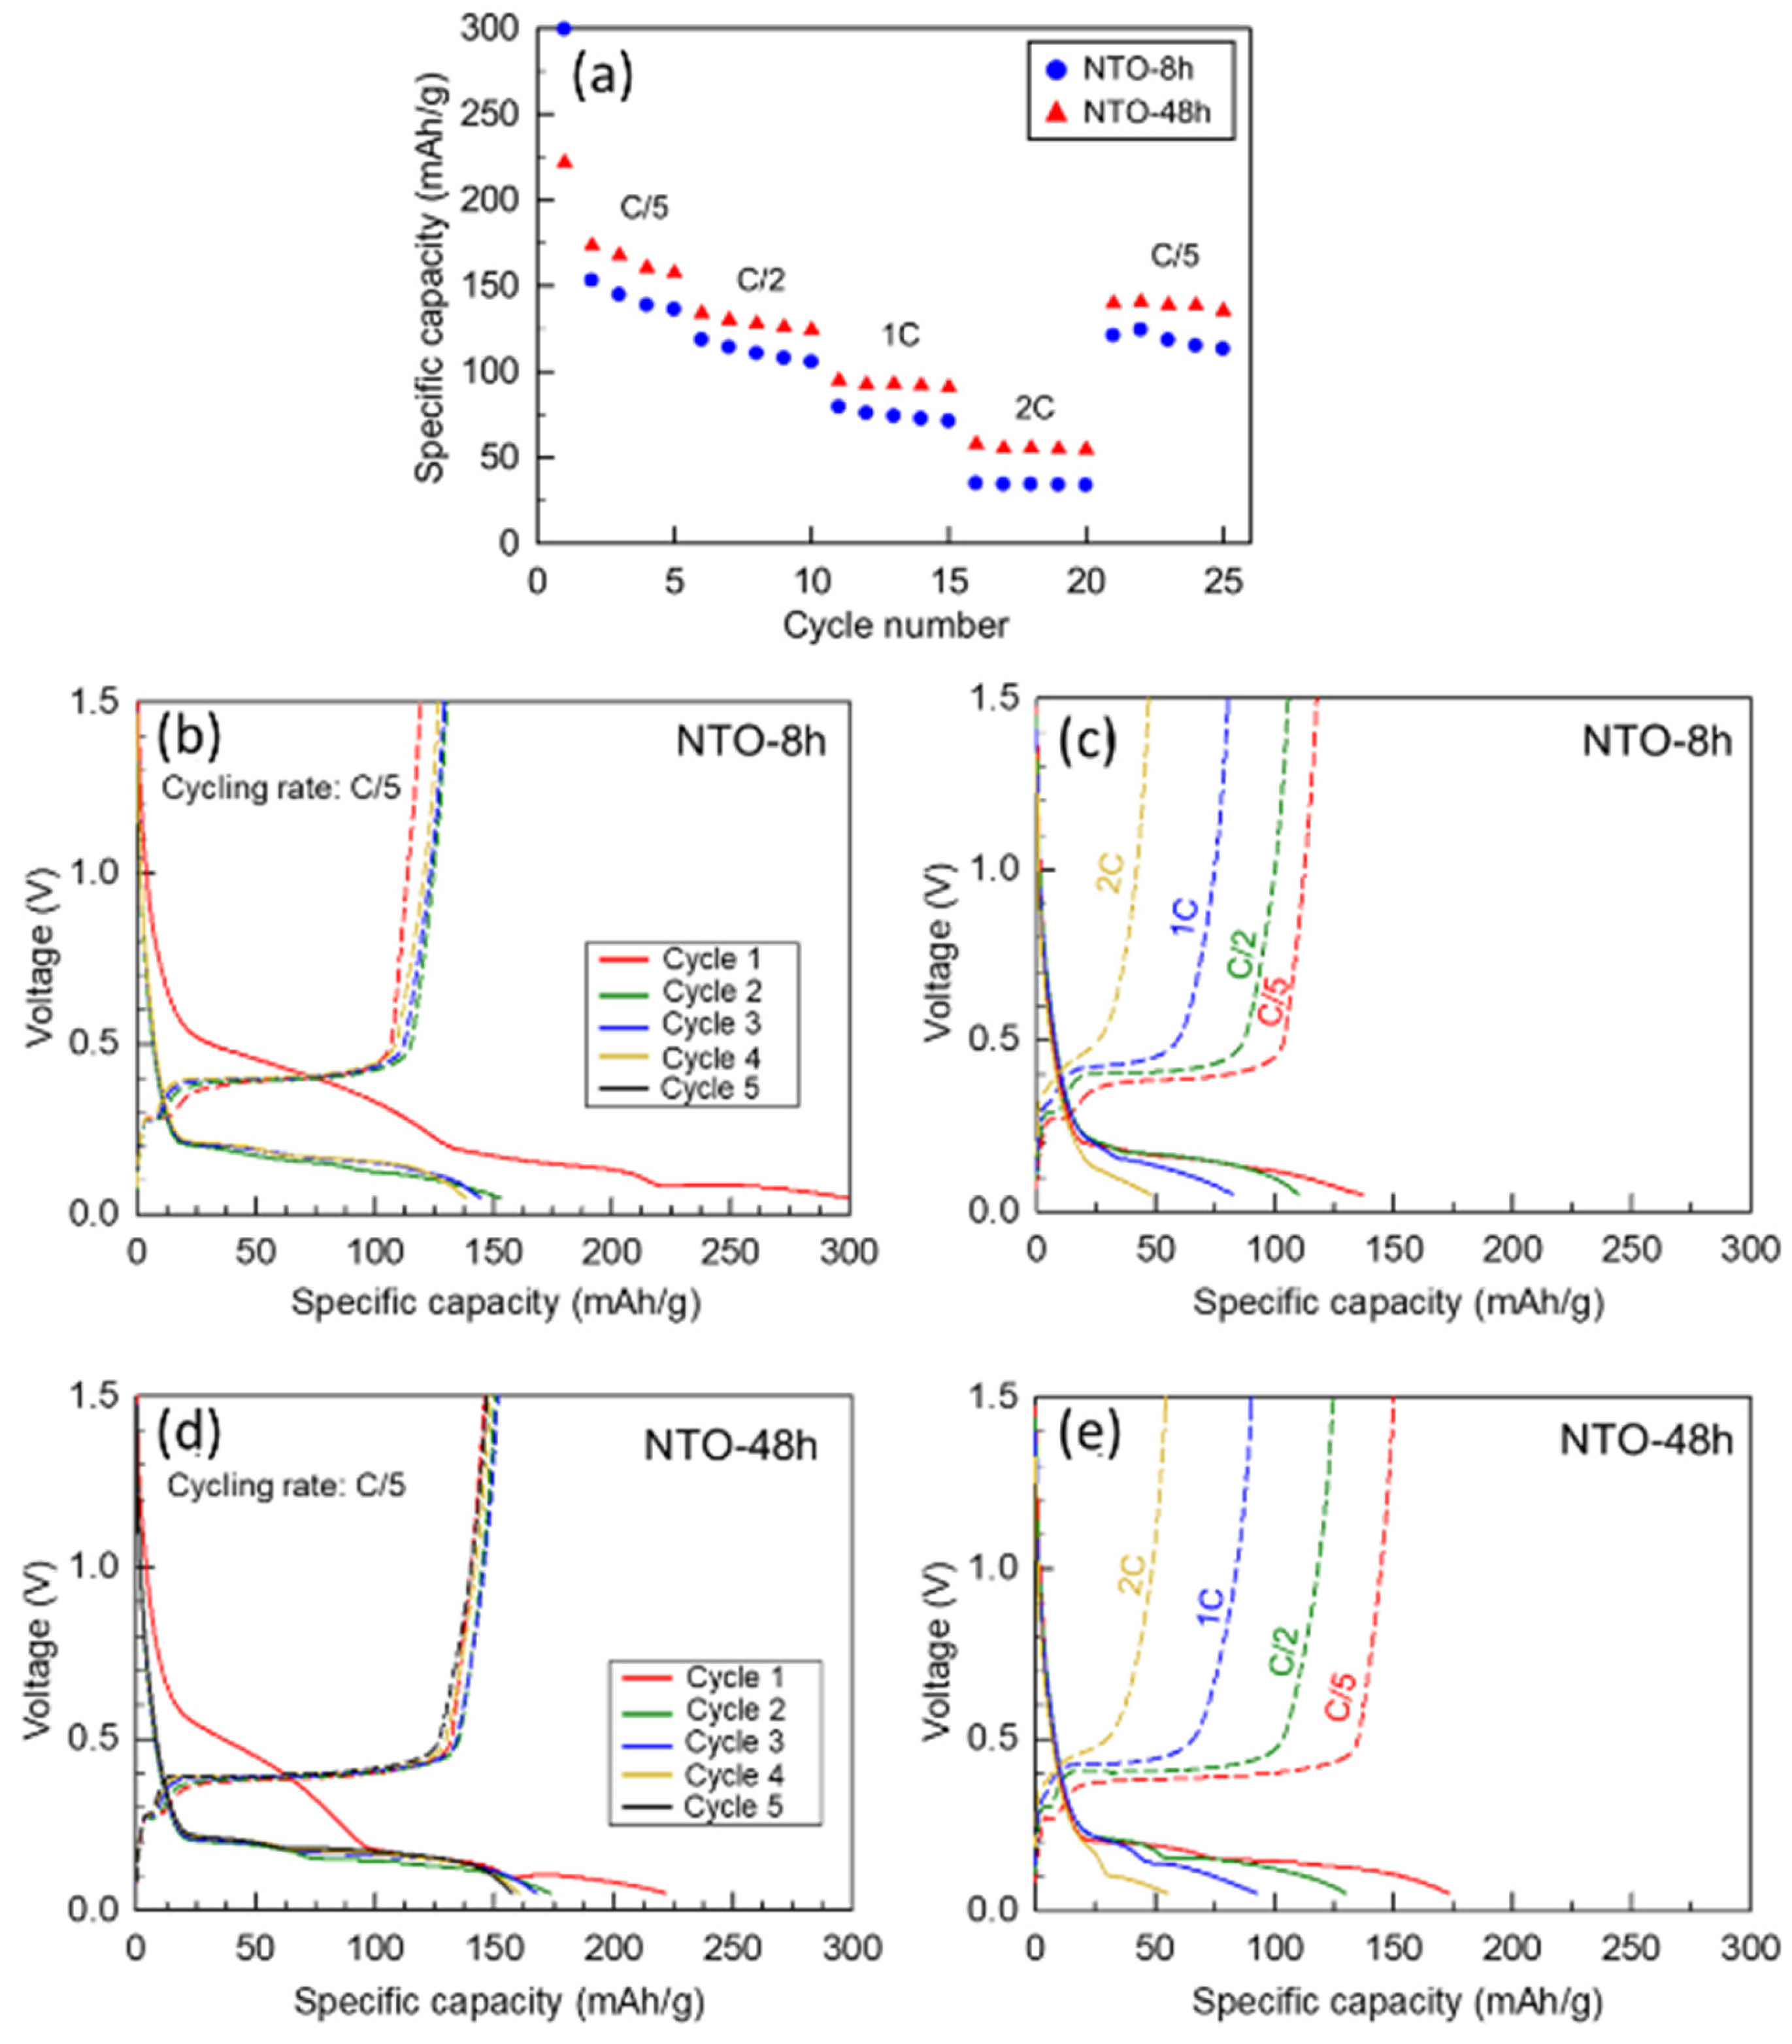
3.4.2. Galvanostatic Cycling

The electrochemical performance at different cycling rates (from C/5 to 2C) of NTO-8h and NTO-48h was evaluated within a voltage window of 0.05–1.5 V vs. Na+/Na (Figure 5a). The first discharge capacity is very high: 299 mAh/g for NTO-8h and 222 mAh/g for NTO-48h then decreases significantly during the following cycles (Figure 5a,b). This very high initial capacity can be attributed to the SEI formation, as previously mentioned. However, it seems that less side reactions occurred during this first cycle for NTO-48h material, as the lower initial capacity, than for NTO-8h. This could be related to the difference in surface chemistry and/or surface reactivity between both samples. Indeed, XPS measurements demonstrated less surface contaminations for NTO-48h. The higher capacities for the first and the following cycles observed for the NTO-48h than for NTO-8h sample are in accordance with the higher intensity of the peaks in the CV analysis discussed above (Figure 4).
The capacity loss between the first and the second cycle was much more important for NTO-8h (48.6%) than for NTO-48h (21.8%). This capacity decrease is well known for NTO electrodes and usually reported principal reasons are the side reactions with carbon black and the formation of an unstable SEI layer [11,13,15,18,19]. Kulova et al. [13] also mention that the alteration of the particles could be caused by their splitting during cycling. When increasing the cycling rate, NTO-48h still exhibits higher capacities than NTO-8h. Indeed, the capacities at the second cycle (at indicated cycling rate) are 173 and 153 mAh/g (C/5), 130 and 114 mAh/g (C/2), 93 and 76 mAh/g (1C), 55 and 34 mAh/g (2C) for NTO-8h and NTO-48h, respectively.
The corresponding voltage profiles were very analogous for both calcination times (Figure 5b,d). Three plateaus are observed during the first discharge (red curves). The first one at about 0.50 V is attributed to the SEI layer formation and side reactions occurring with carbon black [11,13,15,18,19,40]. This phenomenon is not visible anymore in the subsequent cycles, which agrees with the CV results presented above. Then, looking at lower potential, Na+ ions undergo the insertion in a two step-process: at about 0.20 and 0.10 V, in agreement with previous works on NTO anode [13,39,40].
For NTO-8h, the following discharge curves display only one plateau at about 0.20 V (Figure 5b,d). This also agrees with studies of Kulova et al. [13] and Bhardwaj et al. [39], in which this behavior was attributed to instability and structural changes of the material during cycling. According to the work of Rudola et al. [21], this could also imply a mechanism with different pathways for the sodium insertion/extraction, i.e., a multi-step mechanism. By contrast, for NTO-48h, the other discharge curves still exhibit two plateaus for Na+ ions extraction. A two-step process can be observed for both samples at the charge rate of C/5: a short plateau at 0.30 V and a longer one at 0.40 V (Figure 5b,d), corresponding to the sodium extraction from the NTO materials.
At a higher cycling rate, the discharge curves (Figure 5c,e, second cycle at the indicated rate) show less horizontal (flat) insertion plateaus. Kulova et al. [13] attributed these phenomena to the presence of a non-equilibrium solid solution at the surface of the NTO particles that can lead to the increased resistance at the surface of the electrode material and the polarization of the electrode. It was also reported that the cycling rate directly influenced the electrochemical phenomena within NTO material [13] and it was also observed for Li-ion batteries [41,42].
Further differences between NTO-8h and NTO-48h during sodium insertion were observed. For NTO-8h at the discharges of C/2, 1C and 2C rates one plateau at 0.2 V (Figure 5c) can be observed, while NTO-48h displays two plateaus for Na+ extraction at 0.2 and 0.1 V (Figure 5e). Charge curves show two sodium extraction plateaus for both materials (Figure 5c,e): a first very short plateau at about 0.3 V and a second longer one at about 0.4 V. Polarization effect increases with the cycling rate.
The difference in electrochemical behavior between NTO-8h and NTO-48h is discussed in more detail in Section 3.4.3 presenting operando XRD analyses and Section 3.4.4 presenting the EIS analyses.
For the long-term cycling at 1C rate (@) (Figure 6), the NTO-48h material delivers higher capacities than NTO-8h material, over the 400 cycles. Moreover, the fluctuations of the capacity values are similar to the results of Bhardwaj et al. [39]. A comparison between different previous studies on the capacity performances of NTO was demonstrated in our previous work [26]. In this work, detailed information about all most recent studies considering the synthesis method, the particle size and morphology, the electrolyte, the cycling conditions are provided.
One reason for the higher electrochemical performance of NTO-48h compared to NTO-8h during the rate capability tests and long-term cycling could be the more ordered structure for NTO-48h as described in Section 3.1. Therefore, NTO-48h would display more resilience to the sodium-ion insertion/extraction phenomena than NTO-8h.

3.4.3. Study of the Reaction Mechanism by Operando XRD

To better understand the improved electrochemical performance of NTO-48h in comparison to NTO-8h, both electrode materials were investigated by operando XRD during two first electrochemical cycles (Figure 7, Figures S4 and S5). The evolution of the XRD patterns with cycling at a C/20 rate is shown in Figures S4 and S5, where each diffractogram was recorded for one hour. The evolution of the sodium insertion into the NTO materials is summarized in Figure 7.
For both samples, no change appeared during the 25 first diffractograms (up to 0.2 V) (Figure 7). This result was expected as the first discharge plateau at around 0.6 V corresponds, as already mentioned, to the SEI formation during the first discharge and to the side reactions with carbon black. The peaks were indexed by Na2Ti3O7, and by Be and BeO, which correspond to the cell contribution (Figures S4 and S5).
Then, the sodium insertion into NTO material started at 0.2 V (27 h for NTO-8h and NTO-48h). To set the cycling rate at C/20, a current is applied in a defined voltage window such as, theoretically, the (dis)charge duration should take 20 h. However, in practice, the charge and discharge time can be more or less than 20 h, due to side reactions (such as SEI formation and the intercalation of Na+ ions only in part of the material, respectively), and additional peaks gradually appear in the XRD patterns at 16° 2θ, 25° 2θ, 27.8° 2θ and 35.5° 2θ. At 0.1 V (30 h for NTO-8h and 32 h for NTO-48h), two supplementary peaks were gradually visible at 23.6° 2θ and 39.5° 2θ. This indicates a two-step sodium insertion, as described in the literature by several groups [13,15,16]. Moreover, this also corresponds to the study of Rudula et al. [21], who reported an ex situ XRD analysis of NTO material discharged to various potentials. The first series of peaks was attributed to the partially discharged material Na4-xTi3O7 (purple arrows in Figures S4 and S5) and the second one to the fully discharged Na4Ti3O7 material (green arrows in Figures S4 and S5). The evolution of the peak intensities with the potential is qualitatively depicted by the gradually colored rectangles in Figure 7, where discharge and charge data are traced in black and in blue, respectively.
During the first charge, in NTO-8h and NTO-48h, the intermediate phase Na4-xTi3O7 disappeared step by step. However, regarding the fully discharged phase Na4Ti3O7, a major difference emerged between two NTO materials. If the corresponding XRD peaks disappeared in NTO-48h at the end of the charge process, Na4Ti3O7 remained present even at the end of the charge for NTO-8h. This result indicates that Na+ ions were not fully extracted from the NTO-8h structure during the first charge. Some irreversibility in Na+ extraction was also reported in the literature [13,15].
Examining the second discharge, the Na+ ions were well intercalated in the NTO materials. Indeed, the intensity of the Na4Ti3O7 XRD peaks gradually increased from 0.2 V for NTO-8h and NTO-48h. Nevertheless, the peaks of Na4-xTi3O7 did not appear as in the first discharge, neither for NTO-8h nor NTO-48h. This is coherent with the study of Rudola et al. [21], who reported the loss of the Na2Ti3O7 → Na3-xTi3O7 pathway in favor of the direct reaction Na2Ti3O7 → Na4Ti3O7.
During the second charge, the same phenomenon as in the first charge occurred: the Na+ ions were not completely extracted from the NTO-8h structure, whereas the fully extracted Na2Ti3O7 material is recovered for NTO-48h. The complete recovery observed for NTO-48h is mainly due to more ordered structure and lower surface contamination compared to NTO-8h as demonstrated above by XRD and XPS results.
The operando XRD data were further analyzed by using the Rietveld refinement method. The lattice parameters were not evaluated during charge/discharge. The calculation of the Site Occupation Factors (SOF) for sites Na1 and Na2 (see Na1 and Na2 sites in Section 3.1) was also performed. However, because of the low resolution of the operando XRD data, getting accurate values was difficult and overcame the frame of this study. Therefore, SOF values were used to get qualitative information. The SOF evolution was plotted versus time using the operando electrochemical measurements (Figure S6). The NTO-8h material displayed nearly no variation in SOF. The most probable reason for this is that the Na+ ions are trapped into the NTO structure during the charge. By contrast, SOF of the NTO-48h material exhibited much more changes, related to the total insertion and extraction of the additional Na+ ions observed for this material. For the Na2 sites, the SOF may be relatively high, up to 1.77 (Figure S6), thus indicating that small amounts of Ti certainly occur on that site. The presence of Ti on the Na2 site is explained by its morphology, close to an octahedral coordination (Figure 1d), as well as by the relatively short Na2-O bond distances (Table S3).

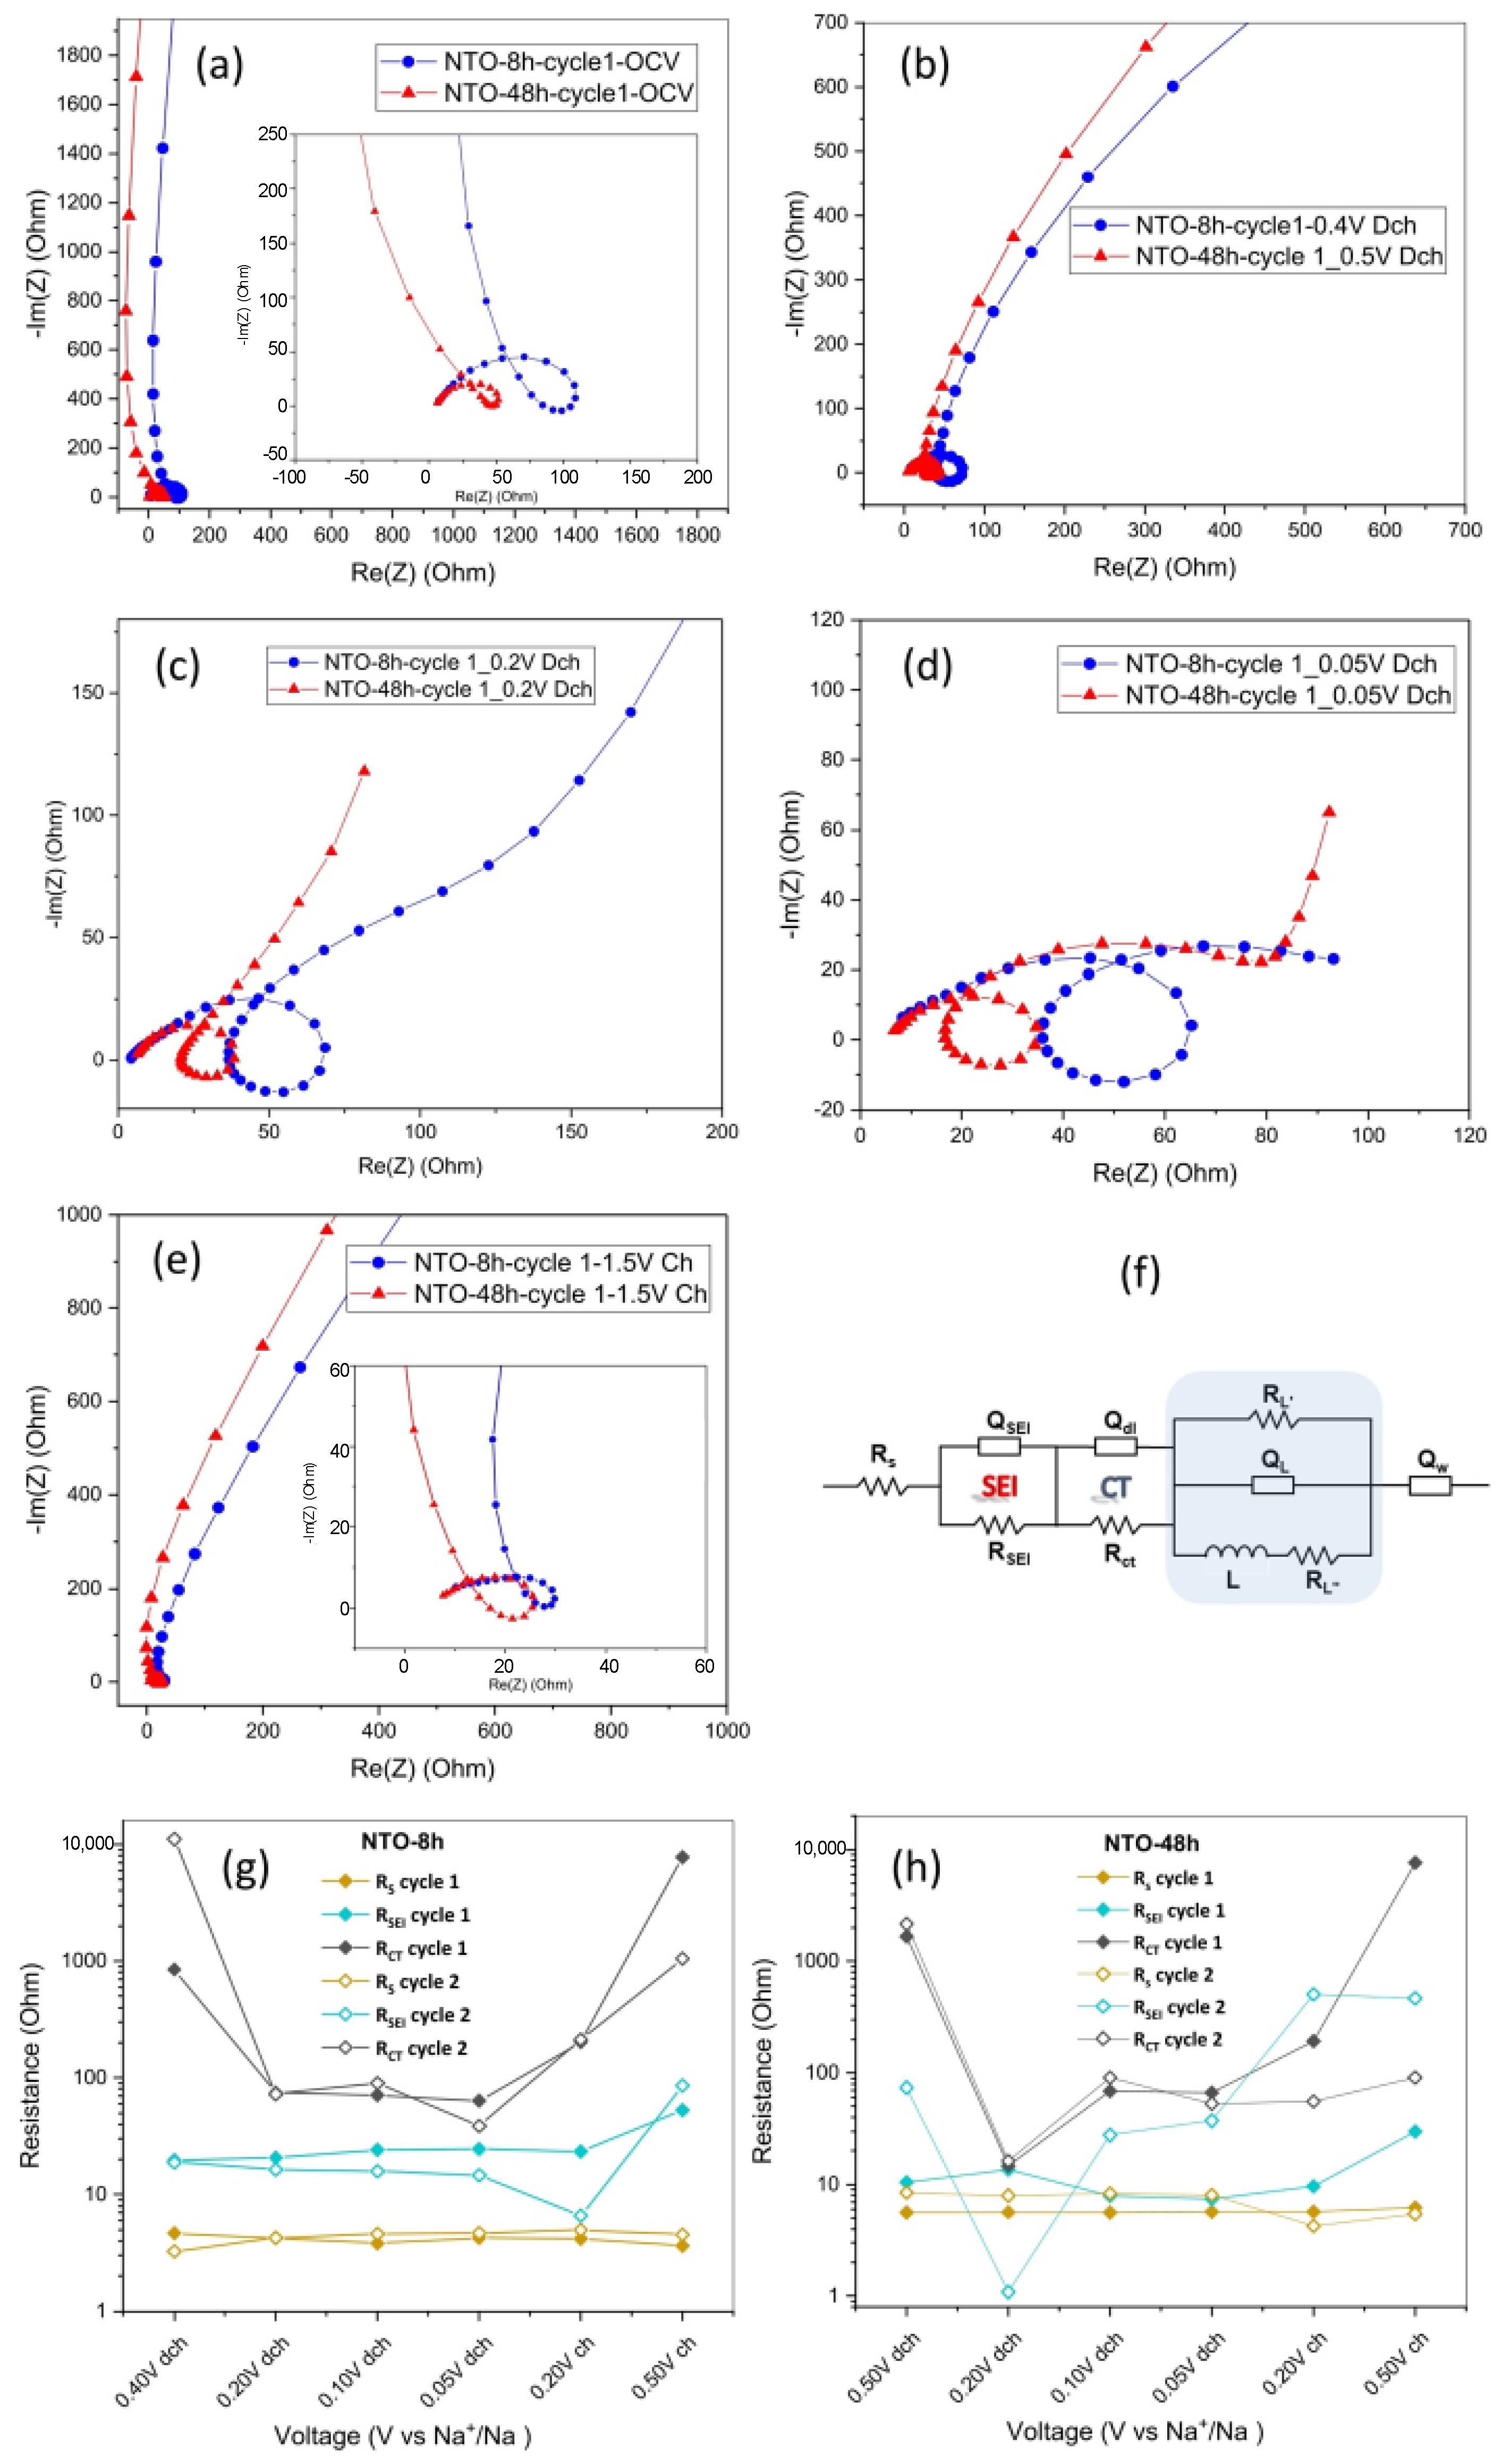
3.4.4. Electrochemical Impedance Spectroscopy (EIS) Studies

Electrochemical impedance spectroscopy is a powerful, non-destructive and widely used method for the characterization of alkali-ion batteries and study the kinetics and electrochemical reaction mechanisms. In batteries, the ionic conduction in the electrolyte solution and electronic conduction through the particles may cause ohmic losses, as such the different contributions to the ohmic loss must be investigated. In this work, we performed EIS measurements to investigate the SEI and charge transfer resistance evolution in NTO-8h and NTO-48 electrodes, as well as the reasons for capacity fading induced by cycling.
EIS tests for NTO-8h and NTO-48h were performed during the first two cycles at different voltages. The impedance spectra at OCV (Figure 8a) show a high frequency semicircle with a loop at the medium frequency and an inclined line at the low-frequency region illustrating a capacitive behavior. This relates to the blocking character of the electrode at equilibrium potential due to the large charge transfer resistance coupled with double-layer capacitance. For the all SoCs (different voltages) (Figure 8b–e), the impedance spectra for both NTO-8h and NTO-48h display an inductive loop in the medium frequency region. Before performing any data fitting, the validity of the EIS spectra was checked by analyzing their reproducibility by the Kramers–Kronig (K–K) equivalent circuit, thus eliminating errors associated with the measurement system or acquired data.
The presence and origin of inductive loops has been widely discussed in literature [43,44,45,46,47,48,49,50]. Brandstätter et al. [45] examined the effect of the SEI on the electrical impedance response using two common anode materials: first the graphite and the second Li4Ti5O12, known for significant and negligible SEI growth, respectively. The inductive loops were observed for both anodes regardless of the types of the materials, SEI growth phenomena or SEI aging mechanism.
The influence of cell setup parameters on the EIS results have also been reported in literature [45,46]. For example, the use of springs in the Swagelok T cell can generate a magnetic inductance at high frequencies. The measurements not performed in the steady-state (drift) can lead to formation of a loop at an intermediate frequency. The corrosion of the electrodes and/or the reference electrode can be detected at the low-frequency region. Thapa et al. [47] reported that the inductive behavior of the electrolyte has an important role in the origin of the inductive loop at the low-frequency region. Hoshi et al. [49] and An et al. [50] attributed the formation of chemical inductance loop to the reference electrodes and their place in the three-electrode cell configuration [49,50]. Gnanaraj et al. [48] attributed the inductive loop to the formation of a (Li1-XC6)/C6 concentration cell from which current flows in opposite direction to Li intercalation into graphite, resulting in appearance of an inductive loop.
The equivalent circuit used to fit the impedance response of NTO-8h and NTO-48h is shown in Figure 8f. Rs represents the internal resistance value of the bulk materials in a battery, such as the current collector, electrolyte and separator. RSEI and QSEI are the resistance and constant phase element, respectively, related to the SEI. Rct and Qdl are the charge transfer resistance and constant phase element, respectively, related to electric double-layer capacitance on active materials. RL′, RL″, QL and L are resistance, constant phase element, and inductance, respectively, to represent an inductive loop geometrically but not as a physical element (detailed example in Figure S7). At low frequency, Qw is a constant phase element representing contribution of the mass transport. The results of the equivalent circuit fitting illustrated by Nyquist plots for the first and second cycles are shown in SI in Figures S8 and S9 for the NTO-8h, as well as in Figures S10 and S11 for the NTO-48h in, respectively. The impedance parameters derived using equivalent circuit models for both NTO samples for the first and second cycles are provided in Tables S4–S7.
The comparison between the impedance response at OCV and at 0.4 V and 0.5 V for NTO-8h and NTO-48h (Figure 8a), respectively, shows that the inclined line resulted from the blocking character of the electrode at OCV is bending toward the real impedance axis and leading to formation a semicircle as the charge transfer resistance coupled with double layer capacitance is slightly decreased. The sluggish motion of electrons within the pristine materials results in the charge transfer resistance to remain very large (>848 Ω) for both NTO-8h and NTO-48h electrodes. The change in the form of the impedance spectra is more apparent at 0.2 V in discharge where the appearance of the Na4-xTi3O7 phase was evidenced by XRD measurements (Figure 7). In the first discharge and upon sodiation of Na2Ti3O7, the Ti4+ states in NTO materials are gradually transformed into the more electronically conductive Ti3+/Ti4+ mixed valence states in Na4-xTi3O7 and Na4Ti3O7 [51]. As such, the overall electronic conductivity increases, and charge transfer resistance substantially decreases during discharge at 0.2 V as shown in Figure 8g, h. The charge transfer resistance decrease is more significant in NTO-48h that translates to improved performance and higher capacity. The charge transfer resistance, however, increases in both NTO-8h and NTO-48h at 0.1 V due to the formation of Na4Ti3O7 phase. As mentioned earlier, the Na atoms are localized in two types of crystallographic sites in the NTO material so the insertion of Na+ and formation of the Na4Ti3O7 phase in the first cycle results in charge transfer build up. Na4Ti3O7 remained present even at the end of the charge for NTO 8h where nearly no variation in SOF for Na1 and Na2 was observed. The Na+ ions that are trapped into the NTO structure during the charge step result in a huge increase in charge transfer resistance as shown in Figure 8. The Nyquist plot at the end of the charge shows large charge transfer resistance coupled with double-layer capacitance for both NTO-8h and NTO-48h. However, the charge transfer resistance at the initial stage of discharge for the second cycle is considerably lower in NTO-48h since the Na+ ions could be extracted easily and the Na4Ti3O7 phase is no longer present.
In addition to the changes in charge transfer resistance in the kinetically controlled impedance region, the Na+ ion diffusion at the low frequency region (the mass transport-controlled) is dominant and shows the most significant changes in resistive and capacitive behaviors. Figure S12, shows the Bode plots of the NTO-8h and NTO-48h electrodes at different discharge and charge steps in the first cycle. The phase angle as a function of frequency can be used to visualize the relative contributions of capacitive and resistive elements, with ideal capacitance at φ = −90°, and resistive processes indicated at φ = 0. The phase angle in the beginning of discharge and end of charge suggests a capacitive behavior and a resistive behavior with improved conduction of electrons across and through the electrode as well as less diffusion limitations in other parts of charge and discharge.
The characteristics of the SEI layer were also studied at different states of charge/discharge for both NTO-8h and NTO-48h. The fitted data show RSEI of 19.8 Ω and 10.58 Ω for NTO-8h and NTO-48h, respectively. The preliminary resistive SEI for NTO-48h is transformed into a more conductive SEI layer at 0.1 V of discharge. At the end of discharge at 0.05 V, RSEI for NTO-8h is 24.5 Ω which is higher than 7.4 Ω for the NTO-48h. This highlights the difference in the thickness and characteristics of the SEI layer in NTO-8h and NTO-48h. The evolution of the SEI resistance in the first charge step and the second cycle in NTO-48h, as well as the increase in Rs, suggests additional electrolyte consumption and decomposition resulting in capacity fading over long-term cycling as shown in Figure 6.

4. Conclusions

In this work, new insights of the heat treatment effect on the electrochemical properties of NTO anode material were presented for the first time. The heat treatment duration affects more the distortion of framework TiO6 polyhedra than the extra-framework NaOx polyhedra. Moreover, NTO-48h displays a more ordered structure than NTO-8h. By contrast, both materials exhibit similar morphology and the same oxidation state of titanium (Ti4+), but the NTO-48h sample displays a lower specific surface area and lower surface contaminations determined by BET and XPS analysis, respectively.
The NTO-8h and NTO-48h materials were studied as anode materials for Na-ion batteries in half-cell configuration. The heat treatment duration drastically influences the electrochemical behavior and performance. The delivered capacities are higher for NTO-48h than for NTO-8h. The cyclic voltammograms for NTO-48h show less peak voltage variations, indicating a better stability of NTO-48h than NTO-8h. These results corroborate with the Rietveld refinement data on the pristine material showing an ordered structure for NTO-48h, resulting in a more resilient insertion/extraction of Na+ ions than NTO-8h.
The investigation of the reaction mechanism during discharge/charge processes by operando XRD evidenced that sodium insertion involves two phases, Na4-xTi3O7 and Na4Ti3O7, during the first discharge. In the second cycle, only Na4Ti3O7 was observed. For NTO-8h the sodium insertion/extraction was not reversible contrary to NTO-48h for which the Na2Ti3O7 material was recovered. This Na+ partial extraction from the NTO-8h structure is supposed to be the main reason for the lower capacities delivered by NTO-8h, compared to NTO-48h.
The electrochemical impedance spectroscopy tests showed lower SEI resistance at the end of the first discharge for NTO-48h. The evolution of SEI in the charge step and the second cycle shows a more stable SEI layer for NTO-8h, which could be due to the well preserved Na4Ti3O7 phase. However, the charge transfer changes suggested a better performance and lower charge transfer resistance when the Na4Ti3O7 phase formation was reversible upon cycling.

Supplementary Materials

The following supporting information can be downloaded at https://www.mdpi.com/article/10.3390/batteries9100495/s1: Figure S1 Electrochemical cell for operando measurements. (a) Photo and (b) Scheme of the device. From Leriche et al. [30]; Figure S2. Rietveld refinnement results of the X-ray powder diffraction pattern of Na2Ti3O7 (sample NTO-8h). Comparison of the experimental (—) and calculated (—) data; Figure S3. Rietveld refinnement results of the X-ray powder diffraction pattern of Na2Ti3O7 (sample NTO-48h). Comparison of the experimental (—) and calculated (—) data. Figure S4. Operando electrochemical XRD patterns of Na2Ti3O7 heat treated at 800 °C for 8h (NTO-8h). Each diffractogram is recorded in 1 h. Cycling rate: C/20. Black curves for data recorded during discharge and blue curves during charge. Figure S5. Operando electrochemical XRD patterns of Na2Ti3O7 heat treated at 800° C for 48 h (NTO-48h). Each diffractogram is recorded in 1 h. Cycling rate: C/20. Black curves for data recorded during discharge and blue curves during charge. Site Occupation Factors (SOF) for Na1 and Na2 sites calculated from Rietveld refinement of operando XRD patterns (Figure S4 and S5) of Na2Ti3O7 heat treated at 800 °C for 8 h (NTO-8h) or 48 h (NTO-48h). Figure S7. Frequency dependency in the Nyquist plot for the inductive loop of NTO-8h at 0.4V in the first discharge. Figure S8. Nyquist plots of NTO-8h at different voltage steps in the first cycle where dot line shows the experimental and solid line fitting results. Figure S9. Nyquist plots of NTO-8h at different voltage steps in the second cycle where dot line shows the experimental and solid line fitting results. Figure S10. Nyquist plots of NTO-48h at different voltage steps in the first cycle where dot line shows the experimental and solid line fitting results. Figure S11. Nyquist plots of NTO-48h at different voltage steps in the second cycle where dot line shows the experimental and solid line fitting results. Figure S12. Bode plots of (a,b) NTO-8h and (c,d) NTO-48h showing the phase angle–frequency dependence at different voltage steps in the discharge and charge steps of the first cycle. Table S1. Experimental details for the Rietveld refinements of the X-ray powder diffraction patterns of Na2Ti3O7. Table S2. Atom coordinates, isotropic temperature factors (Å2), and site occupancy factors for Na2Ti3O7. Table S3. Selected interatomic distances (Å), bond-length distortion parameters (BLD, %), and bond valence sums (BVS, valence units) for the crystal structure of Na2Ti3O7. Table S4: Impedance parameters derived using equivalent circuit models of NTO-8h-cycle 1. Table S5: Impedance parameters derived using equivalent circuit models of NTO-8h-cycle 2. Table S6: Impedance parameters derived using equivalent circuit models of NTO-48h-cycle 1. Table S7: Impedance parameters derived using equivalent circuit models of NTO-48h-cycle 2.

Author Contributions

Conceptualization, C.P. and A.M.; methodology, C.P., G.M. and A.M.; validation, C.P.; formal analysis, C.P., N.E., G.M., F.H. and J.Ś.; investigation, C.P., G.M. and J.Ś.; resources, R.C.; writing—original draft preparation, C.P.; writing—review and editing, C.P., N.E., F.H., J.Ś. and A.M.; visualization, C.P., N.E., F.H. and J.Ś.; supervision, F.B. and A.M.; project administration, A.M.; funding acquisition, R.C. All authors have read and agreed to the published version of the manuscript.

Funding

The authors are grateful to the University of Liège and FRS-FNRS for equipment grants. N.E. thanks FNRS for the PhD FRIA grant [Grant 1.E118.16]. Region Ile-de-France is also acknowledged for partial support for the XPS equipment (Chimie ParisTech—CNRS, PSL University, Institut de Recherche de Chimie Paris).

Data Availability Statement

Data is contained within the article or Supplementary Materials.

Acknowledgments

Electron microscopy was conducted at the CAREM platform (University of Liège).

Conflicts of Interest

The authors declare no conflict of interest.

References

  1. Chayambuka, K.; Mulder, G.; Danilov, D.L.; Notten, P.H.L. Sodium-Ion Battery Materials and Electrochemical Properties Reviewed. Adv. Energy Mater. 2018, 8, 1800079. [Google Scholar] [CrossRef]
  2. Senguttuvan, P.; Rousse, G.; Seznec, V.; Tarascon, J.-M.; Palacin, M.R. Na2Ti3O7: Lowest Voltage Ever Reported Oxide Insertion Electrode for Sodium Ion Batteries. Chem. Mater. 2011, 23, 4109–4111. [Google Scholar] [CrossRef]
  3. Perveen, T.; Siddiq, M.; Shahzad, N.; Ihsan, R.; Ahmad, A.; Shahzad, M.I. Prospects in anode materials for sodium ion batteries—A review. Renew. Sustain. Energy Rev. 2020, 119, 109549. [Google Scholar] [CrossRef]
  4. Hwang, J.-Y.; Myung, S.-T.; Sun, Y.-K. Sodium-ion batteries: Present and future. Chem. Soc. Rev. 2017, 46, 3529–3614. [Google Scholar] [CrossRef] [PubMed]
  5. Hasa, I.; Mariyappan, S.; Saurel, D.; Adelhelm, P.; Koposov, A.Y.; Masquelier, C.; Croguennec, L.; Casas-Cabanas, M. Challenges of today for Na-based batteries of the future: From materials to cell metrics. J. Power Sources 2021, 482, 228872. [Google Scholar] [CrossRef]
  6. Zhen, Y.; Chen, Y.; Li, F.; Guo, Z.; Hong, Z.; Titirici, M.M. Ultrafast synthesis of hard carbon anodes for sodium-ion batteries. Proc. Natl. Acad. Sci. USA 2021, 118, e2111119118. [Google Scholar] [CrossRef] [PubMed]
  7. Du, K.; Rudola, A.; Balaya, P. Investigations of Thermal Stability and Solid Electrolyte Interphase on Na2Ti3O7/C as a Non-carbonaceous Anode Material for Sodium Storage Using Non-flammable Ether-based Electrolyte. ACS Appl. Mater. Interfaces 2021, 13, 11732–11740. [Google Scholar] [CrossRef]
  8. Hong, Z.; Kang, M.; Chen, X.; Zhou, K.; Huang, Z.; Wei, M. Synthesis of Mesoporous Co2+-Doped TiO2 Nanodisks Derived from Metal Organic Frameworks with Improved Sodium Storage Performance. ACS Appl. Mater. Interfaces 2017, 9, 32071–32079. [Google Scholar] [CrossRef]
  9. Zhai, H.; Xia, B.Y.; Park, H.S. Ti-based electrode materials for electrochemical sodium ion storage and removal. J. Mater. Chem. A 2019, 7, 22163–22188. [Google Scholar] [CrossRef]
  10. Xia, J.; Zhao, H.; Pang, W.K.; Yin, Z.; Zhou, B.; He, G.; Guo, Z.; Du, Y. Lanthanide doping induced electrochemical enhancement of Na2Ti3O7anodes for sodium-ion batteries. Chem. Sci. 2018, 9, 3421–3425. [Google Scholar] [CrossRef]
  11. Nava-Avendaño, J.; Morales-García, A.; Ponrouch, A.; Rousse, G.; Frontera, C.; Senguttuvan, P.; Tarascon, J.-M.; Arroyo-de Dompablo, M.E.; Palacín, M.R. Taking steps forward in understanding the electrochemical behavior of Na2Ti3O7. J. Mater. Chem. A 2015, 3, 22280–22286. [Google Scholar] [CrossRef]
  12. Zarrabeitia, M.; Nobili, F.; Munoz-Marquez, M.A.; Rojo, T.; Casas-Cabanas, M. Direct observation of electronic conductivity transitions and solid electrolyte interphase stability of Na2Ti3O7 electrodes for Na-ion batteries. J. Power Sources 2016, 330, 78–83. [Google Scholar] [CrossRef]
  13. Kulova, T.L.; Kudryashova, Y.O.; Kuz’mina, A.A.; Stenina, I.A.; Chekannikov, A.A.; Yaroslavtsev, A.B.; Libich, J. Study of degradation of Na2Ti3O7-based electrode during cycling. J. Solid State Electrochem. 2019, 23, 455–463. [Google Scholar] [CrossRef]
  14. Wang, W.; Yu, C.; Liu, Y.; Hou, J.; Zhu, H.; Jiao, S. Single crystalline Na2Ti3O7 rods as an anode material for sodium-ion batteries. RSC Adv. 2013, 3, 1041. [Google Scholar] [CrossRef]
  15. Rudola, A.; Saravanan, K.; Mason, C.W.; Balaya, P. Na2Ti3O7: An intercalation based anode for sodium-ion battery applications. J. Mater. Chem. A 2013, 1, 2653–2662. [Google Scholar] [CrossRef]
  16. Pan, H.; Xia, L.; Yu, X.; Hu, Y.-S.; Li, H.; Yang, X.-Q.; Chen, L. Sodium Storage and Transport Properties in Layered Na2Ti3O7 for Room-Temperature Sodium-Ion Batteries Sodium. Adv. Energy Mater. 2013, 3, 1186–1194. [Google Scholar] [CrossRef]
  17. Xu, J.; Ma, C.; Balasubramanian, M.; Shirley, Y. Understanding Na2Ti3O7 as an ultra-low voltage anode material for a Na-ion battery. Chem. Commun. 2014, 50, 12564–12567. [Google Scholar] [CrossRef]
  18. Zou, W.; Li, J.; Deng, Q.; Xue, J.; Dai, X.; Zhou, A.; Li, J. Microspherical Na2Ti3O7 prepared by spray-drying method as anode material for sodium-ion battery. Solid State Ion. 2014, 262, 192–196. [Google Scholar] [CrossRef]
  19. Wen, S.; Li, X.; Zhang, J.; Wang, J.; Ding, H.; Zhang, N.; Zhao, D.; Mao, L.; Li, S. Effects of sodium salts on compatibility between Na2Ti3O7@C anode and electrolyte for sodium-ion batteries. J. Alloys Compd. 2023, 930, 167380. [Google Scholar] [CrossRef]
  20. Li, Y.; Liu, Y.; Wang, D.; Hu, C.; Luo, K.; Zhong, B.; Sun, Y.; Liu, Y.; Wu, Z.; Guo, X. Enabling both ultrahigh initial coulombic efficiency and superior stability of Na2Ti3O7 anodes by optimizing binders. J. Mater. Chem. A 2022, 10, 24178–24189. [Google Scholar] [CrossRef]
  21. Rudola, A.; Sharma, N.; Balaya, P. Introducing a 0.2 v sodium-ion battery anode: The Na2Ti3O7 to Na3—XTi3O7 pathway. Electrochem. Commun. 2015, 61, 10–13. [Google Scholar] [CrossRef]
  22. Papp, S.; Korosi, L.; Meynen, V.; Cool, P.; Vansant, E.F.; Dekany, I. The influence of temperature on the structural behaviour of sodium tri- and hexa-titanates and their protonated forms. J. Solid State Chem. 2005, 178, 1614–1619. [Google Scholar] [CrossRef]
  23. Pak, Y.C.; Rim, C.H.; Hwang, S.G.; Ri, K.C.; Yu, C.J. Defect formation and ambivalent effects on electrochemical performance in layered sodium titanate Na2Ti3O7. Phys. Chem. Chem. Phys. 2023, 25, 3420–3431. [Google Scholar] [CrossRef]
  24. Choi, Y.S.; Costa, S.I.R.; Tapia-Ruiz, N.; Scanlon, D.O. Intrinsic Defects and Their Role in the Phase Transition of Na-Ion Anode Na2Ti3O7. ACS Appl. Energy Mater. 2023, 6, 484–495. [Google Scholar] [CrossRef] [PubMed]
  25. Cao, Y.; Ye, Q.; Wang, F.; Fan, X.; Hu, L.; Wang, F.; Zhai, T.; Li, H. A New Triclinic Phase Na2Ti3O7 Anode for Sodium-Ion Battery. Adv. Funct. Mater. 2020, 30, 2003733. [Google Scholar] [CrossRef]
  26. Piffet, C.; Vertruyen, B.; Hatert, F.; Cloots, R.; Boschini, F.; Mahmoud, A. High temperature X-ray diffraction study of the formation of Na2Ti3O7 from a mixture of sodium carbonate and titanium oxide. J. Energy Chem. 2022, 65, 210–218. [Google Scholar] [CrossRef]
  27. Dos Santos Costa, S.; Pereira da Silva, J.; Moraes Biondo, M.; Sanches, E.A.; Da Silva Paula, M.M.; Xavier Nobre, F.; Anglada Rivera, J.; Alexis Zulueta, Y.; Torikachvili, M.S.; Vieira Sampaio, D.; et al. Temperature Dependence of the Electrical Properties of Na2Ti3O7/Na2Ti6O13/POMA Composites. Molecules 2022, 27, 5756. [Google Scholar] [CrossRef] [PubMed]
  28. Yakubovich, O.V.; Kireev, V.V. Refinement of the crystal structure of Na2Ti3O7. Crystallogr. Rep. 2003, 48, 24–28. [Google Scholar] [CrossRef]
  29. Rouquerol, J.; Llewellyn, P.; Rouquerol, F. Is the BET equation applicable to microporous adsorbents? Stud. Surf. Sci. Catal. 2007, 160, 49–56. [Google Scholar] [CrossRef]
  30. Leriche, J.B.; Hamelet, S.; Shu, J.; Morcrette, M.; Masquelier, C.; Ouvrard, G.; Zerrouki, M.; Soudan, P.; Belin, S.; Elkaïm, E.; et al. An Electrochemical Cell for Operando Study of Lithium Batteries Using Synchrotron Radiation. J. Electrochem. Soc. 2010, 157, A606. [Google Scholar] [CrossRef]
  31. Andersson, S.; Wadsley, A.D. The crystal structure of Na2Ti3O7. Acta Crystallogr. 1961, 14, 1245–1249. [Google Scholar] [CrossRef]
  32. Brown, I.D.; Altermatt, D. Bond-valence parameters obtained from a systematic analysis of the Inorganic Crystal Structure Database. Acta Crystallogr. Sect. B 1985, 41, 244–247. [Google Scholar] [CrossRef]
  33. Gadois, C.; Światowska, J.; Zanna, S.; Marcus, P. Influence of titanium surface treatment on adsorption of primary amines. J. Phys. Chem. C 2013, 117, 1297–1307. [Google Scholar] [CrossRef]
  34. Ma, J.; Li, W.; Morgan, B.J.; Światowska, J.; Baddour-Hadjean, R.; Body, M.; Legein, C.; Borkiewicz, O.J.; Leclerc, S.; Groult, H.; et al. Lithium Intercalation in Anatase Titanium Vacancies and the Role of Local Anionic Environment. Chem. Mater. 2018, 30, 3078–3089. [Google Scholar] [CrossRef]
  35. Mehraz, S.; Luo, W.; Swiatowska, J.; Bezzazi, B.; Taleb, A. Hydrothermal synthesis of TiO2 aggregates and their application as negative electrodes for lithium-ion batteries: The conflicting effects of specific surface and pore size. Materials 2021, 14, 916. [Google Scholar] [CrossRef] [PubMed]
  36. Song, T.; Ye, S.; Liu, H.; Wang, Y.G. Self-doping of Ti3+ into Na2Ti3O7increases both ion and electron conductivity as a high-performance anode material for sodium-ion batteries. J. Alloys Compd. 2018, 767, 820–828. [Google Scholar] [CrossRef]
  37. Muñoz-Márquez, M.A.; Zarrabeitia, M.; Castillo-Martínez, E.; Eguía-Barrio, A.; Rojo, T.; Casas-Cabanas, M. Composition and Evolution of the Solid-Electrolyte Interphase in Na2Ti3O7 Electrodes for Na-Ion Batteries: XPS and Auger Parameter Analysis. ACS Appl. Mater. Interfaces 2015, 7, 7801–7808. [Google Scholar] [CrossRef] [PubMed]
  38. Wanger, C.D.; Riggs, W.M.; Davis, L.E.; Moulder, J.F.; Muilenberg, G.E. Handbook of X-ray Photoelectron Spectroscopy; Perkin-Elmer Corp., Physical Electronics Division: Eden Praire, MN, USA, 1979. [Google Scholar] [CrossRef]
  39. Bhardwaj, H.S.; Ramireddy, T.; Pradeep, A.; Jangid, M.K.; Srihari, V.; Poswal, H.K.; Mukhopadhyay, A. Understanding the Cyclic (In)stability and the Effects of Presence of a Stable Conducting Network on the Electrochemical Performances of Na2Ti3O7. ChemElectroChem 2018, 5, 1219–1229. [Google Scholar] [CrossRef]
  40. Mukherjee, A.; Das, D.; Banerjee, S.; Majumder, S.B. Synthesis and electrochemical performance of in-situ and ex-situ carbon-coated Na2Ti3O7, as a promising anode for sodium-ion batteries. Electrochem. Sci. Adv. 2022, e2100118. [Google Scholar] [CrossRef]
  41. Kulova, T.L.; Skundin, A.M. Balance between reversible and irreversible processes during lithium intercalation in graphite. Russ. J. Electrochem. 2006, 42, 251–258. [Google Scholar] [CrossRef]
  42. Mahmoud, A.; Amarilla, J.M.; Lasri, K.; Saadoune, I. Influence of the synthesis method on the electrochemical properties of the Li4Ti5O12 spinel in Li-half and Li-ion full-cells. A systematic comparison. Electrochim. Acta 2013, 93, 163–172. [Google Scholar] [CrossRef]
  43. Laschuk, N.O.; Easton, E.B.; Zenkina, O.V. Reducing the resistance for the use of electrochemical impedance spectroscopy analysis in materials chemistry. RSC Adv. 2021, 11, 27925–27936. [Google Scholar] [CrossRef] [PubMed]
  44. Klotz, D. Negative capacitance or inductive loop?—A general assessment of a common low frequency impedance feature. Electrochem. Commun. 2019, 98, 58–62. [Google Scholar] [CrossRef]
  45. Brandstätter, H.; Hanzu, I. Wilkening. Myth and reality about the origin of inductive loops in impedance spectra of lithium-ion electrodes—A critical experimental approach. Electrochim. Acta 2016, 207, 218–223. [Google Scholar] [CrossRef]
  46. Itagaki, M.; Honda, K.; Hoshi, Y.; Shitanda, I. In-situ EIS to determine impedance spectra of lithium-ion rechargeable batteries during charge and discharge cycle. J. Electroanal. Chem. 2015, 737, 78–84. [Google Scholar] [CrossRef]
  47. Thapa, A.; Gao, A.H. Low-frequency inductive loop and its origin in the impedance spectrum of a graphite anode. J. Electrochem. Soc. 2022, 169, 110535. [Google Scholar] [CrossRef]
  48. Gnanaraj, J.S.; Thompson, R.W.; Iaconatti, S.N.; Dicarlo, J.F.; Abraham, K.M. Formation and growth of surface films on graphitic anode materials for Li-ion batteries. Electrochem. Solid-State Lett. 2005, 8, 128–132. [Google Scholar] [CrossRef]
  49. Hoshi, Y.; Narita, Y.; Honda, K.; Ohtaki, T.; Shitanda, I.; Itagaki, M. Optimization of reference electrode position in a three-electrode cell for impedance measurements in lithium-ion rechargeable battery by finite element method. J. Power Sources 2015, 288, 168–175. [Google Scholar] [CrossRef]
  50. An, S.J.; Li, J.; Daniel, C.; Kalnaus, S.; Wood, D.L. Design and demonstration of three-electrode pouch cells for lithium-ion batteries. J. Electrochem. Soc. 2017, 164, A1755–A1764. [Google Scholar] [CrossRef]
  51. Zhang, Y.; Tang, Y.; Deng, J.; Leow, W.R.; Xia, H.; Zhu, Z.; Lv, Z.; Wei, J.; Li, W.; Persson, C.; et al. Correlating the Peukert’s Constant with Phase Composition of Electrode Materials in Fast Lithiation Processes. ACS Mater. Lett. 2019, 1, 519–525. [Google Scholar] [CrossRef]
Figure 1. The crystal structure of Na2Ti3O7 (sample NTO-8h): (a) Parallel projection to the ac plane, TiO6 octahedra are in blue and NaOx polyhedra in yellow; (b) Parallel projection to the ac plane, TiO6 octahedra are in blue and sodium atoms are shown as yellow spheres; the octahedral ribbons connected by corner-sharing to form planes parallel to (001) are visible; (c) Geometry of the Na1O9 polyhedra and (d) the Na2O7 polyhedra.
Batteries 09 00495 g001
Figure 2. SEM micrographs of Na2Ti3O7 synthesized by spray-drying followed by a heat treatment at 800 °C for (a,b) 8 h or (c,d) 48 h; (e) Laser granulometry size distribution of NTO-8h (blue curve) and NTO-48h (red curve).
Batteries 09 00495 g002
Figure 3. Comparison of XPS (a) Ti 2p, (c) O 1s and (e) Na 1s spectra obtained for NTO-8h and NTO-48h samples. Figures (b,d,f) show a decomposition of Ti 2p, O 1s and Na 1s, respectively, for NTO-8h sample.
Batteries 09 00495 g003
Figure 4. Cyclic voltammetry (0.05–1.5 V vs. Na+/Na with a scan rate of 0.1 mV/s) of (a) NTO-8h and (b) NTO-48h. Voltage window: 0.05–1.5 V vs. Na+/Na.
Batteries 09 00495 g004
Figure 5. (a) Rate capability at indicated cycling rate of NTO-8h and NTO-48h in voltage window: 0.05–1.5 V vs. Na+/Na. Electrochemical curves of (b,c) NTO-8h and (d,e) NTO-48h. Voltage window: 0.05–1.5 V vs. Na+/Na; (b,d) First five cycles at C/5 cycling rate; (c,e) Second cycle at different cycling rates (at C/5, C/2, 1C, 2C).
Batteries 09 00495 g005
Figure 6. Electrochemical cycling at 1C rate during 400 cycles of NTO-8h and NTO-48h. Voltage window: 0.05–1.5 V vs. Na+/Na.
Batteries 09 00495 g006
Figure 7. In situ XRD during electrochemical cycling of Na2Ti3O7 synthesized by spray-drying following by a heat treatment at 800 °C during (a) 8 h and (b) 48 h. Voltage window: 0.05–1.5 V vs. Na+/Na; black curve corresponds to the discharge and blue curve to the charge. Each diffractogram was recorded in one hour and the cycling rate was set at C/20. Colored purple and green gradient rectangles depict Na4-xTi3O7 and Na4Ti3O7 presence, respectively, based on the intensity of XRD peaks visible in Figures S4 and S5.
Batteries 09 00495 g007
Figure 8. EIS tests of NTO-8h and NTO-48h electrodes with the Nyquist plots at (a) OCV, (b) end of the first discharge plateau at 0.4 V and 0.5 V for NTO-8h and NTO-48h, respectively. Nyquist plots at (c) 0.2 V in discharge, (d) 0.05 V in discharge and (e) 1.5 V at full charge; (f) Equivalent circuit used to fit the impedance response of NTO-8h and NTO-48h (the fitted curves for each plot are shown in SI). The evolution of different resistance elements in the first and second cycles in (g,h) NTO-8h and NTO-48h, respectively.
Batteries 09 00495 g008
Disclaimer/Publisher’s Note: The statements, opinions and data contained in all publications are solely those of the individual author(s) and contributor(s) and not of MDPI and/or the editor(s). MDPI and/or the editor(s) disclaim responsibility for any injury to people or property resulting from any ideas, methods, instructions or products referred to in the content.

