Article

Capacity Fading Rules of Lithium-Ion Batteries for Multiple Thermoelectric Aging Paths

1
State Key Laboratory of Automotive Safety and Energy, Tsinghua University, Beijing 100084, China
2
School of Electrical & Electronic Engineering, Harbin University of Science & Technology, Harbin 150080, China
3
Beijing Products Quality Supervision and Inspection Research Institute/National Automotive Quality Inspection &Testing Center (Shunyi Beijing), Beijing 101300, China
*
Author to whom correspondence should be addressed.
Batteries 2023, 9(1), 3; https://doi.org/10.3390/batteries9010003
Submission received: 21 October 2022 / Revised: 12 December 2022 / Accepted: 17 December 2022 / Published: 21 December 2022
(This article belongs to the Collection Advances in Battery Energy Storage and Applications)

Abstract

:
The ambient temperature and charging rate are the two most important factors that influence the capacity deterioration of lithium-ion batteries. Differences in temperature for charge–discharge conditions significantly impact the battery capacity, particularly under high-stress conditions, such as ultrafast charging. The combined negative effects of the ambient temperature and a high charging rate on the capacity of a lithium-ion battery require further research. Here, multiple scenarios of different temperatures and charging rates were considered to examine their influence on battery capacity deterioration, focusing on the effect of high charging rates above 2 C. Three test temperatures and three charging rates were selected, and experiments were performed to evaluate the battery capacity over several charge–discharge cycles. A comparative analysis was performed on the capacity, impedance, and probability density function (PDF). The results showed that increasing the charging rate delayed the response of the phase change reaction to the voltage, which accelerated the corresponding capacity deterioration. At high charging rates, the main causes of capacity deterioration were the loss of active lithium in the battery and the loss of active material from the negative electrode. Most of the product from the side reaction between the lithium coating and electrolyte remained in the electrolyte and had no evident effect on impedance. Therefore, high charging rates significantly increase the temperature of the battery, and a high charging rate and temperature exert a coupled negative effect on the battery capacity. Thermal management strategies for lithium-ion batteries must comprehensively optimize the temperature and charging rate in real time.

1. Introduction

With the widespread energy crisis in the world, renewable energy sources (RESs) are regarded as the best way to achieve sustainable development [1,2]. RESs such as wind and solar energies have received increasing attention and have undergone development [3,4]. As an important energy-storage medium, lithium-ion batteries play an important role in the development of renewable energy [5]. Lithium-ion batteries are widely used for energy storage in electric vehicles (EV), energy-storage stations, and other situations, owing to their high energy density and low cost [6,7]. However, an unsuitable operating temperature and charging rate can have significant negative impacts on the service life of lithium-ion batteries [8,9]. Therefore, it is important to understand how lithium-ion batteries age under different thermoelectric conditions [10,11]. O’Kane et al. [12] employed a pseudo-two-dimensional physical model to study the effect of the concentration-dependent diffusion coefficients for active electrode materials on lithium plating and stripping. They proposed a new modeling protocol to distinguish among fast charging, slow charging, and lithium plating or stripping. Li et al. [13] conducted 400 and 800 charge–discharge cycles at 25 and 45 °C and studied the performance degradation mechanism for retired power batteries to determine if they meet the requirements for energy-storage systems in secondary utilization scenarios. Their experimental results verified that the lithium-ion loss at the cathode of the LiFePO4 battery accounted for over 70% of the capacity deterioration and that over 85% of the lithium ions were consumed at the graphite anode. Xie et al. [14] explored the high-temperature aging behavior of lithium-ion batteries heated to 100 °C. The capacity decreased by 61.1% during the first two charge–discharge cycles but began to recover after the second cycle and stabilized after the 24th cycle. Zilberman et al. [15] analyzed the aging behavior of lithium-ion batteries by differential voltage analysis and negative-electrode scanning electron microscopy imaging. Their results showed that the forced temperature gradient led to different degradation rates, while a cold battery aged fast because of lithium plating. Naumann et al. [16] proposed a combined semiempirical aging model for capacity deterioration and resistance increase based on measured data and a calendar-aging model that can fully predict the life of LiFePO4/graphite batteries for different applications and under different operating conditions. Zhu et al. [17] studied the battery degradation mechanism of an 18650-type battery with a capacity of 2.5 Ah, which they subjected to cycle tests at 25 and 0 °C. The differential voltage and alternating current (AC) impedance were used to quantitatively evaluate the degradation mechanism of the battery. Heins et al. [18] determined the time constants for the overall dynamics of all batteries according to the distribution of relaxation time. They comprehensively studied the impedance spectrum as a function of the temperature and potential of lithium-ion batteries. Rumberg et al. [19] studied the aging mechanism for battery capacity by analyzing changes in the open-circuit voltage (OCV). They proposed a model to calculate the OCV characteristics of a full-cell based on the half-cell OCV characteristics of the anode and cathode, which they applied to simulate changes in the full-cell OCV due to anode and cathode side reactions and loss of active material. Fath et al. [20] proposed a technique for quantifying the loss of recyclable lithium and the reduction in the electrode capacity over charging cycles. They introduced a fitting factor to describe the uneven distribution of lithium in the battery based on the first derivative of the OCV curve relative to the charge between state peaks.
Summarily, most studies on battery aging have focused on analysis methods. However, only a few studies have reported on the aging law of lithium-ion batteries in different aging paths [21,22]. Here, experiments were performed to examine the aging characteristics of LiFePO4 batteries according to different coupled thermoelectric aging paths and parameters. The direct current internal resistance (DCIR) and probability density function (PDF) were used to examine the changes in the battery parameters during the aging process. The PDF curve was also used to study the battery-aging mechanism at different charging rates and ambient temperatures. This study serves as a reference for investigating the battery-aging mechanism and estimating the state of health (SOH) for battery management.

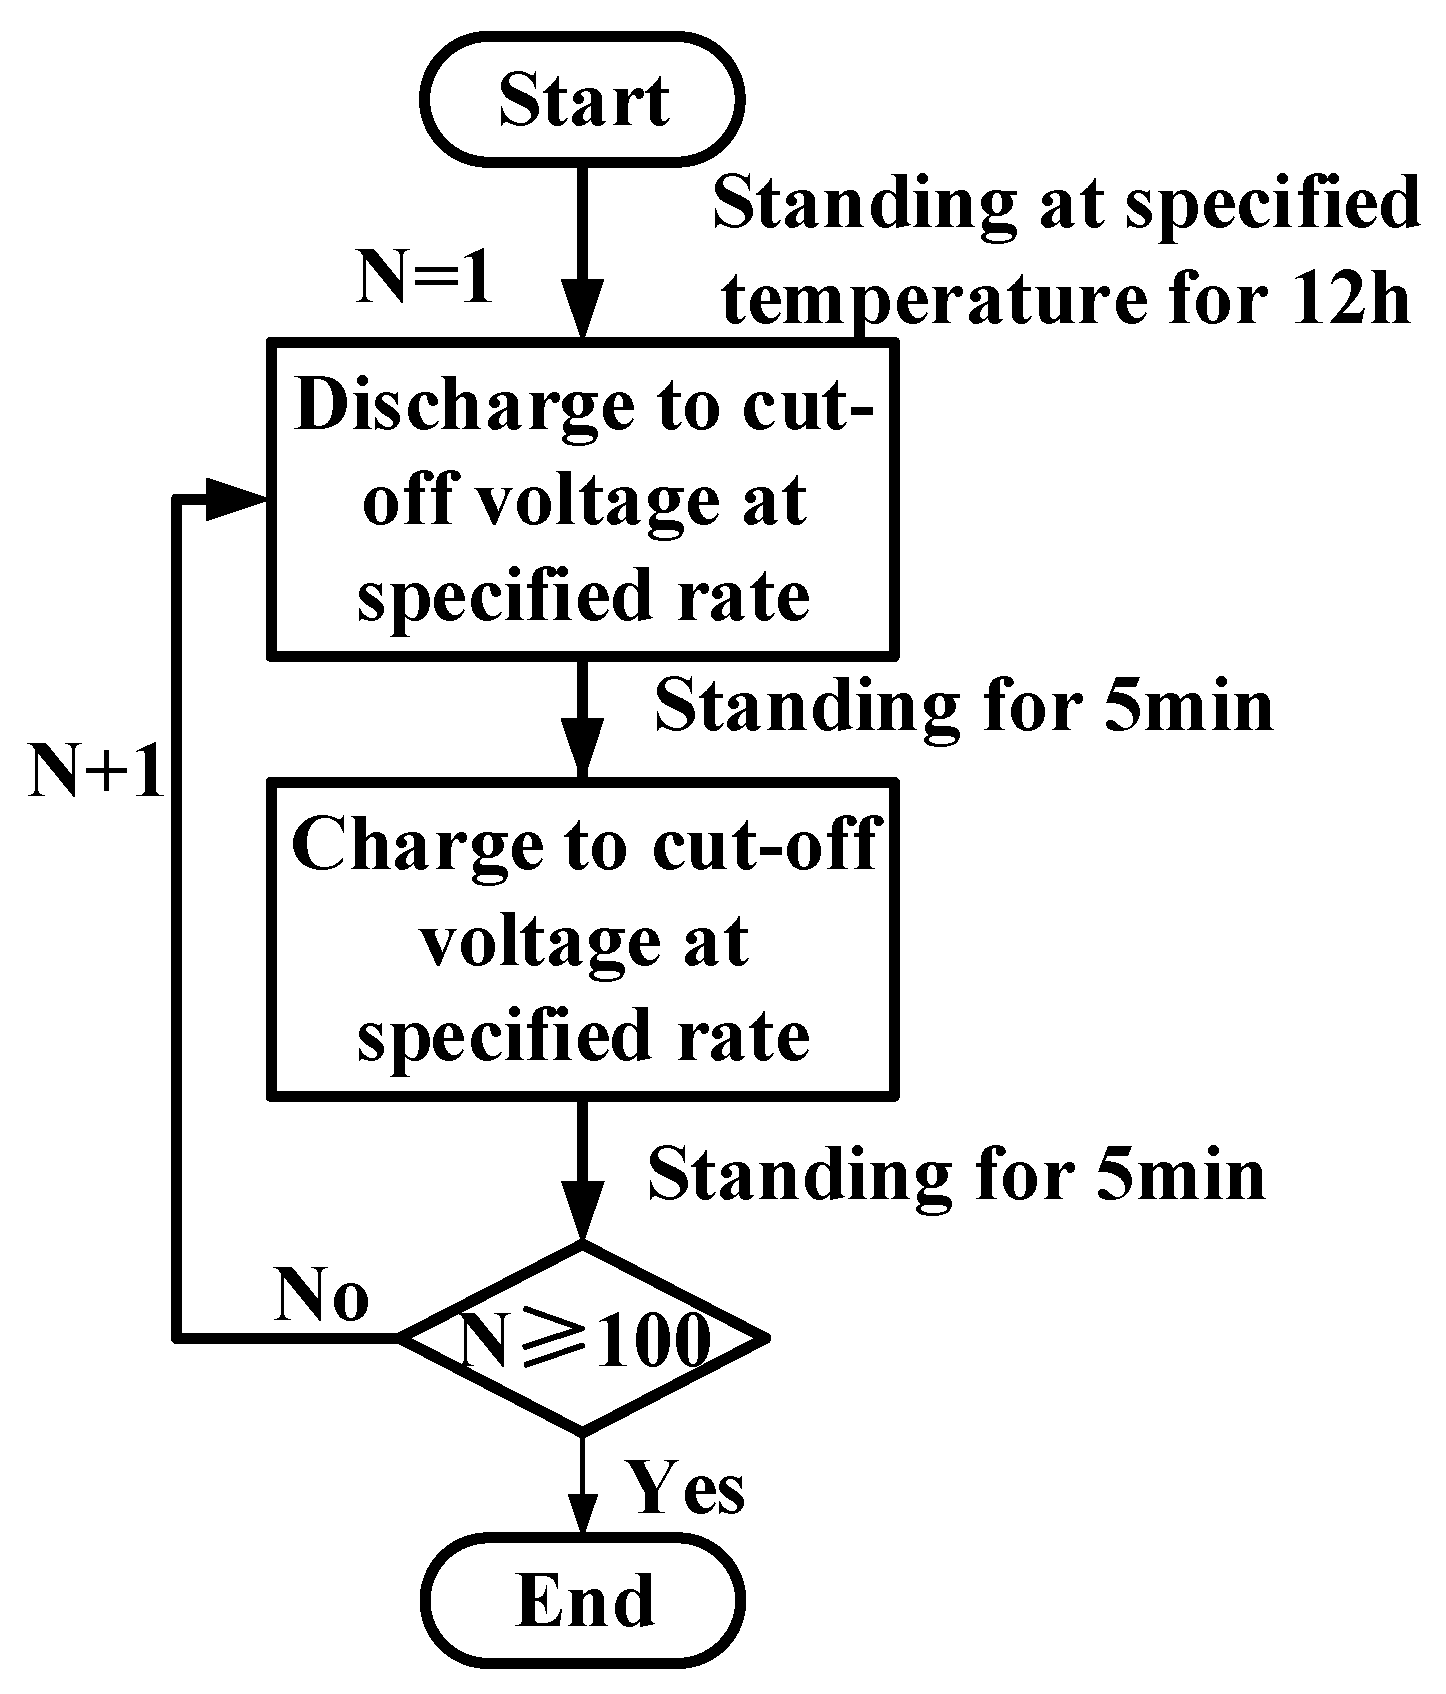
2. Setup of Aging Paths for the Lithium-Ion Battery

Table 1 shows the orthogonal aging paths adopted to evaluate the capacity-deterioration characteristics of the batteries during the charge–discharge cycle tests. According to Cycle Life Requirements and Test Methods for Traction Battery of Electric Vehicle (GB/T 31484-2015), the vehicle power battery shall have a cycle life of not less than 1000 cycles at room temperature at a charging rate of 1 C. The charging rate is a measure of the charging speed. It refers to the ratio required for the battery to be charged to its rated capacity within a specified time. It is equal to the multiple of the battery’s rated capacity (i.e., “charging current/battery rated capacity = charging rate”). A charging rate of 1 C implies that it takes 1 h to charge the battery from 0% state of charge (SOC) to 100% SOC. However, charging a battery at a constant current and voltage takes a long time at high charging rates of 2 C and above. To shorten the duration of the experiment without affecting its purpose, only a constant current was maintained. Lithium-ion batteries perform well only within a suitable temperature range. Generally, the optimal operating temperature range of lithium-ion batteries is 15–40 °C. However, in reality, owing to the influence of ambient temperature and battery self-generated heat, the operating temperature of the battery is often not ideal. In most cases, the operating temperature of the battery is maintained between 10 °C and 50 °C. Therefore, 10, 30, and 50 °C were selected for this study. To achieve fast charging and high power output for power batteries, the working rate frequently exceeds 1 C, which is particularly evident during charging. The working rate generally ranges between 2 and 4 C; therefore, 2, 3, and 4 C were selected for this study. The batteries were maintained at each selected temperature for at least 12 h after the initial performance test and prior to the cycle test to ensure that the inside and outside of the battery were at the experimental temperature. Figure 1 shows the flowchart for the charge–discharge cycle tests of the batteries, where N represents the number of cycles.

3. Experimental Scheme and Platform

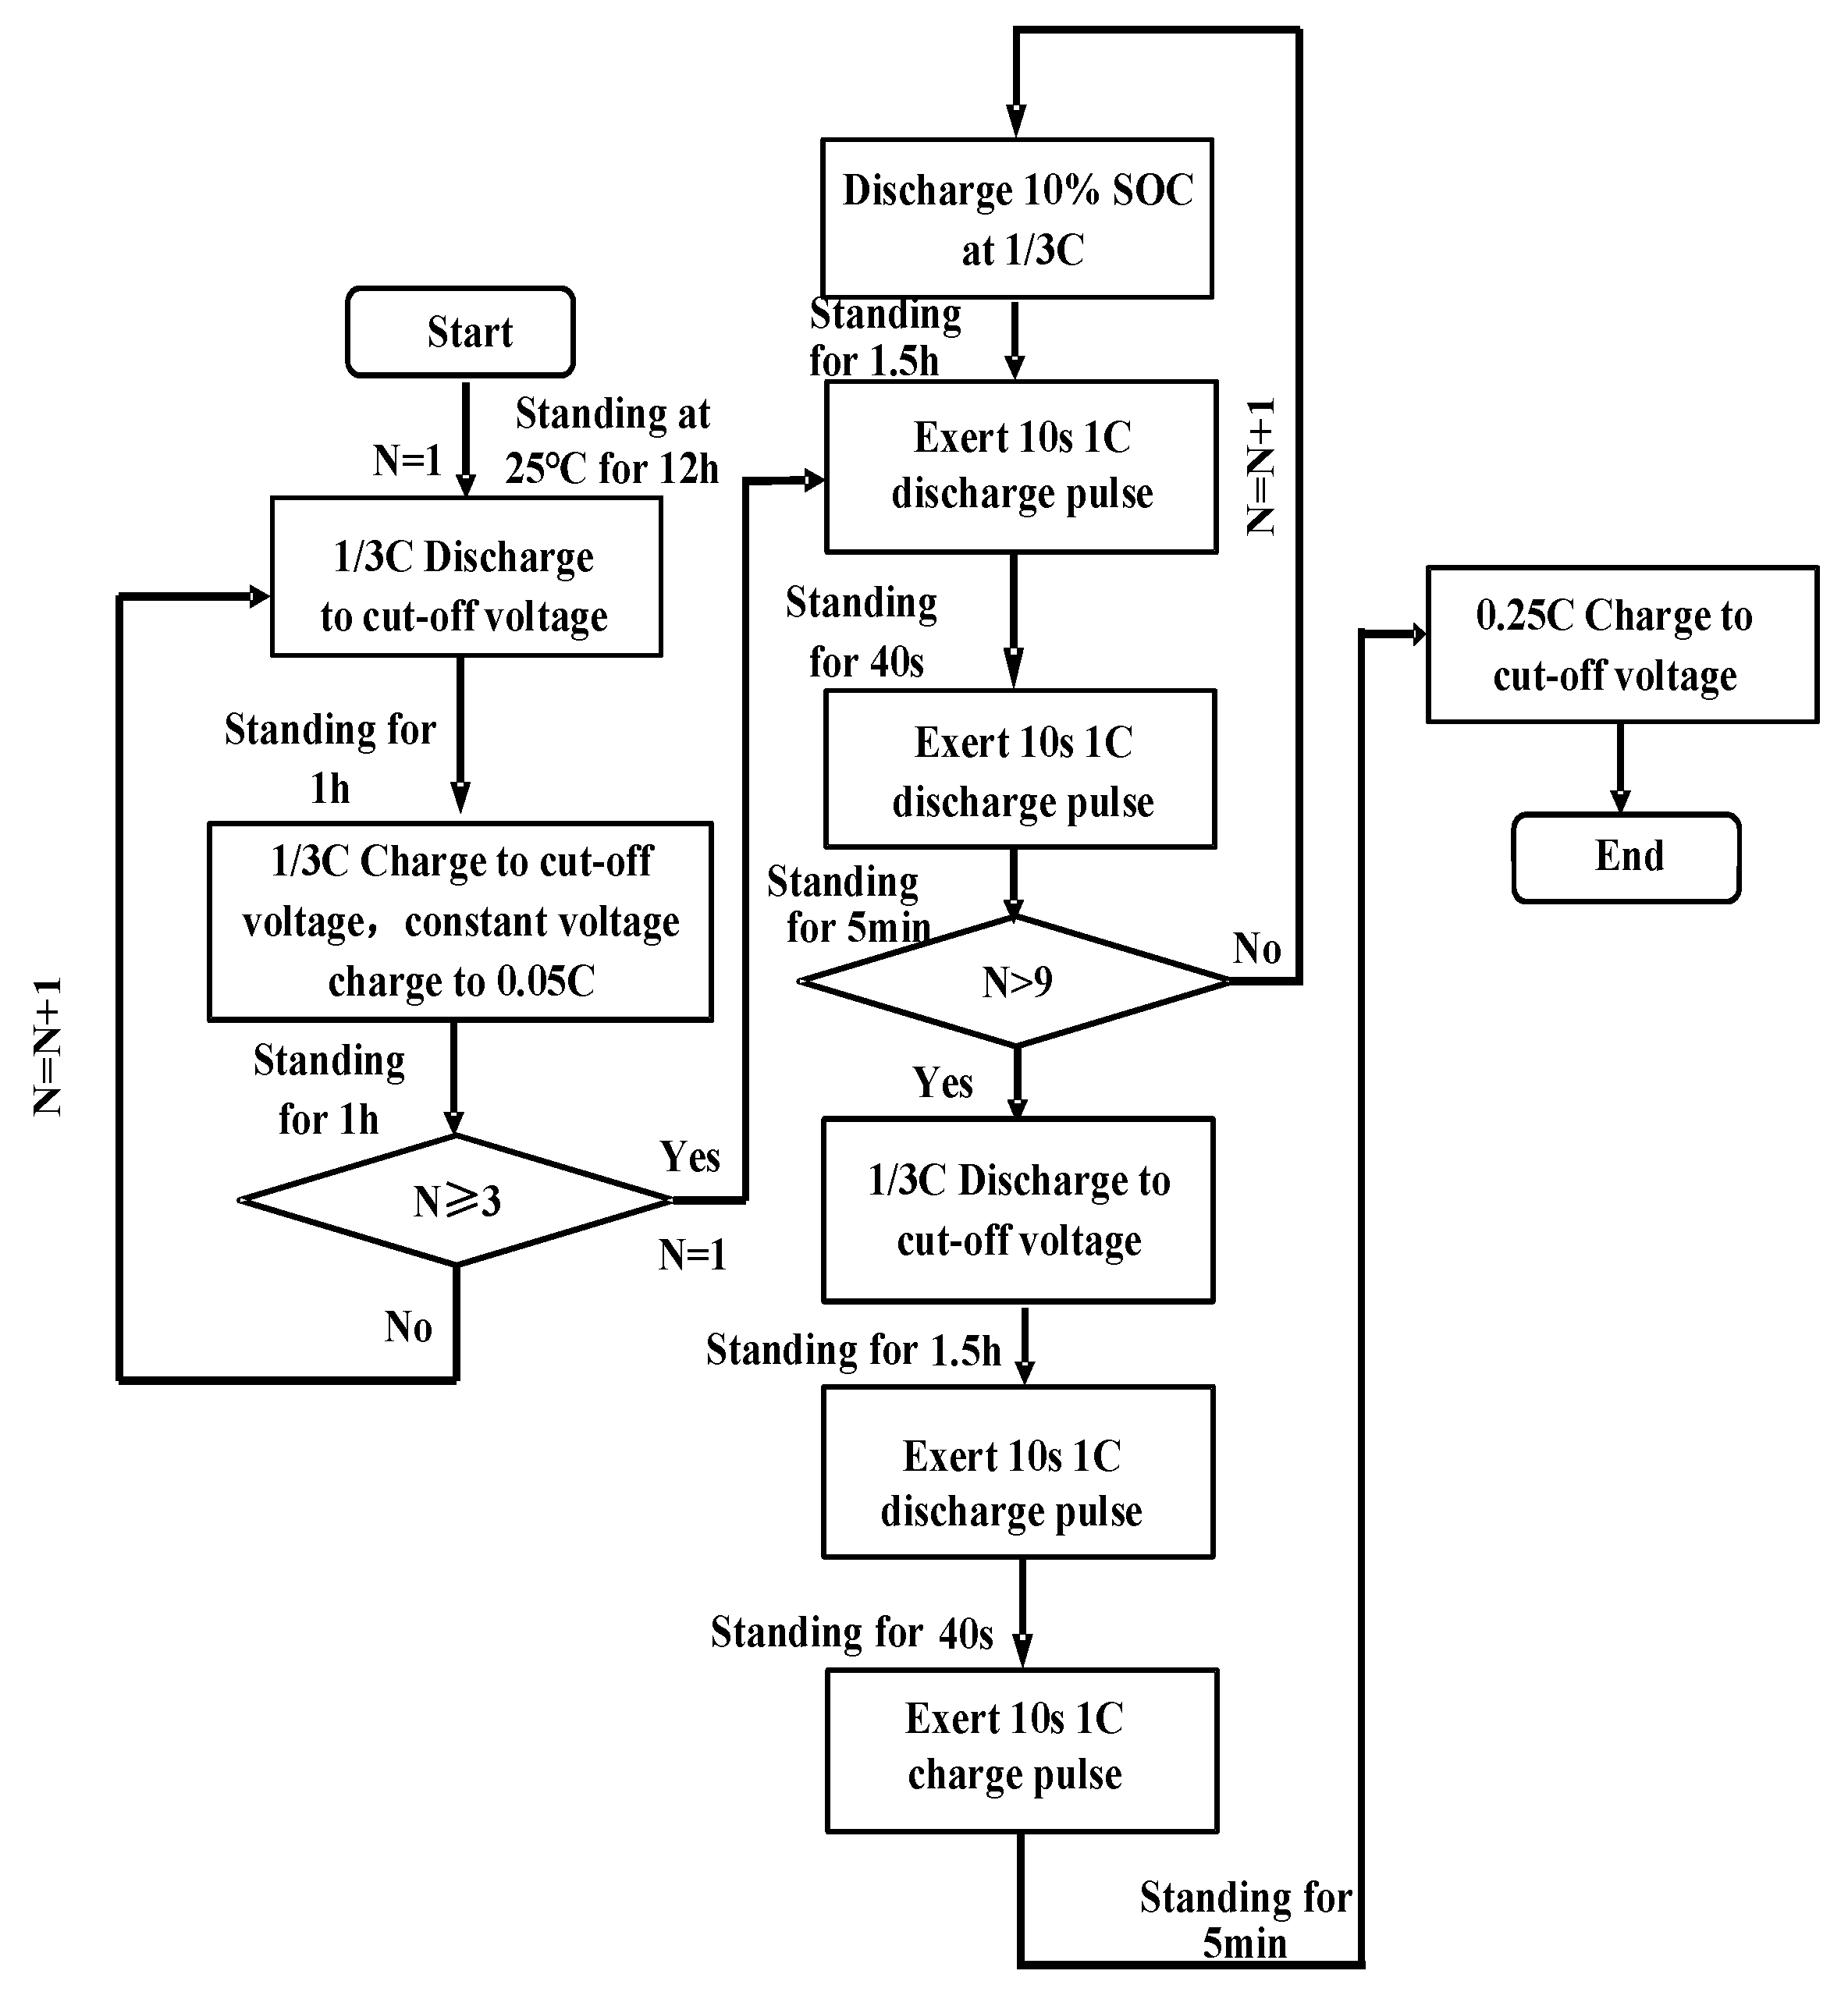
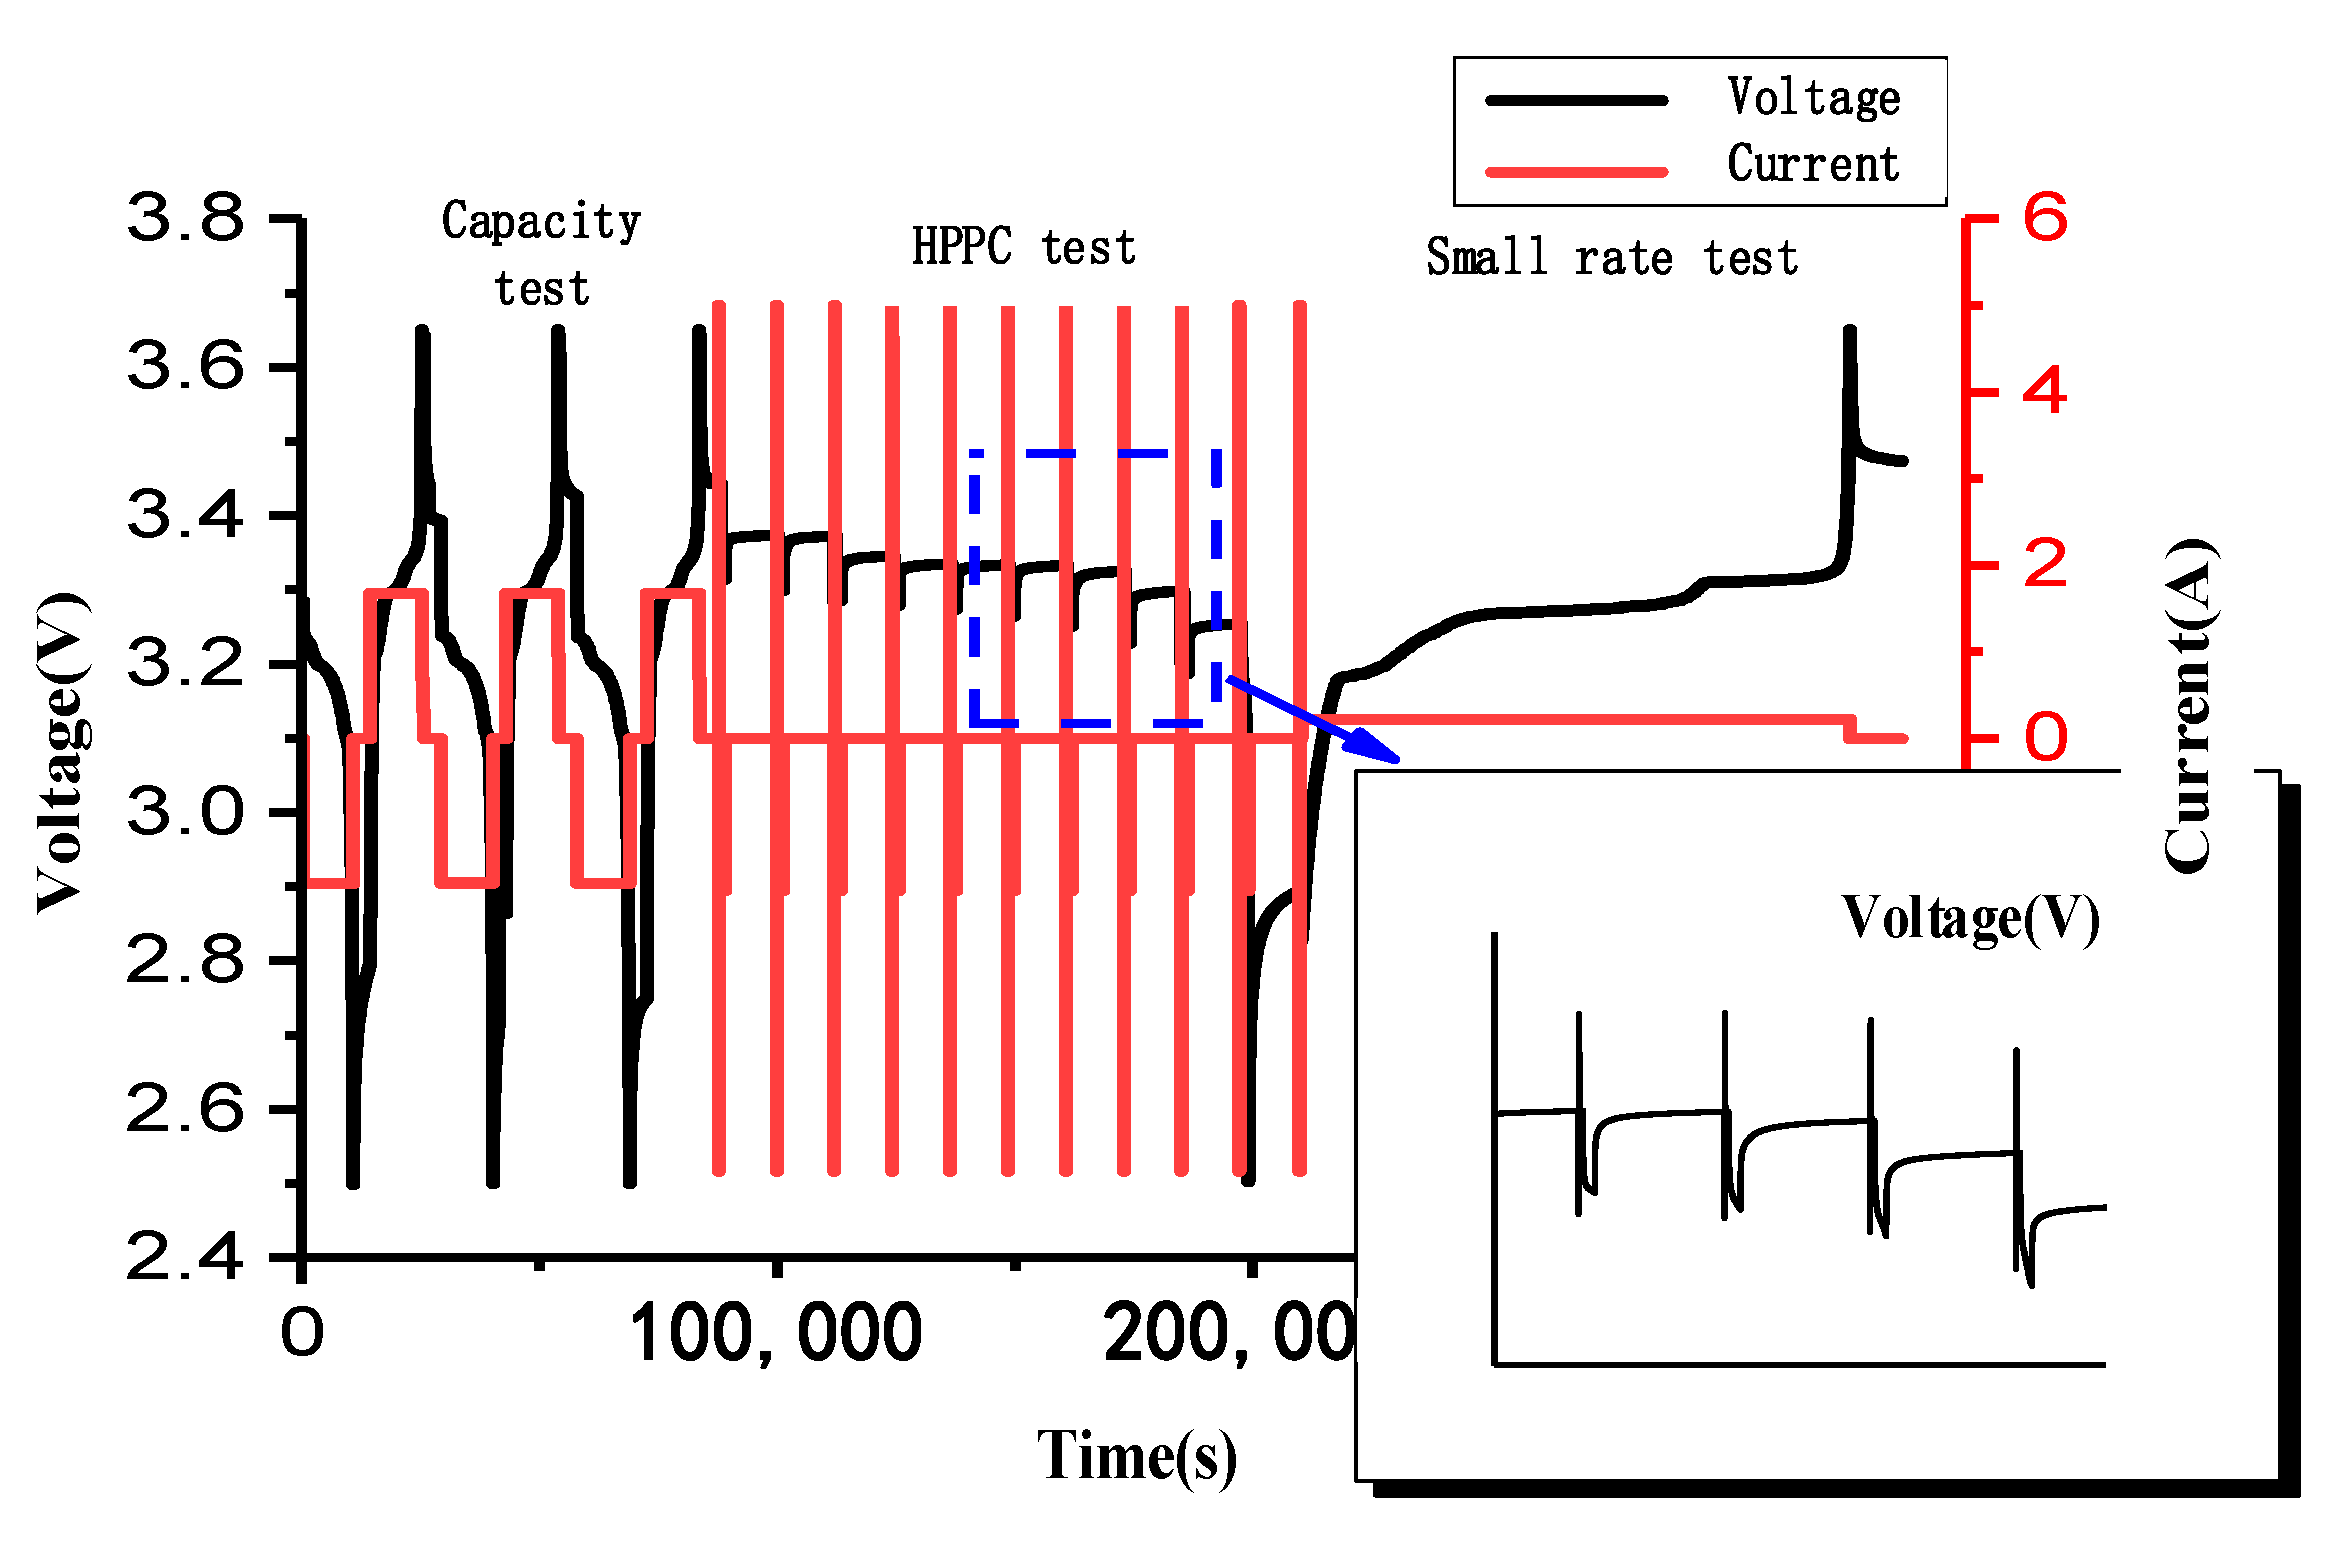
3.1. Basic Performance Tests of the Battery

To study the changes in the battery capacity and other properties with different aging paths, the battery performances prior to and after cycling were compared. The battery capacity referred to herein is the discharge capacity of the battery. This required the determination of the initial performance parameters of the batteries, which included the internal resistance, OCV, SOC, and the relationship among these parameters [23]. To assess the basic performance of the batteries, capacity, hybrid pulse power characterization (HPPC), and small-rate tests were performed at room temperature (25 °C). During the capacity test, three charge–discharge cycles were performed at a charging rate of 1/3 C, and the discharge capacity of the last cycle was defined as the initial battery capacity. Next, the HPPC test was conducted on a fully charged battery to determine the battery impedance for the full SOC interval (0–100% SOC). For the small-rate test, a discharged battery was charged at a rate of 0.25 C and a constant current. This process has very minimal polarization; therefore, it can be used to detect small and gradual changes in the electrochemical characteristics of lithium-ion batteries [24,25]. Figure 2 and Figure 3 show the flowchart and voltage–current curve, respectively, of the basic performance tests.

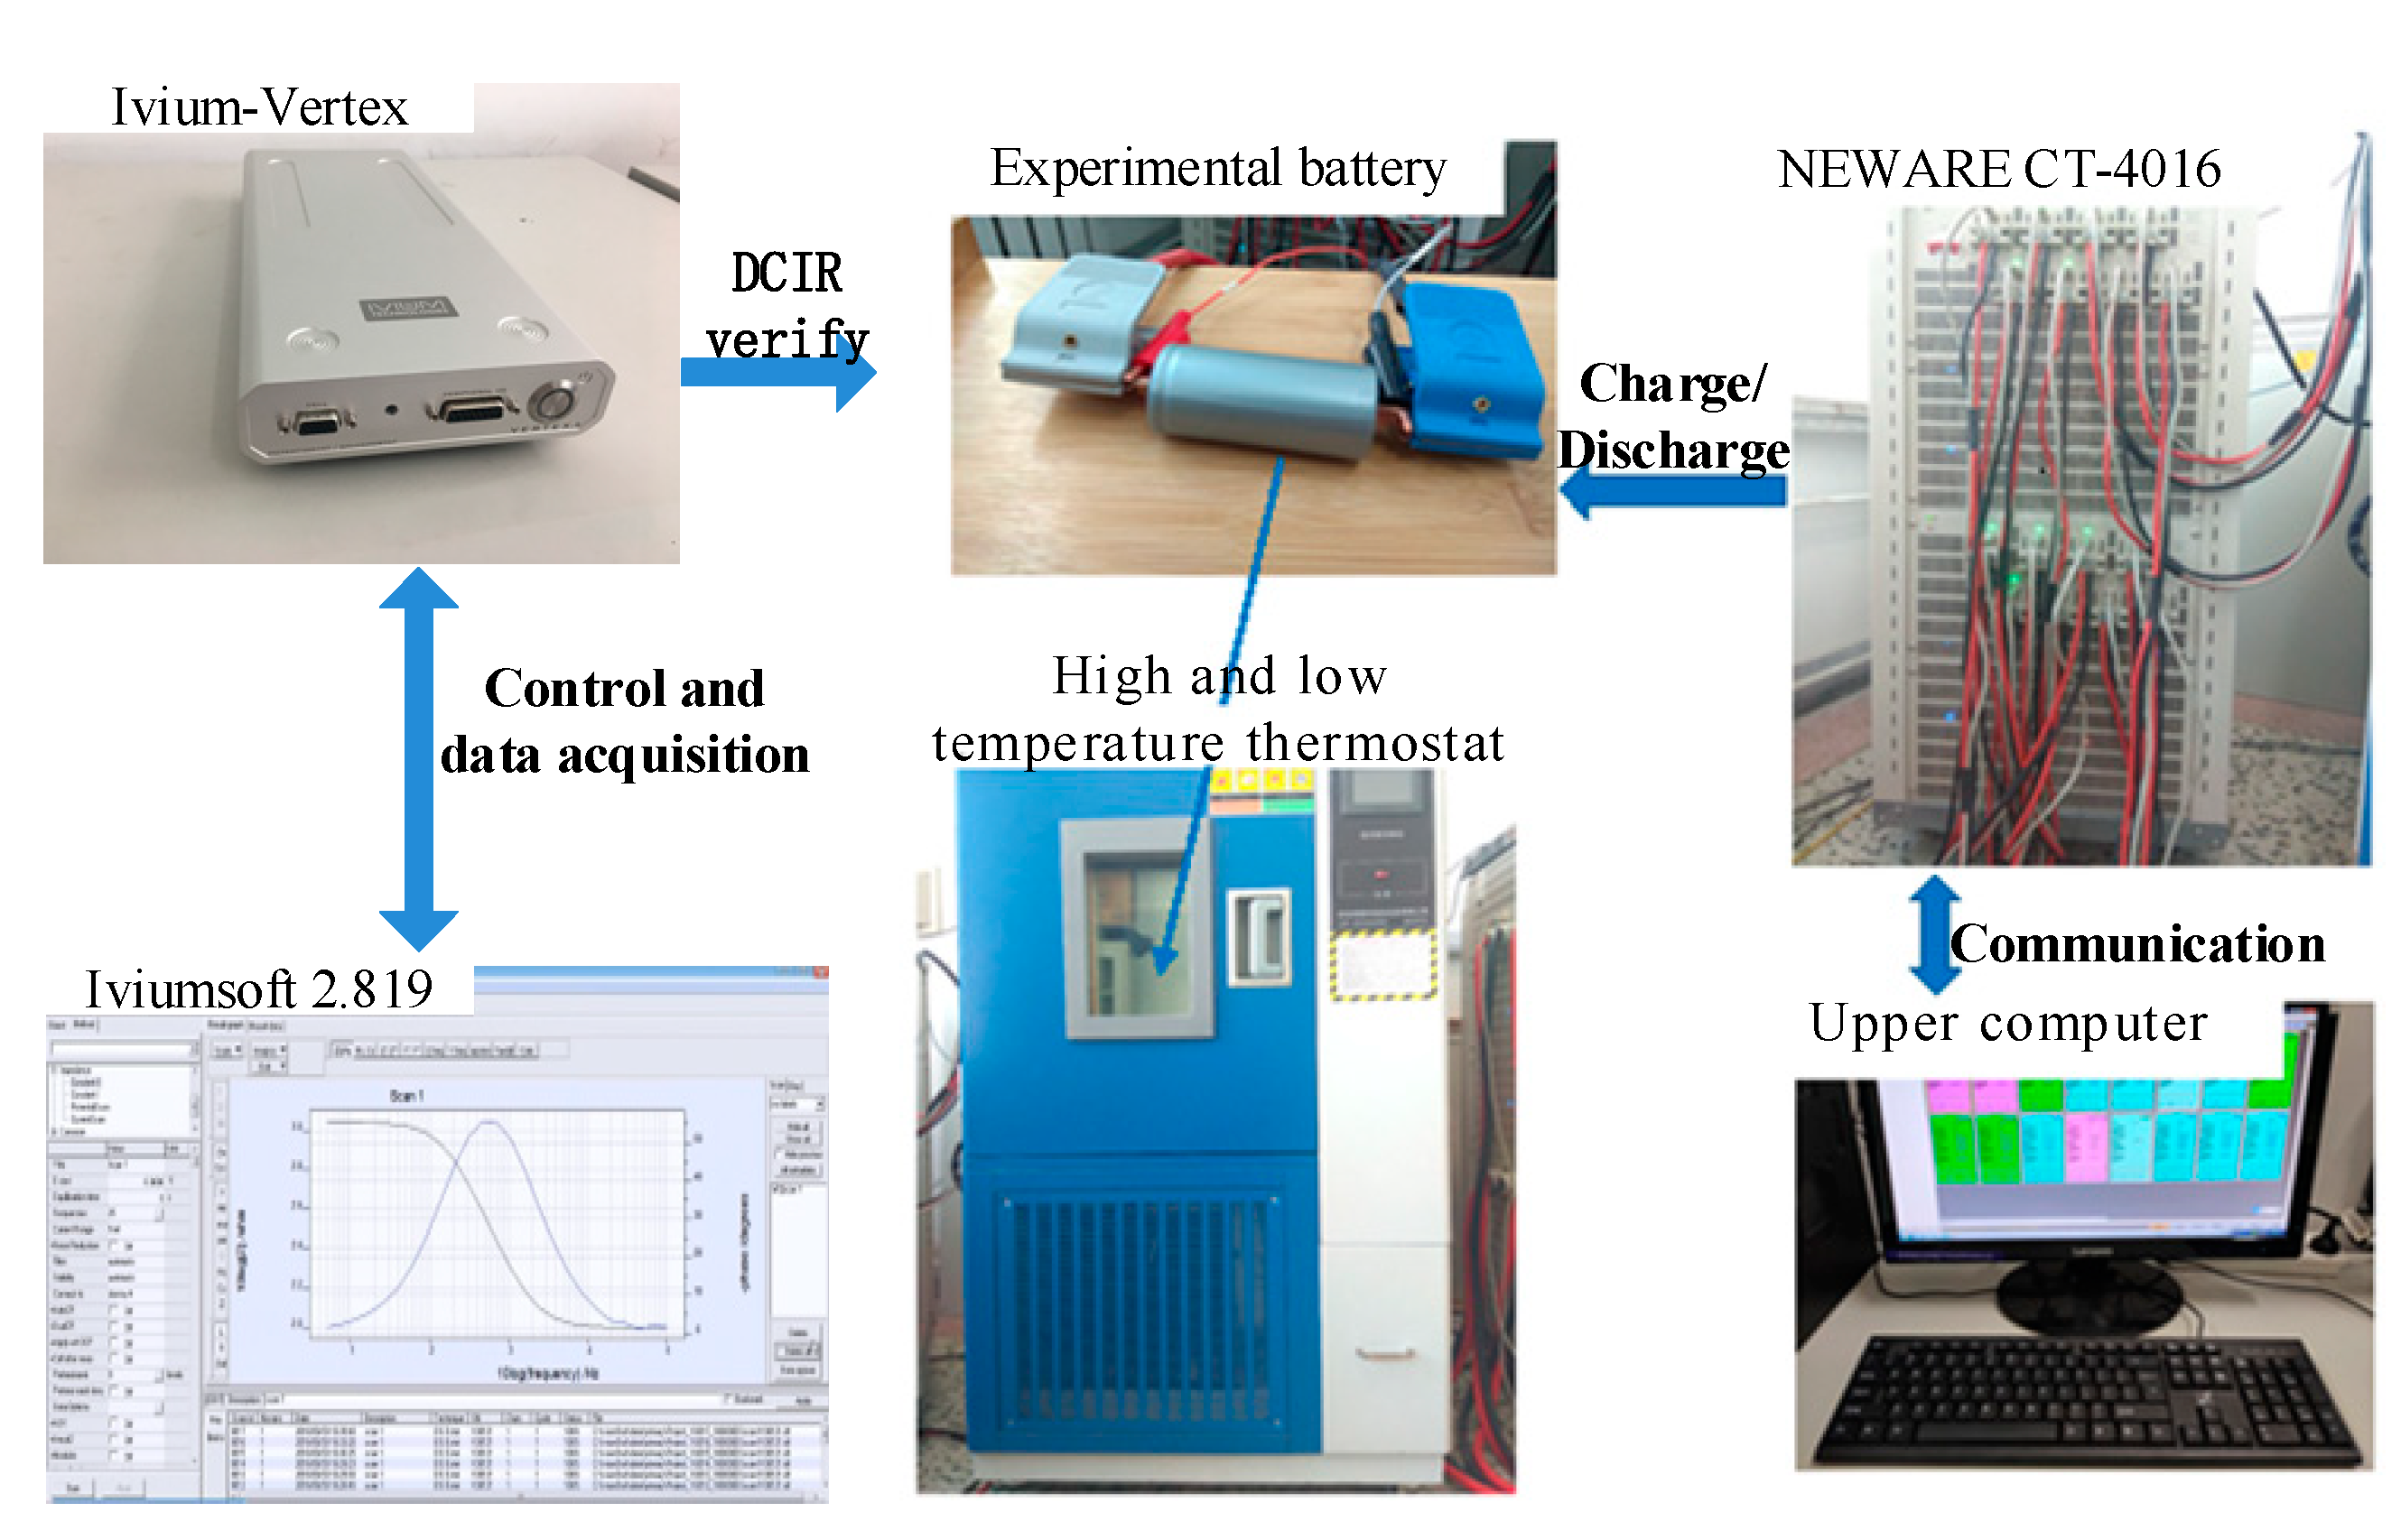
3.2. Construction of the Experimental Platform

Compared with lithium nickel manganese cobalt oxide batteries, lithium iron phosphate batteries are safer, cost effective, and have lower source dependency such that they are widely used in heavy-duty EV, such as electric buses. We focused on how to solve the problems of aging and its potential negative influence on the safety of electric buses. Therefore, we chose a lithium iron phosphate battery for the experiment. Here a cylindrical 32,650 commercial LiFePO4 power battery with a nominal capacity of 5 Ah was used. Its working voltage was 3.2 V, and the cutoff voltages for charging and discharging were 3.65 and 2.5 V, respectively. The diameter of the battery was 32.2 ± 0.5 mm; the height was 69.8 ± 0.2 mm, and the weight was 145 ± 2 g. The basic parameters of the battery are shown in Table 2. Figure 4 shows the experimental platform: an electrochemical workstation, charging and discharging motor, high- and low-temperature thermostat, data-acquisition terminal, upper computer, and battery. The 5 A/10 V Vertex electrochemical workstation (Ivium Company, the Netherlands) was used for the electrochemical test. The potential range was ±10 V; the current range was ±10 nA to ±10 A, and the minimum current resolution was 15 pA. The frequency range of AC impedance was 10 uHz to 1 MHz. The workstation can be used for multiple electrochemical tests, such as AC impedance, chronoamperometry, chronopotentiometry, cyclic voltammetry, and linear sweep voltammetry. These tests are used to measure and verify the DCIR of experimental batteries. The Neware CT-4016 16 channel battery test system was adopted. The voltage measurement range of each channel was 25 mV to 5 V, and the accuracy was 0.1% of the full range (i.e., 5 mV). The current output range was 0.15–30 A, and the accuracy can reach 0.03 A. The test system had the functions of charge–discharge, cycle, and DCIR tests.

4. Analysis of the Aging Characteristics

The following three methods were employed to analyze the aging characteristics of the batteries: incremental capacity analysis (ICA), PDF analysis, and impedance analysis methods.

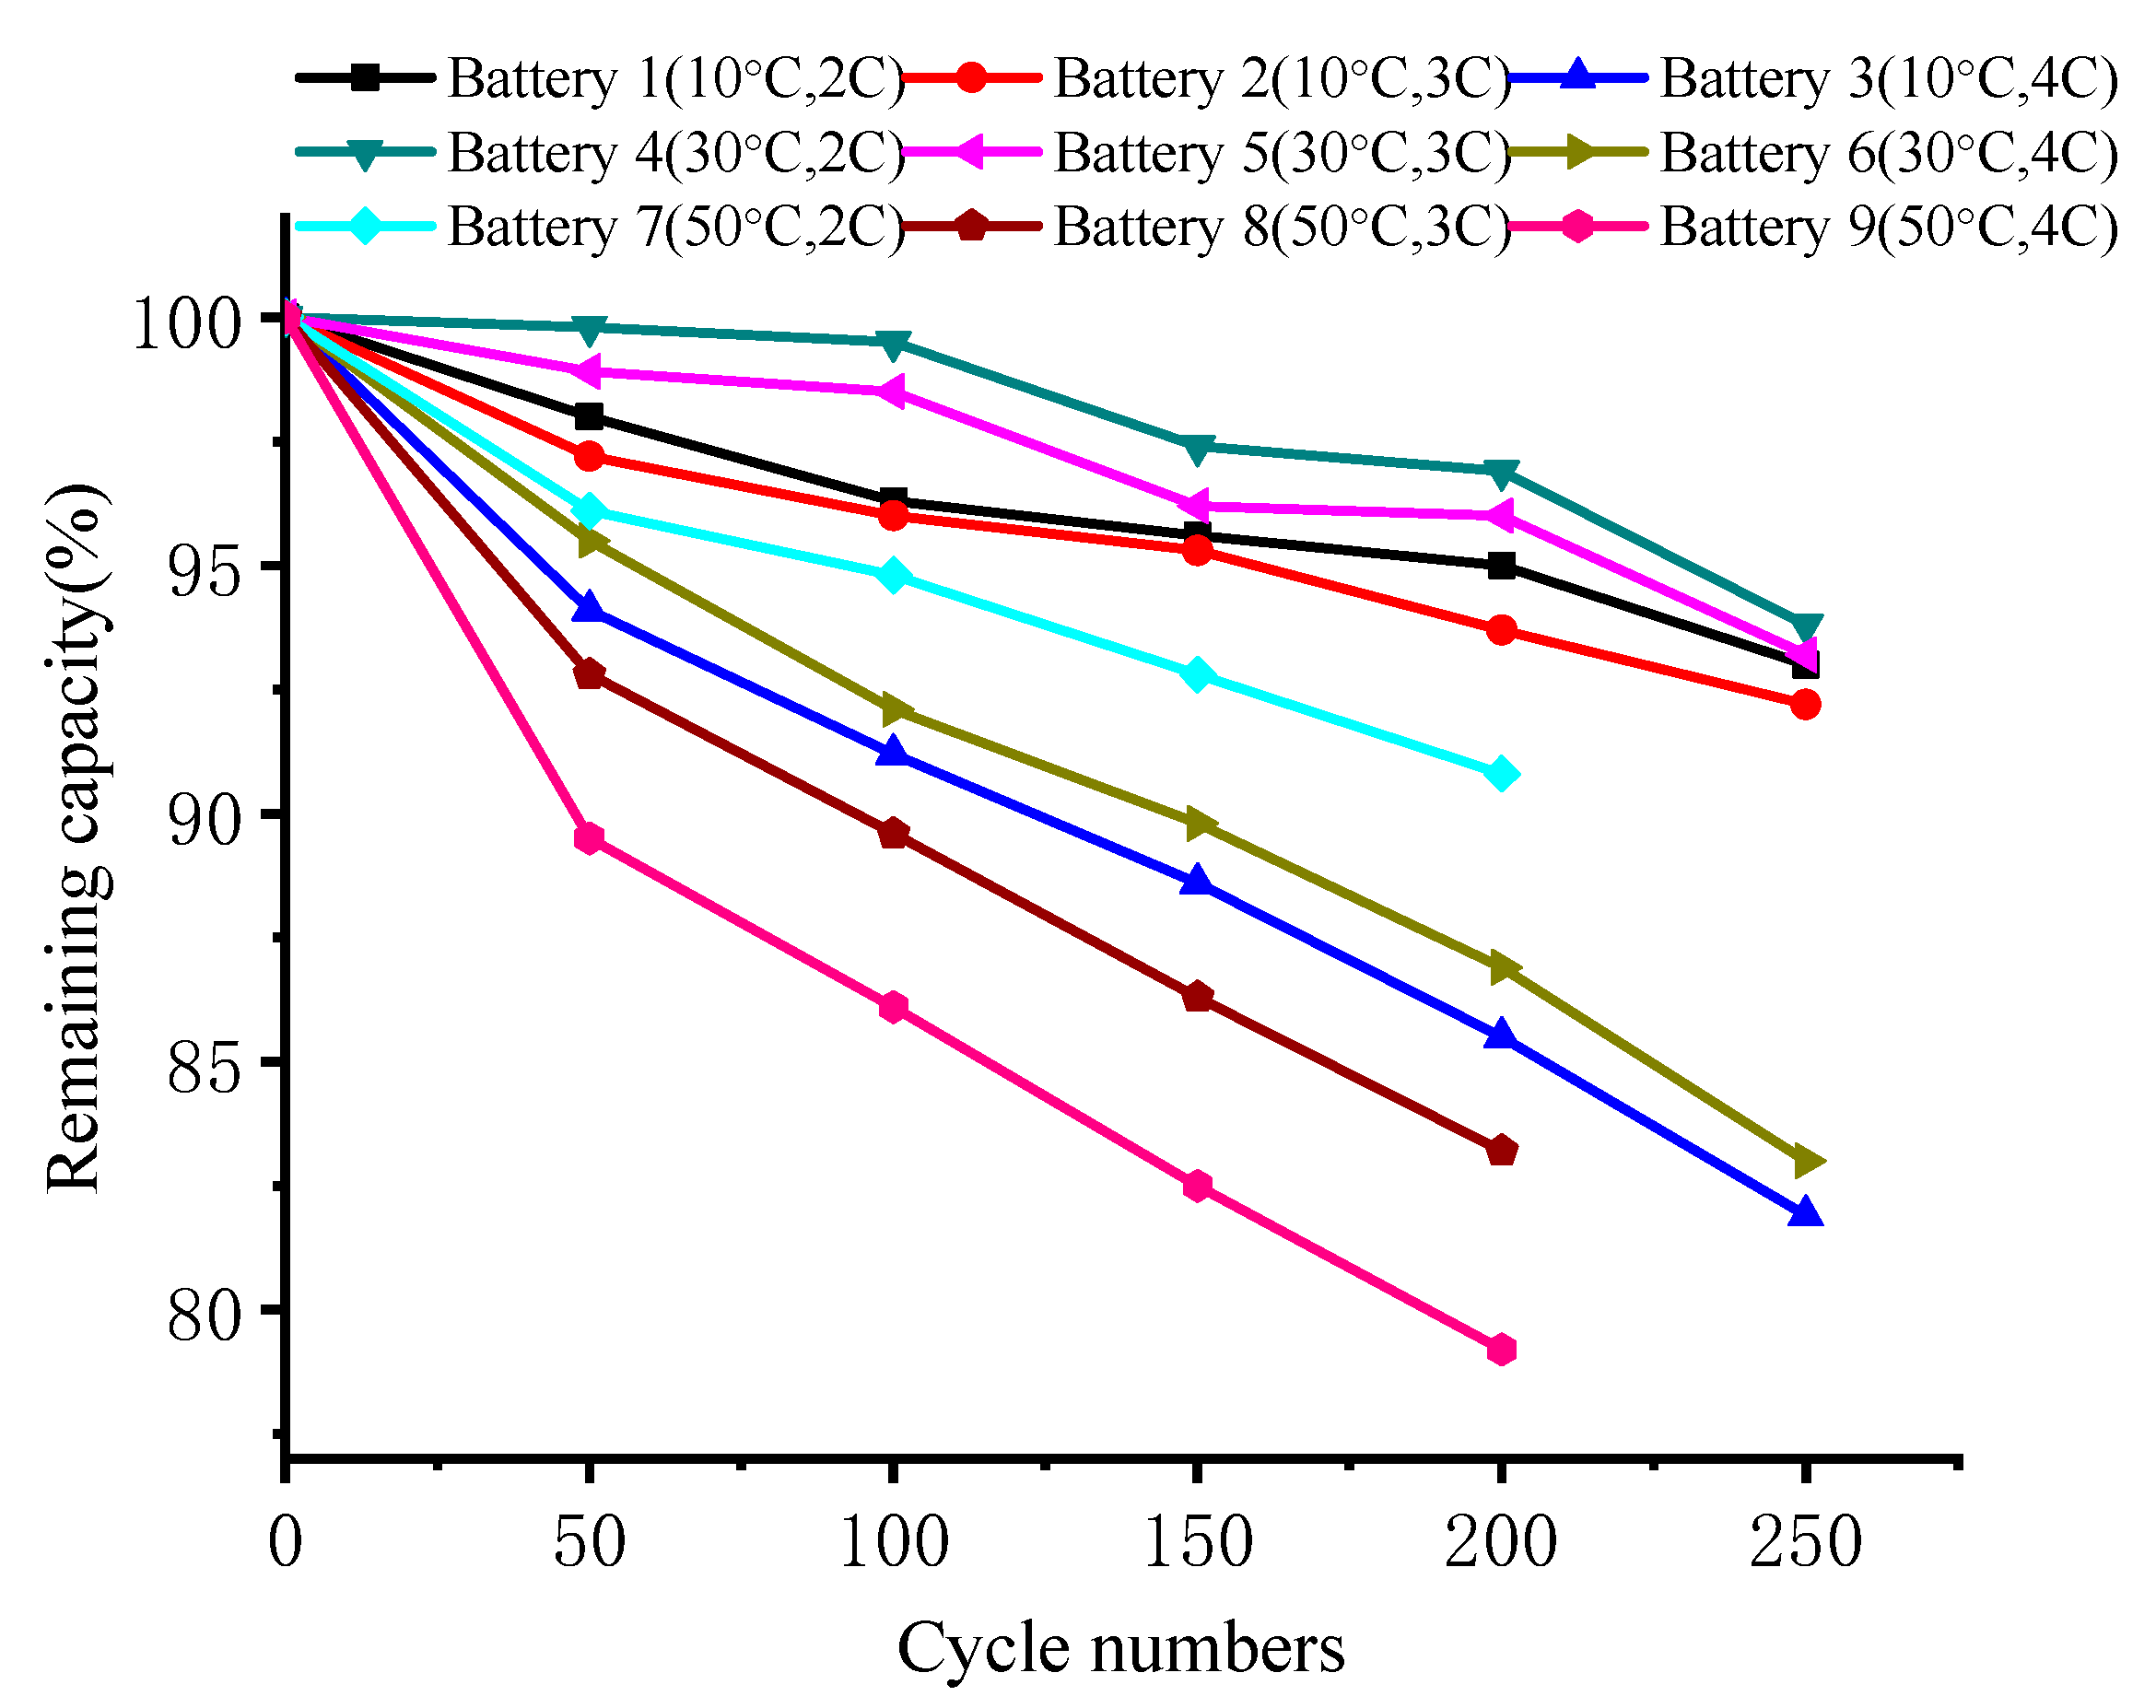
4.1. Capacity Analysis

Table 3 shows the numbered experimental batteries corresponding to different aging paths. The ratio of the battery capacity after a charge–discharge cycle to the initial battery capacity was used to characterize the aging characteristics. Figure 5 shows the changes in the battery capacity in different aging paths. As the number of cycles increased, the battery capacity was affected in different ways by the aging paths. For temperature, capacity deterioration accelerated as the temperature increased from room temperature and was most severe at 50 °C. After only approximately 200 cycles, Batteries 8 and 9 were close to or had exceeded the end of life (EOL) specified by the United States Advanced Battery Consortium LLC (USABC) (i.e., 80% of their initial capacity) [26,27]. The capacity deterioration was also significant at 10 °C; Battery 3 was close to the EOL after 250 cycles. For the charging rate, the results for Batteries 1, 2, 4, and 5 indicated that the capacity deterioration was similar at charging rates of 2 and 3 C and temperatures of 10 and 30 °C. The three charging rates only had significantly different effects at 50 °C. This was because the high temperature intensified the side reactions, which consumed the active lithium ions in the batteries.

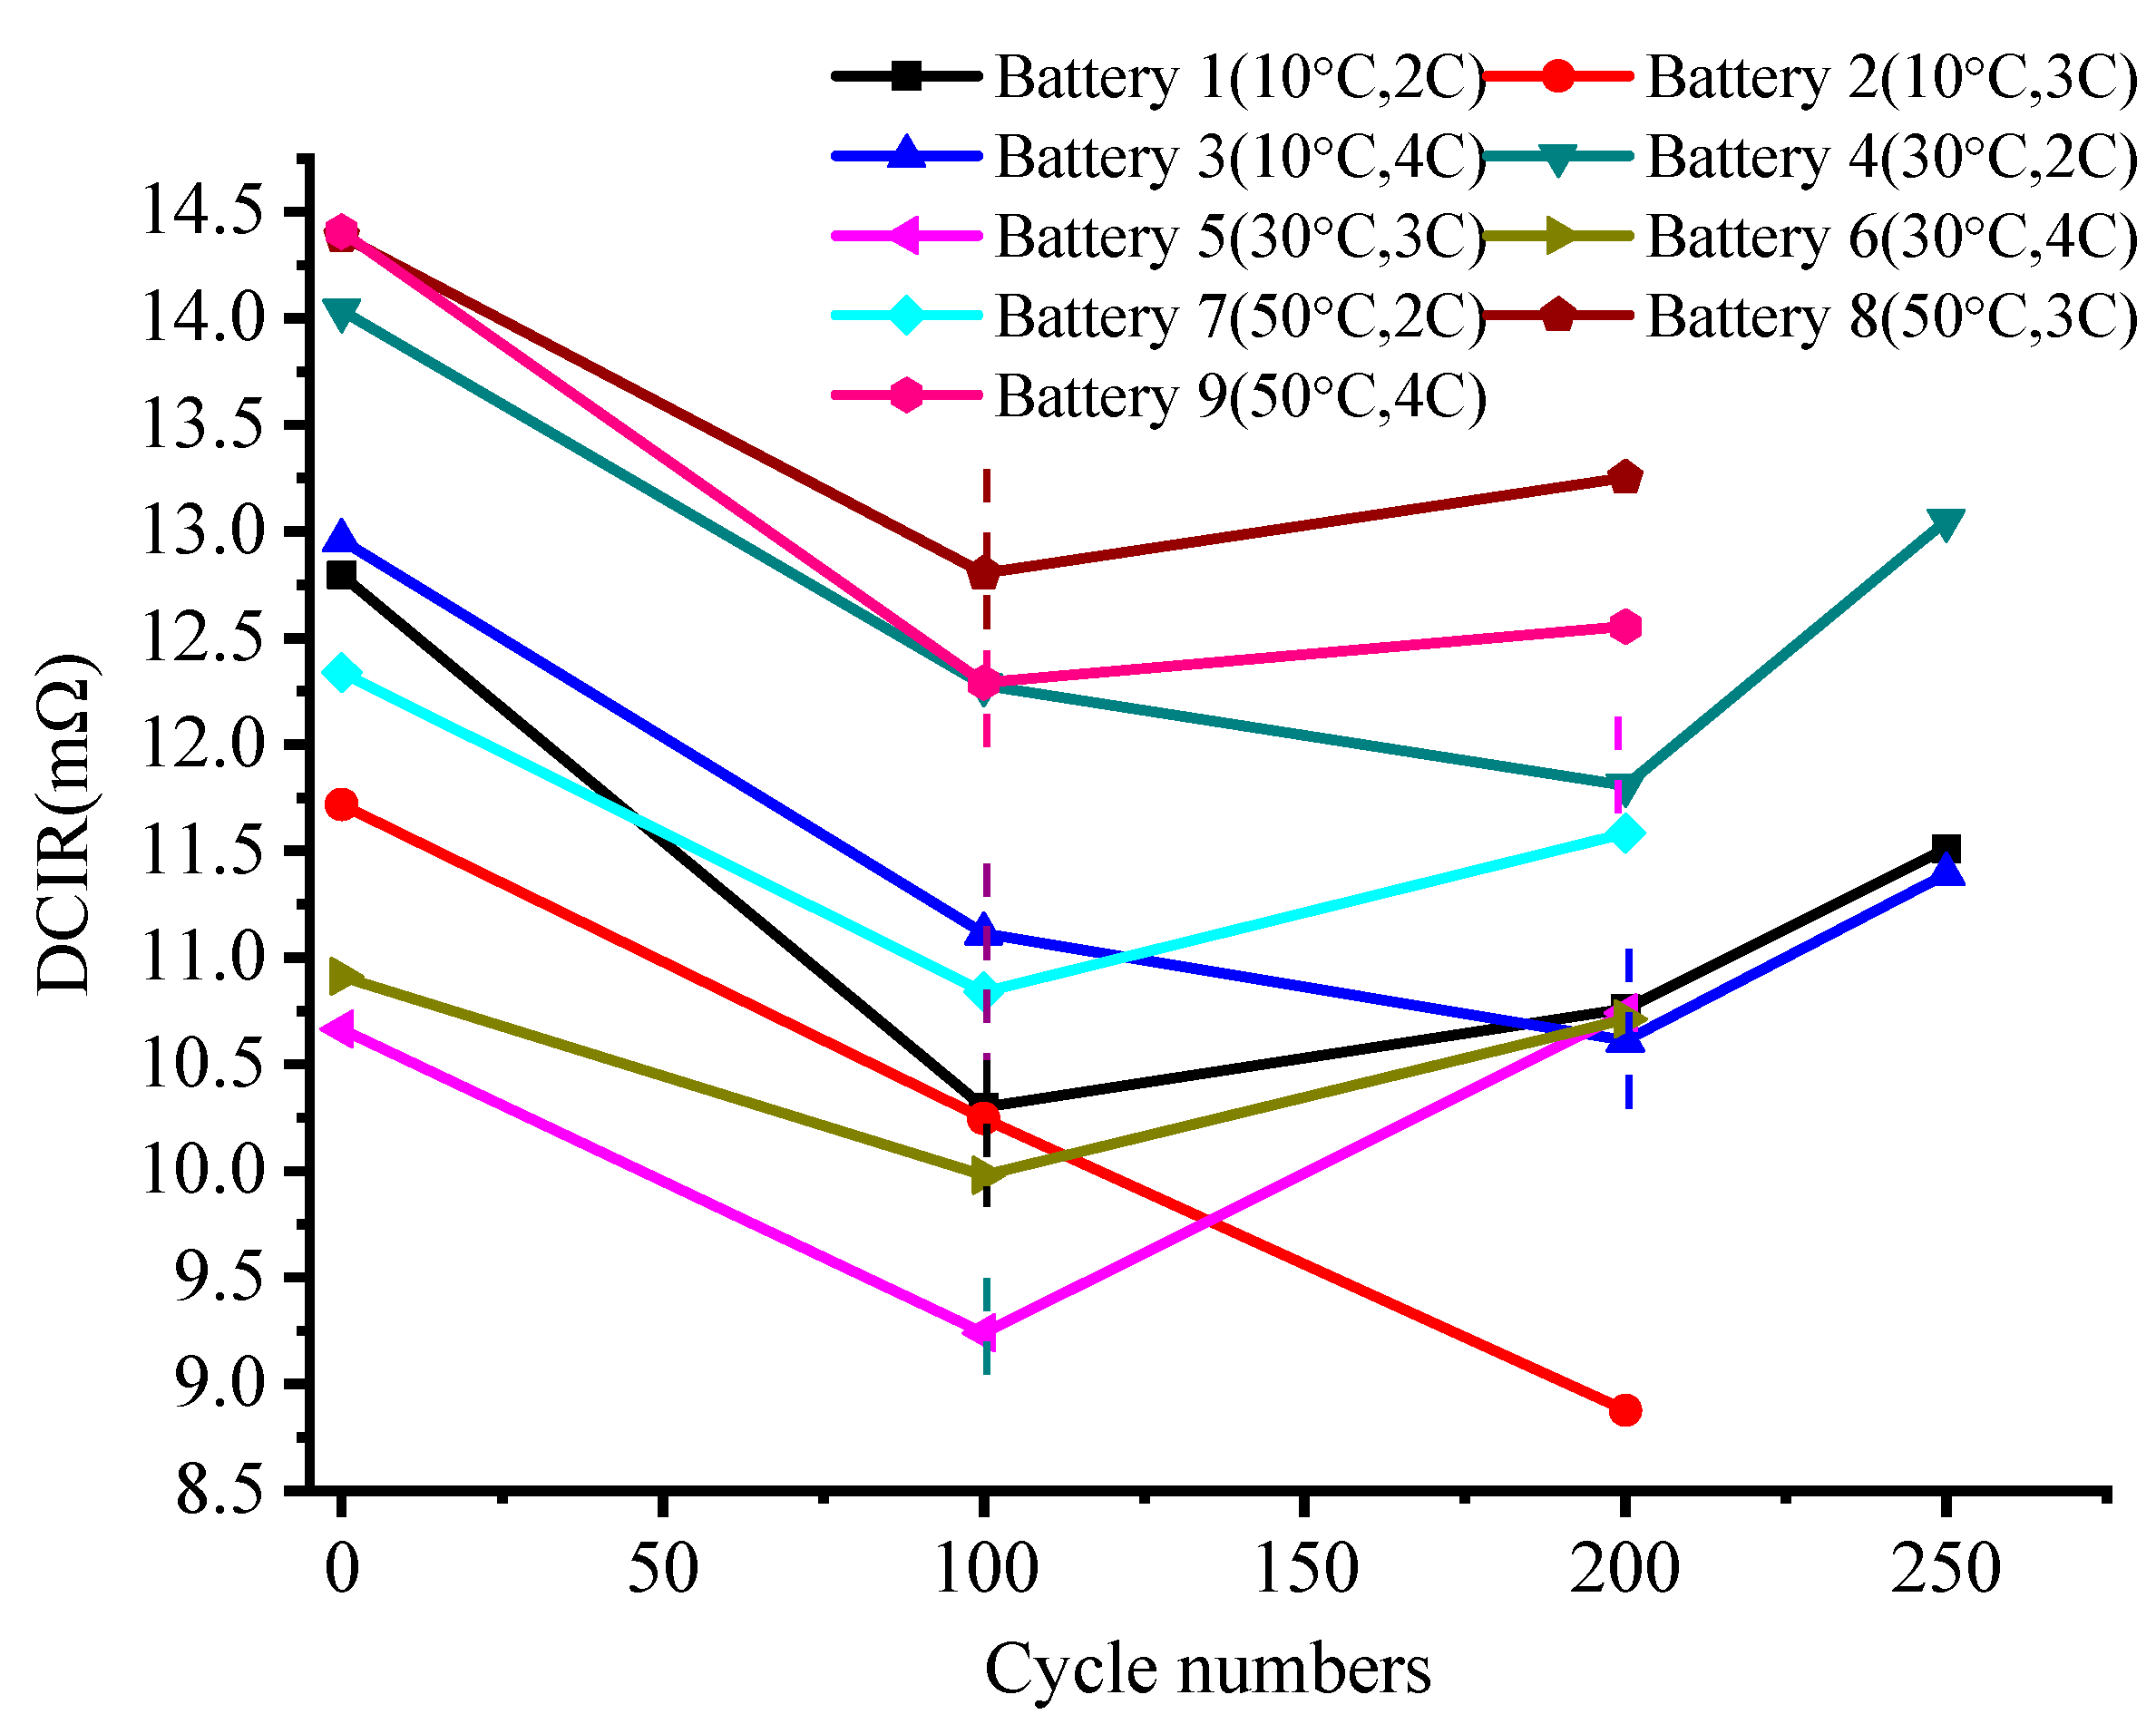
4.2. Impedance Analysis
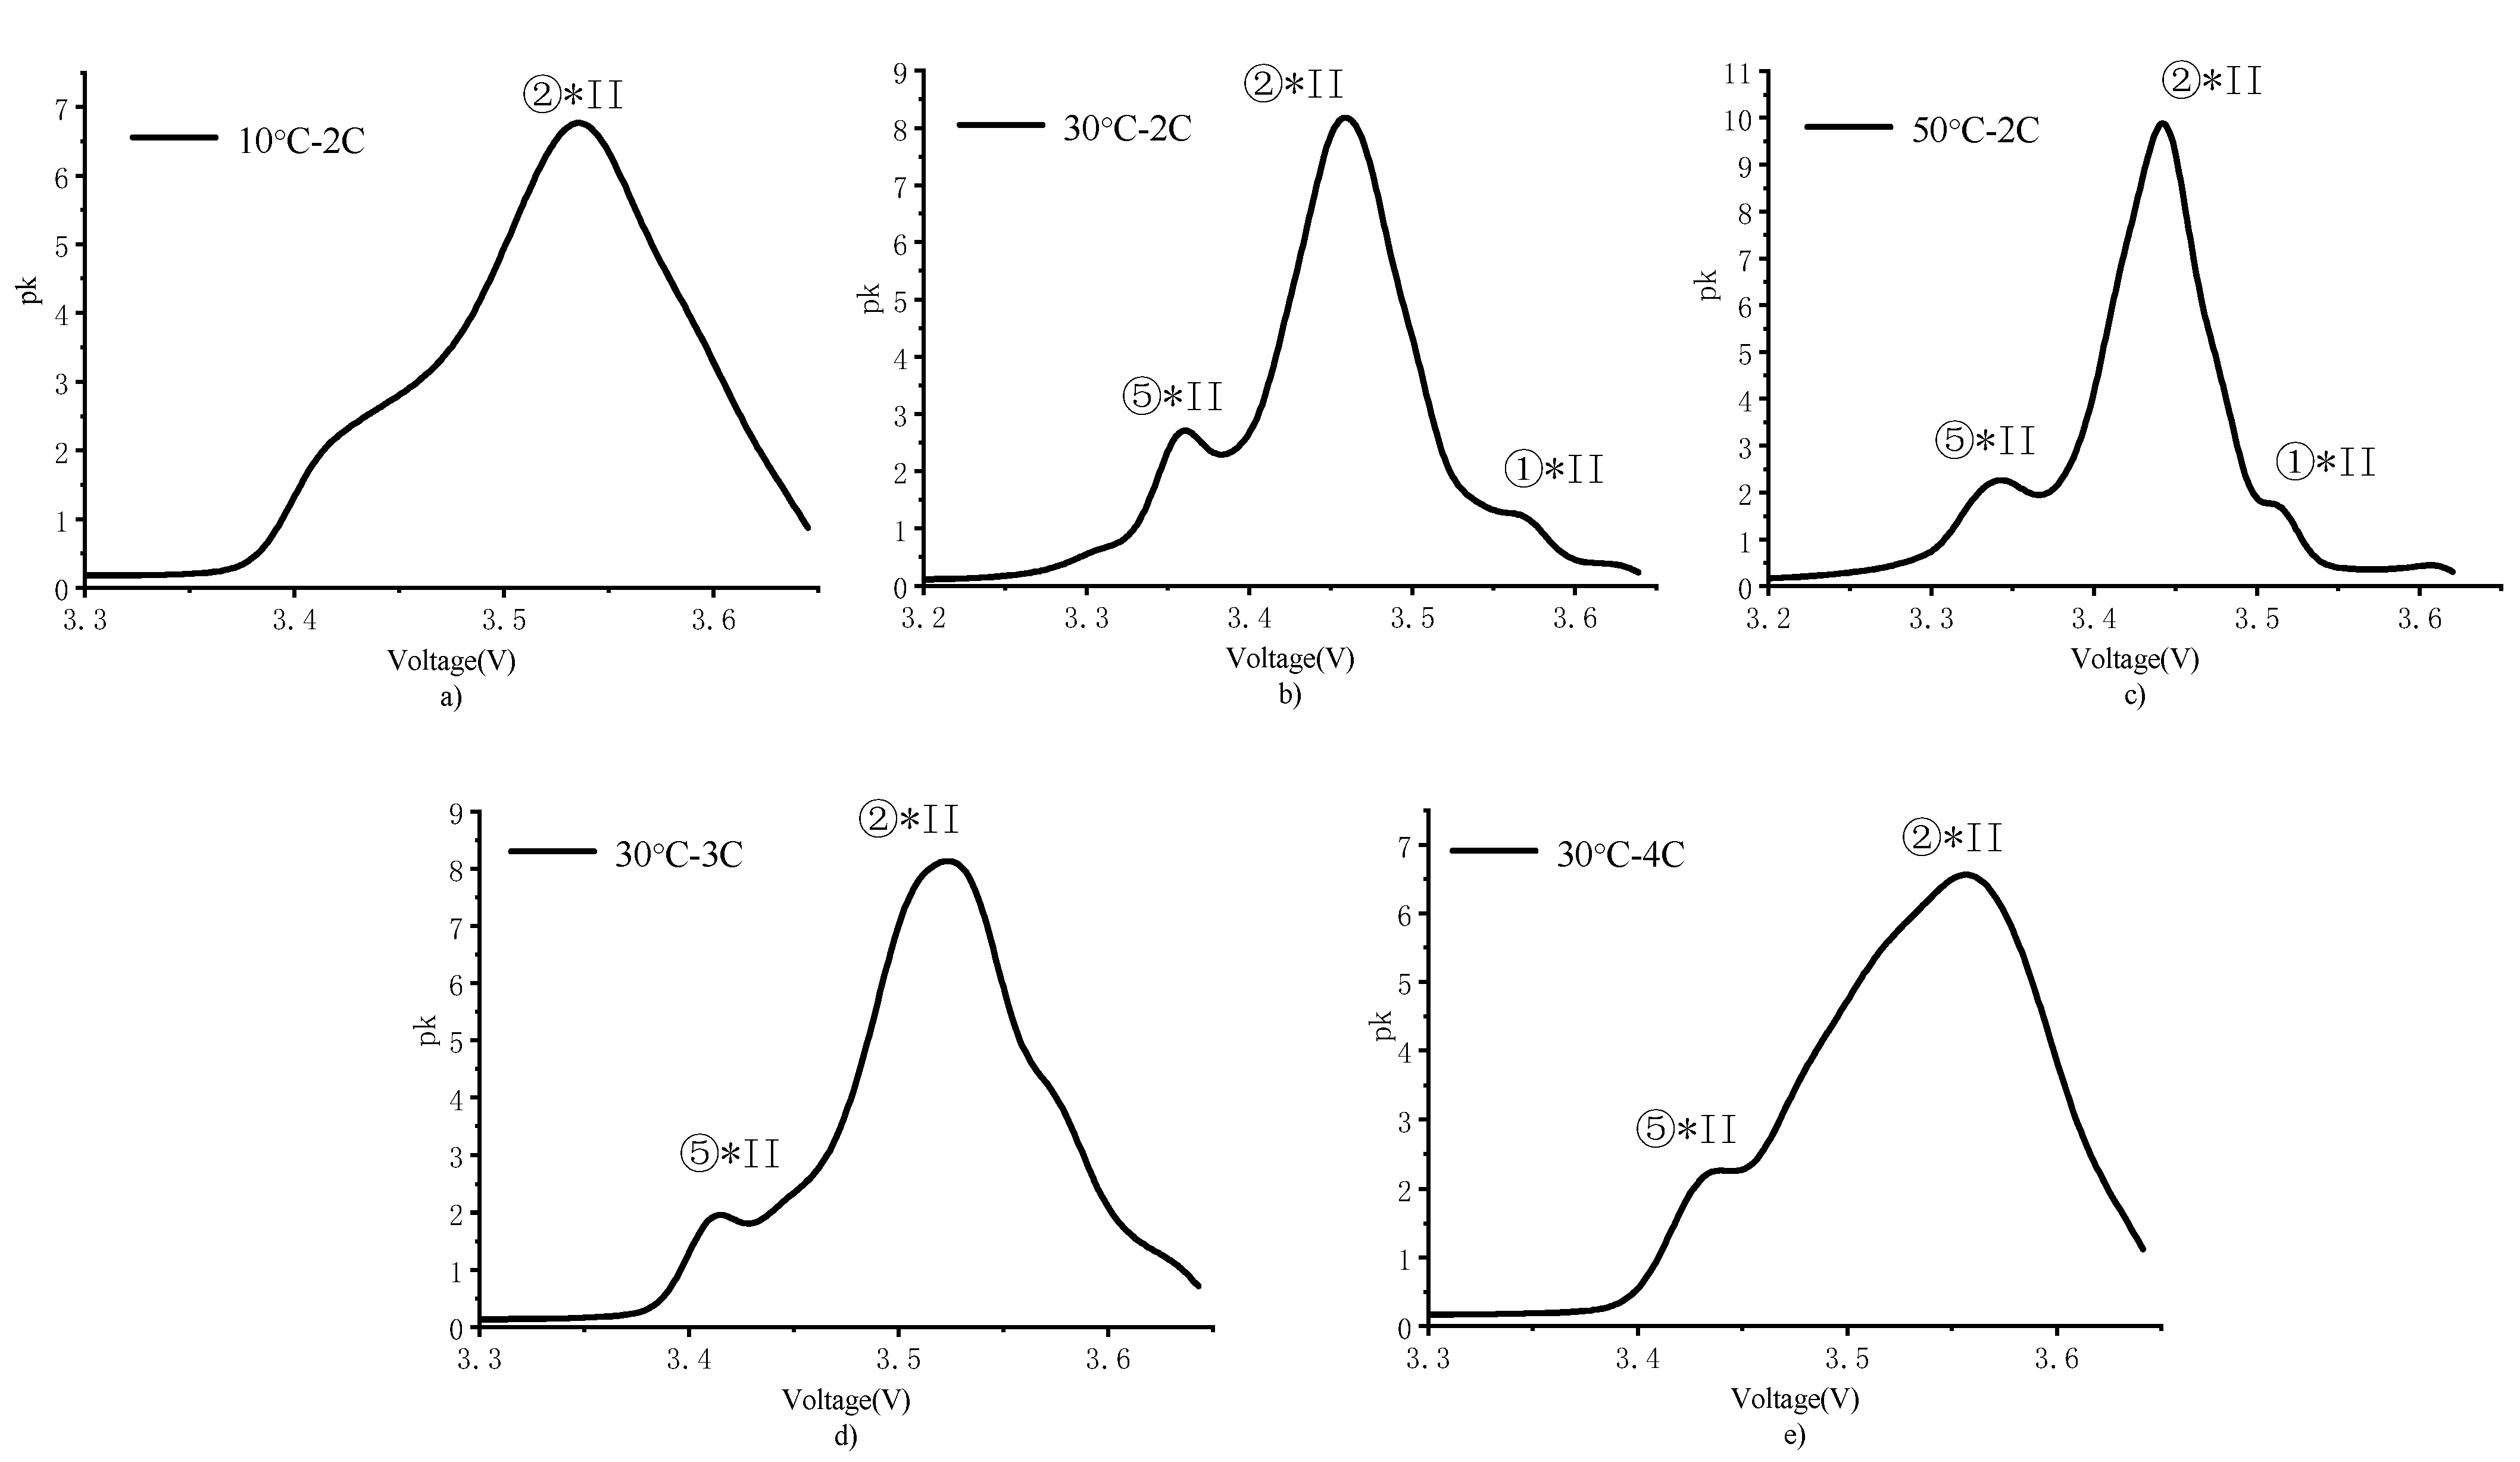
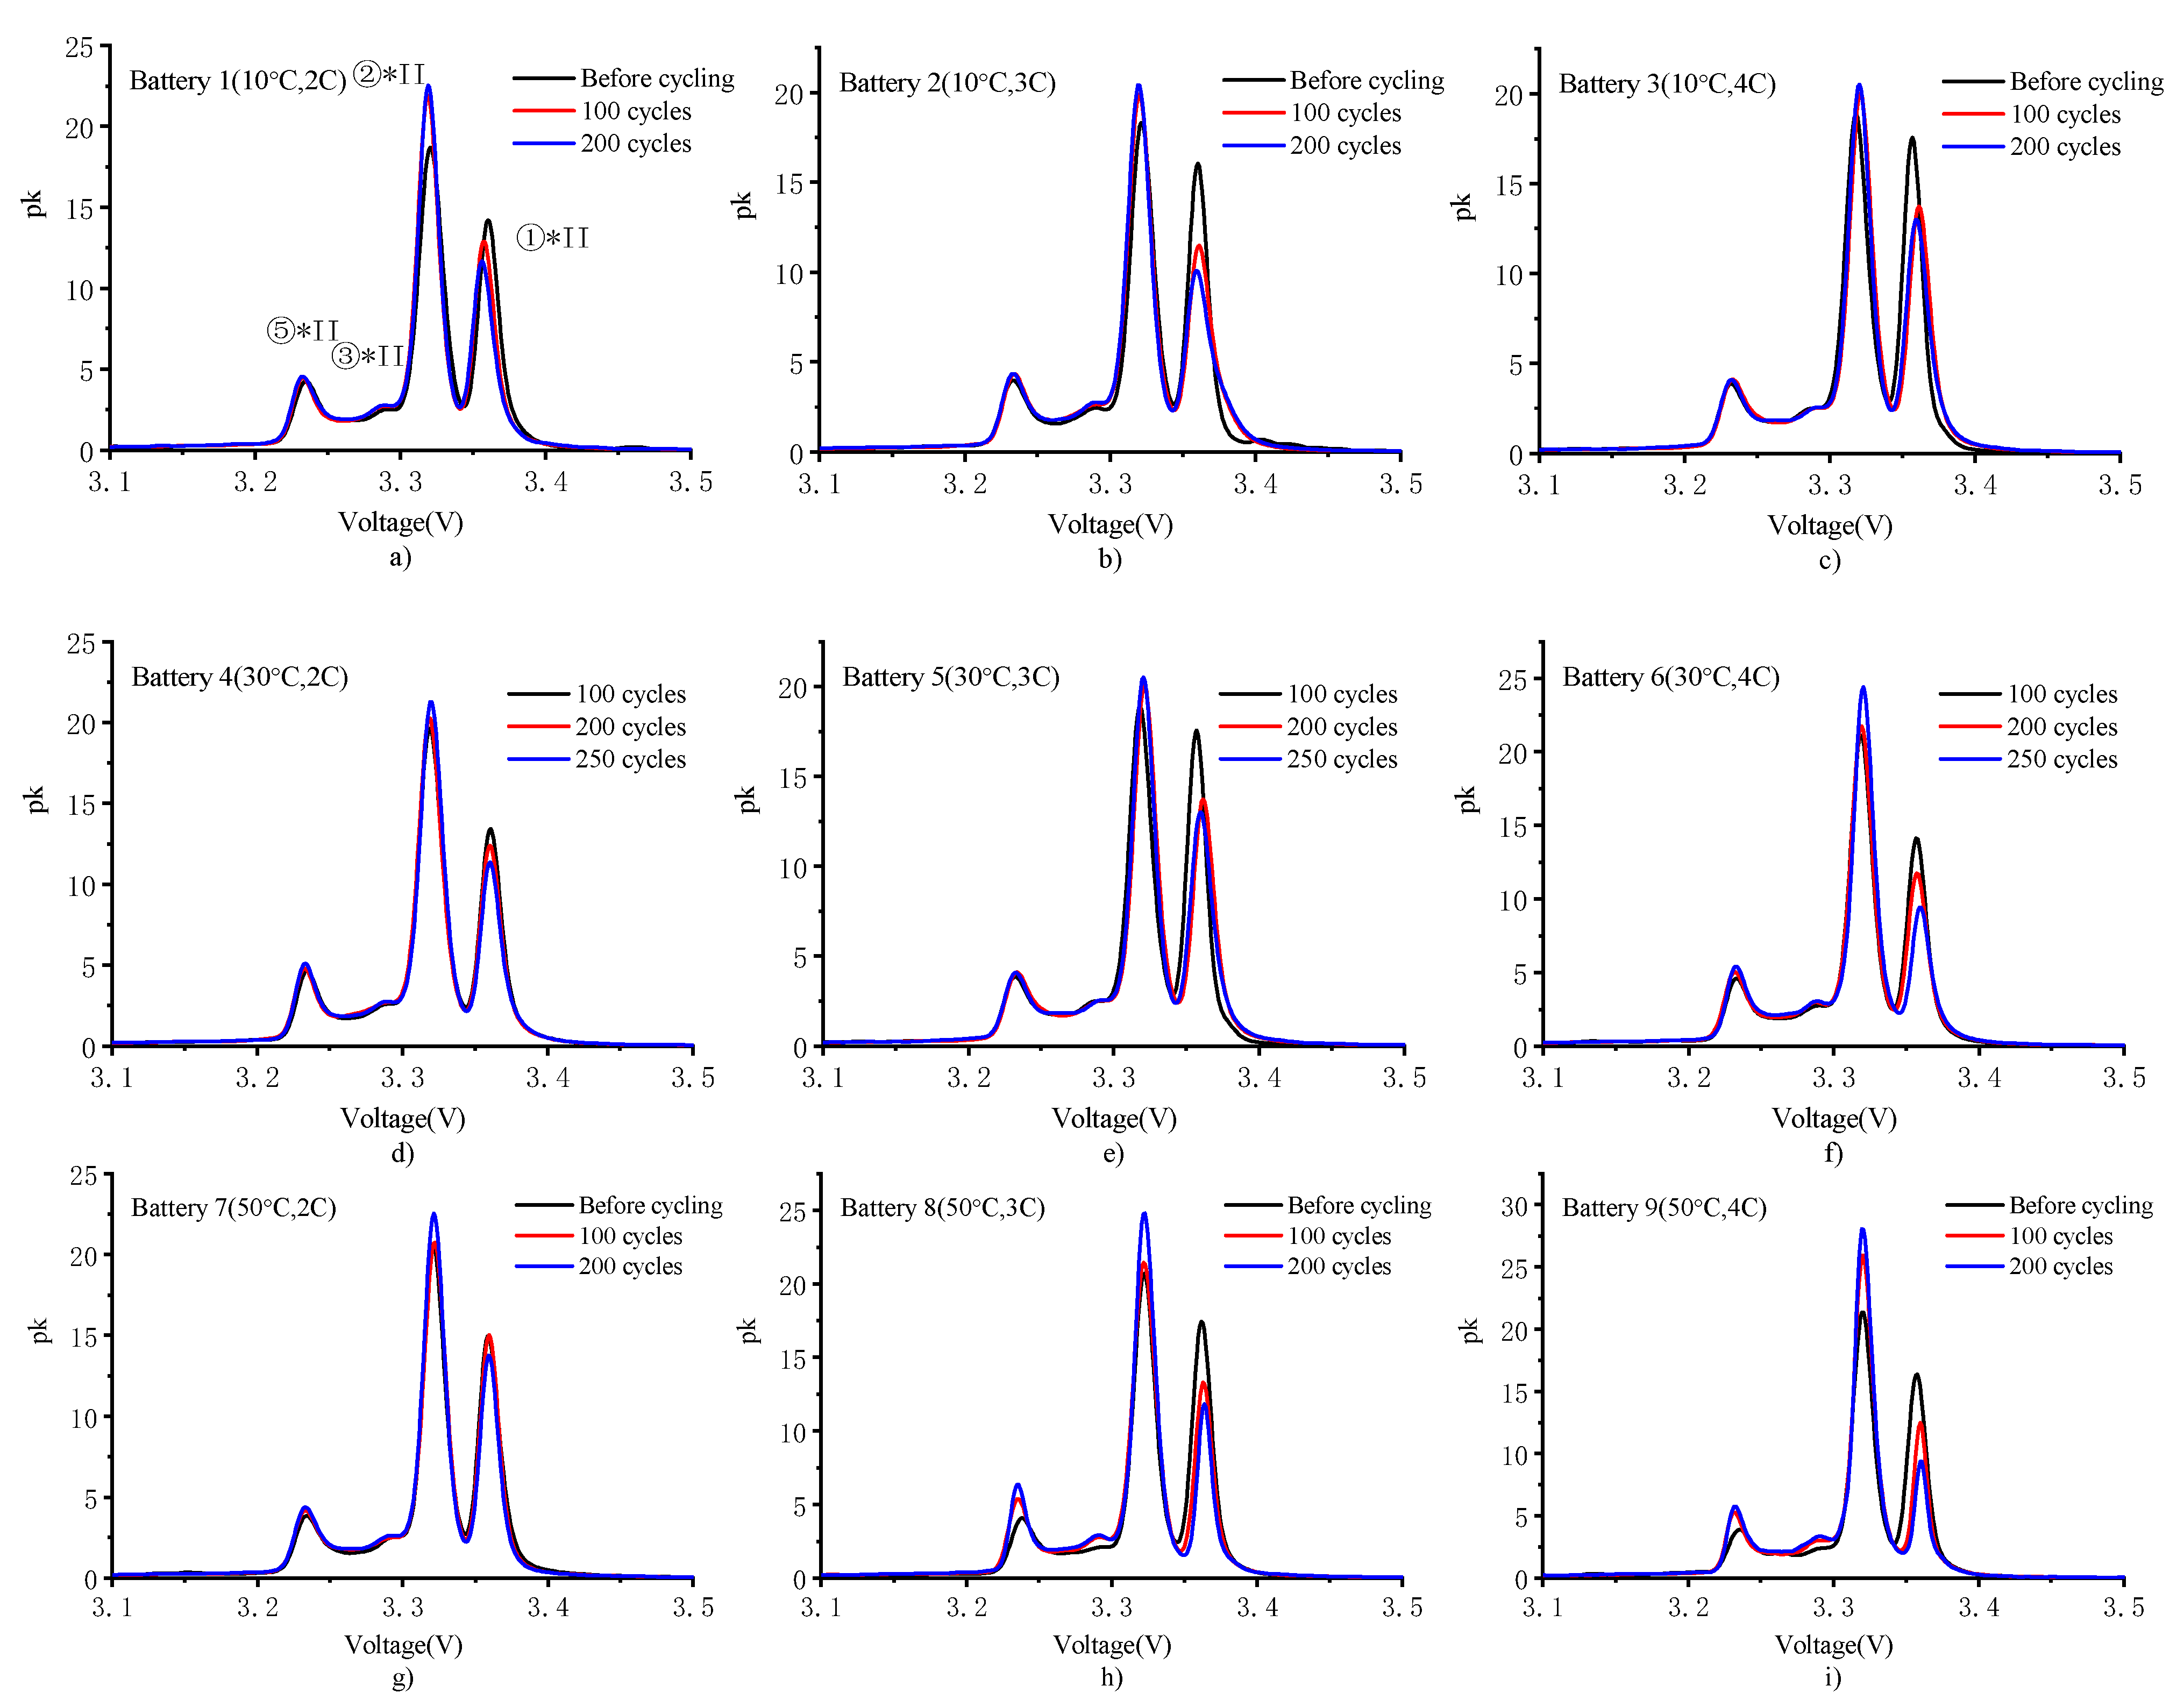
In addition to the available capacity, the battery impedance is another indicator of SOH [28]. The impedance is an important parameter that reflects the difficulty of lithium-ion transfer in the battery. The total impedance includes the DCIR and polarization impedance. The response generated by the current excitation from the DCIR is immediate, whereas the response to the polarization internal resistance is delayed; this is because the lithium-ion diffusion rate involved in the chemical reactions in the solid phase of the active electrode material is less than the chemical reaction rate [29,30]. The DCIR is related to the temperature, current ratio, SOC, and SOH [31]. Figure 6 shows the DCIR from 0% SOC to 100% SOC when the battery was charged at 1 C at 25 °C. The tested battery was fresh prior to cycling. The DCIR was significantly higher at 0% SOC and 100% SOC than at other values and had a small gap for a wide SOC range (10–90%). To facilitate comparison, Figure 7 shows the DCIR of each battery at 50% SOC as the number of cycles was increased. For all the batteries, the change in the DCIR with the number of cycles can be divided into two stages: an initial decrease, followed by an increase. Most inflection points occurred within the range of 100–200 cycles.

4.3. PDF Analysis

The PDF analysis method introduced in previous studies [32,33] was employed to evaluate the phase change reaction during the charge–discharge cycle test. The probability density, pk, can be used to reflect the change in capacity. Figure 8 shows magnified views of the PDF peaks at different temperatures and charging rates. The experimental results showed that the temperature and charging rate significantly influenced the integrity of the PDF peak of the battery. As shown in Figure 8b,c, at a charging rate of 2 C and temperatures of 30 and 50 °C, the ①*II, ②*II, and ⑤*II peaks were observed. Among them, “II” represents the 1-C peak corresponding to the pseudo-binary phase–transition phase of the positive pole, which was represented by ①–⑤ in the order of high to low voltages. The ①*II peak was extremely small because of the high rate and partial overlapping with the ②*II peak. Compared with their positions at 30 °C (i.e., close to room temperature), the peaks slightly shifted to the right at a high temperature of 50 °C. This is because high temperatures improve the conductivity of the electrolyte and transport of lithium ions. The ion transmission between the electrodes and electrolyte accelerated, and the degree of polarization reduced, which advanced the phase change reaction. As shown in Figure 8a, at 2 C and 10 °C, the ①*II and ⑤*II peaks were absorbed by the ②*II peak, and the entire PDF curve shifted to the right. This indicated that the ion transport and chemical reaction were hindered, which reflected the poor performance of LiFePO4 batteries at low temperatures. At 30 °C, increasing the charging rate also caused the ①*II and ⑤*II peaks to converge toward the ②*II peak. As shown in Figure 8d,e, the PDF curves for 3 and 4 C showed that the ①*II peak was absorbed before the ⑤*II peak, indicating that the primary effect of the polarization generated by high charging rates was the corresponding reaction of ① (i.e., the conversion of LiC12 into LiC6). This reaction is kinetically slower than other negative-electrode reactions. The polarization caused the measured electrode surface potential to be out of phase with the reaction of the internal material. When the charging cutoff voltage was reached, the reaction potential inside the material was insufficient to induce a reaction. Therefore, the partial recombination of the ①*II and ②*II peaks resulted in an extremely small shift.

5. Rules for Capacity Deterioration in Different Aging Paths

The PDF curves were examined at a fine resolution to clarify the aging mechanism of lithium-ion batteries. The PDF curve considers the effects of the charging rate and temperature on the battery-charging process and reflects the aging of the battery in terms of capacity retention [34]. The small-rate test was performed at room temperature, which considerably reduced the polarization effect of the temperature and charging rate conditions on the battery. Thus, the aging mechanism of the battery could be identified.
The peak position reflects the degree of the response delay of the battery’s internal phase transition to the voltage, and the peak size reflects the capacity ratio of the phase balance during the charging process. Figure 9 shows the change in the PDF curve of a battery at a small charging rate. As shown in Figure 9a–i, as the number of cycles increased, there was no significant change in the position and shape of each peak, and each phase change reaction occurred as usual. This indicated that the chemical properties of the electrodes did not change. The heights of the three peaks corresponded to the degree of progress in the phase transition, which comprehensively reflected the phase change reactions occurring at the positive and negative poles. The value of the ①*II peak reduced. This may have been caused by the continuous expansion and contraction of the carbon anode during the charge–discharge cycle, which led to structural damage and reduced the intercalation of lithium. Further thickening of the solid electrolyte interface (SEI) layer increased the internal resistance of the battery. As previously mentioned, the change in impedance caused the DCIR to initially decrease, then increase, but the resistance remained below the initial value after 200 cycles. Therefore, the blocking effect of the SEI layer on lithium ions was not the main reason for the reduction of the ①*II peak. The ②*II and ⑤*II peaks increased because the repeated insertion and extraction of lithium ions during the charge–discharge cycle caused the electrochemical grinding of the active material of the negative electrode. This increased the contact area with the lithium ions and promoted phase-transition reactions corresponding to the two peaks [35]. However, the shape and number of peaks did not change, indicating that the carbon anode structure was not damaged. Thus, the reduction of the ①*II peak was caused by the loss of active lithium ions.

6. Conclusions

Here, three ambient temperatures and three charging rates were used to establish orthogonal aging paths and determine the capacity-deterioration mechanism of LiFePO4 batteries. The battery-aging process was analyzed with regard to the battery parameters and aging characteristics. The main conclusions are as follows:
(1)
Charge–discharge cycle conditions away from room temperature accelerate the capacity deterioration of the battery. The analysis of the impedance parameters showed that this type of battery breaks and rebuilds the SEI layer at the negative electrode at the beginning of the cycle. This causes the impedance to temporarily decrease, then rise. The change in charge transfer impedance indicates that the cathode material maintains a relatively stable performance for charge–discharge cycles at high temperatures.
(2)
The PDF analysis results indicated that the main aging mechanism for high charging rates was not the increase in impedance but the loss of active lithium in the battery. High temperature is beneficial to reduce polarization but aggravates side reactions. The increase in the number of cycles delays the phase change reaction to voltage response, while the phase change reaction involves the acceleration of capacity attenuation.
(3)
Compared with the traditional ICA method, the PDF analysis method is less influenced by noise, has no need for complex function fitting, does not result in the ∆V = 0 condition, requires minimal calculation, and uses data that are easy to acquire. However, it has a few limitations: there is a gap between the calculated and actual changes in capacity, and a lack of data on the charging and discharging process can cause drawbacks, such as peak distortion. This method is not recommended when high accuracy is required for the peak voltage or when the charging and discharging process is extremely short.
The aforementioned results indicated that the optimal charging strategy of lithium-ion batteries at high charging rates requires a comprehensive optimization of the charging rate and temperature in real time to mitigate capacity deterioration.
Although the attenuation mechanism of LiFePO4 power batteries in different aging paths has been comprehensively investigated in the present study, owing to the limitation of time and laboratory conditions, certain challenges require further study.
(1)
In terms of aging path design, there are many coupling effects of factors that need to be studied, such as different charging and discharging cycles under different SOCs, different charging modes, and calendar-aging modes (standing). Additional coupling factors should be considered in subsequent studies.
(2)
To verify the universality of the aging mechanism of LiFePO4 power batteries, more aging LiFePO4 power batteries should be investigated in subsequent studies.
(3)
In future studies, more electrochemical characterization methods should be attempted to elucidate the aging mechanism.

Author Contributions

Conceptualization, J.D. and W.W.; methodology, W.W.; software, Z.W.; validation, W.W.; formal analysis, F.H.; investigation, Z.W.; resources, X.W.; writing—original draft preparation, W.W.; writing—review and editing, J.D.; project administration, J.D. All authors have read and agreed to the published version of the manuscript.

Funding

This research was funded by Natural Science Foundation of Beijing, grant number 3192016.

Data Availability Statement

Not applicable.

Conflicts of Interest

The authors declare no conflict of interest.

References

  1. Wang, K.; Qiao, Y.; Xie, L.; Li, J.; Lu, Z.; Yang, H. A fuzzy hierarchical strategy for improving frequency regulation of battery energy storage system. J. Mod. Power Syst. Clean Energy 2021, 9, 689–698. [Google Scholar] [CrossRef]
  2. Zhang, C.; Liu, L.; Cheng, H.; Liu, D.; Zhang, J.; Li, G. Frequency-constrained Co-planning of Generation and Energy Storage with High-penetration Renewable Energy. J. Mod. Power Syst. Clean Energy 2021, 9, 760–775. [Google Scholar] [CrossRef]
  3. Martinez-Rico, J.; Zulueta, E.; de Argandoña, I.R.; Fernandez-Gamiz, U.; Armendia, M. Multi-objective optimization of production scheduling using particle swarm optimization algorithm for hybrid renewable power plants with battery energy storage system. J. Mod. Power Syst. Clean Energy 2020, 9, 285–294. [Google Scholar] [CrossRef]
  4. Aatif, S.; Yang, X.; Hu, H.; Maharjan, S.K.; He, Z. Integration of PV and battery storage for catenary voltage regulation and stray current mitigation in MVDC railways. J. Mod. Power Syst. Clean Energy 2020, 9, 585–594. [Google Scholar] [CrossRef]
  5. Teixeira, T.P.; Borges, C.L.T. Operation strategies for coordinating battery energy storage with wind power generation and their effects on system reliability. J. Mod. Power Syst. Clean Energy 2020, 9, 190–198. [Google Scholar] [CrossRef]
  6. Gomes, I.S.F.; Perez, Y.; Suomalainen, E. Coupling small battery and PV generation: A review. Renew. Sustain. Energy Rev. 2020, 126, 109835. [Google Scholar] [CrossRef]
  7. Pozzi, A.; Torchio, M.; Braatz, R.D.; Raimondo, D.M. Optimal charging of an electric vehicle battery pack: A real-time sensitivity-based model predictive control approach. J. Power Sources 2020, 461, 228133. [Google Scholar] [CrossRef]
  8. Sufyan, M.; Rahim, N.A.; Muhammad, M.A.; Tan, C.K.; Raihan, S.R.S.; Bakar, A.H.A. Charge coordination and battery lifecycle analysis of electric vehicles with V2G implementation. Electr. Power Syst. Res. 2020, 184, 106307. [Google Scholar] [CrossRef]
  9. Liu, T.; Yang, X.-G.; Ge, S.; Leng, Y.; Wang, C.-Y. Ultrafast charging of energy-dense lithium-ion batteries for urban air mobility. eTransportation 2021, 7, 100103. [Google Scholar] [CrossRef]
  10. Wang, K.; Wan, J.J.; Xiang, Y.X.; Zhu, J.P.; Leng, Q.Y.; Wang, M.; Xu, L.M.; Yang, Y. Recent advances and historical developments of high voltage lithium cobalt oxide materials for rechargeable Li-ion battery. J. Power Sources 2020, 460, 228062. [Google Scholar] [CrossRef]
  11. Zhang, X.; Gao, Y.Z.; Guo, B.J.; Zhu, C.; Zhou, X.; Wang, L.; Cao, J. A novel quantitative electrochemical aging model considering side reactions for lithium-ion battery. Electrochim. Acta 2020, 343, 136070. [Google Scholar] [CrossRef]
  12. O’Kan, S.E.J.; Campbell, I.D.; Marzook, M.W.J.; Offer, G.J.; Marinescu, M. Physical origin of the differential voltage minimum associated with lithium plating in Li-ion battery. J. Electrochem. Soc. 2020, 167, 090540. [Google Scholar] [CrossRef]
  13. Li, S.T.; Meng, Q.H.; Fan, M.S.; Yang, K.; Tian, G.Y. Analysis for performance degradation mechanisms of the retired LiFePO4/graphite power cells. Ionics 2020, 26, 4443–4454. [Google Scholar] [CrossRef]
  14. Xie, X.Y.; Wang, L.; Feng, X.N.; Ren, D.S.; He, X.M. High-temperature aging behavior of commercial Li-ion battery. Int. J. Electrochem. Sci. 2020, 15, 4586–4591. [Google Scholar] [CrossRef]
  15. Zilberman, I.; Ludwig, S.; Schiller, M.; Jossen, A. Online aging determination in lithium-ion battery module with forced temperature gradient. J. Energy Storage 2020, 28, 101170. [Google Scholar] [CrossRef]
  16. Naumann, M.; Spingler, F.B.; Jossen, A. Analysis and modeling of cycle aging of a commercial LiFePO4/graphite cell. J. Power Sources 2020, 451, 227666. [Google Scholar] [CrossRef]
  17. Zhu, J.G.; Darma MS, D.; Knapp, M.; Soresen, D.R.; Heere, M.; Fang, Q.H.; Wang, X.Y.; Dai, H.F.; Mereacre, L.; Senyshyn, A. Investigation of lithium-ion battery degradation mechanisms by combining differential voltage analysis and alternating current impedance. J. Power Sources 2020, 448, 227575. [Google Scholar] [CrossRef]
  18. Heins, T.P.; Schluter, N.; Ernst, S.T.; Schroder, U. On the interpretation of impedance spectra of large-format lithium-ion battery and its application in aging studies. Energy Technol. 2020, 8, 1900279. [Google Scholar] [CrossRef]
  19. Rumberg, B.; Epding, B.; Stradtmann, I.; Kwade, A. Identification of Li ion battery cell aging mechanisms by half-cell and full-cell open-circuit-voltage characteristic analysis. J. Energy Storage 2019, 25, 100890. [Google Scholar] [CrossRef]
  20. Fath, J.P.; Dragicevic, D.; Bittel, L.; Nuhic, A.; Sieg, J.; Hahn, S.; Alsheimer, L.; Spier, B.; Wetzel, T. Quantification of aging mechanisms and inhomogeneity in cycled lithium-ion cells by differential voltage anlysis. J. Energy Storage 2019, 25, 100813. [Google Scholar] [CrossRef]
  21. López-Ibarra, J.A.; Goitia-Zabaleta, N.; Herrera, V.I.; Gaztanaga, H.; Camblong, H. Battery aging conscious intelligent energy management strategy and sensitivity analysis of the critical factors for plug-in hybrid electric buses. eTransportation 2020, 5, 100061. [Google Scholar] [CrossRef]
  22. Yang, H.; Wang, P.; An, Y.; Shi, C.; Sun, X.; Wang, K.; Zhang, X.; Wei, T.; Ma, Y. Remaining useful life prediction based on denoising technique and deep neural network for lithium-ion capacitors. eTransportation 2020, 5, 100078. [Google Scholar] [CrossRef]
  23. Feng, X.; Merla, Y.; Weng, C.; Ouyang, M.; He, X.; Liaw, B.Y.; Santhanagopalan, S.; Li, X.; Liu, P.; Lu, L.; et al. A reliable approach of differentiating discrete sampled-data for battery diagnosis. eTransportation 2020, 3, 100051. [Google Scholar] [CrossRef]
  24. Yu, W.; Guo, Y.; Shang, Z.; Zhang, Y.; Xu, S. A review on comprehensive recycling of spent power lithium-ion battery in China. eTransportation 2022, 100155. [Google Scholar] [CrossRef]
  25. Lu, Y.; Li, K.; Han, X.; Feng, X.; Chu, Z.; Lu, L.; Huang, P.; Zhang, Z.; Zhang, Y.; Yin, F.; et al. A method of cell-to-cell variation evaluation for battery packs in electric vehicles with charging cloud data. eTransportation 2020, 6, 100077. [Google Scholar] [CrossRef]
  26. Zhu, J.; Mathews, I.; Ren, D.; Li, W.; Cogswell, D.A.; Xu, B.; Sedlatschek, T.; Kantareddy, S.N.R.; Yi, M.; Gao, T.; et al. End-of-life or second-life options for retired electric vehicle batteries. Cell Rep. Phys. Sci. 2021, 2, 100537. [Google Scholar] [CrossRef]
  27. Chung, H.C. Charge and discharge profiles of repurposed LiFePO4 batteries based on the UL 1974 standard. Sci. Data 2021, 8, 1–12. [Google Scholar] [CrossRef]
  28. Wang, X.; Wei, X.; Zhu, J.; Dai, H.; Zheng, Y.; Xu, X.; Chen, Q. A review of modeling, acquisition, and application of lithium-ion battery impedance for onboard battery management. eTransportation 2021, 7, 100093. [Google Scholar] [CrossRef]
  29. Zhang, X.; Wang, B.; Zhao, S.; Li, H.; Yu, H. Oxygen anionic redox activated high-energy cathodes: Status and prospects. eTransportation 2021, 8, 100118. [Google Scholar] [CrossRef]
  30. Chen, Y.; Xia, D. Systematic density functional theory investigations on cubic lithium-rich iron-based Li2FeO3: A multiple electrons cationic and anionic redox cathode material. eTransportation 2021, 10, 100141. [Google Scholar] [CrossRef]
  31. Yang, X.; Doyle-Davis, K.; Gao, X.; Sun, X. Recent progress and perspectives on designing high-performance thick electrodes for all-solid-state lithium batteries. eTransportation 2021, 11, 100152. [Google Scholar] [CrossRef]
  32. Xiang, K.; Xing, W.T.; Ravnsbaek, D.B.; Hong, L.; Tang, M.; Li, Z.; Wiaderek, K.M.; Borkiewicz, O.J.; Chapman, K.W.; Chupas, P.J. Accommodating high transformation strains in battery electrodes via the formation of nanoscale intermediate phases: Operando investigation of olivine NaFePO4. Nano Lett. 2017, 17, 1696–1702. [Google Scholar] [CrossRef]
  33. Dambournet, D.; Chapman, K.W.; Duttine, M.; Borkiewicz, O.; Chupas, P.J.; Groult, H. Lithium insertion mechanism in iron-based oxyfluorides with anionic vacancies probed by PDF analysis. Chemistryopen 2015, 4, 443–447. [Google Scholar] [CrossRef]
  34. Su, L.; Wu, M.; Li, Z.; Zhang, J. Cycle life prediction of lithium-ion batteries based on data-driven methods. eTransportation 2021, 10, 100137. [Google Scholar] [CrossRef]
  35. Morales, J.; Trócoli, R.; Franger, S.; Santos-Pena, J. Cycling-induced stress in lithium ion negative electrodes: LiAl/LiFePO4 and Li4Ti5O12/LiFePO4 cells. Electrochim. Acta 2010, 55, 3075–3082. [Google Scholar] [CrossRef]
Figure 1. Flowchart of the charge–discharge cycle test with different aging paths.
Batteries 09 00003 g001
Figure 2. Flowchart of the basic performance tests for the battery.
Batteries 09 00003 g002
Figure 3. Voltage–current curve during the basic performance tests.
Batteries 09 00003 g003
Figure 4. Experimental platform for evaluating the battery-aging characteristics.
Batteries 09 00003 g004
Figure 5. Capacity deterioration of the battery in different aging paths.
Batteries 09 00003 g005
Figure 6. Changes in the DCIR with a full SOC.
Batteries 09 00003 g006
Figure 7. Changes in the DCIR with different aging paths.
Batteries 09 00003 g007
Figure 8. PDF curves at different temperatures and charging rates. (a) PDF curves at 10 °C and 2C charging rate; (b) PDF curves at 30 °C and 2C charging rate; (c) PDF curves at 50 °C and 2C charging rate; (d) PDF curves at 30 °C and 3C charging rate; (e) PDF curves at 30 °C and 4C charging rate.
Batteries 09 00003 g008
Figure 9. Changes in the PDF curves. (a) Change in PDF curve during cycle at 10 °C and 2C charge rates; (b) Change in PDF curve during cycle at 10 °C and 3C charge rates; (c) Change in PDF curve during cycle at 10 °C and 4C charge rates; (d) Change in PDF curve during cycle at 30 °C and 2C charge rates; (e) Change in PDF curve during cycle at 30 °C and 3C charge rates; (f) Change in PDF curve during cycle at 30 °C and 4C charge rates; (g) Change in PDF curve during cycle at 50 °C and 2C charge rates; (h) Change in PDF curve during cycle at 50 °C and 3C charge rates; (i) Change in PDF curve during cycle at 50 °C and 4C charge rates.
Batteries 09 00003 g009
Table 1. Aging paths of the battery.
2 C3 C4 C
10 °CL11L21L31
30 °CL12L22L32
50 °CL13L23L33
Table 2. Battery parameters in the experiment.
Parameters (Unit)Numerical Values
Working voltage (V)3.2
Rated capacity (Ah)5.0
Charging cutoff voltage (V)3.65
Discharging cutoff voltage (V)2.5
Maximum constant charging current (A)5
Maximum constant discharging current (A)12.5
Weight (g)145
Height (mm)69.8 ± 0.2
Diameter (mm)32.2 ± 0.5
Table 3. Battery numbers and experimental conditions.
PathsL11L21L31L12L22L32L13L23L33
Battery numbers123456789
Disclaimer/Publisher’s Note: The statements, opinions and data contained in all publications are solely those of the individual author(s) and contributor(s) and not of MDPI and/or the editor(s). MDPI and/or the editor(s) disclaim responsibility for any injury to people or property resulting from any ideas, methods, instructions or products referred to in the content.

