Article

A Novel Evaluation Criterion for the Rapid Estimation of the Overcharge and Deep Discharge of Lithium-Ion Batteries Using Differential Capacity

by
Peter Kurzweil
1,*,
Bernhard Frenzel
1 and
Wolfgang Scheuerpflug
2
1
Electrochemistry Laboratory, University of Applied Sciences (OTH), Kaiser-Wilhelm-Ring 23, 92224 Amberg, Germany
2
Diehl Aerospace GmbH, Donaustraße 120, 90451 Nürnberg, Germany
*
Author to whom correspondence should be addressed.
Batteries 2022, 8(8), 86; https://doi.org/10.3390/batteries8080086
Submission received: 14 June 2022 / Revised: 2 August 2022 / Accepted: 5 August 2022 / Published: 9 August 2022

Abstract

:
Differential capacity dQ/dU (capacitance) can be used for the instant diagnosis of battery performance in common constant current applications. A novel criterion allows state-of-charge (SOC) and state-of-health (SOH) monitoring of lithium-ion batteries during cycling. Peak values indicate impeding overcharge or deep discharge, while dSOC/dU = dU/dSOC = 1 is close to “full charge” or “empty” and can be used as a marker for SOC = 1 (and SOC = 0) at the instantaneous SOH of the aging battery. Instructions for simple state-of-charge control and fault diagnosis are given.

1. Introduction

For the safe operation of battery systems in stationary and mobile applications, the reliable indication of the correct state-of-charge (SOC) and state-of-health (SOH) [1] is a growing task and challenge for an efficient battery management system (BMS).
The current state-of-the-art in metrology [2,3,4] does not provide a universal and rapid method for the diagnosis of a lithium-ion battery without carefully examining the degradation of hundreds of full charge/discharge cycles. The monitoring of batteries by Ampere-hour counting over a few cycles has been used as a quality assurance tool or lithium-ion cells destined for long lifetime applications such as in electric vehicles or aircraft applications.
However, there is no simple and quick method to determine the actual SOC regardless of the age of the battery. Apart from accounting for amp-hours and nominal voltages, it is fundamentally unclear when a battery is sufficiently full during charging without going into overcharge, and when exhaustion is imminent during discharging. Various internal and external faults can occur during the battery operation, leading to performance loss and thermal runaway [5].

1.1. Incremental Data Analysis

Originally, “differential voltage analysis” (DVA) was proposed by Bloom et al. [6], who observed the change of −Q0 ⋅ dU/dQ versus battery capacity Q to gain insight into the aging processes of lithium-ion batteries during cycling.
The term “differential capacity analysis” appeared around the year 2000 (for history see [7,8]) for the first derivative of the galvanostatic curve, U(Q). A series of dQ/dU peaks (as a function of electrode potential or cell voltage U) corresponds to the potential plateaus (at constant voltage).
“Incremental capacity analysis” (ICA) was described by Dubarry et al. [9] and Dahn et al. [10] who considered the reciprocal quantity dQ/dU.
“Differential capacity analysis” [11] using high precision constant current chronopotentiometry and coulometry was employed for a detailed understanding of the aging processes and capacity degradation of lithium-ion batteries. Using the potential-capacity data of the positive and negative electrodes of fresh commercial cells, the differential capacity was calculated as a reference for a theoretical cell. Full LiMn2O4/graphite cells could be explained by mere relative shifts of the positive and negative potential-capacity curves.
“Delta differential capacity analysis” (Smith et al. [12]) was introduced to study the degradation of lithium-ion cells. By the help of constant-current chronopotentiometry, voltage versus charge data were collected as cells were charged and discharged in subsequent cycles. These U(Q) values were then differentiated, using finite differences, to create differential capacity, dQ/dU, for a given measured cycle. For comparison of new and aged batteries, “Delta differential capacity”, the difference Δ(dQ/dU) between the differential capacities of the nth and mth cycle was calculated. ΔdQ/dU should be zero for a perfect battery cell that does not degrade from cycle to cycle.
Both ICA and DVA [13,14,15] are based on the cell terminal voltage. However, the voltage axis may be replaced by the state-of-charge [16]. Differential capacity dQ/dU from charge–discharge curves and pseudo-capacitance [17] at low frequencies from impedance spectra at the same voltage are equivalent [18].
For SOH estimation, the location interval between two inflection points of the differential voltage curve can be evaluated and compared to a new battery [19,20]; the distance between the inflection points is proportional to battery capacity. In recent years, differential voltage analysis has helped to obtain insights into the degradation of lithium-ion cells by capacity loss and resistance increase. An inhomogeneous lithium distribution leads to a flattening of the dU/dQ signals [21]. Metal ions dissolute, migrate and deposit on the counter electrode [22].
Unfortunately, differential curves are very noisy, so that previous smoothing of the data is required. Simple data reduction, moving averages, and FFT smoothing [23] have been described. Fitting of the measured voltage profile with a number of Gaussian curves [24] has been proposed for differential capacity and differential voltage curves of high quality.

1.2. Scope of This Study

In aviation, the fast charging of a battery is allowed only in case of emergency. The state-of-charge (SOC) drops due to self-discharge after storing for a long time without power supply. Capacity determination and the recharging of a 2-Ah battery using the constant current discharge method and other diagnosis tools take roughly 1.5 to 2 h according to the regulations in air traffic.
Based on our previous work [25], we measured hundreds of lithium-ion batteries with different cell chemistries and wondered what might be a simple criterion for “full” and “empty” without performing a full charge–discharge cycle each time and risking overcharge or deep discharge of the cell. By the help of differential capacity, we finally found a diagnostic method that did not waste a complete charge–discharge cycle and a subsequent recharge to determine just the available charge, i.e., SOC = 1, while the state-of-health of the battery continuously deteriorates. Differential capacity dQ/dU is the first derivative of the charge–discharge curve Q(U).
In this study, the performance of a novel evaluation criterion for constant current charge–discharge curves is demonstrated based on numerous examples and different cell chemistries. The idea is to characterize the state-of-charge of any lithium-ion battery, whose history and state-of-health is not known, as “empty” or “full” using a simple calculation rule. Ideally, an automated process would determine whether the battery is approaching overcharge or deep discharge based on the small voltage and charge changes during the charging or discharging process, without knowing the actual charge (capacity Q0 of the last charge).

2. Materials and Methods

New and old lithium-ion batteries of different manufactures and cell chemistries were charged and discharged at a constant current between the upper and lower cutoff voltage. The batteries investigated in the course of long-time tests under real conditions as in the airplane are compiled in Table 1.
The proposed calculation methods work with conventional laboratory equipment and do not require devices from specific manufacturers. In this study, a DC power source (Elektro-Automatik EA-PS 2342-10B, Viersen, Germany), an electronic load (ET Systems ELP/DCM 9712C, Altlußheim, Germany), and a data logger (Agilent 34972A, Meilhaus Electronic, Alling. Germany) were combined in a climatic chamber (Vötsch VT7021, Weiss Technik AG, Altendorf, Switzerland). At a constant ambient temperature, the battery operation between overcharge and deep discharge was considered at slow charge–discharge rates (below 1C). Electric charge (capacity) was determined by coulomb-counting, although this is not strictly required for the proposed method. Measured data can be evaluated using EXCEL, MATLAB or similar software.

2.1. Differential Capacity and Resistance

To avoid numerical problems, differential capacity C = dQ/dU (capacitance [17]) is best calculated from charge–discharge curves using the reciprocal of the differential voltage. According to Equation (1), at constant charge and discharge currents, small voltage differences ΔU in the time interval Δt do not cause “division by zero” errors.
C = d Q d U = d U d Q 1 = d R d t 1
The unit of dQ/dU is Farad: F = C/V = As V−1. Therefore, the symbol C is used for an electrical capacitance, which must not be confused with the electrical charge (capacity Q).
Capacitance C (slope of the Q(U) curve) is small and resistance R (slope of the U(Q) curve) is great when the battery is depleted or overcharged. Equation (2) qualitatively explains this relationship between capacitance and resistance as the state-of-charge changes.
S OC U = d Q / Q 0 d U = d C U / Q 0 d U = C Q 0 = I Q 0 d U d t 1 R   I
where Q0 is the maximum capacity, i.e., the actual available (discharged) electrical charge of the battery after the previous full charge. According to Ohm’s law, the voltage drop across the battery cell correlates with the internal resistance R = dU/dI. At a constant current, dQ = 0, “DV” is insensitive to resistance changes. Nevertheless, dQ/dU implicitly represents the change in internal conductance and is therefore a measure of aging.

2.2. The Intersection Method: A New Approch

The true state-of-charge SOC(t) = Q(t)/Q0 (related to the last full charge Q0) is not clearly a simple function of differential capacity. SOC detection using a linear function C(SOC) works best for flat U(Q) curves, which is true for LFP batteries. However, we are looking for a general empirical method suitable for SOC and SOH monitoring of all battery types.
Indeed, the peaks of differential capacity occur at “almost full” and “almost empty”. The novel criterion in Equation (3) could serve as an indication that the battery is virtually fully charged and imminent overcharging is likely. The same is valid for the empty battery short before an undesirable deep discharge.
d Q d U = d U d Q
The criterion also works with dimensionless quantities, if the state-of-charge (SOC) is used instead of the electric charge Q.
d S OC d U = d U d S OC 1
A descriptive interpretation of the criterion results from the intersection of a straight line (ascending curve dQ/dU, in short x) and a hyperbola (descending curve dU/dQ, in short 1/x). The equation x = 1/x has the solution x = ±1, where only +1 is physically meaningful. The differential capacity could also be approximated by x2 = (1/x)2 or in general xn = (1/x)n, which leads to the same solution, x = 1.
A more complicated approach employs the maximum curvature of the charge–discharge curve. The curvature K of a function y(x) is mathematically defined according to Equation (5) using the first and second derivatives (y′ and y″). However, it is difficult to determine K with noisy measurement data. The reciprocal of the curvature is the radius of curvature 1/K.
K = y x 1 + ( y ) 2 3 2
Electric charge Q(t) is calculated by integrating the current I(t) with respect to time t, for example using the trapezoid rule. It is advisable to smooth the charge–discharge curve before numerical derivation, for example by a moving average. Charging currents are positive (I > 0) and discharging currents have negative signs (I < 0). Details are given below.

2.3. Theoretical Background of the Intersection Criterion

Simplified, a lithium-ion battery can be modeled by an equivalent circuit consisting of a series combination of the electrolyte resistance R1 and the charge transfer impedance R2||C, which is a parallel combination of the charge transfer resistance R2 and the double layer capacitance C. For charging and discharging with a constant current, the state-of-charge as a function of battery voltage is shown in Figure 1.
Differential capacitance dQ/dU (incremental capacity “IC”) and the “incremental voltage” dU/dQ (differential voltage “DV”) intersect below the upper cut-off voltage at a point corresponding to the kink point of the charge curve near full charge. A similar intersection point is obtained for the discharge above the lower cut-off voltage. The distance between the intersection points defines the voltage window in which the battery can be operated without long-term damage.
The model does not consider phase changes that cause further steps in the charge–discharge curve. The idea of the intersection criterion Equation (3) is to detect phase changes in the charge–discharge curve at an early stage to prevent overcharging and deep discharging and to switch from a constant current to a constant voltage operation.
Differential capacity turns to a local maximum where the cell voltage reaches a constant value. dQ/dU peaks occur where the U(Q) curve is flat (or the Q(U) curve is steep), e.g., when the battery reaches a phase equilibrium (ΔU → 0).
Incremental voltage dU/dQ rises abruptly as soon a constant current can no longer be fed into or drawn from the cell (ΔI → 0). dU/dQ peaks show the steepest decent where phase changes, overcharge or deep discharge occur.
Peaks in the dQ/dU curve indicate coexisting equilibrium phases with different lithium concentrations (dU = 0), whereas dU/dQ peaks reflect phase transitions (Bloom [6]).

3. Results and Discussion

3.1. Battery Monitoring Using the Intersection Method
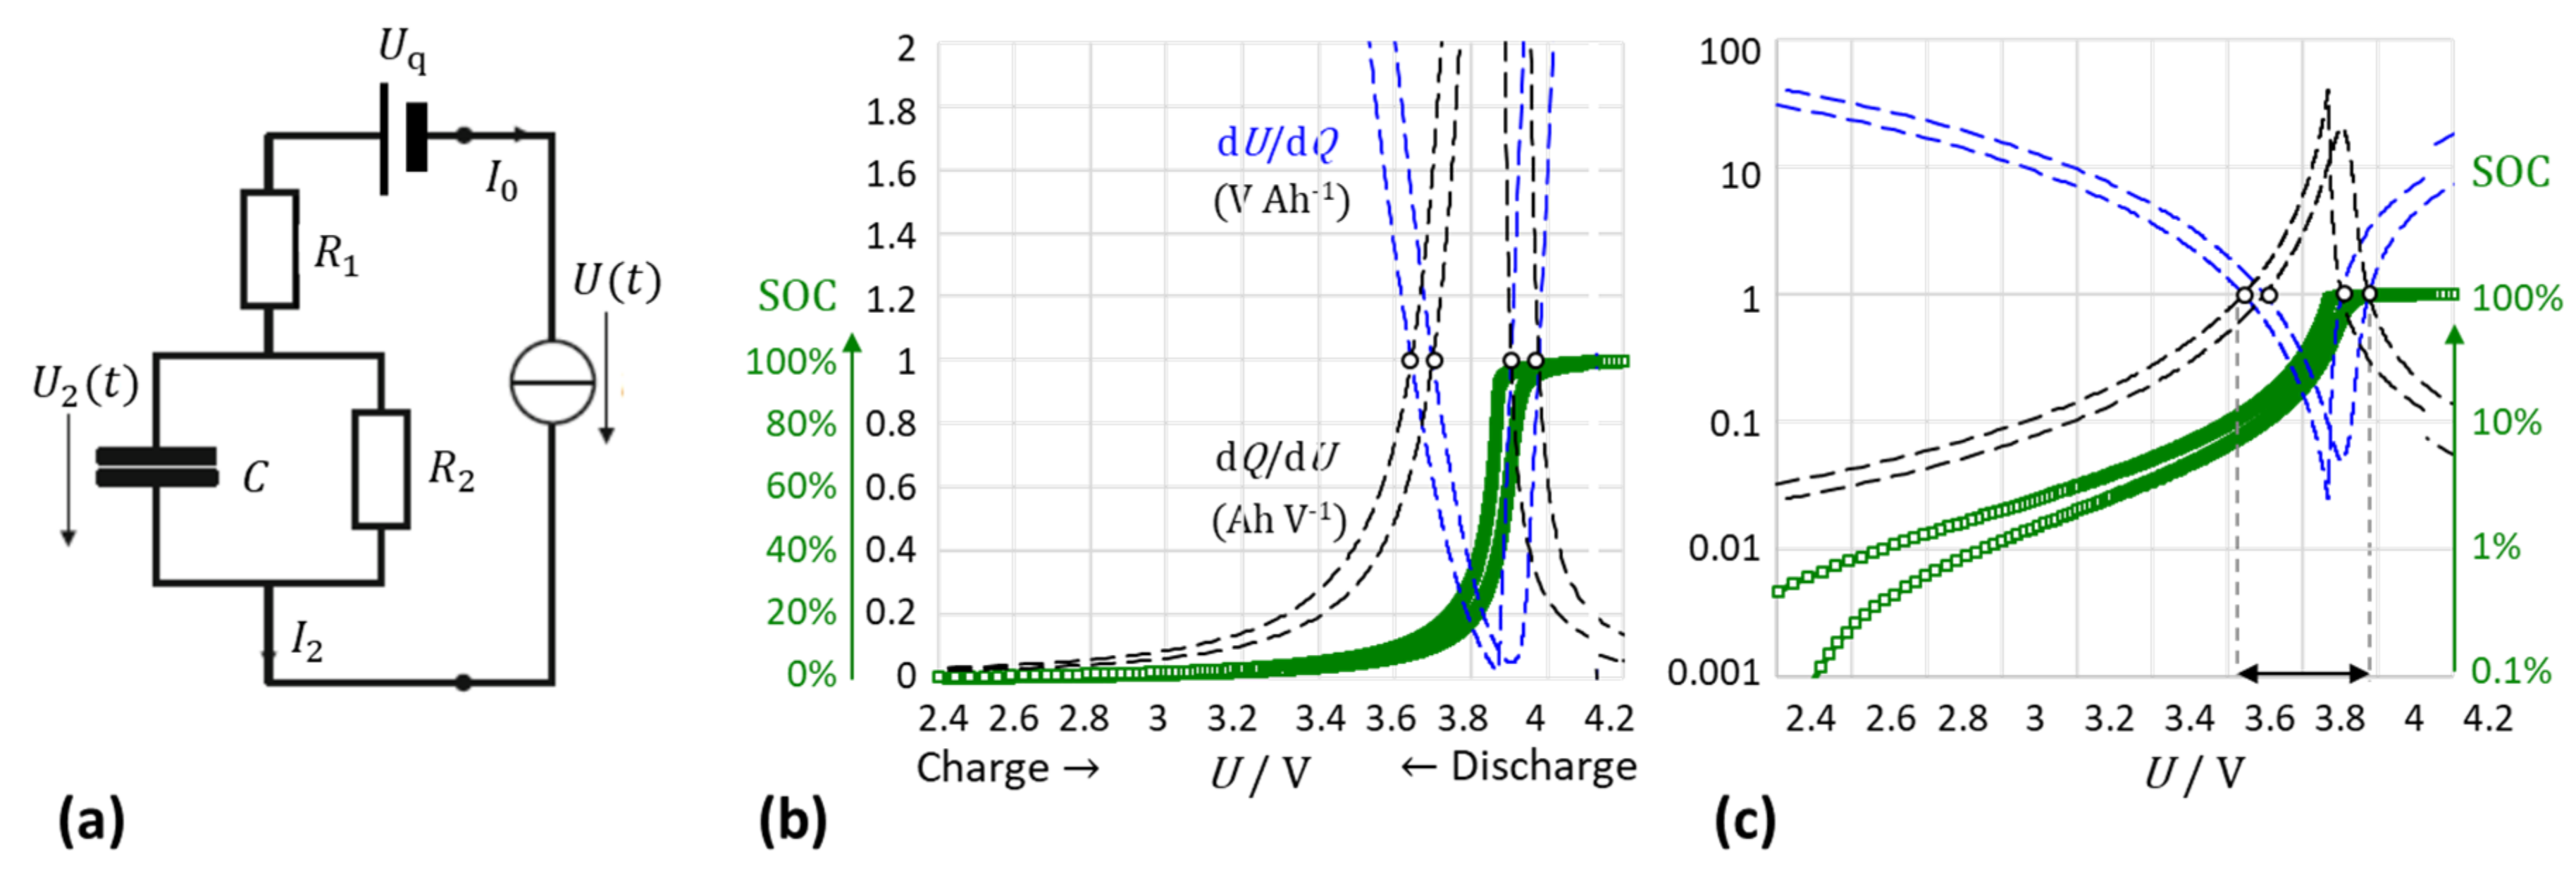
The suitability of differential capacity dQ/dU (incremental capacity “IC”, first derivative of the voltage–charge curve U(Q)) as a quality criterion for the state-of-health (SOH) is now shown for the experimental charge–discharge curves of new and aged lithium-iron phosphate cells. Figure 2 displays dQ/dU and its reciprocal dU/dQ. The scaling on the y-axis is Ah/V or V/Ah. However, drawing dSOC instead of dQ gave the same numerical results.
(a)
Differential capacity
Differential capacity indicates small changes in the battery during aging far better than the U(Q) curve. The dQ/dU signals were sharper on the voltage scale than against SOC. The voltage positions of the peaks were well reproducible and differed only slightly for individual new batteries of the same type. For lithium-iron phosphate chemistry, the central peak of dQ/dU at about 3.25 V indicated roughly the “almost empty” state (SOC → 0). The third peak showed the “almost full” battery at 3.3 V (SOC → 1).
Due to the internal resistance of the battery, charge and discharge had capacity peaks at different voltages (see Figure 1b). At a constant temperature, old and new cells almost did not differ in the voltage positions. Both deep discharge and overcharge did not significantly shift the dQ/dU peaks on the voltage axis. However, the height of the dQ/dU peak became smaller with old cells. With aging, the oxidation peaks shifted toward higher voltages (with charging) and the reduction peaks toward lower voltages (with discharging).
(b)
Incremental voltage
This rise of signal can serve as a criterion that the battery is now fully charged and not yet overcharged. Due to phase transitions, often a sharp rise in temperature was observed shortly before the overcharge or exhaustion of the battery took place. The dU/dQ peak (“DV”) was an early warning of upcoming exhaust heat events and thermal runaway.
(c)
Intersection method
The intersection of dQ/dU and dU/dQ indicated the almost full charge (SOC → 1) at a high voltage and an almost empty state (SOC → 0) at a low voltage. As the current increased, the intersection points shifted to higher voltages (charging) or lower voltages (discharging) because the voltage dropped across the internal resistance of the battery increases. The voltage window (distance between the upper and lower intersection points) depended on the applied current (see Section 3.3).
Table 2 compiles the quantitative results of different batteries. The new LFP battery was 98% fully charged at 3.45 V (2.49 Ah of 2.54 Ah, cut-off voltage 3.61 V). However, only 2.36 Ah could be discharged until the intersection criterion was reached. All experiments were performed at the same current. The bad battery consumed 2.46 Ah (of 2.51 Ah) until the overcharge warning was reached; 2.33 Ah could be discharged until the deep discharge warning. This means that the small additional overcharge capacity (0.05 Ah) and the small residual capacity (0.19 Ah) which were lost using the intersection criterion, were negligible in relation to the risk of repeated overcharge and deep discharge.
We conclude that the intersection method allowed the economical operation of LFP batteries, with about 10% of the theoretical charge remaining unused.

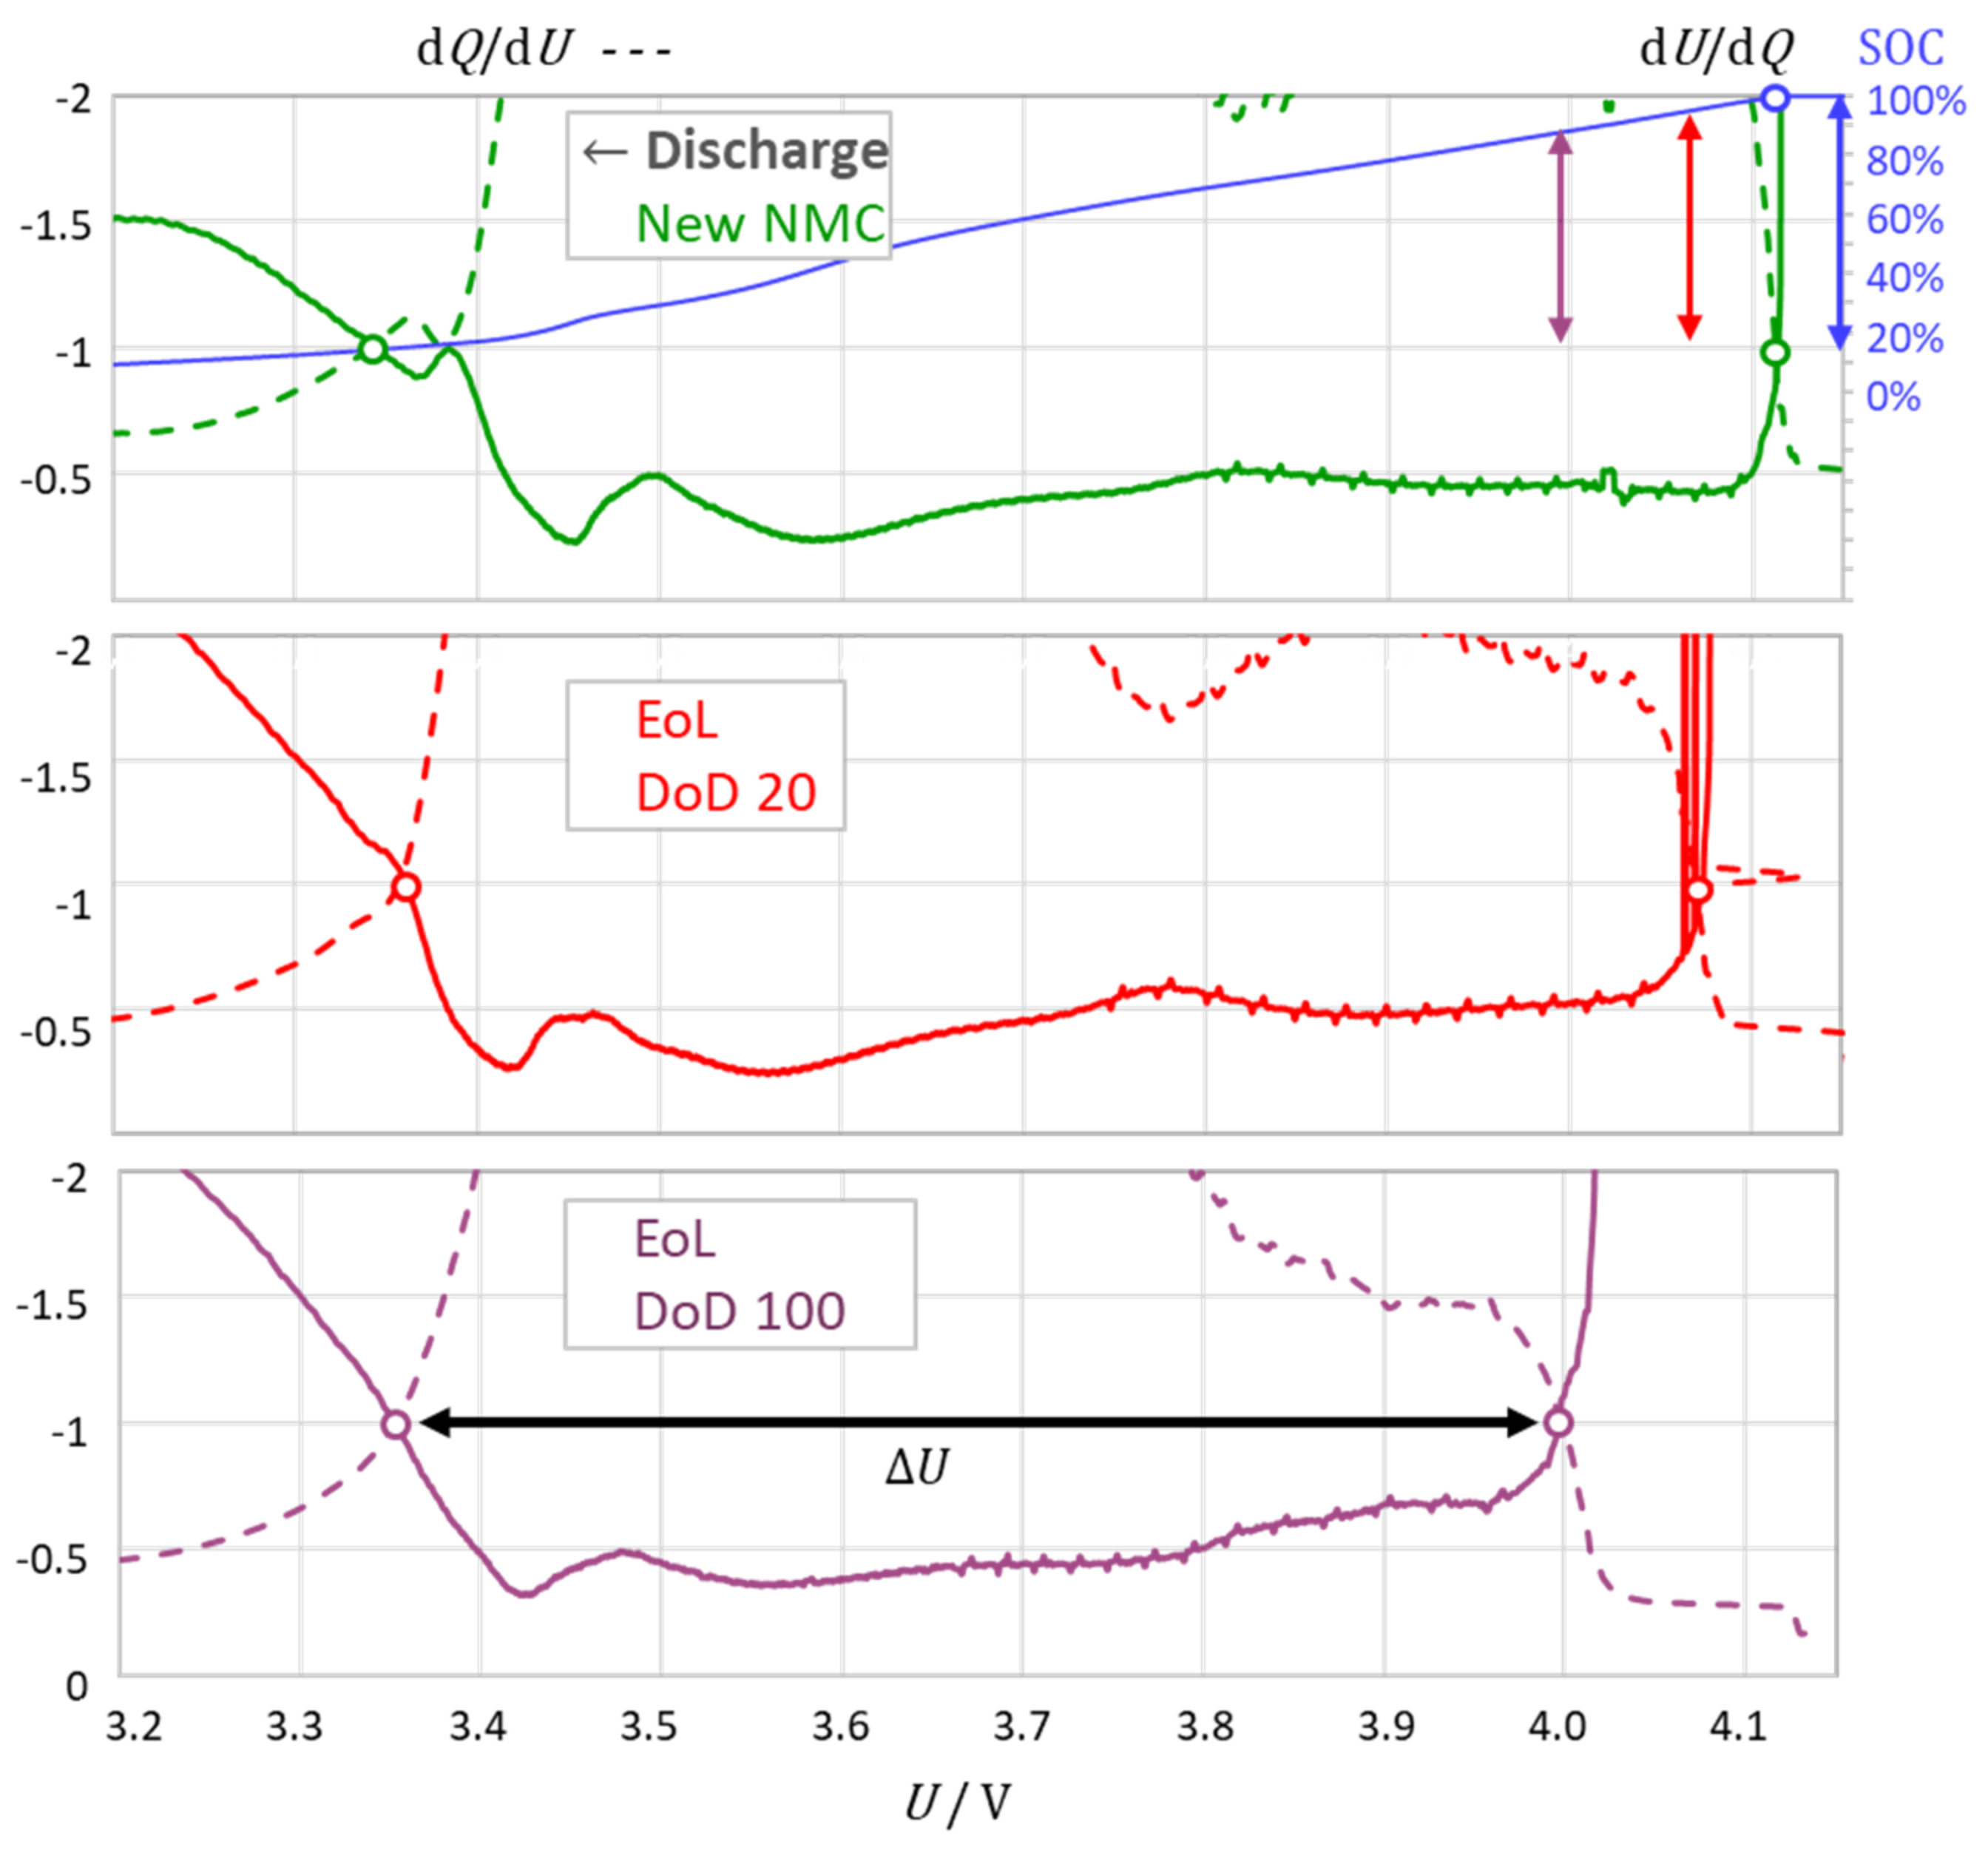
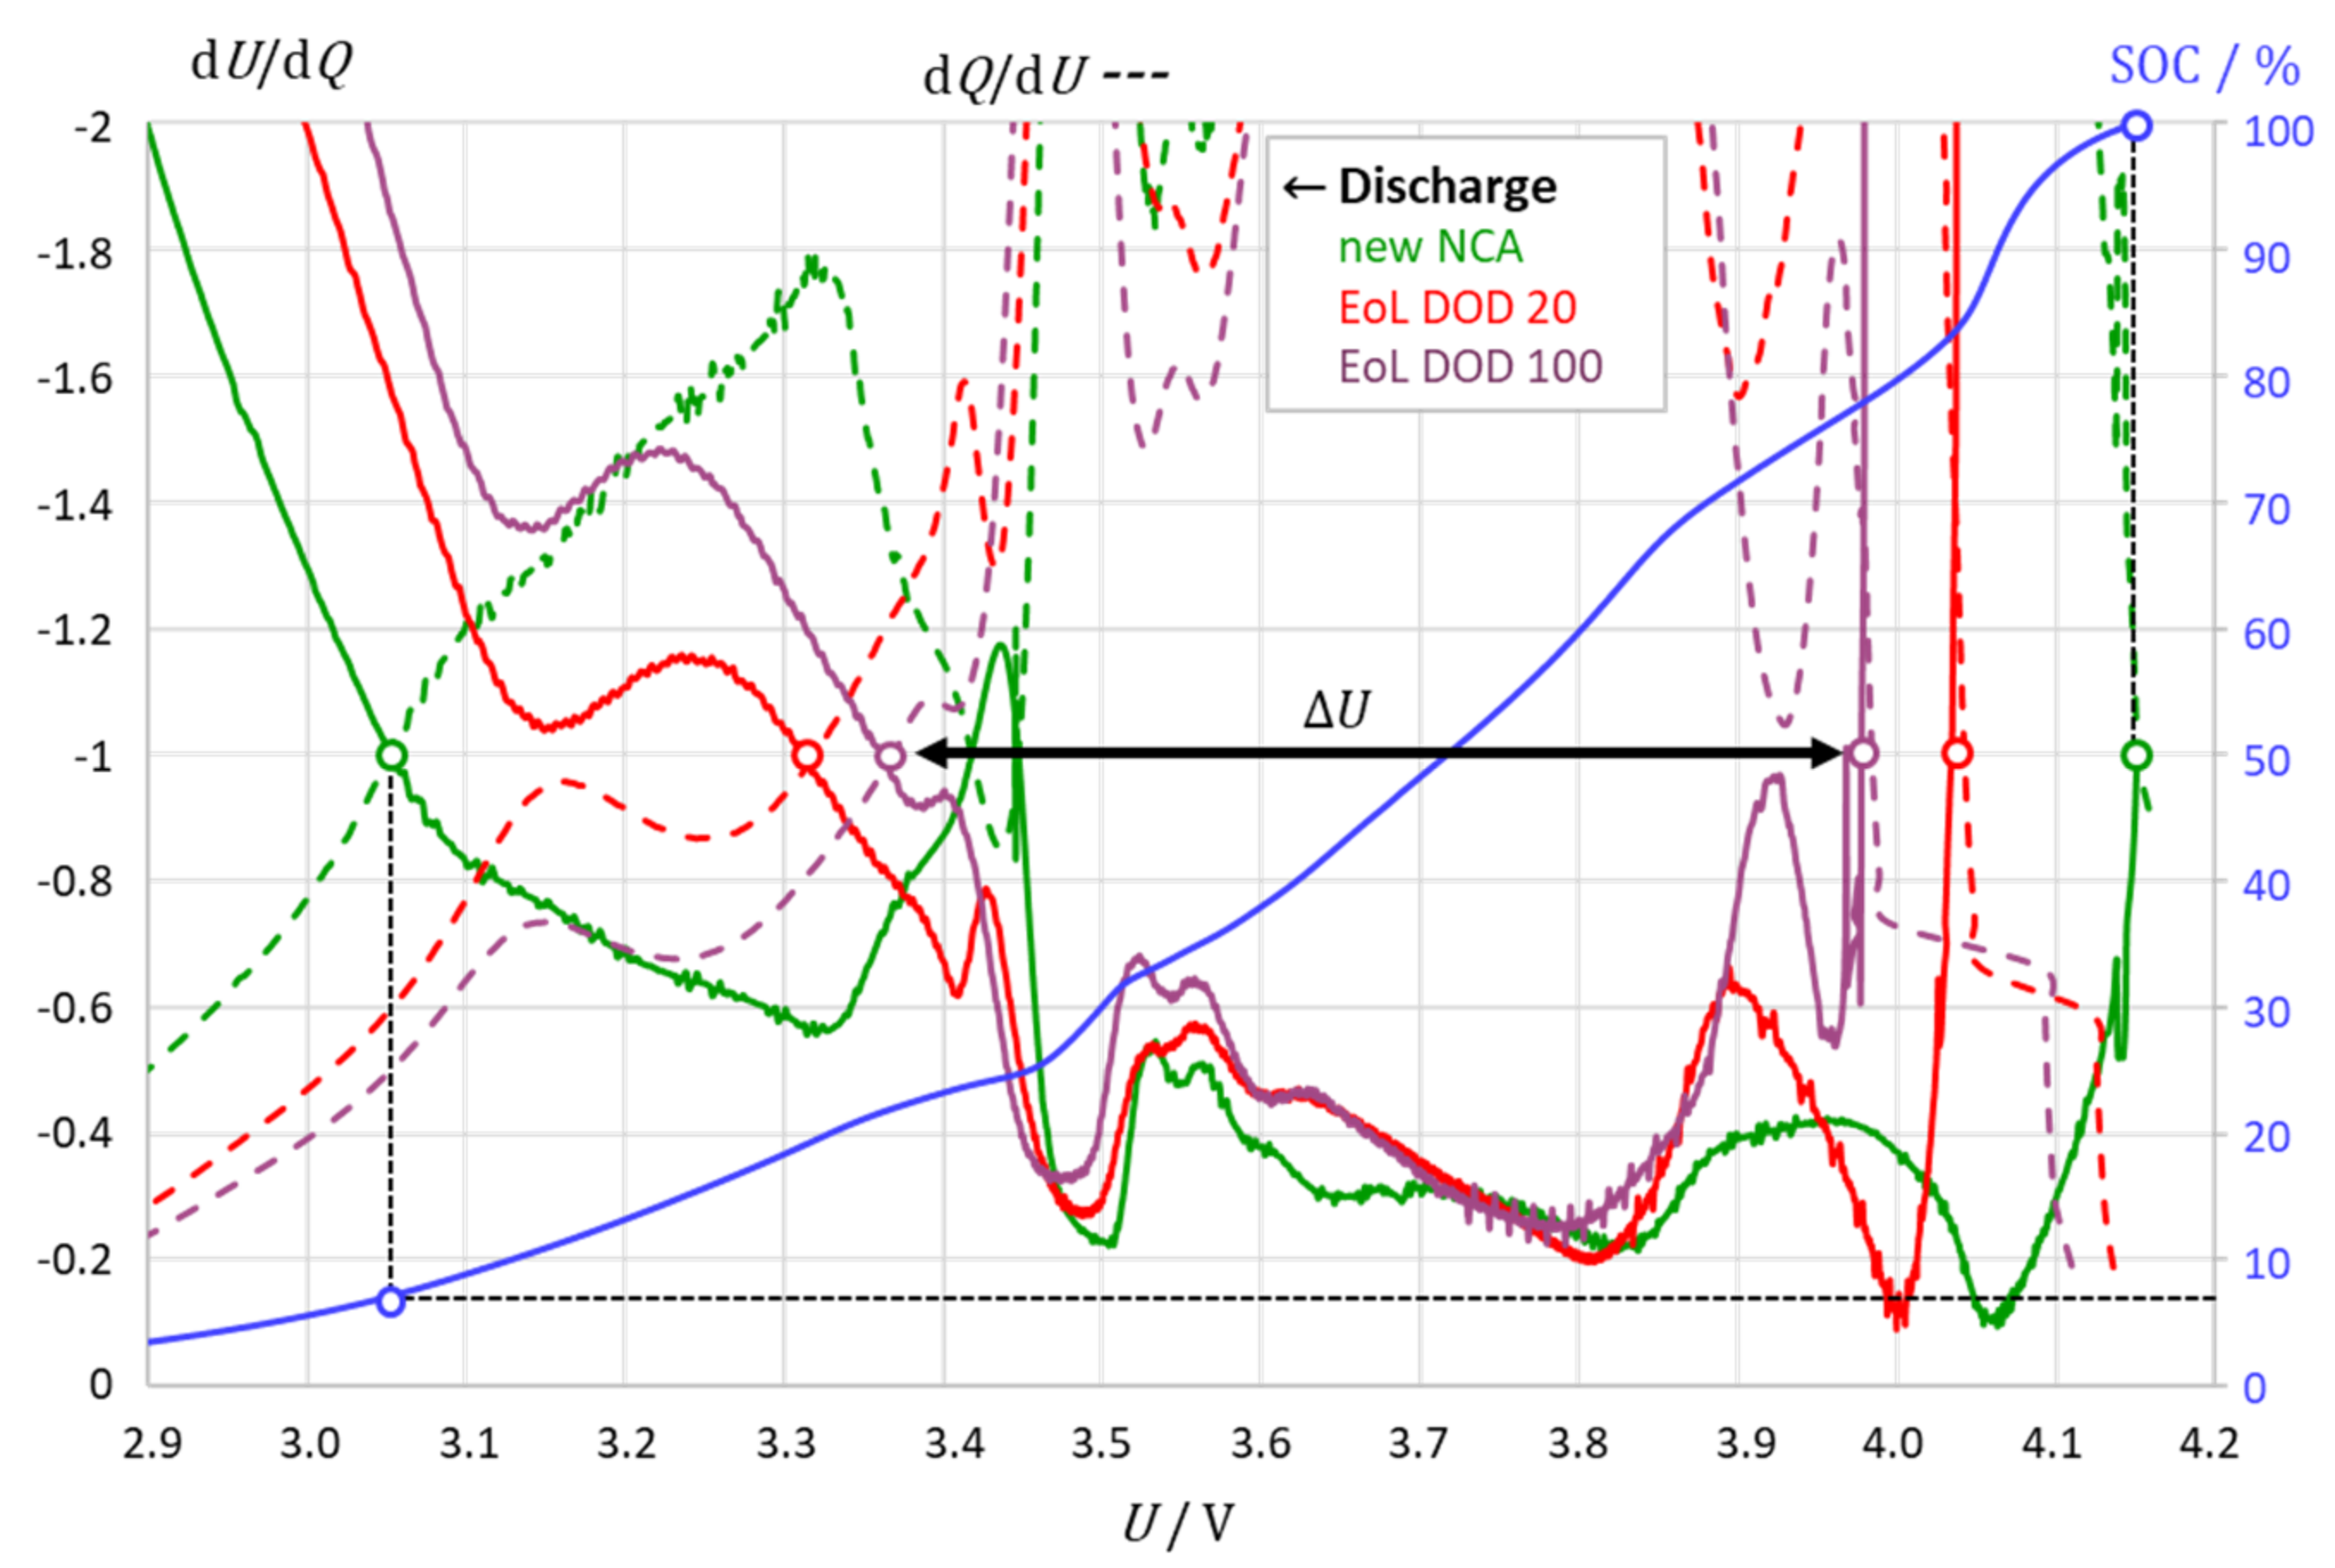
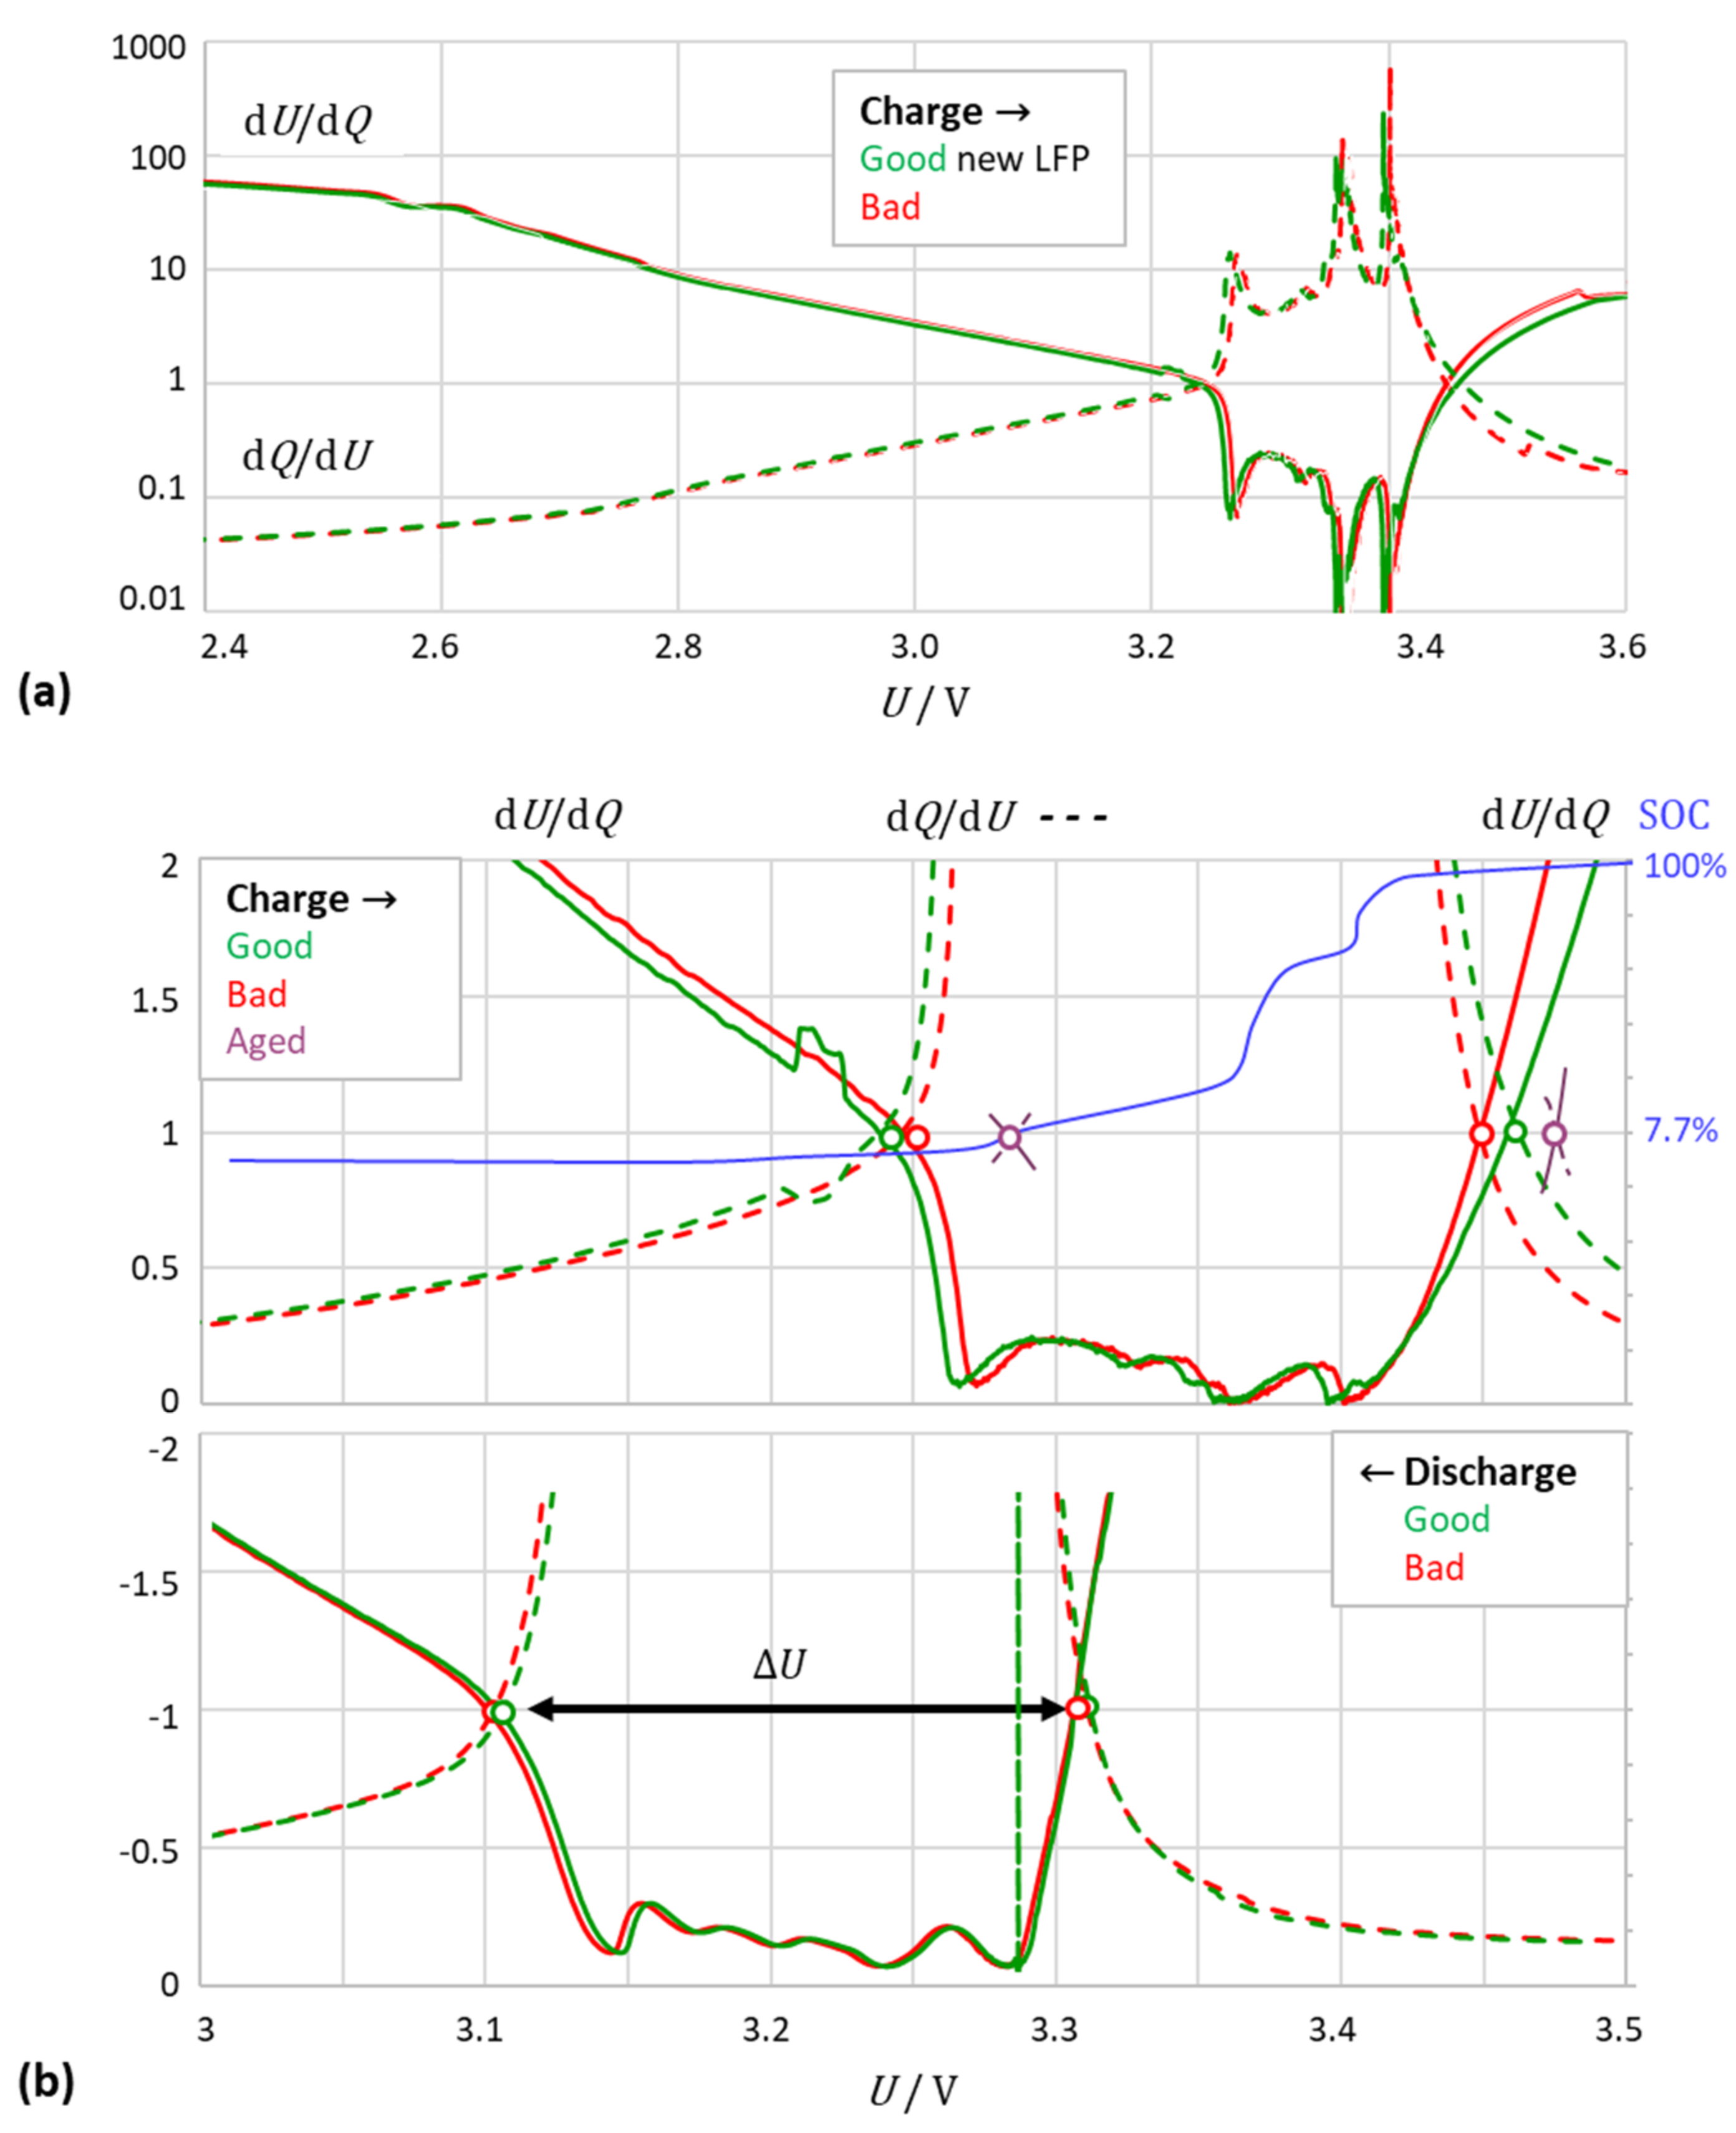
3.2. The Intersection Method Indicates the Degree of Aging

Figure 3 shows the first derivative of the discharge–voltage curve of NMC batteries that reached their end-of-lives after extended long-term cycle tests. Again, differential capacity and its reciprocal intersected at 1. The distance between the intersection points at low and high voltage defined the useful working range. It can be clearly seen that the new battery covered 0.76 V between “almost full” (1.9 Ah) and “almost empty” (0.009 Ah). The old battery offered only 0.65 V between 1.4 Ah and 0.024 Ah.
Figure 3. NMC batteries of the same type (LG ICR18650HE): Intersection method for brand new condition and end-of-life after flat and deep cycling test at constant current (900 cycles, 0.3 A = C/10). The usable voltage range = distance between the intersections (∘) becomes smaller with forced aging. Differential capacity dQ/dU (“IC”, in Ah V−1), incremental voltage dU/dQ (“DV”, in V Ah−1).
Batteries 08 00086 g003
Figure 4. Calculation recipe for the intersection method. Example data from this work. The criterion S = x x 1 0 , or S = lg 10 S > 1 shows the cell voltage at the intersection point, dQ/dU = dU/dQ ≈ 1, in the charge–discharge curve (below in green). Electric charge Q, available capacity Q0 (in bold), and state-of-charge (SOC = Q/Q0) are given for information only.
Batteries 08 00086 g004
In Figure 5, the intersection method was applied to lithium NCA batteries. Qualitatively the same results were obtained as with the other cell chemistries. For NMC and NCA chemistries, the upper intercept around 4 V reflected “virtually full” (SOC > 99%).
Table 2 adds an LCO battery; the discharge profiles (not shown here) were not qualitatively different from the examples discussed.

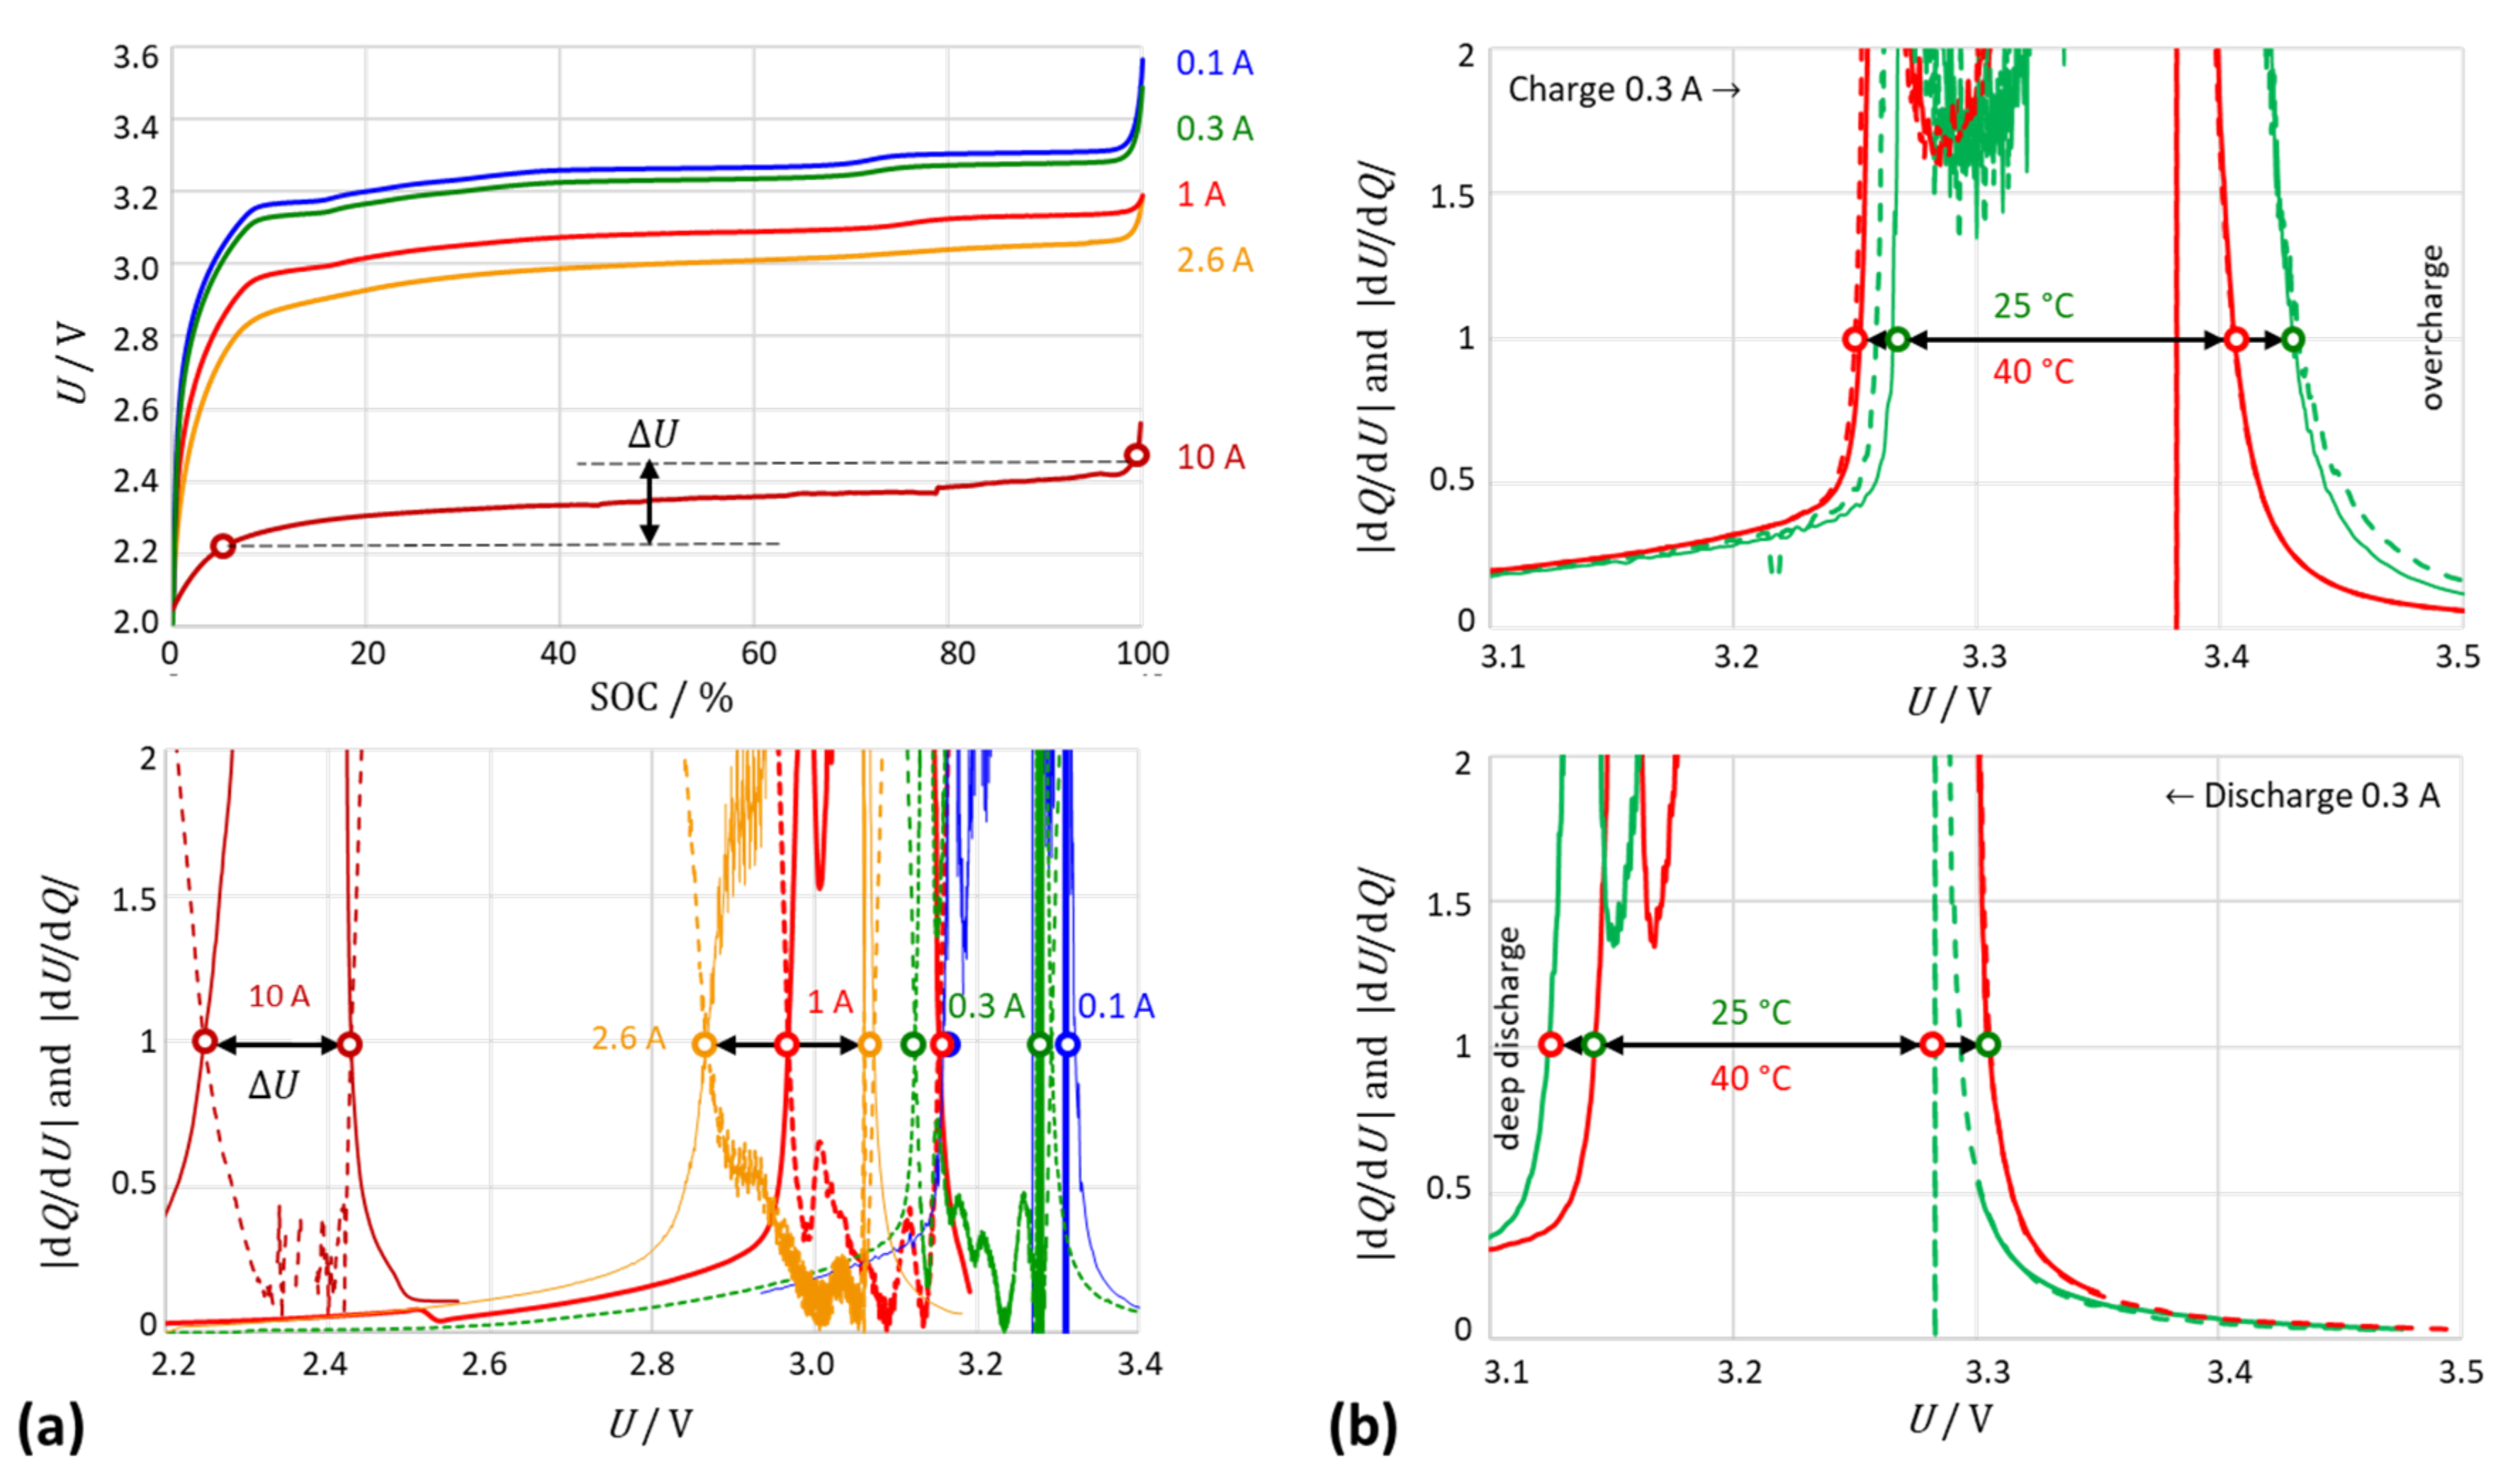
3.3. The Intersection Criterion Reflects Kinetic Inhibitions

As a mathematical tool, the intersection method is nothing more than a mirror of the charge–discharge curve. It is designed to provide a timely indication of impending overcharge or deep discharge. Figure 6 shows exemplary measurements at different currents and temperatures.
For different currents, the intersection points reliably indicated the “safe” voltage window. As the discharge current increased, the intersection points moved to a lower cell voltage, as expected, because the voltage drop across the internal resistance of the battery increased, U(I) = U0I R. As the temperature increased and the kinetic inhibitions decreased, the intersection points shifted to lower cell voltages.

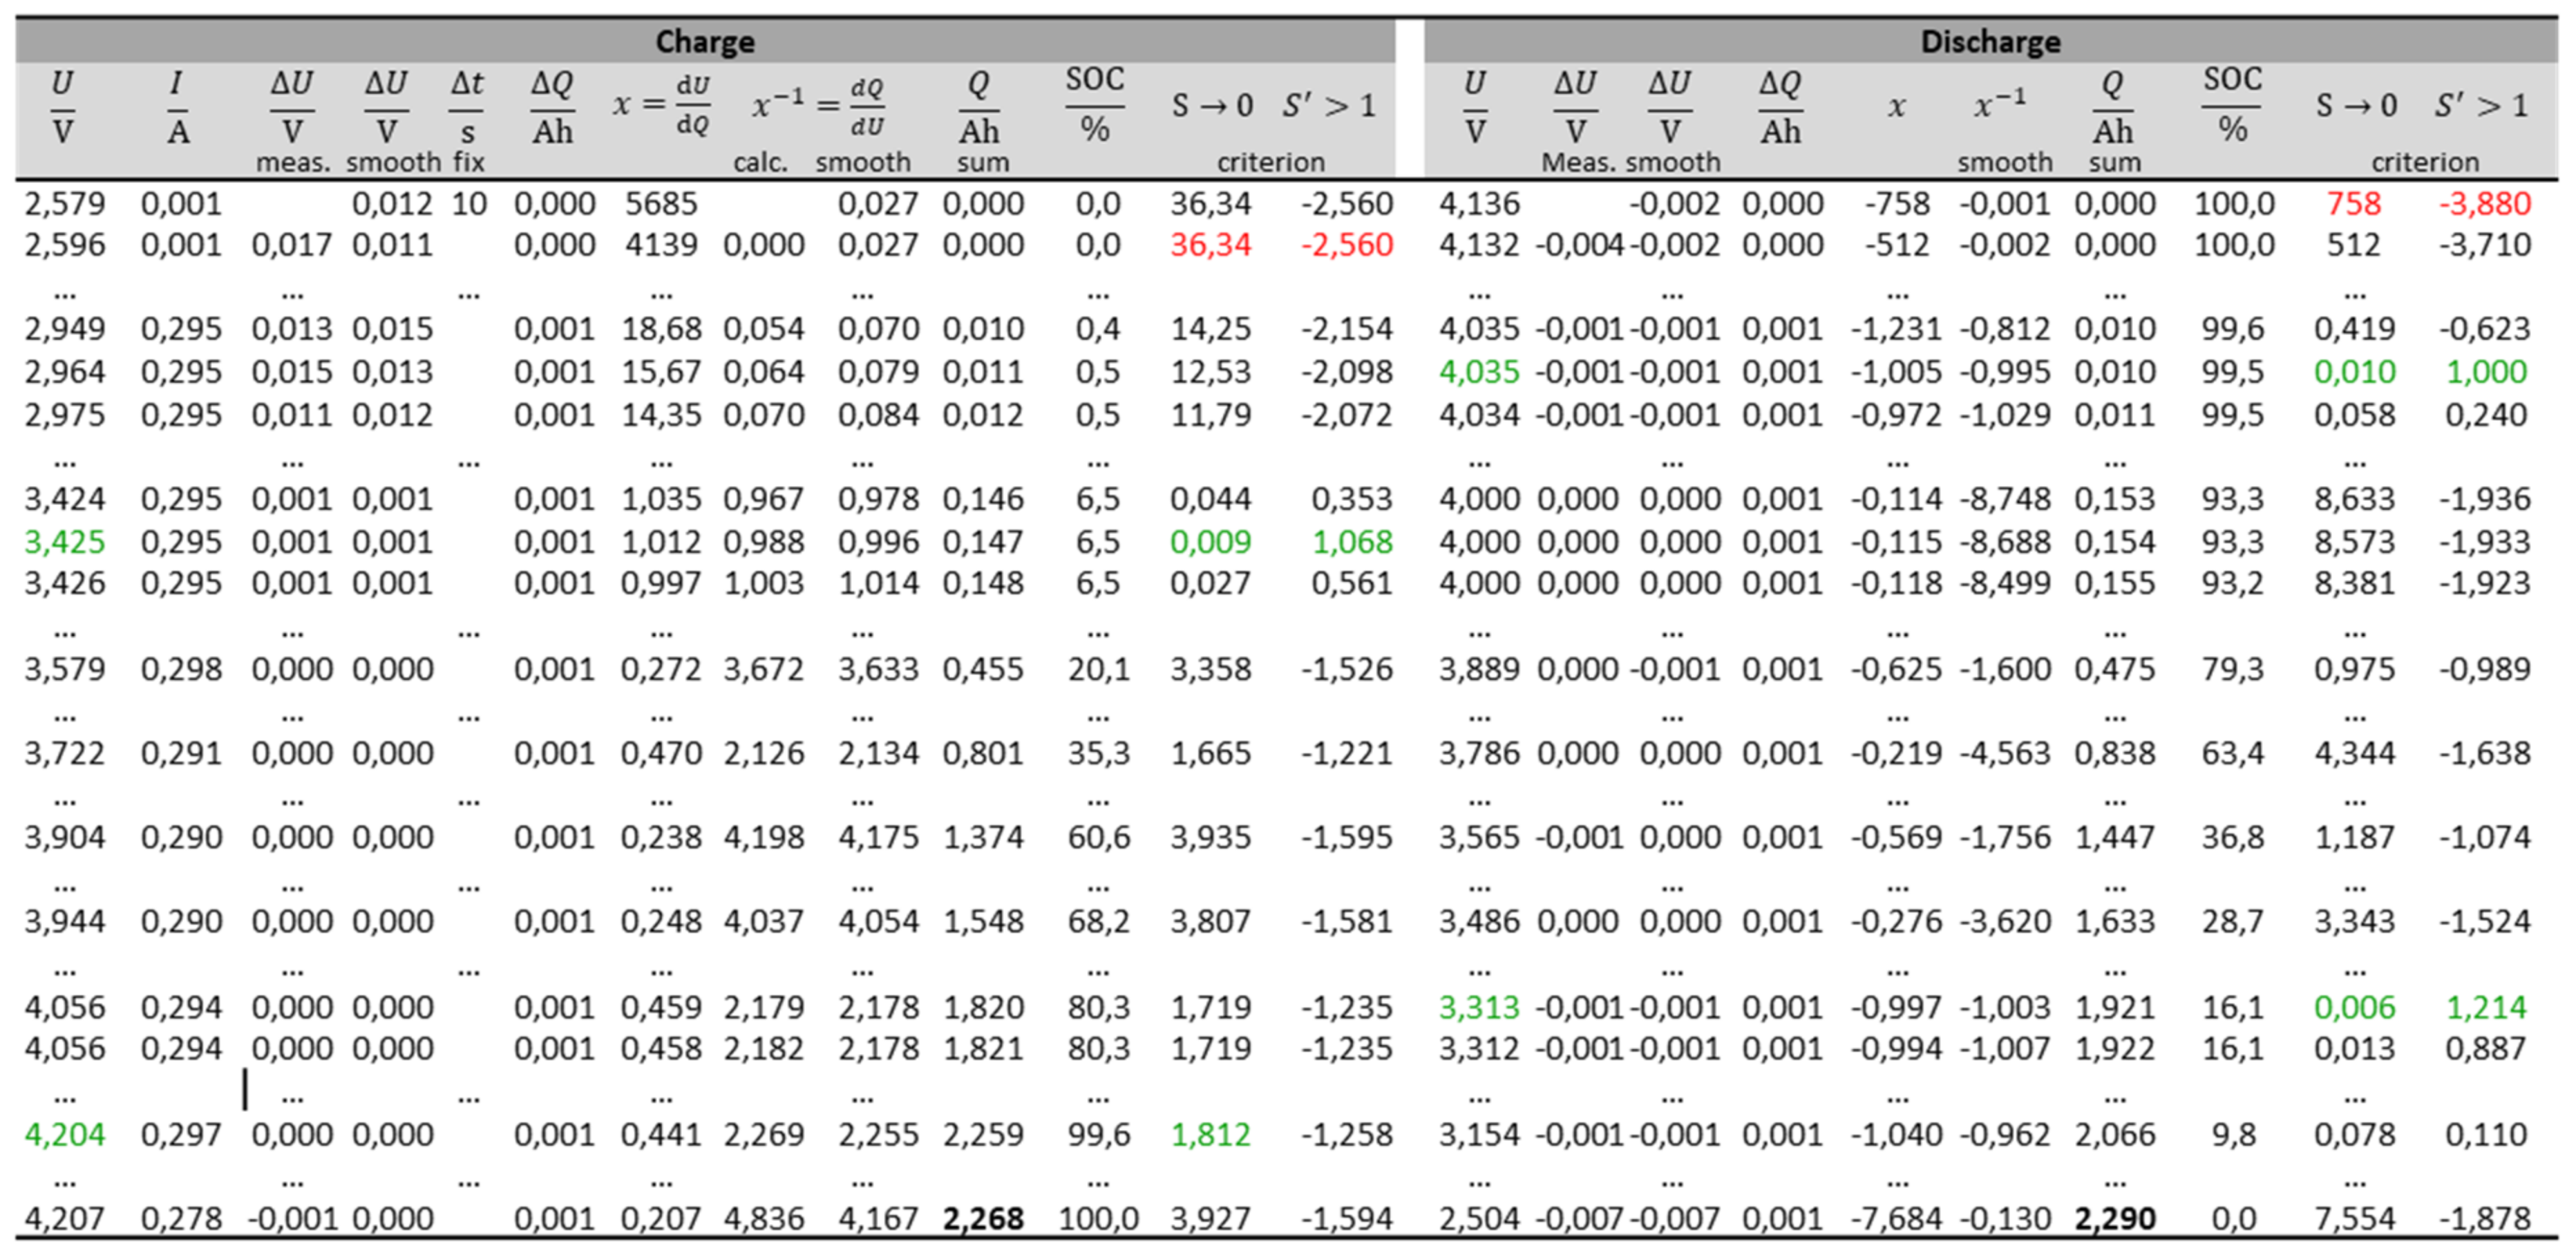
3.4. Practical Implementation

The voltage values in a common charge–discharge curve are not equidistant; therefore, the usual formulas for numerical differentiation including smoothing over multiple data points are not applicable. Small differences between adjacent values cause outliers and spikes. Therefore, for noisy signals, we successfully used derivatives with central differences.
dy dx y i + 1 y i 1 x i + 1 x i 1
The intersection method can be easily carried out by machine according to the calculation recipe in Figure 4.
In Section 3.5, the method was applied to synthetic data without prior smoothing of the measurement values. However, the method worked reliably even with slightly noisy data.
When the current signal was very noisy and the voltage changes were very small, outliers (spikes) occurred in the derivative which, in case of doubt, may be deleted point by point. If noisy measurement data are available, the voltage signal is smoothed by a moving average. With millivolt resolution, 8 or 13 data points are helpful. Then the quotient, S = ΔUQ, and its reciprocal are formed. Comparing how dQ/dU and dU/dQ approach each other and ideally reach the value of one, the operating range of the battery between “almost empty” and “almost full” was found.
For acceptable results with highly noisy measurement data, as shown in the figures above and below, the step-by-step calculation scheme is as follows:
  • Measurement of voltage U and electric current I during charging and discharging, e.g., every 10 s;
  • Calculation of the differences Δ U = U i + 1 U i for all voltage values ( i = 1 , , n ) ;
  • Calculation of charge differences Δ Q = I Δ t   using the average value of constant current I and time interval Δt. Informatively, SOC = Q/Qmax can be added for each voltage point;
  • Smoothing of voltage differences by averaging over 15 data points (total curve has 3000 data points);
  • Calculation of incremental voltage (“DV”), dU/dQ ≈ ΔUQ, using the smoothed voltage vector;
  • Calculation of the reciprocal dQ/dU ≈ (ΔUQ)−1;
  • Smoothing of dQ/dU by averaging over 17 data points.

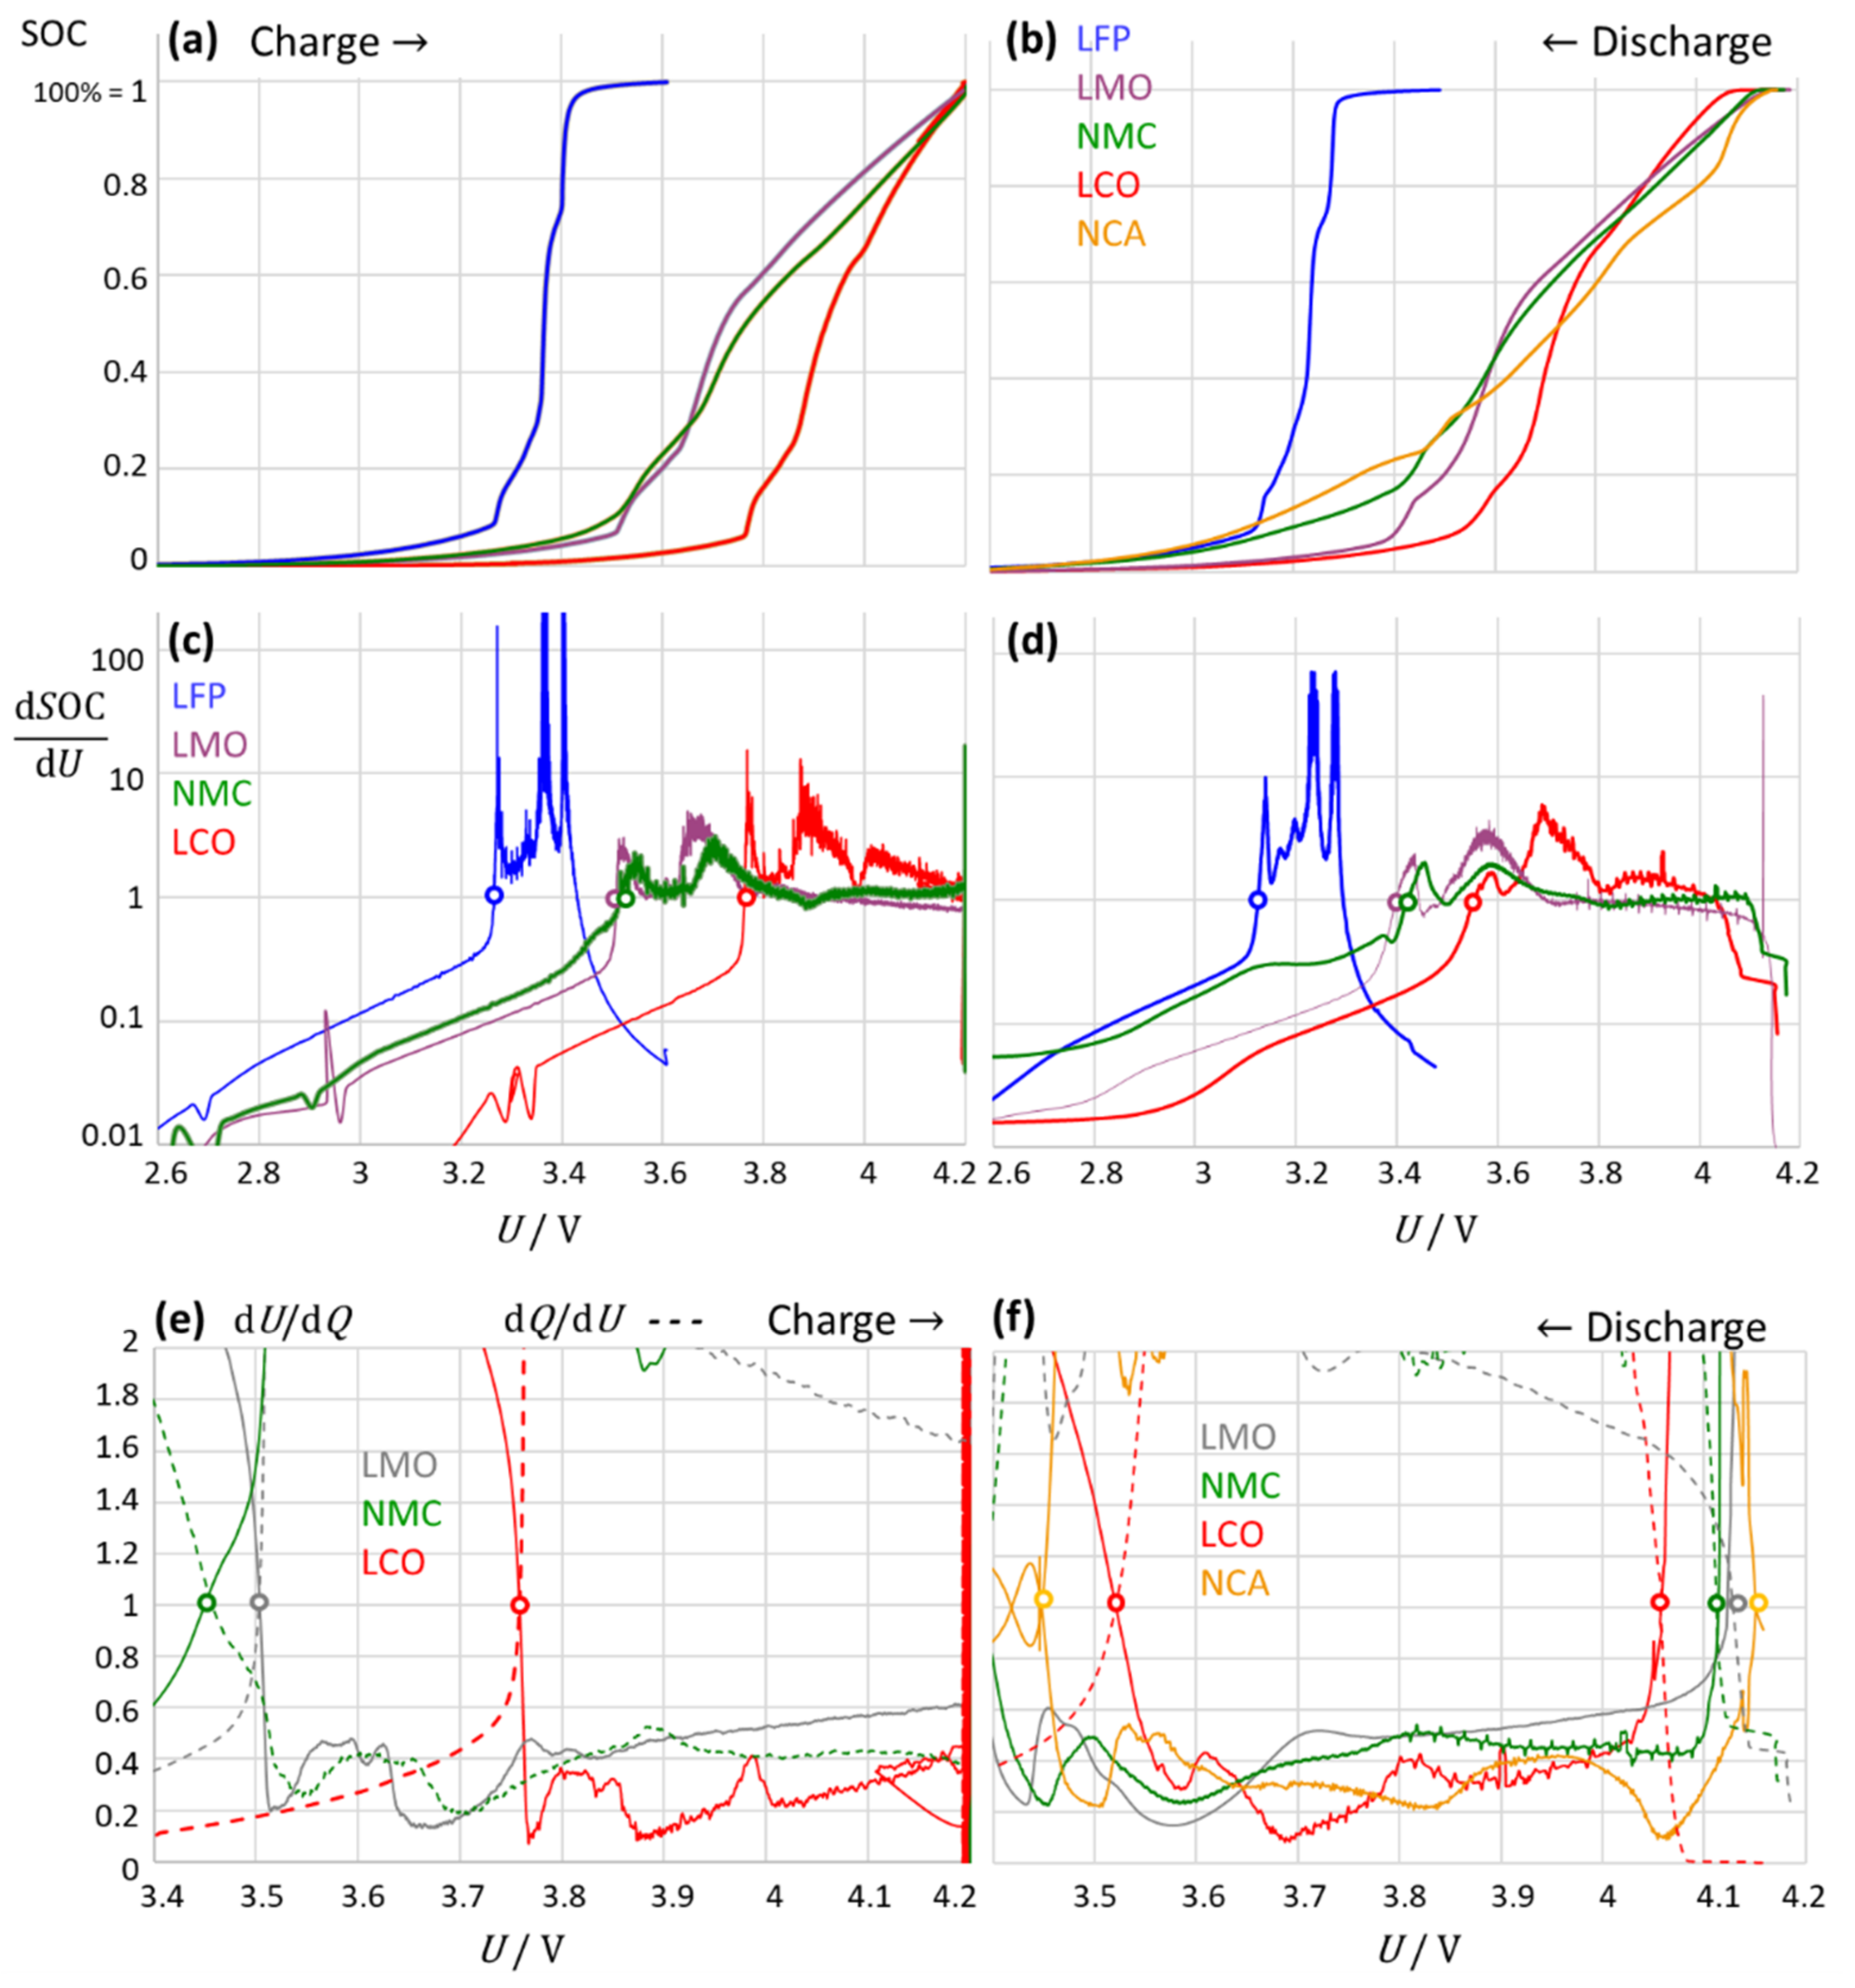
3.5. Limitations of the Method: Application to Different Cell Chemistries

Figure 7 shows the constant current charge–discharge curves of various lithium-ion batteries and the application of the intersection method. The latter worked best when the Q(U) curve was S-shaped and steep.
(a)
Lithium–iron phosphate (LFP)
Curvatures that are easy to read by eye cause considerable difficulties in computer-aided analysis of data curves. The derivative dQ/dU gave the steepest slope. In contrast to that, the intercept criterion Equation (3) provided the voltage at the greatest curvature of the curve, i.e., close to the kink point, before a constant voltage prevails. The S-shaped charge curve exhibited the lower and upper kink point at about 3.27 V (SOC 0.1) and 3.45 V (SOC 0.98); the discharge curve had kink points at 3.14 V (SOC 0.1) and 3.28 V (SOC 0.9). The LFP discharge curve reached the radius of curvature one at 3.1 V and 3.4 V. The voltage range where the radius of curvature was less than 1 again marked the operating range between “almost full” and “almost empty”. At the end of discharge, the radius of the curvature increased steeply. The benefit of curvature and radius of curvature was small, because one could also observe the almost constant voltage. However, it was not clear from the voltage when overcharging and when deep discharging began. This is the advantage of the intersection criterion as demonstrated above.
(b)
Lithium–cobalt oxide (LCO)
This battery reached the “radius of curvature one” at 4.0 V and 3.5 V. Due to the small change in voltage, the radius of curvature increased at the beginning and end of the discharge. From the first derivative of the discharge curve, the values dSOC/dU = 1 were basically evident, but the noise of the measured values was disturbing.
(c)
Lithium–manganese oxide (LMO)
The radius of curvature 1/K = 1 at 4.1 V and 3.4 V again showed the beginning rise of the discharge curve. The operating range could be read more easily from the voltage difference between the horizontal at SOC = 1 and SOC = 0.
(d)
Lithium nickel manganese cobalt oxide (NMC)
The charge–discharge curve was less steep than that of LFP and LCO. The kink points at 3.4 V and 4.0 V (discharge) were approximately represented by the intersection of the first derivative dSOC/dU = 1 (and the intersection criterion). The maxima of the derivative indicated the steepest slope of the discharge curve.
(e)
Lithium nickel cobalt aluminum oxide (NCA)
The discharge curve was relatively flat and less S-shaped than that of other battery chemistries. Noisy measurement values led to large scatter and numerical errors. The derivative dQ/dU showed several passes through one (see Figure 7d). The radius of curvature was one at the kink point (4.15 V) and at other points; the numerical evaluation was unsatisfactory despite strong smoothing.

3.6. Verification of the Intersection Criterion Using Synthetic Data

In this section, the proposed method is applied to synthetic data of LFP batteries provided by Dubarry et al. [26]. The intersection method was applied to the unsmoothed data set of 705,638 charge-discharge curves, U(SOC). The data were evaluated using MATLAB (code see Supplementary Materials).
Figure 8 compares the first derivative of the charge–discharge curves with respect to the absolute state-of-charge, S = dSOC/dU. Here, normalized capacity refers to the initial state to compare a “new” and an “aged” system on the same scale.
The intersection points were found by searching for the smallest value of the difference, |S – 1/S|2 → min, on the “left” and on the “right” side of the data set.
The intersection points at S = 1/S = 1 occurred reliably, so that the associated voltage could be determined fairly accurately. Figure 8c clearly shows how the usable voltage window (distance between die intersection points U1 and U2) became smaller and smaller during aging. For lithium iron phosphate and other cell chemistries, intermediate peaks below S = 1/S =1 do not matter. For diagnostic purposes, such peaks would be interpreted as phase changes.
In the Supplementary Materials, a video shows the method in action for the special case of increasing the loss of the lithium inventory.

4. Conclusions

For all common lithium-ion chemistries, the empirical intersection criterium proposed in this work, dSOC/dU = dU/dSOC = 1, allows the operation of a lithium-ion battery to be monitored between “almost full” and “almost empty leaving some percent of the available capacity unused to avoid overcharge and deep discharge:
  • The intersection points corresponded to the kink points in the charge–voltage curve. At the upper intersection, the battery was “virtually full” and was considered a warning of impending overcharge or phase change. The small deviation to full charge depended on the cell chemistry;
  • At the lower intersection point, the battery was “virtually empty” with a small amount of residual charge remaining in the battery; this was considered as a warning of impending deep discharge or phase change. For “completely empty”, including deep discharge, the criterion diverged from one: dQ/dU → 0 and dU/dQ → −∞;
  • With an increasing current, the intersection points shifted to higher voltages (charging) or lower voltages (discharging); the distance between the intersections slightly increased with the current due to the voltage drop across the internal resistance of the cell.
The small deviation of the intersection method compared to ampere-hour counting contained a useful “reserve” to protect the battery against overcharging and deep discharge. The intersection method is suitable for simple intelligent battery monitoring without the need for Ah counting.
Starting from any battery condition, it is sufficient to record the voltage and current over time, calculate the charge and voltage differences, and evaluate the quotient ΔUQ. The criterion dSOC/dU = dU/dSOC = 1 will stop an automated full charge or discharge in time and prevent thermal runaway as far as possible. To avoid zero differences and rounding errors, the calculation rule in Equation (6) is recommended as a practical implementation of the intersection criterion.
S = Δ U Δ Q     Δ U Δ Q 1 2 0           or       lg 10 S 1
For constant current charge and discharge, one current–voltage point per 10 s is sufficient. The voltage position of the upper intersection can be improved by a shorter measuring interval.

Relevance to Battery Management Systems

In practice, the intersection method is useful for determining when to switch from constant current (CC) to constant voltage charging and when to stop CC discharging. The criterion is not intended as a replacement for monitoring cut-off voltages, but as a tool for the evaluation of conventional charge–discharge curves.
The benefit of the intersection method is a mathematical one; it does not repeat the lower and upper cut-off voltage (defined by the manufacturer for a particular battery) but does provide empirical kink points of the charge–discharge curve just before reaching “full” and “empty” (for any battery). The physical basis of the criterion is solely the course of the charge–discharge curve, which changes over time due to aging. Cut-off voltages need not be known in advance.
The criterion shows a snapshot of the charge–discharge curve. It is irrelevant for the method at which point of the charge–discharge curve, in which direction or under which operating conditions (SOC, SOH, current, temperature, load change) it is used. The result 1/S = S = 1 means “Attention, almost full, overcharge is imminent” or “Attention, almost empty, deep discharge is imminent”. At operating voltages to the left and right of the intersection points, little additional charge flows into or out of the battery. The intersection criterion is intended as an early warning of impending heat events and phase changes.
The criterion does not claim to extend battery life. However, the relationship between shortened service life due to overcharge and deep discharge is known, e.g., [27]. The voltage range between the upper and lower intersection point becomes smaller during aging. It is a mirror image of the charge–discharge curve and thus of electrode kinetics. The intersections shift to lower cell voltages as the internal resistance of the battery increases. Cut-off voltages listed in data sheets do not depend on the actual state-of-health but are specifications of the manufacturer. The conventional diagram also shows that the initial curvature of the upper branch of the curve shifts more and more towards low voltages (see Video S3). The intercept criterion makes this visual observation machine-readable (see Supplementary Video S2).
The proposed mathematical procedure helps a digital machine to find the inflection points of the charge/discharge curve, which cannot always be detected accurately and quickly even by the human eye. Such an automated process would determine if the battery is approaching overcharge or deep discharge without the need to know the actual state-of-charge or state-of-health. The method is suitable for implementation on microcontrollers of battery management systems. It is simple and consumes few resources (memory, computing power).

Supplementary Materials

The following supporting information can be downloaded at: https://www.mdpi.com/article/10.3390/batteries8080086/s1, Video S1: Visualization of the intersection method using synthetic data (Dubarry [26]) for lithium-iron phosphate chemistry: Loss of lithium inventory 0% to 70% at constant loss of active material. Narrowing of the usable SOC range; Video S2: Intersection method on the voltage scale showing the narrowing of the ‘safe’ voltage window during aging; Video S3: Conventional discharge curves with pre-defined cut-off voltages; Figure S1: MATLAB CODE: MATHLAB code fragment for evaluating LFP chemistry.

Author Contributions

Writing—Original Draft Preparation, Review and Editing, all authors. All authors have read and agreed to the published version of the manuscript.

Funding

This work was supported by Diehl Aerospace GmbH.

Conflicts of Interest

The authors declare no conflict of interest.

List of Symbols and Abbreviations

CCapacitance, dQ/dU = 1/x (F)LCOlithium cobalt oxide
Qelectric charge, battery capacity (Ah)LMOlithium manganese spinel
Q0capacity of a fully charged battery (Ah)LFPlithium iron phosphate
Rohmic resistance, real part of impedance (Ω)NCAnickel cobalt aluminum
Reelectrolyte resistance (Ω)NMCnickel manganese cobalt
Ucell voltage (V)SOC state-of-charge
xincremental voltage: dU/dQ (Ω/s)SOH state-of-health

References

  1. Waag, W.; Sauer, D.U. State-of-Charge/Health. In Encyclopedia of Electrochemical Power Sources; Garche, J., Dyer, C., Moseley, P.T., Ogumi, Z., Rand, D., Scrosati, B., Eds.; Elsevier: Amsterdam, The Netherlands, 2009; Volume 4, pp. 793–804. [Google Scholar]
  2. Piller, S.; Perrin, M.; Jossen, A. Methods for state-of-charge determination and their applications. J. Power Sources 2001, 96, 113–120. [Google Scholar] [CrossRef]
  3. Xiong, R.; Pan, Y.; Shen, W.; Li, H.; Sun, F. Lithium-ion battery aging mechanisms and diagnosis method for automotive applications: Recent advances and perspectives. Renew. Sustain. Energy Rev. 2020, 131, 110048. [Google Scholar] [CrossRef]
  4. Gauthier, R.; Luscombe, A.; Bond, T.; Bauer, M.; Johnson, M.; Harlow, J.; Louli, A.J.; Dahn, J.R. How do Depth of Discharge, C-rate and Calendar Age Affect Capacity Retention, Impedance Growth, the Electrodes, and the Electrolyte in Li-Ion Cells? J. Electrochem. Soc. 2022, 169, 020518. [Google Scholar] [CrossRef]
  5. Tran, M.-K.; Fowler, M. A Review of Lithium-Ion Battery Fault Diagnostic Algorithms: Current Progress and Future Challenges. Algorithms 2020, 13, 62. [Google Scholar] [CrossRef] [Green Version]
  6. Bloom, I.; Jansen, A.N.; Abraham, D.P.; Knuth, J.; Jones, S.A.; Battaglia, V.S.; Henriksen, G.L. Differential voltage analyses of high-power, lithium-ion cells: 1. Technique and application. J. Power Sources 2005, 139, 295–303. [Google Scholar] [CrossRef]
  7. Barai, A.; Uddin, K.; Dubarry, M.; Somerville, L.; McGordon, A.; Jennings, P.; Bloom, I. A comparison of methodologies for the non-invasive characterization of commercial Li-ion cells. Prog. Energy Combust. Sci. 2019, 72, 1–31. [Google Scholar] [CrossRef]
  8. Hatzikraniotis, E.; Mitsas, C.L.; Siapkas, D.I. Differential Capacity Analysis, a Tool to Examine the Performance of Graphites for Li-Ion Cells. In Materials for Lithium-Ion Batteries; NATO Science Series; Julien, C., Stoynov, Z., Eds.; Springer: Dordrecht, The Netherlands, 2020; Volume 85. [Google Scholar] [CrossRef]
  9. Dubarry, M.; Svoboda, V.; Hwu, R.; Liaw, B.Y. Incremental capacity analysis and close-to-equilibrium OCV measurements to quantify capacity fade in commercial rechargeable lithium batteries. Electrochem. Solid State Lett. 2006, 9, A454. [Google Scholar] [CrossRef]
  10. Dahn, H.M.; Smith, A.J.; Burns, J.C.; Stevens, D.A.; Dahn, J.R. User-Friendly Differential Voltage Analysis Freeware for the Analysis of Degradation Mechanisms in Li-Ion Batteries. J. Electrochem. Soc. 2012, 159, A1405. [Google Scholar] [CrossRef]
  11. Smith, A.J.; Burns, J.C.; Dahn, J.R. High-Precision Differential Capacity Analysis of LiMn2O4/graphite Cells. Electrochem. Solid-State Lett. 2011, 14, A39. [Google Scholar] [CrossRef]
  12. Smith, A.J.; Dahn, J.R. Delta Differential Capacity Analysis. J. Electrochem. Soc. 2012, 159, A290. [Google Scholar] [CrossRef]
  13. Zheng, L.; Zhu, J.; Lu, D.D.C.; Wang, G.; He, T. Incremental capacity analysis and differential voltage analysis based state of charge and capacity estimation for lithium-ion batteries. Energy 2018, 150, 759–769. [Google Scholar] [CrossRef]
  14. Jehnichen, P.; Wedlich, K.; Korte, C. Degradation of high-voltage cathodes for advanced lithium-ion batteries—differential capacity study on differently balanced cells. Sci. Technol. Adv. Mater. 2019, 20, 1–9. [Google Scholar] [CrossRef] [Green Version]
  15. Krupp, A.; Ferg, E.; Schuldt, F.; Derendorf, K.; Agert, C. Incremental capacity analysis as a state of health estimation method for lithium-ion battery modules with series-connected cells. Batteries 2021, 7, 2. [Google Scholar] [CrossRef]
  16. Zhang, S.; Guo, X.; Dou, X.; Zhang, X. A rapid online calculation method for state of health of lithium-ion battery based on coulomb counting method and differential voltage analysis. J. Power Sources 2020, 479, 228740. [Google Scholar] [CrossRef]
  17. Kurzweil, P.; Ober, J.; Wabner, D.W. Method for extracting kinetic parameters from measured impedance spectra. Electrochim. Acta 1989, 34, 1179–1185. [Google Scholar] [CrossRef]
  18. Guo, D.; Yang, G.; Zhao, G.; Yi, M.; Feng, X.; Han, X.; Lu, L.; Ouyang, M. Determination of the Differential Capacity of Lithium-Ion Batteries by the Deconvolution of Electrochemical Impedance Spectra. Energies 2020, 13, 915. [Google Scholar] [CrossRef] [Green Version]
  19. Wang, L.; Pan, C.; Liu, L.; Cheng, Y.; Zhao, X. On-board state of health estimation of LiFePO4 battery pack through differential voltage analysis. Appl. Energy 2016, 168, 465–472. [Google Scholar] [CrossRef]
  20. Wang, L.; Zhao, X.; Liu, L.; Pan, C. State of health estimation of battery modules via differential voltage analysis with local data symmetry method. Electrochim. Acta 2017, 256, 81–89. [Google Scholar] [CrossRef]
  21. Sieg, J.; Storch, M.; Fath, J.; Nuhic, A.; Bandlow, J.; Spier, B.; Sauer, D.U. Local degradation and differential voltage analysis of aged lithium-ion pouch cells. J. Energy Storage 2020, 30, 101582. [Google Scholar] [CrossRef]
  22. Zhan, C.; Wu, T.; Lu, J.; Amine, K. Dissolution, migration, and deposition of transition metal ions in Li-ion batteries exemplified by Mn-based cathodes–a critical review. Energy Environ. Sci. 2018, 11, 243–257. [Google Scholar] [CrossRef]
  23. Press, W.H.; Teukolsky, S.A.; Vetterling, W.T.; Flannery, B.F. The Art of Scientific Computing, 3rd ed.; Cambridge University Press: Cambridge, UK, 2007. [Google Scholar]
  24. Christophersen, J.P.; Shaw, S.R. Using radial basis functions to approximate battery differential capacity and differential voltage. J. Power Sources 2010, 195, 1225–1234. [Google Scholar] [CrossRef]
  25. Kurzweil, P.; Scheuerpflug, W. State-of-charge monitoring and battery diagnosis of different lithium-ion chemistries using impedance spectroscopy. Batteries 2021, 7, 17. [Google Scholar] [CrossRef]
  26. Dubarry, M.; Beck, D. Analysis of Synthetic Voltage vs. Capacity Datasets for Big Data Li-ion Diagnosis and Prognosis. Energies 2021, 14, 2371. [Google Scholar] [CrossRef]
  27. Ouyang, D.; Chen, M.; Liu, J.; Wei, R.; Weng, J.; Wang, J. Investigation of a commercial lithium-ion battery under overcharge/over-discharge failure conditions. RSC Adv. 2018, 8, 33414. [Google Scholar] [CrossRef] [Green Version]
Figure 1. General model of a lithium-ion battery: (a) Network elements: Uq = 4.2 V, Q0 = 2 Ah, C = 12500 F, R1 = 0.004 Ω, R2 = 0.02 Ω. (b) Calculated battery voltage U (green), differential capacity dQ/dU (“IC”, dashed black) and “incremental voltage” dU/dQ (“DV”, V/Ah, dashed blue) versus state-of-charge for constant current charge and discharge (I = 0.5 A) on a linear scale. (c) Calculated values on the logarithmic scale. (∘) Intersection points: Charge: 3.70 V and 3.98 V; discharge 3.64 V and 3.91 V.
Batteries 08 00086 g001
Figure 2. LFP batteries of the same type (LithiumWerks). (a) First derivative of the charge curve on the logarithmic scale: the best and the worst battery of 100 samples. (b) The intersection points (∘) of differential capacity dQ/dU (“IC” in Ah V−1) and “incremental voltage” dU/dQ (“DV” in V Ah−1) define the voltage window ΔU between almost full charge and almost full discharge. The cross × indicates the intersection criterium of a battery after long-term aging (900 cycles, DOD 20, 0.3 A). Quantitative data see below.
Batteries 08 00086 g002
Figure 5. NCA batteries of the same type (SONY): First derivative of the constant current discharge characteristics for new samples and end-of-life parts after constant current cycling test (900 cycles, 0.3 A). The usable voltage range and SOC window between the intersection points (∘) becomes smaller with forced aging. For comparison: SOC curve (blue) of the new battery.
Batteries 08 00086 g005
Figure 6. Application of the intersection method to measurements on a lithium iron phosphate battery: (a) Variation of current: discharge characteristics (above) and change of voltage window based on differential capacity and its reciprocal (below). ΔU is the ‘safe’ voltage window and a measure of the battery’s internal resistance. (b) Variation of temperature during charging (above) and discharging (below) the battery. The scatter at small currents is a consequence of the used measurement technique.
Batteries 08 00086 g006
Figure 7. Test of the method with highly noisy data. Complete charge –discharge curves of different lithium-ion cell chemistries. (a,b) State-of-charge (SOC = Q/Q0) versus cell voltage U. (c) Differential capacity dSOC/dU as measured without smoothing. (d) Differential capacity dSOC/dU with smoothing by moving average over 13 data points. (e) Intersection method for the charge curves: differential capacity dQ/dU (“IC”, dashed), incremental voltage (“DV”, solid). (f) Intersection method for the discharge curves.
Batteries 08 00086 g007
Figure 8. Application of the intersection method (this paper) to synthetic data from [26] for lithium iron phosphate chemistry. Here: loss of lithium-ion inventory (LLI) with constant loss of active material at the positive electrode (LAMPE) and the negative electrode (LAMNE). (a) Example curve “new” at the beginning of lithium loss, (b) “old” at 50% lithium loss versus the absolute state-of-charge with respect to the initial system (here: normalized capacity). The unit of S is V−1, the unit of 1/S is V. (c) Change of voltage window during aging: U1 and U2 are the lower and the upper intersection points at S = 1/S = 1. (d) Intersection criterion for all states of lithium loss between 0% and 70%.
Batteries 08 00086 g008
Table 1. Lithium-ion batteries in this study according to the manufacturers’ data sheets.
ChemistryCellRatedMax./Min.CapacityAllowed Current (A)
VoltageVoltage U (V)Q (Ah)ChargeDischarge
1LFPLithiumWerks ANR26650M1B (LiFePO4)3.33.6 … 2.02.610 (4 C)50 (20 C)
2NMCLG ICR18650HE2 3.654.2 … 2.02.5420
3LCOSanyo/Panasonic UR18650FK, Li1-xCoO23.74.2 … 2.52.32.34.8
4NCASONY US18650VTC63.654.2 … 2.03.0520
Table 2. Intersection criterion for lithium-ion batteries at the beginning of life and end of life: Cell voltage U, state-of-charge (SOC = Q/Q0 in %) and available electric charge Q (Q0 = capacity at full charge) at the upper and lower intersection: dQ/dU = dU/dQ ≈ 1.
Battery and Cell ChemistryState-of-Health: Capacity Q0 and Electrolyte ResistanceCharge WindowDischarge Window
VSOCmAhVSOCmAh
LFPLithiumWerksNew #0 2.5 Ah, 5.3 mΩ 3.45 … 3.2598 … 7.62493 … 1923.29 … 3.1098 … 7.62356 … 43
See Figure 1Good #74 2.5 Ah, 5.0 mΩ 3.46 … 3.2498 … 7.52497 … 1923.30 … 3.1198 … 7.62365 … 40
Bad #32 2.5 Ah, 6.4 mΩ 3.45 … 3.2598 … 7.72463 … 1923.30 … 3.1098 … 7.72329 … 45
Aged #3 2.0 Ah3.47 … 3.2898 … 8.92088 … 1893.25 … 3.0698 … 9.21957 … 42
NCMLGSee Figure 2New 2.2 Ah4.2 … 3.46100 … 7.52170 … 1644.11 …3.35 99.6 … 141871 … 9
DoD 20 1.9 Ah (0.3 A)4.2 … 3.49100 … 7.61908 … 145 4.07 …3.36 99.4 … 121674 … 11
DoD 100 1.6 Ah (0.3 A)4.2 … 3.55100 … 111590 … 1764.00 …3.35 98.5 … 151365 … 24
NCASonyNew 3.1 Ah, 31 mΩ 4.15 … 3.0599.9 … 7.02850 … 0
See Figure 3DoD 20 2.3 Ah, 74 mΩ 4.21 … 3.43100 … 6.52268 … 1484.04 … 3.3199.5 … 16 1921 … 10
See Figure 4DoD 100 1.7 Ah, 70 mΩ 4.13 … 3.4792 … 8.11607 … 1423.97 … 3.3698.7 … 19 1415 … 23
LCOPanasonicNew #8 2.26 Ah4.09 … 3.7386 … 5.31942 … 1204.09 … 3.5899.2 … 5.32128… 18
DoD 20 #4 2.21 Ah4.21 … 3.70100 … 4.82200 … 1064.11 … 3.5699.5 … 9.2 1702 … 9
DoD 100 #6 2.26 Ah4.21 … 3.7399 … 5.22237… 1184.09 … 3.7594.8 … 1.3 2152 … 29
Publisher’s Note: MDPI stays neutral with regard to jurisdictional claims in published maps and institutional affiliations.

