Article

On the Road to Sustainable Energy Storage Technologies: Synthesis of Anodes for Na-Ion Batteries from Biowaste

by
Nekane Nieto
1,
Olatz Noya
2,
Amaia Iturrondobeitia
1,
Paula Sanchez-Fontecoba
1,
Usue Pérez-López
3,
Verónica Palomares
1,4,
Alexander Lopez-Urionabarrenechea
2,* and
Teófilo Rojo
1
1
Organic and Inorganic Chemistry Department, Science and Technology Faculty, University of the Basque Country UPV/EHU, 48080 Bilbao, Spain
2
Chemical and Environmental Engineering Department, University of the Basque Country UPV/EHU, 48013 Bilbao, Spain
3
Plant Biology and Ecology Department, Science and Technology Faculty, University of the Basque Country UPV/EHU, 48080 Bilbao, Spain
4
BCMaterials—Basque Center for Materials, Applications and Nanostructures, UPV/EHU Science Park, 48940 Leioa, Spain
*
Author to whom correspondence should be addressed.
Batteries 2022, 8(4), 28; https://doi.org/10.3390/batteries8040028
Submission received: 14 January 2022 / Revised: 3 March 2022 / Accepted: 16 March 2022 / Published: 22 March 2022

Abstract

:
Hard carbon is one of the most promising anode materials for sodium-ion batteries. In this work, new types of biomass-derived hard carbons were obtained through pyrolysis of different kinds of agro-industrial biowaste (corncob, apple pomace, olive mill solid waste, defatted grape seed and dried grape skin). Furthermore, the influence of pretreating the biowaste samples by hydrothermal carbonization and acid hydrolysis was also studied. Except for the olive mill solid waste, discharge capacities typical of biowaste-derived hard carbons were obtained in every case (≈300 mAh·g−1 at C/15). Furthermore, it seems that hydrothermal carbonization could improve the discharge capacity of biowaste samples derived from different nature at high cycling rates, which are the closest conditions to real applications.

Graphical Abstract

1. Introduction

The European Green Deal is the strategy of the European Union (UE) to make Europe climate neutral to 2050 and, at the same time, a world leader in climate issues. This plan is based on four main pillars: industrial innovation, bioeconomy, energy innovation and circular economy [1]. In short, there is an urgent need to use innovation to change the current status quo into a scenario where: (1) biological raw materials are used as a source of products and energy, (2) energy comes from renewable energy sources that are climate-neutral, and (3) waste is reintroduced into the economy in the form of secondary raw materials. On the road to innovation in renewable energy, it is necessary to advance in electrochemical energy storage technologies, with the aim of overcoming the limitations of intermittent production of solar, wind or wave energy. Innovation in this field currently requires the design of sustainable batteries that, among other aspects, are not based on critical materials such as lithium or that incorporate materials fabricated from biological feedstock [2].
For the past few years, sodium-ion batteries (SIBs) have received increased attention as an alternative to lithium-ion batteries (LIBs) for stationary energy storage, due to the fact that sodium and lithium have similar chemical properties, such as the intercalation chemistry and, contrary to the case of lithium, there are abundant reserves of sodium on earth [3,4,5]. Even if fundamental principles of SIBs and LIBs are almost the same, Na-ion batteries usually exhibit lower specific capacities, shorter cycle life and poorer rate capabilities, because of the higher mass and radius of Na (22.99 g·mol−1; 1.02 Å) when compared to those of Li (6.94 g·mol−1; 0.76 Å) [6]. Different kind of materials and mainly layered oxides, polyanionic and Prussian Blue systems have been studied as cathodes for SIBs [7,8,9,10].
Regarding anode materials many promising non-carbonaceous (e.g., Ti-, Ge- and P-based compounds) [11,12,13,14,15,16] and carbonaceous materials such as carbon black, hard carbon, carbon spheres, hollow carbon nanowires, carbon nanofibers, carbon nanotubes, graphite and graphene have been tested for SIBs [17,18,19,20]. The carbonaceous materials must facilitate the intercalation/deintercalation of Na+ and accelerate the kinetics, but most of them suffer from low reversible capacity and severe volume expansion during the electrochemical reaction process. However, hard carbon presents outstanding electrochemical features, such as considerable reversible specific capacity and excellent electrical conductivity, being today the most promising anode material [21,22].
Hard carbon is normally obtained from pyrolysis of organic precursors at temperatures above 1000 °C and heating rates between 1–10 °C min−1 under inert atmospheres [23]. The organic nature of the hard carbon precursors gives the opportunity to incorporate biological raw materials in the fabrication of battery components; in fact, the use of bio-based precursors is a common approach when preparing hard carbons for SIBs [24]. Mainly, two groups of bio-precursors can be distinguished: on the one hand, reagent grade bio-chemicals, such as sucrose, glucose, cellulose and lignin [25,26,27,28]. On the other hand, biowaste coming from forestry and agricultural activities [29,30,31,32,33]. In general, anodes synthetized from reagent grade bio-chemicals show better electrochemical performance compared to those obtained from biowaste. However, taking into account that the use of sugars as raw materials for non-alimentary purposes is controversial and that the utilization of biowaste for manufacturing bio-products is at the core of the bioeconomy and the circular economy, it is worth paying particular attention to production of hard carbons from biowaste.
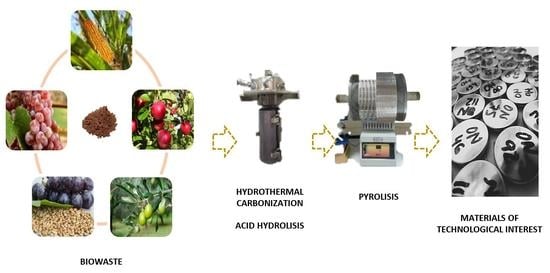
With the objective of overcoming the lower electrochemical performance of hard carbons obtained from direct pyrolysis of biowaste, this work evaluates the effect of acid hydrolysis (AH) and hydrothermal carbonization (HTC) as pretreatment steps for biowaste prior to pyrolysis. Acid hydrolysis, both in dilute and concentrated forms, is a conventional process to convert cellulose and hemicellulose into fermentable sugars, normally as a previous step to bioethanol production via fermentation [34,35]. On the other hand, HTC is a carbonization process happening in the reaction between biomass and water under mild conditions (180–280 °C, 1–72 h, autogenous pressure 2–6 MPa), normally focused on producing a carbonaceous substance (hydrochar) to be used as solid fuel, activated carbon precursor or soil amendment [36,37]. In the end, HTC is also a hydrolysis process caused by the action of temperature and the weak acid nature of water [38], with the advantage of being a water-based environmentally friendly strategy [39,40]. These two processes partially dissolve hemicellulose and cellulose, converting the initial biowaste into a lignin-rich biomass. Considering that lignin is one of the most used biomaterial as precursor for hard carbons due to its high crosslinking and non-crystalline biopolymer [41], the approach of this work is to integrate both pretreatments in the synthesis route of hard carbons from biowaste, which could be connected with better electrochemical performance.

2. Results and Discussion

2.1. Characterization of Biowaste Samples

The different biowaste materials were first subjected to proximate, elemental and constituent analysis in order to observe the differences in composition among them. Table 1 gathers the results obtained from these analyses, where glucans are mainly representative of cellulose (but include also starch) and xylans-arabinans represent hemicellulose.
Regarding the tentative analysis, all samples are mainly composed of volatile matter (59–74 wt.%) and fixed carbon (16–25 wt.%), with lower values of moisture (6–14 wt.%) and ash (2–9 wt.%). Considering that the objective is to produce a carbonized product, the ideal sample would be one with a high fixed carbon content (so that the yield to carbonized product is high) and low ash content (so that the carbonized product does not present a relevant quantity of inorganic substances which would influence the electrochemical performance). In this sense, a priori, it could be said that the two samples of biowaste from wine production (GSEED and GSKIN) would be the most favorable ones for a possible industrial use of these precursors. Elemental analysis exhibits the usual composition in biowaste materials, mostly composed by carbon and oxygen, and with very low quantities of sulphur and nitrogen [42].
Subsequent elemental analysis of corn cob and olive mill solid waste derived carbons is displayed in Table 2. It can be seen that the carbon percentage in both pyrolysed and HTC pretreated samples (CORN_1200, CORN_HTC_1200, OLI_1200 and OLI_HTC_1200) is similar. On the other hand, samples subjected to a previous acid digestion (CORN_PHOS_HTC_1200 and OLI_PHOS_HTC_1200) show lower C weight percentages. This can be related to higher amounts of inorganic impurities in the samples or to the presence of a higher content in volatile compounds in the final carbon sample compared to the directly pyrolyzed or only pretreated by HTC.
At last, it can be said that the bio-precursors chosen for this study are different enough regarding constituents’ composition, which could lead to present diverse behavior when subjected to the different treatment and pretreatments described above. The results of the study of fixed carbon, ashes, glucans (cellulose and starch), hemicellulose (xylans and arabinans) and lignin are described in Figure 1. As it can be seen, the amount of fixed carbon is comparable between each biomass. Nevertheless, in the case of ashes, a huge different quantity is noticed between OLI (8.80 wt.%) and the other samples (<4.10 wt.%). Glucans percentages of the samples seem to be heterogeneous and CORN shows the highest content (33.2 wt.%), probably due to the presence of starch, followed by APP (15.5 wt.%). Notwithstanding, the content of hemicellulose is homogeneous, CORN with the highest hemicellulose content (29.6 wt.%) is far from the second one, GSEED (13.5 wt.%). Concerning lignin, the grape-derived materials show the highest values (56.5 wt.% GSEED and 45.2 wt.% GSKIN) followed by OLI (26.4 wt.%), while CORN (11.5 wt.%) and APP (10.3 wt.%) present quite lower lignin quantity.

2.2. Characterization of Hard Carbons

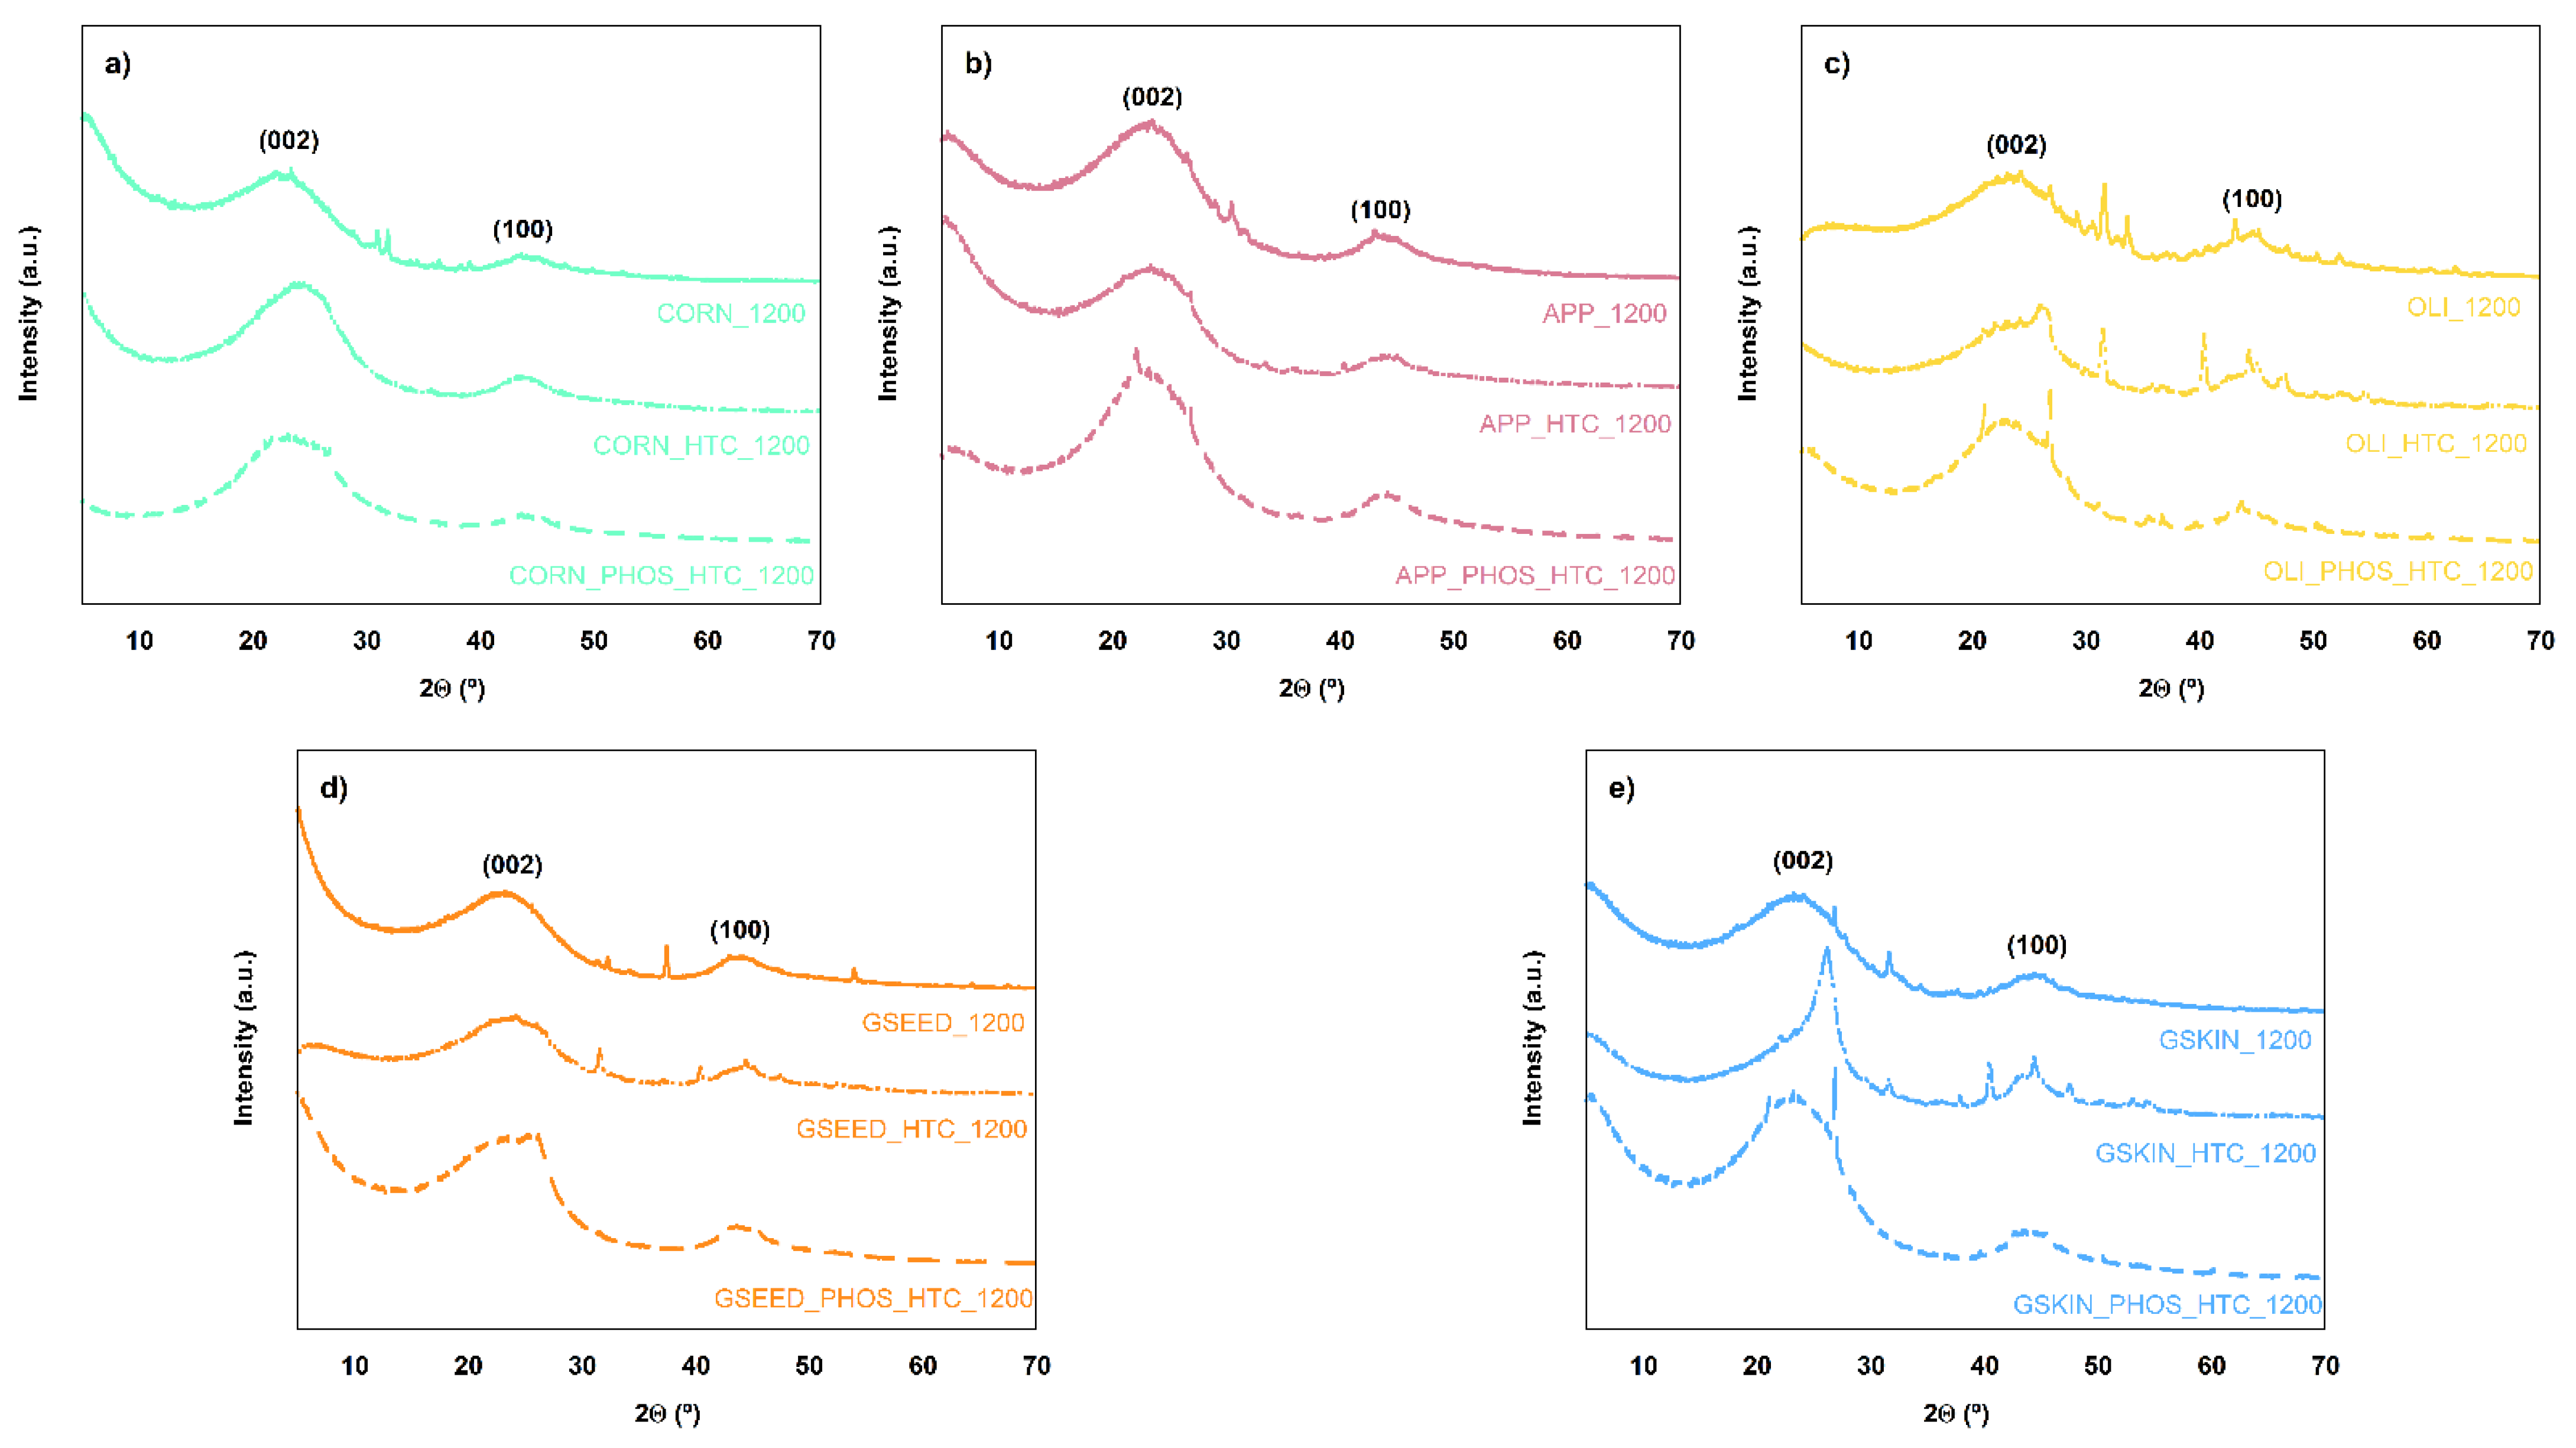
Figure 2 shows the diffraction patterns of the produced carbons. XRD is usually used in hard carbons to obtain information about the interlayer spacing between graphene sheets, which is determined based on the position of (002) and (100) diffraction peaks at 20–26° and 43–44°, respectively. This case, all X-ray diffraction diagrams present this typical wide diffraction maxima (002) and (100), which is attributed to the disordered structure of the of hard carbons [43]. This indicates that all samples have a turbostratic structure, which implies that the building blocks of the carbon samples are composed of graphite-like microcrystallites that are randomly oriented and distributed throughout the samples.
Apart from these two main peaks, other diffraction peaks are also observed in the diffractograms, probably due to the presence of impurities related to the use of real biowaste as starting material. In this sense, two groups of samples can be distinguished in Figure 2: those with a low quantity of impurities and those with a higher amount of them. In the first group, there are CORN, APP and GSEED (Figure 2a,b,d, respectively). In these cases, the use of HTC and AH + HTC pretreatments reduces the impurities compared to the materials obtained by direct pyrolysis. On the other hand, in OLI and GSKIN carbons (Figure 2c,e, respectively) it seems that the impurities decrease with the combined pretreatment AH + HTC, but, on the contrary, they increased with only an HTC pretreatment. These impurities have been related to inorganic compounds, that have been identified as: CaO, MgO, SiO2, Ca(OH)2, NaNO3, K2O and Ca2SiO4 (Powder Diffraction File 01-075-0264. 01-077-2364, 01-083-2468, 01-076-0570, 01-072-0026, 00-027-0431 and 00-029-0369, respectively) [44]. Such substances are consistent with the typical chemical species present in biomass, for example, those coming from the presence of Ca2+, Mg2+ or Na+ salts in the plant [45]. Regarding the lower carbon content registered in elemental analysis of PHOS_HTC_1200 samples for corn cob and olive mill solid waste, X-ray diffractograms indicate that the amount of inorganic crystalline impurities is the lowest in each set of samples. Thus, the cause of the decreased weight carbon content in PHOS_HTC_1200 samples must be attributed to the significant presence of volatile C-based compounds.
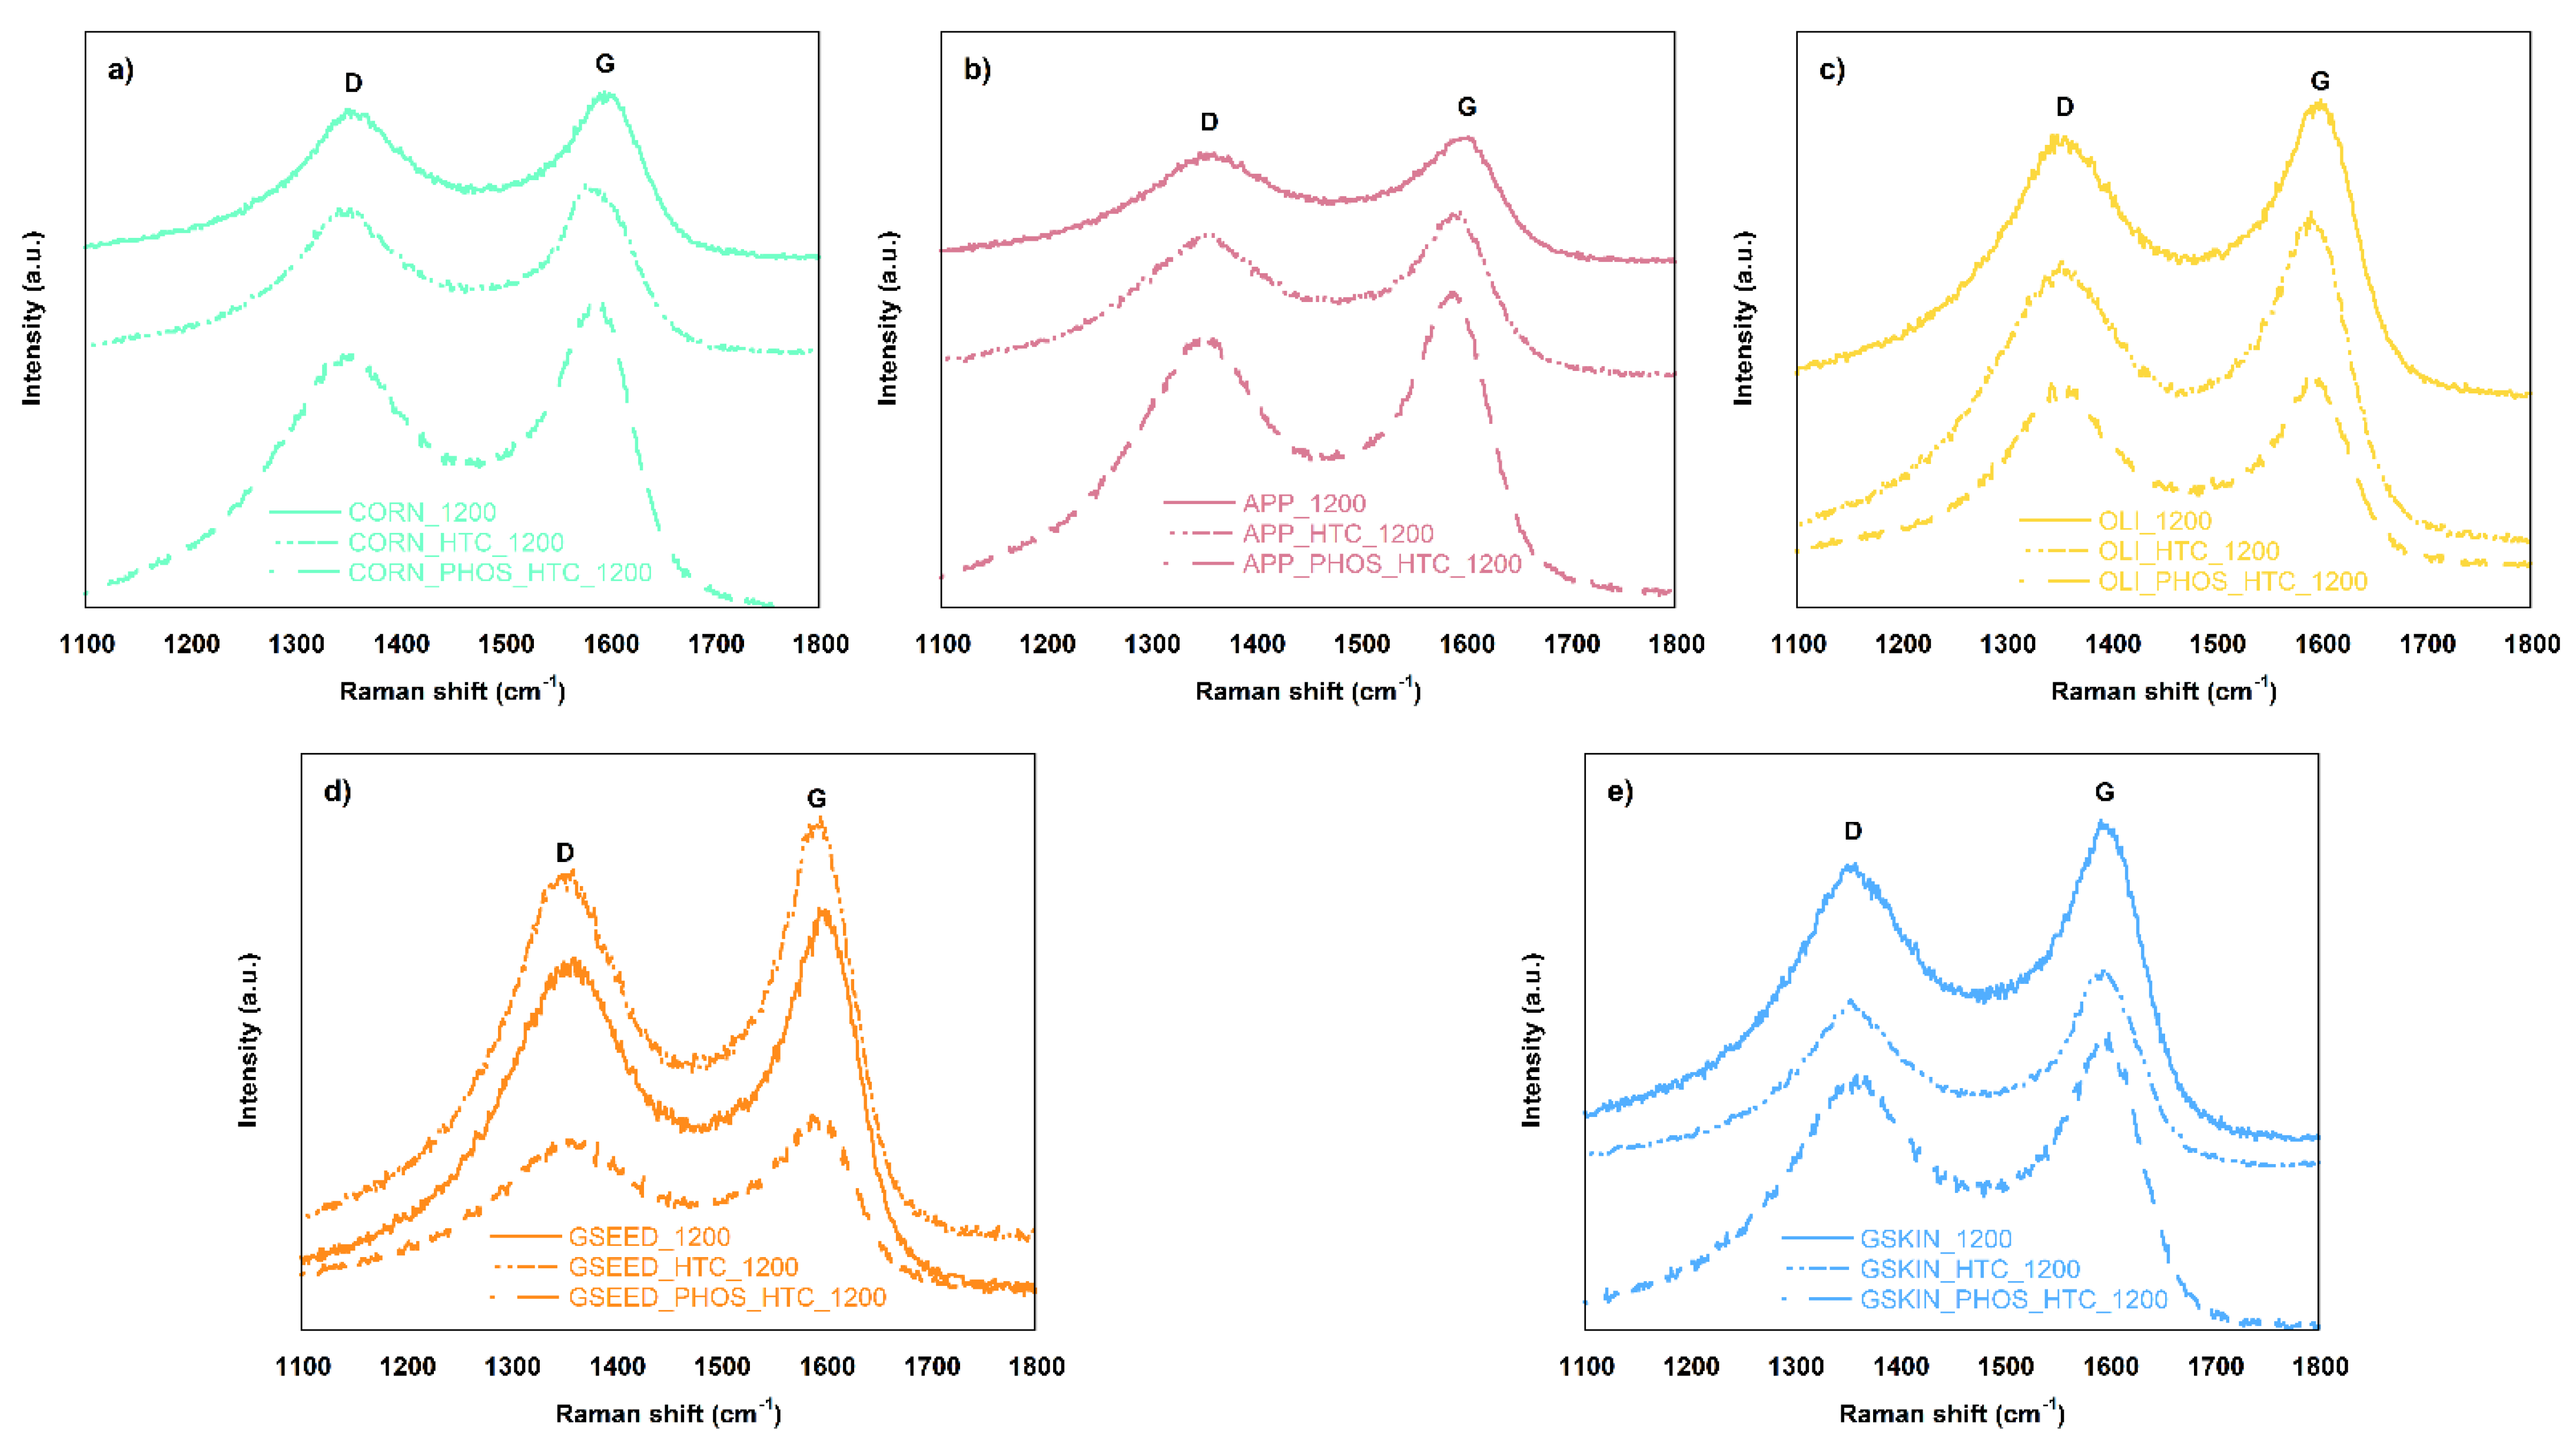
Figure 3 depicts the Raman spectra of the carbon materials obtained from biowaste. As it can be observed, all samples show the typical D (1300–1360 cm−1) and G (1580–1600 cm−1) bands of disordered carbons. D band is associated with the vibrational mode of microcrystalline graphite, which is only Raman-active in the presence of structural defects in graphene planes. On the other hand, G band is linked to stacked graphene sheets defects. This way, the fitting of the Raman spectra allows calculating the ratio between D and G band areas (AD/AG), which can be an indicator of the ordering degree of the carbon structure in the samples [43].
Table 3 shows the main parameters calculated from the information obtained from XRD and Raman characterization techniques. These are structural parameters show the interlayer spacing (d002 and d100) and microcrystallite dimensions, stack height (Lc), stack width (La), the number of stacked graphene sheets (N) and the ratio between D and G Raman-band areas (AD/AG). The calculations were determined using Bragg and Scherrer formulas, which rely on the wavelength of the diffractometer (λ), the diffraction angle (2θ) and the full width at half maximum (FWHM), which is the width of the band at half. Therefore, if (002) diffraction angle increases the d002 decreases. The same occurs to FWHM; when this parameter increases, Lc and La decrease. [46,47,48].
The interlayer spacing between the graphene sheets (d002) is highly important, given that with the increase of this parameter, the space between the sheets also increases and it is easiest for the sodium-ion insertion in the material, probably leading to a better electrochemical performance. In general, it can be said that all the obtained carbons present d002 values equal or higher than 3.44 Å that, together with N values smaller than 500, are typical values for hard carbons [49]. Table 3 shows that HTC pretreatment does not increase the space between the sheets in any case and sometimes produces a significant reduction, as in the case of CORN and especially GSKIN. The explanation for such a reduction could lie on the fact that sample GSKIN_HTC_1200 shows higher (002) diffraction angle (2θ) than the other materials and, at the same time, much smaller FWHM (see Figure 2). This leads to decrease d002 to 3.50, compared to 3.80–3.90 values for the other materials, with the corresponding increase in N up to 10 stacked graphene sheets. This would suggest that the pretreatment of HTC combined with a pyrolysis in GSKIN induce a slightly higher ordering of the material compared to the other samples.
In contrast, pretreatment with AH + HTC increases d002 obtained with only HTC in all cases. In the case of APP, OLI and GSKIN samples these d002 are greater than those obtained with direct pyrolysis. On the contrary, it seems that the route to acquire carbon materials with higher interlayer spacing in the case of CORN and GSEED is direct pyrolysis, without the use of any kind of pretreatment, nor AH, neither HTC.
The ratios between D and G Raman-band areas (AD/AG) are also shown in Table 3. As different spectra were taken in several zones of the analyzed materials, two area ratio values are presented for each material (AD/AG 01 and AD/AG 02), in order to use them as indicators for the degree of homogeneity of the produced carbons. As it can be seen in Table 3, only five out of twelve samples present some degree of homogeneity (CORN_1200, APP_PHOS_HTC_1200, GSEED_1200, GSKIN_HTC_1200 and GSKIN_PHOS_HTC_1200), while the other carbons show clear signs of heterogeneity. Therefore, when analyzing the influence of the different pretreatments on the resulting carbons, the uncertainty caused by heterogeneity must be taken into account. Furthermore, in order to lead the discussion, it should be mentioned that the typical AD/AG values for hard carbons are around 2.65–2.70 [49].
It should be noted that only 3 samples show uniformity in the influence of pretreatments among the different areas analyzed (AD/AG 01 and AD/AG 02); these are OLI, GSEED and GSKIN. In the case of OLI and GSEED, it appears that the two pretreatments (HTC and AH + HTC) improve the ratio AD/AG in the different areas. As a consequence, the GSEED_PHOS_HTC_1200 carbon clearly enhances the ratio of those measured after only pyrolysis or after HTC + pyrolysis, reaching the typical values of hard carbons (2.71). On the contrary, HTC carbons present smaller ratio compared to the only pyrolyzed carbons for GSKIN, but this is clearly increased after AH + HTC (2.91). Therefore, it can be concluded that the number of defects in the materials increases notably when using AH combined with HTC pretreatment with GSEED and GSKIN samples. On the contrary, no rigorous conclusions can be drawn from this parameter for the CORN and APP samples, since, depending on the area analyzed, opposing effects can be observed.
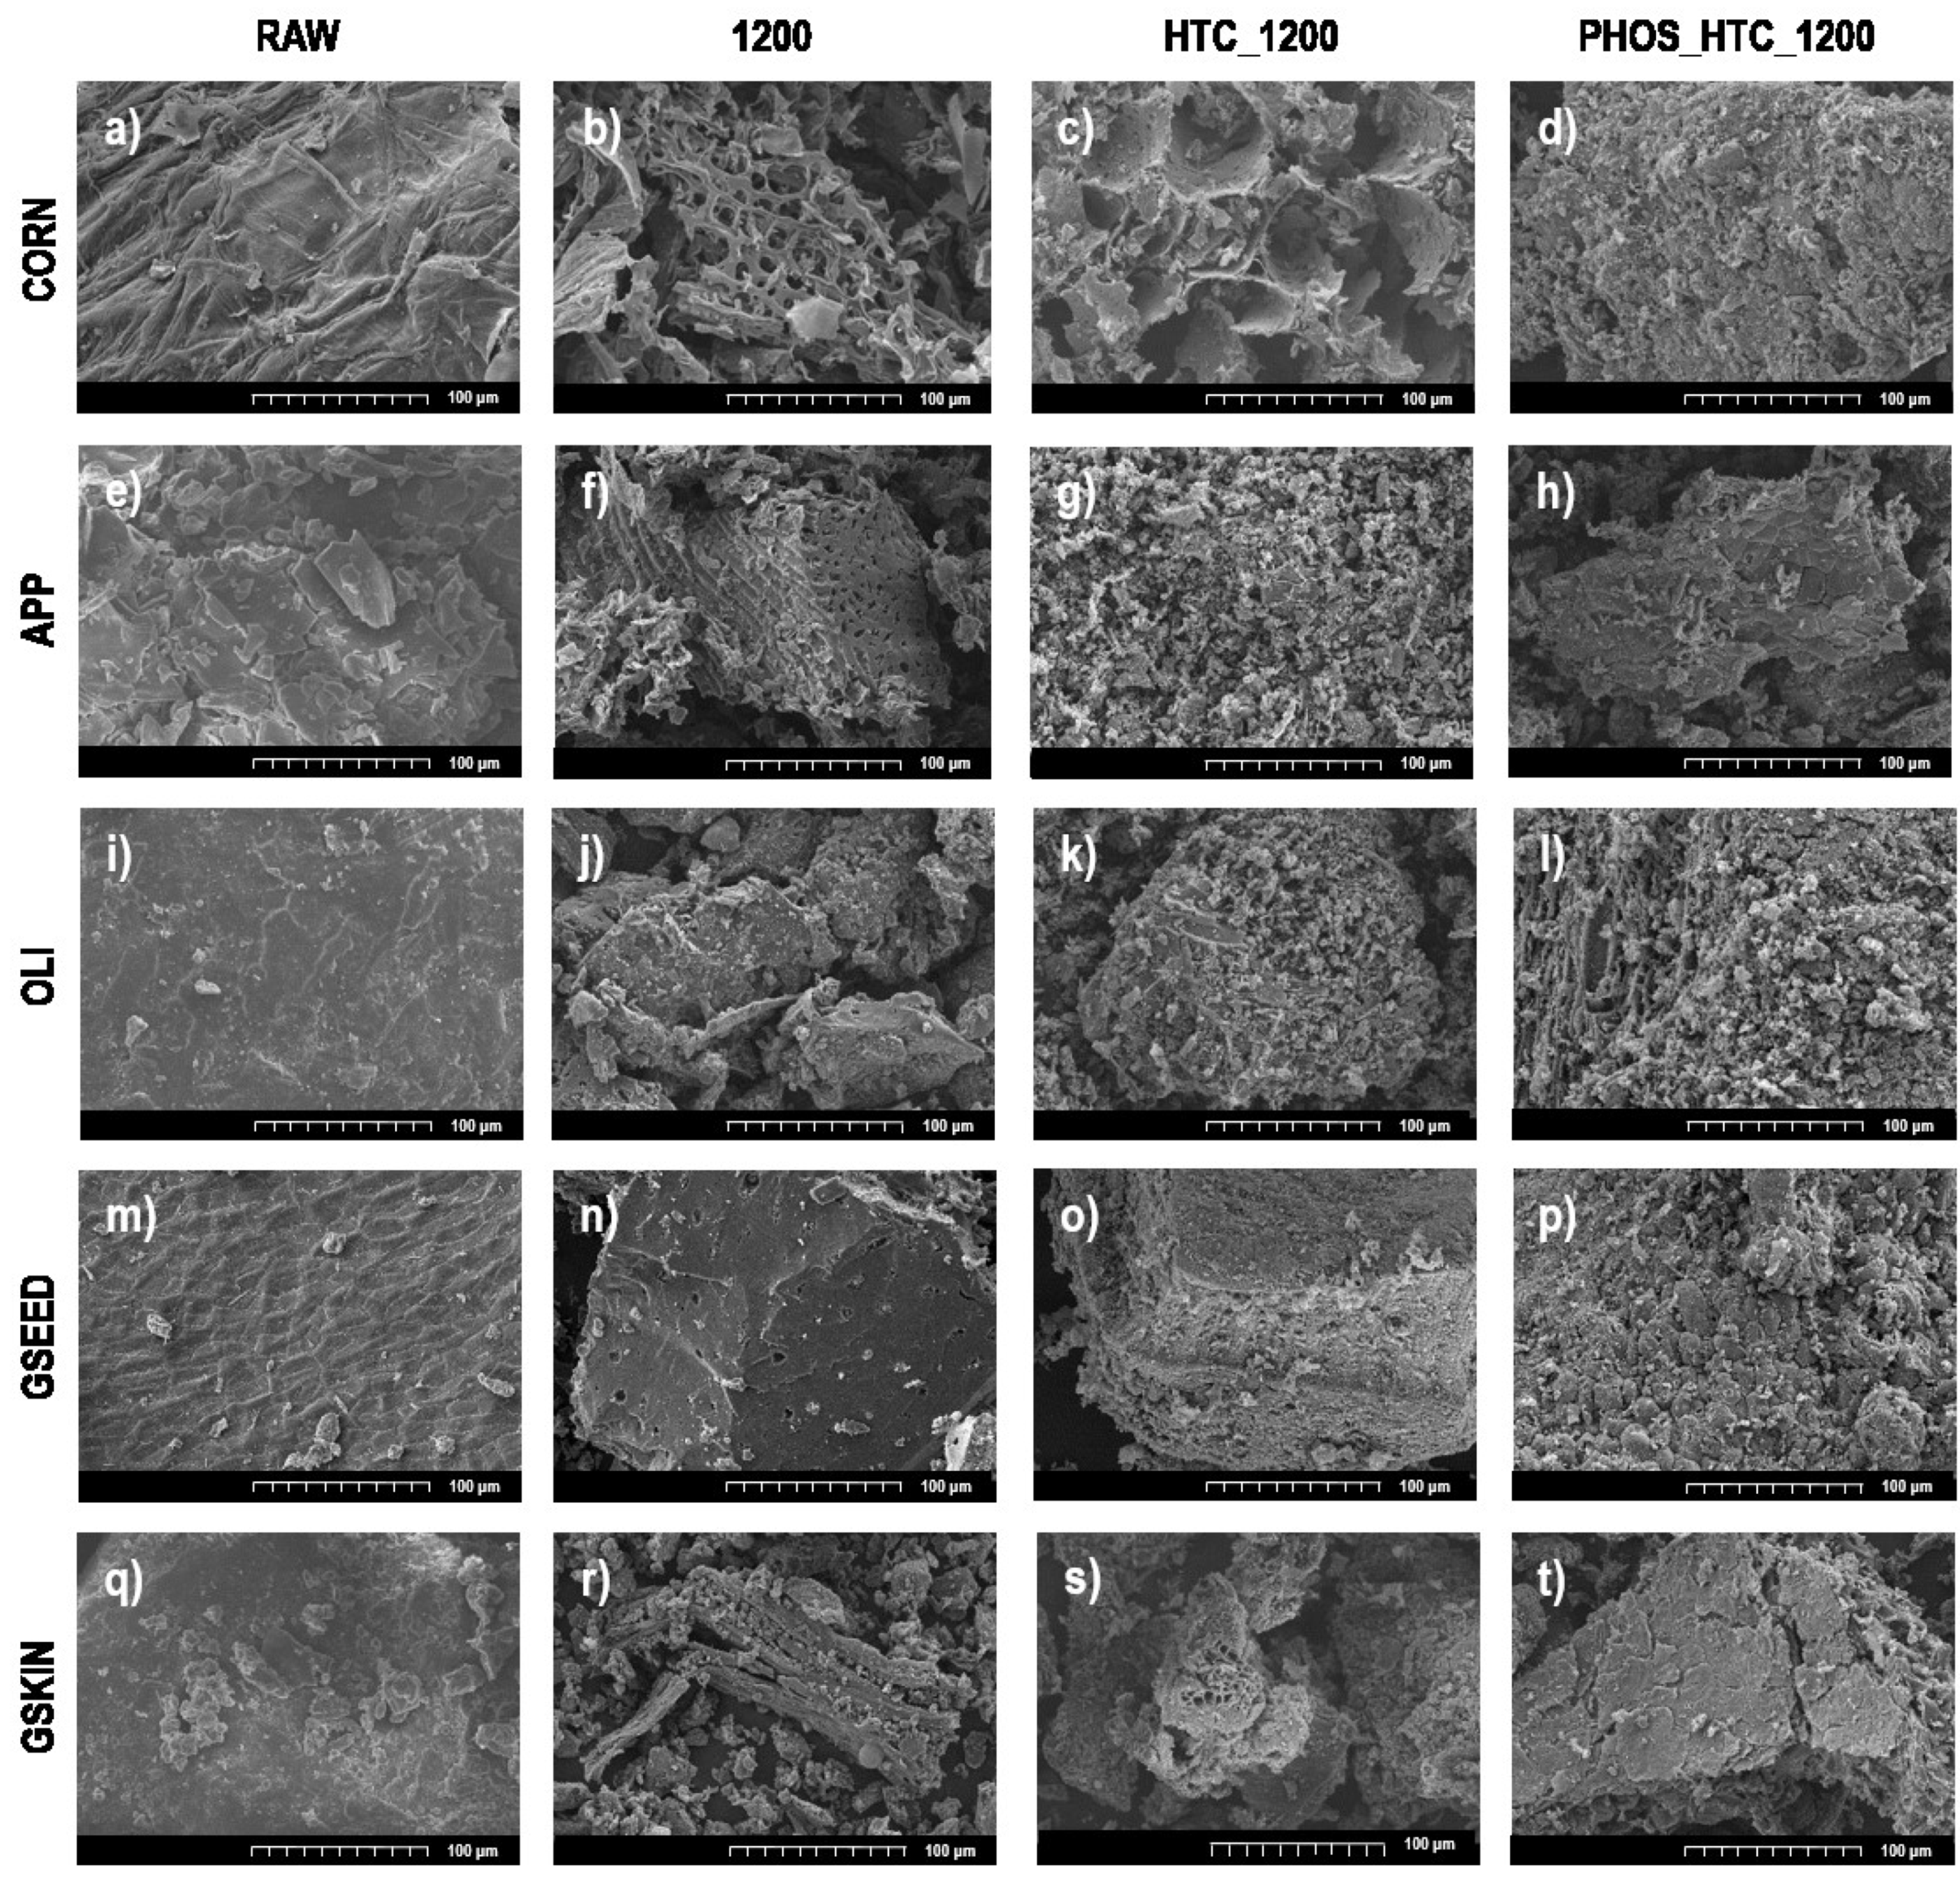
SEM micrographs of the raw precursors and the prepared carbons are shown in Figure 4. In the case of CORN, OLI and GSEED, it can be observed that after a pyrolysis step (Figure 4b,j,n, respectively) the integrity of the biostructure they come from (Figure 4a,i,m, respectively) is slightly broken in some points, which allows seeing the internal arrangement of the material. In CORN_1200 it can be appreciated the cell form morphology inside the material with pores of about 8–10 μm size. OLI_1200 and GSEED_1200 show a degraded structure consisting of 100–150 μm wrinkled aggregates (OLI_1200), and >200 μm lumps with pores smaller than 10 microns in them (GSEED_1200). Nevertheless, HTC pretreatment on these three precursors shows deteriorated structures (Figure 4c,k,o, respectively) and, in the case of AH with subsequent HTC, highly deteriorated structure without any chance of distinguish the initial morphology of each precursor (Figure 4d,l,p, respectively).
On the other hand, APP_1200 also exhibits broken aggregates larger than 100 μm with small pores in them after direct pyrolysis (Figure 4f). However, the only use of HTC leads to complete disaggregation of the material, which is reduced to particles smaller than 10 μm (Figure 4g). Then, the combination of AH and HTC on APP precursor (APP_PHOS_HTC_1200) cause higher level of biostructure destruction (Figure 4h). Finally, GSKIN presents the highest degree of biostructure damage after pyrolysis (Figure 4r) compared to the materials subjected to HTC pretreatment (Figure 4s) and to combined AH and HTC pretreatment (Figure 4t). Biowaste hard carbons can preserve their natural porous structures derived from the plant vessels for water transfer, which is beneficial for Na+ adsorption and insertion. However, the use of different treatments, such as pyrolysis, hydrothermal carbonization and acid hydrolysis can lead to modify their initial microstructure, to form micropores and mesopores. In the case of hydrothermal process and also in acid digestion, crystalline inorganic impurities could be significantly removed, which can be linked to an increase in the pore formation. In summary, the morphological analysis of the prepared carbon samples indicates that the use of different pretreatments led to diverse morphologies and textures depending on the starting material.

2.3. Electrochemical Tests

Figure 5 shows the voltage profile of the first cycle of samples derived from corncob as representative of the whole set of samples (Figure 5a) and the first cycle and its subsequent cycles from CORN _1200 sample (Figure 5b).
Analysis of the voltage profile of CORN materials in the first discharge (Figure 5a) shows that all of them present the typical electrochemical signature of hard carbon vs. sodium metal: a slope region below 1 V vs. Na/Na+ followed by a plateau close to 0 V vs. Na/Na+ [50]. Figure 5b shows that the initial discharge capacity, that is, the specific capacity of each material in the first cycle, presents a larger curve than that of the subsequent cycles. This means that the specific capacity (Csp) in the first cycle is higher than in the following ones, due to the Na ion (Na+) insertion-adsorption and the formation of the Solid Electrolyte Interphase (SEI), that occurs always during the first discharge [51]. The formation of a stable SEI mitigates further parasitic reactions between the anode material and the electrolyte and allows an efficient reversible electrochemical cycling. However, the natural precipitation of a compact, stable and suitable passivation film depends on the complex interplay of many concurrent factors, such as the composition of the electrolyte or the surface chemistry of the hard carbon and its morphology [52].
This phenomenon happens for all the anodic materials as it can be seen in Table 4, where initial discharge capacities, together with the main parameters corresponding to the electrochemical performance of every material are shown.
The electrochemical performances reported in Table 4 present a wide range of values, which could be related to the precursor used and the effects of the pretreatments on it. However, the majority of values in Table 4 are higher than those reported in other works carried out with biowaste [53]. CORN and APP show quite high initial discharge capacities after direct pyrolysis (644.48 and 644.64 mAh·g−1, respectively). Then, these capacities worsen as samples are pretreated with HTC and AH + HTC. In the case of OLI and GSKIN, apart from showing lower initial discharge capacities (444.09 and 446.47 mAh·g−1, respectively), they behave quite different in relation to the two pretreatments. On the one hand, the initial capacity of OLI is slightly enhanced with HTC pretreatment, but significantly decreases when AH + HTC pretreatment is used. On the other hand, HTC pretreatment diminishes the initial capacity of GSKIN, but it is almost recovered when AH + HTC is applied in the pretreatment step. At last, GSEED is the only sample that clearly improves its capacity thanks to the use of the pretreatment stages, showing a slightly better performance with exclusive HTC pretreatment.
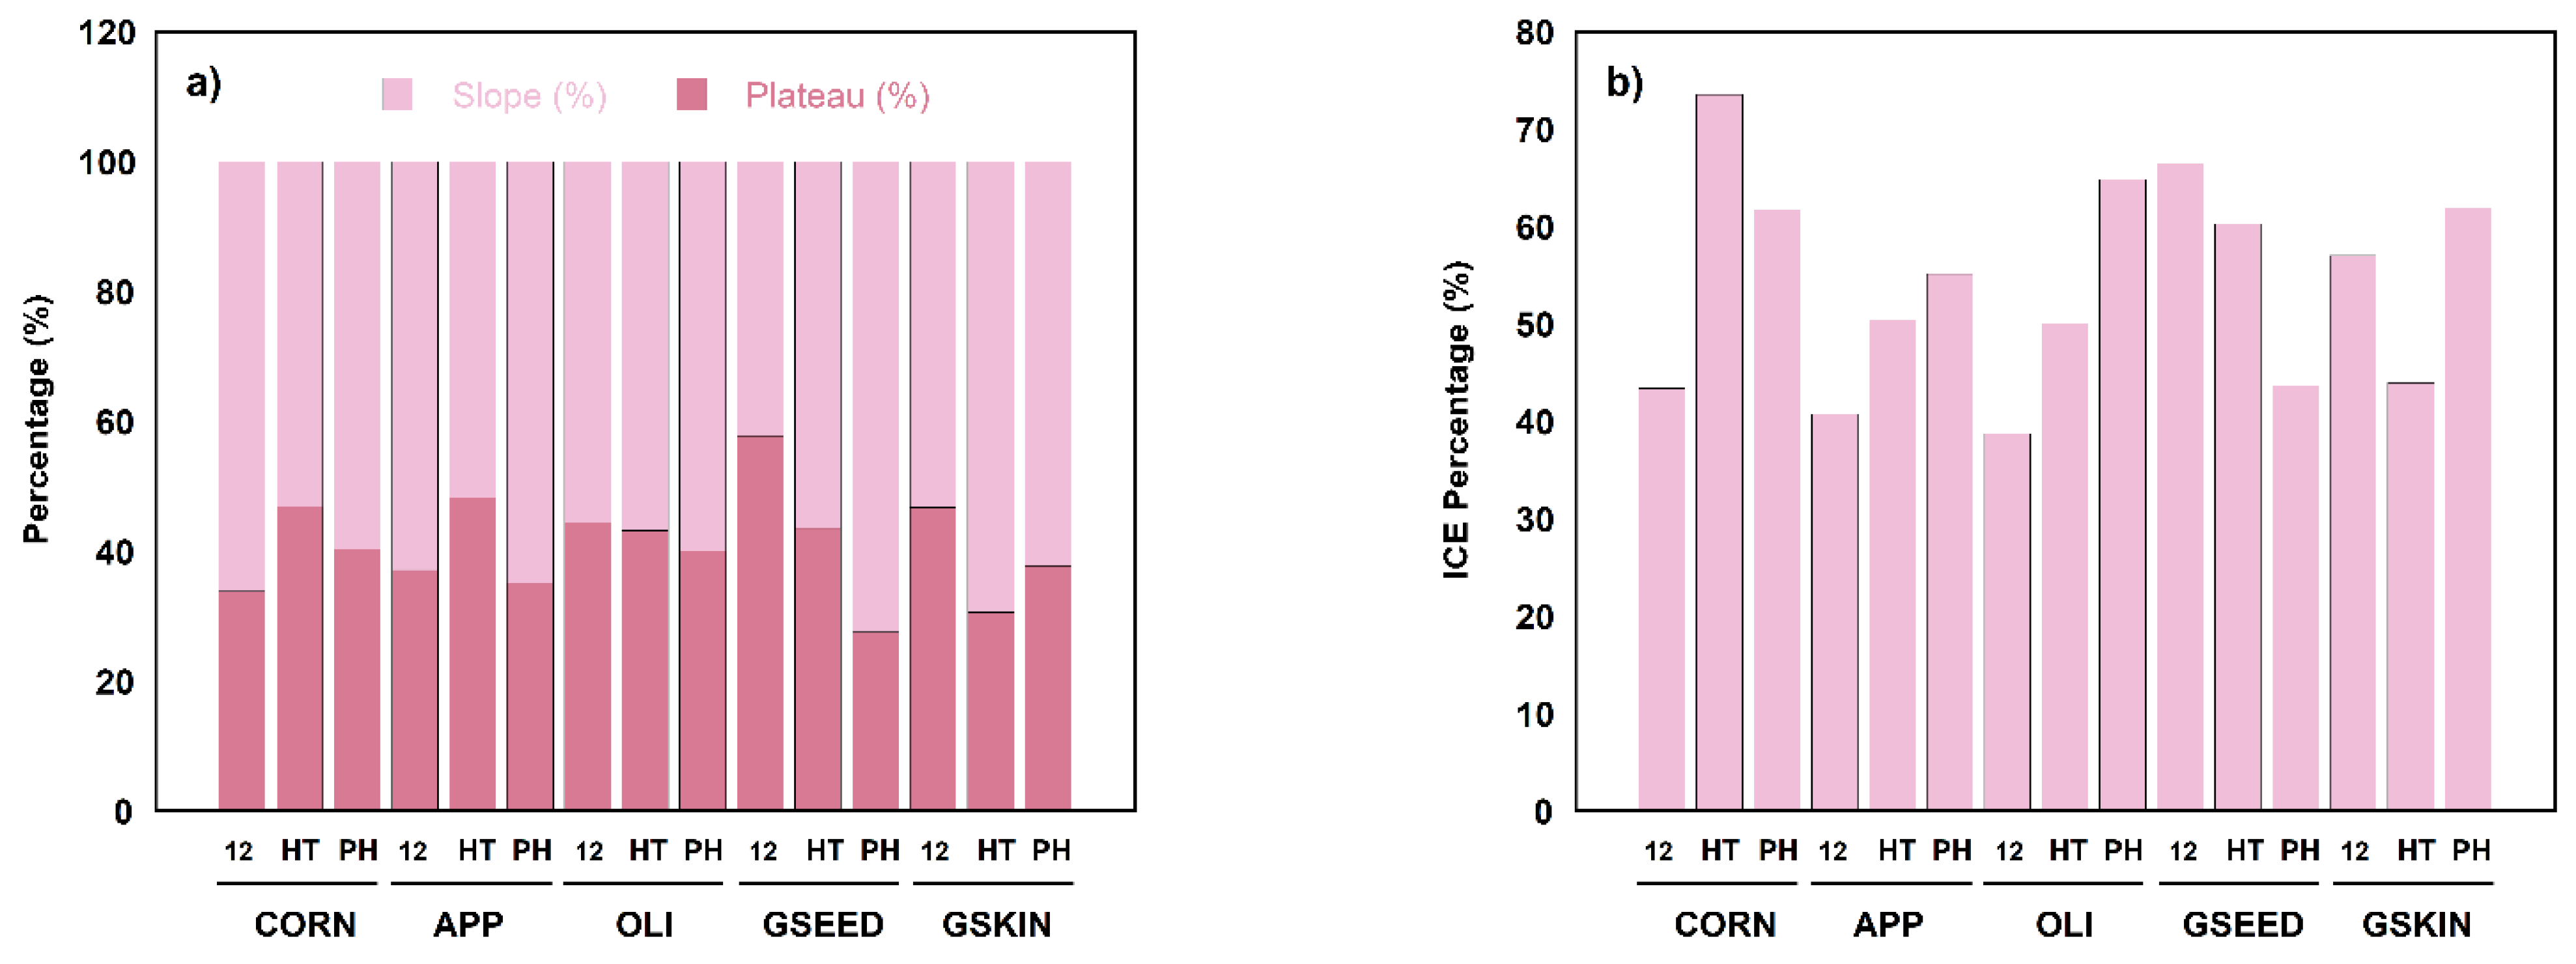
Moreover, Table 4 and Figure 6 present slope-plateau contribution to specific capacity for the first cycle (a) and Initial Coulombic Efficiency (ICE) (b) percentages for each sample. From Figure 6a, it can be observed that most of the samples have higher plateau proportion with direct pyrolysis (OLI, GSEED and GSKIN) or with HTC pretreatment (CORN and APP), but none of them with combined AH and HTC.
Analysis of the ICE (Figure 6b) indicates that the use of HTC pretreatment and the combined pretreatment with AH improves the ICE values compared to the pyrolytic ones, reaching at least 50% of ICE for most of the precursors (CORN, APP, OLI and GSKIN). However, GSEED and GSKIN do not show this trend and, in these cases, ICE values higher than 55% are only reached by using direct pyrolysis and HTC pretreatment (GSEED) and direct pyrolysis and the AH combined with HTC pretreatment (GSKIN). It must be remarked that, except GSEED, the use of HTC pretreatment with or without previous acid digestion causes an increase in the ICE, which is a parameter that must be maintained as high as possible in order to obtain carbon materials to be used as anodes in commercial Na-ion batteries. Thus, CORN_HTC_1200 presenting the highest ICE value among the tested samples (73.49%), would be the best behaving material in terms of Coulombic efficiency.
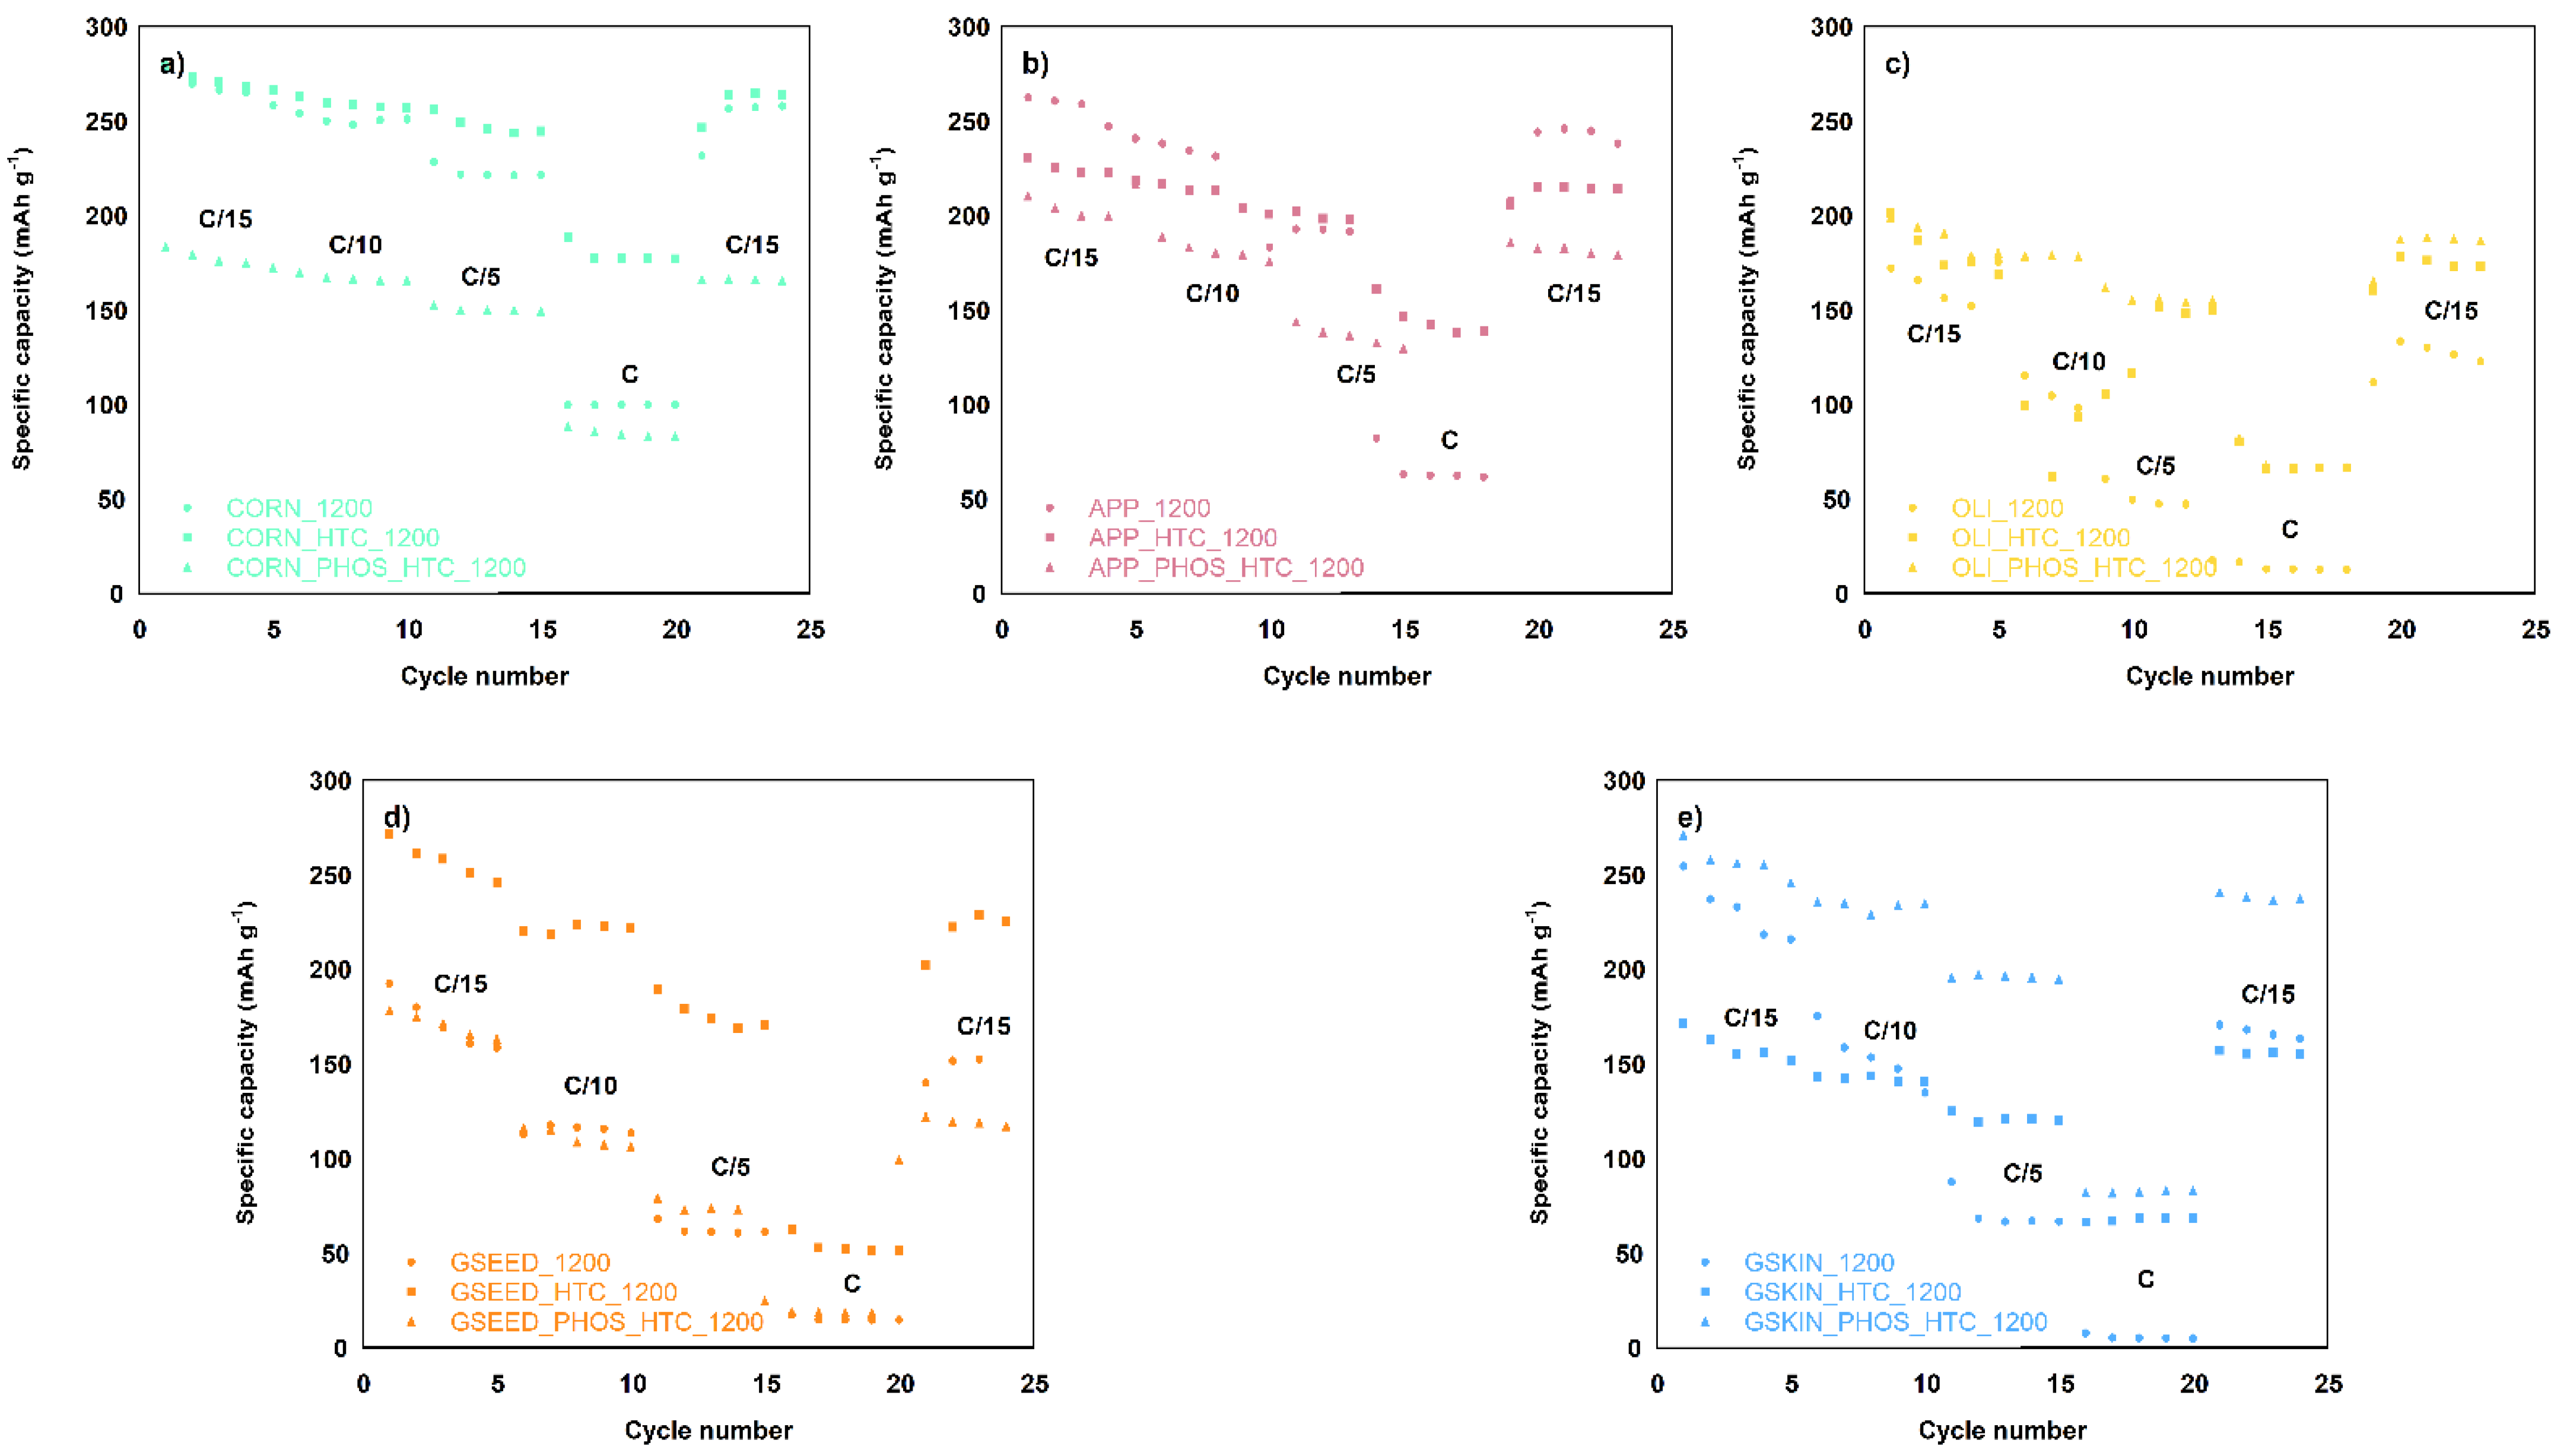
Figure 7 displays the discharge rate capability of each one of the carbonaceous materials prepared in this work, that is, the specific capacity (Csp) at different cycling speeds. Among the used cycling rates, C/15 and C/10 are considered moderate/low, whereas C is taken as high rate. A final set of 5 cycles at C/15 is carried out on every material in order to observe if the electroactive material recovers its initial Csp or has been degrade during continuous cycling at various rates. In all cases, it can be appreciated that the use of higher cycling rates induces a decrease in Csp, which is due to kinetic limitations of electrochemical reactions. On the other hand, Csp values in the range of the previous ones registered in the initial cycles at C/15 were observed, so it can be considered that there was no significant material degradation with cycling and the observed specific capacity values for each rate can be attributed only to the material performance.
In CORN samples (Figure 7a), the use of HTC pretreatment improves slightly the Csp, especially at high rates (56% at C-rate), whereas by using a previous AH no improvement in the electrochemical performance is observed. In the case of APP materials (Figure 7b), direct pyrolysis provides the best electrochemical results compared to the other synthesis routes, except at C-rate (high rate), where it can be observed a substantial improvement in the Csp of the HTC pretreated sample (44% at C-rate). Figure 7c shows the rate performance of OLI derived carbons, where it can be seen that the carbon sample with the best electrochemical results is the one pretreated with AH and HTC. Taking into account that OLI is a biowaste with a significant quantity of ash (8.8 wt.%), perhaps the dissolution of part of this inorganic content due to pretreatment with phosphoric acid has improved its electrochemical performance. In addition, HTC has been also previously reported as an effective strategy to remove inorganic impurities [54]. Despite the improvement observed with the pretreatments, this sample is the one with the worst electrochemical performance.
Finally, contrary to expected, GSEED and GSKIN (Figure 7d,e) do not show similar response to the different pretreatments. In the case of GSEED (Figure 7d), the use of HTC pretreatment enhances electrochemical performance at all rates compared to the other GSEED samples, this enhancement is of a 67% at C/15, 52% at C/10, 36% at C/5 and 28% at C-rate. In this sample the use of AH seems not to be necessary. In fact, the subsequent use of HTC after acid treatment does not produce a carbon with similar electrochemical performance to GSEED_HTC_1200. On the other hand, carbons obtained from GSKIN precursor (Figure 7e) show better results in the case of AH and HTC pretreated material.
The best specific capacities were obtained by using corn cob with a combined treatment of HTC + pyrolysis, probably due to the higher content of glucans (cellulose and starch) and hemicellulose (xylans and arabinans) in the precursor. CORN_HTC_1200 presents the best specific capacity value at high rates, that are considered closer to real charge/discharge conditions.
The comparison of cycling behavior of the synthesized materials with values reported in literature shows that the hard carbons prepared in this work are below the registered capacities obtained from reagent grade chemicals such as magnesium gluconate and glucose, which are close to 500 mAh·g−1 at C/15 [55]. However, the capacities reported for hard carbons coming from biowaste (≈300 mAh·g−1 at C/15) are in the range of those obtained in this work as it can be seen in Table 5. Additional characterizations (such as SAXS, BET surface area measurement and post-mortem analysis) are needed in the future to offer better insights.

3. Materials and Methods

3.1. Biowaste

Five types of biowaste related to agro-industrial activities with a high level of implementation in Spain were selected as bio-precursors for hard carbon production. (1) Corncob (CORN) coming from corn production and supplied by a local farmer; (2) apple pomace (APP) coming from cider production and supplied by an association that elaborates fresh cider in Basque Country (Bizkaiko Sagardoa); (3) olive mill solid waste (OLI) coming from olive oil production and supplied by an olive oil press located in Navarra (Hacienda Ortigosa); (4) deffated grape seed (GSEED) and (5) dried grape skin (GSKIN) coming from wine and subsequent liquor production and supplied by a distillery dedicated to the exploitation of the wine production waste (Agralco S.Coop.).
The quantity of biowaste generated in olive oil production in Spain is a big concern, since this country is the first world producer of olive oil (around 1.3 Mt/year) and, taking into account the low olive oil/olive ratio (0.2/1), the production of olive mill solid waste represents approximately 1.5 Mt/year [60]. Spain is also the second world producer of wine, which accounts up to 4.6 Mt of wine annually and the corresponding 1.26 Mt of winery derived biowaste [61]. On the other hand, corn is the fourth most produced cereal in Spain (the one with the highest production in the spring season), reaching 3.6 Mt in the 2018 harvest [62]. It is estimated that waste generated in corn production is 40% of the harvest, within which, cobs represent another 40% (0.6 Mt/year) [63]. At last, although cider does not reach the production levels mentioned above, apple pomace has been selected as a possible emerging waste given the increasing cider production observed in recent years [64]. The majority of the above-mentioned biowaste is nowadays used as solid fuel or raw material for composting. However, in order to expand the possibilities of bioeconomy, other alternatives of material recovery must be found.

3.2. Characterization Techniques

The chemical properties of the biowaste samples were determined by proximate analysis, elemental analysis and analysis of constituents. The proximate analysis was carried out in the LECO TGA-701 thermobalance, following the ASTM E871-82, ASTM E872-82 and ASTM E1534 standards. The elemental analysis (C, H, N, S, O) was accomplished in the Eurovector 2000 elemental analyzer. The constituent analysis, including extractive substances, structural carbohydrates (glucans, xylans and arabinans) and lignin, was performed according to UNE-EN-ISO 18134-2:2015 standard, and “Determinations of extractives in Biomass” and “Determinations of structural Carbohydrates and lignin in Biomass” NREL protocols.
The hard carbons produced were characterized by X-ray diffraction and Raman spectroscopy. X-ray diffraction was carried out with the PANalytical Xpert PRO diffractometer with Cu-Kα radiation source (λ = 1.5418 Å) and Raman spectroscopy by using the Renishaw inVia spectrometer (514 nm Ar+ laser, 4 scans by measurement between 150 and 3500 cm−1). At last, the morphology of both, the raw materials (biowaste samples) and the resulting hard carbons, was observed using the scanning electron microscope (SEM) Hitachi S-4800.

3.3. Hard Carbon Production

Each sample of biowaste was powdered by milling (Retsch, Mixer Mill 301), decreasing the particle size to 5 μm. GSEED and APP were previously freeze-dried (Heto PowerDry LL3000) to prevent from any kind of biologic degradation. Three types of hard carbons were produced with each biowaste sample: direct pyrolysis hard carbons, HTC + pyrolysis hard carbons and AH + HTC + pyrolysis hard carbons. The pyrolysis was carried out in a tubular furnace (TZF 1200 °C Carbolite), following a thermal program consisting in heating up 1 g of each sample in a N2 atmosphere from room temperature to 1200 °C at a heating rate of 5 °C/min and maintaining at such temperature for 2 h. The hard carbons produced in this way were named as NAME_1200. When biowaste samples were pretreated by HTC, 5 g of sample were introduced in a 300 mL autoclave (Autoclave Engineers) with 250 mL of water and both were heated up to 250 °C and maintained for 24 h under autogenous pressure (≈40 bar). The obtained hydrochars were pyrolyzed under the conditions mentioned above and the resulting carbon samples were named as NAME_HTC_1200. At last, when AH was also used to pretreat the biowaste samples, 25 gr of sample were dispersed in concentrated H3PO4 (Honeywell, 85%) and maintained at room temperature for 24 h. After AH and subsequent washing and filtering until neutral pH, the hydrolyzed biowaste samples were hydrothermally carbonized and later pyrolyzed under the above-quoted conditions. The obtained materials were entitled as NAME_PHOS_HTC_1200.

3.4. Electrochemical Tests

The working electrodes consisted of 80 wt.% active material (corn cob, apple pomace, olive mill solid waste, defatted grape seed and dried grape skin derived carbons) and 10 wt.% conducting carbon black (Ketjen black, AkzoNobel) and the rest is composed by polyvinylidene fluoride (PVDF, Solvay) solved homogeneously in N-methyl-2-pyrrolidone (NMP). Al foil was used as current collector. The electrodes were punched out with diameters of 7/16 inches. The CR2032-type coin cells were assembled in an Ar-filled glove Box (Labstar, MBraun). The electrolyte was a solution of 1 mol/L NaPF6 in ethylene carbonate/dimethyl carbonate (EC/DMC, 1:1 in volume). Metallic sodium was used as the counter electrode and glass microfiber filters (Whatman GF/F) were used as the separator. All electrochemical measurements were carried out on a multichannel potentiostat/galvanostat (BioLogic VPM3) at room temperature. The charge/discharge experiments were performed between 2.0 and 0.002 V at different current rate in which C-rate is defined as discharge to the graphite full capacity (372 mAh·g−1). The reproducibility of performance of each hard carbon material has been carried out 3 and 4 times. All the reactants and equipments have been purchased in Spain.

4. Conclusions

The main conclusion of this work is that, depending on the nature of the biowaste, different synthesis routes must be followed in the preparation of pyrolytic hard carbons. However, in general, hydrothermal carbonization improves capacity at high cycling rates, which are the closest conditions to real application. The electrochemical performance of the materials tested in this work is similar to other hard carbons obtained from biowaste. The best capacities were obtained by using corn cob with a combined treatment of HTC + pyrolysis, probably due to the presence of a higher amount of glucans (cellulose and starch) and hemicellulose (xylans and arabinans) in the precursor. Despite the similar specific capacities of CORN_1200 and CORN_HTC_1200 at low rates, the second one presents the best electrochemical performance in terms of both initial Coulombic efficiency and specific capacity at high rates, closer to real charge/discharge conditions.

Author Contributions

Conceptualization, V.P. and A.L.-U.; investigation, N.N., O.N., P.S.-F., U.P.-L., V.P. and A.L.-U.; writing-original draft preparation, N.N. and A.I.; writing-review and editing, V.P., A.L.-U. and T.R.; supervision, T.R.; funding acquisition, V.P., A.L.-U. and T.R. All authors have read and agreed to the published version of the manuscript.

Funding

This research was funded by the Ministerio de Ciencia e Innovación (PID2019-107468RB-C21) and Gobierno Vasco/Eusko Jaurlaritza (IT-1226-19 and IT-993-16).

Informed Consent Statement

Not applicable.

Data Availability Statement

Not applicable.

Acknowledgments

The authors thank the companies mentioned in the article for the donation of the biowaste samples. The authors want to thank technical and human support provided by SGIker of UPV/EHU.

Conflicts of Interest

The authors declare no conflict of interest.

References

  1. European Commission. Communication from the Commission: The European Green Deal. 2019. Available online: https://eur-lex.europa.eu/legal-content/EN/TXT/?qid=1596443911913&uri=CELEX:52019DC0640#document2 (accessed on 14 January 2021).
  2. Larcher, D.; Tarascon, J.M. Towards greener and more sustainable batteries for electrical energy storage. Nat. Chem. 2015, 7, 19–29. [Google Scholar] [CrossRef] [PubMed]
  3. Lu, M.; Huang, Y.; Chen, C. Cedarwood Bark-Derived Hard Carbon as an Anode for High-Performance Sodium-Ion Batteries. Energy Fuels 2020, 34, 11489–11497. [Google Scholar] [CrossRef]
  4. Wang, L.; Hu, J.; Yu, Y.; Huang, K.; Hu, Y. Lithium-air, lithium-sulfur, and sodium-ion, which secondary battery category is more environmentally friendly and promising based on footprint family indicators? J. Clean. Prod. 2020, 276, 124244. [Google Scholar] [CrossRef]
  5. Zhang, H.; Zhang, W.; Ming, H.; Pang, J.; Zhang, H.; Cao, G.; Yang, Y. Design advanced carbon materials from lignin-based interpenetrating polymer networks for high performance sodium-ion batteries. Chem. Eng. J. 2018, 341, 280–288. [Google Scholar] [CrossRef]
  6. Kim, J.H.; Jung, M.J.; Kim, M.J.; Lee, Y.S. Electrochemical performances of lithium and sodium ion batteries based on carbon materials. J. Ind. Eng. Chem. 2018, 61, 368–380. [Google Scholar] [CrossRef]
  7. Palomares, V.; Blas, M.; Serras, P.; Iturrondobeitia, A.; Peña, A.; Lopez-Urionabarrenechea, A.; Lezama, L.; Rojo, T. Waste Biomass as in Situ Carbon Source for Sodium Vanadium Fluorophosphate/C Cathodes for Na-Ion Batteries. ACS Sustain. Chem. Eng. 2018, 6, 16386–16398. [Google Scholar] [CrossRef]
  8. Wang, W.; Gang, Y.; Hu, Z.; Yan, Z.; Li, W.; Li, Y.; Gu, Q.F.; Wang, Z.; Chou, S.L.; Liu, H.K.; et al. Reversible structural evolution of sodium-rich rhombohedral Prussian blue for sodium-ion batteries. Nat. Commun. 2020, 11, 3572. [Google Scholar] [CrossRef] [Green Version]
  9. Li, H.; Xu, M.; Zhang, Z.; Lai, Y.; Ma, J. Engineering of Polyanion Type Cathode Materials for Sodium-Ion Batteries: Toward Higher Energy/Power Density. Adv. Funct. Mater. 2020, 30, 2000473. [Google Scholar] [CrossRef]
  10. Zhao, C.; Wang, Q.; Yao, Z.; Wang, J.; Sánchez-Lengeling, B.; Ding, F.; Qi, X.; Lu, Y.; Bai, X.; Li, B.; et al. Rational design of layered oxide materials for sodium-ion batteries. Science 2020, 370, 708–712. [Google Scholar] [CrossRef] [PubMed]
  11. Petrovičovà, B.; Ferrara, C.; Brugnetti, G.; Ritter, C.; Fracchia, M.; Ghigna, P.; Pollastri, S.; Triolo, C.; Spadaro, L.; Ruffo, R.; et al. Effect of germanium incorporation on the electrochemical performance of electrospun Fe2O3 nanofibers-based anodes in sodium-ion batteries. Appl. Sci. 2021, 11, 1483. [Google Scholar] [CrossRef]
  12. Gavrilin, I.M.; Kudryashova, Y.O.; Kulova, T.L.; Skundin, A.M.; Gavrilov, S.A. The effect of growth temperature on the process of insertion/extraction of sodium into germanium nanowires formed by electrodeposition using indium nanoparticles. Mater. Lett. 2021, 287, 129303. [Google Scholar] [CrossRef]
  13. Kulova, T.L.; Skundin, A.M. The Use of Phosphorus in Sodium-Ion Batteries—A Review. Russ. J. Electrochem. 2020, 56, 3–19. [Google Scholar] [CrossRef]
  14. Liu, Y.; Liu, Q.; Jian, C.; Cui, D.; Chen, M.; Li, Z.; Li, T.; Nilges, T.; He, K.; Jia, Z.; et al. Red-phosphorus-impregnated carbon nanofibers for sodium-ion batteries and liquefaction of red phosphorus. Nat. Commun. 2020, 11, 2520. [Google Scholar] [CrossRef]
  15. Opra, D.P.; Gnedenkov, S.V.; Sinebryukhov, S.L.; Gerasimenko, A.V.; Ziatdinov, A.M.; Sokolov, A.A.; Podgorbunsky, A.B.; Ustinov, A.Y.; Kuryavyi, V.G.; Mayorov, V.Y.; et al. Enhancing lithium and sodium storage properties of tio2(B) nanobelts by doping with nickel and zinc. Nanomaterials 2021, 11, 1703. [Google Scholar] [CrossRef] [PubMed]
  16. Wang, W.; Liu, Y.; Wu, X.; Wang, J.; Fu, L.; Zhu, Y.; Wu, Y.; Liu, X. Advances of TiO2 as Negative Electrode Materials for Sodium-Ion Batteries. Adv. Mater. Technol. 2018, 3, 1800004. [Google Scholar] [CrossRef]
  17. Wang, H.; Yu, W.; Shi, J.; Mao, N.; Chen, S.; Liu, W. Biomass derived hierarchical porous carbons as high-performance anodes for sodium-ion batteries. Electrochim. Acta 2016, 188, 103–110. [Google Scholar] [CrossRef]
  18. Zhao, L.F.; Hu, Z.; Lai, W.H.; Tao, Y.; Peng, J.; Miao, Z.C.; Wang, Y.X.; Chou, S.L.; Liu, H.K.; Dou, S.X. Hard Carbon Anodes: Fundamental Understanding and Commercial Perspectives for Na-Ion Batteries beyond Li-Ion and K-Ion Counterparts. Adv. Energy Mater. 2021, 11, 2002704. [Google Scholar] [CrossRef]
  19. Hasa, I.; Dou, X.; Buchholz, D.; Shao-Horn, Y.; Hassoun, J.; Passerini, S.; Scrosati, B. A sodium-ion battery exploiting layered oxide cathode, graphite anode and glyme-based electrolyte. J. Power Sources 2016, 310, 26–31. [Google Scholar] [CrossRef]
  20. Lee, M.E.; Lee, S.M.; Choi, J.; Jang, D.; Lee, S.; Jin, H.J.; Yun, Y.S. Electrolyte-Dependent Sodium Ion Transport Behaviors in Hard Carbon Anode. Small 2020, 16, 2001053. [Google Scholar] [CrossRef] [PubMed]
  21. Pei, L.; Cao, H.; Yang, L.; Liu, P.; Zhao, M.; Xu, B.; Guo, J. Hard carbon derived from waste tea biomass as high-performance anode material for sodium-ion batteries. Ionics 2020, 26, 5535–5542. [Google Scholar] [CrossRef]
  22. Jin, Q.; Wang, K.; Li, H.; Li, W.; Feng, P.; Zhang, Z.; Wang, W.; Zhou, M.; Jiang, K. Tuning microstructures of hard carbon for high capacity and rate sodium storage. Chem. Eng. J. 2021, 417, 128104. [Google Scholar] [CrossRef]
  23. Saavedra Rios, C.D.M.; Simonin, L.; De Geyer, A.; Ghimbeu, C.M.; Dupont, C. Unraveling the properties of biomass-derived hard carbons upon thermal treatment for a practical application in Na-ion batteries. Energies 2020, 13, 3513. [Google Scholar] [CrossRef]
  24. Alvin, S.; Chandra, C.; Kim, J. Extended plateau capacity of phosphorus-doped hard carbon used as an anode in Na- and K-ion batteries. Chem. Eng. J. 2020, 391, 123576. [Google Scholar] [CrossRef]
  25. Kubota, K.; Shimadzu, S.; Yabuuchi, N.; Tominaka, S.; Shiraishi, S.; Abreu-Sepulveda, M.; Manivannan, A.; Gotoh, K.; Fukunishi, M.; Dahbi, M.; et al. Structural Analysis of Sucrose-Derived Hard Carbon and Correlation with the Electrochemical Properties for Lithium, Sodium, and Potassium Insertion. Chem. Mater. 2020, 32, 2961–2977. [Google Scholar] [CrossRef]
  26. Bobyleva, Z.V.; Drozhzhin, O.A.; Dosaev, K.A.; Kamiyama, A.; Ryazantsev, S.V.; Komaba, S.; Antipov, E.V. Unveiling pseudocapacitive behavior of hard carbon anode materials for sodium-ion batteries. Electrochim. Acta 2020, 354, 136647. [Google Scholar] [CrossRef]
  27. Alvin, S.; Chandra, C.; Kim, J. Controlling intercalation sites of hard carbon for enhancing Na and K storage performance. Chem. Eng. J. 2021, 411, 128490. [Google Scholar] [CrossRef]
  28. Matei Ghimbeu, C.; Zhang, B.; Martinez de Yuso, A.; Réty, B.; Tarascon, J.M. Valorizing low cost and renewable lignin as hard carbon for Na-ion batteries: Impact of lignin grade. Carbon 2019, 153, 634–647. [Google Scholar] [CrossRef]
  29. Saha, A.; Sharabani, T.; Evenstein, E.; Nessim, G.D.; Noked, M.; Sharma, R. Probing Electrochemical Behaviour of Lignocellulosic, Orange Peel Derived Hard Carbon as Anode for Sodium Ion Battery. J. Electrochem. Soc. 2020, 167, 090505. [Google Scholar] [CrossRef]
  30. Arie, A.A.; Tekin, B.; Demir, E.; Demir-Cakan, R. Hard carbons derived from waste tea bag powder as anodes for sodium ion battery. Mater. Technol. 2019, 34, 515–524. [Google Scholar] [CrossRef]
  31. Xu, Z.; Huang, Y.; Ding, L.; Huang, J.; Gao, H.; Li, T. Highly Stable Basswood Porous Carbon Anode Activated by Phosphoric Acid for a Sodium Ion Battery. Energy Fuels 2020, 34, 11565–11573. [Google Scholar] [CrossRef]
  32. Wu, F.; Zhang, M.; Bai, Y.; Wang, X.; Dong, R.; Wu, C. Lotus Seedpod-Derived Hard Carbon with Hierarchical Porous Structure as Stable Anode for Sodium-Ion Batteries. ACS Appl. Mater. Interfaces 2019, 11, 12554–12561. [Google Scholar] [CrossRef]
  33. Arie, A.A.; Kristianto, H.; Muljana, H.; Stievano, L. Rambutan peel based hard carbons as anode materials for sodium ion battery. Fuller. Nanotub. Carbon Nanostruct. 2019, 27, 953–960. [Google Scholar] [CrossRef]
  34. Lima, C.S.S.; Conceição, M.M.; Silva, F.L.H.; Lima, E.E.; Conrado, L.S.; Leão, D.A.S. Characterization of acid hydrolysis of sisal. Appl. Energy 2013, 102, 254–259. [Google Scholar] [CrossRef]
  35. Chen, W.H.; Ye, S.C.; Sheen, H.K. Hydrolysis characteristics of sugarcane bagasse pretreated by dilute acid solution in a microwave irradiation environment. Appl. Energy 2012, 93, 237–244. [Google Scholar] [CrossRef]
  36. Hao, W.; Björkman, E.; Lilliestråle, M.; Hedin, N. Activated carbons prepared from hydrothermally carbonized waste biomass used as adsorbents for CO2. Appl. Energy 2013, 112, 526–532. [Google Scholar] [CrossRef]
  37. Wang, G.; Zhang, J.; Lee, J.Y.; Mao, X.; Ye, L.; Xu, W.; Ning, X.; Zhang, N.; Teng, H.; Wang, C. Hydrothermal carbonization of maize straw for hydrochar production and its injection for blast furnace. Appl. Energy 2020, 266, 114818. [Google Scholar] [CrossRef]
  38. Heilmann, S.M.; Jader, L.R.; Harned, L.A.; Sadowsky, M.J.; Schendel, F.J.; Lefebvre, P.A.; von Keitz, M.G.; Valentas, K.J. Hydrothermal carbonization of microalgae II. Fatty acid, char, and algal nutrient products. Appl. Energy 2011, 88, 3286–3290. [Google Scholar] [CrossRef]
  39. Bhaskar, T.; Pandey, A.; Mohan, S.V.; Lee, D.-J.; Khanal, S.K. Waste Biorefinery: Potential and Perspectives; Elsevier B.V.: Amsterdam, The Netherlands, 2018; pp. 129–156. [Google Scholar]
  40. Torres, M.D.; Kraan, S.; Dominguez, H. Sustainable Seaweed Technologies: Cultivation, Biorefinery and Applications; Elsevier Inc.: Amsterdam, The Netherlands, 2020; pp. 191–205. [Google Scholar]
  41. Górka, J.; Vix-Guterl, C.; Matei Ghimbeu, C. Recent Progress in Design of Biomass-Derived Hard Carbons for Sodium Ion Batteries. J. Carbon Res. 2016, 2, 24. [Google Scholar] [CrossRef] [Green Version]
  42. Shen, J.; Zhu, S.; Liu, X.; Zhang, H.; Tan, J. The prediction of elemental composition of biomass based on proximate analysis. Energy Convers. Manag. 2010, 51, 983–987. [Google Scholar] [CrossRef]
  43. Dou, X.; Hasa, I.; Saurel, D.; Vaalma, C.; Wu, L.; Buchholz, D.; Bresser, D.; Komaba, S.; Passerini, S. Hard carbons for sodium-ion batteries: Structure, analysis, sustainability, and electrochemistry. Mater. Today 2019, 23, 87–104. [Google Scholar] [CrossRef]
  44. Joint Committee on Powder Diffraction Standards (JCPDS) International Centre for Diffraction Data (ICDD). International Centre for Diffraction Data (ICDD). 2021. Available online: https://www.icdd.com/pdfsearch/ (accessed on 20 April 2021).
  45. Clemente, J.S.; Beauchemin, S.; Thibault, Y.; Mackinnon, T.; Smith, D. Differentiating Inorganics in Biochars Produced at Commercial Scale Using Principal Component Analysis. ACS Omega 2018, 3, 6931–6944. [Google Scholar] [CrossRef] [PubMed]
  46. Deraman, M.; Sazali, N.E.S.; Hanappi, M.F.Y.M.; Tajuddin, N.S.M.; Hamdan, E.; Suleman, M.; Othman, M.A.R.; Omar, R.; Hashim, M.A.; Basri, N.H.; et al. Graphene/semicrystalline-carbon derived from amylose films for supercapacitor application. J. Phys. Conf. Ser. 2016, 739, 12085. [Google Scholar] [CrossRef] [Green Version]
  47. Ross, J.R.H. Catalyst Characterization. In Contemporary Catalysis; The Royal Society of Chemistry: London, UK, 2019; pp. 121–132. ISBN 9780444634740. [Google Scholar]
  48. Yang, L.; Hu, M.; Zhang, H.; Yang, W.; Lv, R. Pore structure regulation of hard carbon: Towards fast and high-capacity sodium-ion storage. J. Colloid Interface Sci. 2020, 566, 257–264. [Google Scholar] [CrossRef]
  49. Sánchez-Fontecoba, P. Advanced Anode Materials for Sodium Ion Batteries. University of the Basque Country (UPV/EHU). 2017. Available online: https://addi.ehu.es/handle/10810/24246?locale-attribute=en (accessed on 20 May 2021).
  50. Xiao, B.; Rojo, T.; Li, X. Hard Carbon as Sodium-Ion Battery Anodes: Progress and Challenges. ChemSusChem 2019, 12, 133–144. [Google Scholar] [CrossRef]
  51. He, H.; Sun, D.; Tang, Y.; Wang, H.; Shao, M. Understanding and improving the initial Coulombic efficiency of high-capacity anode materials for practical sodium ion batteries. Energy Storage Mater. 2019, 23, 233–251. [Google Scholar] [CrossRef]
  52. Carboni, M.; Manzi, J.; Armstrong, A.R.; Billaud, J.; Brutti, S.; Younesi, R. Analysis of the Solid Electrolyte Interphase on Hard Carbon Electrodes in Sodium-Ion Batteries. ChemElectroChem 2019, 6, 1745–1753. [Google Scholar] [CrossRef] [Green Version]
  53. Zhu, Z.; Zeng, X.; Wu, H.; Wang, Y.; Cheng, H.; Dong, P.; Li, X.; Zhang, Y.; Liu, H. Green energy application technology of litchi pericarp-derived carbon material with high performance. J. Clean. Prod. 2021, 286, 124960. [Google Scholar] [CrossRef]
  54. Cong, L.; Tian, G.; Luo, D.; Ren, X.; Xiang, X. Hydrothermally assisted transformation of corn stalk wastes into high-performance hard carbon anode for sodium-ion batteries. J. Electroanal. Chem. 2020, 871, 114249. [Google Scholar] [CrossRef]
  55. Kamiyama, A.; Kubota, K.; Igarashi, D.; Youn, Y.; Tateyama, Y.; Ando, H.; Gotoh, K.; Komaba, S. MgO-Template Synthesis of Extremely High Capacity Hard Carbon for Na-Ion Battery. Angew. Chem. Int. Ed. 2020, 5120, 5114–5120. [Google Scholar] [CrossRef]
  56. Wang, Y.; Feng, Z.; Zhu, W.; Gariépy, V.; Gagnon, C.; Provencher, M.; Laul, D.; Veillette, R.; Trudeau, M.L.; Guerfi, A.; et al. High capacity and high efficiency maple tree-biomass-derived hard carbon as an anode material for sodium-ion batteries. Materials 2018, 11, 1294. [Google Scholar] [CrossRef] [Green Version]
  57. Dahbi, M.; Kiso, M.; Kubota, K.; Horiba, T.; Chafik, T.; Hida, K.; Matsuyama, T.; Komaba, S. Synthesis of hard carbon from argan shells for Na-ion batteries. J. Mater. Chem. A 2017, 5, 9917–9928. [Google Scholar] [CrossRef]
  58. Rath, P.C.; Patra, J.; Huang, H.T.; Bresser, D.; Wu, T.Y.; Chang, J.K. Carbonaceous Anodes Derived from Sugarcane Bagasse for Sodium-Ion Batteries. ChemSusChem 2019, 12, 2302–2309. [Google Scholar] [CrossRef] [PubMed]
  59. Li, X.; Zeng, X.; Ren, T.; Zhao, J.; Zhu, Z.; Sun, S.; Zhang, Y. The transport properties of sodium-ion in the low potential platform region of oatmeal-derived hard carbon for sodium-ion batteries. J. Alloys Compd. 2019, 787, 229–238. [Google Scholar] [CrossRef]
  60. Caballero, B.M.; López-Urionabarrenechea, A.; Pérez, B.; Solar, J.; Acha, E.; de Marco, I. Potentiality of “orujillo” (olive oil solid waste) to produce hydrogen by means of pyrolysis. Int. J. Hydrogen Energy 2020, 5, 20549–20557. [Google Scholar] [CrossRef]
  61. Dávila, I.; Gullón, P.; Labidi, J. Influence of the heating mechanism during the aqueous processing of vine shoots for the obtaining of hemicellulosic oligosaccharides. Waste Manag. 2021, 120, 146–155. [Google Scholar] [CrossRef]
  62. Ministerio de Agricultura Pesca y Alimentación. Superficie y Producción de Cereales en España. 2018. Available online: https://www.mapa.gob.es/es/agricultura/temas/producciones-agricolas/cultivos-herbaceos/cereales/default.aspx (accessed on 20 May 2021).
  63. Miranda, M.T.; Sepúlveda, F.J.; Arranz, J.I.; Montero, I.; Rojas, C.V. Analysis of pelletizing from corn cob waste. J. Environ. Manag. 2018, 228, 303–311. [Google Scholar] [CrossRef]
  64. Calvete-Torre, I.; Muñoz-Almagro, N.; Pacheco, M.T.; Antón, M.J.; Dapena, E.; Ruiz, L.; Margolles, A.; Villamiel, M.; Moreno, F.J. Apple pomaces derived from mono-varietal Asturian ciders production are potential source of pectins with appealing functional properties. Carbohydr. Polym. 2021, 264, 117980. [Google Scholar] [CrossRef]
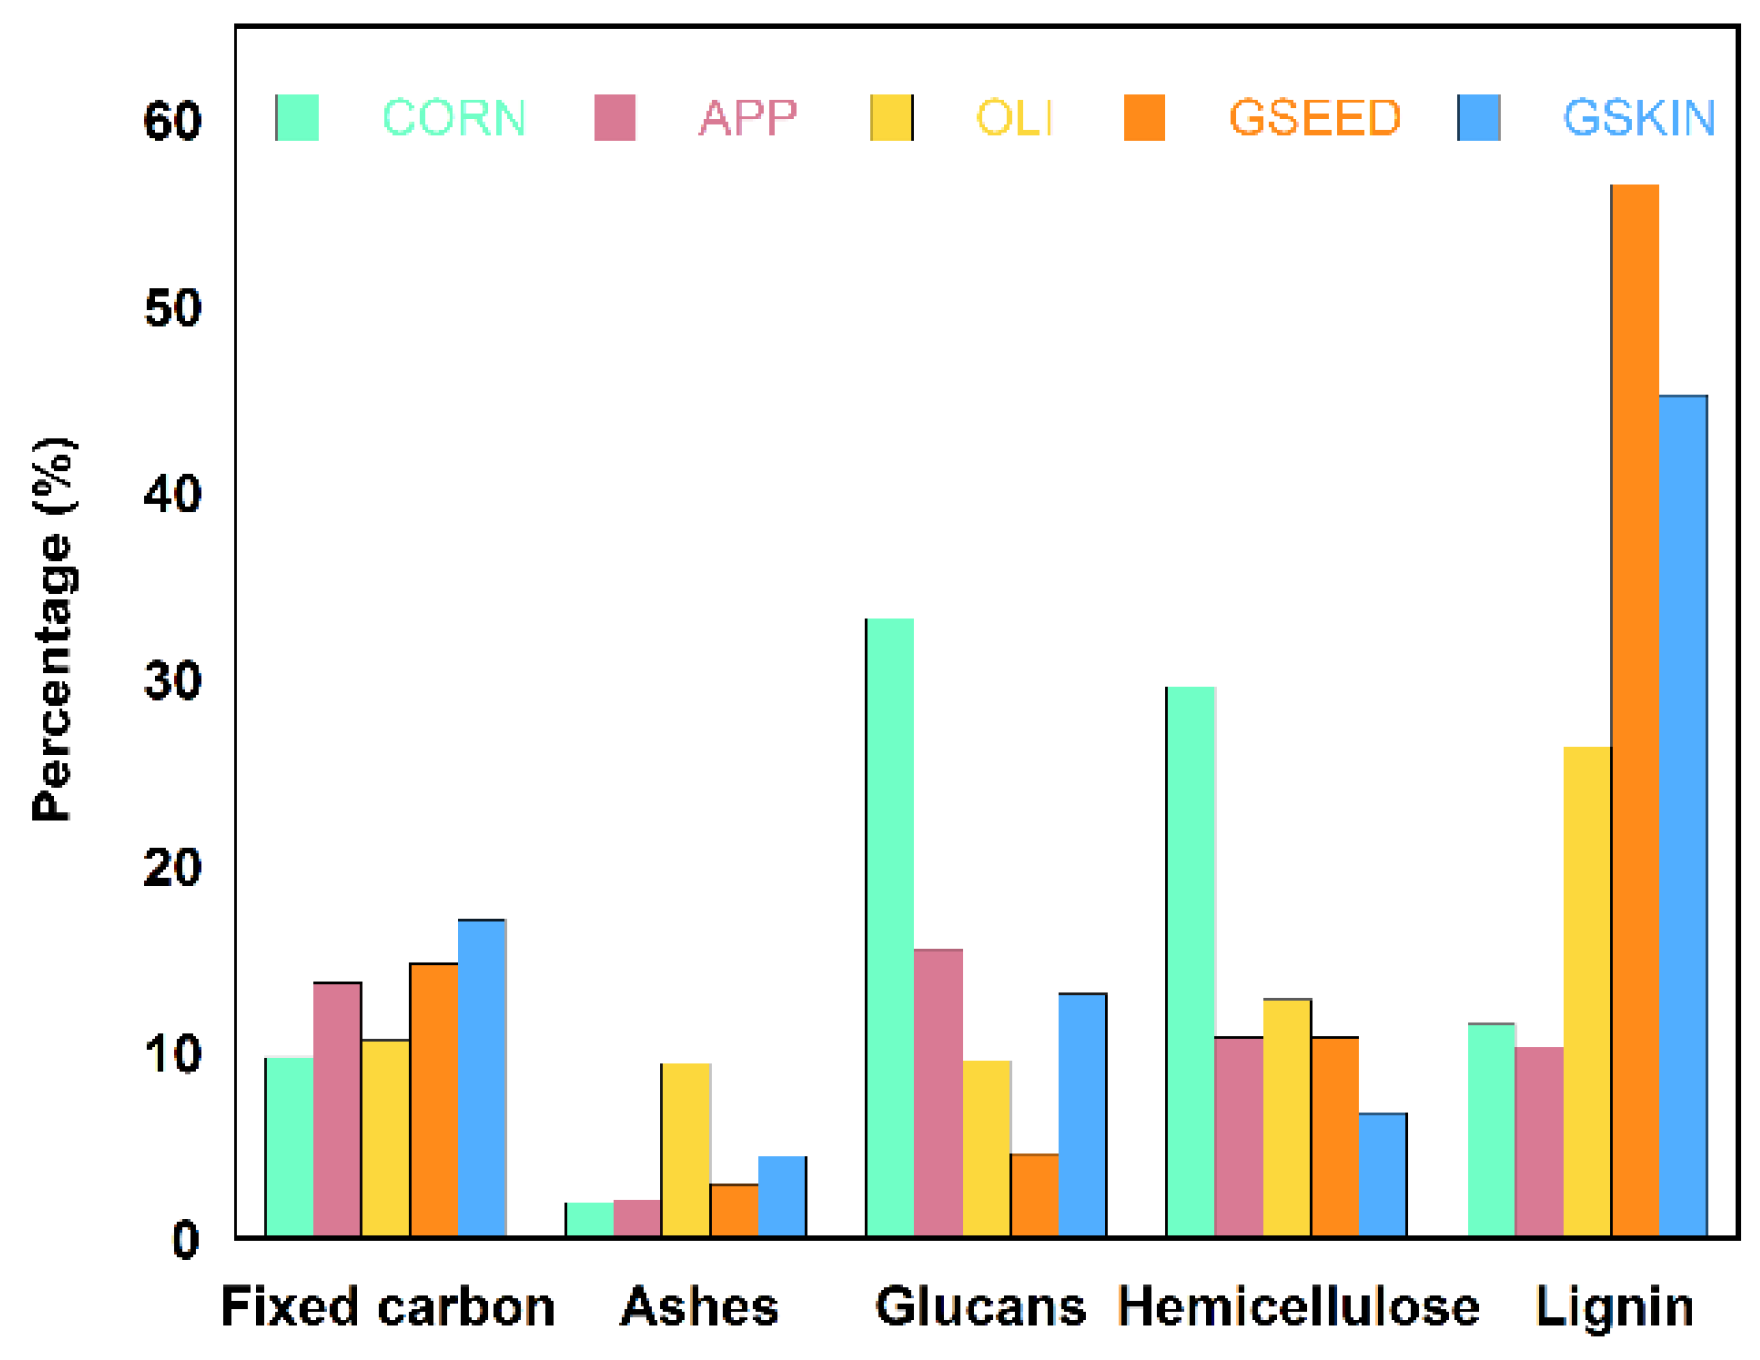
Figure 1. Fixed carbon, ashes, glucans, hemicellulose and lignin analysis comparison of the biowaste samples.
Batteries 08 00028 g001
Figure 2. X-ray diffraction diagrams of corn cob (a), apple pomace (b), olive mil solid waste (c), defatted grape seed (d) and dried grape skin (e) samples.
Batteries 08 00028 g002
Figure 3. Raman spectra of corn cob (a), apple pomace (b), olive mil solid waste (c), grape defatted seed (d) and dried grape skin (e) samples.
Batteries 08 00028 g003
Figure 4. SEM micrographs of the untreated, pyrolyzed (1200), pretreated with HTC (HTC_1200) and pretreated with acid and later with HTC (PHOS_HTC_1200) samples of corn cob (ad), apple pomace (eh), olive mil solid waste (il), defatted dried grape skin (mp) and dried grape skin (qt), respectively.
Batteries 08 00028 g004
Figure 5. Electrochemical performance of the first discharge cycle of CORN_1200, CORN_HTC_1200 and CORN_PHOS_HTC_1200 (a) and the first charge/discharge and subsequent cycles of CORN_1200 (b) at C/15.
Batteries 08 00028 g005
Figure 6. Slope-plateau proportion (a) and Initial Coulombic Efficiency (ICE) (b) in each material.
Batteries 08 00028 g006
Figure 7. Discharge rate capability of corncob (a), apple pomace (b), olive mill solid waste (c), defatted grape seed (d) and dried grape skin (e) samples.
Batteries 08 00028 g007
Table 1. Proximate, elemental and constituent analysis of the raw precursors (wt.%).
Corn CobApple PomaceOlive Mill Solid WasteDeffated Grape SeedDry Grape Skin
Proximate analysis 1Moisture8.705.806.7013.908.30
Volatiles72.7073.9068.4059.0064.30
Fixed carbon316.8018.3016.1024.6023.30
Ashes1.802.008.802.504.10
Elemental analysis 1Carbon43.5041.7044.1047.4048.60
Hydrogen7.007.806.306.707.00
Nitrogen0.400.601.601.903.00
Sulfur0.200.200.200.200.20
Oxygen42.8048.1035.8038.5033.20
Others36.101.6012.005.308.00
Constituent analysis 2Extractives9.6044.3037.609.7016.80
Glucans33.2015.509.504.5013.10
Xylans27.606.6011.9010.506.20
Arabinans2.004.200.900.300.50
Lignin11.5010.3026.4056.5045.20
Others316.1019.1013.7018.5018.20
1 Wet basis (as received); 2 Dry basis; 3 By difference.
Table 2. Elemental analysis of corn cob and olive mill solid waste derived hard carbons (wt.%).
SamplesCarbonHydrogenNitrogen
CORN120080.080.451.56
HTC_120089.310.252.68
PHOS_HTC_120051.690.271.60
OLI120070.680.831.59
HTC_120070.760.392.27
PHOS_HTC_120049.940.131.46
Table 3. Physical parameters of the samples calculated from XRD and Raman spectra.
Samplesd002 (Å)La (Å)Lc (Å)NAD/AG 01AD/AG 02
CORN12003.9838.5010.612.672.252.29
HTC_12003.8038.479.532.512.661.52
PHOS_HTC_12003.9236.398.912.271.581.89
APP12003.9037.069.382.411.911.32
HTC_12003.8737.3710.232.642.110.87
PHOS_HTC_12003.9336.819.422.401.851.77
OLI12003.8140.528.232.161.700.61
HTC_12003.7535.848.632.301.901.71
PHOS_HTC_12003.8945.889.412.421.91---
GSEED12003.9239.8910.012.561.191.16
HTC_12003.8539.049.972.591.80---
PHOS_HTC_12003.8541.8010.032.612.712.00
GSKIN12003.8635.539.512.462.30---
HTC_12003.5045.6135.6710.181.841.77
PHOS_HTC_12003.8835.109.462.442.912.98
Table 4. Electrochemical performances in each sample at C/15 (24.8 mA·g−1).
SamplesInitial Discharge Capacity (mAh·g−1)Specific Capacity (mAh·g−1)Initial Coulombic Efficiency (%)
CORN1200644.48265.1743.39
HTC_1200378.96268.5473.49
PHOS_HTC_1200297.09169.6661.69
APP1200644.64247.1940.73
HTC_1200457.76222.4750.41
PHOS_HTC_1200381.57196.6355.11
OLI1200444.09149.4438.75
HTC_1200468.09174.1650.00
PHOS_HTC_1200320.86182.9064.81
GSEED1200289.59158.4266.47
HTC_1200450.76244.9460.25
PHOS_HTC_1200437.63162.9243.65
GSKIN1200446.47215.7357.03
HTC_1200385.61149.4443.96
PHOS_HTC_1200437.84243.8261.89
Table 5. Electrochemical performances in each sample at C/15 (24.8 mA·g−1).
Electrochemical Performance (mAh·g−1)Initial Coulombic Efficiency (%)References
Waste tea bag282.40 (30.00 mA·g−1)69.00[30]
Maple tree332.00 (30.00 mA·g−1)88.30[56]
Argan shell286.00 (25.00 mA·g−1)76.90[57]
Sugarcane bagasse290.00 (30.00 mA·g−1)70.00[58]
Oatmeal272.40 (20.00 mA·g−1)46.64[59]
Corn cob268.54 (24.80 mA·g−1)73.49This work
Grape skin243.82 (24.80 mA·g−1)61.89This work
Grape seed244.94 (24.80 mA·g−1)60.25This work
Apple pomace247.19 (24.80 mA·g−1)40.73This work
Publisher’s Note: MDPI stays neutral with regard to jurisdictional claims in published maps and institutional affiliations.