Abstract
The prediction of thermal behavior is essential for an efficient initial design of thermal management systems which equip energy sources based on electrochemical cells. In this study, the surface temperature of various cylindrical types of Li-ion batteries is monitored at multiple points during discharge. Three different battery chemistries and two sizes (18650 and 21700) are considered in this study, allowing the comparison of the influence these parameters have on the temperature rise considering different discharge rates (1C, 2C and 3C). Based on repeated experimental measurements, a simple equation that describes the thermal behavior of batteries is proposed and further used to create 3D thermal maps for each analyzed battery (generally error is below 1 °C but never exceeds 3 °C). The practical utility of such an equation is that it can drastically reduce the time spent with experimental measurements required to characterize the thermal behavior of cylindrical Li-ion batteries, necessary for the initial design process of energy sources’ thermal management system.
1. Introduction
In recent years, the need to reduce environmental pollution has been increasingly acknowledged, offering a wider market share to electric vehicles year by year [1]. Lithium-ion (Li-ion) batteries are the preferred energy source for electric vehicles, due to their proven supremacy compared to other chemistries in terms of power and energy density, self-discharge rate and cycle life [2]. However, these properties are strongly affected by temperature [3]. During charging and discharging operations the ongoing electrochemical processes generate a considerable quantity of heat, resulting in the rise of the battery temperature [4]. The heat generation of Li-ion batteries generally varies in time and influenced by the working conditions, such as state of charge, discharge rate and ambient temperature [4,5].
Studies show that operating Li-ion batteries at high temperatures can quicken chemical changes, such as the growth of solid electrolyte interphase in cells, loss of active material or electrolytic corrosion [6,7,8,9]. This leads to the reduction in the electrodes’ available surface area for electrochemical reactions. Therefore, it is crucial to be able to predict heat generation characteristics and temperature rise for the right battery thermal management system design, for maintaining the performance and safety of the battery cells.
The different processes that take place inside the batteries are strongly connected one to another. The reactions generate heat which affects temperature uniformity inside the cell [10,11]. The temperature gradient consecutively dictates the electrochemical reaction kinetics, the transfer of ionic charge and the crystalline phase equilibria of the electrodes. The dynamics of these phenomena are heavily connected [12]. The interactions between thermal, electrical, and electrochemical phenomena are illustrated in Figure 1. The processes include species diffusion, charge transport, chemical kinetics and thermal transport and are directed by physical laws including several transport properties, such as thermal conductivity, mass diffusivity or reaction rates [12].
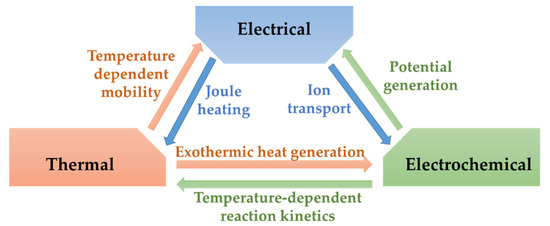
Figure 1.
Schematic illustrating processes inside Li-ion batteries.
The elementary components of Li-ion batteries are the two electrodes, anode and cathode, and the electrolyte which allows the transfer of lithium ions between the electrodes. The negative electrode (anode) is usually made from carbon (graphite) or lithium titanate (Li4Ti5O12), while other materials such as Li metals or Li(Si) alloys are considered. The electrolyte is typically an organic liquid containing a variety of organic carbonates and a salt, such as lithium hexafluorophosphate (LiPF6) [13]. Within the family of Li-ion batteries, there are several positive electrode (cathode) materials, which define the battery chemistry, for example: LiCoO2 (LCO), LiFePO4 (LFP), Li(Ni1−x−yMnxCoy)O2 (NMC), Li(Ni1−x−yCoxAly)O2 (NCA) and LiMn2O4 (LMO) [14]. LCO batteries have high energy density but are very reactive and therefore have weak thermal stability. LFP batteries have high power density and thermal stability and are inexpensive. NMC batteries have high specific energy and exceptional thermal properties, obtained by the right proportions of nickel and manganese to enhance each other’s strengths. Therefore, they are in high demand for their use in electric vehicle batteries. NCA batteries also offer high specific power and specific energy and a long lifespan, but are not as safe as the other chemistries and are more expensive.
The heat generation and temperature rise of Li-ion batteries have been investigated by a large number of papers [4,5,10,15,16,17,18,19]. Generally, there are two main causes attributed to battery heat generation, namely the over-potential and the entropic heat flow [20,21]. The former is due to ohmic losses, charge transfer at the interfaces and mass transfer constraints, as well as the current flowing from one electrode to the other, originating in an irreversible heat flow. Meanwhile, the latter is due to the reactions at the anode and cathode, respectively, during charge and discharge [17]. Experimental measurements and mathematical models have shown that the thermal influence of the two electrodes can be different, with a more concentrated heat generation at the positive terminal [22,23]. Different values at the two terminals also exist for parameters such as lithium diffusion coefficient, reaction rate and entropy change, influencing the characterization of thermal behavior at the electrodes [24].
The prediction of Li-ion batteries’ thermal behavior can be conducted in several ways. Equivalent circuit models are used due to their simplicity and suitable performance, describing the state of charge, current and heat generation [25]. Multiphysics modeling can be used to analyze the influence of the battery’s active components on the contribution of reversible and irreversible heat generation [13]. Another numerical prediction method of the battery core temperature is the use of coupled linear differential equations, based on measured ambient and battery surface temperatures [26]. Drake et al. [5] monitored the variation of internal and external temperatures of cylindrical Li-ion batteries, as well as the heat flux on their outer surface, to determine the heat generation rate. Well-established experimental methods are the accelerating rate calorimetry (ARC) and isothermal heat conduction calorimetry (IHC) [27]. Under adiabatic conditions (ARC method), heat generation can be calculated based on the specific heat capacity and temperature rise of the battery [28]. To minimize heat exchange with the surroundings, Arora et al. [18] placed pouch battery cells in slots inside HDPE slabs. A novel isothermal calorimetric method is proposed by Hu et al. [29], which allows the simultaneous measurement of internal resistance and entropy coefficient by applying a sinusoidal current and analyzing the heat generation responses in the frequency domain. An additional IHC calorimeter was designed by Yin et al. [30] with highly dynamic properties, obtained from the use of thermoelectric devices. The proposed calorimeter allows the monitoring of variations in heat generation rate during dynamic charge/discharge processes, due to the reduced thermal inertia. A similar concept was proposed by Diaz et al. [31], where the entire experimental apparatus, placed in an environmental chamber, was set to be maintained at constant temperature by the means of thermoelectric elements. The rate of heat extraction must be equal to the rate of heat generation, resulting in 4D maps of heat generation, as a function of frequency, current, state of charge and temperature.
Most of the studies limit temperature and heat flux measurement to the exterior surface of the batteries, although temperature distribution inside the cell can be experimentally investigated using micro thermocouples [11]. Such measurements show that due to the poor radial thermal conductivity of the cylindrical batteries, significant temperature gradients can form within the cells, especially at high discharge rates. This non-uniform temperature distribution amplifies the non-uniform distribution of current density, caused by the dependencies between the state of charge (SoC), current and temperature, which in extreme conditions can cause a short circuit or overcharge [32,33]. Therefore, measuring the internal temperature provides more information about the state of health of the battery, while external measurements can significantly underestimate the maximum temperature.
Consequently, the prediction of battery heat generation and temperature rise for a given battery shape, capacity and chemistry must be addressed before designing the battery pack and its thermal management system [34]. Regarding temperature indication methods, key characteristics are accuracy, resolution, and measurement range. Thermistors are solid semiconductor devices, which show a rapid change in their electrical resistance with temperature [35]. Resistance Temperature Detectors are equipment consisting of metallic conductors and presenting an increase in electrical resistance with temperature [36]. Thermocouples are devices functioning on the principle of the Seebeck effect, which consists of the formation of an electromotive force by exposing two distinct conductors to a temperature difference [37]. They are a preferred solution due to their low cost, robustness, size and temperature range [38]. Even though a higher accuracy can be obtained, it normally lies within 1 or 2 °C and is thus ordinary. Amid the numerous accessible scientific papers that conduct experimental measurements regarding battery temperature, commercial thermocouples are regularly adopted. A justification might be that devices are generally equipped with thermocouple input channels. The greater part of investigations uses the common K-type or T-type thermocouples to measure the battery temperature [39,40,41,42,43,44,45,46,47,48].
The authors analyzed bibliographic sources related to this subject and failed to identify a mathematical relationship of the thermal behavior that considers the chemical particularities of cylindrical Li-ion batteries. For this purpose, in this paper, cylindrical Li-ion batteries of different sizes and chemistries are discharged at several rates while measuring the surface temperature in three points using K-type thermocouples. The objective is to create a 3D thermal map for each of the tested batteries, in which temperature rise is described as a function of the state of charge and discharge rate and finally a mathematical equation is proposed that characterizes the thermal behavior of the batteries. Fitting equations describing temperature rise or heat generation appear in numerous papers, usually in the form of simple polynomial equations of the second or third degree. Although these have excellent accuracy, their implementation requires the definition of all the individual unknown parameters present in polynomial equations (up to nine in the case of a third-degree two-variable polynomial equation), which is a time-consuming process. The novelty of this research lies in the general character of the proposed fitting equation, which includes some of the main parameters of Li-ion batteries, such as nominal voltage and capacity, reducing the number of unknown parameters to just one. The function of the battery’s chemistry, this parameter can be quickly determined even by a single measurement, reducing considerably the time necessary for creating the sought thermal maps.
2. Materials and Methods
Three types of cylindrical Li-ion batteries from different manufacturers were used during the measurements, their parameters are listed in Table 1. Cylindrical Li-ion cells have a significantly higher energy density than prismatic or pouch cells [49]. Even though they cannot be packed as optimally as the other two cell shapes, cylindrical cells maintain a slight advantage even at a system (battery pack) level. Temperature measurements were made using K-type thermocouples with PTFE insulation and 0.2 mm twisted pair conductor fixed to the battery surface using thermal insulation tape. To capture possible differences in heat generation and therefore temperature at the battery terminals, three thermocouples were used for the tests, in the proximity of the cathode, in the proximity of the anode and at the middle of the battery, as shown in Figure 2. Nickel sheets were welded to the cell terminals using spot welding.

Table 1.
Battery cell parameters.

Figure 2.
Positioning of thermocouples on the battery surface: (a) LCO; (b) NCA; (c) NMC.
The thermocouples were connected to a Pico TC-08 data logger, for which the temperature accuracy is the sum of ±0.2% of reading and ±0.5 °C. Temperatures were recorded from the date logger at an interval of one second on the personal computer. The constant current discharge of the batteries was conducted using an East Tester ETS5410 programmable electronic load, with a current accuracy of ±(0.05% + 0.05% FS). Additionally, a thermal camera with a sensor resolution of 76,800 pixels and a thermal sensitivity of 70 mK was used as a second temperature monitoring tool for validation. The whole experimental setup is shown in Figure 3.
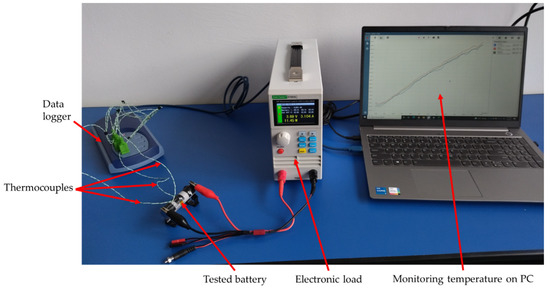
Figure 3.
Experimental setup.
Experimental Procedure
In this experimental study, for each battery type, three individual cells from the same batch were selected. The nine selected cells were numbered as follows: #1, 4, 7–NCA (Panasonic, Beijing, China); #2, 5, 8–NMC (Samsung); #3, 6, 9–LCO (KeepPower). Every cell was successively discharged three times at discharge rates of 1C, 2C and 3C. For each discharge process, the average temperature rise for all three thermocouples was determined. In the case where at a single thermocouple a difference larger than 5% of the average temperature rise between measurements was detected, a fourth measurement was conducted at the respective discharge rate. The four measurements were compared and only the three with the smallest added differences were considered in the following. Completing the above-mentioned experimental procedure required a total of approximately 60 h of experimental measurements.
The hereby selected experimental data collections were then plotted on a single diagram for each battery type, resulting in a total of nine diagrams (3 battery types × 3 discharge rates). Each diagram illustrates a total of 27 curves, representing the measured temperature rise on all three locations on the battery surface. For every location, a 3rd-order polynomial equation was generated to describe the thermal behavior at the positive and negative terminal and in the middle of the cell, respectively. Additionally, another equation was generated to describe the trendline of all measured data.
The nine diagrams with their respective equations are illustrated in Figure 4, while the equations’ coefficients are represented in Table 2.
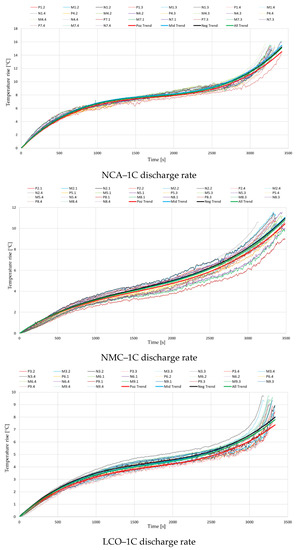
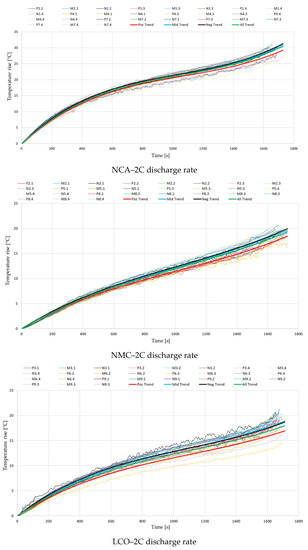
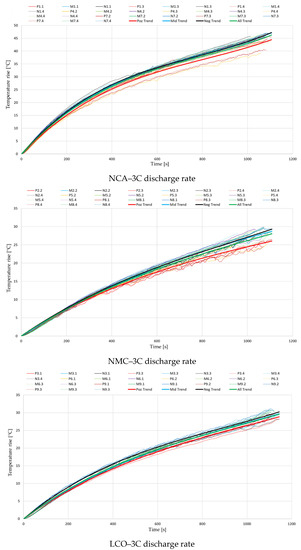
Figure 4.
Temperature variations during the discharge process, for different cell chemistries.

Table 2.
Third-order polynomial equations’ coefficients.
The given coefficients are from a general 3rd-order polynomial equation of the following form:
where ΔT is the temperature rise in °C and t is the discharge time in seconds.
3. Results and Discussions
It can be observed that especially at the lowest discharge rate of 1C, near the start and end of the discharge process, a steeper temperature rise appears. When applying the discharge current, a sudden drop in battery voltage occurs, increasing the irreversible part of the generated heat. Similarly, near the end of discharge, the battery voltage drops at a faster rate, increasing again the irreversible component. The initial stage of discharge is also the moment that presents the highest differences in local current density inside the cell, while near the terminal stage of the process the gradient of electrolyte Li+ concentration is at its highest [50].
In Figure 5, pictures taken with the thermal camera at the end of the 2C discharge process are illustrated, which seem to be in agreement with the temperature rise values presented in Figure 4. One can also notice the different color shades of the wires in the presented three pictures, which can be due to the variable color scales present in the color bars, but mostly to differences in current values corresponding to the discharge rate for the presented battery capacities. The differences in wire temperature for the same C-rates also influenced the results presented in Figure 4 and the comparative analysis between battery chemistries.
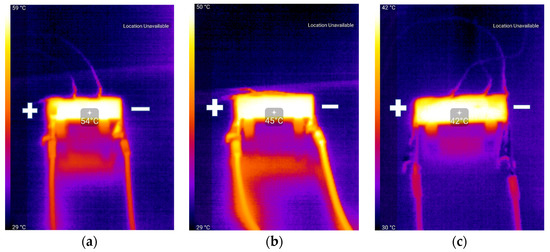
Figure 5.
Thermal camera pictures at end of 2C discharge process: (a) NCA; (b) NMC; (c) LCO.
Contrarily to what was expected, the results from Figure 4 indicate that for every case the lowest temperatures were recorded at the positive terminal. While the differences between the negative terminal and the middle of the battery were negligible, those to the positive terminal were up to even 3 °C at the highest analyzed discharge rate. This disparity could be attributed to the limits of measuring temperature on the battery surface or the moderate accuracy of the thermocouples and other equipment. However, given the high number of tests completed and the repeatability of the performed experimental procedure, the authors consider that this ever-present trend’s origins should be further investigated.
Regarding the comparison of the different battery chemistries and capacities, the conducted experiments show that the temperature rise for the analyzed NCA battery is far higher. Temperatures at the end of the discharge process were regularly 10 °C above the ones measured at the other two chemistries, but in some cases exceeded even 20 °C. Based on the ambient conditions, one can see that the end surface temperature for the analyzed NCA batteries can easily exceed 70 °C when discharged at 3C, a case in which a thermal management system is necessary. This finding can be aligned with other investigations where the thermal stability of different cathode chemistries was compared. Barkholtz et al. [51] stated that NCA and LCO cathodes are metastable, with NCA batteries showing the highest thermal runaway rates, while LFP cathodes are stable. Another study [52] also showed that from the thermal stability and reactivity point of view, when comparing three cathode materials for Li-ion batteries, the electrochemically delithiated NCA was found to be the least stable.
The magnitude of temperature rise was similar for the analyzed LCO and NMC batteries, although the variation with increasing discharge rate was slightly different. If at 1C the average temperature rise for the LCO battery was 3 °C lower than for the NMC, at 2C the results became closely the same, and finally, at 3C it increased above the values recorded for the NMC battery. Additionally, different studies [13,53] have already proved that a higher nominal capacity results in an increase in the irreversible heat generation’s contribution, due to the ohmic polarization in the cathode, separator and anode. This information, in correlation with the obtained results, indicates the conclusion that of the analyzed batteries, the NMC chemistry presents the best thermal behavior, and offers the potential to be used in the future in lower-cost and higher-specific-energy batteries for electric vehicles [54]. However, for a stronger validation of this statement, a similar test procedure with a 18650-type NMC battery is suggested for further investigations.
It is observed that no relevant temperature gradient was detected at the various thermocouple measuring locations on the batteries’ surface nor on the thermal camera images. Given the prior observation as well as the large number of data and generated coefficients, only the general trendline for all measured data will be considered in the following, with the aim of simplifying the results’ interpretation process. Even though only one dataset will be used in the following, indicating the global thermal behavior of batteries, measurements in several locations on the battery surface gave a more accurate calculation of the average temperature rise and offered the possibility to analyze thermal behavior also on a local level. Furthermore, if more relevant temperature differences arose at the different measuring locations, thermal maps and subsequently temperature predictions could be generated for multiple locations on the batteries. The obtained equations (presented in Table 2) were introduced in Matlab software and a thermal map was generated for each considered battery, as shown in Figure 6.
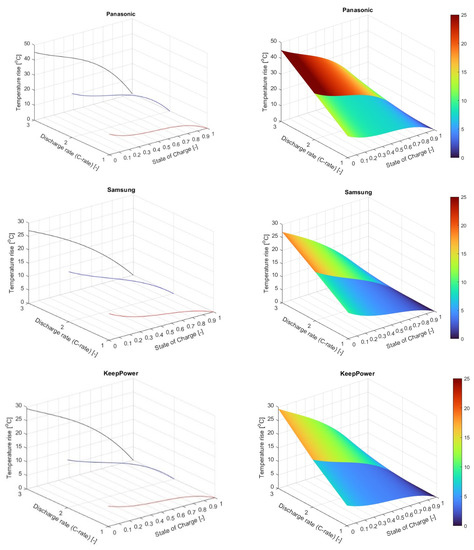
Figure 6.
Thermal maps for the studied batteries (Panasonic- NCA, Samsung-NMC, KeepPower-LCO).
Based on the presented thermal maps an equation is proposed, which can describe relatively simply and with good accuracy the illustrated surfaces with as few coefficients as possible. For this purpose, several battery parameters are integrated into the equation and a single coefficient is left to be determined for every case based on the battery chemistry.
The proposed equation is the following:
where ΔT–temperature rise [°C]; n–size coefficient: n = 1 for 18650-type cell; n = 2 for 21700-type cell; U–battery nominal voltage [V]; D–discharge rate (C-rate) [-]; S – State of Charge (SoC) [-]; Q–battery nominal capacity [Ah]; B–chemistry coefficient to be determined for each battery.
From our study, a general indicative value for the B coefficient should be between 0 and 5. Together with the original polynomial equations from Figure 6, the surfaces obtained from the proposed fitting equation are illustrated in Figure 7, while in Table 3 the values for the B coefficient and main fitting parameters are indicated.
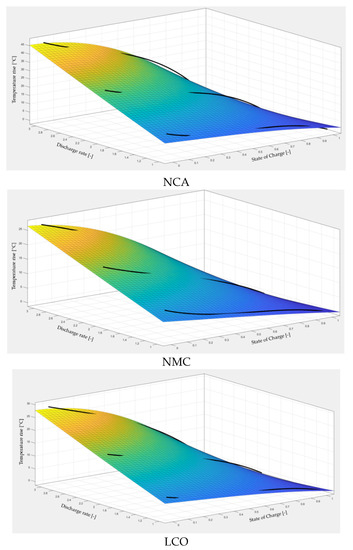
Figure 7.
Thermal maps obtained from the proposed equation.

Table 3.
Fitting parameters.
It can be seen that the proposed equation is in good agreement with the experimental results (according to R-square values). The largest differences are at values of the battery state of charge below 0.1 (SoC-10%), where the equation underestimates battery temperatures by up to 3 °C. Other than that, the error generally is below 1 °C but never exceeds 2 °C. Naturally, the proposed fitting equation represents only an approximation of battery temperature rise and cannot be yet applied for precise value estimation. Moreover, all results are limited to cases with a constant discharge rate and therefore cannot be taken for good in the case of dynamic discharge profiles. Additionally, more experiments with other battery chemistries and sizes are needed to truly validate the equation and possibly refine its current form. However, the utility of such an equation is that it can drastically reduce the time spent with experimental measurements required to characterize the thermal behavior of Li-ion batteries. With the mean of only a few measurements, the equation can be used to determine the B coefficient for any battery type and then apply it to other discharge rates, eliminating the necessity of performing all the experimental and data processing work presented in this study.
4. Conclusions
The article presents a research topic in accordance with the need to introduce sustainable transport systems, which led to the research and analysis of efficient energy sources for electric vehicles. In the presented study, the temperature rise was experimentally analyzed during discharge mode at 1C, 2C and 3C for three electrochemistry types (NCA, NMC and LCO) used in the construction of cylindrical batteries.
Based on the obtained results, it can be observed that the temperature rise for the analyzed NCA battery was by far the highest, while the magnitude of temperature rises for the analyzed LCO and NMC batteries were similar. Furthermore, through a more accurate analysis of the results, it can be stated that the NMC chemistry presents the best thermal behavior and offers the potential to be used in the future in lower-cost and higher-specific-energy batteries for electric vehicles.
By analyzing the data related to the thermal variation of batteries with different chemistries, it was possible to propose a parametric equation with good statistical correlation (generally error is below 1 °C but never exceeds 3 °C, compared to the experimental data), describing temperature rise as the main function of the state of charge and discharge rate. The simple form of the equation offers the advantage of being easily used in the initial design and construction processes of an energy source consisting of cylindrical batteries.
Future research directions can aim to investigate whether the proposed form of the parametric equation offers a potential application for other chemistries, sizes of cylindrical batteries or even constructive types of batteries (prismatic, pouch).
An important future research orientation is increasing the number of parameters that are used in describing the prediction function. This desiderate can be achieved in several ways. Co-simulations with finite element analysis can be conducted to simultaneously evaluate the thermal, mechanical and chemical performances of the batteries. Such an approach would allow us to monitor the aging mechanisms of the cells, the electrodes’ structural deterioration due to mechanical strains and the generation of reversible and irreversible heat [55]. The second possibility is the implementation of machine learning methods, given the large quantity of measured data. Such a future development would enable a precise prediction of battery performance in various working conditions, with the possibility of increasing the dataset’s complexity by measuring other input parameters, such as state of health or internal resistance.
Author Contributions
Conceptualization, T.I.C.B. and F.M.; methodology, T.I.C.B. and F.M.; validation, T.I.C.B.; formal analysis, T.I.C.B.; investigation, T.I.C.B.; writing—original draft preparation, T.I.C.B. and F.M.; writing—review and editing, T.I.C.B. and F.M.; supervision, F.M. All authors have read and agreed to the published version of the manuscript.
Funding
This research received no external funding.
Institutional Review Board Statement
Not applicable.
Informed Consent Statement
Not applicable.
Data Availability Statement
Not applicable.
Conflicts of Interest
The authors declare no conflict of interest.
References
- New Registrations of Electric Cars, EU-27 2022. Available online: https://www.eea.europa.eu/data-and-maps/daviz/new-electric-vehicles-in-eu-2#tab-chart_3 (accessed on 2 December 2022).
- Bukhari, S.M.A.S.; Maqsood, J.; Baig, M.Q.; Ashraf, S.; Khan, T.A. Comparison of Characteristics—Lead Acid, Nickel Based, Lead Crystal and Lithium Based Batteries. In Proceedings of the 2015 17th UKSim-AMSS International Conference on Modelling and Simulation (UKSim), Cambridge, UK, 25–27 March 2016; pp. 444–450. [Google Scholar] [CrossRef]
- Spitthoff, L.; Shearing, P.; Burheim, O. Temperature, Ageing and Thermal Management of Lithium-Ion Batteries. Energies 2021, 14, 1248. [Google Scholar] [CrossRef]
- Liu, S.; Zhang, H.; Xu, X. A study on the transient heat generation rate of lithium-ion battery based on full matrix orthogonal experimental design with mixed levels. J. Energy Storage 2021, 36, 102446. [Google Scholar] [CrossRef]
- Drake, S.; Martin, M.; Wetz, D.; Ostanek, J.; Miller, S.; Heinzel, J.; Jain, A. Heat generation rate measurement in a Li-ion cell at large C-rates through temperature and heat flux measurements. J. Power Sources 2015, 285, 266–273. [Google Scholar] [CrossRef]
- Liu, P.; Wang, J.; Hicks-Garner, J.; Sherman, E.; Soukiazian, S.; Verbrugge, M.; Tataria, H.; Musser, J.; Finamore, P. Aging Mechanisms of LiFePO[sub 4] Batteries Deduced by Electrochemical and Structural Analyses. J. Electrochem. Soc. 2010, 157, A499–A507. [Google Scholar] [CrossRef]
- Amine, K.; Liu, J.; Belharouak, I. High-temperature storage and cycling of C-LiFePO4/graphite Li-ion cells. Electrochem. Commun. 2005, 7, 669–673. [Google Scholar] [CrossRef]
- Ramadass, P.; Haran, B.; White, R.; Popov, B.N. Capacity fade of Sony 18650 cells cycled at elevated temperatures: Part I. Cycling performance. J. Power Sources 2002, 112, 606–613. [Google Scholar] [CrossRef]
- Maleki, H.; Deng, G.; Anani, A.; Howard, J. Thermal Stability Studies of Li-Ion Cells and Components. J. Electrochem. Soc. 1999, 146, 3224–3229. [Google Scholar] [CrossRef]
- Drake, S.; Wetz, D.; Ostanek, J.; Miller, S.; Heinzel, J.; Jain, A. Measurement of anisotropic thermophysical properties of cylindrical Li-ion cells. J. Power Sources 2014, 252, 298–304. [Google Scholar] [CrossRef]
- Zhang, G.; Cao, L.; Ge, S.; Wang, C.-Y.; Shaffer, C.E.; Rahn, C.D. In Situ Measurement of Radial Temperature Distributions in Cylindrical Li-Ion Cells. J. Electrochem. Soc. 2014, 161, A1499–A1507. [Google Scholar] [CrossRef]
- Shah, K.; Vishwakarma, V.; Jain, A. Measurement of Multiscale Thermal Transport Phenomena in Li-Ion Cells: A Review. J. Electrochem. Energy Convers. Storage 2016, 13. [Google Scholar] [CrossRef]
- Nazari, A.; Farhad, S. Heat generation in lithium-ion batteries with different nominal capacities and chemistries. Appl. Therm. Eng. 2017, 125, 1501–1517. [Google Scholar] [CrossRef]
- Miao, Y.; Hynan, P.; von Jouanne, A.; Yokochi, A. Current Li-Ion Battery Technologies in Electric Vehicles and Opportunities for Advancements. Energies 2019, 12, 1074. [Google Scholar] [CrossRef]
- Jindal, P.; Katiyar, R.; Bhattacharya, J. Evaluation of accuracy for Bernardi equation in estimating heat generation rate for continuous and pulse-discharge protocols in LFP and NMC based Li-ion batteries. Appl. Therm. Eng. 2021, 201, 117794. [Google Scholar] [CrossRef]
- Xie, Y.; Shi, S.; Tang, J.; Wu, H.; Yu, J. Experimental and analytical study on heat generation characteristics of a lithium-ion power battery. Int. J. Heat Mass Transf. 2018, 122, 884–894. [Google Scholar] [CrossRef]
- Christen, R.; Martin, B.; Rizzo, G. New Experimental Approach for the Determination of the Heat Generation in a Li-Ion Battery Cell. Energies 2021, 14, 6972. [Google Scholar] [CrossRef]
- Arora, S.; Kapoor, A. Experimental Study of Heat Generation Rate during Discharge of LiFePO4 Pouch Cells of Different Nominal Capacities and Thickness. Batteries 2019, 5, 70. [Google Scholar] [CrossRef]
- Huang, Y.; Lu, Y.; Huang, R.; Chen, J.; Chen, F.; Liu, Z.; Yu, X.; Roskilly, A.P. Study on the thermal interaction and heat dissipation of cylindrical Lithium-Ion Battery cells. Energy Procedia 2017, 142, 4029–4036. [Google Scholar] [CrossRef]
- Bandhauer, T.M.; Garimella, S.; Fuller, T.F. A Critical Review of Thermal Issues in Lithium-Ion Batteries. J. Electrochem. Soc. 2011, 158, R1. [Google Scholar] [CrossRef]
- Zhang, J.; Huang, J.; Li, Z.; Wu, B.; Nie, Z.; Sun, Y.; An, F.; Wu, N. Comparison and validation of methods for estimating heat generation rate of large-format lithium-ion batteries. J. Therm. Anal. 2014, 117, 447–461. [Google Scholar] [CrossRef]
- Liu, F.; Lan, F.; Chen, J. Dynamic thermal characteristics of heat pipe via segmented thermal resistance model for electric vehicle battery cooling. J. Power Sources 2016, 321, 57–70. [Google Scholar] [CrossRef]
- Kleiner, J.; Singh, R.; Schmid, M.; Komsiyska, L.; Elger, G.; Endisch, C. Influence of heat pipe assisted terminal cooling on the thermal behavior of a large prismatic lithium-ion cell during fast charging in electric vehicles. Appl. Therm. Eng. 2020, 188, 116328. [Google Scholar] [CrossRef]
- Hosseinzadeh, E.; Marco, J.; Jennings, P. The impact of multi-layered porosity distribution on the performance of a lithium ion battery. Appl. Math. Model. 2018, 61, 107–123. [Google Scholar] [CrossRef]
- Mahfoudi, N.; Boutaous, M.; Xin, S.; Buathier, S. Thermal Analysis of LMO/Graphite Batteries Using Equivalent Circuit Models. Batteries 2021, 7, 58. [Google Scholar] [CrossRef]
- Surya, S.; Marcis, V.; Williamson, S. Core Temperature Estimation for a Lithium Ion 18650 Cell. Energies 2020, 14, 87. [Google Scholar] [CrossRef]
- Thakur, A.K.; Prabakaran, R.; Elkadeem, M.; Sharshir, S.W.; Arıcı, M.; Wang, C.; Zhao, W.; Hwang, J.-Y.; Saidur, R. A state of art review and future viewpoint on advance cooling techniques for Lithium–ion battery system of electric vehicles. J. Energy Storage 2020, 32, 101771. [Google Scholar] [CrossRef]
- Lin, C.; Xu, S.; Liu, J. Measurement of heat generation in a 40 Ah LiFePO4 prismatic battery using accelerating rate calorimetry. Int. J. Hydrogen Energy 2018, 43, 8375–8384. [Google Scholar] [CrossRef]
- Hu, Y.; Choe, S.-Y.; Garrick, T.R. Measurement of heat generation rate and heat sources of pouch type Li-ion cells. Appl. Therm. Eng. 2021, 189, 116709. [Google Scholar] [CrossRef]
- Yin, Y.; Zheng, Z.; Choe, S.-Y. Design of a Calorimeter for Measurement of Heat Generation Rate of Lithium Ion Battery Using Thermoelectric Device. SAE Int. J. Altern. Powertrains 2017, 6, 252–260. [Google Scholar] [CrossRef]
- Diaz, L.B.; Hales, A.; Marzook, M.W.; Patel, Y.; Offer, G. Measuring Irreversible Heat Generation in Lithium-Ion Batteries: An Experimental Methodology. J. Electrochem. Soc. 2022, 169, 030523. [Google Scholar] [CrossRef]
- Chen, S.; Wan, C.; Wang, Y. Thermal analysis of lithium-ion batteries. J. Power Sources 2005, 140, 111–124. [Google Scholar] [CrossRef]
- Chen, S.C.; Wang, Y.-Y.; Wan, C.-C. Thermal Analysis of Spirally Wound Lithium Batteries. J. Electrochem. Soc. 2006, 153, A637–A648. [Google Scholar] [CrossRef]
- Buidin, T.; Mariasiu, F. Battery Thermal Management Systems: Current Status and Design Approach of Cooling Technologies. Energies 2021, 14, 4879. [Google Scholar] [CrossRef]
- Becker, J.A.; Green, C.B.; Pearson, G.L. Properties and Uses of Thermistors—Thermally Sensitive Resistors. Trans. Am. Inst. Electr. Eng. 1946, 65, 711–725. [Google Scholar] [CrossRef]
- Childs, P.R.N.; Greenwood, J.R.; Long, C.A. Review of temperature measurement. Rev. Sci. Instrum. 2000, 71, 2959–2978. [Google Scholar] [CrossRef]
- Raijmakers, L.; Danilov, D.; Eichel, R.-A.; Notten, P. A review on various temperature-indication methods for Li-ion batteries. Appl. Energy 2019, 240, 918–945. [Google Scholar] [CrossRef]
- Duff, M.; Towey, J. Two Ways to Measure Temperature Using Thermocouples Feature Simplicity, Accuracy, and Flexibility. Analog Dialogue 2010, 44, 1–6. [Google Scholar]
- Lv, Y.; Zhou, D.; Yang, X.; Liu, X.; Li, X.; Zhang, G. Experimental investigation on a novel liquid-cooling strategy by coupling with graphene-modified silica gel for the thermal management of cylindrical battery. Appl. Therm. Eng. 2019, 159, 113885. [Google Scholar] [CrossRef]
- Weng, J.; Yang, X.; Zhang, G.; Ouyang, D.; Chen, M.; Wang, J. Optimization of the detailed factors in a phase-change-material module for battery thermal management. Int. J. Heat Mass Transf. 2019, 138, 126–134. [Google Scholar] [CrossRef]
- Yan, J.; Li, K.; Chen, H.; Wang, Q.; Sun, J. Experimental study on the application of phase change material in the dynamic cycling of battery pack system. Energy Convers. Manag. 2016, 128, 12–19. [Google Scholar] [CrossRef]
- Lv, Y.; Situ, W.; Yang, X.; Zhang, G.; Wang, Z. A novel nanosilica-enhanced phase change material with anti-leakage and anti-volume-changes properties for battery thermal management. Energy Convers. Manag. 2018, 163, 250–259. [Google Scholar] [CrossRef]
- Zhang, J.; Li, X.; Zhang, G.; Wang, Y.; Guo, J.; Wang, Y.; Huang, Q.; Xiao, C.; Zhong, Z. Characterization and experimental investigation of aluminum nitride-based composite phase change materials for battery thermal management. Energy Convers. Manag. 2019, 204, 112319. [Google Scholar] [CrossRef]
- Ling, Z.; Wen, X.; Zhang, Z.; Fang, X.; Gao, X. Thermal management performance of phase change materials with different thermal conductivities for Li-ion battery packs operated at low temperatures. Energy 2017, 144, 977–983. [Google Scholar] [CrossRef]
- Zhong, G.; Zhang, G.; Yang, X.; Li, X.; Wang, Z.; Yang, C.; Yang, C.; Gao, G. Researches of composite phase change material cooling/resistance wire preheating coupling system of a designed 18650-type battery module. Appl. Therm. Eng. 2017, 127, 176–183. [Google Scholar] [CrossRef]
- Lyu, Y.; Siddique, A.; Majid, S.; Biglarbegian, M.; Gadsden, S.; Mahmud, S. Electric vehicle battery thermal management system with thermoelectric cooling. Energy Rep. 2019, 5, 822–827. [Google Scholar] [CrossRef]
- Li, X.; Zhong, Z.; Luo, J.; Wang, Z.; Yuan, W.; Zhang, G.; Yang, C.; Yang, C. Experimental Investigation on a Thermoelectric Cooler for Thermal Management of a Lithium-Ion Battery Module. Int. J. Photoenergy 2019, 2019, 3725364. [Google Scholar] [CrossRef]
- Behi, H.; Karimi, D.; Behi, M.; Jaguemont, J.; Ghanbarpour, M.; Behnia, M.; Berecibar, M.; Van Mierlo, J. Thermal management analysis using heat pipe in the high current discharging of lithium-ion battery in electric vehicles. J. Energy Storage 2020, 32, 101893. [Google Scholar] [CrossRef]
- Löbberding, H.; Wessel, S.; Offermanns, C.; Kehrer, M.; Rother, J.; Heimes, H.; Kampker, A. From Cell to Battery System in BEVs: Analysis of System Packing Efficiency and Cell Types. World Electr. Veh. J. 2020, 11, 77. [Google Scholar] [CrossRef]
- Liang, J.; Gan, Y.; Li, Y.; Tan, M.; Wang, J. Thermal and electrochemical performance of a serially connected battery module using a heat pipe-based thermal management system under different coolant temperatures. Energy 2019, 189, 116233. [Google Scholar] [CrossRef]
- Barkholtz, H.M.; Preger, Y.; Ivanov, S.; Langendorf, J.; Torres-Castro, L.; Lamb, J.; Chalamala, B.; Ferreira, S.R. Multi-scale thermal stability study of commercial lithium-ion batteries as a function of cathode chemistry and state-of-charge. J. Power Sources 2019, 435, 226777. [Google Scholar] [CrossRef]
- Huang, Y.; Lin, Y.-C.; Jenkins, D.M.; Chernova, N.A.; Chung, Y.; Radhakrishnan, B.; Chu, I.-H.; Fang, J.; Wang, Q.; Omenya, F.; et al. Thermal Stability and Reactivity of Cathode Materials for Li-Ion Batteries. ACS Appl. Mater. Interfaces 2016, 8, 7013–7021. [Google Scholar] [CrossRef]
- Mevawalla, A.; Panchal, S.; Tran, M.-K.; Fowler, M.; Fraser, R. Mathematical Heat Transfer Modeling and Experimental Validation of Lithium-Ion Battery Considering: Tab and Surface Temperature, Separator, Electrolyte Resistance, Anode-Cathode Irreversible and Reversible Heat. Batteries 2020, 6, 61. [Google Scholar] [CrossRef]
- Houache, M.S.E.; Yim, C.-H.; Karkar, Z.; Abu-Lebdeh, Y. On the Current and Future Outlook of Battery Chemistries for Electric Vehicles—Mini Review. Batteries 2022, 8, 70. [Google Scholar] [CrossRef]
- Mirsalehian, M.; Beykirch, R. Thermal Investigation and Physical Modeling of Lithium-ion Batteries. ATZ Worldw. 2020, 122, 36–41. [Google Scholar] [CrossRef]
Publisher’s Note: MDPI stays neutral with regard to jurisdictional claims in published maps and institutional affiliations. |
© 2022 by the authors. Licensee MDPI, Basel, Switzerland. This article is an open access article distributed under the terms and conditions of the Creative Commons Attribution (CC BY) license (https://creativecommons.org/licenses/by/4.0/).