Abstract
The most popular approach for smoothing renewable power generation fluctuations is to use a battery energy storage system. The lead-acid battery is one of the most used types, due to several advantages, such as its low cost. However, the precision of the model parameters is crucial to a reliable and accurate model. Therefore, determining actual battery storage model parameters is required. This paper proposes an optimal identification strategy for extracting the parameters of a lead-acid battery. The proposed identification strategy-based metaheuristic optimization algorithm is applied to a Shepherd model. The bald eagle search algorithm (BES) based identification strategy provided excellent performance in extracting the battery’s unknown parameters. As a result, the proposed identification strategy’s total voltage error has been reduced to 2.182 × 10⁻³, where the root mean square error (RMSE) between the model and the data is 6.26 × 10⁻⁵. In addition, the optimization efficiency achieved 85.32% using the BES algorithm, which approved its efficiency.
1. Introduction
Due to the overuse of fossil fuels, there has been an increase in air pollution and global warming worldwide. As a result, the development of various alternative energy sources has been substantially expedited. Renewable energy sources such as solar energy have recently received much attention as an alternative solution. Because of their unexpected and intermittent availability, renewable energy sources have encountered a dilemma regarding power generation. This changeable nature poses considerable challenges to the power grid, such as instability and power quality issues. Energy storage systems (ESS), such as battery storage systems, have been presented to address these issues [1]. Batteries in renewable energy applications must have high cycle stability and an intense discharge rate. Lead-acid batteries (LaBs) can be suitable for these applications [2]. Lead-acid batteries (LaB) are commonly utilized in various applications where cost takes precedence over weight and space. In addition, a LaB battery has the advantages of being totally recyclable, maintenance-free, and have a high reserve capacity [3]. However, after a lengthy period of usage, the properties of the batteries will degrade, owing to changes in their internal states, such as capacity, state of health (SoH), and remaining useful lifecycle [4]. In addition, the battery model has usually been used for battery management system (BMS) laws. Battery deterioration, on the other hand, clearly produces parametric modifications, which reduce their performance [5]. Therefore, to ensure its lifecycle’s proper functioning and extension, the BMS must consider its internal parameters. Furthermore, battery identification enables the estimation of the battery’s state of health (SoC), which displays the deterioration ratio [6].
Some of these parameters can be extracted using an appropriate model and experiment/manufacture data. The battery behavior has been expressed using several models. There are Shepherd [7], Guasch [8], PSPice [9], and CIEMAT [10] models among the existing models. Each model contains several parameters that must be identified. The other parameters cannot be measured directly and can only be determined using model-based strategies.
In the literature review, several identification techniques and methodologies have been provided to extract the unknown parameters of the battery model. Shen et al. [11] suggested a group-wise algorithm-based identification Lithium-ion (Li-ion) battery parameter technique. However, this approach is essentially experimental and depends on measurement precision and data availability. An extended Kalman filter (EKF) and an unscented Kalman filter (UKF) were used to identifying the resistance-capacitance (RC) model [12]. The precision of these approaches is determined by the filter settings, which may increase the estimation error. Due to their excellent performance, the utilization of metaheuristic algorithms (MAs) in extracting the battery parameters has gained considerable attention. Some of the used MAs are artificial ecosystem-based optimization (AEO) [6], modified COOT [13], and the bald eagle search algorithm (BES) [14].
Unlike lithium-ion batteries (Li-ion), few papers present lead-acid battery identification strategies. In [15], several methods for predicting the lifespan of lead-acid batteries are compared. Each strategy’s merits and downsides are listed in this paper. A simple, fast, and practical identification approach was reported in [16] to extract the parameters of an equivalent circuit model for lead-acid batteries. The suggested approach is based on an experimental data set. A review of LaB’s state of health estimation methods is presented and discussed in [17]. The battery aging and the SoH estimation strategies are well explained in this paper. The reported research in [18] proposes an algebraic approach for identifying Thevenin’s equivalent circuit model parameters. The identification strategy has been operated under non-zero initial conditions. An optimal LaB battery parameters identification strategy using Evolutionary Algorithms (EA) has been proposed in [19]. This strategy is based on reducing the error between the real and estimated datasets.
Identification strategies based on metaheuristic optimization algorithms (MAs) are getting more consideration, thanks to their high accuracy. These algorithms have been used extensively in extracting the Li-ion battery parameters, such as the bald eagle search algorithm (BES). BES is a new optimizer with a high convergence rate and high exploitation and exploration performance due to the triple updating phases [20]. This makes it an excellent choice for identification applications. In this paper, an offline identification strategy for a LaB is performed. The provided model can be used to enhance its integration for renewable applications, such as photovoltaic applications. The main aims of this search can be listed as:
- Suggest an optimal identification strategy based on the MAs for the LaB battery model.
- Investigate and confirm the high performance of the BES-based identification strategy.
- Approve the accuracy of the proposed identification strategy by extracting the real parameters of a Banner 100 Ah battery.
The remainder of the article has been arranged as follows. The battery mathematical model using the Shepherd model is introduced in Section 2. Then, the BES-based identification strategy is well described in Section 3. Section 4 shows the results, as well as a discussion section. Lastly, Section 5 presents the main findings.
2. Lead Acid Battery Modeling
The lead-acid model has been proposed and explained in [21]. The Shepherd relation is the simplest and most popular battery model [7]. It defines the charging and discharging phases’ nonlinearity. The discharge equation for a Lead acid battery is as follows:
where Vdis is the discharging battery output,
Vch are the charging battery outputs,
E0 is the constant voltage (V), Q denotes the battery’s nominal capacity (Ah), K represents a polarization constant (Ah−1), it denotes the current battery charge () (Ah), Rint is the internal resistance (Ω), and i and i* are the battery output current and the filtered current (A), respectively. Vpol represents the polarization voltage (V), Vohm represents the ohmic loses voltage (V), and Vexp represents the exponential zone voltage containing the hysteresis phenomenon.
where A is the amplitude of the exponential zone (V), B denotes the time constant inverse of the exponential area (Ah−1), and u represents the operating mode (u = 1 for the charging case and u = 0 for the discharge case). At the full charge state, the Vexp contributes more than 1 V, which is much higher than Vpol or Vohm. Hence, the output voltage at this state is higher than E0.
For this model, the following assumptions must be considered:
- Rint is assumed to be constant during the charge and discharge modes and does not change in proportion to the amplitude of the current.
- The model’s parameters are extracted from the discharge mode characteristics and are supposed to be equal to the charging model.
- No Peukert effect (Q does not vary with the current amplitude).
- No thermal effect.
- No self-discharge effect.
- No memory effect.
A lead-acid battery discharging model is presented in Figure 1.
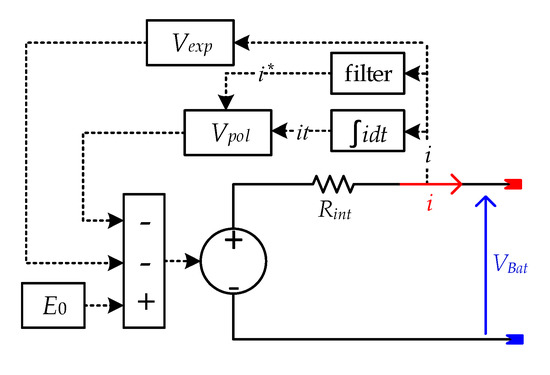
Figure 1.
Lead-acid battery discharging model.
3. Proposed Identification Strategy
3.1. Problem Formulation
The proposed methodology depends on minimizing the voltage difference between real-world battery data and its model. The fitness function is generated using the root main square voltage error (RMSE). The RMSE is represented as follows
where VData(T) is the measured data at instant T, VModel(T) is the model output voltage, T is discrete-time (T = k.Ts), Ts is the sampling time, k = 0, 1, 2,….M, and M is the measurement data size.
The idea is to determine the best set of parameters x for the unknown model that minimizes the objective function. The set of parameters x can be expressed as follow
The optimizer assigns the candidate solutions x on the model at the first step. Then, the error is generated, and the objective function of the candidate solutions x is evaluated. Finally, the best solution will be assigned as a target solution, which will repeat until the last iteration. The candidate solutions have to be limited within their limits as
where LB and UB are the lower and the upper limits of the candidate solutions.
3.2. Bald Eagle Search Algorithm
The bald eagle search algorithm (BES) is a recent bio-inspired metaheuristic optimizer [20]. It emulates the searching and fishing strategy of a bald eagle. This algorithm contains three stages: selecting space, searching in the space, and swooping.
Select space: the eagle flies from a random place and searches for the area that includes the prey. This stage can be modeled as follows
where Pnew denotes the candidate spaces, Pbest is the prey space (best position), α is controlling again [1.5, 2], and r is a penalty factor [0, 1]. Pm denotes the mean of all the existing spaces. The prey space will be updated based on the obtained fitness of the new spaces Pnew.
Searching in the space: In this stage, the eagle explores the chosen space in the previous stage, and determines the best position to hunt the prey. This stage can be expressed as follow
where Pnew represents a set of new possible positions for hunting and x and y represent the direction coordinates. They can be expressed as follow
where a represents a constant factor [5, 10] employed to define the corner between point search in the central point, and R represents a fixed factor [0.5, 2] employed to specify the number of searching cycles.
Swooping: the eagle pounces on its prey from the best-obtained location in the previous stage. This stage can be expressed as follow
where c1 and c2 are random numbers in [1, 2]; x1 and y1 are direction coordinates that can be defined as
4. Results and Discussion
4.1. Test 01
The lead-acid battery model was created using Matlab 2020a. Random solutions within the search space restrictions were generated and assigned to the model as candidate solutions. The model was then run using these parameters, and the results were compared to the measured data. The error was used in the objective function Equation (4).
A predetermined current supplied the considered LaB battery. The output voltage was saved and used in the identification process. The actual parameters of the considered battery are presented in Table 1. The used current and measured voltage are delivered in Figure 2.

Table 1.
Real Battery Parameters.

Figure 2.
Lead-acid battery data: current and voltage.
Since the MAs are stochastic algorithms that start from random positions, the results for each time can be different. The algorithm’s robustness means its ability to provide similar or close to results for each identification process. The robustness can be evaluated using ANOVA and Tuckey statistical tests.
Its results were compared with those provided by employing other MAs such as PSO, SSA, AEO, MPA, and COOT to confirm the proposed method’s high performance. However, due to the stochastic nature of the MAs, each algorithm was performed 30 times to approve the performance in terms of robustness and accuracy. Each algorithm was initialized with the following parameters: Population size (N = 30); Number of max iterations (Tmax = 30); Upper search space limit (UB): 120% of the actual value; and lower search space limit (LB): 80% of the actual value.
Table 2 shows the final parameters for the first, middle, and last runs. The identification statistics are given in Table 3.

Table 2.
Identification results.

Table 3.
Identification statistics.
The average efficiency can be calculated as follow
where n is the number of runs (30 runs), OFest is the estimated fitness value, and OFbest is the best-obtained fitness value.
From the provided results in Table 2, all the estimated parameters were near the real ones. However, the identification precision differed from one algorithm to another and from run to run. To analyze these results, a statistical study is presented in Table 3. Based on these results, the best mean fitness value was 7.79776 × 10⁻⁵, provided by the BES. In addition, the BES’s min, max, and standard deviation were the best-obtained results by 6.26281 × 10⁻⁵, 16.2673 × 10⁻⁵, and 6.26281 × 10⁻⁵, respectively. Moreover, the BES optimization efficiency was the highest at 85.32%. Consequently, the battery parameters estimated using the BES were nearer to the actual values. However, the elapsed time by the BES was much longer compared to the other optimizers, as confirmed by the total voltage error (2.182 × 10⁻³).
Figure 3 introduces the evolution of the mean fitness. The provided curves demonstrate the superiority of the BES over the other methods. The mean fitness value was 7.79776 × 10⁻⁵, which is better than the AEO by 2.25 times, better than the MPA by five times, better than the COT by 16 times, better than the SSA by 18 times, and finally better than PSO by 36. Furthermore, the BES needed only ten iterations to reach the minimum cost function, unlike the other algorithms, regarding the convergence rate.
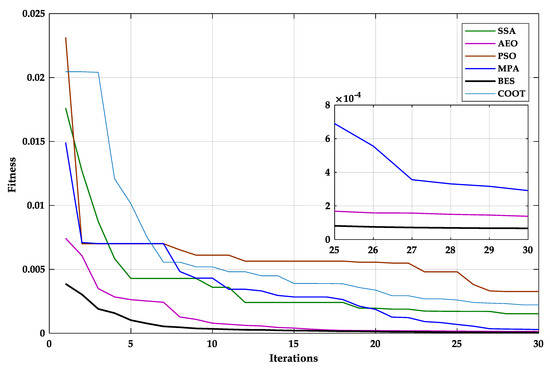
Figure 3.
Mean fitness evolution.
Figure 4 presents the agent evolution of both PSO, SSA, and COOT algorithms. Figure 5 shows the agent evolution of MPA, AEO, and BES algorithms. These curves explain the obtained results in Table 2 and Table 3. The PSO and COOT algorithms required more iterations to achieve better results. Thirty iterations were not enough. SSA agents were much closer to optimal results than PSO and COOT. However, the accuracy was still weak during the last iterations. The MPA provided a competitive performance; however, the variation range of its agent was vast compared with BES and AEO. BES and AEO gave the best results in terms of accuracy and convergence speed; the movement of their agents can explain this. Nevertheless, the evolution of the BES agents is slightly better than the evolution of the AEO agent, demonstrating its superiority.
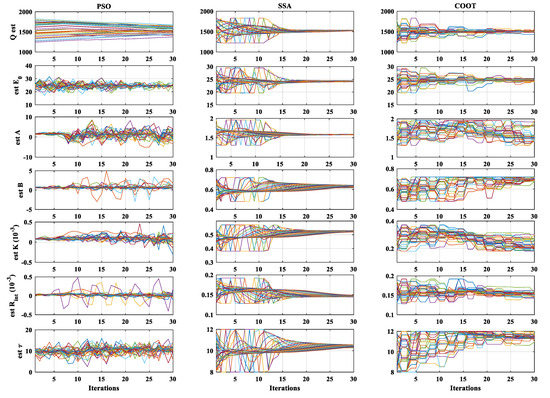
Figure 4.
The evolution of PSO, SSA, and COOT during the optimization process.
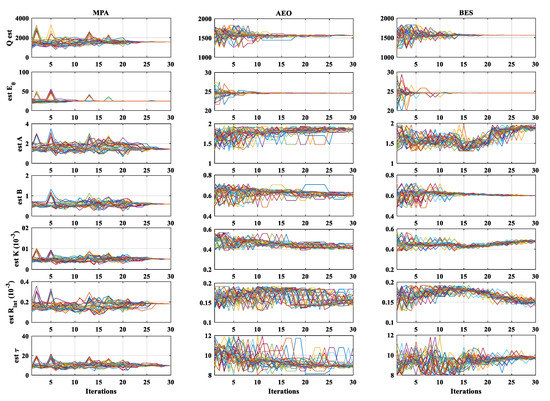
Figure 5.
The evolution of MPA, AEO, and BES during the optimization process.
A variation analysis test called ANOVA was performed to approve the superiority of the BES. The ANOVA test results are provided in Table 4 and Figure 6. These results prove the high ability of the suggested identification strategy to extract the optimal lead-acid battery.

Table 4.
ANOVA Results.

Figure 6.
ANOVA ranking for the considered algorithms.
The calculated and measured voltages are given in Figure 7. The model output voltage is identical to the measured battery voltage. Therefore, the battery parameters were accurately identified using the proposed strategy.

Figure 7.
Voltage curves of the battery model and the measured data.
4.2. Test 02
Some parameters can be known or measured (Q, Rint, and E0). In this case, these parameters were set very close to their real values to produce a simpler optimization problem where the number of unknown parameters was decreased to only four. In this case, only the following parameters were identified: K, A, B, and τ. The search space limits were extended to 150% of the real values. The statistical results are provided in Table 5, and the produced fitness curves are illustrated in Figure 8.

Table 5.
Identification statistics for test 2.
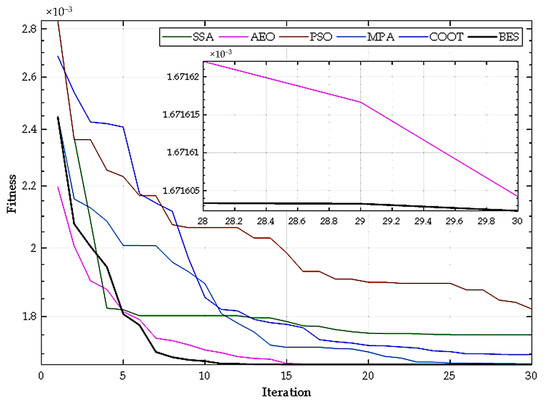
Figure 8.
Mean fitness evolution as a function of the iterations.
The other optimization algorithms’ performance was raised to reduce the optimization problem complexity. The AEO provided a very similar performance to the BES, with a slight superiority in terms of mean fitness to the BES and a slight advantage to the AEO in terms of StD.
4.3. Test 03
The experimental testing results in [22] were used to extract the parameters of Banner 120 Ah Lab. These testing results are illustrated in Figure 8. The used battery had been supplied with a constant current (20 A). The search space limits are presented in Table 6, where the used data are presented in Figure 9.

Table 6.
Search space limits for Banner 120 Ah battery model.

Figure 9.
Experimental voltage curves of Banner 75 Ah.
The mean fitness evolution compared with those provided by employing other MAs is provided in Figure 10. Due to the large data size, each algorithm was performed five times. Each algorithm was initialized with the same parameters as in previous cases. The search space limits were set approximately.

Figure 10.
Mean fitness evolution as a function of the iterations.
As shown in Figure 10, MPA and BES offer very similar performance with a slight superiority to BES, as shown in the statistical results in Table 7 and Table 8. The statistical results below prove the ability of the proposed identification strategy to extract the LaB parameters accurately. Regarding accuracy, the BES provided the minimum fitness value (0.0747). Regarding the robustness, the BES’ StD value (2.4 × 10⁻⁷) is the lowest, and the obtained parameters in Table 7 are very similar, which approves its robustness.

Table 7.
Identification results for Banner battery case.

Table 8.
Identification statistics for test 2 for Banner battery case.
The discharge curve simulated based on parameters obtained by the BES model compared to the measured data is provided in Figure 11.
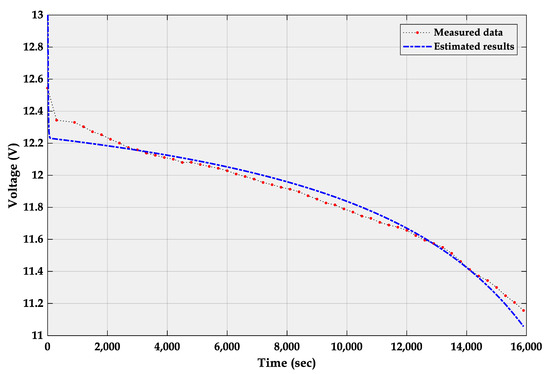
Figure 11.
Measured and estimated voltage curves.
5. Conclusions
This article suggests a recent method for identifying lead-acid battery parameters. This method updates the battery model with unknown parameters employing the metaheuristic algorithm algorithms. The identification compares the model output with actual measured data, and RMSE is utilized as an objective function. Particle swarm optimization (PSO), salp swarm algorithm (SSA), marine predator algorithm (MPA), artificial eco-system optimizer (AEO), COOT algorithm, and bald eagle search algorithm (BES) were employed to minimize the objective function of the optimization problem. The results demonstrated the capability of BES compared with the other used algorithms in terms of the mean value of 7.79776 × 10⁻⁵, optimization efficiency by 85.32%, convergence rate, and robustness, where the StD is 6.26281 × 10⁻⁵. In addition, the total voltage error between the model and the measured data is 2.182 × 10⁻³, which is the smallest obtained value. The BES achieved the best results in extracting the parameters of a 120 Ah Banner battery, compared to the other considered algorithms, which approve its performance in both robustness and accuracy. The findings approve that the suggested identification method is excellent at precisely estimating the parameters of a lead-acid battery. In addition, the proposed method proved highly accurate compared to various algorithms and three testing cases.
Author Contributions
Conceptualization, H.R. and S.F.; methodology, H.R., A.F. and S.F.; software, H.R. and S.F.; formal analysis, R.M.G.; writing—original draft preparation, All authors; writing—review and editing, All authors. All authors have read and agreed to the published version of the manuscript.
Funding
This work was funded by the Deanship of Scientific Research at Princess Nourah bint Abdulrahman University, through the Research Groups Program Grant no. (RGP-1443-0046).
Institutional Review Board Statement
Not applicable.
Informed Consent Statement
Not applicable.
Data Availability Statement
Not applicable.
Conflicts of Interest
The authors declare no conflict of interest.
References
- Kebede, A.A.; Coosemans, T.; Messagie, M.; Jemal, T.; Behabtu, H.A.; Van Mierlo, J.; Berecibar, M. Techno-economic analysis of lithium-ion and lead-acid batteries in stationary energy storage application. J. Energy Storage 2021, 40, 102748. [Google Scholar] [CrossRef]
- Loukil, J.; Masmoudi, F.; Derbel, N. A real-time estimator for model parameters and state of charge of lead acid batteries in photovoltaic applications. J. Energy Storage 2021, 34, 102184. [Google Scholar] [CrossRef]
- May, G.J.; Davidson, A.; Monahov, B. Lead batteries for utility energy storage: A review. J. Energy Storage 2018, 15, 145–157. [Google Scholar] [CrossRef]
- Křivík, P.; Bača, P.; Kazelle, J. Effect of ageing on the impedance of the lead-acid battery. J. Energy Storage 2021, 36, 102382. [Google Scholar] [CrossRef]
- Lai, X.; Jin, C.; Yi, W.; Han, X.; Feng, X.; Zheng, Y.; Ouyang, M. Mechanism, modeling, detection, and prevention of the internal short circuit in lithium-ion batteries: Recent advances and perspectives. Energy Storage Mater. 2021, 35, 470–499. [Google Scholar] [CrossRef]
- Ferahtia, S.; Djeroui, A.; Rezk, H.; Chouder, A.; Houari, A.; Machmoum, M. Optimal parameter identification strategy applied to lithium-ion battery model. Int. J. Energy Res. 2021, 45, 16741–16753. [Google Scholar] [CrossRef]
- Tremblay, O.; Dessaint, L.-A. Experimental Validation of a Battery Dynamic Model for EV Applications. World Electr. Veh. J. 2009, 3, 289–298. [Google Scholar] [CrossRef]
- Guasch, D.; Silvestre, S. Dynamic battery model for photovoltaic applications. Prog.Photovolt. Res. Appl. 2003, 11, 193–206. [Google Scholar] [CrossRef]
- Ghosh, S.; Maka, S. A NARX modeling-based approach for evaluation of insulin sensitivity. Biomed. Signal Process. Control 2009, 4, 49–56. [Google Scholar] [CrossRef]
- McIntyre, M.; Burg, T.; Dawson, D.; Xian, B. Adaptive State of Charge (SOC) estimator for a battery. In Proceedings of the American Control Conference, Minneapolis, MN, USA, 14–16 June 2006; Volume 2006, pp. 5740–5744. [Google Scholar]
- Shen, W.-J.; Li, H.-X. A Sensitivity-Based Group-Wise Parameter Identification Algorithm for the Electric Model of Li-Ion Battery. IEEE Access 2017, 5, 4377–4387. [Google Scholar] [CrossRef]
- Andre, D.; Nuhic, A.; Soczka-Guth, T.; Sauer, D.U. Comparative study of a structured neural network and an extended Kalman filter for state of health determination of lithium-ion batteries in hybrid electricvehicles. Eng. Appl. Artif. Intell. 2013, 26, 951–961. [Google Scholar] [CrossRef]
- Houssein, E.H.; Hashim, F.A.; Ferahtia, S.; Rezk, H. Battery parameter identification strategy based on modified coot optimization algorithm. J. Energy Storage 2022, 46, 103848. [Google Scholar] [CrossRef]
- Fathy, A.; Ferahtia, S.; Rezk, H.; Yousri, D.; Abdelkareem, M.A.; Olabi, A.G. Robust parameter estimation approach of Lithium-ion batteries employing bald eagle search algorithm. Int. J. Energy Res. 2022, 46, 10564–10575. [Google Scholar] [CrossRef]
- Sauer, D.U.; Wenzl, H. Comparison of different approaches for lifetime prediction of electrochemical systems—Using lead-acid batteries as example. J. Power Sources 2008, 176, 534–546. [Google Scholar] [CrossRef]
- Moubayed, N.; Kouta, J.; El-Ali, A.; Dernayka, H.; Outbib, R. Parameter identification of the lead-acid battery model. In Proceedings of the 2008 33rd IEEE Photovolatic Specialists Conference, San Diego, CA, USA, 11–16 May 2008; pp. 1–6. [Google Scholar]
- Jiang, S.; Song, Z. A review on the state of health estimation methods of lead-acid batteries. J. Power Sources 2021, 517, 230710. [Google Scholar] [CrossRef]
- Devarakonda, L.; Hu, T. Algebraic method for parameter identification of circuit models for batteries under non-zero initial condition. J. Power Sources 2014, 268, 928–940. [Google Scholar] [CrossRef]
- Chacón, H.A.; Banguero, E.; Correcher, A.; Pérez-Navarro, Á.; Morant, F. Modelling, Parameter Identification, and Experimental Validation of a Lead Acid Battery Bank Using Evolutionary Algorithms. Energies 2018, 11, 2361. [Google Scholar] [CrossRef]
- Alsattar, H.A.; Zaidan, A.A.; Zaidan, B.B. Novel meta-heuristic bald eagle search optimisation algorithm. Artif. Intell. Rev. 2019, 53, 2237–2264. [Google Scholar] [CrossRef]
- Nikolian, A.; de Hoog, J.; Fleurbay, K.; Timmermans, J.; van de Bossche, P.; van Mierlo, J. Classification of Electric modelling and Characterization methods of Lithium-ion Batteries for Vehicle Applications. In Proceedings of the European Electric Vehicle Congress (EEVC), Brussels, Belgium, 3–5 December 2014; pp. 1–15. [Google Scholar]
- Achaibou, N.; Haddadi, M.; Malek, A. Lead acid batteries simulation including experimental validation. J. Power Sources 2008, 185, 1484–1491. [Google Scholar] [CrossRef]
Publisher’s Note: MDPI stays neutral with regard to jurisdictional claims in published maps and institutional affiliations. |
© 2022 by the authors. Licensee MDPI, Basel, Switzerland. This article is an open access article distributed under the terms and conditions of the Creative Commons Attribution (CC BY) license (https://creativecommons.org/licenses/by/4.0/).