Article

Improvement of Cycle Stability for Graphite-Based Lithium-Ion Batteries via Usage of Phenyl Methanesulfonate as an Electrolyte Additive

by
Behrooz Mosallanejad
1,
Mehran Javanbakht
1,2,*,
Zahra Shariatinia
1 and
Mohammad Akrami
3,*
1
Department of Chemistry, Amirkabir University of Technology (Tehran Polytechnic), Tehran P.O. Box 15875-4413, Iran
2
Renewable Energy Research Center, Amirkabir University of Technology, Tehran P.O. Box 15916-34311, Iran
3
Department of Engineering, University of Exeter, Exeter EX4 4QF, UK
*
Authors to whom correspondence should be addressed.
Batteries 2022, 8(10), 152; https://doi.org/10.3390/batteries8100152
Submission received: 21 July 2022 / Revised: 1 September 2022 / Accepted: 26 September 2022 / Published: 2 October 2022

Abstract

:
In this work, phenyl methanesulfonate (PMS) is evaluated as an additive to enhance the cyclic stability of lithium-ion batteries (LIBs) based on a graphite electrode. According to the theoretical results obtained from density functional theory (DFT) calculations, PMS possesses a lower reduction potential compared to the cyclic carbonate electrolyte solvent. Hence, this compound is foreseen to be reduced before ethylene carbonate (EC) and form a solid electrolyte interphase (SEI) layer on the graphite electrode. The cyclic stability of Li/graphite battery is promoted considerably by adding a low dose of PMS to the electrolyte. The capacity retention of the Li/graphite half-cell is incredibly improved to about 100% after 35 cycles at room temperature. The results acquired from the electrochemical and surface characterization tests corroborate that an electrolyte with PMS is capable of forming a thinner SEI layer compared to the electrolyte devoid of an additive, which can dramatically lessen the interfacial resistance. Moreover, the results show that the graphite sheets are disguised under a myriad of PMS reductive deposits, which can neutralize the catalytic activity of prismatic surfaces.

1. Introduction

In the last decades, the concerns about the rise in the production of greenhouse gases induced by the burning of fossil fuels and subsequently contributing to global warming have induced scientists to explore new energy resources [1,2]. One of the necessities of such a crucial exploration is to employ energy storage devices. The lithium-ion battery (LIB) as a reliable energy storage device has dramatically affected the world thanks to its high energy density and voltage along with its superior cycle stability. They are extensively utilized in portable devices such as cell phones and laptop computers and also in electric vehicles (EVs), which are useful to decrease environmental pollutions [3,4,5,6]. LIBs are commonly made up of a graphite anode and a transition metal oxide cathode, which are soaked in an organic electrolyte and separated by a separator [2,7]. An electrolyte, as one of the main components of LIBs, includes a solvent or a mixture of solvents which acts as a medium for the transportation of ions and a lithium salt as a source of lithium ions. Typically, a mixture of solvents is adopted for the electrolytes, which is composed of a cyclic alkyl carbonate having a high dielectric permittivity and linear alkyl carbonates with a low viscosity, which are necessary to heighten the ionic conductivity of the electrolyte [8,9]. Owing to its merits, including a superior theoretical specific capacity and the lowest negative electrochemical potential, lithium (Li) metal has been adopted as a negative electrode in rechargeable batteries. However, batteries including Li metal have not been commercialized yet because of two main hurdles: one is the growth of lithium dendrites during consecutive charge and discharge cycles, giving rise to the short circuit. The other ground is its low Coulombic efficiency (CE). Hence, Li metal was superseded with the graphite intercalation compound (GIC) as an anodic material [10,11].
Graphite as a negative electrode has been widely employed in LIBs. From a crystallographic point of view, layered graphite is an aggregate of crystalline grains with a hexagonal structure which contains two sorts of surfaces (Figure S1a) [12,13]. The first one is basal plane surfaces which are commonly devoid of any defects and contaminants and are only composed of carbon atoms. The other one is prismatic (edge) surfaces which, in addition to carbon atoms, contain chemical complexes generated during the manufacturing stages. These complexes mostly are carbon–hydrogen bonds and chemisorbed oxygen groups, which are depicted in Figure S2. The basal plane are terminated by arm-chair and zig-zag faces in which carbon fragments of one or two atoms protruding from the major condensed benzene ring structure (Figure S1b). Both arm-chair and zig-zag faces are two kinds of prismatic surfaces contributing to form surface active sites and chemisorbed oxygen groups [14,15]. The adsorption of oxygen groups onto the prismatic surfaces relies on their reactivity, in which the oxygen groups are weakly chemisorbed to active sites, denoted by “a” in Figure S1b, while the active sites nominated by “A” have a higher electron affinity, leading to stronger chemisorbed carbon–oxygen bonds [14,16].
Several irreversible charge-consuming phenomena are expected for graphite electrodes which can be roughly classified into two groups: (1) solid electrolyte interphase (SEI) generation caused by the co-intercalation of solvent molecules into the graphite electrode, and (2) the reduction in surface complexes, impurities, and residue compounds on the prismatic surfaces according to the following reactions (G represents graphite) [12,15]:
G COOH +   Li + +   e   G COOLi + 0.5 H 2
G CHO +   Li + +   e   G Li + CO + 0.5 H 2
G OH +   Li + +   e   G OLi + 0.5 H 2
G H +   Li + +   e   G Li + 0.5 H 2
Various strategies are employed to cover the active sites to diminish irreversible capacity loss. One of these beneficial avenues is the physical coating of graphite materials with a protective layer like a metal oxide. Another effective approach is the introduction of reduction-type additives into the electrolyte formulation. To define these sort of additives, they are materials whose reduction potentials are higher than those of the solvents used in the electrolyte, which allows them to undergo the reduction before the electrochemical reduction in the electrolyte solvents and produce a robust and homogenous SEI layer on the graphite surface. The resultant SEI layer coats the prismatic sites available in the graphite electrode and deactivate their catalytic activity [12,17,18].
Sulfur-containing additives are well-known as one of the kinds of reduction-type additives, the most important of which are 1,3-propane sultone (PS), butyl sultone (BS), and prop-1-ene-1,3-sultone (PES) [17,19,20]. The study of sulfur-containing additives has been a topic of great interest among scientists, and substantial attention has been paid to them. Park et al. [21] found that the inclusion of PS into the electrolyte can restrain not only PC decomposition but also Li metal deposition on the graphite electrode by coating the active sites. Xu et al. [22,23] conducted two discrete investigations, revealing that the addition of a PS additive to the electrolyte could enhance the battery’s cycling performance in low and high temperatures. Moreover, Jung and his colleagues [24] reported that 3-fluoro-1,3-propane sultone (FPS) outperforms PS and vinylene carbonate (VC) over an extensive temperature range (25–60 °C), and fluorine as an electron-withdrawing group can make the anodic stability and thermal stability of the FPS better in comparison with PS, which is lacking of fluorine atom, and VC.
The present work looks at phenyl methanesulfonate (PMS) as an electrolyte additive, taking advantage of two different functional groups, including sulfonate (-OSO2-) and phenyl. A recent work manifested that PMS could enhance the performance of LiNi0.5Co0.2Mn0.3O2/graphite full-cell at low temperatures [25]. In this research, we aim to contrive an experiment to evaluate the effect of PMS on the graphite electrode–electrolyte interface and its impact on the electrochemical performance of LIBs with the graphite electrode. In accordance with the density functional theory (DFT) predictions, we believe that the solid electrolyte interphase (SEI) layer derived from PMS can significantly impact the surface chemistry of the graphite anode, which would be responsible for determining the cyclic performance of LIBs based on the graphite anode.

2. Materials and Methods

2.1. Computational Section

The ground-state structures of the ethylene carbonate (EC) and PMS molecules depicted in Figure 1 were fully optimized with C1 symmetry. All calculations were performed by means of the B3PW91 functional and 6-311G (d,p) basis set employed in Gaussian 09 [26]. The solvent effect was exerted by employing the conductor-variant polarized continuum model (CPCM) [27]. A dielectric constant of 46.4 was obtained as a weighted average value between the dielectric constants of EC (ε = 89.78) and dimethyl carbonate (DMC) (ε = 3.11) since we used a mixture of EC and DMC with an equal proportion (1:1, v/v) in this study.

2.2. Electrolyte Preparation

The EC (Merck, for synthesis), DMC (Merck, for synthesis), lithium hexafluorophosphate salt (LiPF6) (Sigma-Aldrich, battery grade), and PMS (Sigma-Aldrich, 98%) as the case-study additive were purchased. EC:DMC (1:1, v/v) with 1 M LiPF6 was used as the “reference electrolyte”. To desiccate the moisture available in the solvents, 4 Å molecular sieves were dehumidified first at 350 °C for 17 h, then the solvents were stored over arid molecular sieves under a high purity argon (Ar) of a glove box for several days. The water amount of the prepared electrolyte was determined by Karl Fischer titration (Mettler Toledo DL31), which was less than 10 ppm.

2.3. Electrode Preparation and Cell Assembling

The commercial graphite electrode used in this study was composed of graphite (as the active material) (93 wt%), styrene-butadiene rubber (SBR, as the binder) (4.6 wt%), carboxymethyl cellulose (CMC, as the binder) (1.4 wt%), and Super P (SP as the conductive additive) (1 wt%) on a copper foil substrate as the current collector. The graphite electrode, a micro-pores polypropylene membrane (Celgard 2400) as the separator, and Li foil as the counter electrode were assembled into the coin cells in a dry glove box filled with Ar gas.

2.4. Electrochemical Tests

The charge–discharge experiments were carried out using a battery tester (Kimiastat-5V/10 mA, Kimia Pardaz Rayane, Iran). To assess the cathodic stability of the case-study electrolytes, the cyclic voltammetry (CV) measurements were executed at a scan rate of 0.1 mV s−1 from 0.001 to 3 V (vs. Li+/Li). Furthermore, the anodic behavior of the electrolytes was examined through the usage of a linear sweep voltammetry (LSV) test. The LSV tests were done at a scan rate of 0.1 mV in a voltage range of 3 to 6 V vs. Li+/Li, and a three-electrode cell was used in LSV, consisting of the Pt electrode as working electrode and Li foils as counter and reference electrodes. In electrochemical impedance spectroscopy (EIS) analysis, a 10 mV excitation potential and a frequency ranging from 100 kHz to 0.1 Hz were applied to the half-cell systems. All the CV, LSV, and EIS measurements were carried out using a Galvanostat/Potentiostat Autolab (PG-STAT 302N) at room temperature.

2.5. Characterization of the Graphite Electrode Surface

The formation process of the SEI layer on the graphite electrode surface was done through five charge–discharge cycles at a low C-rate (0.1 C) from 0.001 to 3 V (vs. Li+/Li). After the formation, the coin cells were dismantled in the glove box and afterward, the graphite electrodes were washed with DMC solvent. The morphology and chemical composition investigations of the graphite anode surface were performed using field-emission scanning electron microscopy (FE-SEM, Tescan Mira 3-LMU, 15 kV) and an energy dispersive spectrometer (EDS) mounted on FE-SEM, respectively. To explore the organic functional groups available on the graphite electrode surface, a Bruker Alpha Fourier-transform infrared (FT-IR) spectrometer was used. The Raman spectra of the graphite electrodes were obtained through a Takram Raman microscope with a 532 nm Nd:YAG laser. To carry out the UV-visible spectroscopy, after washing and drying, the dry electrode was soaked in a given amount of methanol for four days. The UV-visible absorption spectra were acquired in the air by using a Perkin Elmer Lambda 45 spectrometer.

3. Results and Discussion

3.1. DFT Calculations

Having a higher reduction potential (RP) than that of the cyclic solvent of the electrolyte is a vital parameter for a reductive SEI additive, which enables it to sacrifice itself before the reduction in the electrolyte solvent and to rescue the electrolyte from further reduction through the formation of a robust and uniform SEI layer. Another attribute making SEI additives more suited is its higher oxidation potential (OP) compared to the electrolyte solvent; consequently, it can inhibit likely outcomes of the layer generated on the cathode electrode as the result of additive oxidation [24,28,29]. Scheme S1 shows a Born–Haber cycle, which was exercised to gain the Gibbs free energy of the redox half-reaction Δ G solv ° , redox and the OP of a reductant (Red)   ( E abs ° ( Red ) ) , which are, respectively, indicated by Equations (6) and (7):
  Δ G solv ° , redox = Δ G gas ° , redox + Δ G s ° ( Ox ) Δ G s ° ( Red )
  E abs ° ( Red ) = Δ G solv ° , redox / F
  E ° ( vs Li + Li ) = E abs ° 1.37   V
That Δ G gas ° , redox is the ionization free energy in the gas phase at 298.15 K, Δ G s ° ( Ox ) and Δ G s ° ( Red )   are the free energies of the oxidant (Ox) and reductant molecules, respectively, and F is the Faraday constant [30]. Equation (8) is used to convert the absolute OP to the Li+/Li scale [31]. Analogous to the calculation of OP, the Born–Haber cycle illustrated in Scheme S2 is adopted to calculate the reduction potential [32].
Δ G solv ° , redox = Δ G gas ° , redox + Δ G s ° ( Red ) Δ G s ° ( Ox )
E abs ° ( Ox ) = Δ G solv ° , redox / F
Equations (9) and (10) are respectively adopted to acquire the Gibbs free energy of the redox half-reaction Δ G solv ° , redox   and RP of an oxidant ( E abs ° ( Ox ) ) . In addition, Equation (8) is used to change the absolute reduction potential to the Li+/Li scale. The redox potentials of the EC and PMS molecules are listed in Table 1. The RP value of the PMS compound is more than that of EC; therefore, it shows the potential to be employed as a SEI additive. Meanwhile, PMS exhibits a lower OP value with respect to EC, implying that PMS has a lower anodic stability and is foreseen to be oxidized before EC on the cathode.

3.2. Charge–Discharge Test

In order to optimize the PMS amount in the reference electrolyte, the galvanostatic charge–discharge test along with EIS analysis was carried out. The first charge–discharge cycle of the Li/G half-cells containing varied contents of PMS are exhibited in Figure S3. The long voltage plateau located in the voltage range from 0.2 to 0.01 V in the discharge curve corresponds to the lithium intercalation process. The CE of the cell with no additive is 69.29%, whereas the inclusion of 1 wt% PMS into the reference electrolyte promotes the cell’s CE to 93.65%. The reason for the improved CE is the presence of the PMS, which can cover the active sites at the surface of the graphite electrode and protect it more efficiently from the deterioration of the electrolyte [33]. Higher amounts of PMS (more than 1 wt%) can lead to a gradual decline in CE (Table S1). This phenomenon can be regarded as the result of developing a thicker SEI layer onto the graphite electrode’s surface and the higher interfacial impedance of the electrode, which is confirmed via EIS analysis and explained in the next section [33,34]. Hence, the sample containing 1 wt% PMS was considered as the optimal dose of the additive.

3.3. Electrochemical Measurements
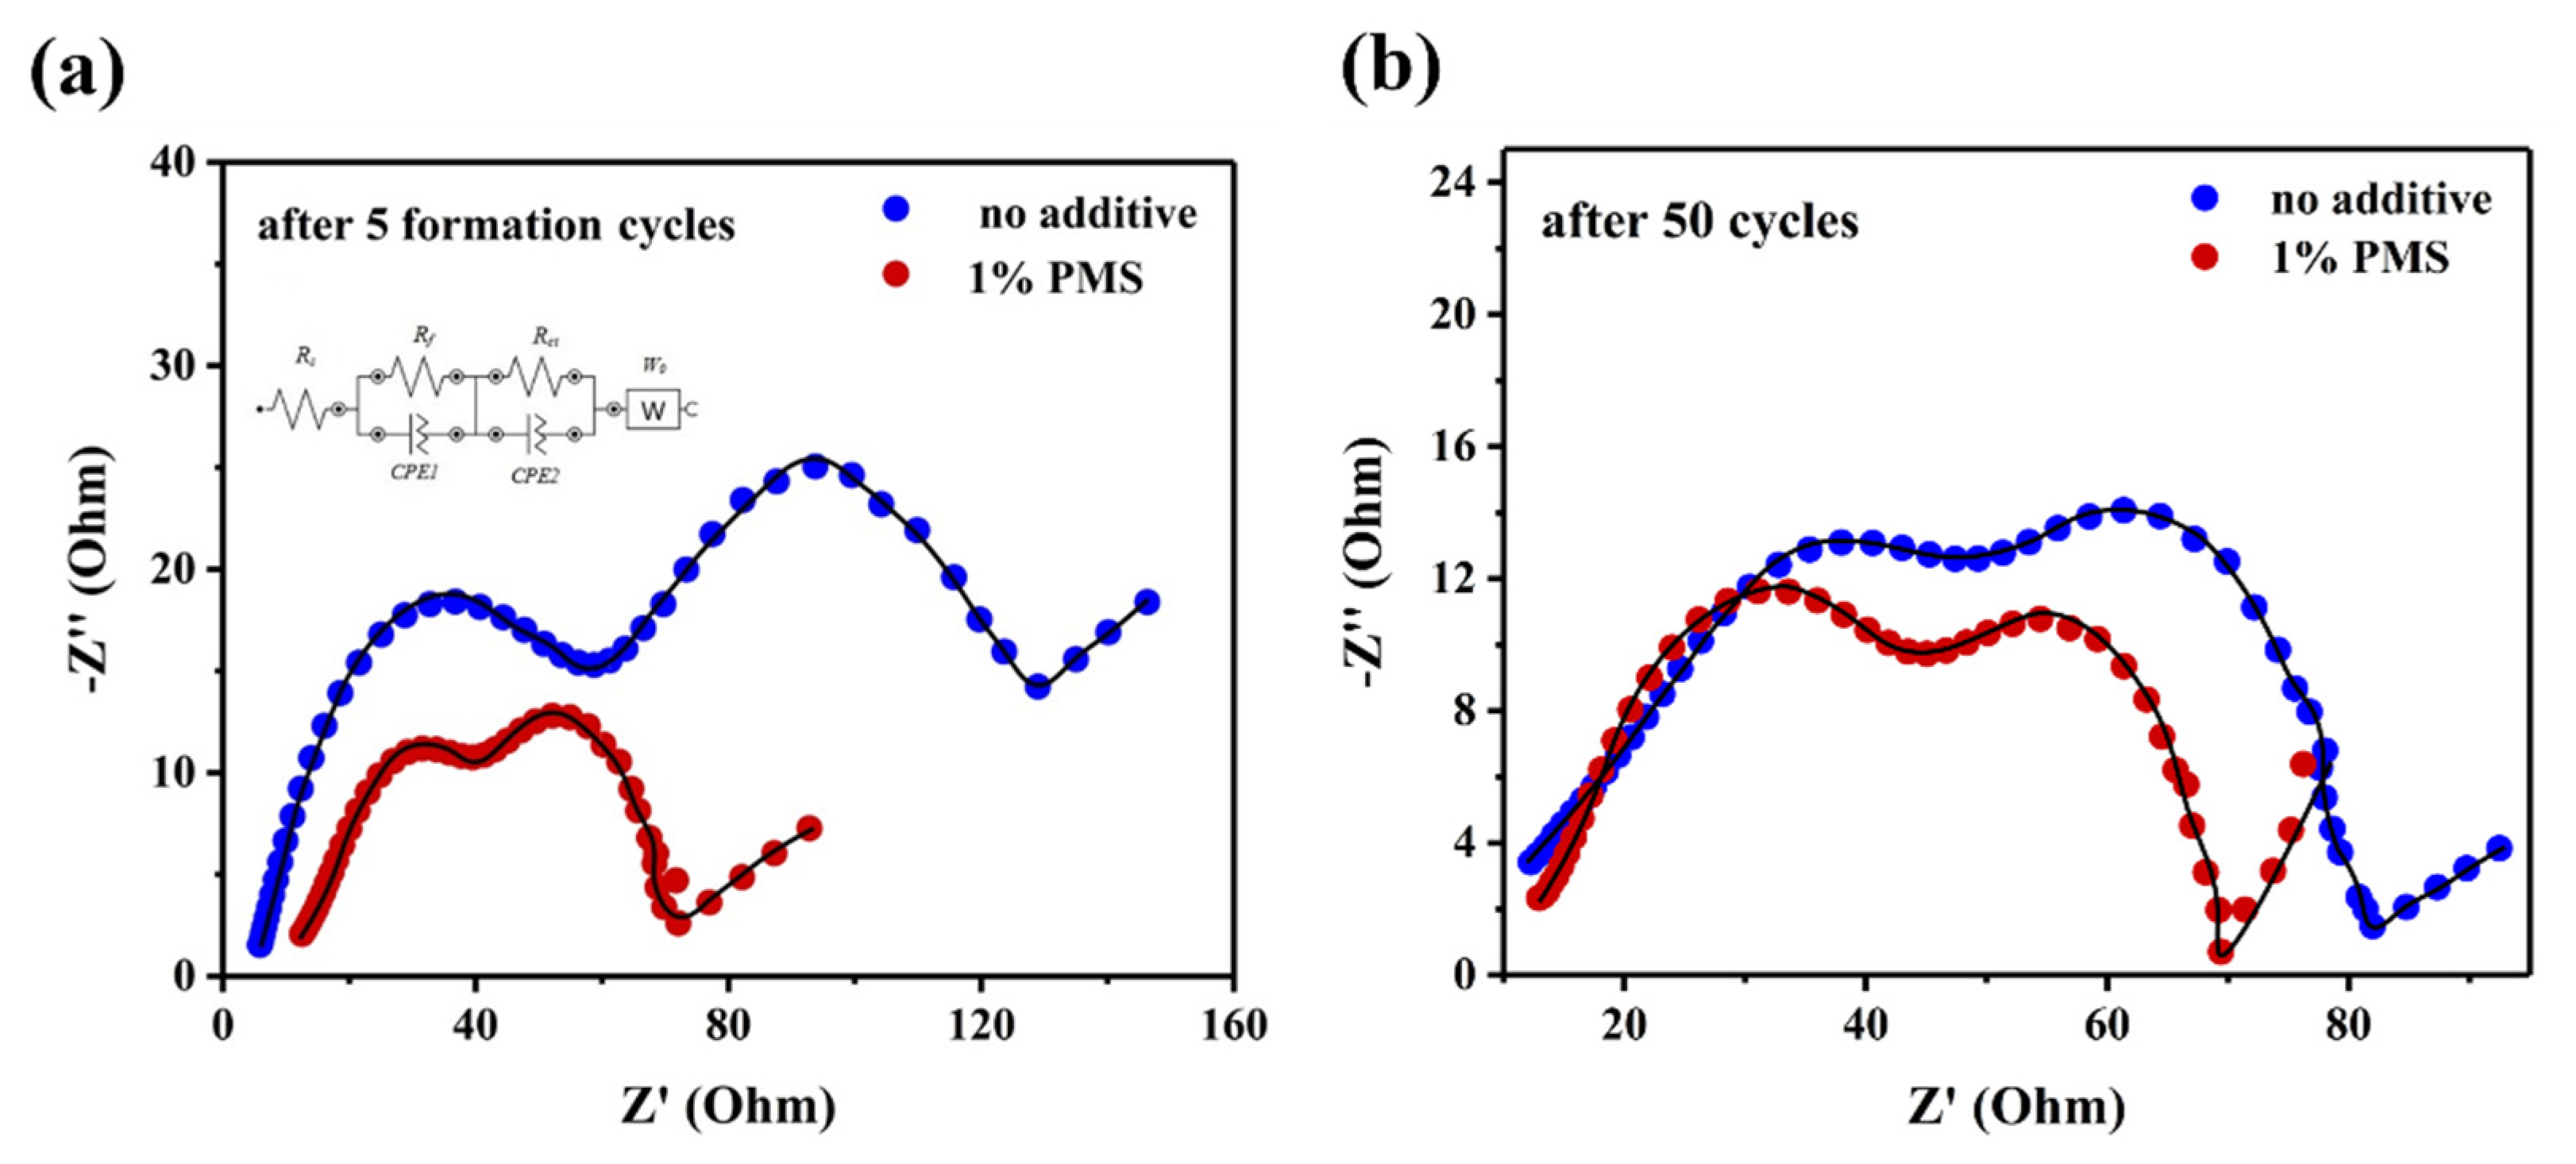
3.3.1. EIS Analysis

The Nyquist plots of the cells with no additive and with PMS were taken after five cycles as the formation and also 50 cycles and fitted via Nova 1.10 Software to achieve an appropriate equivalent circuit (Figure 2). Each Nyquist plot is made up of two semicircles, including a semicircle observed at a high frequency known as the interfacial layer resistance (Rf) and a semicircle located at the medium frequency, which is the charge transfer resistance (Rct). The linear section in the low-frequency region is the Warburg impedance (W0), which is pertinent to the diffusion of Li+ ions into the intercalation compound [35,36].
The battery cells without and with the additive, respectively, show the Rct values of 68.09 and 31.58 Ω after 5 cycles formation (Table 2). Interestingly, after 50 cycles, the Rct value of the cell with PMS is less than that of its counterpart with no additive. The cell without and with the PMS delivered an Rct of 34.6 and 23.17, respectively. The Rf values are 52.87 and 27.07 Ω after 5 cycles and 35.15 and 32.14 Ω after 50 cycles for the cells with no and with PMS, respectively. The lower Rf and Rct values of the cell benefiting from the presence of the PMS in comparison with the cell free of any additive reveal that the inclusion of PMS resulted in the formation of SEI in an appropriate way, which improved the lithium-ion migration within the surface film as well as the charge transfer in the electrochemical reaction. The lowered Rf and Rct values can diminish ohmic and activation polarizations during successive lithiation/de-lithiation, which can efficiently affect the cyclic performance of LIBs [35,37]. Increasing the amount of additive from 1 wt% to 2 and 3 wt% resulted in an increment in the impedance of the cells, which is consistent with the charge–discharge experiment (Figure S4).

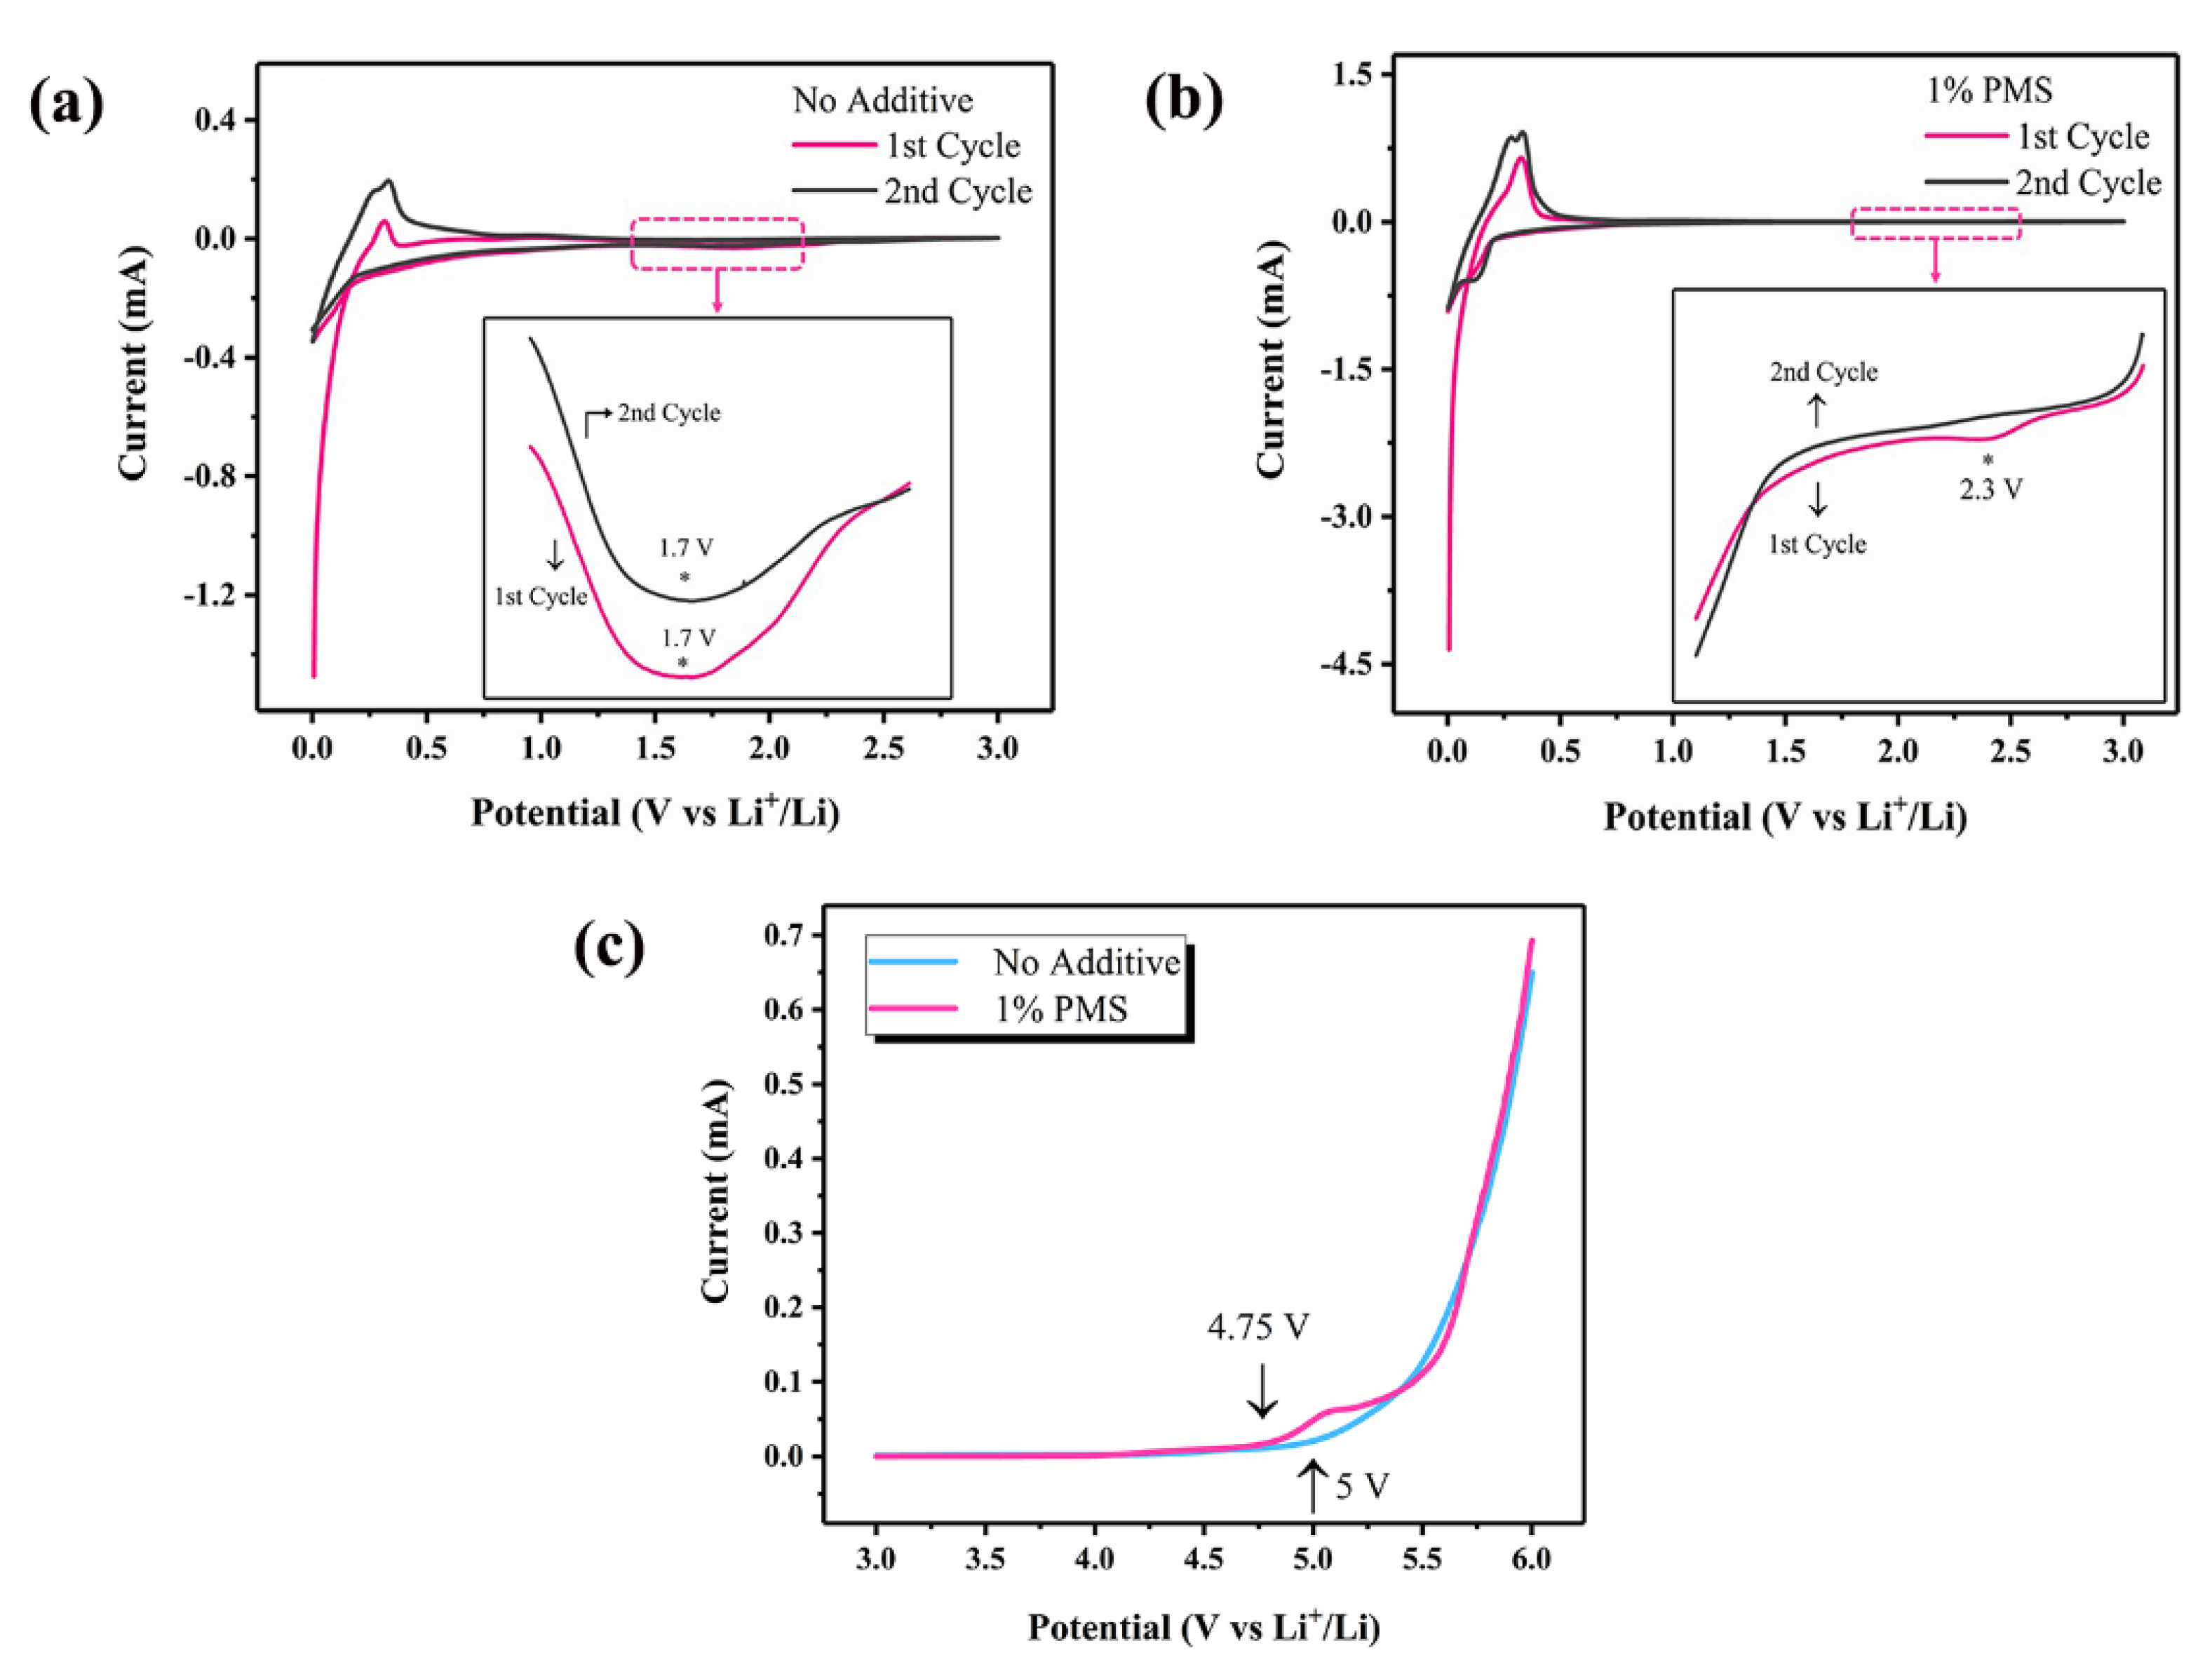
3.3.2. CV Measurements

Figure 3a,b show the CVs of the electrolyte samples during the first and second cycles. During the first cathodic potential sweep of the reference electrolyte, a reduction peak emerges at ~1.7 V, which can be related to the reduction in the electrolyte, resulting in the production of the SEI layer (Figure 3a). Additionally, the reduction peak located at 1.7 V appears again in the second sweep, implying that the SEI film formed during the first cycle was not able to completely suppress any further reduction in the electrolyte during the subsequent cycles. The pair oxidation peak (observed at ~0.25 V) and the reduction peak (observed at ~0 V) are respectively related to the process of the de-intercalating and intercalating process of the Li ions from/to the graphite electrode [38]. Through the addition of 1 wt% PMS, the reduction behavior of the reference electrolyte is conspicuously changed. As evidenced from Figure 3b, during the first cathodic potential sweep, a reduction peak is found at ~2.3 V, which is ascribed to the reduction in the PMS. The reduction peak of the electrolyte containing PMS is shifted to the higher reduction potential, and this issue confirms that the data obtained via the DFT calculations align well with those acquired from CV measurements. During the second sweep, the reduction peak at 2.3 V is not found. It is worth mentioning that the reduction peaks of the reference electrolyte at 1.7 V during the first and second sweeps disappeared, implying that the SEI derived from the PMS could thoroughly prevent the deterioration of the electrolyte. Comparing the CVs of the electrolyte samples in the first and second cycles exhibits that the intensity of the intercalation/de-intercalation peak in the cell with PMS is higher than that of the cell with no additive; as a consequence, the addition of PMS could substantially reduce polarization [33].

3.3.3. Anodic Stability Evaluation

The anodic stability of electrolytes was investigated using the LSV test. As can be found from Figure 3c, the PMS is oxidized at about 4.75 V (vs. Li+/Li) with a substantial increment in the oxidation current in the LSV curve. In contrast, the reference electrolyte is stable up to about 5 V. As a conclusion, PMS exhibits a lower anodic stability than that of EC, which is in agreement with the DFT calculations.

3.4. Surface Characterization Tests

3.4.1. SEM and EDS Analyses

The SEM micrographs of the graphite electrodes in the fresh state (before cycling) and after the formation in different electrolytes are illustrated in Figure 4. The fresh electrode possess a smooth and clean surface morphology. However, the morphologies of the electrodes cycled in the electrolytes without and with an additive are distinctly changed, and the graphite sheets are covered with a layer of deposit. Interestingly, the morphology of the deposit in the reference electrolyte is totally different from that in the electrolyte with PMS. The electrode cycled in the electrolyte containing PMS is heavily covered with deposited substances generated by the PMS decomposition, and the graphite sheets are buried and can hardly be seen. Conversely, the decomposition products originating from the reduction in the electrolyte with no additive are not capable of completely covering the graphite sheets, and they can be vividly found. Figure S4 displays the EDS patterns of the different electrolytes. The characteristic sulfur peak at about 2 keV in the EDS pattern of the electrolyte with PMS is attributed to the sulfurous compounds that have appeared on the graphite electrode owing to the reduction in PMS, whereas this peak is not detected in the EDS pattern of the reference electrolyte [39].

3.4.2. TEM Test

Figure 5 shows the TEM images of the samples. As can be clearly seen in Figure 5a,b, the graphite sheets are covered with a layer which is the SEI film. The morphology of this layer in both electrolytes are completely different. The graphite sheet in the sample with no additive is visible; however, in the electrolyte containing PMS, the graphite sheet is not distinct. These results are in agreement with the SEM images. Unlike the SEI layer built-in additive free electrolyte, a non-uniform SEI layer is formed in the electrolyte with PMS, but its thickness is less than that of its counterpart without an additive (Figure 5c,d), which can considerably diminish the interfacial resistance and is well-matched with the EIS results. Referring to the SEM and TEM analyses, the SEI layer formed through the PMS reduction completely covers the prismatic surfaces, which can prevent the exposure of the electrolyte to these surfaces and hinder electrolyte decomposition.

3.4.3. FT-IR Spectroscopy

The FT-IR spectrum of the fresh electrode is shown in Figure 6. The sharp peak at 3423 cm−1 indicates the –OH stretching vibration band. The peaks at 2923 and 2854 cm−1 are, respectively, attributed to the asymmetric and symmetric vibrations of the CH2 groups. The peaks located at 1636 and 1095 cm−1 are, respectively, related to the existence of the C=C and C-O bands [40,41]. Hence, the chemisorbed oxygen groups demonstrated in Figure S2 are detected in the structure of the fresh graphite. Referring to the literature, the chemical composition of the SEI layer can be relevant to the electrolyte components [42]. Based on this fact, the participation of EC in the formation of SEI occurs through two mechanisms. One is the electrochemically-induced reduction in EC, giving rise to the production of lithium carbonate (Li2CO3) and gaseous products; the SEI formed via this path is less stable. In the second path, lithium ethylene dicarbonate (LEDC) is the principal constituent of SEI, and this mechanism causes less gaseous products, and the resulting products are substantially insoluble in the electrolyte [18,43]. The reduction in DMC as the other solvent of the electrolyte leads to the production of lithium methyl carbonate (LMC) [42]. The pronounced peaks at 1630 cm−1asC=O) and 1080 cm−1C-O) can be attributed to the lithium alkyl carbonate (LEDC and LMC) species. The absorption peaks at 1481 cm−1CH3,CH2) and 841 cm−1 (δCO32−) originate from the presence of Li2CO3 [44,45,46]. In the FT-IR spectrum of graphite cycled in the electrolyte with PMS, a well-defined peak at 1308 cm−1 is seen (Figure 6). For the assignment of this peak, we investigated the FT-IR spectrum of the PMS powder nominated as pure PMS (Figure 6). In the region from 1300 to 1400 cm−1, a peak at 1379 cm−1 is observed, which is related to the asymmetric SO2 stretching [47]. Furthermore, the computed frequencies of the PMS molecule by the DFT calculations in the region varying from 1200 to 1600 cm−1 in Table S2 show only a peak at 1388 cm−1, which nearly coincided with the peak at 1379 cm−1. Therefore, the peak at 1308 cm−1 can be ascribed to the asymmetric SO2 stretching, which is shifted to the lower frequency and confirms that the reduction products of the PMS incorporate into the SEI layer. The peak seen at ~1625 cm−1 is pertinent to the symmetric C=C. Moreover, the sharp peak located at ~1220 cm−1 is related to the symmetric S=O [47,48].
Based on the X-ray photoelectron spectroscopy (XPS) results reported in the literature using the PMS electrolyte additive, lithium alkyl carbonate and Li2CO3 are the main products resulting from the decomposition of the carbonate-based electrolyte. Moreover, the decomposition of LiPF6 can lead to the generation of LiF, LiPxOyFz, and LiPxFy species. The reduction in the PMS additive can produce Li2SO4, ROSO2Li, and LiS2 [25].

3.4.4. Raman Spectroscopy

The Raman spectrum of graphite commonly consists of two well-defined peaks. The weak D-band (at ~1380 cm−1) is related to the A1g vibrational mode and can be designated to the breathing motion of the sp2 hybridized carbon atoms in rings at the edge planes and the defects in the graphite sheets. The G-band (~1580 cm−1) is assigned to the E2g vibrational mode and corresponds to the relative motion of the sp2 carbon atoms in rings and also the chains. The ratio between the intensity of the D-band and G-band (ID/IG) is employed to obtain the degree of structural disorder in graphite. This parameter should be zero for an intact graphite [49,50,51]. The Raman spectra of graphite anodes in the two samples and also the ratio ID/IG of those are brought in Figure 7a. The ID/IG for the graphite electrode before cycling is 0.35, which is higher than the perfect graphite (ID/IG = 0) due to the presence of defects and disorders in the graphite structure. The ID/IG ratio is increased noticeably after 5 cycles. The ID/IG for the graphite anode cycled in the electrolyte with no additive (0.6) is higher than that in the electrolyte with an additive (0.4). The Raman results imply that the SEI film built in the PMS-containing electrolyte is more efficacious with regards to protecting the surface structure of graphite [37].

3.4.5. UV-Visible Spectroscopy

Figure 7b portrays the UV-visible absorption spectra of the PMS powder as the monomer used in the electrolyte, and the graphite electrode cycled in the electrolyte with PMS. For the PMS monomer, one absorption peak is exclusively emanated in 223 nm, which is also found in the spectrum of the cycled graphite electrode. In addition, there is an extra peak in 255 nm in the spectrum of the cycled graphite electrode, which is absent in the spectrum of the PMS monomer. The peak at 223 nm is appointed to the PMS monomer molecules, which can be entrapped in the SEI film polymer deposited on the graphite surface [52]. The broad peak at 255 nm can be imputed to the polymer film, which originated from the polymerization of the benzene ring radical and is not found in the spectrum of the PMS monomer [53].
Figure S5 illustrates a proposed reaction scheme for PMS reduction. Accordingly, a reduction in PMS results in the generation of a methanesulfonate anion and a radical. Methanesulfonate anion could react with lithium ions to form lithium methanesulfonate (path a). In addition, this anion could react with solvent constituents to produce lithium methane sulfonate ethyl carbonate (path b). In terms of the radical, it can be terminated by the solvent molecules to form a polymer (path c). Furthermore, it dimerizes, forming a dimer (path d) [53,54].

3.5. Cycling Performance

Figure 8 shows the discharge capacity retention of the Li/graphite half-cells at room temperature in a voltage varying from 0.001 to 3 V after 35 cycles 1C. The cell cycled with PMS has much more stability with a remarkable capacity retention, while the cycling performance of the cell cycled without PMS is decreased to only 50.4% retention compared to its initial discharge capacity. The cycling performance results carry this message that the addition of PMS can remarkably enhance the cycle stability, and the cell with PMS delivers an excellent cycling performance compared to the one with no additive.

4. Conclusions

The SEI formation, as the result of the co-intercalation of the solvent molecules and also a reduction in the chemisorbed oxygen groups extant in the prismatic surfaces, is regarded as the irreversible charge-consuming phenomena in graphite anode-based LIBs. To overcome these problems, an addition of a low dose of PMS to the reference electrolyte is suggested. The CV measurements demonstrated that the electrolyte with PMS is reduced at 2.3 V, higher than that of the reference electrolyte at 1.7 V. The SEM and TEM images exhibited that the graphite sheets are buried under lots of reductive materials that stem from PMS decomposition and are hardly able to be seen. The results brought this successful conclusion that the SEI layer formed through the PMS degradation can deactivate the catalytic activity of chemisorbed oxygen groups, which are involved in the consumption of Li+ charges and, afterward, irreversible capacity loss. After 35 cycles, the remaining capacity of the cell cycled with no additive severely decreased to merely 50.4% compared to its initial discharge capacity. In contrast, the cell with PMS achieved a stable cycling performance with an incredible capacity retention.

Supplementary Materials

The following supporting information can be downloaded at: https://www.mdpi.com/article/10.3390/batteries8100152/s1, Figure S1: (a) Schematic representation of graphite hexagonal structure showing AB layer stacking sequence and the unit cell, (b) edge configurations of a graphite basal plane. Figure S2: Plausible organic compounds formed by oxygen adsorption on graphite surface. Figure S3: First charge-discharge profiles of Li/graphite half-cells using reference electrolyte with no and with various amounts of PMS. The cells were cycled between 0.001–3 V at 0.1 C. Figure S4: Nyquist plots of Li/G half-cells (a,b) without and with 2% PMS after 5 cycles 0.5 C as the formation and after 50 cycles 1 C, respectively, (c,d) without and with 3% PMS after 5 cycles 0.5 C as the formation and after 50 cycles 1 C, respectively. Figure S5: EDS patterns of the graphite electrode after cycling; (a) in the reference electrolyte; (b) in the reference electrolyte with 1 wt% PMS. Table S1: Parameters of the first charge-discharge of Li/graphite half-cells containing various amounts of PMS. Table S2: The computed frequencies of PMS molecule in the frequency range of 1200–1600 cm-1 and mode assignments. Scheme S1: The Born-Haber cycle for calculation of oxidation potential. Scheme S2: The Born-Haber cycle for calculation of reduction potential.

Author Contributions

Conceptualization, B.M.; methodology, B.M.; software, B.M. and Z.S.; validation, B.M., M.J. and Z.S.; writing—original draft preparation, B.M.; writing—review and editing, B.M., M.J., Z.S. and M.A.; supervision, M.J. and Z.S.; project administration, M.J. and Z.S. All authors have read and agreed to the published version of the manuscript.

Funding

This research received no external funding.

Data Availability Statement

Not applicable.

Conflicts of Interest

The authors declare no conflict of interest.

References

  1. Jin, R.; Ren, C.; Kang, H.; Gao, S.; Chen, S. Stacked Cu2−xSe nanoplates with 2D nanochannels as high performance anode for lithium batteries. J. Colloid Interface Sci. 2021, 590, 219–225. [Google Scholar] [CrossRef] [PubMed]
  2. Han, J.Y.; Jung, S. Thermal Stability and the Effect of Water on Hydrogen Fluoride Generation in Lithium-Ion Battery Electrolytes Containing LiPF6. Batteries 2022, 8, 61. [Google Scholar] [CrossRef]
  3. Madani, S.S.; Soghrati, R.; Ziebert, C. A Regression-Based Technique for Capacity Estimation of Lithium-Ion Batteries. Batteries 2022, 8, 31. [Google Scholar] [CrossRef]
  4. Vogt, D.; Michalowski, P.; Kwade, A. Production and Characterisation of Fibre-Reinforced All-Solid-State Electrodes and Separator for the Application in Structural Batteries. Batteries 2022, 8, 55. [Google Scholar] [CrossRef]
  5. Li, Z.; Guo, A.; Liu, D. Water-Soluble Conductive Composite Binder for High-Performance Silicon Anode in Lithium-Ion Batteries. Batteries 2022, 8, 54. [Google Scholar] [CrossRef]
  6. Moradi Bilondi, A.; Kermani, M.J.; Heidary, H.; Abdollahzadehsangroudi, M. Investigation of the Effect of Anode Fuel Contaminants on the Performance of Polymer Electrolyte Membrane Fuel Cell. Amirkabir J. Mech. Eng. 2020, 52, 381–398. [Google Scholar] [CrossRef]
  7. Kosova, N.V.; Tsydypylov, D.Z. Effect of Mechanical Activation and Carbon Coating on Electrochemistry of TiNb2O7 Anodes for Lithium-Ion Batteries. Batteries 2022, 8, 52. [Google Scholar] [CrossRef]
  8. Xu, K. Nonaqueous liquid electrolytes for lithium-based rechargeable batteries. Chem. Rev. 2004, 104, 4303–4418. [Google Scholar] [CrossRef]
  9. Xu, K. Electrolytes and interphases in Li-ion batteries and beyond. Chem. Rev. 2014, 114, 11503–11618. [Google Scholar] [CrossRef]
  10. Xu, W.; Wang, J.; Ding, F.; Chen, X.; Nasybulin, E.; Zhang, Y.; Zhang, J.-G. Lithium metal anodes for rechargeable batteries. Energy Environ. Sci. 2014, 7, 513–537. [Google Scholar] [CrossRef]
  11. Cheng, X.-B.; Zhang, R.; Zhao, C.-Z.; Zhang, Q. Toward safe lithium metal anode in rechargeable batteries: A review. Chem. Rev. 2017, 117, 10403–10473. [Google Scholar] [CrossRef]
  12. Zhang, S.S. Aromatic isocyanate as a new type of electrolyte additive for the improved performance of Li-ion batteries. J. Power Sources 2006, 163, 567–572. [Google Scholar] [CrossRef]
  13. Placke, T.; Siozios, V.; Schmitz, R.; Lux, S.F.; Bieker, P.; Colle, C.; Meyer, H.-W.; Passerini, S.; Winter, M. Influence of graphite surface modifications on the ratio of basal plane to ‘non-basal plane’ surface area and on the anode performance in lithium ion batteries. J. Power Sources 2012, 200, 83–91. [Google Scholar] [CrossRef]
  14. El-Genk, M.S.; Tournier, J.-M.P. Development and validation of a model for the chemical kinetics of graphite oxidation. J. Nucl. Mater. 2011, 411, 193–207. [Google Scholar] [CrossRef]
  15. Winter, M.; Novák, P.; Monnier, A. Graphites for lithium-ion cells: The correlation of the first-cycle charge loss with the Brunauer-Emmett-Teller surface area. J. Electrochem. Soc. 1998, 145, 428–436. [Google Scholar] [CrossRef]
  16. Smith, T.E.; McCrory, S.; Lou Dunzik-Gougar, M. Limited oxidation of irradiated graphite waste to remove surface carbon-14. Nucl. Eng. Technol. 2013, 45, 211–218. [Google Scholar] [CrossRef] [Green Version]
  17. Zhao, H.; Yu, X.; Li, J.; Li, B.; Shao, H.; Li, L.; Deng, Y. Film-forming electrolyte additives for rechargeable lithium-ion batteries: Progress and outlook. J. Mater. Chem. A 2019, 7, 8700–8722. [Google Scholar] [CrossRef]
  18. Zhang, S.S. A review on electrolyte additives for lithium-ion batteries. J. Power Sources 2006, 162, 1379–1394. [Google Scholar] [CrossRef]
  19. Haregewoin, A.M.; Wotango, A.S.; Hwang, B.-J. Electrolyte additives for lithium ion battery electrodes: Progress and perspectives. Energy Environ. Sci. 2016, 9, 1955–1988. [Google Scholar] [CrossRef]
  20. Zhao, W.; Ji, Y.; Zhang, Z.; Lin, M.; Wu, Z.; Zheng, X.; Li, Q.; Yang, Y. Recent advances in the research of functional electrolyte additives for lithium-ion batteries. Curr. Opin. Electrochem. 2017, 6, 84–91. [Google Scholar] [CrossRef]
  21. Park, G.; Nakamura, H.; Lee, Y.; Yoshio, M. The important role of additives for improved lithium ion battery safety. J. Power Sources 2009, 189, 602–606. [Google Scholar] [CrossRef]
  22. Zuo, X.; Xu, M.; Li, W.; Su, D.; Liu, J. Electrochemical reduction of 1,3-propane sultone on graphite electrodes and its application in Li-ion batteries. Electrochem. Solid State Lett. 2006, 9, A196. [Google Scholar] [CrossRef]
  23. Xu, M.; Li, W.; Lucht, B.L. Effect of propane sultone on elevated temperature performance of anode and cathode materials in lithium-ion batteries. J. Power Sources 2009, 193, 804–809. [Google Scholar] [CrossRef]
  24. Jung, H.M.; Park, S.-H.; Jeon, J.; Choi, Y.; Yoon, S.; Cho, J.-J.; Oh, S.; Kang, S.; Han, Y.-K.; Lee, H. Fluoropropane sultone as an SEI-forming additive that outperforms vinylene carbonate. J. Mater. Chem. A 2013, 1, 11975–11981. [Google Scholar] [CrossRef]
  25. Lin, Y.; Yue, X.; Zhang, H.; Yu, L.; Fan, W.; Xie, T. Using phenyl methanesulfonate as an electrolyte additive to improve performance of LiNi0.5Co0.2Mn0.3O2/graphite cells at low temperature. Electrochim. Acta 2019, 300, 202–207. [Google Scholar] [CrossRef]
  26. Frisch, M.J.; Trucks, G.W.; Schlegel, H.B.; Scuseria, G.E.; Robb, M.A.; Cheeseman, J.R.; Scalmani, G.; Barone, V.; Petersson, G.A.; Nakatsuji, H.; et al. Gaussian 09, Revision A.02; Gaussian, Inc.: Wallingford, CT, USA, 2009. [Google Scholar]
  27. Barone, V.; Cossi, M.; Tomasi, J. Geometry optimization of molecular structures in solution by the polarizable continuum model. J. Comput. Chem. 1998, 19, 404–417. [Google Scholar] [CrossRef]
  28. Han, Y.-K.; Yoo, J.; Yim, T. Why is tris (trimethylsilyl) phosphite effective as an additive for high-voltage lithium-ion batteries? J. Mater. Chem. A 2015, 3, 10900–10909. [Google Scholar] [CrossRef]
  29. Mosallanejad, B. Phthalimide Derivatives: New Promising Additives for Functional Electrolyte in Lithium-ion Batteries. Chem. Methodol. 2019, 3, 261–275. [Google Scholar] [CrossRef]
  30. Borodin, O.; Behl, W.; Jow, T.R. Oxidative stability and initial decomposition reactions of carbonate, sulfone, and alkyl phosphate-based electrolytes. J. Phys. Chem. C 2013, 117, 8661–8682. [Google Scholar] [CrossRef]
  31. Trasatti, S. The absolute electrode potential: An explanatory note (Recommendations 1986). Pure Appl. Chem. 1986, 58, 955–966. [Google Scholar] [CrossRef]
  32. Leggesse, E.G.; Jiang, J.-C. Theoretical study of the reductive decomposition of ethylene sulfite: A film-forming electrolyte additive in lithium ion batteries. J. Phys. Chem. A 2012, 116, 11025–11033. [Google Scholar] [CrossRef]
  33. Li, X.; Yin, Z.; Li, X.; Wang, C. Ethylene sulfate as film formation additive to improve the compatibility of graphite electrode for lithium-ion battery. Ionics 2014, 20, 795–801. [Google Scholar] [CrossRef]
  34. Li, B.; Xu, M.; Li, B.; Liu, Y.; Yang, L.; Li, W.; Hu, S. Properties of solid electrolyte interphase formed by prop-1-ene-1,3-sultone on graphite anode of Li-ion batteries. Electrochim. Acta 2013, 105, 1–6. [Google Scholar] [CrossRef]
  35. Wang, R.; Li, X.; Wang, Z.; Zhang, H. Electrochemical analysis graphite/electrolyte interface in lithium-ion batteries: P-Toluenesulfonyl isocyanate as electrolyte additive. Nano Energy 2017, 34, 131–140. [Google Scholar] [CrossRef]
  36. Wang, R.-H.; Li, X.-H.; Wang, Z.-X.; Guo, H.-J.; He, Z.-J. Electrochemical analysis for enhancing interface layer of spinel Li4Ti5O12: P-toluenesulfonyl isocyanate as electrolyte additive. ACS Appl. Mater. Interfaces 2015, 7, 23605–23614. [Google Scholar] [CrossRef]
  37. Yan, G.; Li, X.; Wang, Z.; Guo, H.; Wang, J. Compatibility of graphite with 1,3-(1,1,2,2-Tetrafluoroethoxy) propane and fluoroethylene carbonate as cosolvents for nonaqueous electrolyte in lithium-ion batteries. J. Phys. Chem. C 2014, 118, 6586–6593. [Google Scholar] [CrossRef]
  38. Zhao, L.; Jing, D.; Shi, Y.; Zhuang, Q.; Cui, Y.; Ju, Z.; Cui, Y. TriMethylene sulfite as a novel additive for SEI film formation in lithium-ion batteries. Ionics 2020, 26, 4813–4824. [Google Scholar] [CrossRef]
  39. Xu, M.Q.; Li, W.S.; Zuo, X.X.; Liu, J.S.; Xu, X. Performance improvement of lithium ion battery using PC as a solvent component and BS as an SEI forming additive. J. Power Sources 2007, 174, 705–710. [Google Scholar] [CrossRef]
  40. Figueiredo, J.L.; Pereira, M.F.R.; Freitas, M.M.A.; Orfao, J.J.M. Modification of the surface chemistry of activated carbons. Carbon 1999, 37, 1379–1389. [Google Scholar] [CrossRef]
  41. Soliman, A.B.; Abdel-Samad, H.S.; Rehim, S.S.A.; Hassan, H.H. Surface functionality and electrochemical investigations of a graphitic electrode as a candidate for alkaline energy conversion and storage devices. Sci. Rep. 2016, 6, 256. [Google Scholar] [CrossRef]
  42. Xing, M.L.; Li, W. Interphases between electrolytes and anodes in Li-ion battery. In Electrolytes for Lithium and Lithium-Ion Batteries; Jow, T.R., Xu, K., Borodin, O., Ue, M., Eds.; Springer: New York, NY, USA, 2014; pp. 227–277. [Google Scholar]
  43. Wang, L.; Menakath, A.; Han, F.; Wang, Y.; Zavalij, P.Y.; Gaskell, K.J.; Borodin, O.; Iuga, D.; Brown, S.P.; Wang, C.; et al. Identifying the components of the solid–electrolyte interphase in Li-ion batteries. Nat. Chem. 2019, 11, 789–796. [Google Scholar] [CrossRef]
  44. Choi, N.-S.; Profatilova, I.A.; Kim, S.-S.; Song, E.-H. Thermal reactions of lithiated graphite anode in LiPF6-based electrolyte. Thermochim. Acta 2008, 480, 10–14. [Google Scholar] [CrossRef]
  45. Ota, H.; Kominato, A.; Chun, W.-J.; Yasukawa, E.; Kasuya, S. Effect of cyclic phosphate additive in non-flammable electrolyte. J. Power Sources 2003, 119, 393–398. [Google Scholar] [CrossRef]
  46. Hu, Y.; Kong, W.; Li, H.; Huang, X.; Chen, L. Experimental and theoretical studies on reduction mechanism of vinyl ethylene carbonate on graphite anode for lithium ion batteries. Electrochem. Commun. 2004, 6, 126–131. [Google Scholar] [CrossRef]
  47. Pretsch, E.; Bühlmann, P.; Badertscher, M. Structure Determination of Organic Compounds, 4th ed.; Springer: Berlin/Heidelberg, Germany, 2009. [Google Scholar]
  48. Mistry, B.D. A Handbook of Spectroscopic Data: Chemistry; Oxford Book Co.: Jaipur, India, 2009. [Google Scholar]
  49. Sethuraman, V.A.; Hardwick, L.J.; Srinivasan, V.; Kostecki, R. Surface structural disordering in graphite upon lithium intercalation/deintercalation. J. Power Sources 2010, 195, 3655–3660. [Google Scholar] [CrossRef] [Green Version]
  50. Markervich, E.; Salitra, G.; Levi, M.D.; Aurbach, D. Capacity fading of lithiated graphite electrodes studied by a combination of electroanalytical methods, Raman spectroscopy and SEM. J. Power Sources 2005, 146, 146–150. [Google Scholar] [CrossRef]
  51. Zhang, J.; Wang, W.; Peng, H.; Qian, J.; Ou, E.; Xu, W. Water-soluble graphene dispersion functionalized by Diels–Alder cycloaddition reaction. J. Iran. Chem. Soc. 2017, 14, 89–93. [Google Scholar] [CrossRef]
  52. Komaba, S.; Itabashi, T.; Tatsuya Ohtsuka, H.; Groult, N.; Kumagai, N.; Kaplan, B.; Yashiro, H. Impact of 2-vinylpyridine as electrolyte additive on surface and electrochemistry of graphite for C/LiMn2O4 Li-ion Cells. J. Electrochem. Soc. 2005, 152, A937. [Google Scholar] [CrossRef]
  53. Li, B.; Wang, Y.; Lin, H.; Wang, X.; Xu, M.; Wang, Y.; Xing, L.; Li, W. Performance improvement of phenyl acetate as propylene carbonate-based electrolyte additive for lithium ion battery by fluorine-substituting. J. Power Sources 2014, 267, 182–187. [Google Scholar] [CrossRef]
  54. Ciosek Högström, K.; Malmgren, S.; Hahlin, M.; Rensmo, H.; Thébault, F.; Johansson, P.; Edstrom, K. The influence of PMS-additive on the electrode/electrolyte interfaces in LiFePO4/graphite Li-ion batteries. J. Phys. Chem. C 2013, 117, 23476–23486. [Google Scholar] [CrossRef]
Figure 1. The chemical structures of (A) EC and (B) PMS.
Batteries 08 00152 g001
Figure 2. The Nyquist plots of Li/G half-cells without and with 1% PMS after (a) 5 cycles 0.5 C as the formation, and (b) after 50 cycles 1 C. The equivalent circuit model used for simulating experimental results is inserted in Figure 2a (From left to right, Rs, Rf, Rct, CPE, and W0 denote resistance of solution, interfacial layer resistance, charge transfer resistance, constant phase resistance, and Warburg impedance, respectively).
Batteries 08 00152 g002
Figure 3. (a) The cyclic voltammograms of the Li/graphite half-cell in the electrolyte with no additive and (b) electrolyte with 1 wt% PMS. (c) The linear sweep voltammograms of the electrolytes without and with 1 wt% PMS.
Batteries 08 00152 g003
Figure 4. The SEM images of the graphite electrode: (a) before cycling, (b) after cycling in the electrolyte without PMS, (c,d) and after cycling in the electrolyte with PMS in two different magnifications. The arrows in (b,c), respectively, point out the reductive decomposition products of electrolytes without and with additive.
Batteries 08 00152 g004
Figure 5. TEM images of the graphite electrode: (a,c) in the electrolyte without PMS, and (b,d) in the electrolyte with PMS after 5 cycles 0.1C from 0.001 to 3 V (vs. Li+/Li).
Batteries 08 00152 g005
Figure 6. The FT-IR spectra of graphite electrodes before cycling (fresh electrode), after cycling in the electrolyte without additive, after cycling in the electrolyte containing PMS, and PMS powder (pure PMS).
Batteries 08 00152 g006
Figure 7. (a) Raman spectra obtained from the fresh and cycled graphite electrodes without and with PMS, (b) UV-visible spectra of PMS powder, and SEI formed on the graphite electrode through decomposition of PMS.
Batteries 08 00152 g007
Figure 8. Discharge capacity retention of Li/graphite half-cells without and with PMS after 35 cycles 1 C in a voltage range of 0.001–3 V.
Batteries 08 00152 g008
Table 1. The redox potentials of EC and PMS molecules.
MaterialRedox Potentials (eV)
RPOP
EC−0.336.94
PMS1.995.32
Table 2. EIS fitting results of the Li/graphite half-cells using electrolytes without and with 1 wt% PMS after 5 cycles 0.5 C as formation and 50 cycles 1 C.
SampleAfter 5 CyclesAfter 50 Cycles
Rs (Ω)Rf (Ω)Rct (Ω)Rs (Ω)Rf (Ω)Rct (Ω)
No additive5.8852.8768.0912.2435.1534.6
1% PMS12.4927.0731.5812.9232.1423.17
Publisher’s Note: MDPI stays neutral with regard to jurisdictional claims in published maps and institutional affiliations.

