1. Introduction
Lithium ion battery technology is more and more widespread due to its high energy density and good cyclability. However, this technology can suffer from safety issues. Most Li-ion battery electric vehicles catch fire due to thermal runaway of the battery. Therefore, safety is a key issue in the development of this technology.
Thermal runaway of the battery results from a chain of reactions, some of which are exothermic. Chemical reactions occur one after another, raising the temperature and triggering new reactions. The different exothermic reactions are as follows: first, the decomposition of the solid electrolyte interphase (SEI); then, the reaction of the anode active material and the electrolyte and the reaction between the anode active material and the binder. Next, the cathode active material decomposes and can release oxygen as the battery temperature goes higher. The released oxygen can oxidise the electrolyte or react with the anode active material bringing the battery temperature to a higher value. Combustion of the flammable gases, such as the gas-state solvents and the gases released from the chemical reactions, would happen at a high temperature if an ignition source occurred (short-circuit), resulting in fire and explosion [
1].
Most of the studies concerning safety are conducted on new/fresh cells. However, different ageing mechanisms inside the cell can induce physical and chemical modifications of the internal components that could influence the initiation of possible combustion. Ageing can be an important factor that must be taken into account for safety. Few studies investigate the influence of ageing on safety and most of them are conducted from an experimental point of view. Cells are cycled and tested in order to exhibit different ageing mechanisms that impact the safety. For example, Friesen et al. [
2] studied the impact of low-temperature cycling on safety, and Borner et al. [
3] or Larson et al. [
4] showed the correlation between ageing and thermal stability of batteries. All existing studies use the runaway temperature and the heat rate to determine the thermal stability. This article proposes to better understand the correlation between ageing and safety. Several accelerating rate calorimeter (ARC) tests on cells ageing in different conditions have been realised. The results of the experiment have been crossed with a model.
Thermal runaway models are based on the kinetic equation parametrised by the temperature (
T) and
(
), the fractional conversion degree of the reactants. The kinetic model has different forms. Avrami–Erofeev introduced the semi-empirical model parametrised by three constants
. Frequently, the more general Sestak and Berggren [
5] model is used.
It is believed that this kinetic equation can describe any reaction. The choice of the parameters is often made without justifications and the parameters , , are classically chosen.
We assumed it necessary to develop a method to select the parameters; the parameters are calculated from the ARC test data. The test protocol will be described in
Section 2 and the model in
Section 3.
Section 4 will expose the results of the crossing of the test results with the model. The data-crossing proves that ageing mechanisms have a major impact on the parameters that is confirmed by the post-mortem analysis.
2. Test Protocol Description
The commercial Li-ion 18650 cell format was chosen for this protocol. Tests were performed on INR18650-30Q cells (from Samsung DI Co., Yongin, South Korea). The cell chemistry is a blend of graphite/silicon (approximately 2–3% Si) in the negative electrode and a blend of NCA (LiNiCoAlO) and NCO (NiCo) in the positive electrode. Performance of each cell batch was measured at 1C: capacity was 3000 mAh and energy density was 230 Wh/kg. Cells were aged using a battery electric vehicle (BEV) protocol with representative ageing cycles at various temperatures and calendar ageings according to the international standard “IEC 62660-1”. The temperature tests were (−20 C, 0 C, 25 C, 45 C) and the calendar ageing was realised at 45 C at constant voltage (CV) at 4.2 V and at 45 C in an open circuit voltage (OCV). Ageing profiles contained current pulses in charge or discharge that simulated car breaking and acceleration. For each condition 15 cells were aged on a battery tester (® SBT 05250). The choice of these conditions was guided by the IEC 62660 standard.
During the test, the state of health (SOH) was followed via an electrical performance measurement realised at 25
C every 28 days for cells aged by cycling and every 6 weeks for calendar ageing on a battery cycler. This electrical test allowed us to track the evolution of some relevant characteristics of the cell: capacity, internal resistance [
6,
7], and nominal voltage. The internal resistance was evaluated by the current pulse method (10 s, I discharge max = 15 A).
In order to identify the favoured ageing mechanism in each condition, aged cells were dismantled in a glove box under argon (>99.999%) for post-mortem analyses. Scanning electronic microscopy (SEM) and electrochemical analyses were performed on both positive and negative electrodes recovered from the aged cells. Glow discharge-optical emission spectroscopy (GD-OES) and solid state
Li NMR were realised in addition on the negative electrodes to clearly identify the main ageing mechanisms. Indeed, different studies [
8,
9,
10] have shown that the NCA positive electrode has no significant changes after ageing. The only suspect ageing mechanism on such NCA active material is the transition metal (Ni, Co, Al) dissolution during high-temperature ageing.
To help in the comprehension of mechanisms of ageing, electrochemical impedance spectra (EIS) measurements were carried out on cells at SOC. EIS was performed using a VMP3 multi-potentiostat (Biologic Science Instruments) equipped with an EIS option. The frequency range used was from 1 mHz to 500 kHz, starting from high frequency to low frequency in a logarithmic scan. The alternating voltage amplitude was set to 5 mV at 25 C.
Finally, an accelerated rate calorimetry (ARC) test was performed. An ARC test is a technique that allows measurement of the self-heating of a cell. The cell is heated in 5 C steps. After a 35 min break, if the heat rate is not over 0.02 C/min, a new step is started. As soon as the heat rate reaches over 0.02 C/min, the so-called “onset temperature” is identified.
In this study, only the beginning of self-heating was studied. Tests were stopped at 90 C in order not to damage the cell and allow further investigations. Two cells per ageing condition were tested. A fresh cell was also used as a reference in order to compare the different safety behaviours.
3. Model
The thermal runaway model is based on the kinetic equation parametrised by the temperature (
T) and
(
), the fractional degree of conversion of the reactants:
The temperature dependence of the process rate is typically parametrised through the Arrhenius equation:
where
A and
are kinetic parameters.
A is the pre-exponential factor,
the activation energy, and
R the universal gas constant.
The fractional degree of conversion of the reactants
is determined experimentally as the fraction of the overall change in the physical properties that go with the process (ex: loss of mass). The overall transformation can generally involve more than a single reaction or, in other words, multiple steps, each of which has its specific extent of conversion. This is why some authors have proposed to model all the different steps of reactions. This is the case for Coman et al. [
11] or Hatchard et al. [
12]. Hatchard et al. [
12] built their model by distinguishing the reaction of the SEI, the anode, and the cathode, and also introduced the state of charge (SOC). A couple
was identified for each reaction.
Generally, models consider only the total reaction. First, because the various reactions are quite differentiated during the first steps, each reaction has its own kinetics. For example, a reaction can be described by:
and
are the specific conversion rates of the two individual reactions and their sum is
with:
Second, even if the mechanism involves several steps, one of them can determine the overall kinetics. For instance, this would be the case for a mechanism composed of two consecutive reactions when the first reaction is significantly slower than the second. Then, the first process would determine the overall kinetics that would obey a single step, whereas the mechanism involves two steps.
In this study, ARC tests were stopped at 160C (for new cells) and 90C (for aged cells). The aged cells were subjected to post-abusive characterisation. The use of this temperature range guarantees keeping the cell intact. The principal reactions at this temperature are first the SEI and then anode reactions: consumption of Li in the anode when the tests stop at 90C, and the consumption of active materials in the anode for tests stopped at 160C. It seems reasonable to model the process as a single-step equation.
is the kinetic model. This function is based on physical-geometrical assumptions of regularly shaped bodies. We understand that these assumptions cannot describe heterogeneous systems. Therefore, the idea is to describe as easily as possible more complex reactions.
The first expression of
comes from the experimental fitting of
through relation (
1) under isothermal conditions:
Sestak and Berggren [
5] introduced a semi-empirical model (SB model) that estimates this:
Several variations of this model exist. The three principal ones are as follows:
The Avrami–Erofeev model:
The Prout–Tompkins model:
and the Prout–Tompkins regular model, where
.
The lack of information regarding the estimation of these parameters led us to propose a way to estimate them. In the following sections, a method to build a thermal runaway model is proposed. To model it some parameters are required:
the onset temperature and so the degree of reactants converted ;
the parameters of the kinetic model ;
the parameters of the Arrhenius law: and A;
the time of simulation.
The following sections describe how to obtain these parameters from ARC tests.
3.1. Determination of Parameters and
The first step is to determine the onset temperature. A new definition is proposed. Rather than defining the temperature onset as the temperature at the instant when the heat rate is over 0.02C/min, we will say that it is the temperature at the instant when the heat rate starts to increase.
The heat rate is defined as:
ans so the time onset
is defined as:
This instant is denoted . Different parameters can be evaluated at this instant:
the temperature onset ;
the degree of reactant converted ;
the heat rate .
In
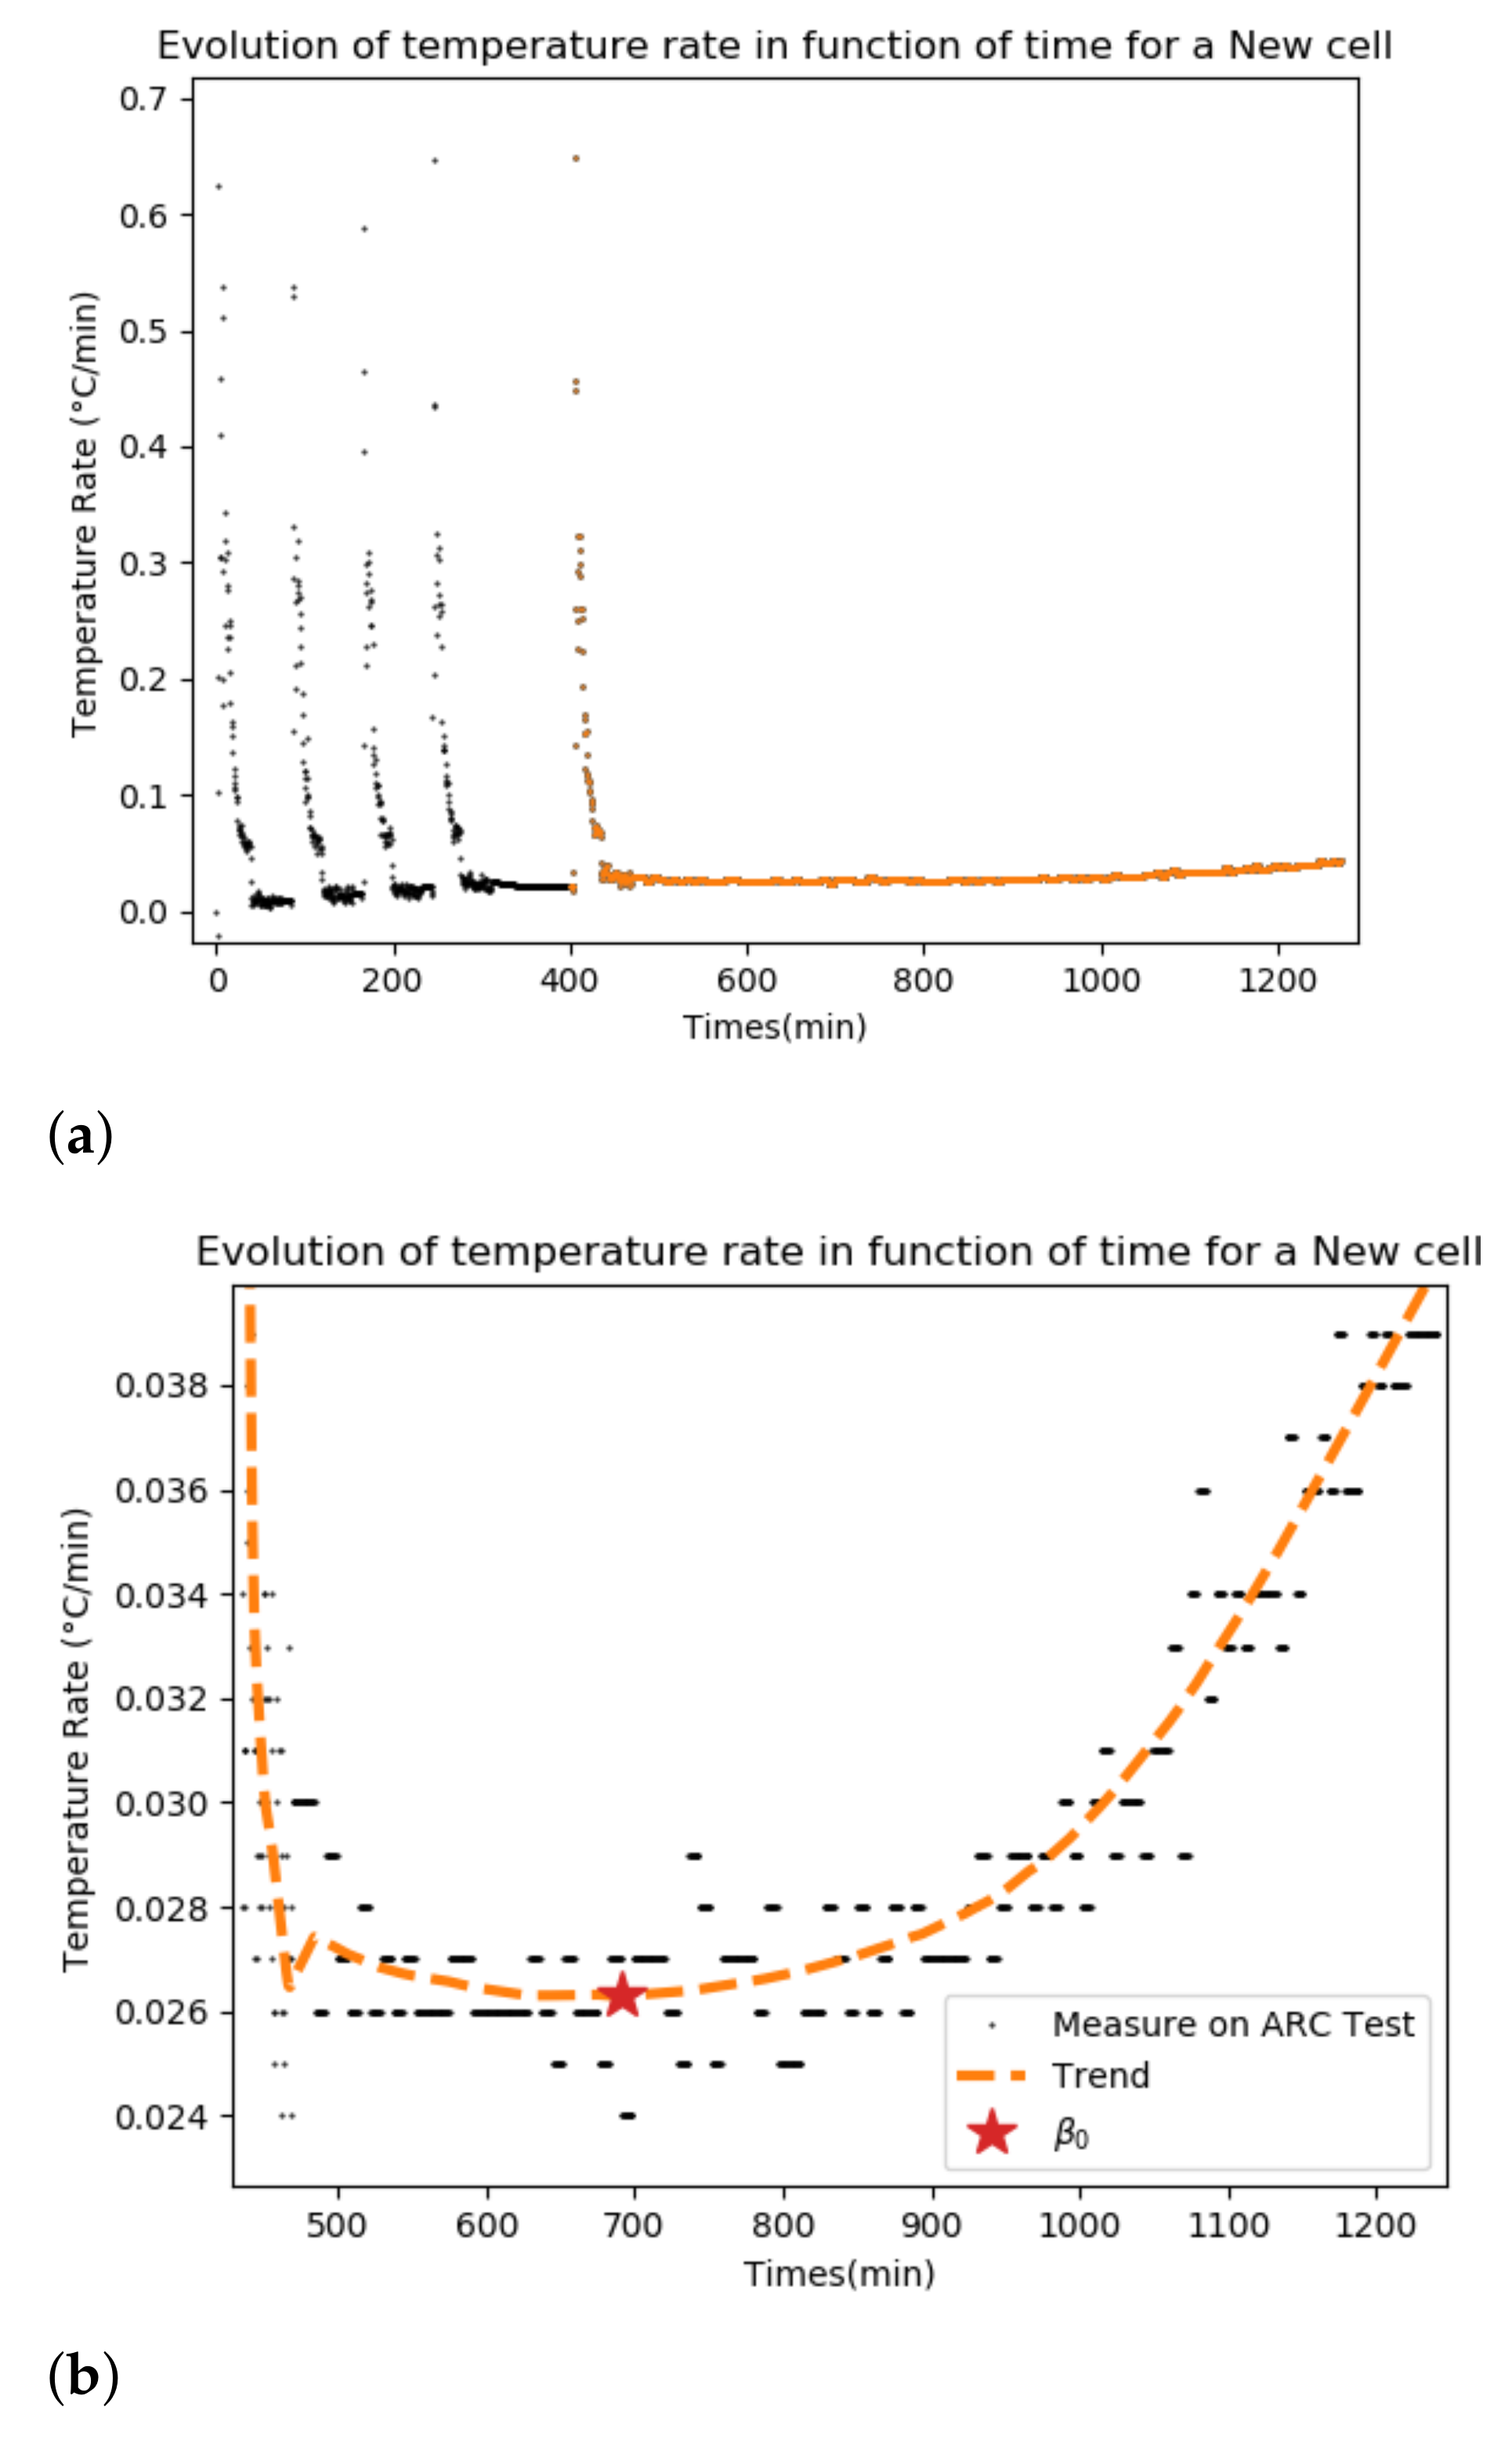
Figure 1, an example of heat rate measured during an ARC test on a new cell is given. On the left side (
Figure 1a), the different heating levels (black peaks) can be observed. On the right side (
Figure 1b), a zoom on the plot is chosen as the onset temperature. In orange is the trend.
3.2. Estimation of Parameters
Once the onset temperature of each cell is determined, the parameters of the model can be identified.
The demonstration is realised under adiabatic conditions. The energy conservation equation for an adiabatic reaction guarantees:
where
(
J) is the total heat that can be produced by the reaction and
is the total capacity (
).
The heating rate is denoted by:
With this notation the thermal runaway model (
1) becomes:
At the start of the reaction
,
. The reactants begin to transform and we can consider that the heat rate is constant:
Therefore, the SB kinetic model can be approached by a limited development:
Therefore, when
Equation (
13) is:
By deriving Equation (
16) by
T:
Due to the adiabatic condition
verifies (
10) so:
Three cases are possible at the beginning of the reaction ():
. The reaction is instantaneous. Then:
. The phenomenon occurs in a chain reaction. Then:
At the beginning of the reaction, it seems reasonable that
be positive or null. This implies:
Gorbatchev [
13] has shown that no more than two kinetic exponents are necessary to describe any kinetic schema, so we choose
.
n is considered as the order of the reaction, so
, and therefore:
Let us study the Gibbs free energy of activation, defined as:
where
is the Boltzmann constant and
h the Planck constant and so
.
k is the constant reaction.
Chemical thermodynamics explains that if
: the reaction is thermodynamically favourable and will occur spontaneously;
: the reaction is at its state of equilibrium;
: additional energy must be input for the reaction to occur.
In ARC tests, the cell is heated for a few minutes and then there is a 35 min break: if the heat rate is not over 0.02C a new step is started. During these first steps additional energy is necessary to trigger the reactions. Therefore, must be positive. At the onset temperature: , the thermal runaway starts and reactions become spontaneous so .
We consider that at , when the reaction is at its state of equilibrium. The free enthalpy is then equal to 0.
l will be chosen so that the Gibbs free energy is positive before and negative after, and so that is verified. Until these conditions are verified, is reduced per step to 1.
For a fixed
n, Algorithm 1 can be used to choose the parameter
.
| Algorithm 1 Calculate l. |
Require: n, the onset index and Calculate m thanks Calculate G thanks while do Calculate new m Calculate new G end while
|
3.3. Estimation of
Energy activation (
) and pre-exponential factor
A are calculated thanks to Equation (
13) and the calculated parameters
(
Figure 2).
The pre-exponential is defined as:
3.4. Remarks about the Temperature Effects
The rate constant
k is defined by the Arrhenius law, where energy of activation is considered a constant parameter (independent of the temperature). This approximation proves to be a very good one, at least over a moderate temperature range. In this case, kinetic phenomena can be interpreted as a set of elementary reactions. This theory is totally adapted for gas phases where chemical transformations take place in a series of isolated binary collisions of molecules, but less for solid or liquid phases or when the reactions are blended [
5,
14].
There is another way of calculating the rate constant. The expression comes from the transition state theory defined by Equation (
21). In this case the energy of activation
and pre-exponential factor
A are dependent on the temperature. It is this theory that is used to determined the values of
. It seems well-adapted because in the system the reactions are blended and are in different phases. Pulses of heat impact the progress of the reaction (
) and so the transitory state of equilibrium. The level of energy of activation required to realise the reaction will change.
3.5. Remarks about the Precision of Measurements
Algorithm 1 updates
until all the values of
G are negative before
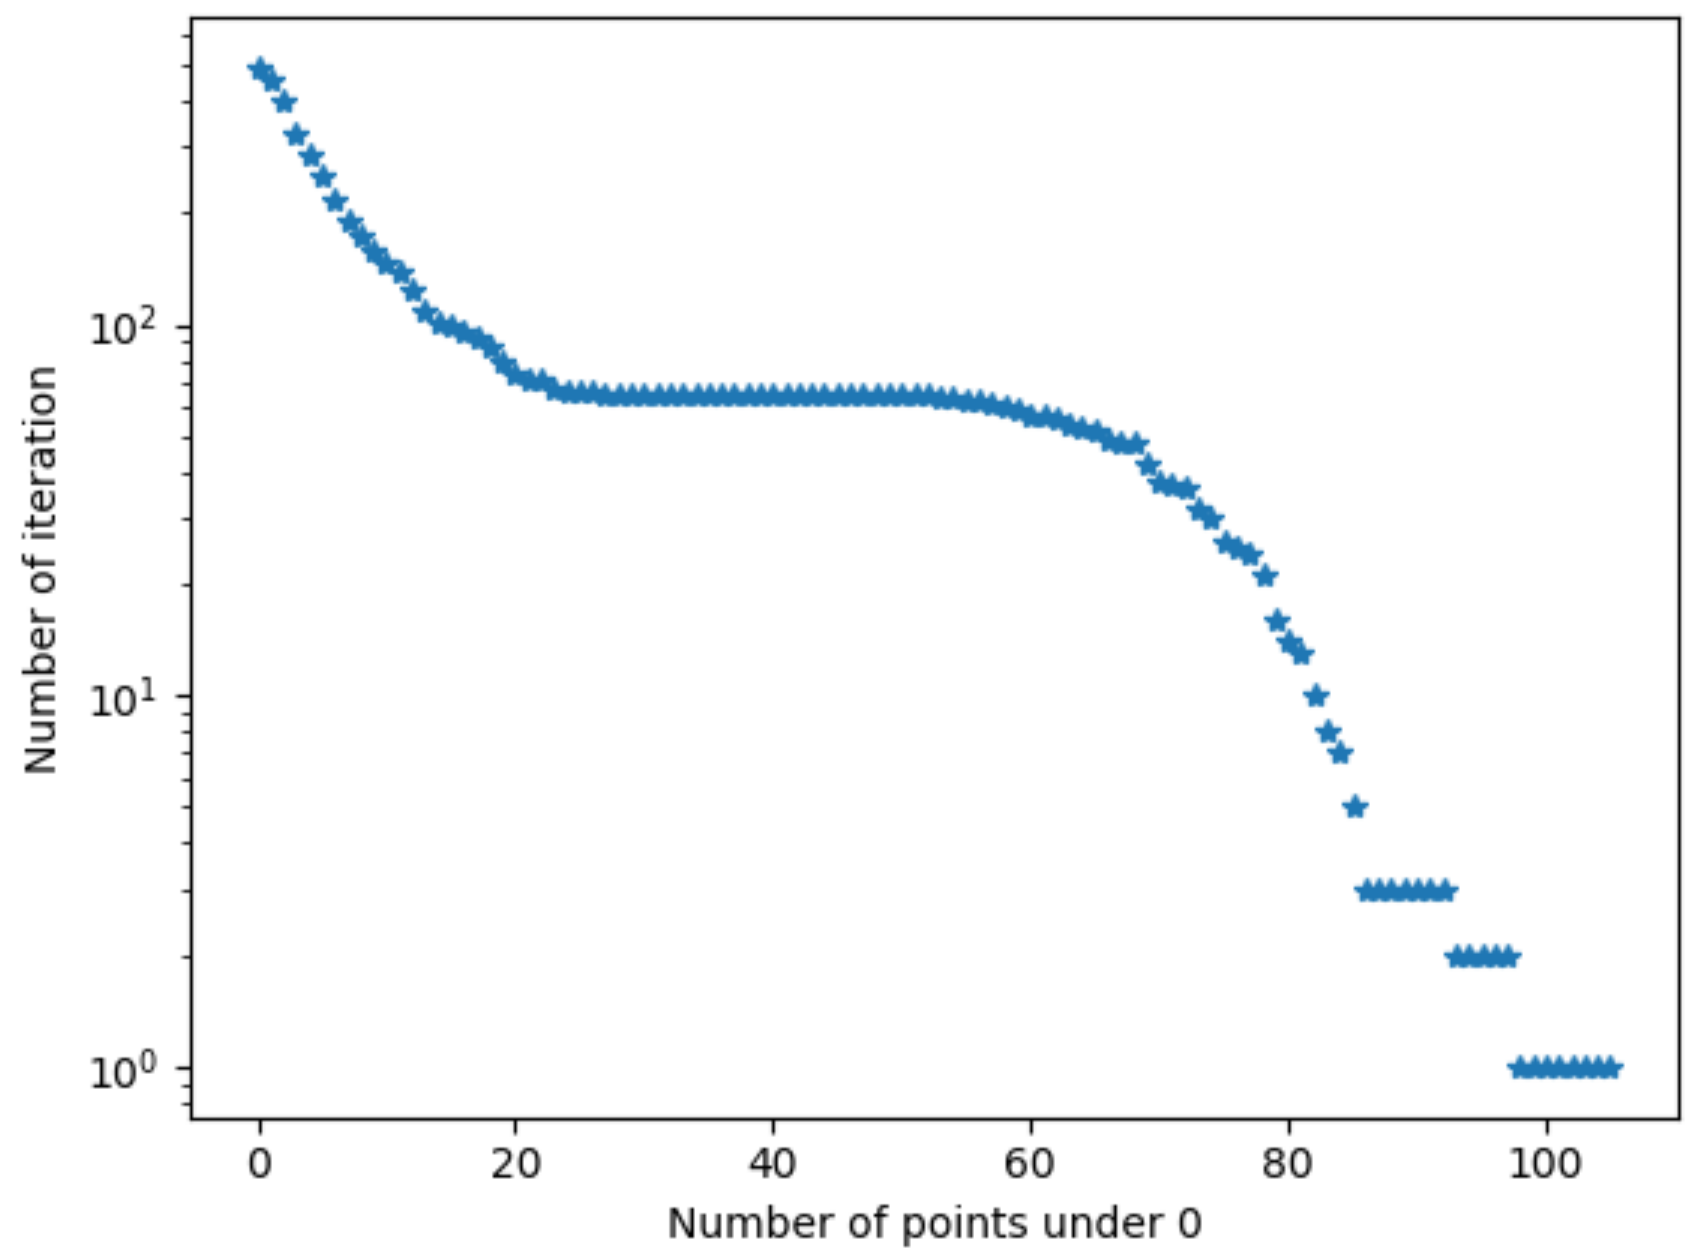
. Sometimes, due to the precision of the measurement, few points are not under 0 during several iterations. For example, in
Figure 3, 20 iterations more were performed because 3 points were still positive.
was then overvalued.
To avoid this kind of problem, instead of verifying , a tolerance is added. In theory no value can be positive. In this case, we accepted a maximum of 10 positive values.
4. Results
All the parameters described were calculated on aged cells in order to appreciate the impact of the ageing on the kinetics model. The values were crossed with experimental results to verify the coherence of the values obtained.
4.1. Post-Mortem Analysis
The negative electrode is the site of the exchangeable lithium loss (SEI, Li-plating, ...). This is why the post-mortem analyses (GD-OES, Li-NMR and EIS) were focused on it. The results are presented in the next paragraph.
4.1.1. GD-OES and Li-NMR
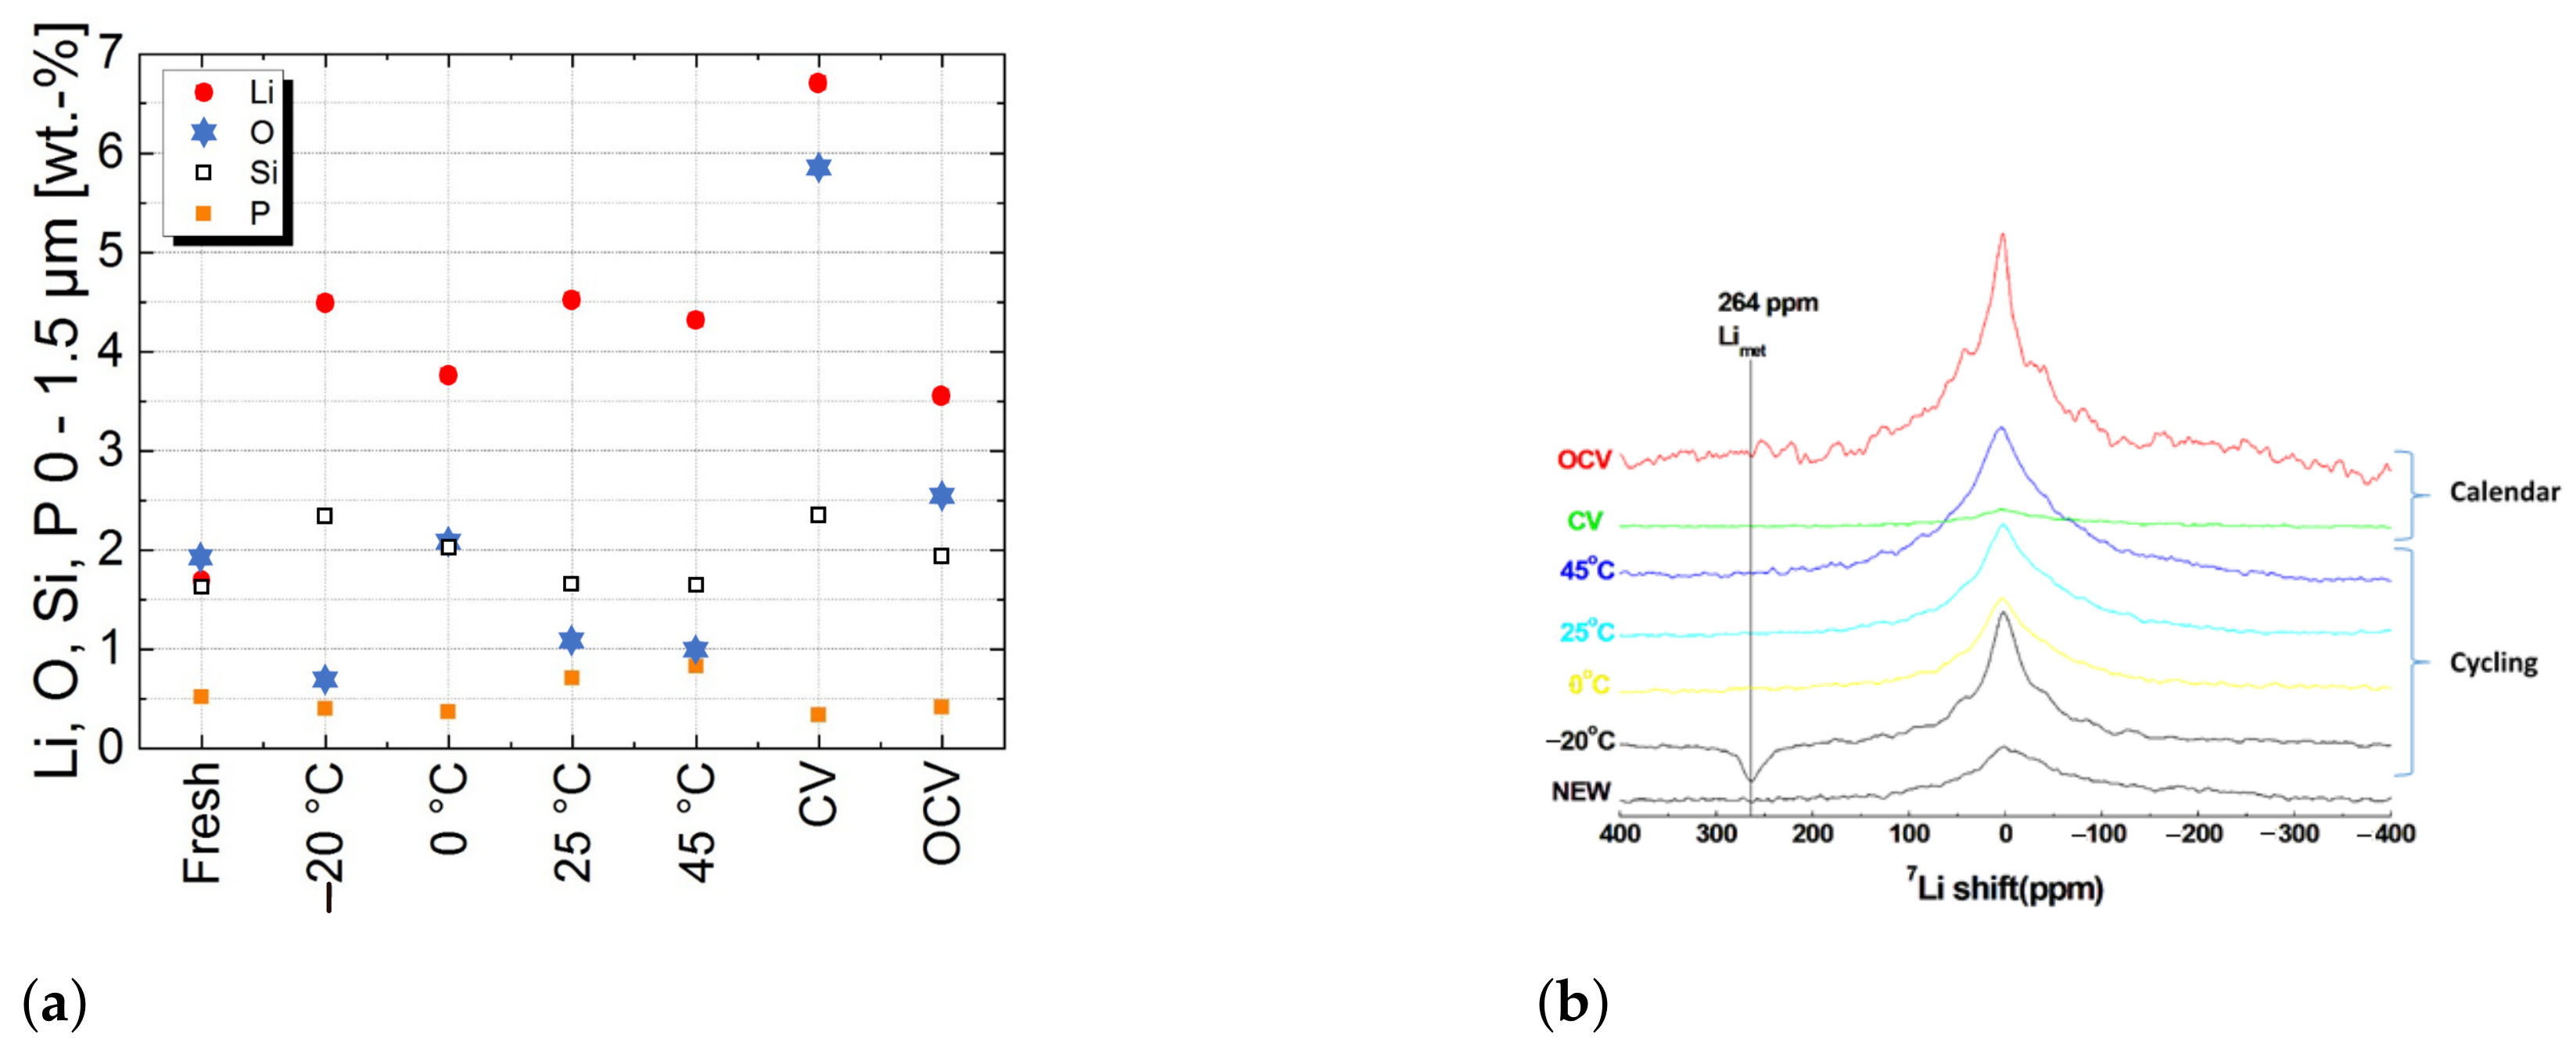
Figure 4a presents the composition of the negative electrode surface after the different ageing conditions obtained by GD-OES. GD-OES allows us to study the chemical composition of the surface in the first 1.5
m (total thickness of electrode is 44
m) and allows us to understand which ageing mechanism takes place for each ageing condition.
For all aged cells, GD-OES measurements show that Si particles, initially well distributed in the negative electrode depth, are concentrated on the electrode surface. This migration should be related to the formation of Li-silicates [
15], which consume cyclable Li.
Compared to fresh cells, the quantity of
increases whereas the quantities of
O (oxygen) and
P decrease for cells aged at −20
C. This shows that SEI does not grow on the electrode surface and it reveals the presence of metallic Li on its surface. Li-NMR measurements presented in
Figure 4b confirm this observation.
When cells are aged at 25
C and 45
C,
increases while
O decreases and
P increases, which reveals SEI growth by salt degradation [
16].
At 45
C calendar ageing, the observations are the same for both CV and OCV conditions. The increase in
coupled with the increase in
O and the decrease in
P reveals that SEI grows by solvent degradation [
16]. The mechanism is more pronounced for CV than OCV conditions.
Cells aged at 0
C have no preponderant ageing mechanism considering the very small change in
O and
P quantities.
Li-NMR MAS (
Figure 4b) shows that the observed Li is not in a metallic state. The Li detected here by the GD-OES analysis is not contained in the SEI layer and not in a metallic state.
4.1.2. EIS
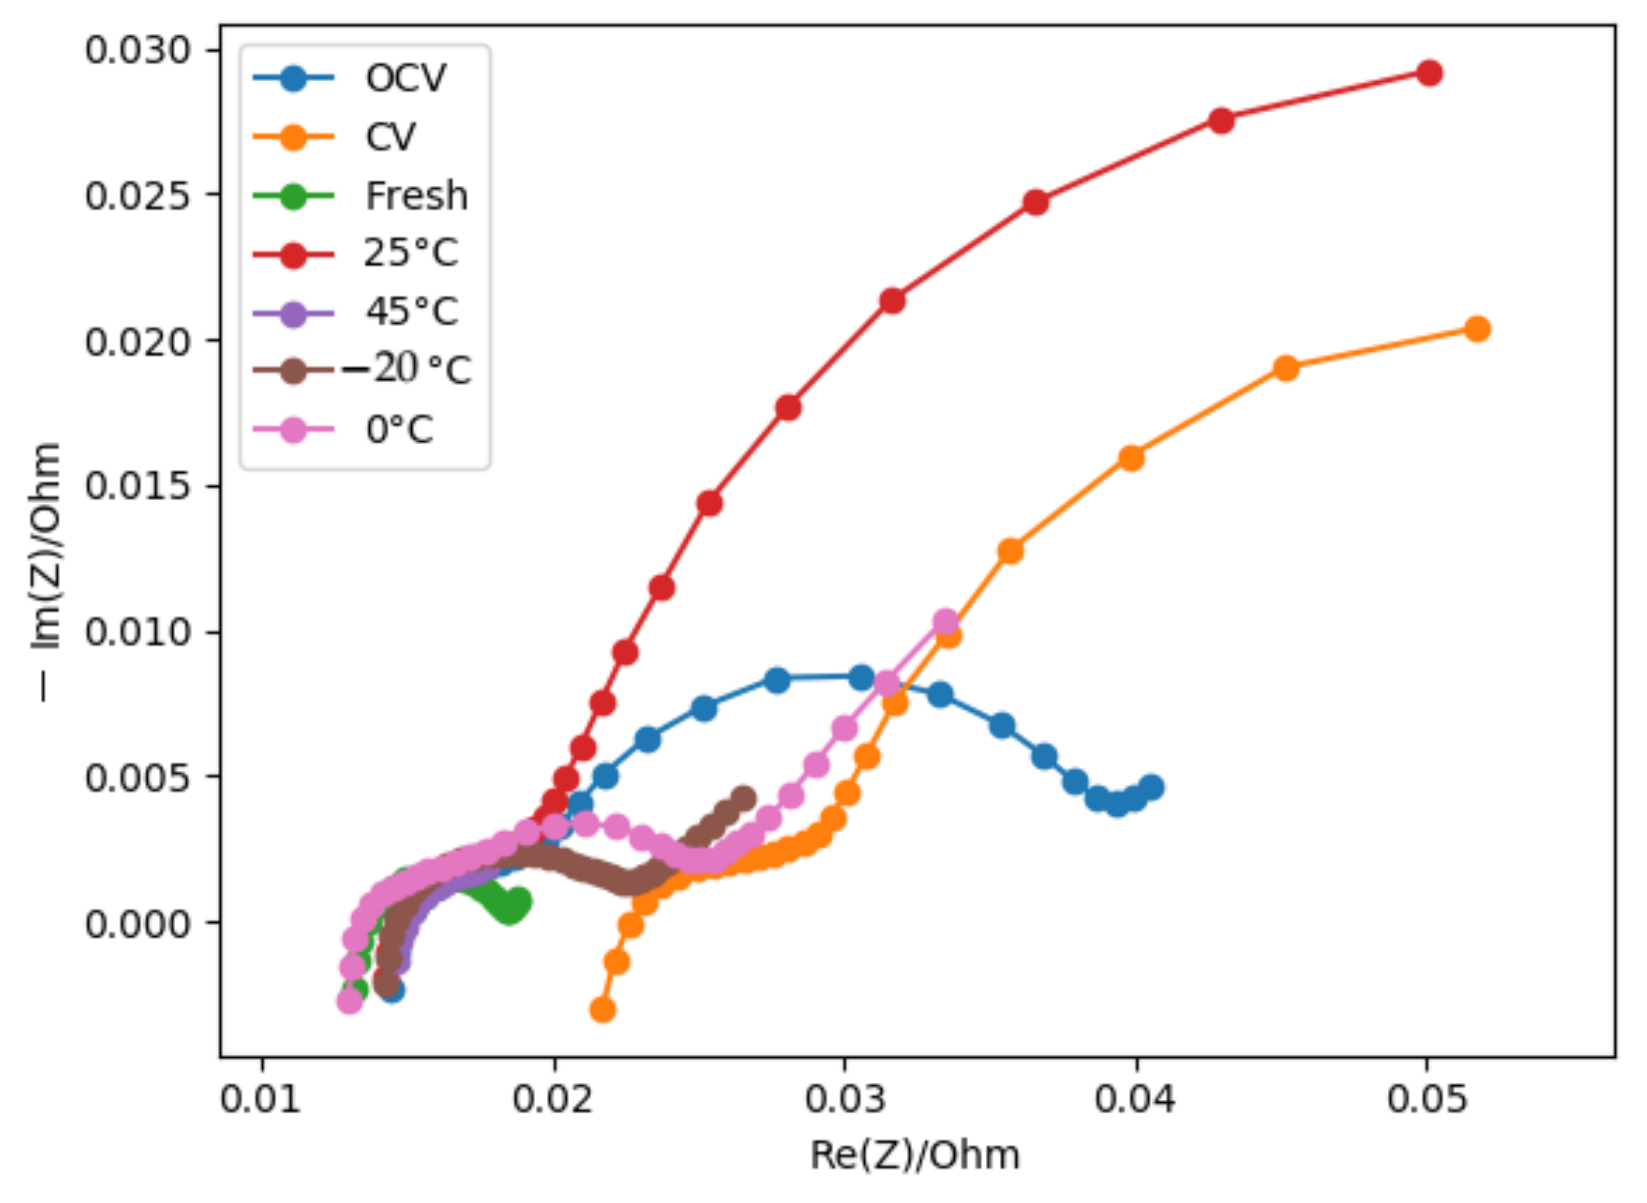
Figure 5 and
Figure 6 present the results of the impedance spectroscopy conducted on half of the cells built from the aged negative electrodes. The results are for a cell charged at
.
EIS spectra can be fitted by an equivalent circuit:
is the resistance at high frequency associated to the ohmic resistance of the cell. It reflects the lithium ion transfers in the electrolyte.
is linked to the first semi-loop. The frequency range of apparition is related to the migration of the lithium ion through SEI.
is associated to the second semi-loop. The frequency range of apparition is related to the charge transfer through the electrode/electrolyte interface.
Figure 5 represents the results in the Nyquist plan of the different cells.
Figure 6 presents the parameter values of the fitted models on each plot.
No ageing cell has the same resistance and capacitance, which reflects a difference in the morphology of the “electrodes”.
The cells aged at −20 C, 0 C, and by calendar ageing at CV keep an interface resistance () in the same order as the fresh cells. These cells may not have developed extra SEI, or the thickness of the SEI has not increased.
The interface capacitance of the fresh cells and the cells aged at −20 C are quite the same, which confirms the results of GD-OES: no extra SEI has been formed.
The interface capacitance of cells aged at 0 C and by calendar ageing at OCV is more important than that of the fresh cells, but the resistance is in the same order of value. It induces a transformation in the morphology of the SEI for these cells. The SEI is less compact.
EIS confirms that cells aged at 25
C and 45
C have the same kind of SEI morphology. The resistance and capacitance interfaces are closed (
Figure 6c).
Cells aged by a calendar process at have a resistance and close to the one of cells aged at 25 C and 45 C. GD-OES has shown that the extra SEI developed is not of the same nature. One growth is due to salt degradation, the other to solvent degradation. Compared to cells aged at OCV the resistance is higher, which means that the thickness developed by the CV process is greater than the one developed by an OCV process. This is confirmed by GD-OES.
Regarding charge transfer resistance , cells aged at 25 C, 45 C, and by calendar ageing keep the same order of value as the fresh cells. However, charge transfer capacitances () are lower than for the fresh cells. The interface film solution might be less porous certainly due to the growth of SEI.
The cells aged by calendar ageing at constant voltage tend to have the same morphology as cells aged at 25 C and 45 C regarding the values of .
Nevertheless, the ohmic resistance (
Figure 6b) is more important, which means that the properties of the electrolyte are different. The GD-OES shows that the processes of SEI generation are not similar. One is based on the decomposition of salt and the other on the degradation of the solvents. Components present in the electrolyte might be different.
Cells aged at −20
C and 0
C have an important resistance charge transfer
. The growth of the resistance value, in the case of the cells aged at −20
C, can be explained by the development of metallic lithium. In the case of the cells aged at 0
C, the GD-OES analysis exhibits the presence of lithium (
Figure 4a). The analyses show that lithium is not contained in the SEI layer and is not in a metallic state. It is as if lithium was blocked on the the film interface.
4.2. Model Results
Kinetic parameters have been calculated from the ARC tests. Results are presented in the following paragraphs and compared to the results of the post-mortem analysis summarised in
Table 2.
4.2.1. Onset Temperature
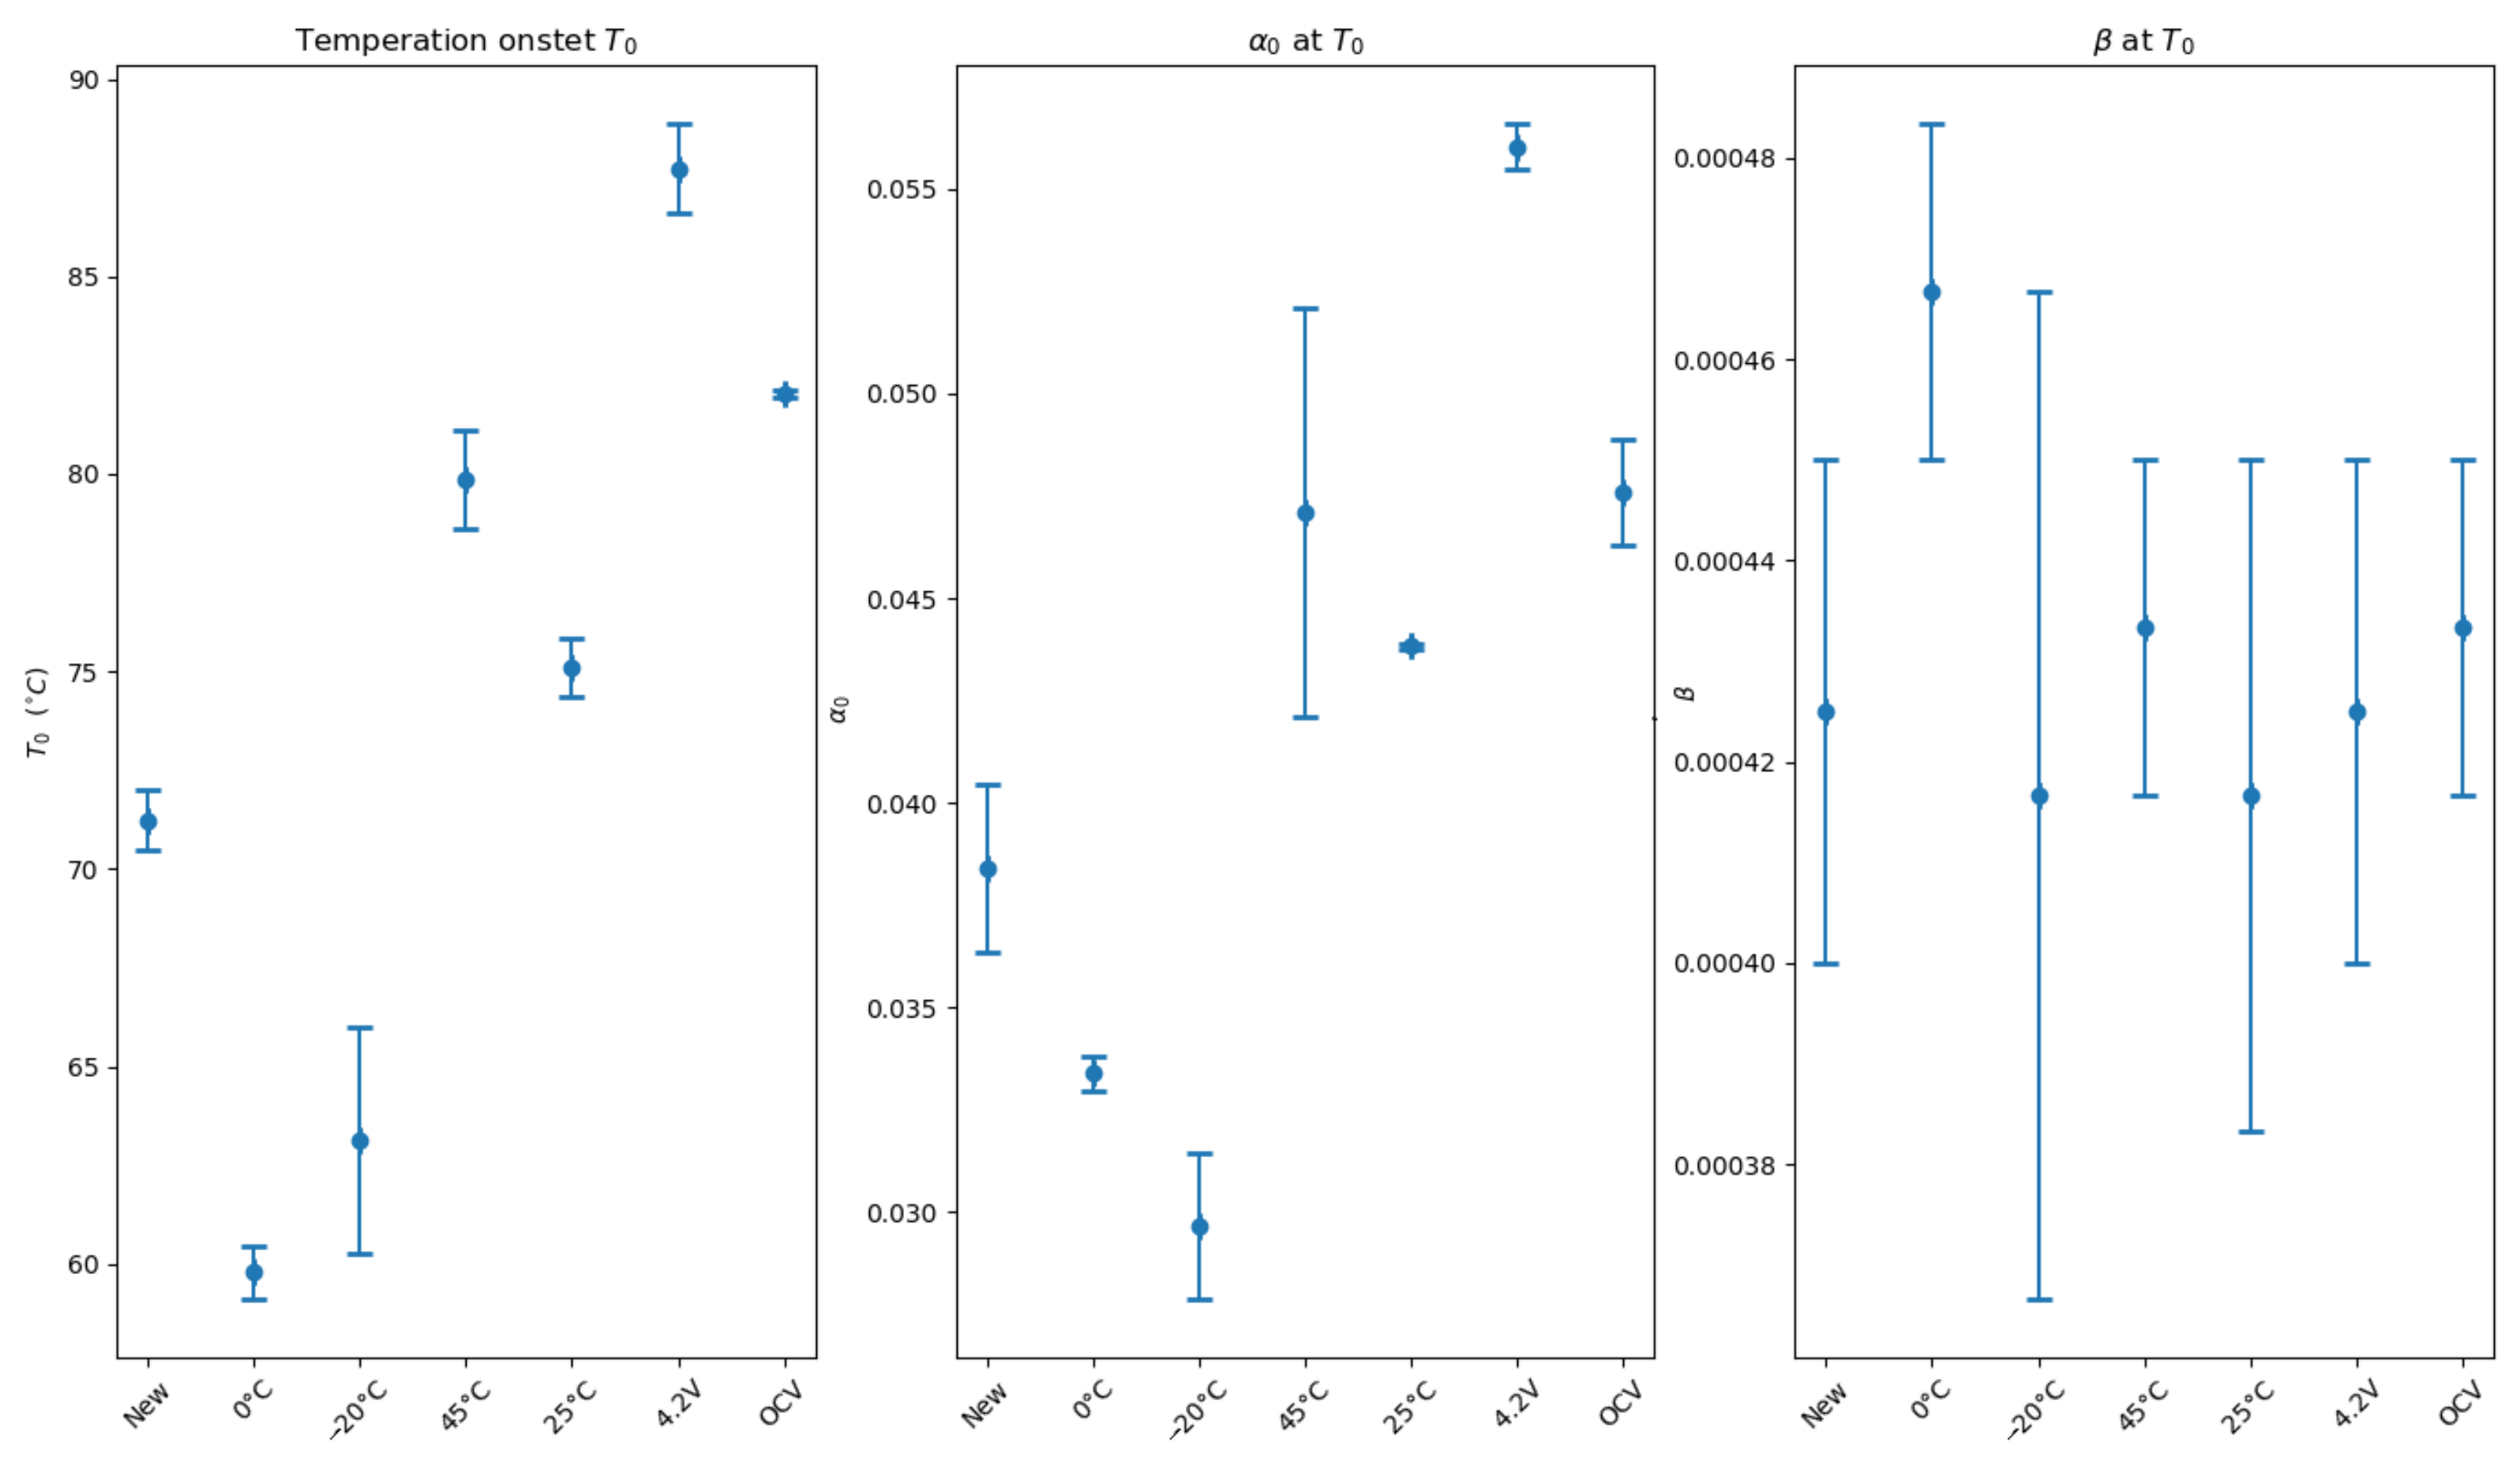
The onset temperature was calculated for each cell (
Figure 7) thanks to the criteria described before. The instant when
is measured represents the start of the reaction. Once the beginning of the reaction is defined, the fractional degree of conversion of reactants
and the temperature rate (
) can be evaluated.
Two groups appear. One group has a lower temperature onset than the fresh cells: cells aged at (0 C, −20 C). A second group has a higher onset temperature than the fresh cells: cells aged at (25 C, 45 C) and cells aged by a calendar process. The fractional degree of conversion of reactants follows the same order, which is totally normal in adiabatic conditions.
Notice that the dispersion of the fractional degree of conversion of reactants for cells aged at 45 C is more pronounced even if the temperature onset is identical. One more temperature pulse has been applied to one of the cells, which explains a larger degree of conversion. Yet it has no impact on the measure of the onset temperature.
The temperature rate is quasi-identical at the beginning of the reaction for each test. Reactions start at the same speed.
4.2.2. Parameters
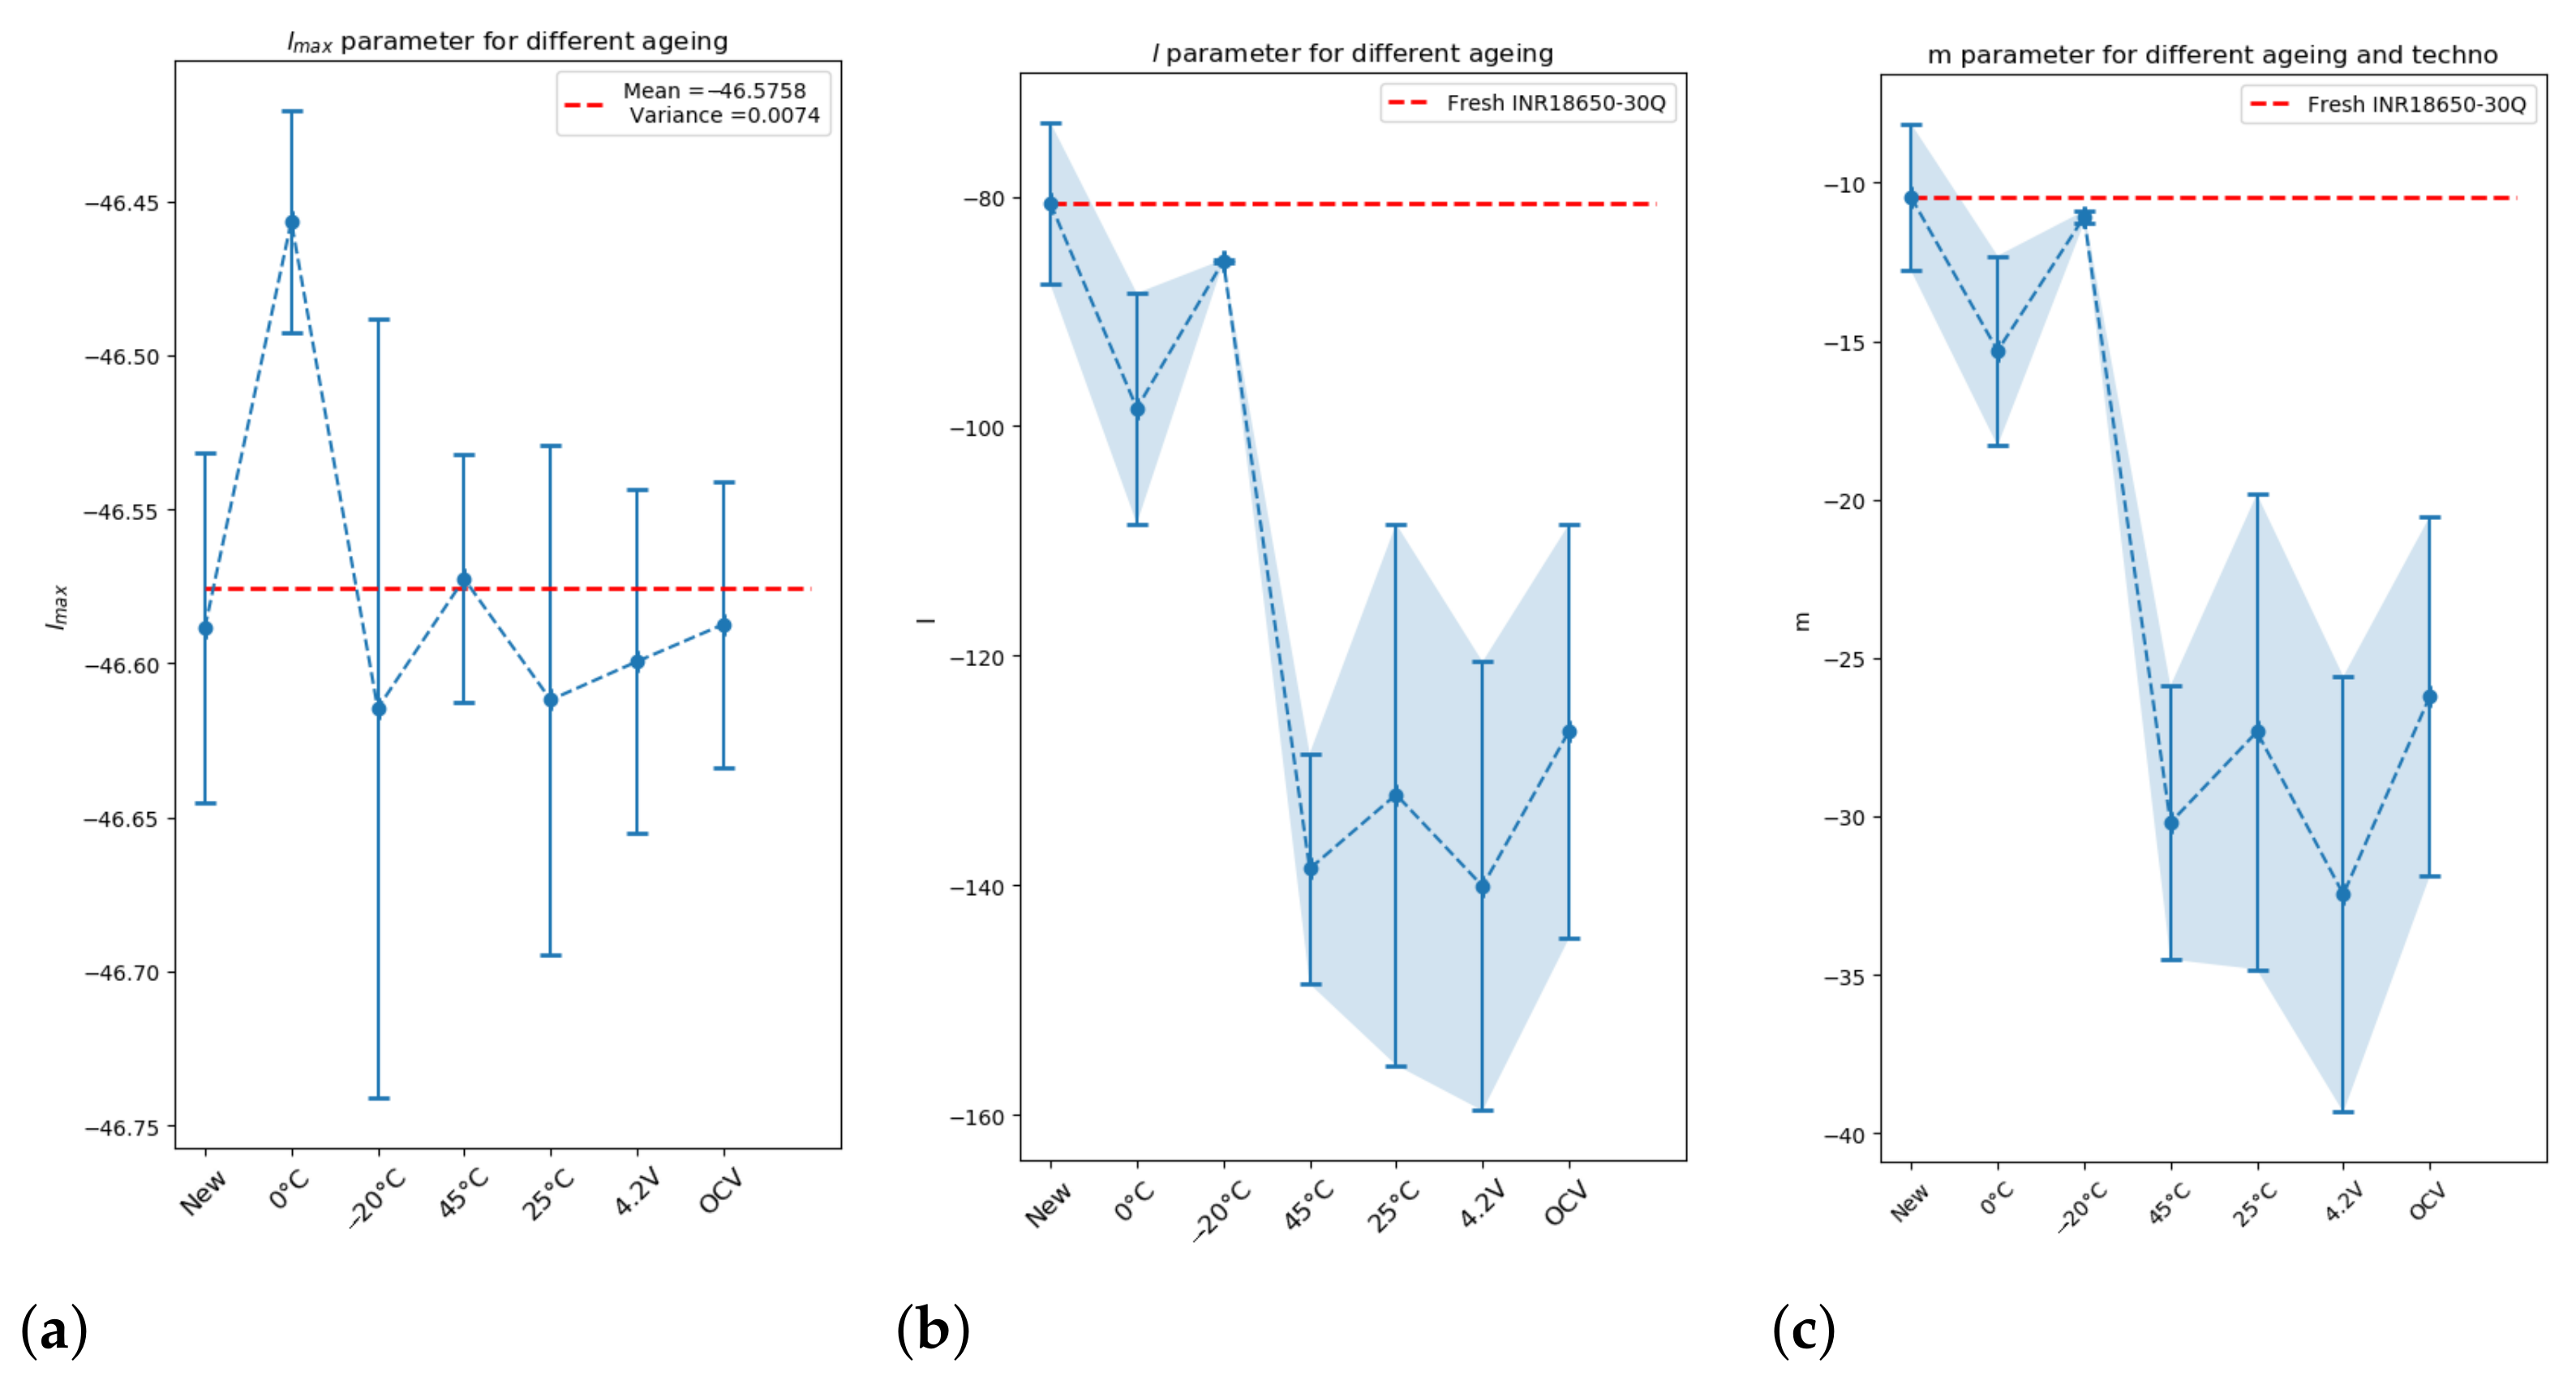
Thanks to Algorithm 1, parameters
are calculated on all the aged cells with
. The results are presented in
Figure 8.
The dispersion of parameter
is very small: 0.007 (
Figure 8a). Conversely,
l (
Figure 8b) does not have the same value depending on the ageing process.
Parameter
m follows the same trend as
l (
Figure 8c). Two groups are formed:
: cells aged at (−20 C, 0 C) and fresh cells;
: cells aged at (25 C, 45 C), and cells aged by a calendar process at constant voltage and at OCV.
The dispersion per condition observed for parameters m and l is due to the quality of reproduction of the ARC test and the precision of the measurements previously explained.
Post-mortem analyses show that the main difference between the two groups formed here is the development of extra SEI. Group G1 has not developed extra SEI contrary to group G2. That is in accordance with the interpretation of the
m parameter. The
m parameter contains information regarding the basic geometrics of nuclei (spherical, prismatic⋯) and the physico-chemical aspects of processes (nucleation, diffusion, transport process⋯) [
5]. The development of extra SEI changes the morphology of the cell.
Cells aged at 0 C have the smallest m in group G1, although no ageing mechanism is preponderant. The EIS study shows that the property of interface capacitance is different. The morphology is different.
In group G2, the values of m are dispersed, which makes interpretation difficult.
4.2.3. Parameters
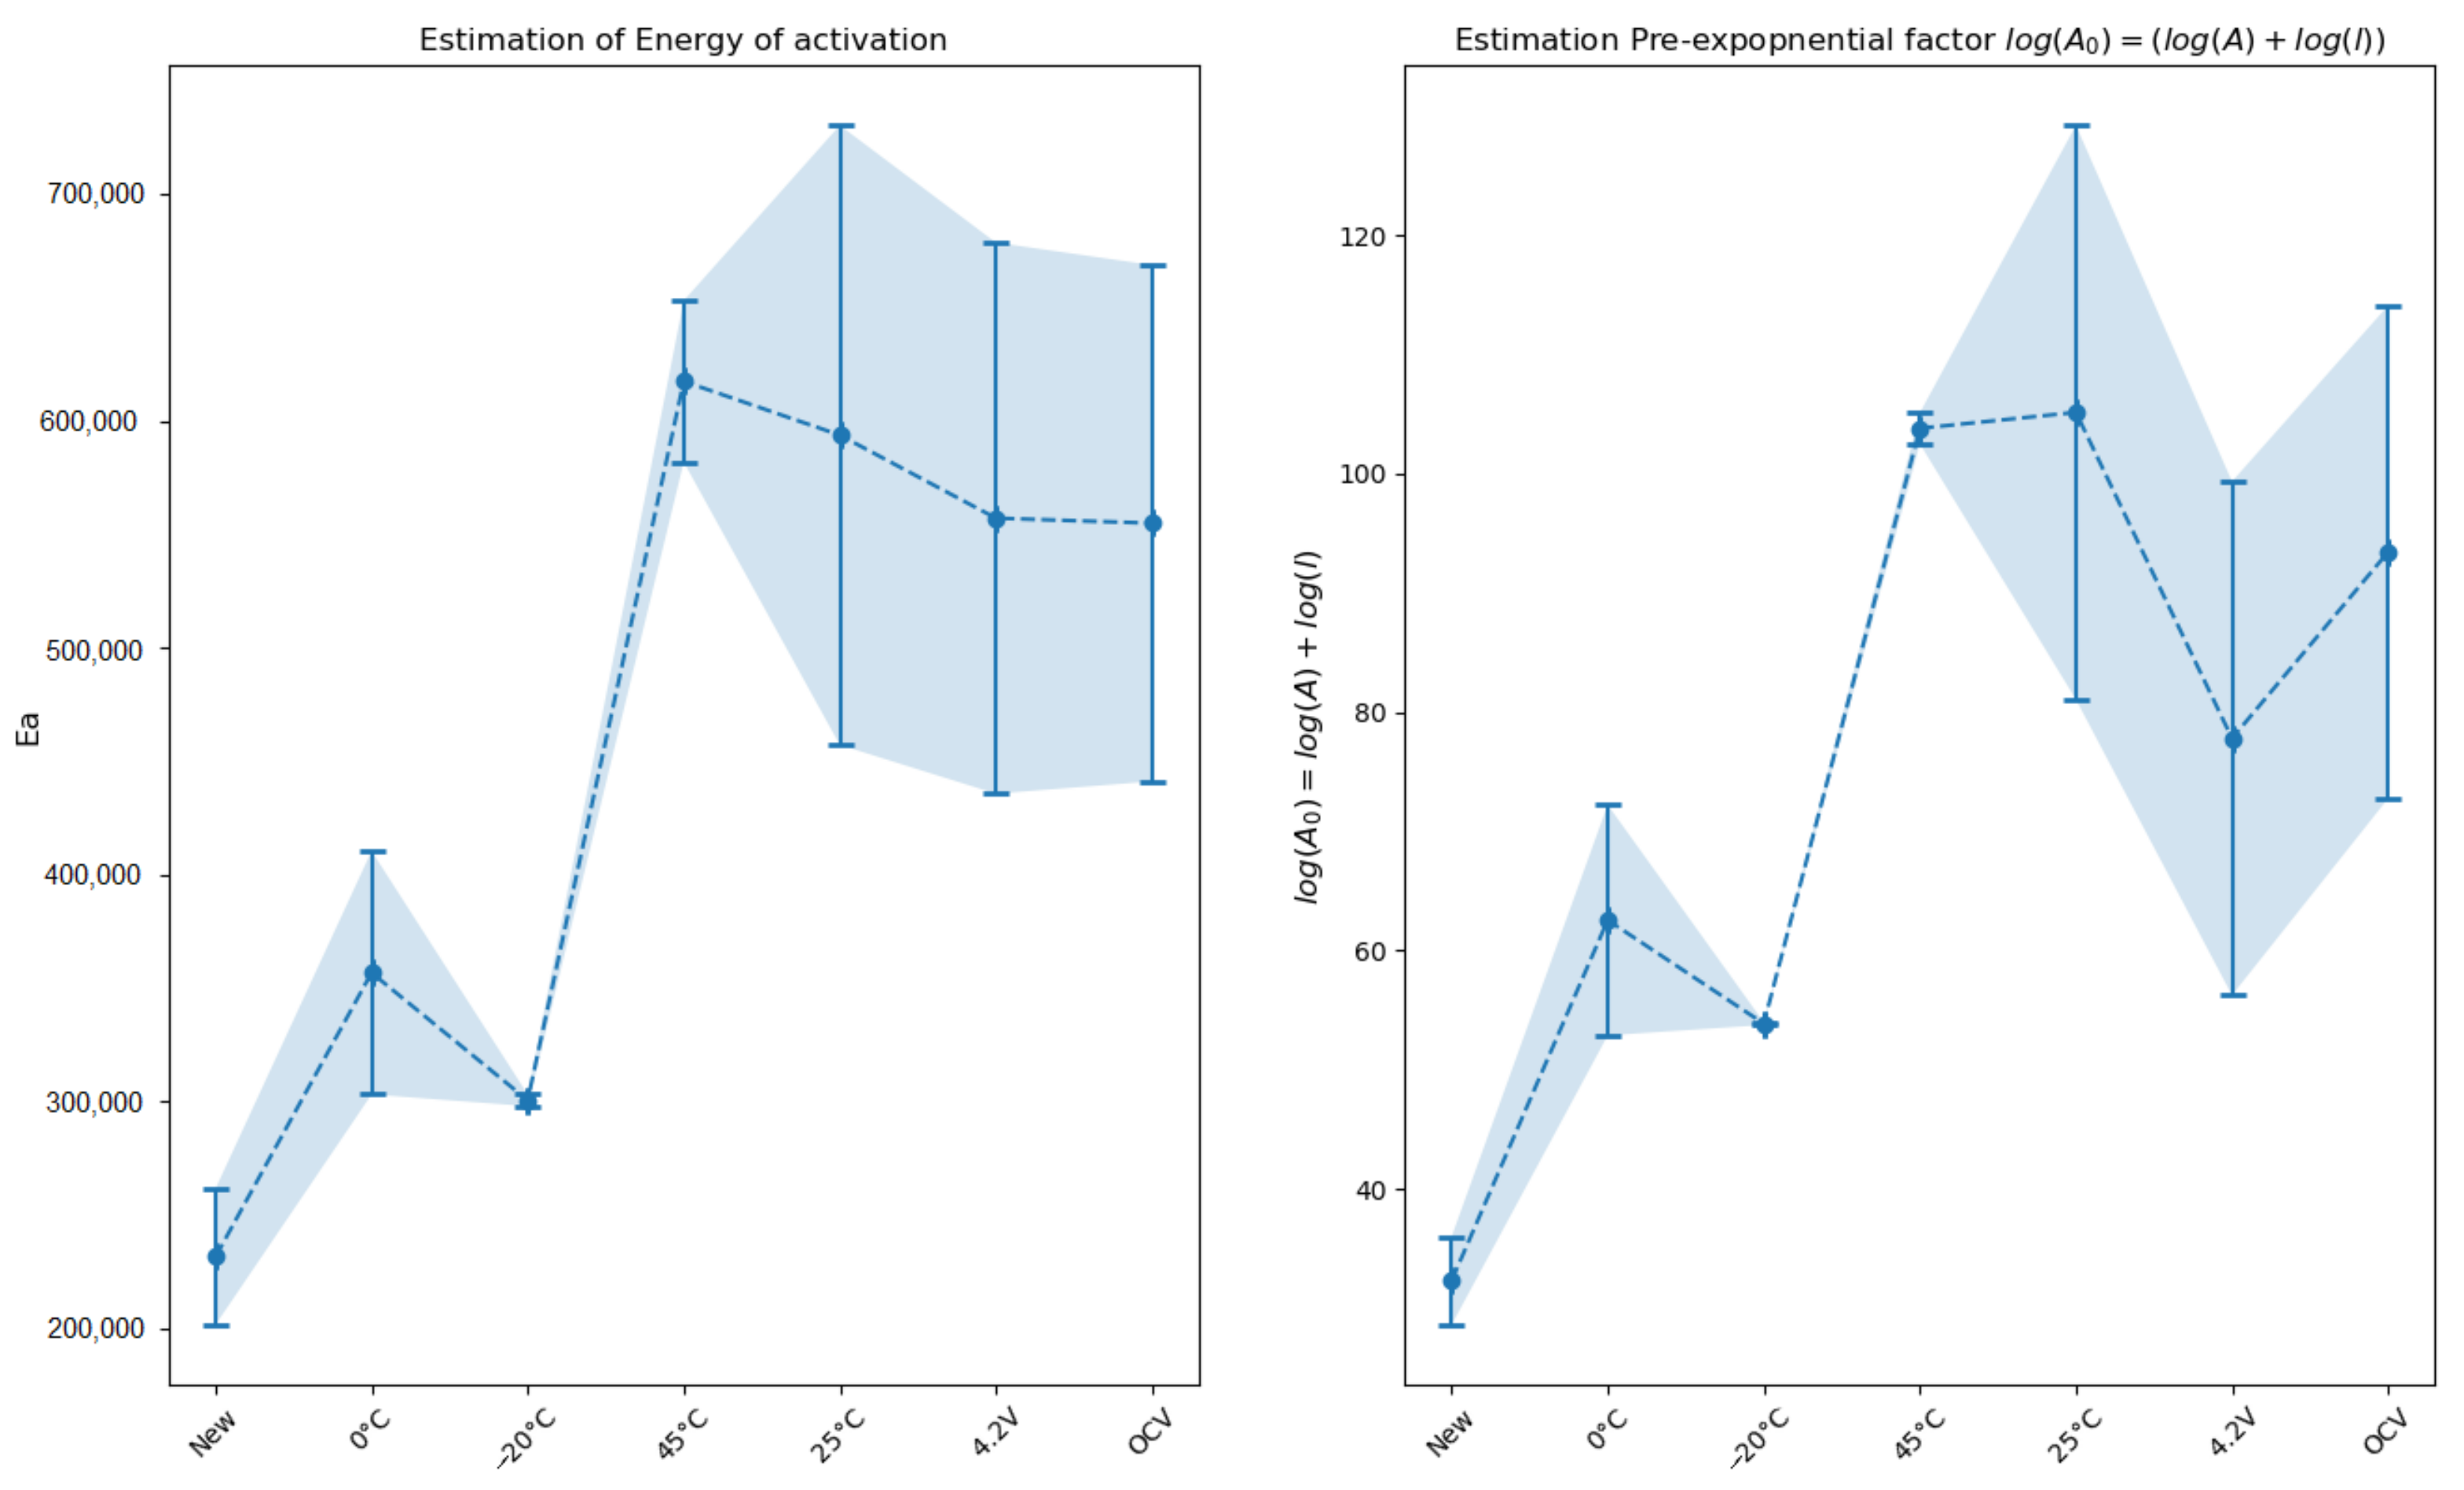
Energy of activation
and pre-exponential factor
were calculated thanks to Equation (
13) and the calculated parameters
(
Figure 9).
Group
has the smallest energy of activation. The energy required to start the reaction is smaller than the energy of activation of the other cells. No extra SEI has been formed in this group and it is well known than SEI plays a protector role in the thermal stability. However we can notice that the activation energy values within this group are not identical (
Figure 9).
Cells aged at 0
C have the highest energy of activation in group
. A high energy of activation means that the reaction is slow. This can be explained by the fact that these cells have a different morphology (as shown by parameter
m) and so require more energy to trigger the reaction. Post-mortem analyses confirm that these cells have been transformed. GD-OES exhibits that lithium is available at the surface of the electrode. EIS has shown that the interface capacitance has grown, revealing a more porous morphology. The porosity may create an imbalance in the concentration distribution of Li. SEI can be formed irregularly on the pores and so creates zones with Li and zones without Li [
17].
In group , cells have quite the same energy of activation but the pre-exponential factor is different. The pre-exponential factor of the cell aged at CV is lower than for one the other cells of group . The pre-exponential factor includes many constants describing the initial state of the sample, such as three-dimensional shape factors of initial particles, molecular mass, density, stoichiometric factors of chemical reaction, active surface, number of lattice imperfections, etc. EIS shows that the structure of the interface is closer to the structure of cells aged at 45 C and the cells aged at 25 C. Extra SEI formed in these conditions is formed by solvent degradation like for the cells aged at the OCV. The EIS and the GD-OES analyses show that the quantity of SEI is more important in the case of the CV ageing process. This can explain the differences in the value .
4.2.4. Simulation
It is often considered that the combination of all the parameters describes the kinetics of the reaction.
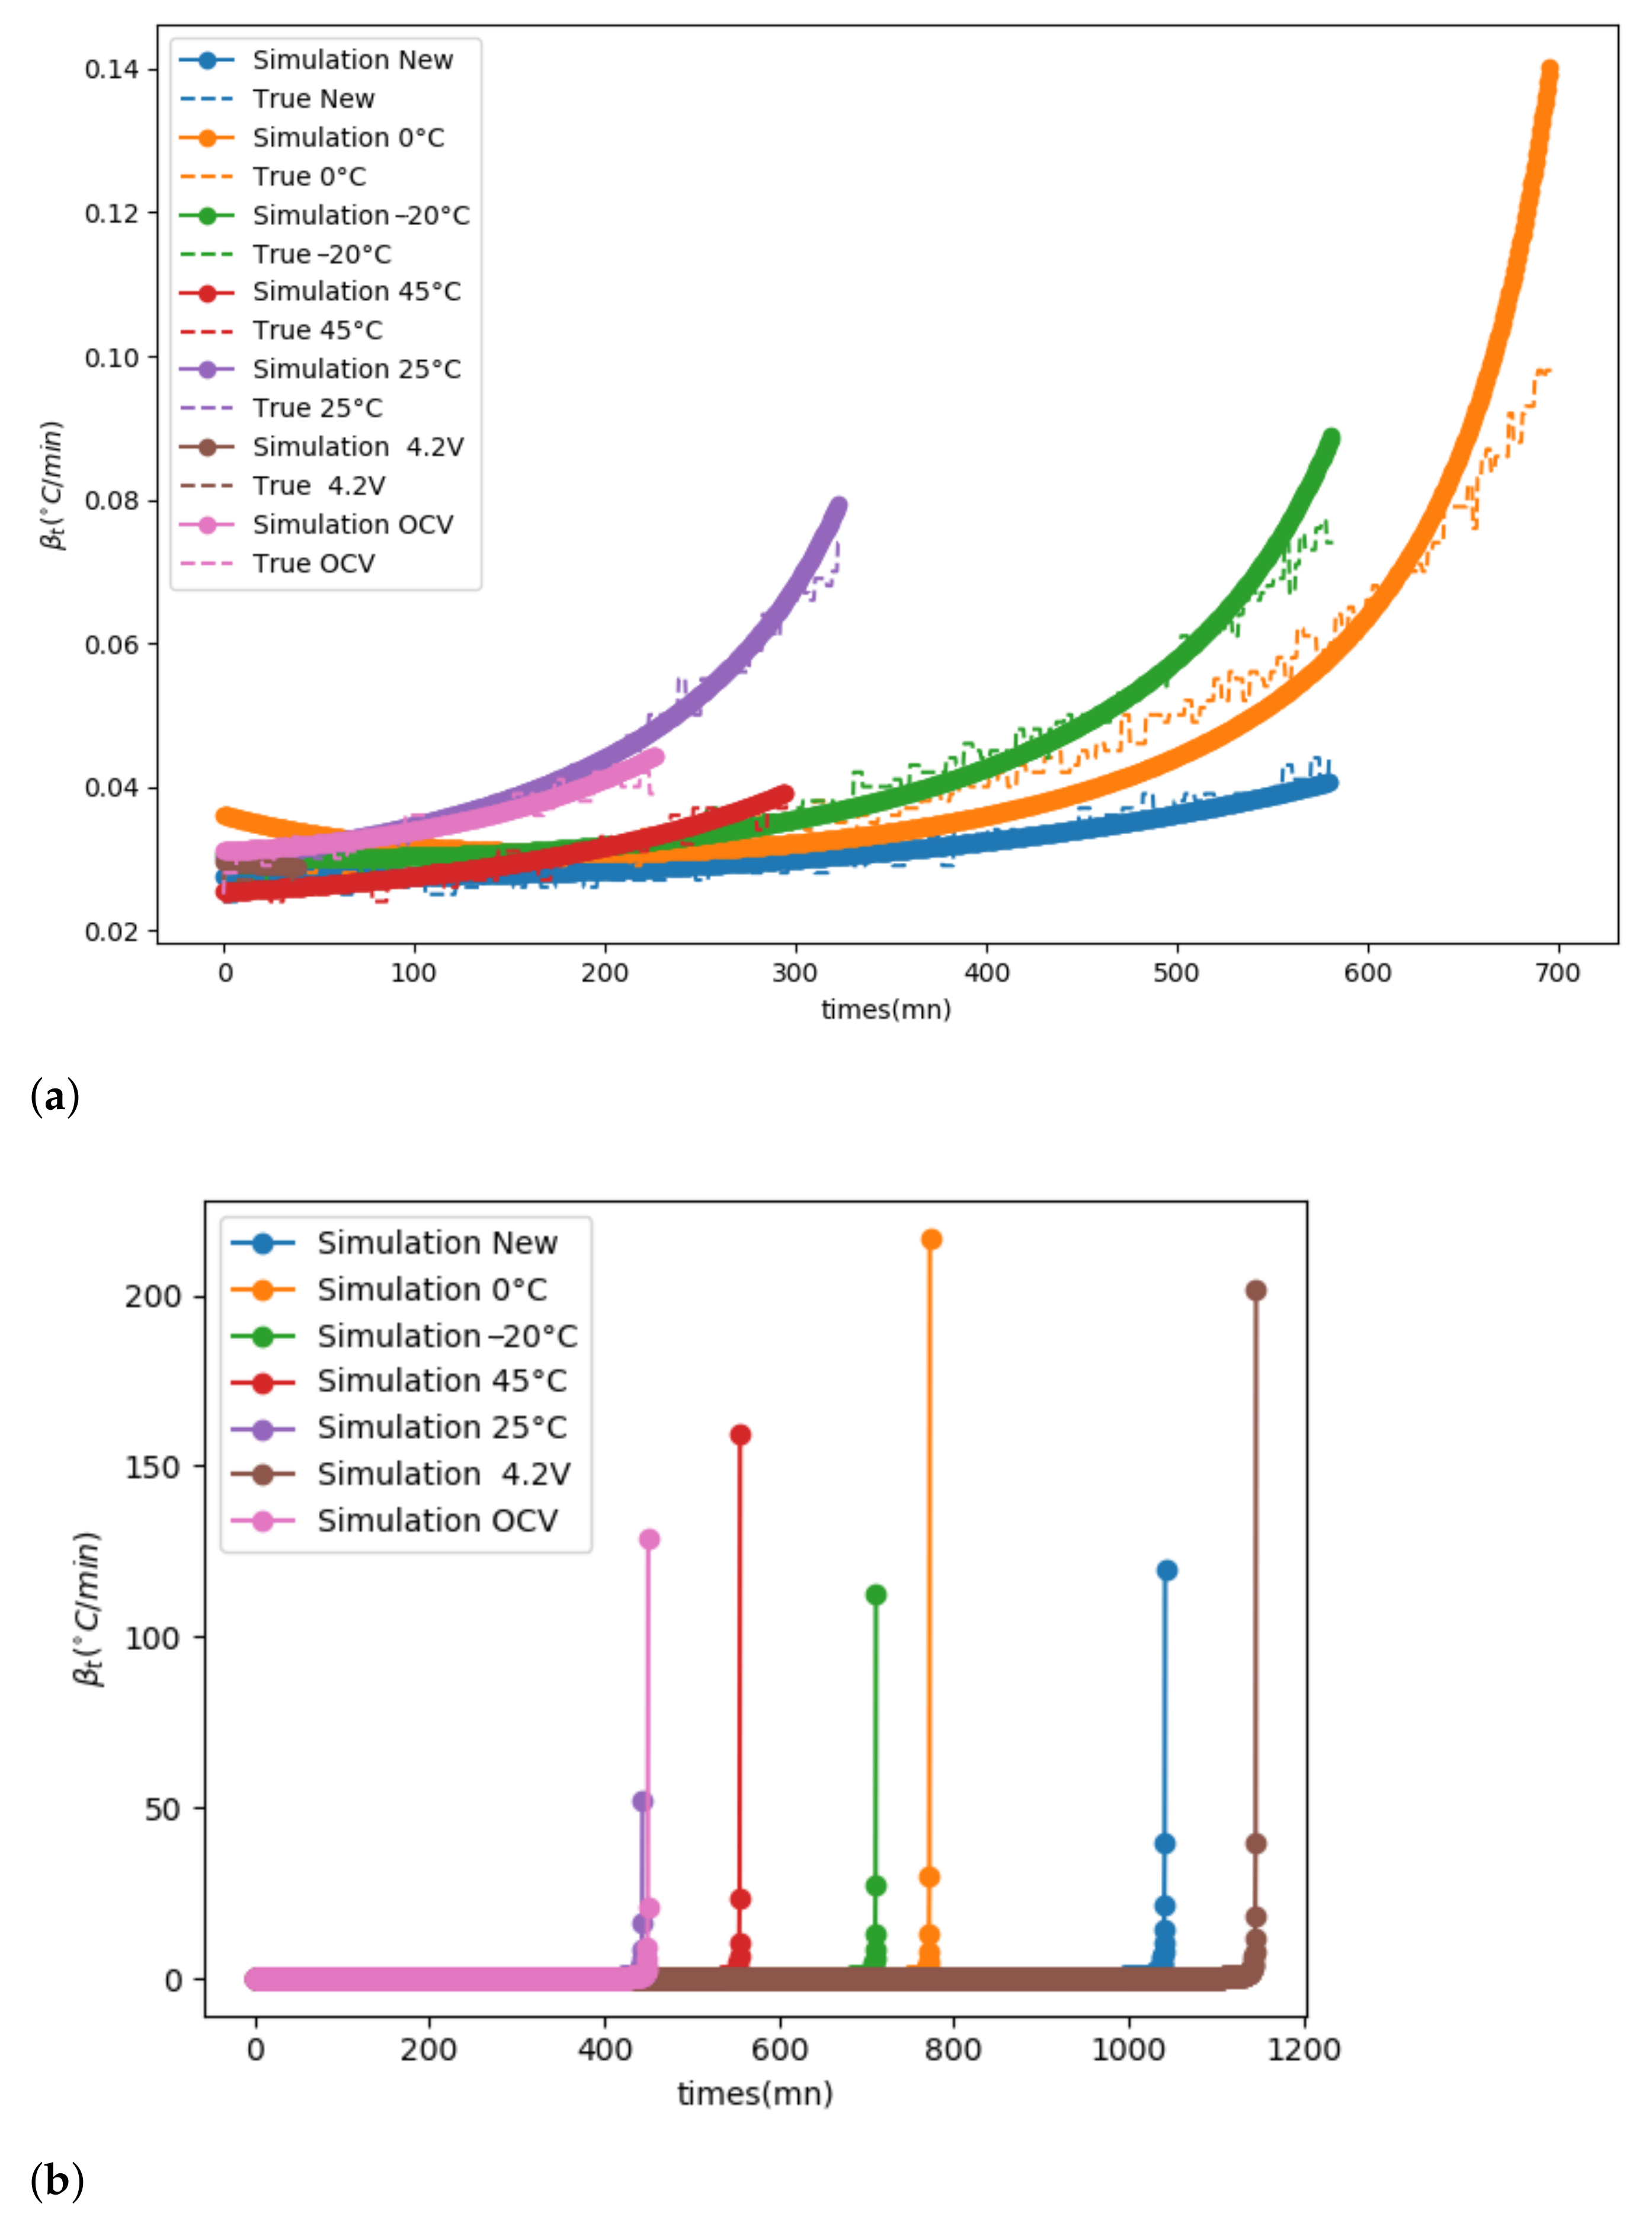
To illustrate this, a simulation using the parameters estimated previously
was realised for each ageing process (
Figure 10b). To do so, the initialisation of the temperature and
is required. Two algorithms are proposed.
The simulations in
Figure 10 were performed with the true
and
. In
Figure 10b, the simulation performed with Algorithm 2 is compared to the true data. The parameters estimated previously
are representative of the kinetics. The kinetics seem to be well reproduced except for the cells aged at 0
C. One possible explanation is that only one energy of activation is considered. In fact, several reactions occur at the same time. The kinetics can change over the time due to a new group of reactions, which will impose their kinetics. This is why the kinetics must be studied on a range of temperatures to improve the results, which verifies an isokinetic relationship.
By applying the second Algorithm 3, it is possible to evaluate the time of reaction. In this case no extra reaction occurs. The parameters
represent the whole reaction. This is the most optimistic case. The most reactive cells are the cells aged at 25
C and cells aged in open circuit voltage (OCV). They are considered more thermally stable because the onset temperature is high and yet the time of reaction is shorter. Cells aged at 0
C and −20
C are less stable (onset temperature small) but their time of reaction is longer. Therefore, mitigation solutions can be set up more easily. The most thermally stable cells are the fresh cells and the cells aged at constant voltage.
| Algorithm 2 Calculation of T. |
Require: n, m, , , , ,, while T ≤ do end while
|
| Algorithm 3 Calculation of T. |
Require: n, m, , , , ,, while do end while
|
5. Conclusions
Thanks to the ARC tests realised on cells aged by different processes, we have shown that parameters must be chosen carefully. Indeed these parameters vary according to ageing and what the cell experienced.
The values of impact the energy of activation and the pre-exponential factor. The transition state theory shows that energy of activation and pre-exponential factor cannot be considered constant. They vary according to the history of the cell. First, the ageing changes the morphology of the cell and consequently the reaction that will be produced. Secondly, the rise in the temperature will change the equilibrium of the reaction, therefore the energy required to trigger the reaction will not be the same.
Once all the kinetic parameters are calculated, simulations can be used to reproduce the rise in temperature. Simulations confirm that the kinetic parameters must be estimated at different temperatures but with constant kinetics. One reaction can impose its kinetics but a new reaction can take over and in turn impose its own kinetics. In this case all the kinetic parameters must be re-evaluated, for each range of temperatures.
Simulations have exposed another problem: some cells are considered more stable thermally because the reaction starts at a higher temperature. However, in this case, the reaction will be realised faster. Other cells have a lower temperature onset but the reaction will be slower, which gives time to find solutions to a thermal runaway. Should we focus on stability in order to minimise the risk of thermal runaway, or should we focus on the time response in case of thermal runaway?
