Article

Versatile AC Current Control Technique for a Battery Using Power Converters

Electrical and Computer Engineering Department, University of Connecticut, Storrs, CT 06269, USA
*
Author to whom correspondence should be addressed.
Batteries 2021, 7(3), 47; https://doi.org/10.3390/batteries7030047
Submission received: 12 May 2021 / Revised: 4 July 2021 / Accepted: 9 July 2021 / Published: 15 July 2021
(This article belongs to the Special Issue Battery Systems and Energy Storage beyond 2020)

Abstract

:
Although a battery is a DC device, AC current is often necessary for testing, preheating, impedance spectroscopy, and advanced charging. This paper presents a versatile control technique to inject AC current to a battery. Synchronous buck and H-bridge topologies are operated in bidirectional mode and controlled by uni-polar and bi-polar pulse width modulation techniques for the AC current injection. The input and output passive circuits are specially designed considering AC current and the properties of the battery. A controller is proposed considering a small internal impedance, small AC ripple voltage, and variable DC offset voltage of a battery. The controller is capable of maintaining stable operation of AC current injection in two power quadrant within a small DC voltage boundary of a battery. The controller is comprised of a feedback compensator, a feedforward term, and an estimator. The feedback gain is designed considering the internal impedance. The feedforward gain is designed based on estimated open circuit battery voltage and input voltage. The open circuit voltage estimator is designed based on filters and battery model. For validation, AC current is injected to a Valence U-12XP battery. The battery is rated for 40 Ah nominal capacity and 13.8 V nominal voltage The controller successfully injected AC current to a battery with +10 A, 0 A and −10 A DC currents. The magnitude and frequency of the AC current was up to 5 A and 2 kHz respectively.

1. Introduction

Batteries are DC electrochemical energy storage devices which are mainly utilized as DC source or load in applications. However, AC current injection in a battery is necessary to preheat in cold weather, to measure the internal impedance, to balance the capacity based on impedance, and to charge by sinusoidal ripple current method [1,2,3,4]. Conventionally, AC current is injected to rechargeable batteries using linear circuits which work offline (the batteries are disconnected from the applications) [5,6]. Recently, power converters are being used to inject AC current to rechargeable batteries which can be operated either offline or online (the battery is connected to the applications) [1,2,3,4,7,8,9,10,11,12,13]. A buck converter topology was used to inject AC current on top of DC charging current in [9]. AC current was imposed on top of discharging current in [10]. The methods available in the existing literature for AC current injection using power converters can be operated either offline or online (either while charging or discharging). A versatile AC current control technique is proposed in this manuscript which can be operated in both offline and online conditions for a broad frequency spectrum.
The AC current injection using power converters for AC system (grid tied inverter) is an well established technology where the power flows unidirectionally and has a significant voltage variation corresponding to current [14,15]. The unidirectional power flow of a single phase inverter is depicted in Figure 1a. V o u t and I o u t are the output voltage and current. The arrow line depicts the steady state operating condition. The tilted arrow indicates the AC signal. Power converters can operate beyond the steady state for transient conditions which is depicted as control range by shaded area. Compared to AC systems, AC current injection to a DC system (rechargeable battery) using a power converter is a recent idea [16,17]. Power can flow bidirectionally in a rechargeable battery. The power flow of a conventional bidirectional converter is shown in Figure 1b, which can control DC current for a constant voltage. A controller for conventional bidirectional converter is not enough to inject AC current into a battery. This is because a battery has a small internal impedance and a variable DC voltage offset. A significant amount of AC current causes a small voltage ripple in a battery. The AC injector for rechargeable batteries should be able to control large current within a small voltage window as shown in Figure 1c. Therefore, AC current control for rechargeable batteries is more challenging than conventional bidirectional converters.
A versatile control technique to inject AC current into a rechargeable battery is presented in this manuscript which can inject AC current up to a magnitude of 5 A and a frequency of 2 kHz for a 40 Ah 13.8 V battery. The controller is capable of injecting AC current using two topologies: synchronous buck and H-bridge. In addition, the key contributions in this manuscript are listed as follows:
  • A versatile controller is proposed which can inject AC current to a battery for zero, positive, and negative DC current i.e., it works for both offline and online (while charging and discharging).
  • A controller gain selection method and controller architecture is developed for AC current injection considering small internal impedance and variable DC offset voltage of a battery.
  • A procedure is developed to select topology, modulation, and passive components for AC current injection.
The modes of AC current injection to a battery is discussed in Section 2. Power converter topologies, small signal analysis, and controller architecture are in Section 3, Section 4 and Section 5. Finally, results are presented in Section 6.

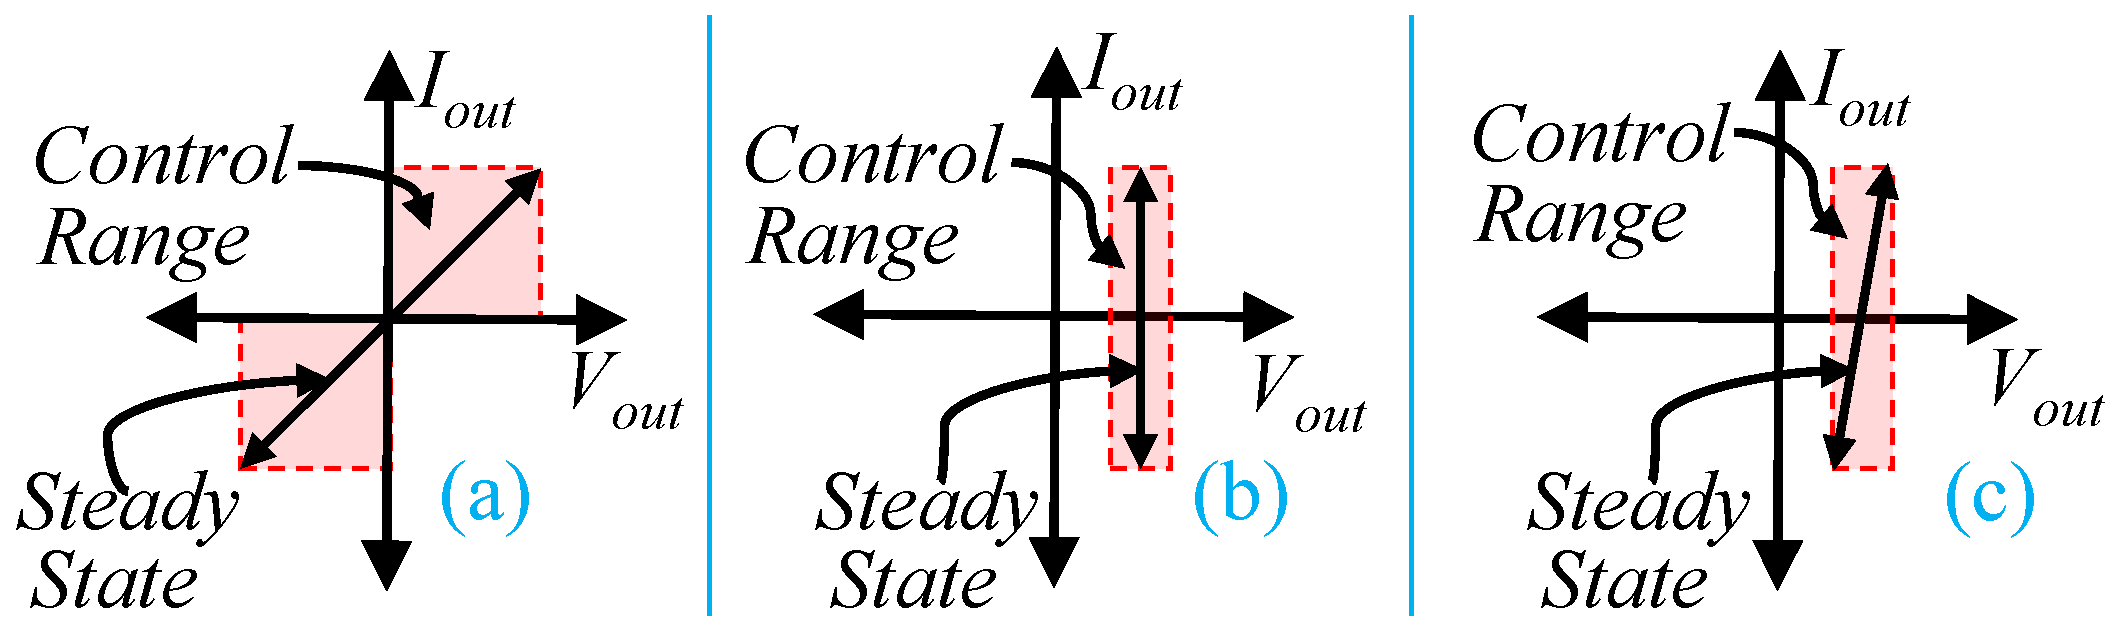
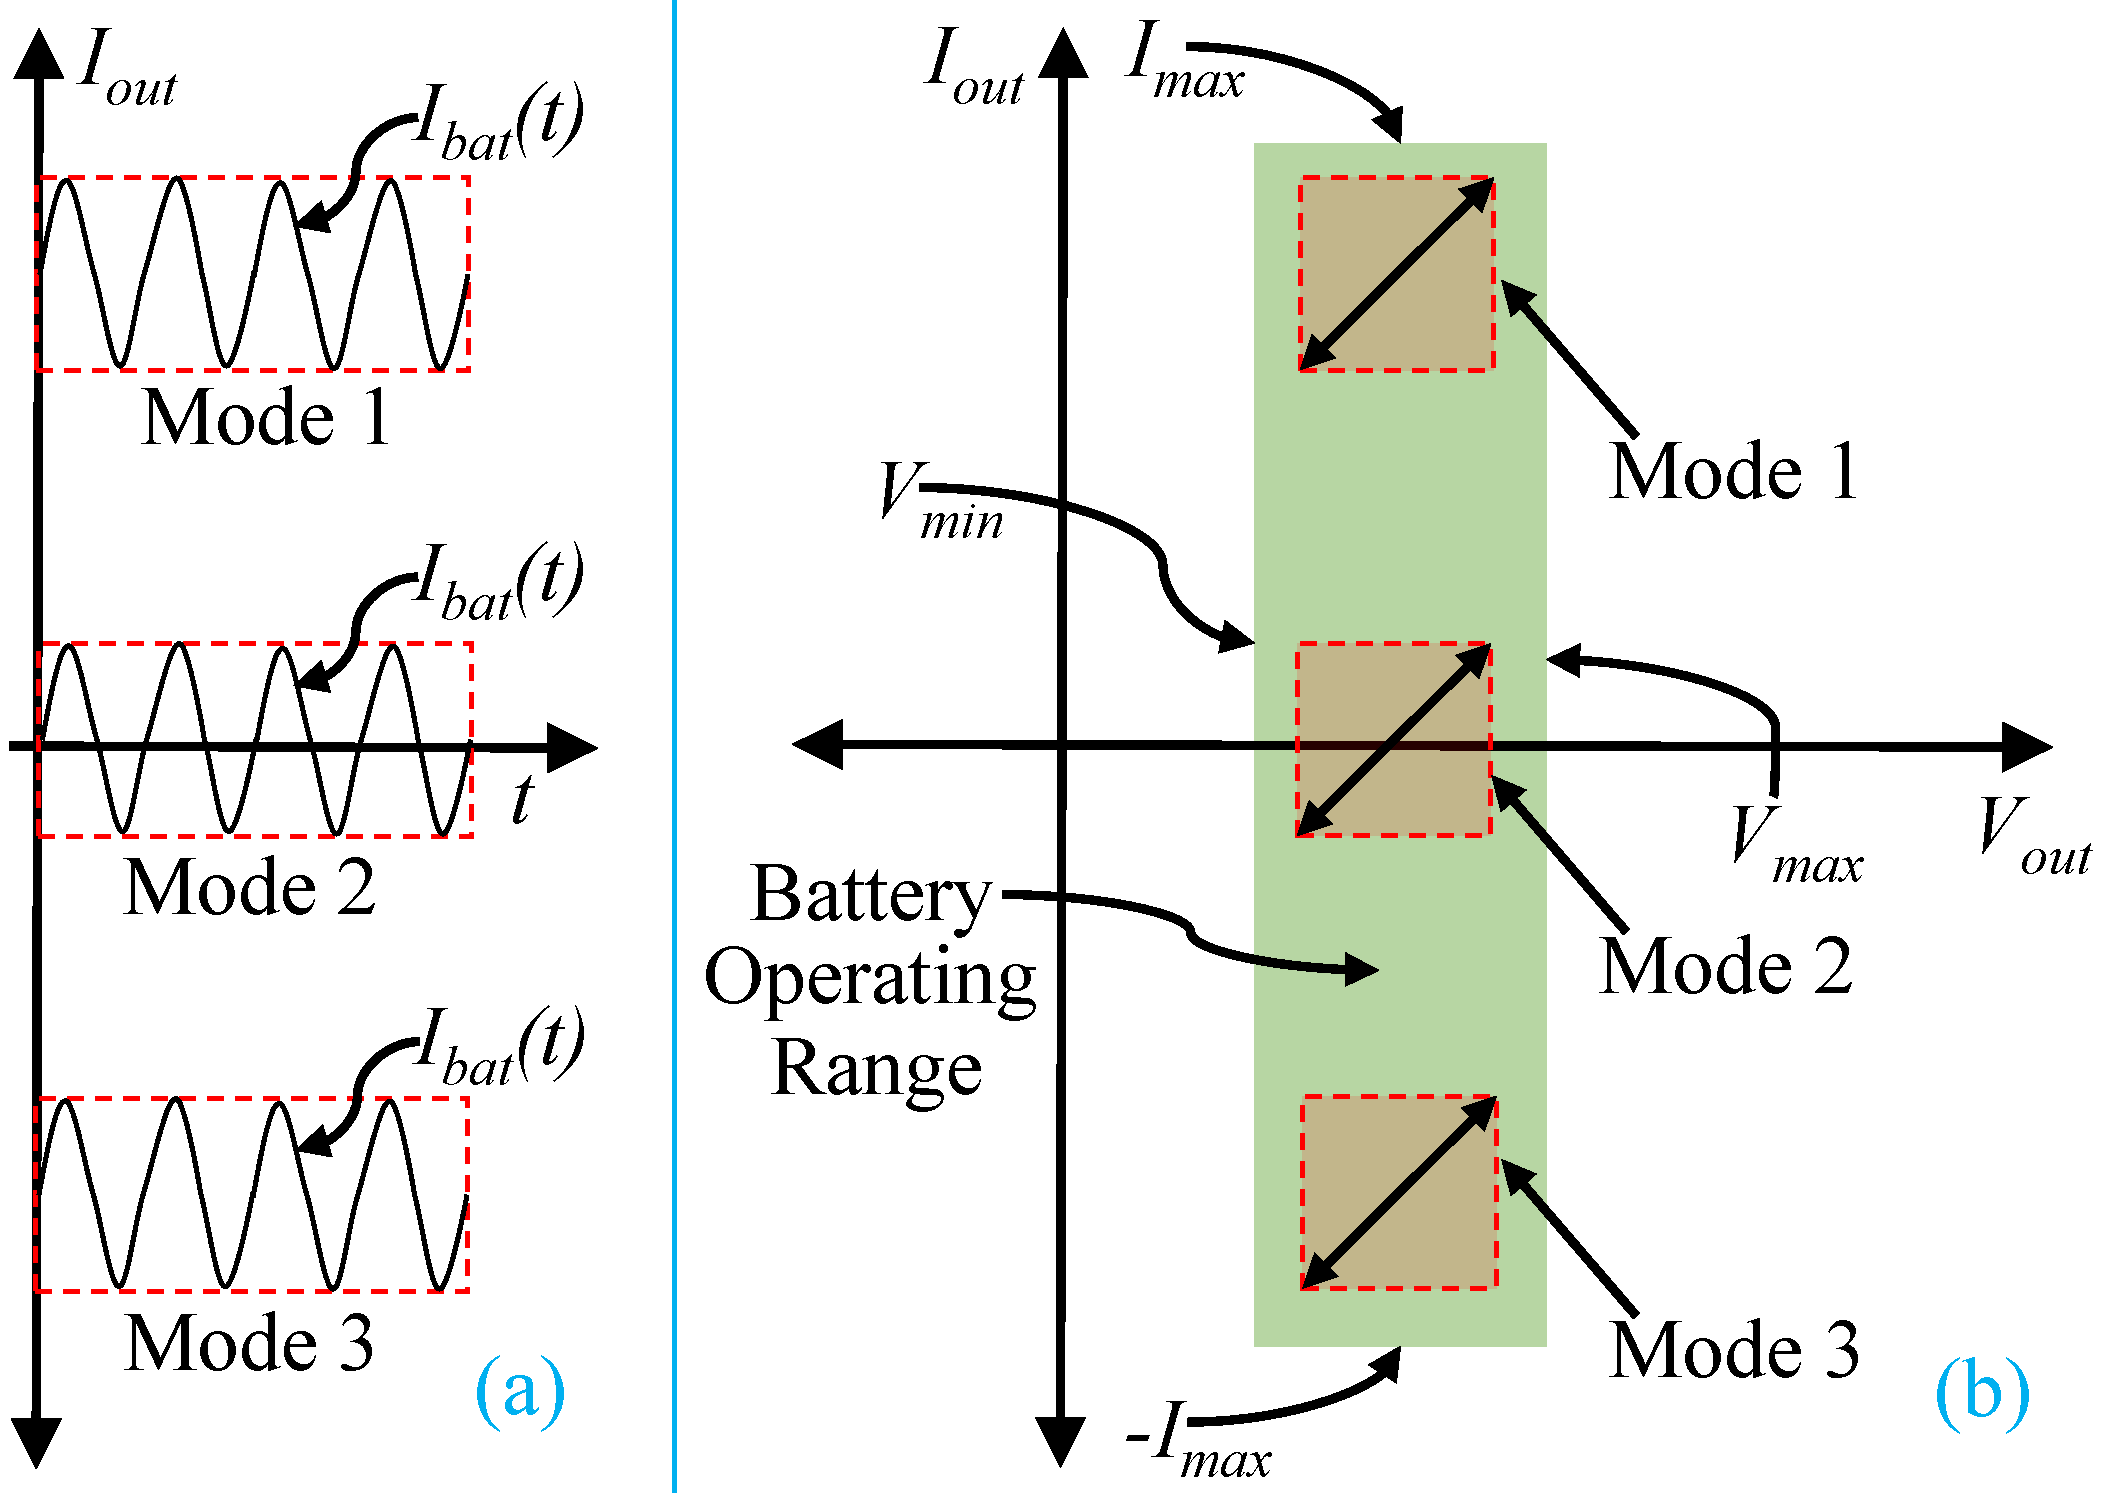
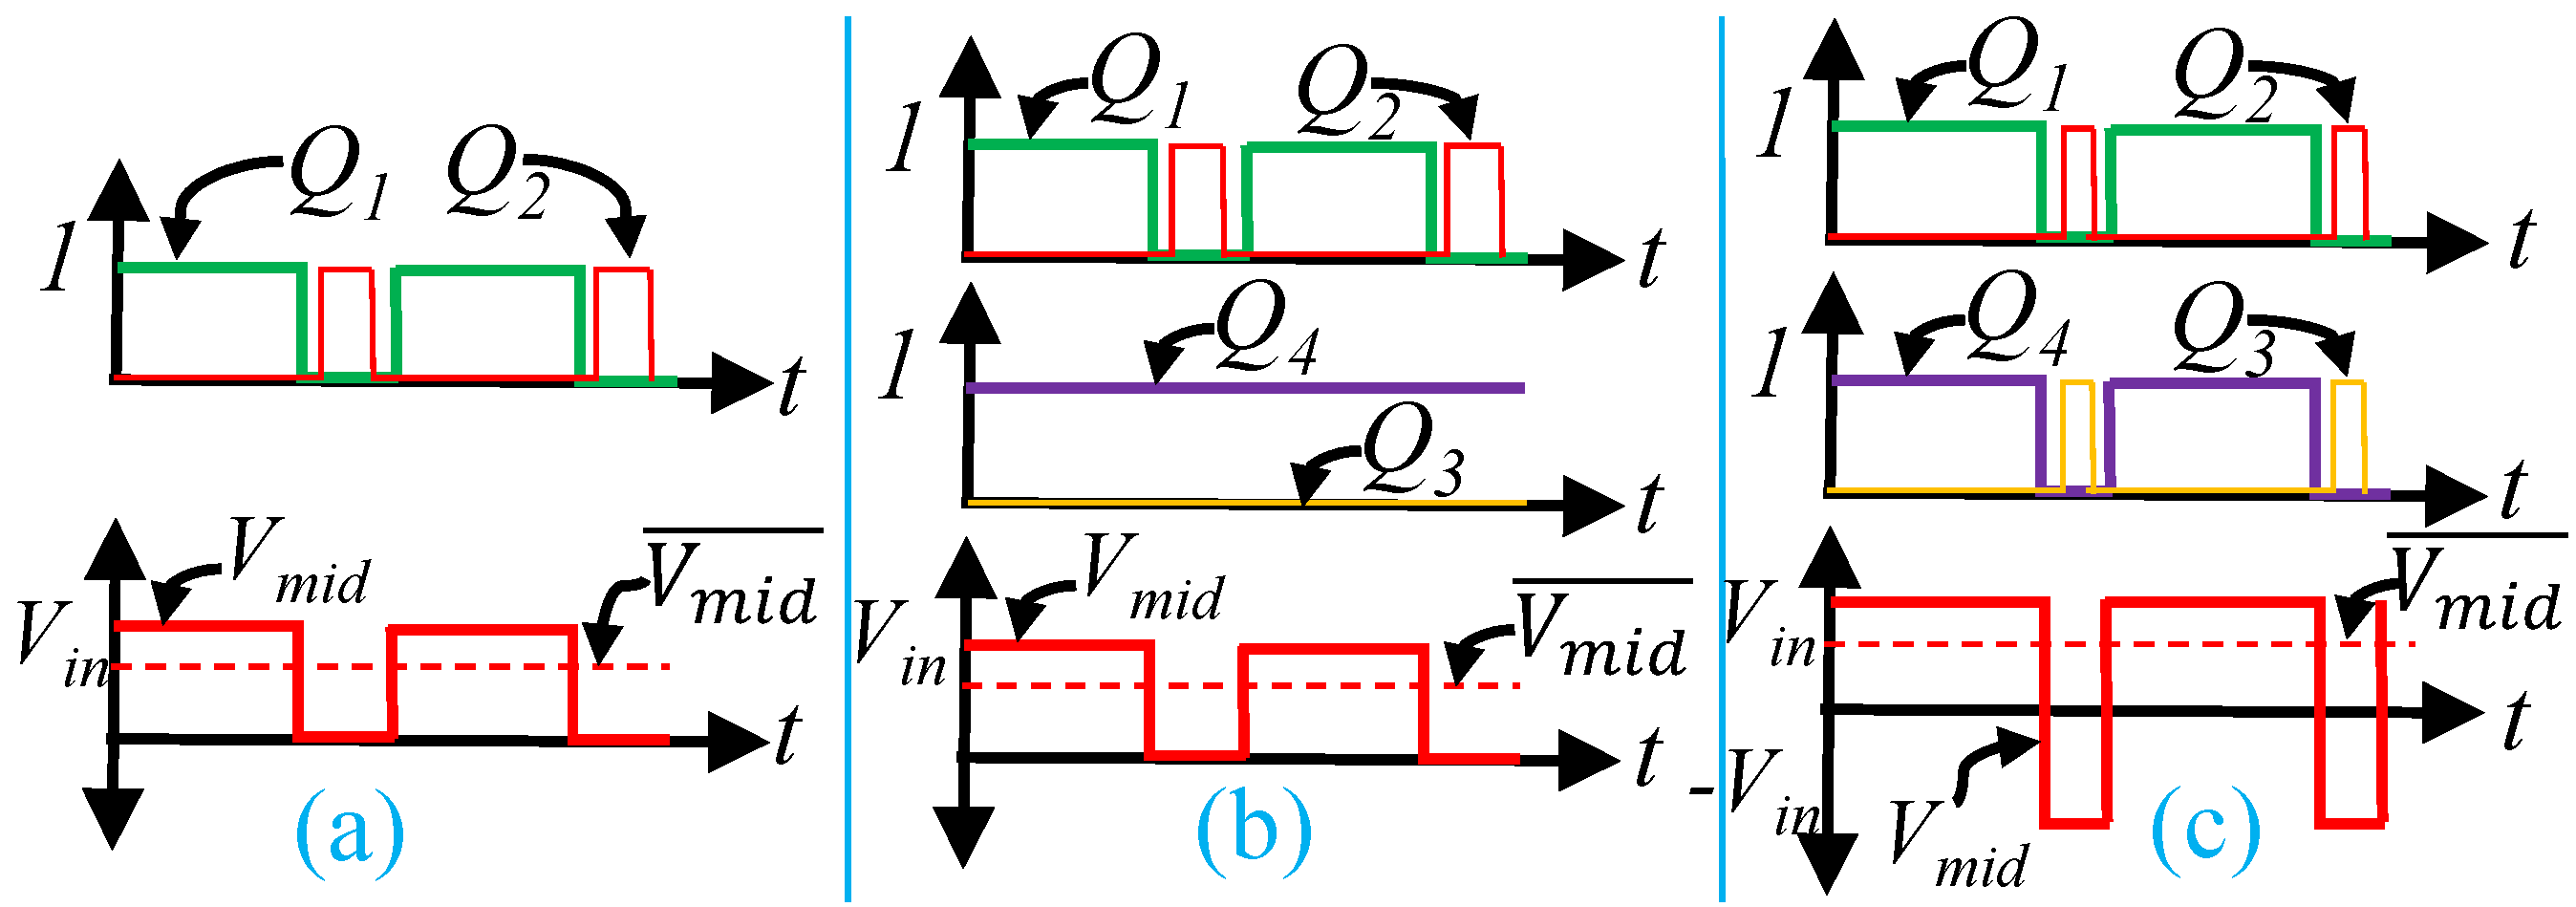
2. Operational Modes for AC Current Injection

AC current can be injected to a rechargeable battery on top of DC charging and discharging current. AC current can also be injected solely without DC current. The modes of AC current injection in a battery are expressed by (1).
I o u t ( t ) = I b a t ( t ) = I d c + I m s i n ( ω t ) , if Mode 1 0 + I m s i n ( ω t ) , if Mode 2 I d c + I m s i n ( ω t ) , if Mode 3
where, t is the time, I b a t is the battery current, I d c is the DC offset current, I m is the magnitude of AC signal, and ω is the angular frequency for AC signal. I d c is positive for mode 1 where AC current is injected to the battery while charging. I d c is negative for discharging condition. I d c is zero for offline AC injection. The waveforms of each mode of AC current injection are shown in Figure 2a. The existing methods available in the literature for AC current injection using power converters can operate in only one mode at a time. All three modes can be operated using proposed controller which is unique in this manuscript.
The voltage vs. current of a battery during different modes of operation shown in Figure 2b. The power converters output is bounded by the rated operating range of the battery (shaded in area in Figure 2b). The rated maximum and minimum operating voltage of a battery is V m a x and V m i n . The rated currents are I m a x and I m i n . The control range for different modes are also shaded and has dashed boundary line. The steady state operating conditions are within the control range and shown as tilted arrow lines. The tilted arrow indicates AC voltage and current for different modes. The magnitude of AC current in Figure 2b is corresponding to the magnitude of of current in Figure 2a. To perform all modes of operation, the power converter should be capable of operating within the right half plane of the power quadrant (two quadrant as in Figure 2b).

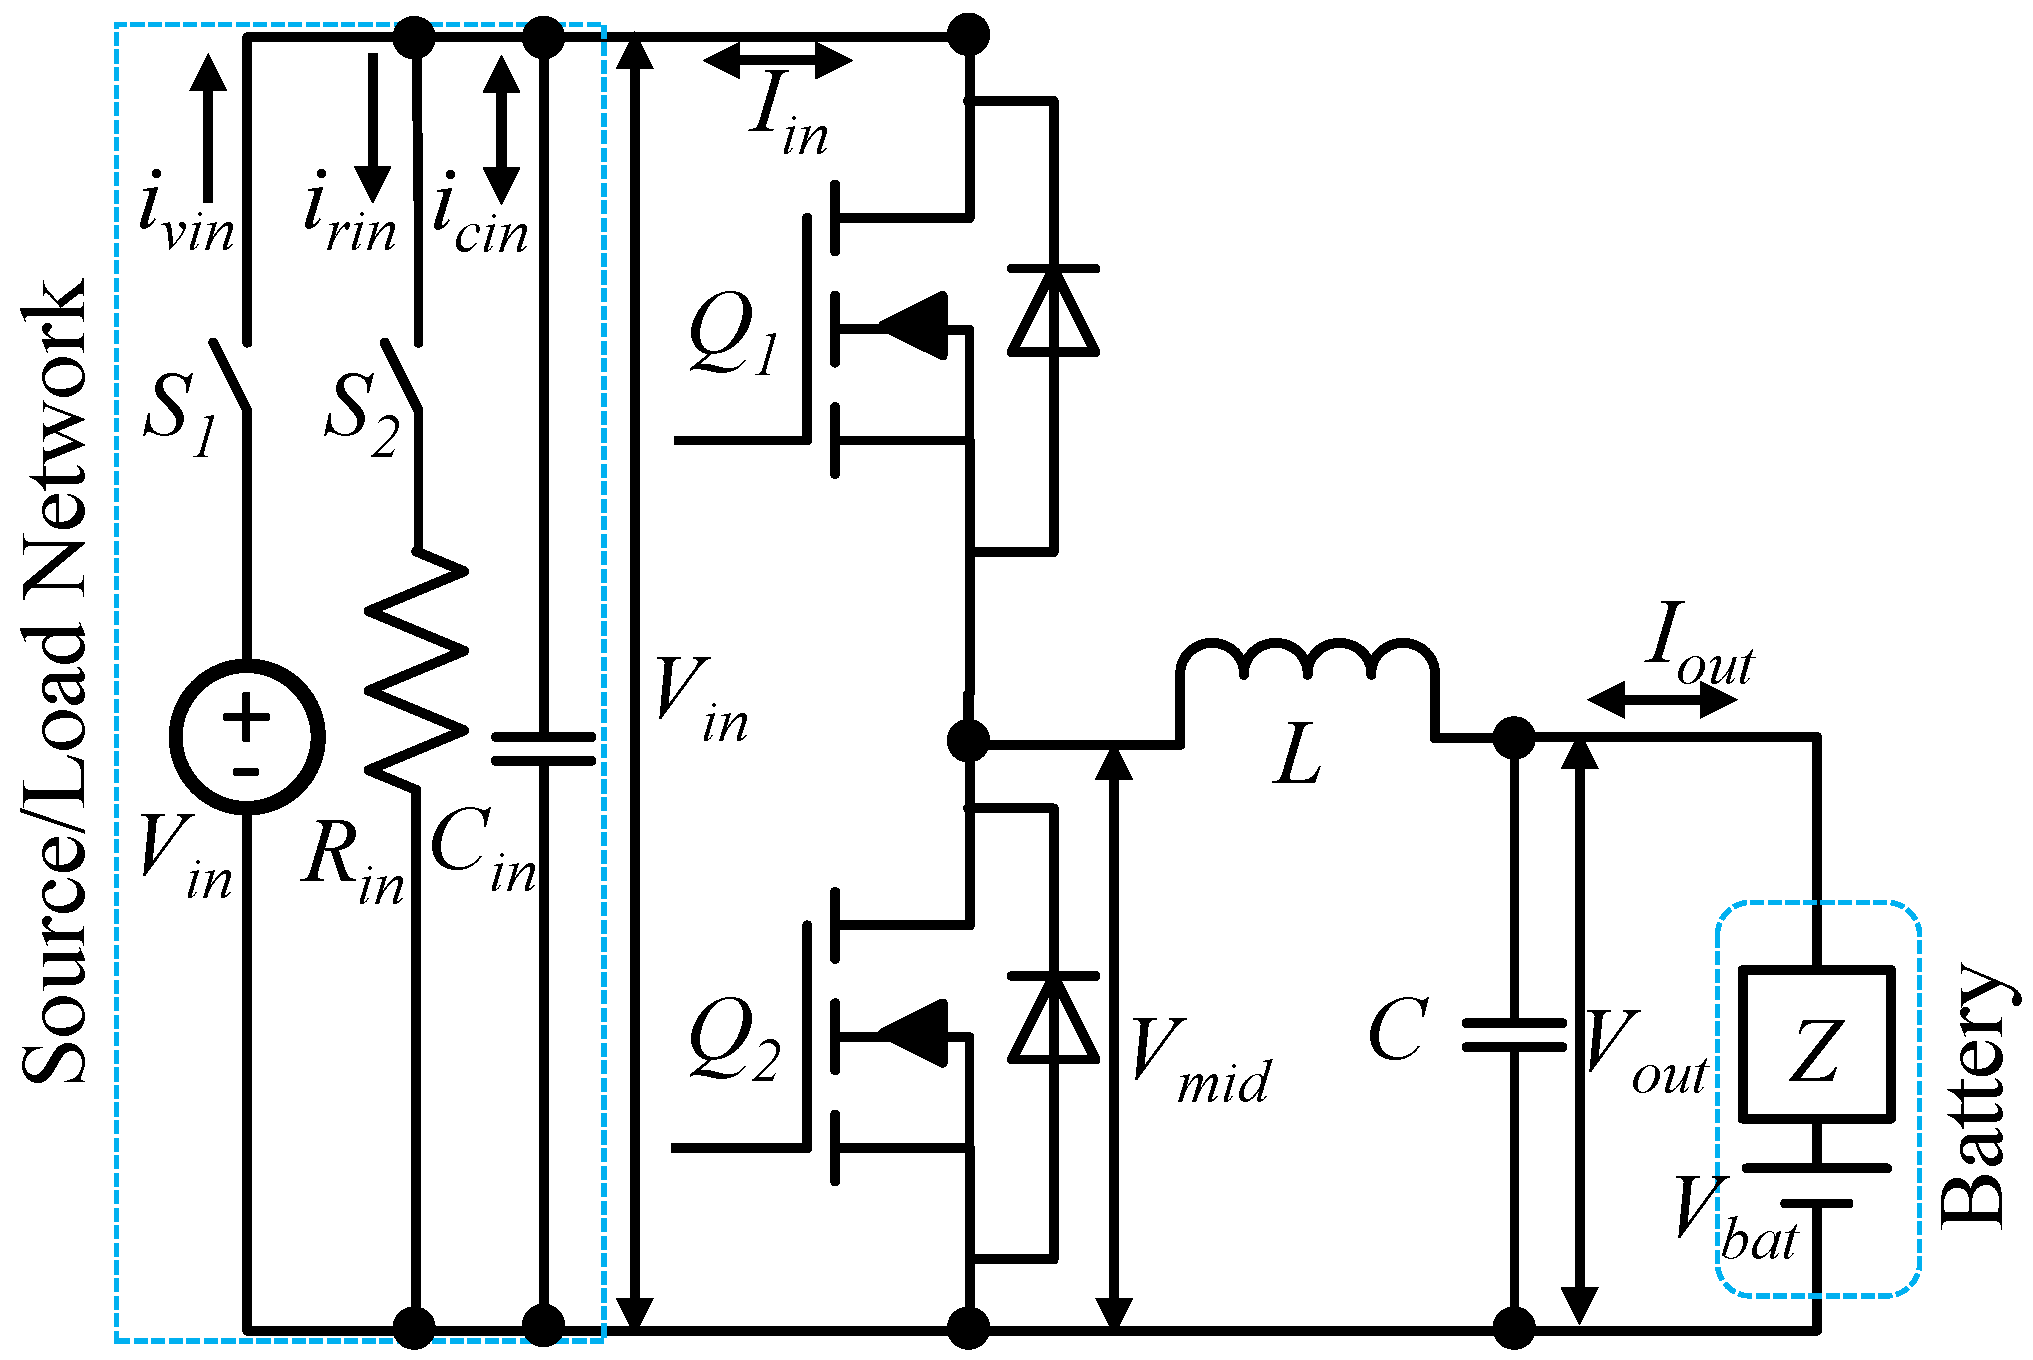
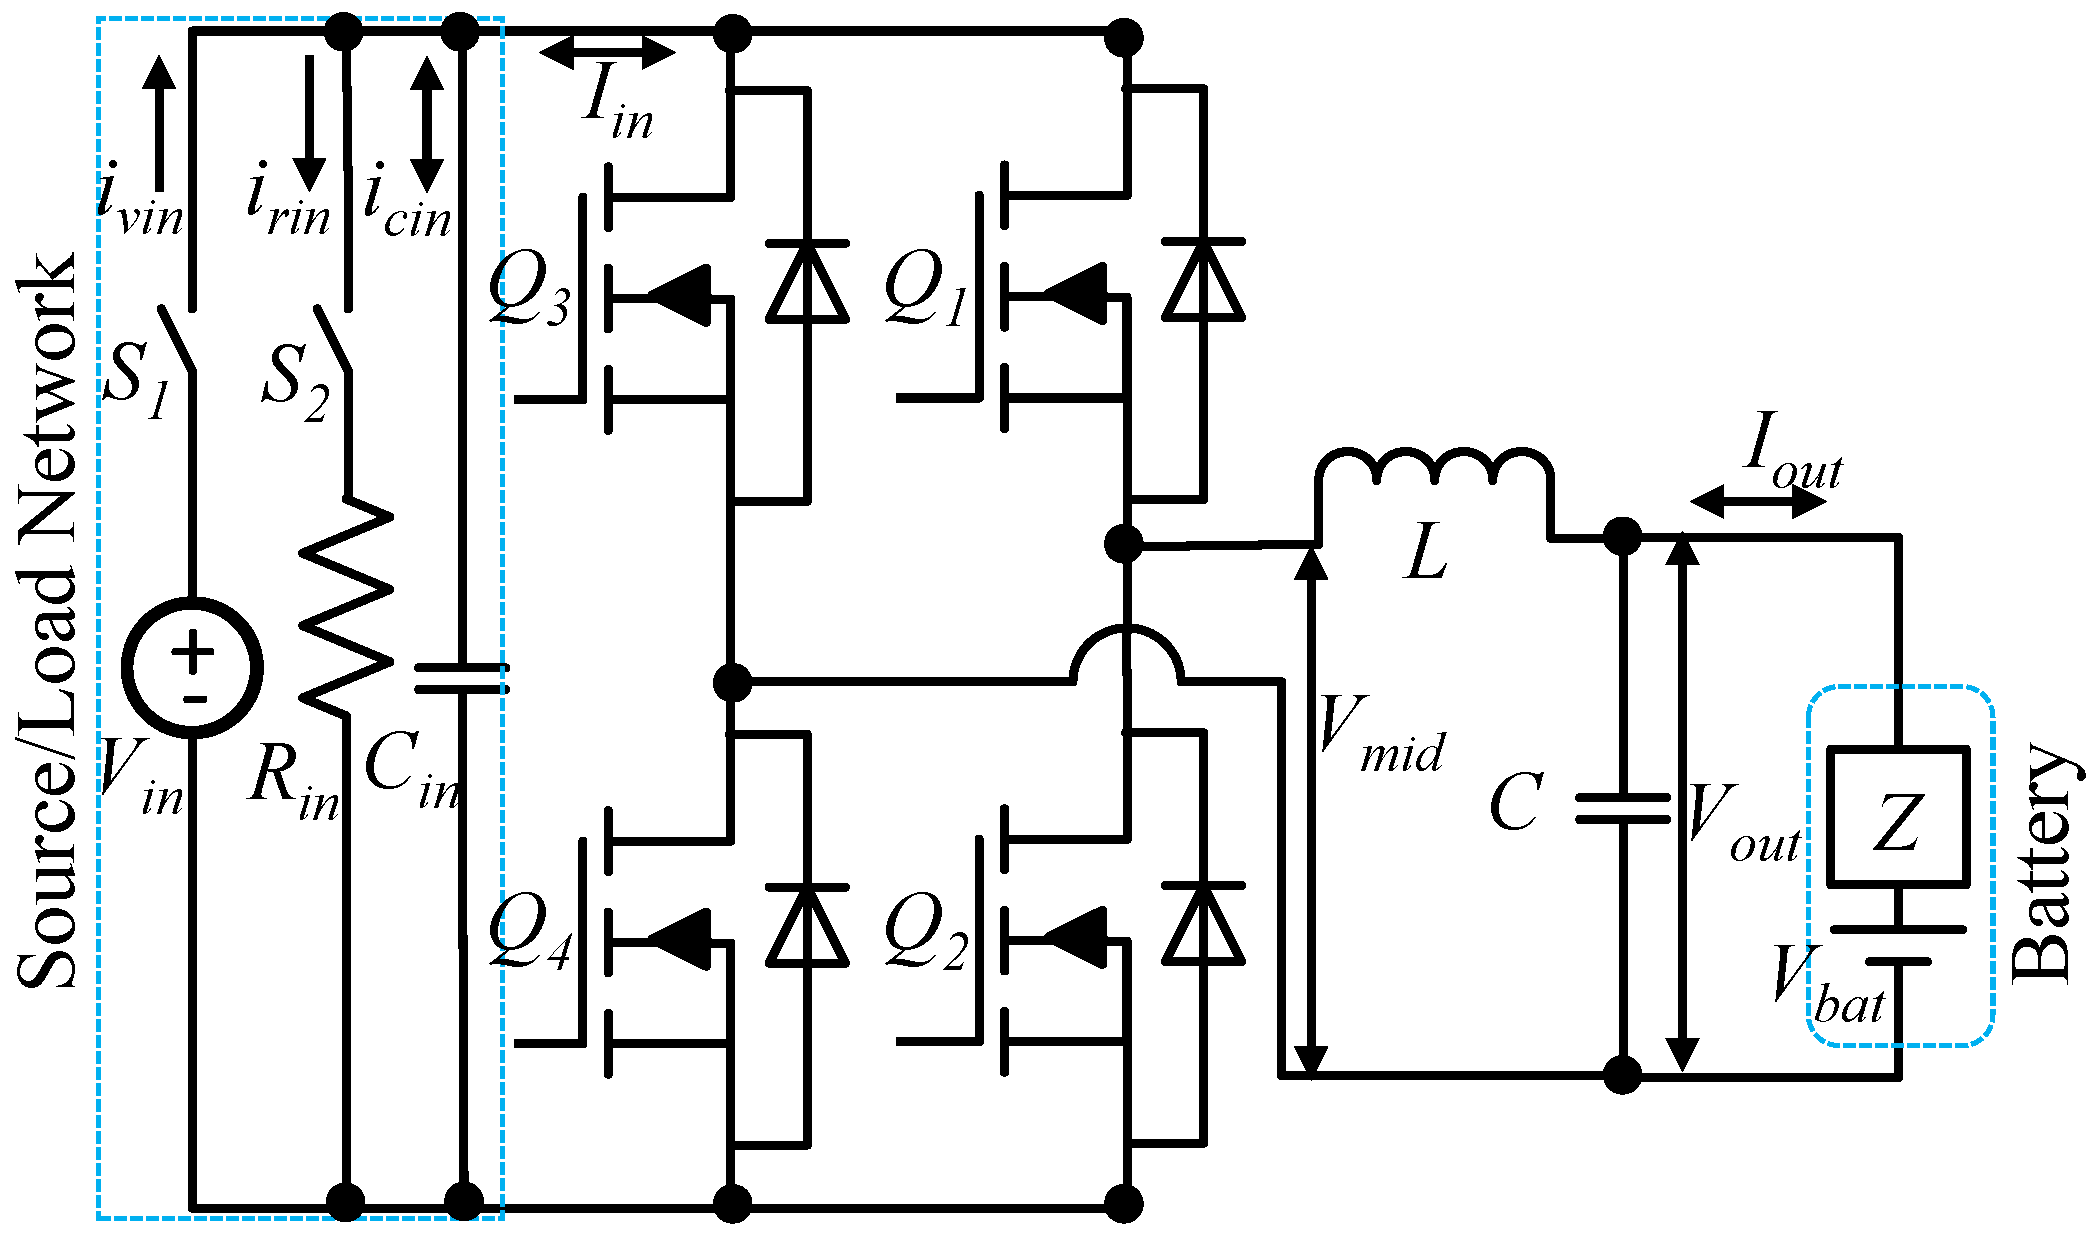
3. Topologies and Modulation

An AC current injector for batteries was implemented using buck, synchronous buck, boost, and resonant power converters [1,2,3,4,7,8,9,10]. A synchronous buck converter for AC current injection to battery was used in this paper as shown in Figure 3. In addition, a technique is proposed to use H-bridge topology to inject AC current as shown in Figure 4. Q 1 , Q 2 , Q 3 and Q 4 are SiC MOSFETs with anti-parallel diodes. An input network was used to deploy three modes of operation for the versatile control which consists of a DC voltage source V i n , a resistor R i n , and a capacitor C i n . I i n is input current which could have three parts i v i n , i r i n , and i c i n . S 1 and S 2 are used to control the network as source and/or load which determines online charging/discharging mode or offline mode of operation for AC current injection. The AC injection modes and corresponding possible switch states are in Table 1.

3.1. Design

V i n depends on the available input power source. For the buck mode of operation, V i n must be greater than open circuit battery voltage, V b a t . For maximum control flexibility, the duty cycle is 50 % and V i n can be selected based on (2).
V i n = 2 V b a t _ n
where, V b a t _ n is the nominal battery voltage from datasheet.
R i n depends on the value of DC load current in mode 3. For maximum control flexibility, R i n can be selected by (3).
R i n = V i n i r i n = V i n I i n _ d c = 2 V b a t _ n I d c / 2 = 4 V b a t _ n I d c
The input capacitor should be capable to store the charge and energy for half cycle of the injected AC current and discharge in rest of the half cycle. The value of C i n is determined based on the allowable input ripple voltage Δ v c i n and the magnitude, I m , and frequency, ω , of AC current. The charge storage, sinusoidal ripple current, and ripple voltage across input capacitor is depicted in Figure 5. C i n is used to bypass most of the AC current. Therefore, AC current through R i n and V i n should be negligible. Input capacitor current, i c i n , can be represented by (4).
i c i n I m s i n ( ω t )
The voltage and the charge of the input capacitor is determined based on the initial conditions and AC current. The charge of the input capacitor, q c i n , can be presented by (5).
q c i n = q i n + i c i n d t
where, q i n is the steady state stored charge in capacitor. The designed nominal input voltage, V i n can be considered is initial condition for capacitor voltage, v c i n . Therefore, v c i n can be represented by (6).
v c i n = V i n + Δ v c i n s i n ( ω t + π / 2 )
By the definition of capacitance, the relationship between voltage and charge can be presented by (7).
i c i n = d q c i n d t = C i n d v c i n d t
Equation (7) can be rewritten as (8) by linearization. The linearization is shown in Figure 5.
Δ q c i n Δ t = C i n Δ v c i n Δ t
For 1/4th of the period, Δ q c i n is determined by (9).
Δ q c i n Δ t = 0 T / 4 i c i n d t T / 4 = 0 T / 4 I m s i n ( ω t ) d t T / 4 = I m 8 π
where, T is period. Therefore, (8) can be represented by (10).
C i n Δ v c i n T / 4 = I m 8 π
Rearranging (10), C i n can be calculated from (11).
C i n = I m T 32 π Δ v c i n = I m 32 π f Δ v c i n = I m 16 ω Δ v c i n
where, f is the frequency of the AC current and ω = 2 π f .
The output inductor, L, is selected based on the standard design as in (12) [18].
L = V o u t × ( V i n V o u t ) Δ I L × f S W × V i n
where, Δ I L is the allowable inductor switching ripple current, and f S W is the pulse width modulation switching frequency. Switching ripple current, Δ I L , is different than controlled AC injection current. The frequency of Δ I L , is much higher than AC injection current and the magnitude should be almost negligible. A larger inductor gives better attenuation to switching ripple current. However, it reduces the control bandwidth. Considering (2) and control bandwidth, the design guideline for L can be presented in (13).
L = V b a t _ n × ( 2 V b a t _ n V b a t _ n ) Δ I L × f S W × 2 V b a t _ n = V b a t _ n 2 × Δ I L × f S W
The output capacitor, C, reduces the switching ripple voltage. C can be selected by the standard design as in (14) [18].
C = Δ I L 8 × f S W × Δ V o u t
A higher value of C provides lower switching ripple. However, the battery itself has very high capacitance. Therefore, a smaller value of C can be used.
The passive components for the topologies are calculated using (2), (3), (11), (13), and (14) considering V b a t _ n = 13.8 V, I m = 5 A, and f = 20 Hz, f S W = 100 kHz, Δ V o u t = 7.5 mV, and Δ I L is 5 % i of I m . Available standard components are selected for experiments. The calculated and selected value of components are in Table 2.

3.2. Modulation

The midpoint voltage, V m i d , is the voltage across L and C shown in Figure 3 and Figure 4. V m i d determines the direction and magnitude of output current I o u t . V m i d is controlled by pulse width modultion (PWM) of the gate driver signal. The output voltage, V o u t , depends on internal impedance, Z, output current, I o u t and open circuit battery voltage, V b a t as in (15).
V o u t = V b a t + I o u t Z
The PWM signals to drive the MOSFETs are shown in Figure 6. The gating signal and midpoint voltage for synchronous buck converter is in Figure 6a. Q 1 and Q 2 are complementary. Deadtime is considered between on states of Q 1 and Q 2 . The estimated average midpoint voltage is expressed by (16).
V m i d ¯ d V i n V o u t ¯
where, d is the duty cycle. The effect of synchronous operation and deadtime are excluded from calculation in (16).
The unipolar PWM signal for H-bridge topology is shown in Figure 6b. V o u t is always positive. Therefore, Q 3 is always off and Q 4 is always on for unipolar switching. Q 1 and Q 2 are complementary with deadtime. The estimated average voltage for unipolar switching is approximately the same as the synchronous buck converter in (16).
V m i d ¯ d u n i V i n V o u t ¯
where, d u n i is the duty cycle of Q 1 for unipolar PWM. The relationship between d u n i and d is represented by (18).
d u n i = d
The bipolar PWM signal for the H-bridge is in Figure 6c. The estimated average midpoint voltage for bipolar PWM is expressed by (19).
V m i d ¯ d b i V i n ( 1 d b i ) V i n V o u t ¯
where, d b i is the duty cycle of Q 1 for bipolar switching. 1 d b i is applied to Q 3 . Q 1 and Q 2 are complementary with deadtime. Q 3 and Q 4 are also complementary. d b i V i n represents positive parts of V m i d and ( 1 d b i ) V i n represents the negative part. V o u t is always positive, therefore d b i V i n is always significantly higher than ( 1 d b i ) V i n . The relationship between d b i and d is represented by (20)–(22).
d = d b i ( 1 d b i )
d b i = 1 2 + d 2
1 d b i = 1 2 d 2
PWM techniques are selected based on the topologies used to inject AC current injection. Regardless of the topology chosen, V m i d is controlled by the duty cycle, d. d is converted to d u n i and d b i for the H-bridge using unipolar and bi-polar switching. For both topologies anti-parallel diode ensures the reverse current flow i.e., discharging condition of the battery.

4. Small Signal Analysis

The output current of synchronous buck and H-bridge converters can be analyzed by a simplified average mode small signal model and transfer functions.

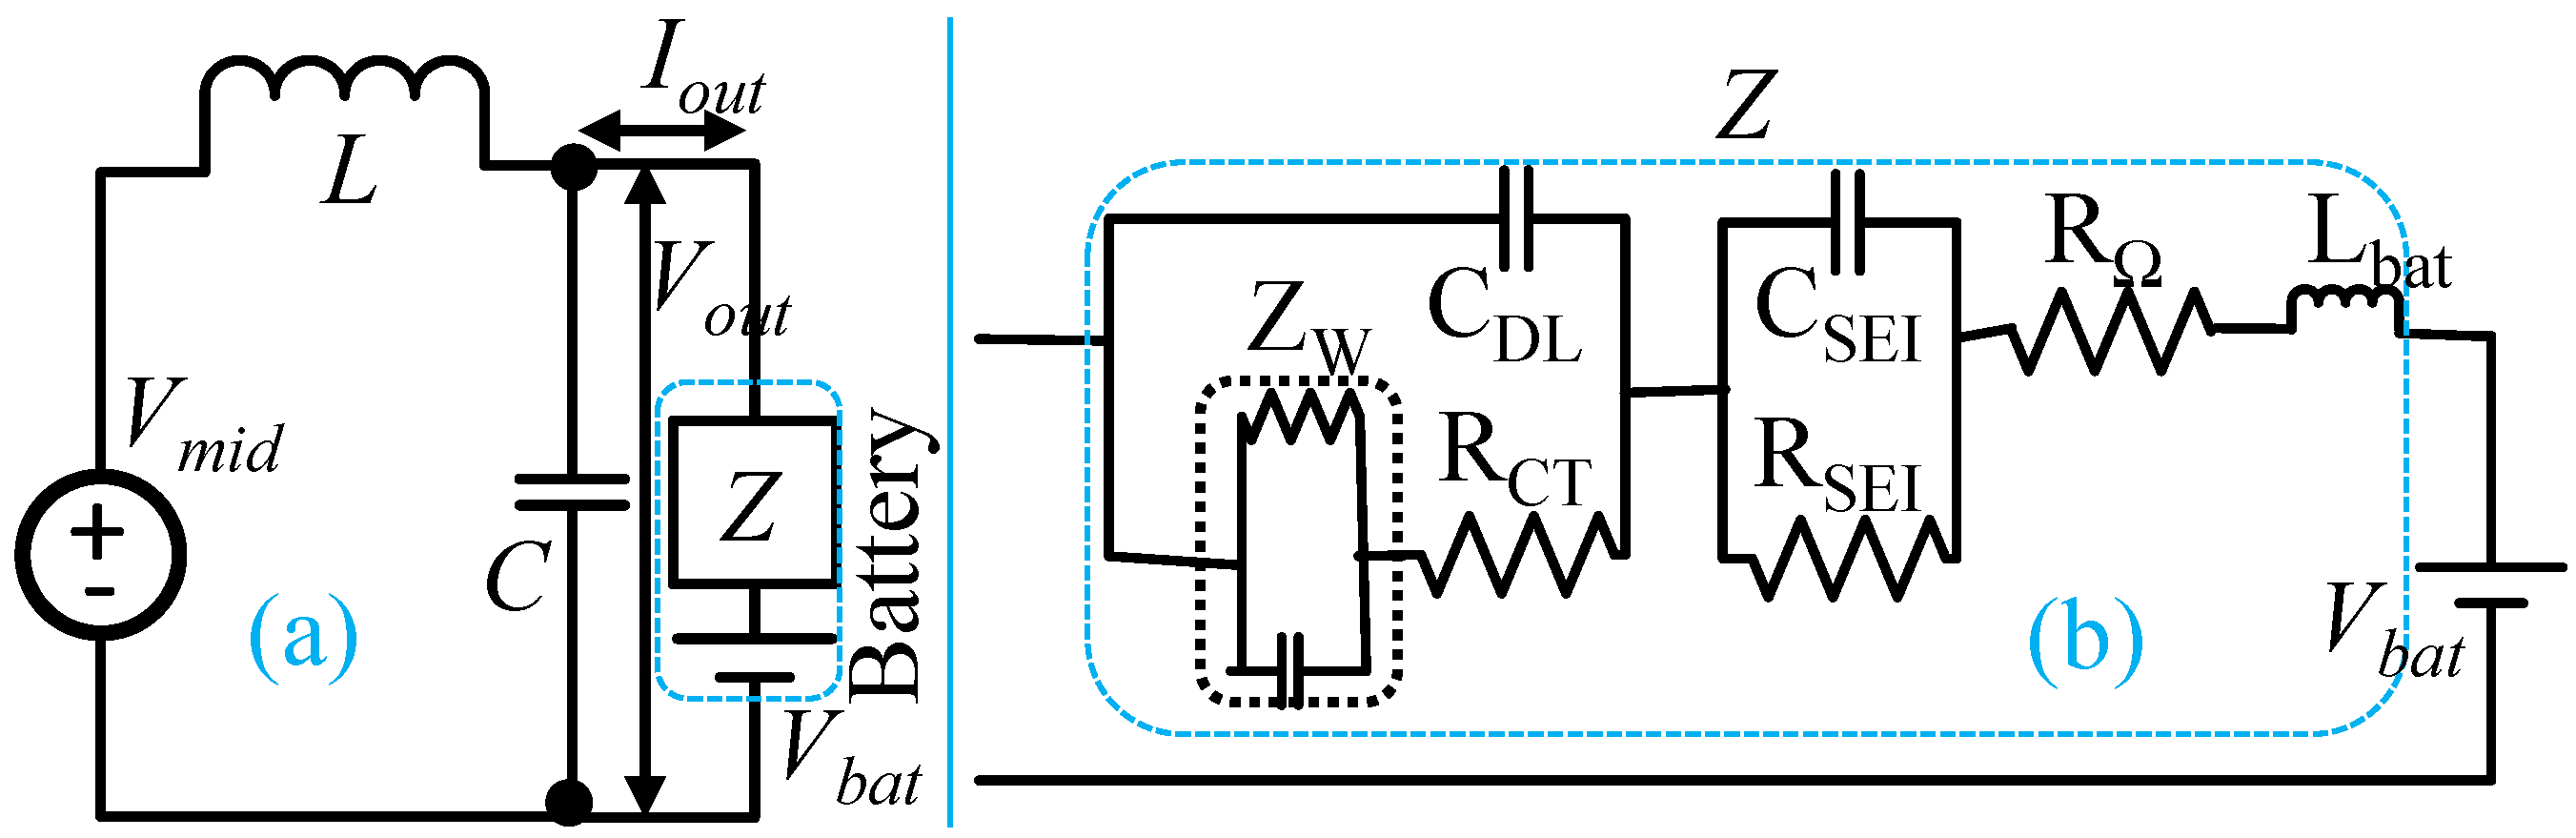
4.1. Simplified Model and Feedforward

Both synchronous buck and H-bridge converters can be represented by a simplified form as shown in Figure 7a. Modulation techniques are used to get the desired value of the midpoint voltage, V m i d . The direction of average output current, I o u t ¯ , depends on value of V m i d ¯ and V b a t ¯ . I o u t ¯ ( t ) determines the mode of operation for the controller. In the steady state equilibrium condition, I o u t ¯ =0 and V m i d ¯ = V o u t = V b a t . A feedforward duty can maintain the power converters in equilibrium. The feedforward duty, d f f , in averaged control mode can be expressed by (23) and (24).
V m i d ¯ = V i n d f f = V b a t
d f f = V b a t V i n

4.2. Transfer Function of Switching Power Pole
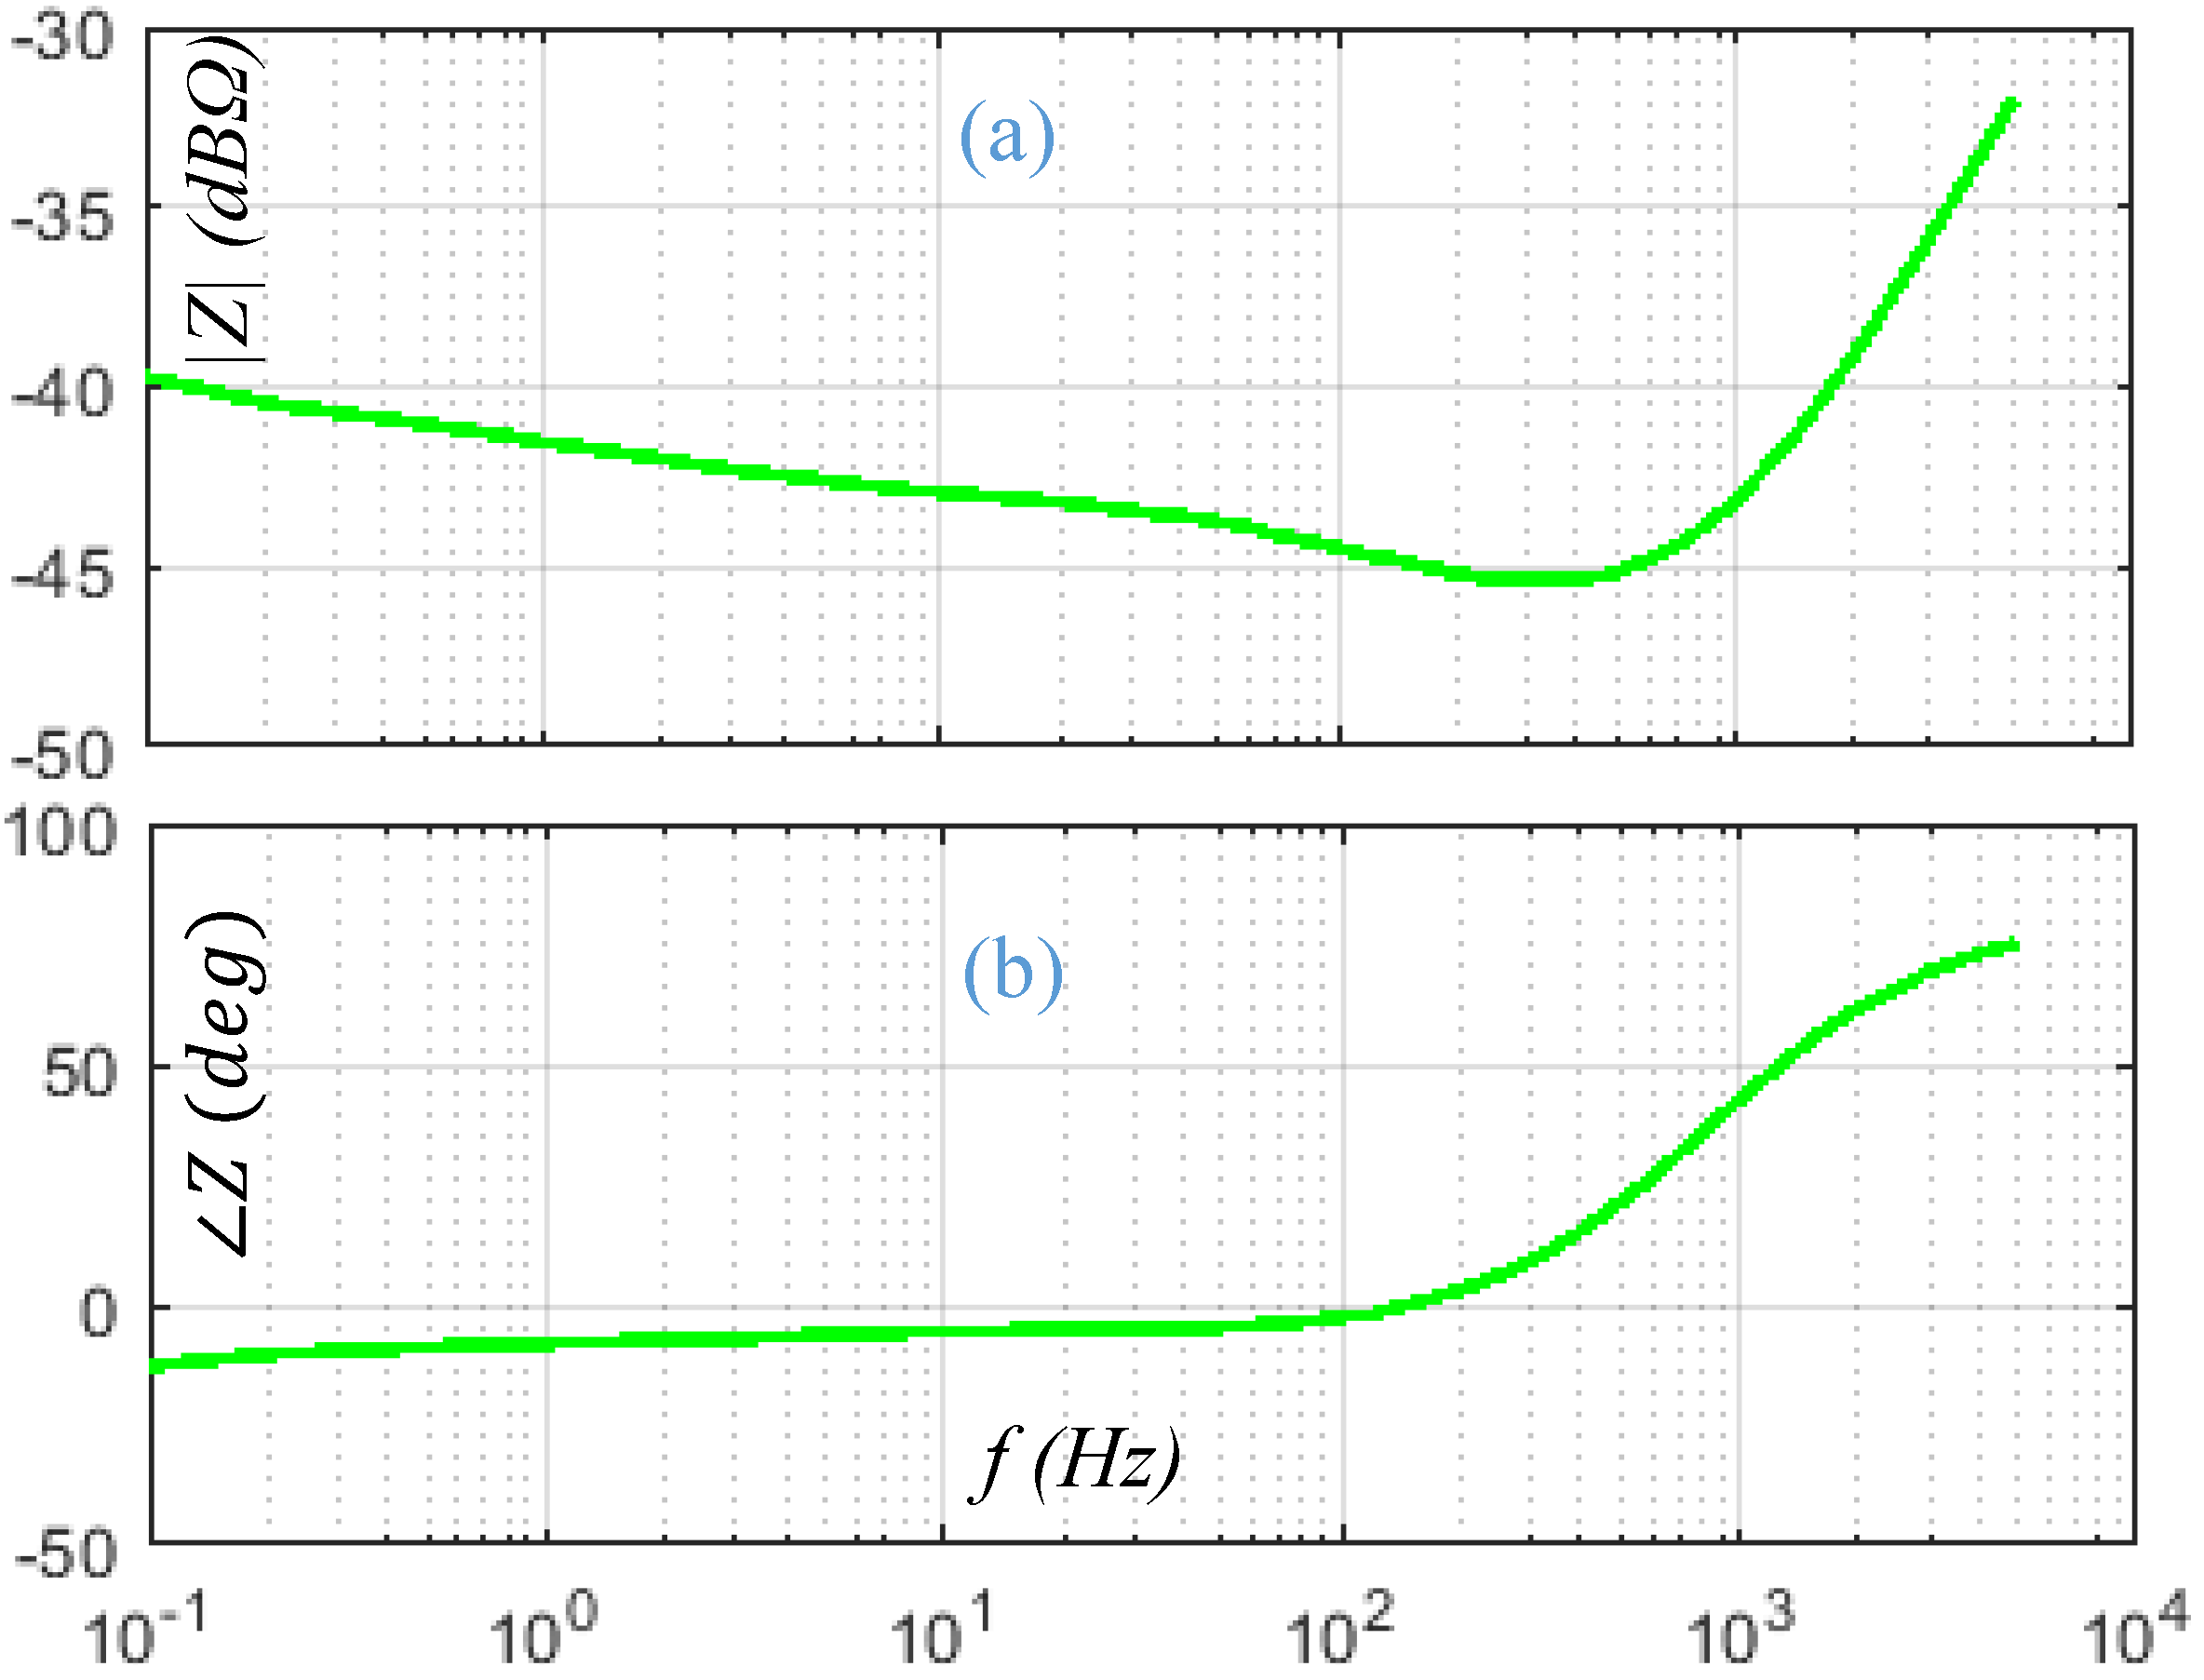
The average midpoint voltage for a PWM cycle at any instant can be expressed by (25).
V m i d ¯ ( t ) = V i n d ¯ ( t )
where, d ¯ is average duty for that cycle and the value of d ¯ is updated for every cycle based on control requirement. A small perturbation to steady state duty causes perturbation to average midpoint voltage. The small perturbations can be expressed by (26) and (27).
d ¯ ( t ) = d f f ( t ) + d ˜ ( t )
V m i d ¯ ( t ) = V i n d f f ( t ) + V m i d ¯ ˜ ( t )
Considering the average mode control perturbation and steady input voltage, frequency domain interpretation of the midpoint voltage can be expressed by (28).
V m i d ¯ ( s ) = V i n d ( s )
where, s = j ω , and ω is angular frequency.

4.3. Battery Model

A Li-Ion battery has a small AC voltage ripple for large AC current ripple due to small internal impedance. The adaptive Randle equivalent circuit model (AR-ECM) of a Li-Ion battery can explain the internal impedance. AR-ECM is shown in Figure 7b. It consists of an open circuit voltage source, V b a t , battery inductance, L b a t , Ohmic resistance, R Ω , charge transfer resistance, R C T , double layer capacitance, C D L , Warburg impedance, Z W , solid electrolytic interface resistance, R S E I , and capacitance, C S E I . The overall internal battery impedance in frequency domain, Z ( s ) is expressed by (29) [19].
Z ( s ) = s L b a t + R Ω + 1 1 R S E I + s C S E I + 1 1 R C T + σ 2 s + s C D L
where, σ is Warburg coefficient, and Warburg impedance Z W = σ 2 / s . Z ( s ) is taken into account for versatile current controller design.
For a Valence U-12XP 40 Ah 13.8 V Li-Ion battery, the model components are L = 0.34   μ H, R Ω = 5.65 m Ω , C D L = 4.29 F, R C T = 1.23 m Ω and σ = 2.05 × 10 3 at 25% state of charge [9]. The bode plot of the battery impedance is shown in Figure 8. The magnitude is calculated by 20 l o g 10 ( | Z | / R b a s e ) , where R b a s e is 1 Ω . The magnitude of impedance is 40 dB Ω i.e., a small voltage perturbation will cause large current perturbation. The phase plot indicates that at low frequency perturbation the battery behaves in capacitive manner. However, at high frequency the inductive part becomes dominant.

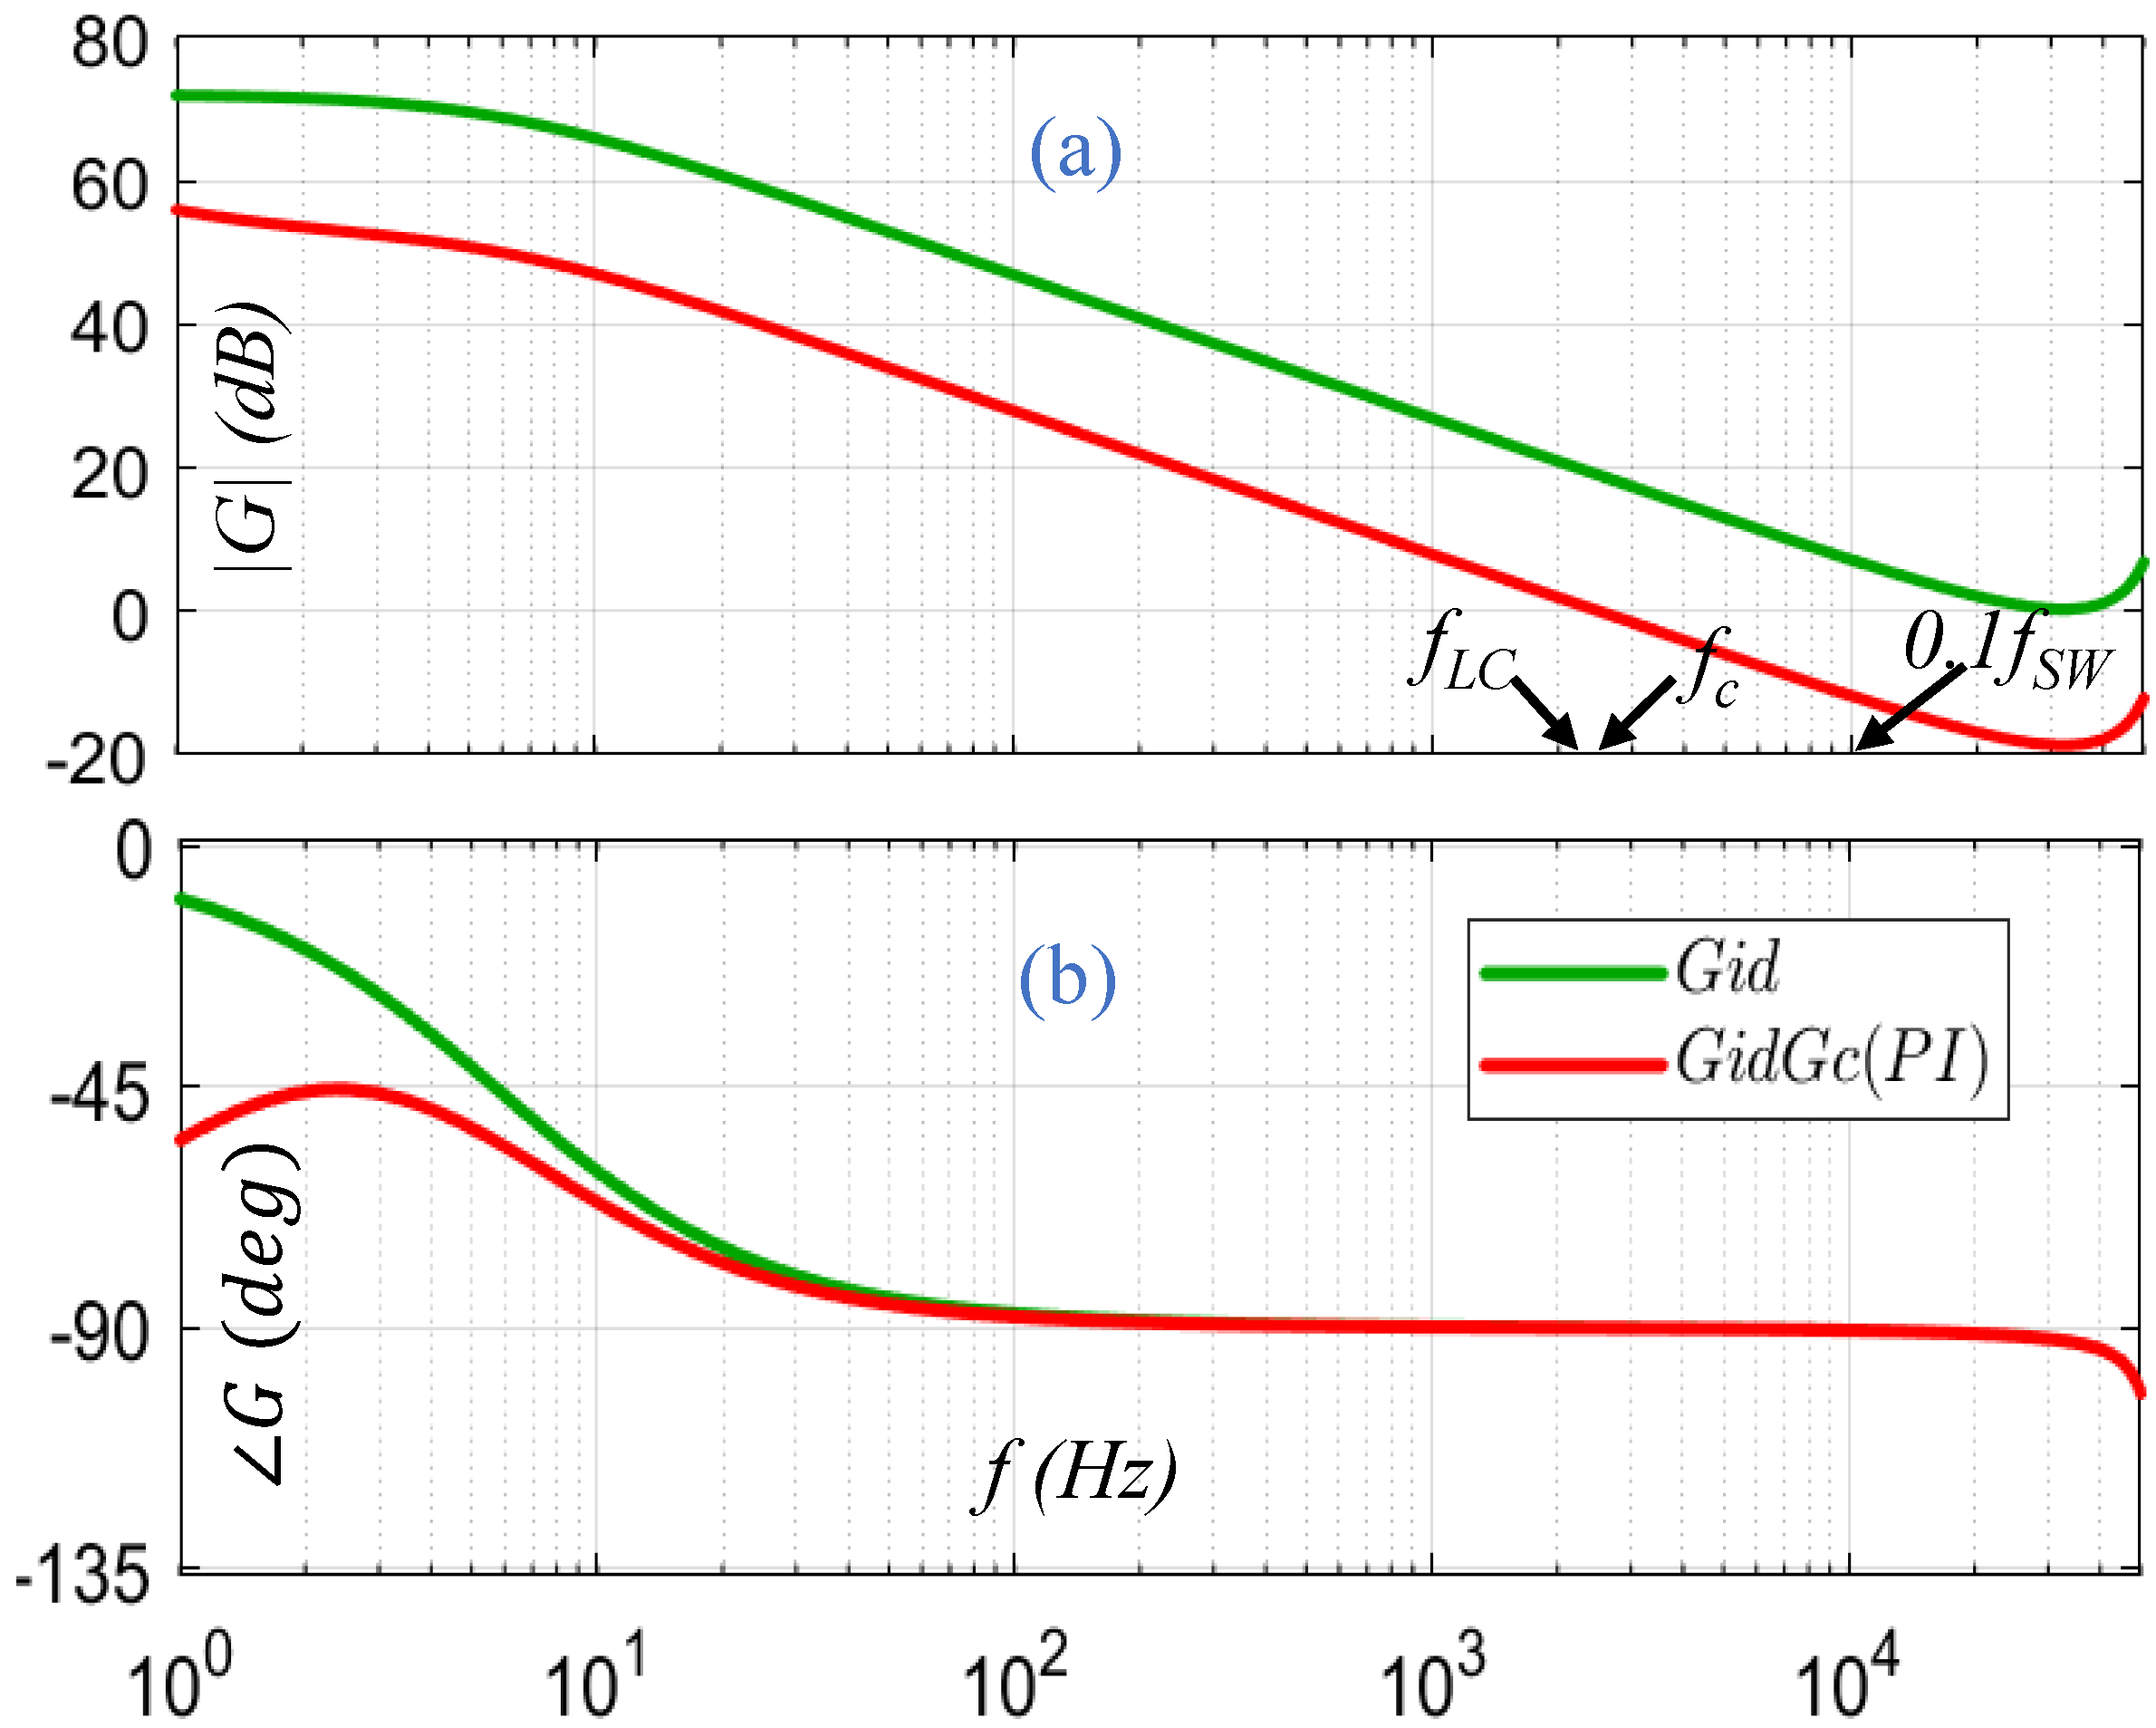
4.4. Open Loop Transfer Function

The output current is controlled by duty perturbation. Therefore, output current to duty transfer function is defined by G i d as in (30).
G i d = I o u t ( s ) d ( s )
G i d can be determined by circuit analysis from Figure 7a. The overall impedance at the midpoint can be expressed by (31).
Z m i d ( s ) = s L + 1 s C Z ( s ) 1 s C + Z ( s )
The impedance at the output node can be expressed by (32).
Z o u t ( s ) = 1 s C Z ( s ) 1 s C + Z ( s )
The inductance current, I L ( s ) , can be expressed by capacitor current, I C ( s ) , and output current, I o u t ( s ) , based on Kirchhoff’s current law as in (33).
I L ( s ) = I C ( s ) + I o u t ( s )
The equation for output voltage to midpoint voltage can be derived by (34) and (35).
H v ( s ) = V o u t ( s ) V m i d ( s ) = I L ( s ) Z o u t ( s ) I L ( s ) Z m i d ( s )
H v ( s ) = 1 1 + s L Z ( s ) + s 2 L C
The battery ripple voltage transfer function, G v d , can be expressed by (36)
G v d = V o u t ( s ) d ( s ) = 1 1 + s L Z ( s ) + s 2 L C V i n
The V o u t ( s ) can be expressed by (37).
V o u t ( s ) = I o u t ( s ) Z ( s )
Using (34) and (37), we can write (38).
H v ( s ) = I o u t ( s ) Z ( s ) V m i d ( s )
For average mode control, (38) can be expressed by (39)
H v ( s ) = I o u t ( s ) Z ( s ) V i n d ( s ) = Z ( s ) V i n G i d
Using (35) and (38), G i d can be determined by (40)
G i d = 1 Z ( s ) + s L + s 2 L C Z ( s ) V i n
The bode plot of G i d is shown in Figure 9 for the proposed system. The bode plot is based on selected parameters of Table 2 and Z ( s ) from Figure 8. The L C resonance peak is not visible in bode plot due to small internal impedance. The internal parameters of a battery changes with state of charge and aging. Therefore, the nominal value of internal resistance can be used as an alternative to Z ( s ) . At lower frequency, G i d has a very high gain (≈70 dB). This means a very small duty perturbation causes a very high current perturbation which leads to instability i.e., 1% duty perturbation at 5 Hz would cause 31 A current perturbation whereas recommended current is only 20 A. This instability happens because of very low magnitude of internal impedance ( 40 dB Ω ). The instability is removed by designing a proper feedback and feedforward controller.

4.5. Feedback Compensator Design

Stability, steady state error, and response time are three important criteria for feedback compensator design. The feedback compensator is designed based on the following steps:

4.5.1. Crossover Frequency Selection

The first step of controller design is to select crossover frequency, f c . To make a stable controller f c must be slightly higher than the resonance frequency of L C filter, f L C . The resonance frequency for the L C filter is defined by (41).
f L C = 1 2 π L C
The rule of thumb to design an efficient and stable controller is to choose crossover frequency less than 1 / 10 th of switching frequency f S W . The crossover frequency selection criterion can be expressed by (42).
f L C < f c 1 10 f S W
Considering the value of f L C and f S W the value of f c = 2.5 kHz is selected.

4.5.2. Gain Adjustment

The compensated loop gain at cross over frequency, | G i d G c | f c , should be 0 dB which can be expressed by (43).
| G i d G c | f c = 1
where, G c is controllers transfer function. (43) can be re-written as (44)
k = | G c | f c = 1 | G i d | f c
where, k is the factor for gain adjustment.
The value of | G i d | f c is 18.96 dB i.e., 8.87, therefore the value of k is 0.11. This system is reducing gain instead of boosting. Gain reduction is necessary to improve stability.

4.5.3. Phase Adjustment

Phase adjustment is done through controller selection. A proportional integral (PI) controller is selected for that purpose. The transfer function of the PI controller is expressed by (45).
G c = k p + k i s
The value of k p and k i are selected in such a way so that | G c | is 0 dB at f c and frequency can be swept for all the frequency less than f c .The value of k p could be ≈k and the value of k i can be determined by (46).
k i = k p ω z
where, ω z is the angular form of zero frequency f z . The value of f z should be less than the desired control frequency, f, of injected AC current. The relationship can be expressed by (47).
f z < f < f c
The parameters used for phase and gain adjustment are in Table 3. The loop controller transfer functions are shown in Figure 9.

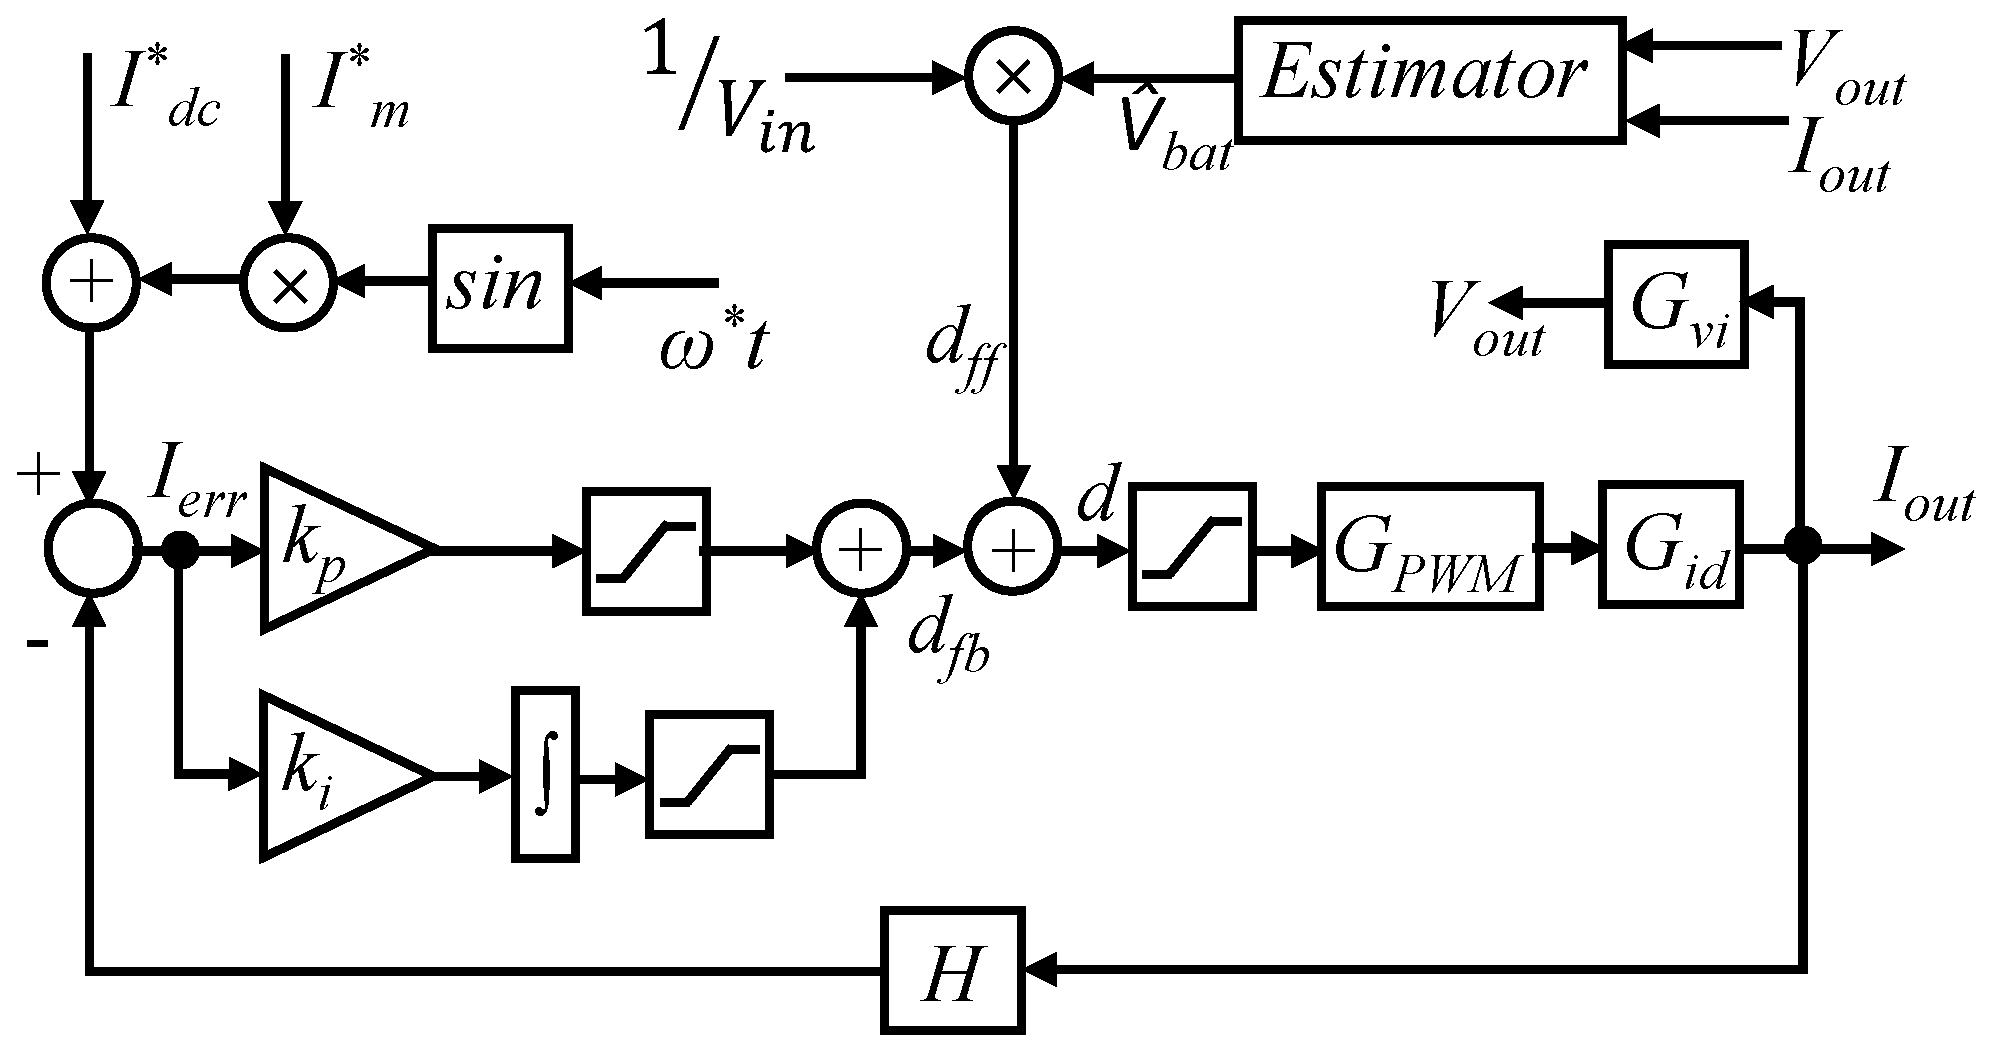
5. Controller Architecture

The proposed controller is designed to inject AC current for all three modes as described in Section 2. The proposed versatile controllers architecture is shown in Figure 10. The overall proposed closed loop control system consists of references, feedback controller, sensing gain (H), feedforward term, estimator, PWM modulation transfer function, G P W M , output current transfer function, G i d , and voltage transfer function, G v i . The current reference, I o u t * , is selected based on desired mode of operation and frequency as in (48).
I o u t * ( t ) = I d c * + I m * s i n ( ω * t )
where, I d c * is the DC level of the current based on the desired mode, I m * is the desired amplitude of the AC signal, and ω * is the desired angular frequency of the AC signals.
The value of reference current, I o u t * , is compared with the output current I o u t and the current error, I e r r , is calculated by (49). The error is compensated by a PI feedback controller. The feedback controller gives feedback duty, d f b , by (50).
I e r r ( t ) = I o u t * ( t ) I o u t ( t )
d f b ( t ) = k p I e r r ( t ) + k i I e r r ( t ) d t
The saturation blocks of the proposed controller keep the value of d f b within the range of −1 to +1. The feedforward duty, d f f , is calculated in (51) using the estimated open circuit voltage, V ^ b a t , and input voltage, V i n .
d f f ( t ) = V ^ b a t ( t ) V i n
The feedback and feedforward terms are combined by (52).
d = d f f + d f b
The value of V ^ b a t is estimated using an estimator as shown in Figure 11. The estimator takes V o u t and I o u t as input. It uses low pass filters to estimate V ^ d c and I ^ d c . A high pass filter is used to estimate v ^ a c and i ^ a c . From the value of v ^ a c and i ^ a c , the magnitude of battery impedance | Z | ^ is calculated. The saturation block is used to limit the unexpected values. Using I ^ d c , | Z | ^ and V ^ d c , the value of V ^ b a t is calculated by (53).
V ^ b a t = V ^ d c I ^ d c | Z | ^

6. Experimental Results

Experiments were conducted for all three modes using Synchronous buck and H-bridge topologies for a Valence U-12XP 40 Ah 13.8 V Li-Ion battery [20].

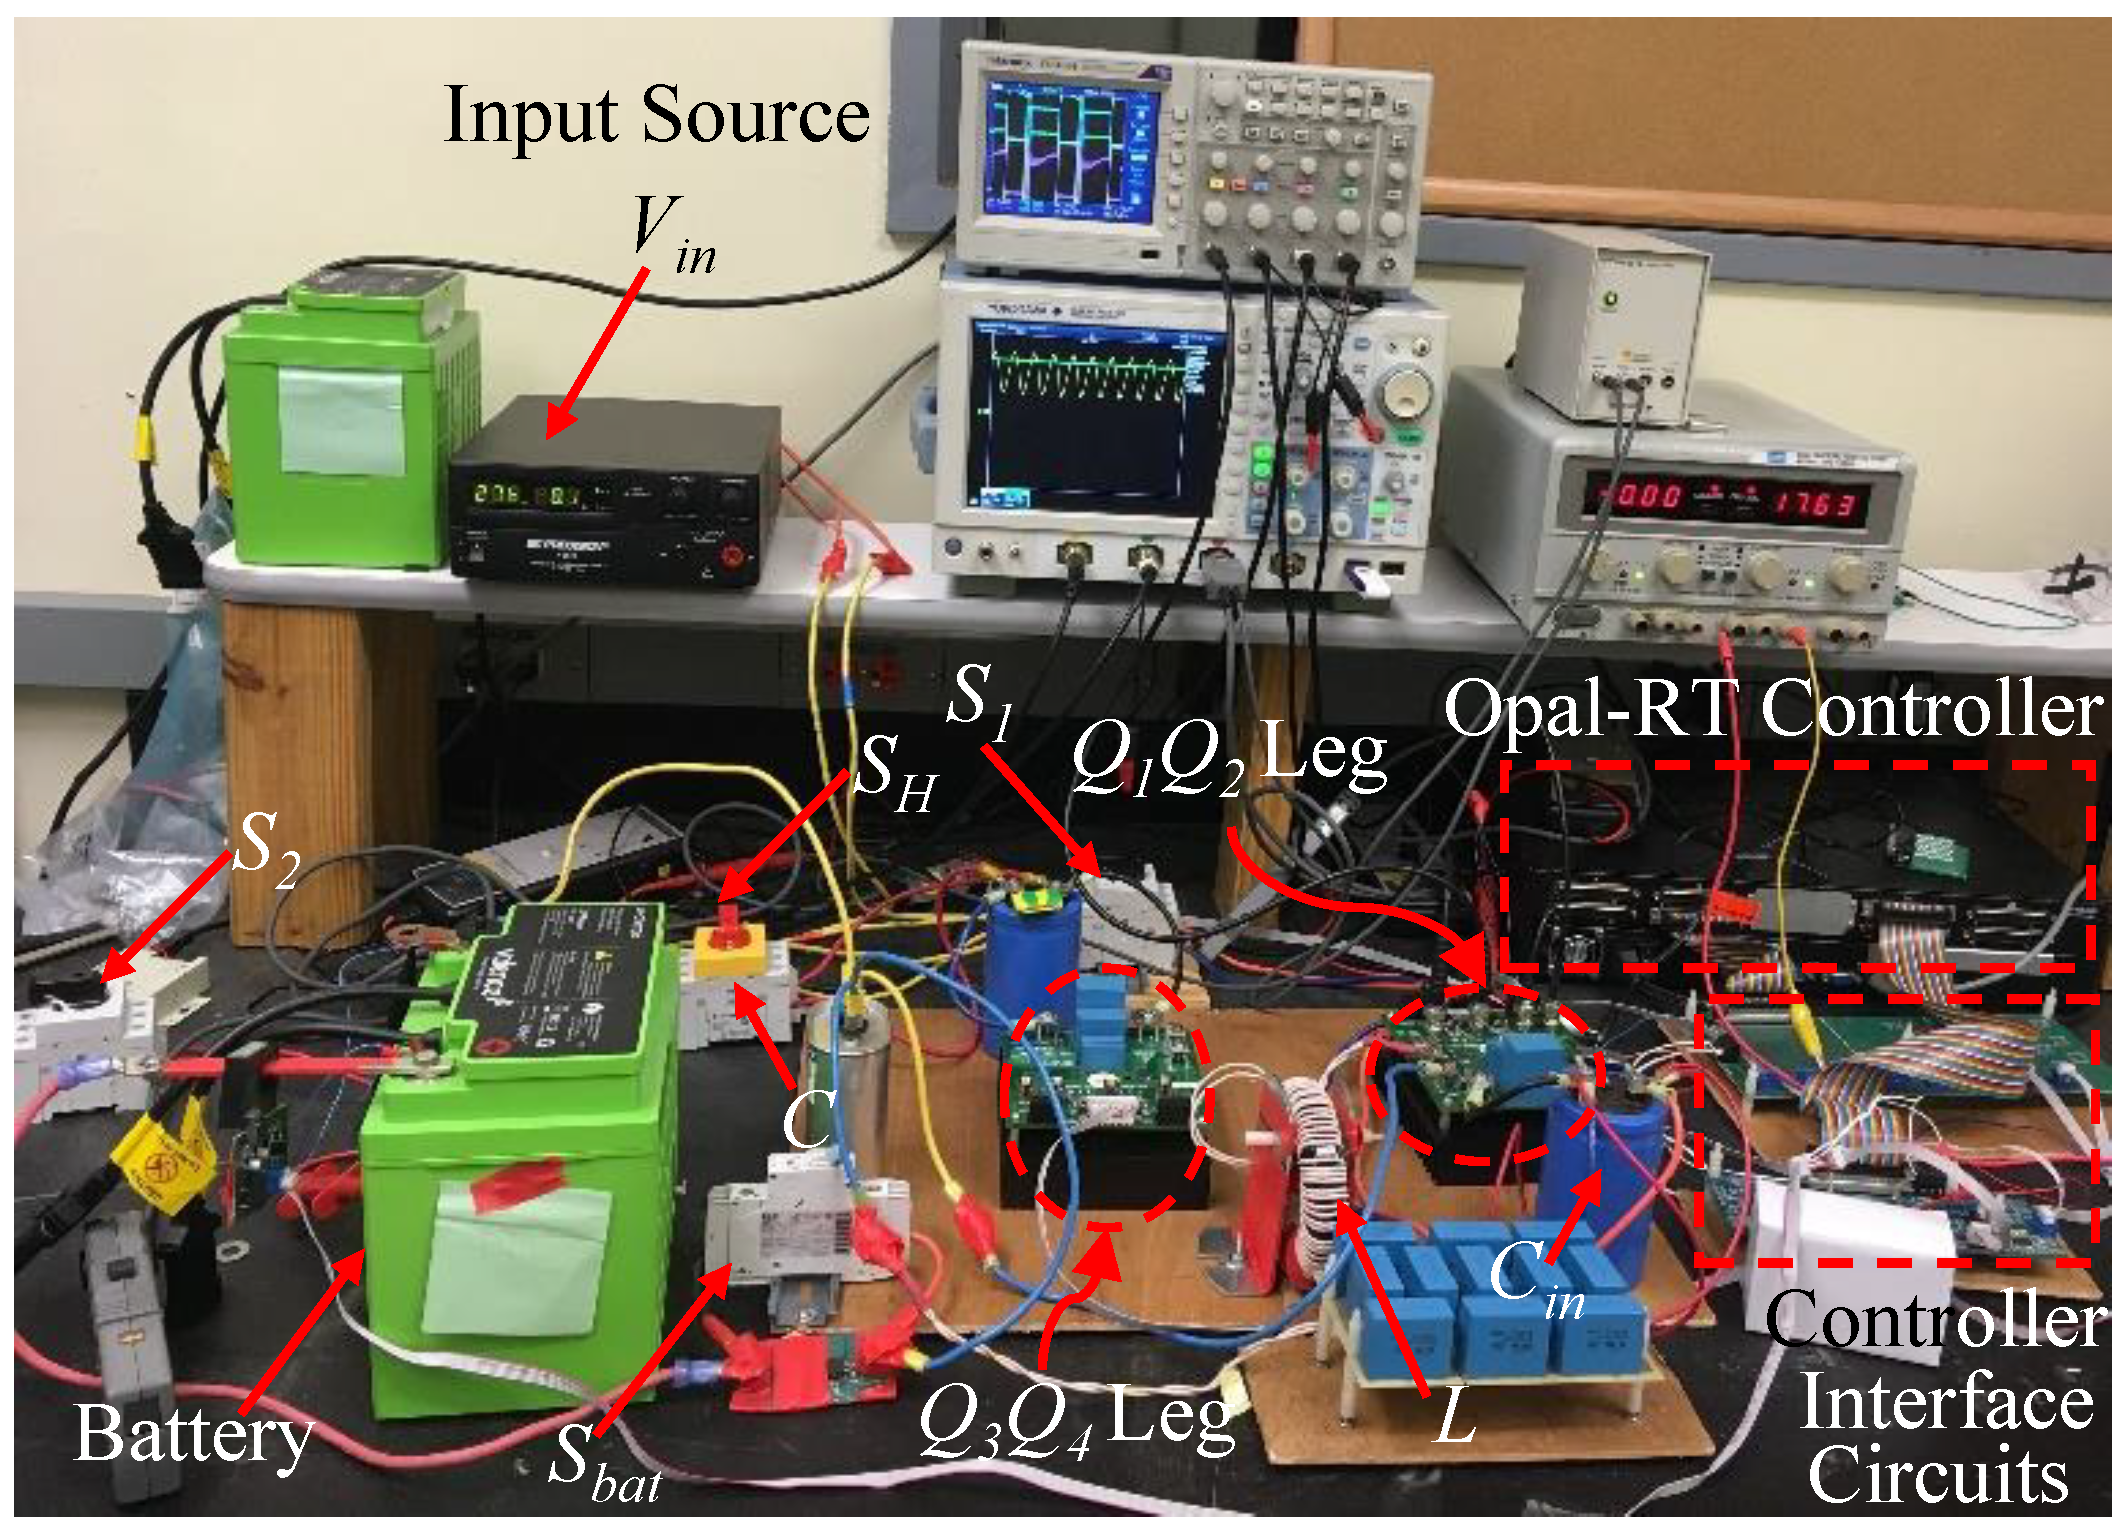
6.1. Experimental Setup

A re-configurable test bed was set up for both synchronous buck and H-bridge topologies as shown in Figure 12. The topologies are shown in Figure 3 and Figure 4. The switch, S H was used to configure the options between synchronous buck and H-bridge topologies. S H connected or disconnected the Q 3 Q 4 leg of H-bridge. The switches S 1 and S 2 were to connect and disconnect the input source, V i n and input resistor, R i n . The value of V i n , C i n , R i n , L, and C were selected based on the discussion of III.A and Table 2. These MOSFETs were controlled by 100 kHz PWM signal generated by the Simulink based Opal-RT controller. The Opal-RT controller gets voltage and current as feedback through Op-Amp based offset clipping and scaling interface circuits. The proposed controller was implemented with a sample time of 20 μ S using Opal-RT (OP4510).

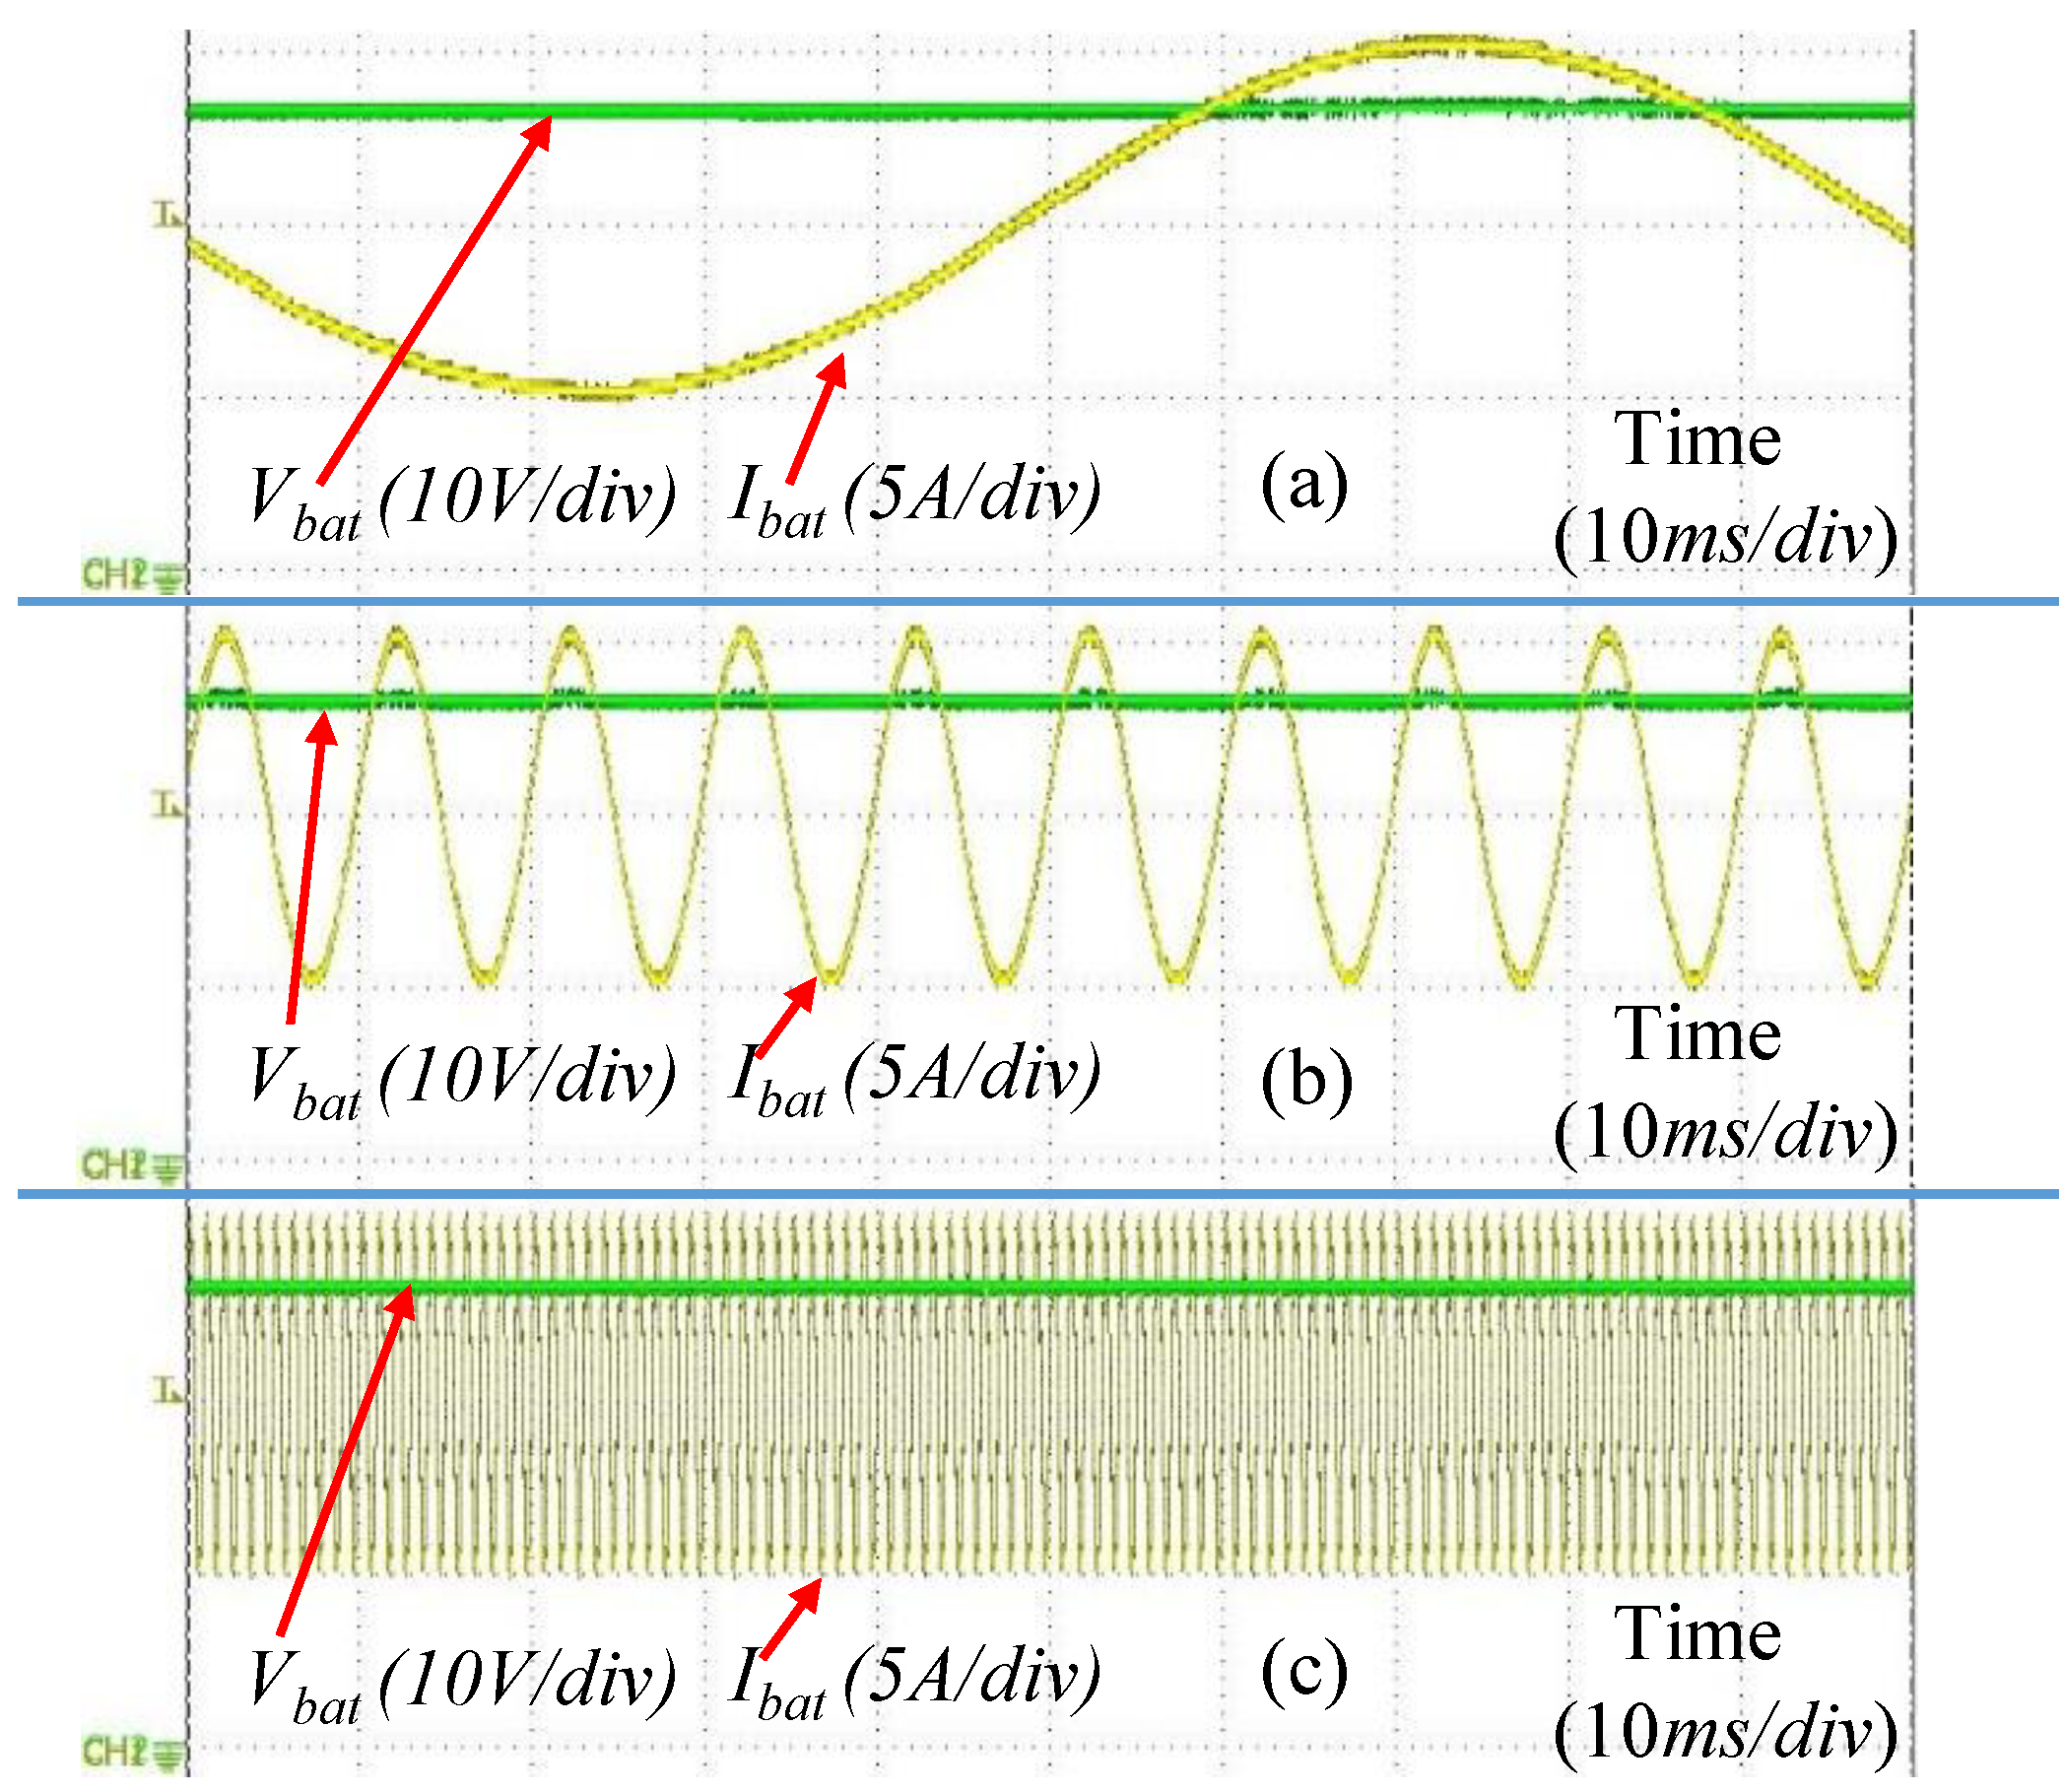
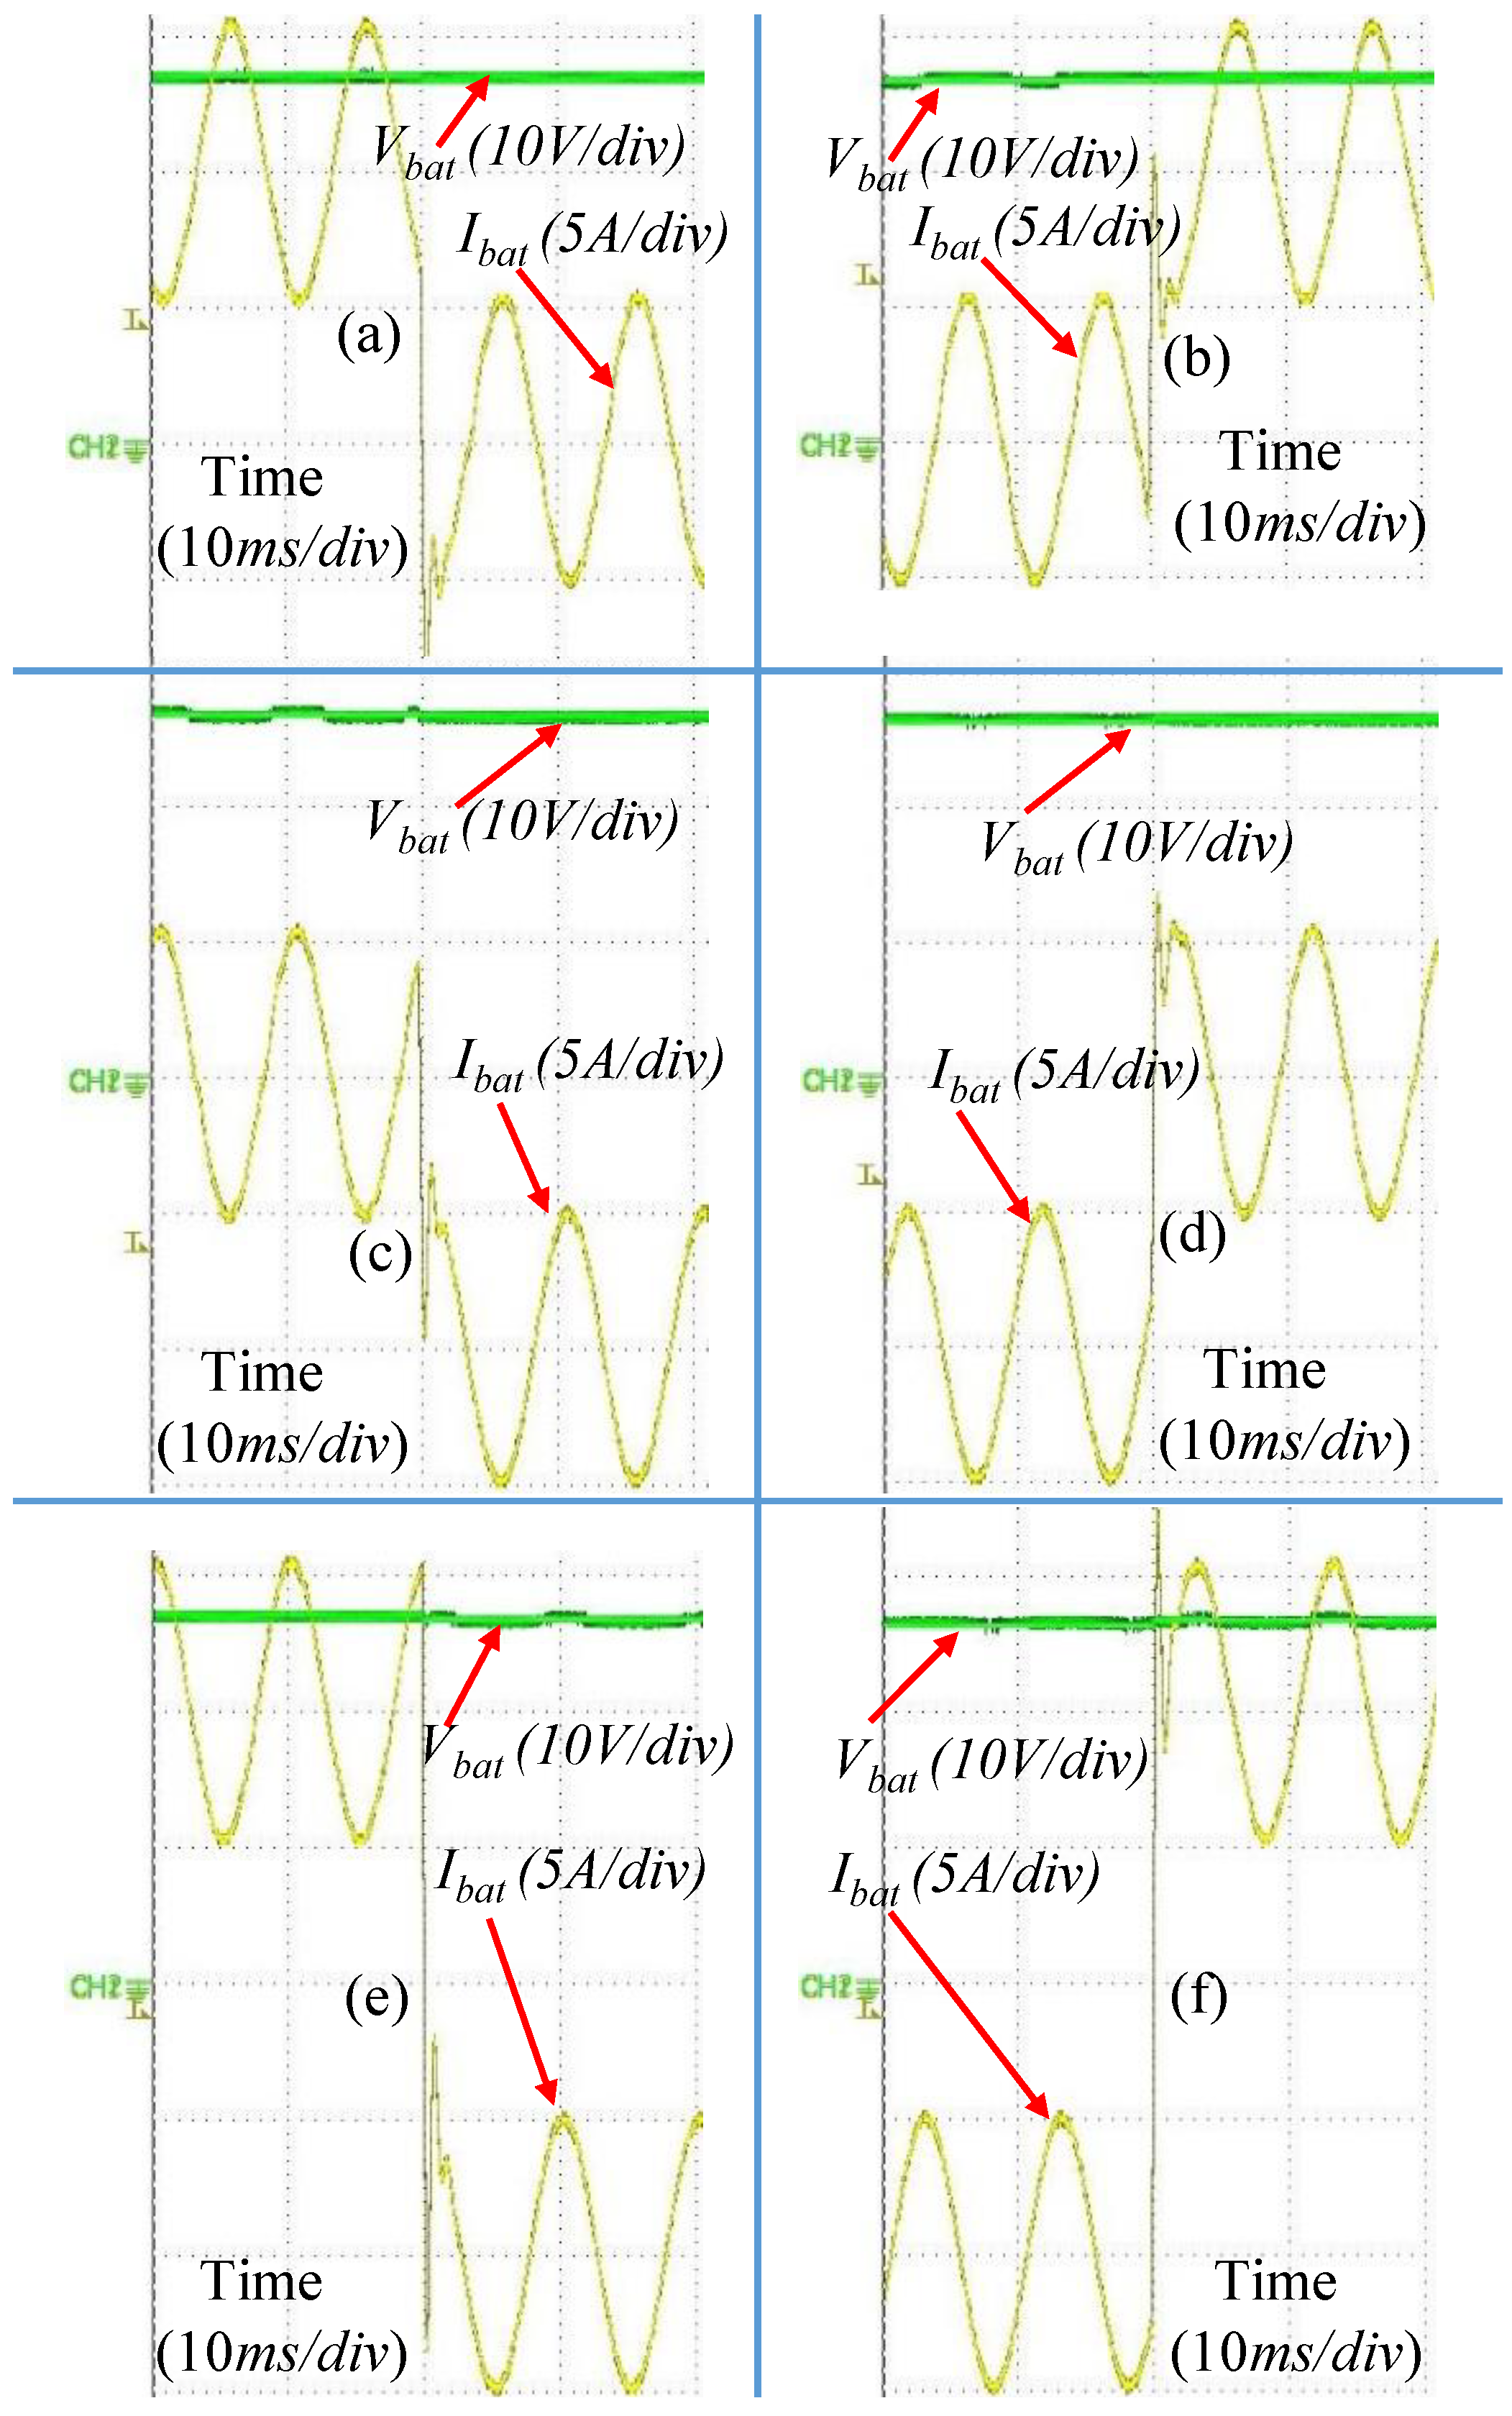
6.2. Waveforms and Analysis

The steady state battery voltage and current for different modes of operation using the synchronous buck converter are shown in Figure 13. The DC current of the battery for different modes were +10 A, 0 A, and −10 A. The same operation was verified using the H-bridge converter also. The amplitude of the AC injection current was 5 A and the frequency was 100 Hz. The battery voltage was 13.5 V as DC average. The battery had a very small internal impedance (maximum 15 m Ω ). Therefore, small battery voltage ripple due to AC injection was not visible by DC coupling in an oscilloscope. The battery voltage ripple is shown in Figure 14 using AC coupling. In this case the battery was operated in mode 1 for 100 Hz. The AC current peak was changed from 2 A to 5 A to observe the transient response and the effect of AC current to battery voltage. The controller was successfully able to regulate the current.
The AC part of the battery current was changed from 0 to 2 kHz for all three modes of operation using both synchronous buck and H-bridge converters. The battery voltage and current for 10 Hz, 100 Hz and 1 kHz for mode 1 using the synchronous buck converter is shown in Figure 15. The dynamic response for mode change using the proposed controller is shown in Figure 16. In these cases, both S 1 and S 2 were turned on. The proposed versatile controller was validated by successfully testing the additional conditions listed in Table 4.

7. Discussion

A passive component selection guideline and controller design method for AC current injection to battery is presented in this manuscript. The novelty in this manuscript is to operate power converters for batteries in two quadrant applying the proposed guideline and method. The novelty is justified by comparing the AC current injection method for batteries in the recent journals as in Table 5.

8. Conclusions

A complete controller design method for AC current injection to a battery is developed in this manuscript. This method includes the passive component selection, controller gain selection, and controller architecture. The controller was able to operate for both synchronous buck and H-bridge converters. The proposed versatile controller successfully controlled the AC battery current for offline and online modes (while charging/discharging) over a range of frequencies and magnitudes as expected from the bode plot of the simulation. The proposed controller and design method will be useful for internal impedance measurement, advanced charging, and preheating applications. The advantage of the proposed technique is that it does not require any changes in the control architecture for different mode of operation for various topologies over a range of frequencies. The disadvantage of the proposed controller is that it requires voltage feedback for optimized operation. The performance of this controller with AC/DC/DC grid tied application is not verified yet and will be investigated in the future.

Author Contributions

All the authors contributed substantially to the manuscript. Contributions of each author are as follows: conceptualization, S.M.R.I.; methodology, S.M.R.I.; software, S.M.R.I.; validation, S.M.R.I. and S.-Y.P.; formal analysis, S.M.R.I.; investigation, S.M.R.I.; resources, S.M.R.I. and S.-Y.P.; data curation, S.M.R.I.; writing—original draft preparation, S.M.R.I.; writing—review and editing, S.M.R.I. and S.-Y.P.; visualization, S.M.R.I.; supervision, S.-Y.P.; project administration, S.-Y.P.; funding acquisition, S.-Y.P. All authors have read and agreed to the published version of the manuscript.

Funding

This research was funded by the National Science Foundation of under Grant No. 1454578.

Institutional Review Board Statement

Not applicable.

Informed Consent Statement

Not applicable.

Data Availability Statement

Not applicable.

Acknowledgments

This work was supported by the National Science Foundation under grant no. 1454578. However, any opinions, findings, conclusions, or recommendations expressed herein are those of the authors and do not necessarily reflect the views of the National Science Foundation.

Conflicts of Interest

The authors declare no conflict of interest.The funders had no role in the design of the study; in the collection, analyses, or interpretation of data; in the writing of the manuscript, or in the decision to publish the results.

References

  1. Shang, Y.; Liu, K.; Cui, N.; Zhang, Q.; Zhang, C. A Sine-Wave Heating Circuit for Automotive Battery Self-Heating at Subzero Temperatures. IEEE Trans. Ind. Inform. 2020, 16, 3355–3365. [Google Scholar] [CrossRef]
  2. Din, E.; Schaef, C.; Moffat, K.; Stauth, J.T. A Scalable Active Battery Management System With Embedded Real-Time Electrochemical Impedance Spectroscopy. IEEE Trans. Power Electron. 2017, 32, 5688–5698. [Google Scholar] [CrossRef]
  3. Varnosfaderani, M.A.; Strickland, D. A Comparison of Online Electrochemical Spectroscopy Impedance Estimation of Batteries. IEEE Access 2018, 6, 23668–23677. [Google Scholar] [CrossRef]
  4. Lee, Y.D.; Park, S.Y. Electrochemical State-Based Sinusoidal Ripple Current Charging Control. IEEE Trans. Power Electron. 2015, 30, 4232–4243. [Google Scholar] [CrossRef]
  5. Lasia, A. Electrochemical Impedance Spectroscopy and Its Applications; Springer: New York, NY, USA, 2014. [Google Scholar]
  6. Orazem, M.E.; Tribollet, B. Electrochemical Impedance Spectroscopy; John Wiley & Sons: Hoboken, NJ, USA, 2011; Volume 48. [Google Scholar]
  7. Lee, Y.D.; Park, S.Y.; Han, S.B. Online Embedded Impedance Measurement Using High-Power Battery Charger. IEEE Trans. Ind. Appl. 2015, 51, 498–508. [Google Scholar] [CrossRef]
  8. Chen, J.; Lee, Y.; Park, S. Adaptive PI gain control to realize sinusoidal ripple current charging. In Proceedings of the 2015 9th International Conference on Power Electronics and ECCE Asia (ICPE-ECCE Asia), Seoul, Korea, 1–5 June 2015; pp. 2582–2589. [Google Scholar] [CrossRef]
  9. Islam, S.M.R.; Park, S. Precise Online Electrochemical Impedance Spectroscopy Strategies for Li-Ion Batteries. IEEE Trans. Ind. Appl. 2020, 56, 1661–1669. [Google Scholar] [CrossRef]
  10. Qahouq, J.A.A.; Xia, Z. Single-Perturbation-Cycle Online Battery Impedance Spectrum Measurement Method With Closed-Loop Control of Power Converter. IEEE Trans. Ind. Electron. 2017, 64, 7019–7029. [Google Scholar] [CrossRef]
  11. Hajisadeghian, H.; Motie Birjandi, A.A.; Nahavandi, R. Sliding Mode Controller (SMC) For Sinusoidal Ripple Current (SRC) Charge of Li-ion Battery. In Proceedings of the 2019 10th International Power Electronics, Drive Systems and Technologies Conference (PEDSTC), Shiraz, Iran, 12–14 February 2019; pp. 600–605. [Google Scholar] [CrossRef]
  12. Sadeghi, E.; Zand, M.H.; Hamzeh, M.; Saif, M.; Alavi, S.M.M. Controllable Electrochemical Impedance Spectroscopy: From Circuit Design to Control and Data Analysis. IEEE Trans. Power Electron. 2020, 35, 9933–9942. [Google Scholar] [CrossRef]
  13. Bayati, M.; Abedi, M.; Gharehpetian, G.B.; Farahmandrad, M. Sinusoidal-Ripple Current Control in Battery Charger of Electric Vehicles. IEEE Trans. Veh. Technol. 2020, 69, 7201–7210. [Google Scholar] [CrossRef]
  14. Teodorescu, R.; Liserre, M.; Rodriguez, P. Grid Converters for Photovoltaic and Wind Power Systems; John Wiley & Sons: Hoboken, NJ, USA, 2011; Volume 29. [Google Scholar]
  15. Li, J. Design and Control Optimisation of a Novel Bypass-embedded Multilevel Multicell Inverter for Hybrid Electric Vehicle Drives. In Proceedings of the 2020 IEEE 11th International Symposium on Power Electronics for Distributed Generation Systems (PEDG), Dubrovnik, Croatia, 28 September–1 October 2020; pp. 382–385. [Google Scholar] [CrossRef]
  16. Chen, L.; Wu, S.; Shieh, D.; Chen, T. Sinusoidal-Ripple-Current Charging Strategy and Optimal Charging Frequency Study for Li-Ion Batteries. IEEE Trans. Ind. Electron. 2013, 60, 88–97. [Google Scholar] [CrossRef]
  17. Koch, R.; Kuhn, R.; Zilberman, I.; Jossen, A. Electrochemical impedance spectroscopy for online battery monitoring—Power electronics control. In Proceedings of the 2014 16th European Conference on Power Electronics and Applications, Lappeenranta, Finland, 26–28 August 2014; pp. 1–10. [Google Scholar] [CrossRef]
  18. Instruments, T. Basic Calculation of a Buck Converter’s Power Stage; Application Report-SLVA477B, Rev; Richtek Technology Corporation: Zhubei City, Taiwan, 2015. [Google Scholar]
  19. Islam, S.; Park, S.Y.; Balasingam, B. Unification of Internal Resistance Estimation Methods for Li-Ion Batteries Using Hysteresis-Free Equivalent Circuit Models. Batteries 2020, 6, 32. [Google Scholar] [CrossRef]
  20. Lithium Werks. Valence U1-12XP Batteries. Available online: https://www.lithionbattery.com/products/modules/u-charge-xp/ (accessed on 13 July 2021).
  21. Koseoglou, M.; Tsioumas, E.; Papagiannis, D.; Jabbour, N.; Mademlis, C. A Novel On-Board Electrochemical Impedance Spectroscopy System for Real-Time Battery Impedance Estimation. IEEE Trans. Power Electron. 2021, 36, 10776–10787. [Google Scholar] [CrossRef]
  22. Tang, C.Y.; Chen, P.T.; Jheng, J.H. Bidirectional Power Flow Control Integrated With Pulse and Sinusoidal-Ripple-Current Charging Strategies for Three-Phase Grid-Tied Converters. IEEE Access 2021, 9, 42151–42160. [Google Scholar] [CrossRef]
Figure 1. Power converters output: (a) AC current injector using an inverter for AC systems (b) fixed voltage bi-directional converter for DC bus, and (c) AC current injector required for batteries.
Batteries 07 00047 g001
Figure 2. Modes of operation for AC current injector: (a) waveform of converter current and (b) operating conditions and control ranges.
Batteries 07 00047 g002
Figure 3. AC injector using synchronous buck converter (2 MOSFTETs).
Batteries 07 00047 g003
Figure 4. AC injector using H-bridge converter (4 MOSFTETs).
Batteries 07 00047 g004
Figure 5. AC states at input capacitor: current, charge, and voltage.
Batteries 07 00047 g005
Figure 6. Gate driver PWM signal for power converters: (a) synchronous buck (b) H-bridge with unipolar switching (c) H-bridge with bi-polar switching.
Batteries 07 00047 g006
Figure 7. Small signal modeling: (a) simplified model of power converters, and (b) AR-ECM model of a battery.
Batteries 07 00047 g007
Figure 8. Bode-plot of internal impedance: (a) magnitude, (b) phase [9].
Batteries 07 00047 g008
Figure 9. Bode-plot of open loop and compensated loop transfer functions: (a) magnitude, (b) phase.
Batteries 07 00047 g009
Figure 10. Structure of the proposed controller for AC current injector.
Batteries 07 00047 g010
Figure 11. Proposed estimator for the open circuit voltage of a battery.
Batteries 07 00047 g011
Figure 12. The re-configurable testbed of AC current injector for synchronous buck and H-bridge topologies.
Batteries 07 00047 g012
Figure 13. Voltage and current of the battery in steady state for: (a) mode 1, (b) mode 2, and (c) mode 3.
Batteries 07 00047 g013
Figure 14. Transient response: magnitude change (from 2 A AC peak to 5 A) of battery current in mode 1 at 100 Hz.
Batteries 07 00047 g014
Figure 15. Voltage and current of the battery in steady state in mode 1 for: (a) 10 Hz, (b) 100 Hz, and (c) 1000 Hz.
Batteries 07 00047 g015
Figure 16. Dynamic response: mode change (for 100 Hz 5A AC peak) of battery current: (a) mode 1 to 2, (b) mode 2 to 1, (c) mode 2 to 3, (d) mode 3 to 2, (e) mode 1 to 3, and (f) mode 3 to 1.
Batteries 07 00047 g016
Table 1. Operating modes and input switches.
Switches S 1 S 2 S 1 S 2 S 1 S 2 S 1 S 2
State00100111
Mode2131, 2, 3
Table 2. Passive Components for Topologies.
V in R in C in LC
Calculated27.6 V5.5  Ω 1800  μ F276  μ H41  μ F
Selected27.6 V4.5  Ω 2200  μ F198  μ H24  μ F
Table 3. Parameters for proposed controller.
f LC f c f SW | G id | fc | G id G c | fc f z k p k i
2.3 kHz2.5 kHz100 kHz18.96 dB0 dB1 Hz0.110.7
Table 4. The test conditions for controller validation.
ConditionSync-BuckH-Bridge
Steady
State
Mode 1Mode 2Mode 3Mode 1Mode 2Mode 3
0, 2, 3, & 5 A AC peak
0, 0.1, 10, 50, 100, 300, 500, 1k, 1.5k, & 2k Hz AC
Dynamic
Response
Mode change: 1-2, 2-1, 2-3, 3-2, 1-3, & 3-1.
Maximum mode transition time: 2 mS
Maximum overshoot current for mode change: 2.5 A
Magnitude change of AC current:
✓transient response for 0-5 A, 5-0 A, 2-5 A, & 5-2 A
Frequency change of AC current:
✓frequency transition for 0–50 Hz, 50–100 Hz, 100–50 Hz, & 0–2 kHz
Table 5. Comparison of AC current injection method for batteries.
ReferenceYearPower QuadrantDC CurrentAC WaveformTopologyControlNotes
[10]20171-0.1–1.9 kHzDC/DCdischarge,voltage
multisineboost/buckfeedbackcontrol
[9]20201+0.1 Hz–5 kHzDC/DCchargefeedback
[21]20211+20 mHz–2 kHzDC/DC,chargefeedback
[22]20212±<60 HzAC/DC/DCcharge/dischargedistort if
sinegrid-tiedfeedback f > 60  Hz
This20212±,0.1 Hz–2 kHzDC/DC,charge/discharge,passive
work 0sineSync-buck,feedback,component
H-bridgefeedforwardselection
Publisher’s Note: MDPI stays neutral with regard to jurisdictional claims in published maps and institutional affiliations.

