Abstract
The widespread use of electric vehicles is nowadays limited by the “range anxiety” of the customers. The drivers’ main concerns are related to the kilometric range of the vehicle and to the charging time. An optimized fast-charge profile can help to decrease the charging time, without degrading the cell performance and reducing the cycle life. One of the main reasons for battery capacity fade is linked to the Lithium plating phenomenon. This work investigates two methodologies, i.e., three-electrode cell measurement and internal resistance evolution during charging, for detecting the Lithium plating conditions. From this preliminary analysis, it was possible to develop new Multi-Stage Constant-Current profiles, designed to improve the performance in terms of charging time and cells capacity retention with respect to a reference profile. Four new profiles were tested and compared to a reference. The results coming from the new profiles demonstrate a simultaneous improvement in terms of charging time and cycling life, showing the reliability of the implemented methodology in preventing Lithium plating.
Keywords:
lithium plating; fast charging; automotive; electric vehicles; li-ion battery; MCC; cut-off voltage 1. Introduction
Nowadays, the energy economy based on fossil fuels involves tremendous risks, e.g., high demand for oil, depletion of non-renewable resources, increase of CO2 emissions, etc. From this standpoint, it is necessary to drastically foster alternative energy systems. In this sense, the replacement of the Internal Combustion Engine (ICE) with Electric, Hybrid, Plug-in Hybrid Vehicles (EVs, HEVs. and PHEVs) seems to track the route towards a sustainable mobility [1,2].
Lithium-ion Batteries (LIBs) are among the most diffused energy storage systems, because of their high energy density and good power capability. They are largely used in consumer electronics and more and more widespread in the automotive sector. [3] Today, the use of an electric vehicle is still strongly limited by “range anxiety” [4]. In fact, the drivers’ main concerns are related to the kilometric range of the vehicle, limited by the usable energy of batteries if compared to those using fossil fuels, and to the charging time, significantly higher than the time required for refueling. In terms of energy density, many efforts have been made for the development of innovative materials for Li-ion batteries [5], including cathodes for high operating voltage [6], high-capacity anodes [7].
On the other hand, the implementation of an optimized fast-charging profile can be helpful to decrease the time needed for a complete charge, without degrading the cell performance and reducing the cycle life.
Automotive producers consider that a fast charging procedure is appropriate when the 80% of usable energy can be restored in 30–65 min, as reported in Table 1.

Table 1.
Summary of fast charging parameters for several vehicles on the market.
Several approaches have been developed, with the aim of optimizing capacity retention, along with reducing the charge time [8,9].
Among different charging methodologies, constant-current–constant-voltage (CC–CV) (Figure 1a) is one of the most widespread, because of its simplicity. The multi-stage constant-current (MCC) protocol (Figure 1b) is one of the first specifically designed for fast charging. This kind of protocol is composed of two or more CC steps that end when a well-defined cut-off voltage is reached [10,11]. The constant-current–constant-voltage–negative-pulse (CC-CVNP) charging protocol (Figure 1c) shows a constant current profile divided in a certain number of steps, interspersed with a negative-pulsed current, useful to reduce the concentration gradients inside the electrode [12,13]. The pulse charging protocol (Figure 1d) comprises a series of constant current charging steps, with rest phases introduced among each charge. This reduces the risk of cell excessive polarization, improving the charging efficiency, with benefits in terms of solid electrolyte interphase (SEI) formation [14,15]. Figure 1e reports a boost charging protocol, where the initial step is characterized by significantly high current values, usually followed by a normal CC–CV [9]. Figure 1f shows a variable current profile (VCP) protocol, where the current profile changes continuously on the basis of the outputs coming from an equivalent circuit model [16].
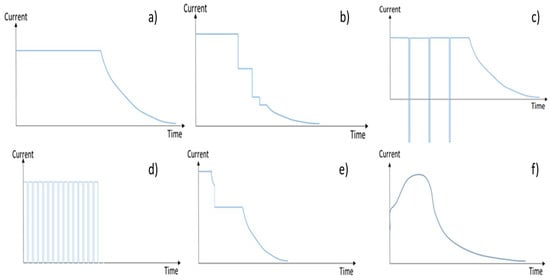
Figure 1.
(a) Constant-Current–Constant-Voltage (CC-CV) charging profile; (b) Multi-stage constant-current (MCC) charging profile; (c) Constant-Current with negative pulse (CCNP) charging profile; (d) Pulse-current charging profile; (e) Boost-charging current profile; (f) Continuously Variable (VCP) current profile.
In all the described cases, from the knowledge of the impedance of the cell as a function of the state of charge, it is possible to define a charge profile that optimizes the charging efficiency and therefore reduces heat generation [16].
Since cycle aging, especially during fast charging, causes irreversible capacity fade in the cell, it is of high importance to monitor the main phenomena responsible of this loss. Among the aging causes there is the fracture of particles in the active material due to the Lithium concentration gradient, with consequent stress generation (proportional to the applied C-rate) [17,18,19].
This study focuses on one of the other main causes of aging, i.e., the Lithium plating phenomenon. It consists in the deposition of metallic Lithium on the anode side during charging and mainly happens at high current values and low temperature conditions. The negative effects of this phenomenon [20,21] are:
- consumption of active Lithium;
- clogging of electrode porosity, with consequent loss of Li+ ions mobility;
- risk of short circuits associated with the formation of Li dendrites.
One of the most diffused methodologies for the electrochemical detection of the onset of Lithium plating consists in the observation of voltage behavior during the relaxation time, after a charging phase. If Lithium plating is not present, the cell voltage drops exponentially just after the charging stops (Figure 2a–blue line). The dynamic voltage response of the cell is used to be modelled with an equivalent RC parallel circuit, showing an exponential decrease during relaxation. In the case of Lithium plating, as demonstrated in [22], a different behavior is found (Figure 2a–red line): indeed, during the relaxation time, the plated Lithium continues to intercalate into graphite, leading to an increase in the concentration of LiC6. The usage of differential voltage during the relaxation period is useful to investigate voltage evolution during the rest phase: the local minimum indicated by (X) in Figure 2b–red line clearly individuates the end of the plated Lithium intercalation and the beginning of normal relaxation.
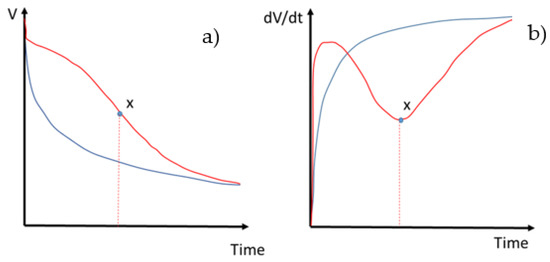
Figure 2.
(a) Voltage relaxation with Lithium plating (red line) and without Lithium plating (blue line). (b) Differential voltage during the relaxation period with Lithium plating (red line) and without Lithium plating (blue line).
Differential Voltage Analysis (DVA) performed during a discharge can be also used as a diagnostic tool for detecting the presence of Lithium plating on the anode surface [23,24]. If Lithium plating is present, the DVA curve shows an inflection at the beginning of the discharge, as shown in Figure 3.
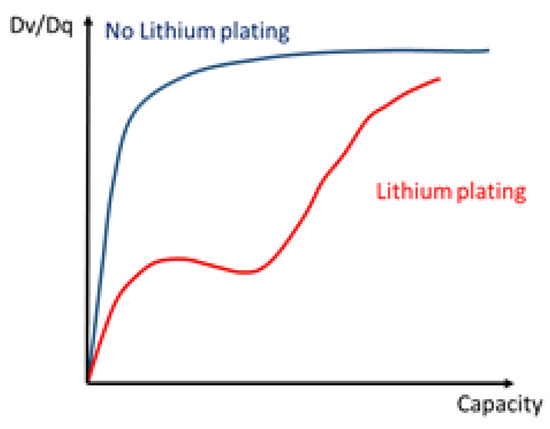
Figure 3.
Differential Voltage Analysis (DVA) during discharge.
In order to evaluate and anticipate the conditions leading to plating evolution, the present study focuses on two methodologies, described in Section 2:
- evaluation of electrode potential as a function of time, measured in a three-electrode cell (EL-Cell) against a Li/Li+ pseudo-reference electrode [9,25,26,27];
- evaluation of the evolution as a function of time of the internal resistance during the charge process [28].
Since the second methodology is simpler and can be applied to the full cells without the need to tear them down and to test the materials in a three-electrode cell, one of the objectives of the present study is to compare the capacity of the two techniques of predicting Lithium plating.
2. Materials and Methods
A commercial high-energy-density (215 Wh/Kg) cell with Si–C|EC/DMC (1:1), 1M LiPF6|NMC811 was used in all the described experiments. As the cathode material, Ni0.8Mn0.8Co0.1O2 (NMC811) was used, while the anode was Silicon–Graphite (Si–C), with an amount of silicon of 2 wt %. Both electrodes were double-side coated (details are reported in Table 2). A mixture of EC/DMC (1:1) and 1M LiPF6 was used as the electrolyte.
Table 2.
Commercial cell electrodes properties.
All the tests described in this work were performed at 25 °C, in a temperature- and humidity-controlled climatic chamber (Angelantoni ACS).
2.1. Evaluation of Electrode Potential Measured in a Three-Electrode Cell against a Li/Li+ Pseudo-Reference Electrode
The commercial cell was opened in discharge state for working in safety conditions. The electrode materials were cut in disks of 18 mm diameter and used to assemble a laboratory test cell (supplied by EL-Cell).
Since the electrodes on the original cell were coated on both layers of the current collectors, one of the two active material sides was removed to allow the proper electric contact in the EL-Cell. This operation does not influence the mass loading ratio between cathode and anode materials, reproducing the original conditions.
The use of the EL-Cell configuration was preferred over the coin cell, since it allows the easy dismantling of the cells for further post-mortem analysis of the materials.
The electrolyte was the same used for the commercial cell, purged on an FS-5P double-layered commercial separator.
The EL-Cell was assembled in an MBraun Glove Box with Ar atmosphere (O2 < 0.1 ppm; H2O < 0.1 ppm).
The testing station was a Basytec CTS Lab with 4 channels.
The cell formation protocol consisted of 10 cycles at a current rate equal to C/10, and the capacity (mAh) was estimated as follow:
- CC–CV charge C/2 up to 4.2 V (CV step with an exit condition I < C/40);
- CC discharge at expected 1 C down to 2.75 V;
In order to detect the Lithium plating phenomenon occurring at the anode, a Lithium reference electrode was used to detect when the anode potential (Uan) became negative (vs. Li/Li+). As reported in the literature [29], this condition evidences that Lithium ions can preferentially plate on the anode surface instead of intercalating inside graphite planes.
A CC charging phase was performed at several C-Rates with anode potential (Uan) equal to zero as the ending condition.
In order to design each single step of a multi-step charging profile, once the C-Rate of a specific step was selected, the full-cell potential measured at the end of the charging phase (related to the selected C-Rate) was considered as the cut-off voltage.
2.2. Evaluation of the Evolution of the Internal Resistance as a Function of Time during the Charge Process
This approach is complementary to that described in Section 2.1 and it consists in performing a pulsed charging procedure on the full cell, in order to evaluate the evolution of the internal resistance.
The testing station was a Basytec XCTS.
The internal resistance was measured during a resting period (3 s), using the current interrupt method after each charging step (Figure 4). Between two rest periods, an increase of 2.5% SoC was reached.
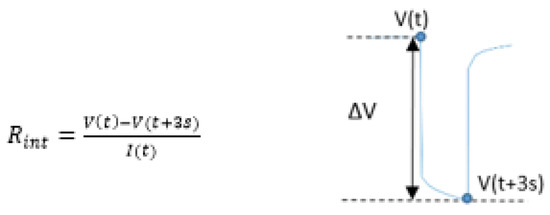
Figure 4.
Internal Resistance evaluation during a 3 s resting period.
The charging steps were performed at specified C-Rates in the range between 0.5 C and 2 C, with an interval of 0.25 C for each step (i.e., 0.5 C; 0.75 C; 1 C; etc.).
The internal resistance values obtained at 0.1 C were considered as the Reference values (see Section 3).
As widely discussed and demonstrated [28], the internal resistance evaluated with the pulsed charge procedure is an effective way to estimate impedance evolution and to detect Lithium plating at the anode. When Lithium plating occurs, this phenomenon enters in competition with the intercalation of Lithium ions among the graphite layers. From an electrical analogy point of view, it is possible to model the intercalation phenomenon with a resistance, imagining an additional resistance in parallel, ascrivibile to Lithium plating to the existing one, with a total decrease in term of resistance, as shown in Figure 5.
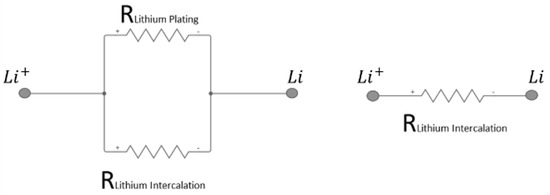
Figure 5.
Electrical analogy representing the competition of Lithium plating with the intercalation phenomenon.
In this sense, the potential value that corresponds to a point on the internal resistance Vs SoC diagram before the plating zone was chosen as cut-off voltage value.
To be conservative and work in plating-free conditions, the cell potential associated with a SoC value lower than ~10% of the corresponding plating zone SoC was selected.
2.3. Definition of Multi-Stage Constant-Current Profiles
The results obtained from three-electrode cell potential measurements (Section 2.1) and from internal resistance evolution monitoring (Section 2.2) were used to define the cut-off voltages (Figure 6a) and the current limits (Figure 6b) useful for the realization of the following Direct-Current Fast-Charging (DCFC) profiles:
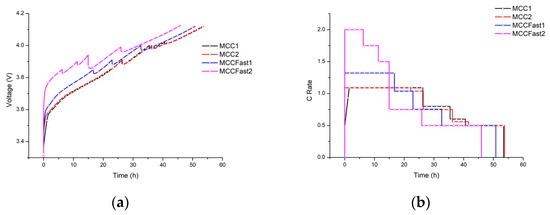
Figure 6.
(a) Voltage Responses Profiles and (b) Fast-Charge current profiles.
- MCC1
- MCC2
- MCCFast1
- MCCFast2
The four profiles were compared to a reference profile, composed of a double step charge up to 4.092 V. All the developed profiles led to the same normalized charged capacity (see Figure 7).
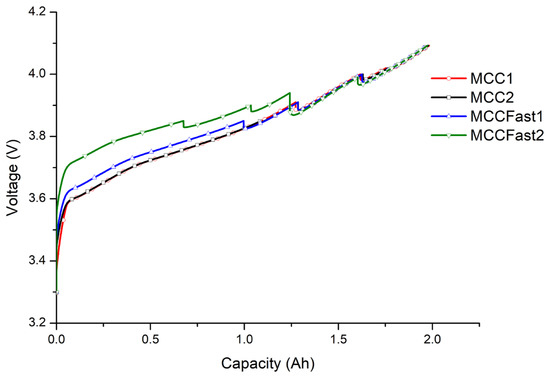
Figure 7.
Voltage as a function of charged capacity for the MCC developed profiles.
The methodology described in Section 2.2, if compared with that described in Section 2.1, is easier to be performed, since it does not require specific instrumentation. Indeed, one of the aims of the present study was to investigate this technique.
2.3.1. MCC1
Starting from the results obtained for the three-electrode cell (EL-Cell), a Multi-Stage Constant-Current (MCC) profile was created. The internal resistance of the EL-Cell was considered as the worst case, due to the dismantling and reassembling operations (see Section 2.1) performed. The cut-off voltages used for the cycling of the commercial cell were selected by overestimating the cut-off voltage of the first charging step by 1.5%. An initial current ramp was introduced to guarantee smooth current and voltage increases (Table 3). The measurement of the internal resistance (Section 2.2) was used as an additional information to fix the cutoff voltages.
Table 3.
Summary of the four MCC profiles.
2.3.2. MCC2
In this case, the results obtained from the three-electrode cell were used to determine cut-off voltages and current limits. In comparison with MCC1, the initial current ramp was deleted. The cut-off voltage of the first step was decreased to 3.850 V (against 3.910 V of MCC1), a second step was added, and the current in the third step was reduced from 0.600 C (MCC1) to 0.560 (see Table 3). Internal resistance measurements (Section 2.2) were used for a redundancy check on cut-off voltages.
2.3.3. MCC Fast1
This profile was developed with the aim of reducing the charging time, maintaining a comparable capacity retention during cycle aging, with respect to the reference profile. The development of this profile was performed using the data obtained by the EL-Cell configuration (Section 2.1), crosschecking data coming from internal resistance values (Section 2.2). Here, there was an initial charge of 1.32 C, maintaining the same cut-off voltage used for the first step in MCC2 (see the remaining steps result overlapped to those of the MCC2).
2.3.4. MCC Fast2
To develop the MCC Fast2 profile, the MCC Fast1 (4.3.2) concept was pushed to its limits (in terms of charging current). To design that profile, the data from the internal resistance evolution monitoring were used (Section 2.2). Since this test was performed directly on the commercial cell, the degradation effects due to the operations caused by the assembling of the EL-Cell were absents, and the obtained data permitted the creation of a faster profile. Also in this case, a double check with the EL-Cell was performed.
2.4. Cycle Aging Evaluation Test
To test the profiles described above, an aging protocol was defined, and the cells were aged for 300 cycles. This limited number of cycles, even if not sufficient to age the cells up to the end of their life, is sufficiently high to highlight the differences among the charging profiles selected for the study.
The aging program started with a preliminary measurement of the cell capacity, used as reference for the following comparisons.
The aging protocol was composed of several charging–discharging cycles structured as reported below:
- charging: performed by applying for each cell, one of the profiles described above;
- rest: each charging phase was followed by a resting time (30 min);
- discharging: at the end of the resting time, the cell discharge started at 1 C up to a voltage value equal to 2.98 V;
- rest: the discharging phase was followed by a resting time (30 min);
The aging loop was repeated 4 times, for a total of 300 charging-discharging cycles, described in detail above. During the aging loop (cycle life), a capacity check was performed, in order to control the SoH (State of Health). For these tests, 3 cells for each profile were tested. The results were rather reproducible, and the standard deviation was 0.075.
The capacity check used was based on standard charge CCCV and CC discharge protocols (repeated twice) as follow:
- CC–CV charge C/2 up to 4.2 V (CV step with an exit condition I < C/100);
- CC discharge at the expected 1 C down to 2.5 V;
The selected discharging rate (1 C) does not represent a significant stress for a generic high-energy-density Li-ion cell. In any case, since the discharging procedure was common to all the tested cells, it was possible to assume a comparable aging effect, with consequent possibility to compare the test results reciprocally.
Figure 8 shows the alternance of the capacity check performed every aging loop (75 cycles of charge/discharge), useful for a constant check on the aging behavior.
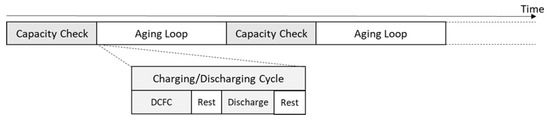
Figure 8.
Charge/Discharge aging.
It is also possible to appreciate the charge/discharge cycle scheme.
3. Results
Figure 9a shows the results obtained from the test performed in a full cell (EL-Cell) with a three-electrode configuration (see Section 2.1). Several cells were charged with C-rates up to 1.32 C, showing good performance in terms of voltage stability. The C-rate values were estimated at the end of the test based on 9 mAh, as the average capacity. Figure 9a reports the full-cell potential until the electric potential of the anode (Si–Graphite) falls below that of a Li/Li+ reference electrode; Figure 9b shows the complementary behavior of the anodic half-cell.
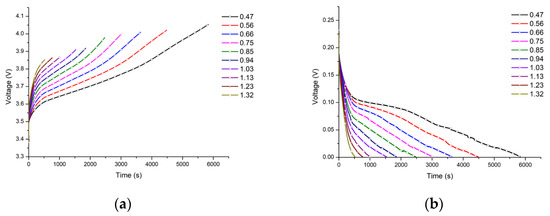
Figure 9.
(a) Full-cell voltage; (b) Anodic half-cell voltage at several C Rates (response versus Li/Li+).
Figure 10 reports the evolution of the internal resistance of the full cell (see Section 2.2) during the charging phase, at different C-Rates, as a function of the increment of the State of Charge (SoC).
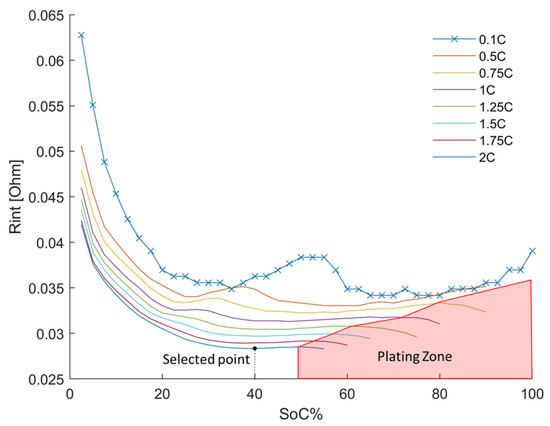
Figure 10.
Internal resistance as a function of SoC during charging at several C-Rates. Crosses in 0.1 C line represents the frequency of data points for all measurements.
The internal resistance behavior at 0.1 C was considered as a reference (blue curve on the top), since no plating was expected at a very low C-Rate. With respect to the 0.1 C curve, with the increase of the C-Rate, the curves underwent a shift to the left, due to the occurrence of higher overpotentials, mainly caused by diffusion processes.
Starting from 0.75 C (yellow curve) it is possible to see a decrease of the internal resistance at high SoC values (red zone), which was not observed at 0.1 C and 0.5 C C-Rates. This behavior can be ascribed to the beginning of the plating phenomenon, as reported in [28] and already discussed in Section 2.2.
On the basis of the obtained results, it was possible to create several fast-charging profiles, as discussed in Section 2.1 and Section 2.2.
As expected, the evaluation of electrode potential measured in a three-electrode cell against a Li/Li+ pseudo-reference electrode methodology revealed to be a useful technique for detecting plating evolution at the anode.
The evaluation of the evolution of the internal resistance during the charge process also resulted to be an interesting test, since it is directly applicable to the cell, without needing a complete tear down of the cell, reason why it could be of high interest in the automotive industry.
The results obtained from the aging test (see Section 2.4) performed with different charging profiles are reported in Figure 11. Here, the capacity values are expressed as SoH percentage and calculated as follow:
where is the capacity measured in the i-th check, while is the capacity estimated in the first characterization.
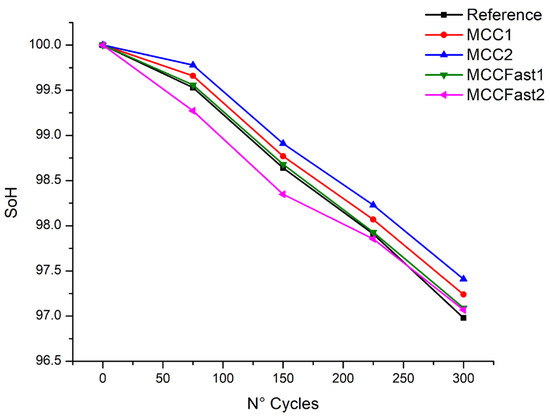
Figure 11.
SoH as a function of the number of cycles for different charging profiles.
Among the tested charging profiles, the best result in terms of aging were obtained with MCC2, with a concurrent reduction of the charging time (3 min) in comparison with the Reference.
The MCC1 profile presented an intermediate aging trend, if compared with the Reference, and the MCC2 showed again a reduction of the charging time (3 min) with respect to the Reference.
The MCC Fast1 presented an overall aging comparable with that of the Reference, but with a significant gain in terms of time (6 min). Finally, the MCC Fast2, after an initial capacity fade in comparison with the other profiles, showed an upswing, and its SoH value, after 300 cycles, was comparable to that of the MCC Fast1.
Figure 12 reports, as an example, the charge and discharge capacities recorded during the aging step 1 (75 cycles). It can be observed that the MCC2 and the charging profile provided, among all tested profiles, the highest charge–discharge capacity during the execution of each aging step.
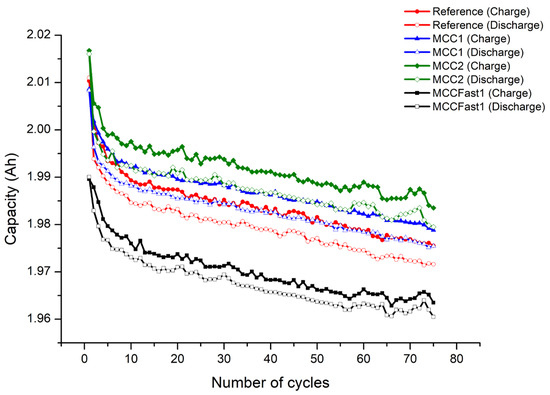
Figure 12.
Charged–Discharged capacity as a function of the cycle number during the first cycle aging step (75 cycles).
4. Conclusions
Two different methodologies were used to determine the operating limits in terms of current and voltage, to be respected so to avoid the deposition of metallic Lithium on the anode surface of a Li-ion cell.
- Evaluation of electrode potential as a function of time, measured in a three-electrode cell (EL-Cell) against a Li/Li+ pseudo-reference electrode (described in Section 2.1)
- -
- Pros: consolidated method based on well-known electrochemical principles; precise check on electrode potential (i.e., anode vs. Li).
- -
- Cons: complex preparative procedure and need of specific facilities (i.e., Glove box with argon flux); risk of degradation for the electrodes during the dismantling of the cell.
- Evaluation of the evolution as a function of time of the internal resistance during the charge process (described in Section 2.2)
- -
- Pros: no complex preparative procedure and no need of specific facilities; no risk of degradation for the electrodes, since no dismantling operation is necessary; fast check on plating evolution; easy to be applied to a high number of samples.
- -
- Cons: further investigation required, above all, on cells with higher capacities and different anode chemistry.
The developed profiles led to:
- reduction of charging time,
- improvement of capacity retention for MCC1, MCC2, MCC Fast1 (best result obtained with MCC2).
The MCC Fast2, due to the different aging behavior, deserves a special further investigation that will be carried out in a future study.
Moreover, further understanding of the cells’ conditions will be obtained through post-mortem analysis of the cells at the end of life (EoL) to collect information about the plating phenomenon. In the imminent future, a function dedicated to the adaptation of the charging profiles to the cell State of Heath will be developed. This will be useful for rescaling the electrical parameters while considering the aging of the cell.
Author Contributions
Conceptualization, M.D. and E.M.; Data curation, M.D., M.E., M.G., and R.R.; Supervision, C.N., M.B., M.E., and M.F.S.; Visualization, C.N. and M.B.; Writing–original draft, M.D. and M.E.; Writing–review & editing, M.B. and M.F.S. All authors have read and agreed to the published version of the manuscript.
Funding
This research received no external funding.
Institutional Review Board Statement
Not applicable.
Informed Consent Statement
Not applicable.
Data Availability Statement
Not applicable.
Conflicts of Interest
The authors declare no conflict of interest.
References
- Scrosati, B.; Garche, J. Lithium batteries: Status, prospects and future. J. Power Sources 2010, 195, 2419–2430. [Google Scholar] [CrossRef]
- Pollet, B.G.; Staffell, I.; Shang, J.L. Current status of hybrid, battery and fuel cell electric vehicles: From electrochemistry to market prospects. Electrochim. Acta 2012, 84, 235–249. [Google Scholar] [CrossRef]
- Pelegov, D.V.; Pontes, J. Main Drivers of Battery Industry Changes: Electric Vehicles—A Market Overview. Batteries 2018, 4, 65. [Google Scholar] [CrossRef] [Green Version]
- Pevec, D.; Babic, J.; Carvalho, A.; Ghiassi-Farrokhfal, Y.; Ketter, W.; Podobnik, V. A survey-based assessment of how existing and potential electric vehicle owners perceive range anxiety. J. Clean. Prod. 2020, 276, 122779. [Google Scholar] [CrossRef]
- Manthiram, A. Materials for High-energy Density Batteries. In Energy Harvesting Technologies; Springer: Boston, MA, USA, 2009; pp. 365–385. [Google Scholar]
- Cui, Z.; Xie, Q.; Manthiram, A. Zinc-Doped High-Nickel, Low-Cobalt Layered Oxide Cathodes for High-Energy-Density Lithium-Ion Batteries. ACS Appl. Mater. Interfaces 2021, 9, 15324–15332. [Google Scholar] [CrossRef] [PubMed]
- Namsar, O. Improved electrochemical performance of anode materials for high energy density lithium-ion batteries through Sn(SnO2)–SiO2/graphene-based nanocomposites prepared by a facile and low-cost approach. Sustain. Energy Fuels 2020, 12, 4625–4636. [Google Scholar] [CrossRef]
- Rajagopalan, S.; Maitra, A.; Halliwell, J.; Davis, M.; Duvall, M. Fast Charging: An In-Depth Look at Market Penetration, Charging Characteristics, and Advanced Technologies. In Proceedings of the 2013 World Electric Vehicle Symposium and Exhibition (EVS27), Barcelona, Spain, 17–20 November 2013; pp. 1–11. [Google Scholar]
- Tomaszewska, A.; Chu, Z.; Feng, X.; O’Kane, S.; Liu, X.; Chen, J.; Ji, C.; Endler, E.; Li, R.; Liu, L.; et al. Lithium-ion battery fast charging: A review. eTransportation 2019, 1, 100011. [Google Scholar] [CrossRef]
- Liu, Y.-H.; Luo, Y.-F. Search for an Optimal Rapid-Charging Pattern for Li-Ion Batteries Using the Taguchi Approach. IEEE Trans. Ind. Electron. 2010, 57, 3963–3971. [Google Scholar] [CrossRef]
- Waldmann, T.; Kasper, M.; Wohlfahrt-Mehrens, M. Optimization of Charging Strategy by Prevention of Lithium Deposition on Anodes in high-energy Lithium-ion Batteries–Electrochemical Experiments. Electrochim. Acta 2015, 178, 525–532. [Google Scholar] [CrossRef]
- Abdel Monem, M.; Trad, K.; Omar, N.; Hegazy, O.; Mantels, B.; Mulder, G.; Van den Bossche, P.; Van Mierlo, J. Lithium-ion batteries: Evaluation study of different charging methodologies based on aging process. Appl. Energy 2015, 152, 143–155. [Google Scholar] [CrossRef]
- Monem, M.A.; Trad, K.; Omar, N.; Hegazy, O.; Mantels, B. A Comparative Study of Different Fast Charging methodologies for Lithium-Ion Batteries Based on Aging Process. Available online: https://www.researchgate.net/publication/276057968_A_comparative_study_of_different_fast_charging_methodologies_for_lithium-ion_batteries_based_on_aging_process (accessed on 18 May 2021).
- Keil, P. Charging protocols for lithium-ion batteries and their impact on cycle life—An experimental study with different 18650 high-power cells. J. Energy Storage 2016, 17, 125–141. [Google Scholar] [CrossRef]
- Li, J.; Murphy, E.; Winnick, J.; Kohl, P.A. The effects of pulse charging on cycling characteristics of commercial lithium-ion batteries. J. Power Sources 2001, 102, 302–309. [Google Scholar] [CrossRef]
- Cho, I.-H.; Lee, P.-Y.; Kim, J.-H. Analysis of the Effect of the Variable Charging Current Control Method on Cycle Life of Li-ion Batteries. Energies 2019, 12, 3023. [Google Scholar] [CrossRef] [Green Version]
- Zhou, W. Effects of external mechanical loading on stress generation during lithiation in Li-ion battery electrodes. Electrochim. Acta 2015, 185, 28–33. [Google Scholar] [CrossRef] [Green Version]
- Christensen, J.; Newman, J. A Mathematical Model of Stress Generation and Fracture in Lithium Manganese Oxide. J. Electrochem. Soc. 2006, 153, A1019. [Google Scholar] [CrossRef]
- Zhou, W.; Hao, F.; Fang, D. The effects of elastic stiffening on the evolution of the stress field within a spherical electrode particle of lithium-ion batteries. Int. J. Appl. Mech. 2013, 5, 1350040. [Google Scholar] [CrossRef]
- Guo, Z.; Zhu, J.; Feng, J.; Du, S. Direct in situ observation and explanation of lithium dendrite of commercial graphite electrodes. RSC Adv. 2015, 5, 69514–69521. [Google Scholar] [CrossRef]
- Petzl, M.; Kasper, M.; Danzer, M.A. Lithium plating in a commercial lithium-ion battery–A low-temperature aging study. J. Power Sources 2015, 275, 799–807. [Google Scholar] [CrossRef]
- von Lüders, C.; Zinth, V.; Erhard, S.V.; Osswald, P.J.; Hofmann, M.; Gilles, R.; Jossen, A. Lithium plating in lithium-ion batteries investigated by voltage relaxation and in situ neutron diffraction. J. Power Sources 2017, 342, 17–23. [Google Scholar] [CrossRef]
- Campbell, I.D.; Marzook, M.; Marinescu, M.; Offer, G.J. How Observable Is Lithium Plating? Differential Voltage Analysis to Identify and Quantify Lithium Plating Following Fast Charging of Cold Lithium-Ion Batteries. J. Electrochem. Soc. 2019, 166, A725–A739. [Google Scholar] [CrossRef]
- Bloom, I.; Christophersen, J.; Gering, K. Differential voltage analyses of high-power lithium-ion cells. J. Power Sources 2005, 139, 304–313. [Google Scholar] [CrossRef]
- Vetter, J.; Novák, P.; Wagner, M.R.; Veit, C.; Möller, K.-C.; Besenhard, J.O.; Winter, M.; Wohlfahrt-Mehrens, M.; Vogler, C.; Hammouche, A. Ageing mechanisms in lithium-ion batteries. J. Power Sources 2005, 147, 269–281. [Google Scholar] [CrossRef]
- Rangarajan, S.P.; Barsukov, Y.; Mukherjee, P.P. Anode potential controlled charging prevents lithium plating. J. Mater. Chem. A 2020, 8, 13077–13085. [Google Scholar] [CrossRef]
- Ahmed, S.; Bloom, I.; Jansen, A.N.; Tanim, T.; Dufek, E.J.; Pesaran, A.; Burnham, A.; Carlson, R.B.; Dias, F.; Hardy, K.; et al. Enabling fast charging—A battery technology gap assessment. J. Power Sources 2017, 367, 250–262. [Google Scholar] [CrossRef]
- Koleti, U.R.; Dinh, T.Q.; Marco, J. A new on-line method for lithium plating detection in lithium-ion batteries. J. Power Sources 2020, 451, 227798. [Google Scholar] [CrossRef]
- Bitzer, B.; Gruhle, A. A new method for detecting lithium plating by measuring the cell thickness. J. Power Sources 2014, 262, 297–302. [Google Scholar] [CrossRef]


Publisher’s Note: MDPI stays neutral with regard to jurisdictional claims in published maps and institutional affiliations. |
© 2021 by the authors. Licensee MDPI, Basel, Switzerland. This article is an open access article distributed under the terms and conditions of the Creative Commons Attribution (CC BY) license (https://creativecommons.org/licenses/by/4.0/).