1. Introduction
The mechanical properties of commercial Li-ion cells are increasingly coming into focus, especially considering the steadily growing requirements. Higher energy and power densities, less space consumption, and longer service life—these are the challenges that need to be overcome. However, many promising material combinations are limited by their mechanical properties or are not suitable for real applications. For example, silicon has a significantly higher energy density and specific capacity (
[
1]) than graphite (
[
1]), is available in sufficient quantities in nature, and is reasonably priced [
1,
2]. However, the volume change of
compared to the initial volume due to lithium intercalation is problematic. This can lead to cracking in the lattice structure and thus to delamination of the active material from the current collector [
3], which leads to a faster aging. For this reason, an alloy or a compound of different materials is usually used to combine the most favorable properties [
1,
2,
3,
4,
5].
In order to understand which underlying mechanical processes take place inside the battery cell, suitable measurement methods are necessary for recording and analyzing parameters such as electrode thickness and volume change of the cell components. Various methods of measuring electrode thickness have already been implemented and show a volume change of electrode materials and battery cells caused by the intercalation and deintercalation of Li-ions [
6,
7,
8,
9]. Depending on the material, the electrodes expand differently with lithium migration. Compared to silicon, graphite as an anode material is significantly inferior when considering the specific capacity, but it expands only up to
[
6,
7,
10] of the initial volume during lithiation and delithiation and thus exerts significantly less mechanical pressure on the cell components. Cathode materials, metal oxides frequently, also show a volume change due to lithiation and delithiation. In this process, Nickel Cobalt Manganese Oxide (NCM) expands by up to
[
7,
8,
10] and Nickel Cobalt Aluminium Oxide (NCA) by up to
[
10] of the initial volume.
Other factors influencing the cell volume are the Solid Electrolyte Interface (SEI) layer thickness growth due to electrolyte decomposition products forming a covering layer on the electrodes [
11,
12] and Li-plating (especially for Lithium Metal cells) [
8,
11]. These effects lead to a reduction in volume due to irreversible layer thickness growth and, together with the gassing that takes place due to side reactions [
13,
14], leads to an increase in pressure inside the cell on the housing, resulting in a measurable change of the cell thickness. This was measured using dilatometry [
7,
8], imaging techniques such as computed tomography [
6] and neutron imaging [
15], or strain gauges glued to the cells [
9], among other methods. In some cases, besides reversible expansion due to the migration of lithium ions, irreversible expansion was also shown, which also correlates with the loss of cyclizable lithium.
In addition, measurement of the internal gas pressure has already been realized for different cell formats [
13,
14,
16]. Aiken et al. [
13] performed tests according to the Archimedes principle on clamped and unclamped pouch cells and demonstrated reversible volume expansion as a function of SoC for initial cycling of battery cells with different electrolytes. In unstrained cells, the volume change built up via charge could be dissipated upon discharge and was thus almost completely reversible. In the case of clamped cells, the pressure no longer decreased completely, since the gas collects on the outer sides of the electrode stack due to the static pressure caused by the clamping. The results obtained from the measurements suggest that, depending on the electrolyte, reversible gas formation is also possible, with the gas formed as the reactant in the chemical reactions taking place. Schmitt et al. [
14] showed for the first time that internal gas pressure measurement is possible with commercial pressure sensors on large-sized cells. The results show that during formation the gas pressure in the cell increases irreversibly. Afterwards, a clear SoC dependence can be seen, from which a correlation between the expansion and the graphite stages (pressure increase correlates with the calculated volume change due to lithiation of the graphite and stagnates with restructuring of the crystal lattice) can also be established. Schmitt et al. [
14] also showed the irreversible increase in internal gas pressure with decreasing State of Health (SoH). This is also evident in work by Schiele et al. [
16], which shows an irreversible increase of internal pressure with increasing number of cycles because of gas evolution attributed to the thermal decomposition of the conducting salt LiPF
6 using a multichannel in situ pressure measurement system.
While measurable changes in cell thickness are obvious for pouch cells, having a flexible aluminum composite foil housing, reversible, and irreversible cell thickness growth can also be observed for cylindrical cells, although to a much lesser extent due to the rigid housing [
9]. Considering all mentioned effects and investigations, as well as due to the rigid housing and the cylindricity of the commercial cylindrical battery cells, the assumption of a homogeneous expansion of the battery cell over the entire surface is reasonable. The irreversible cell thickness growth due to the mentioned causes and the increase of the internal gas pressure due to side reactions would thus have to lead to an increasing load on the cell housing.
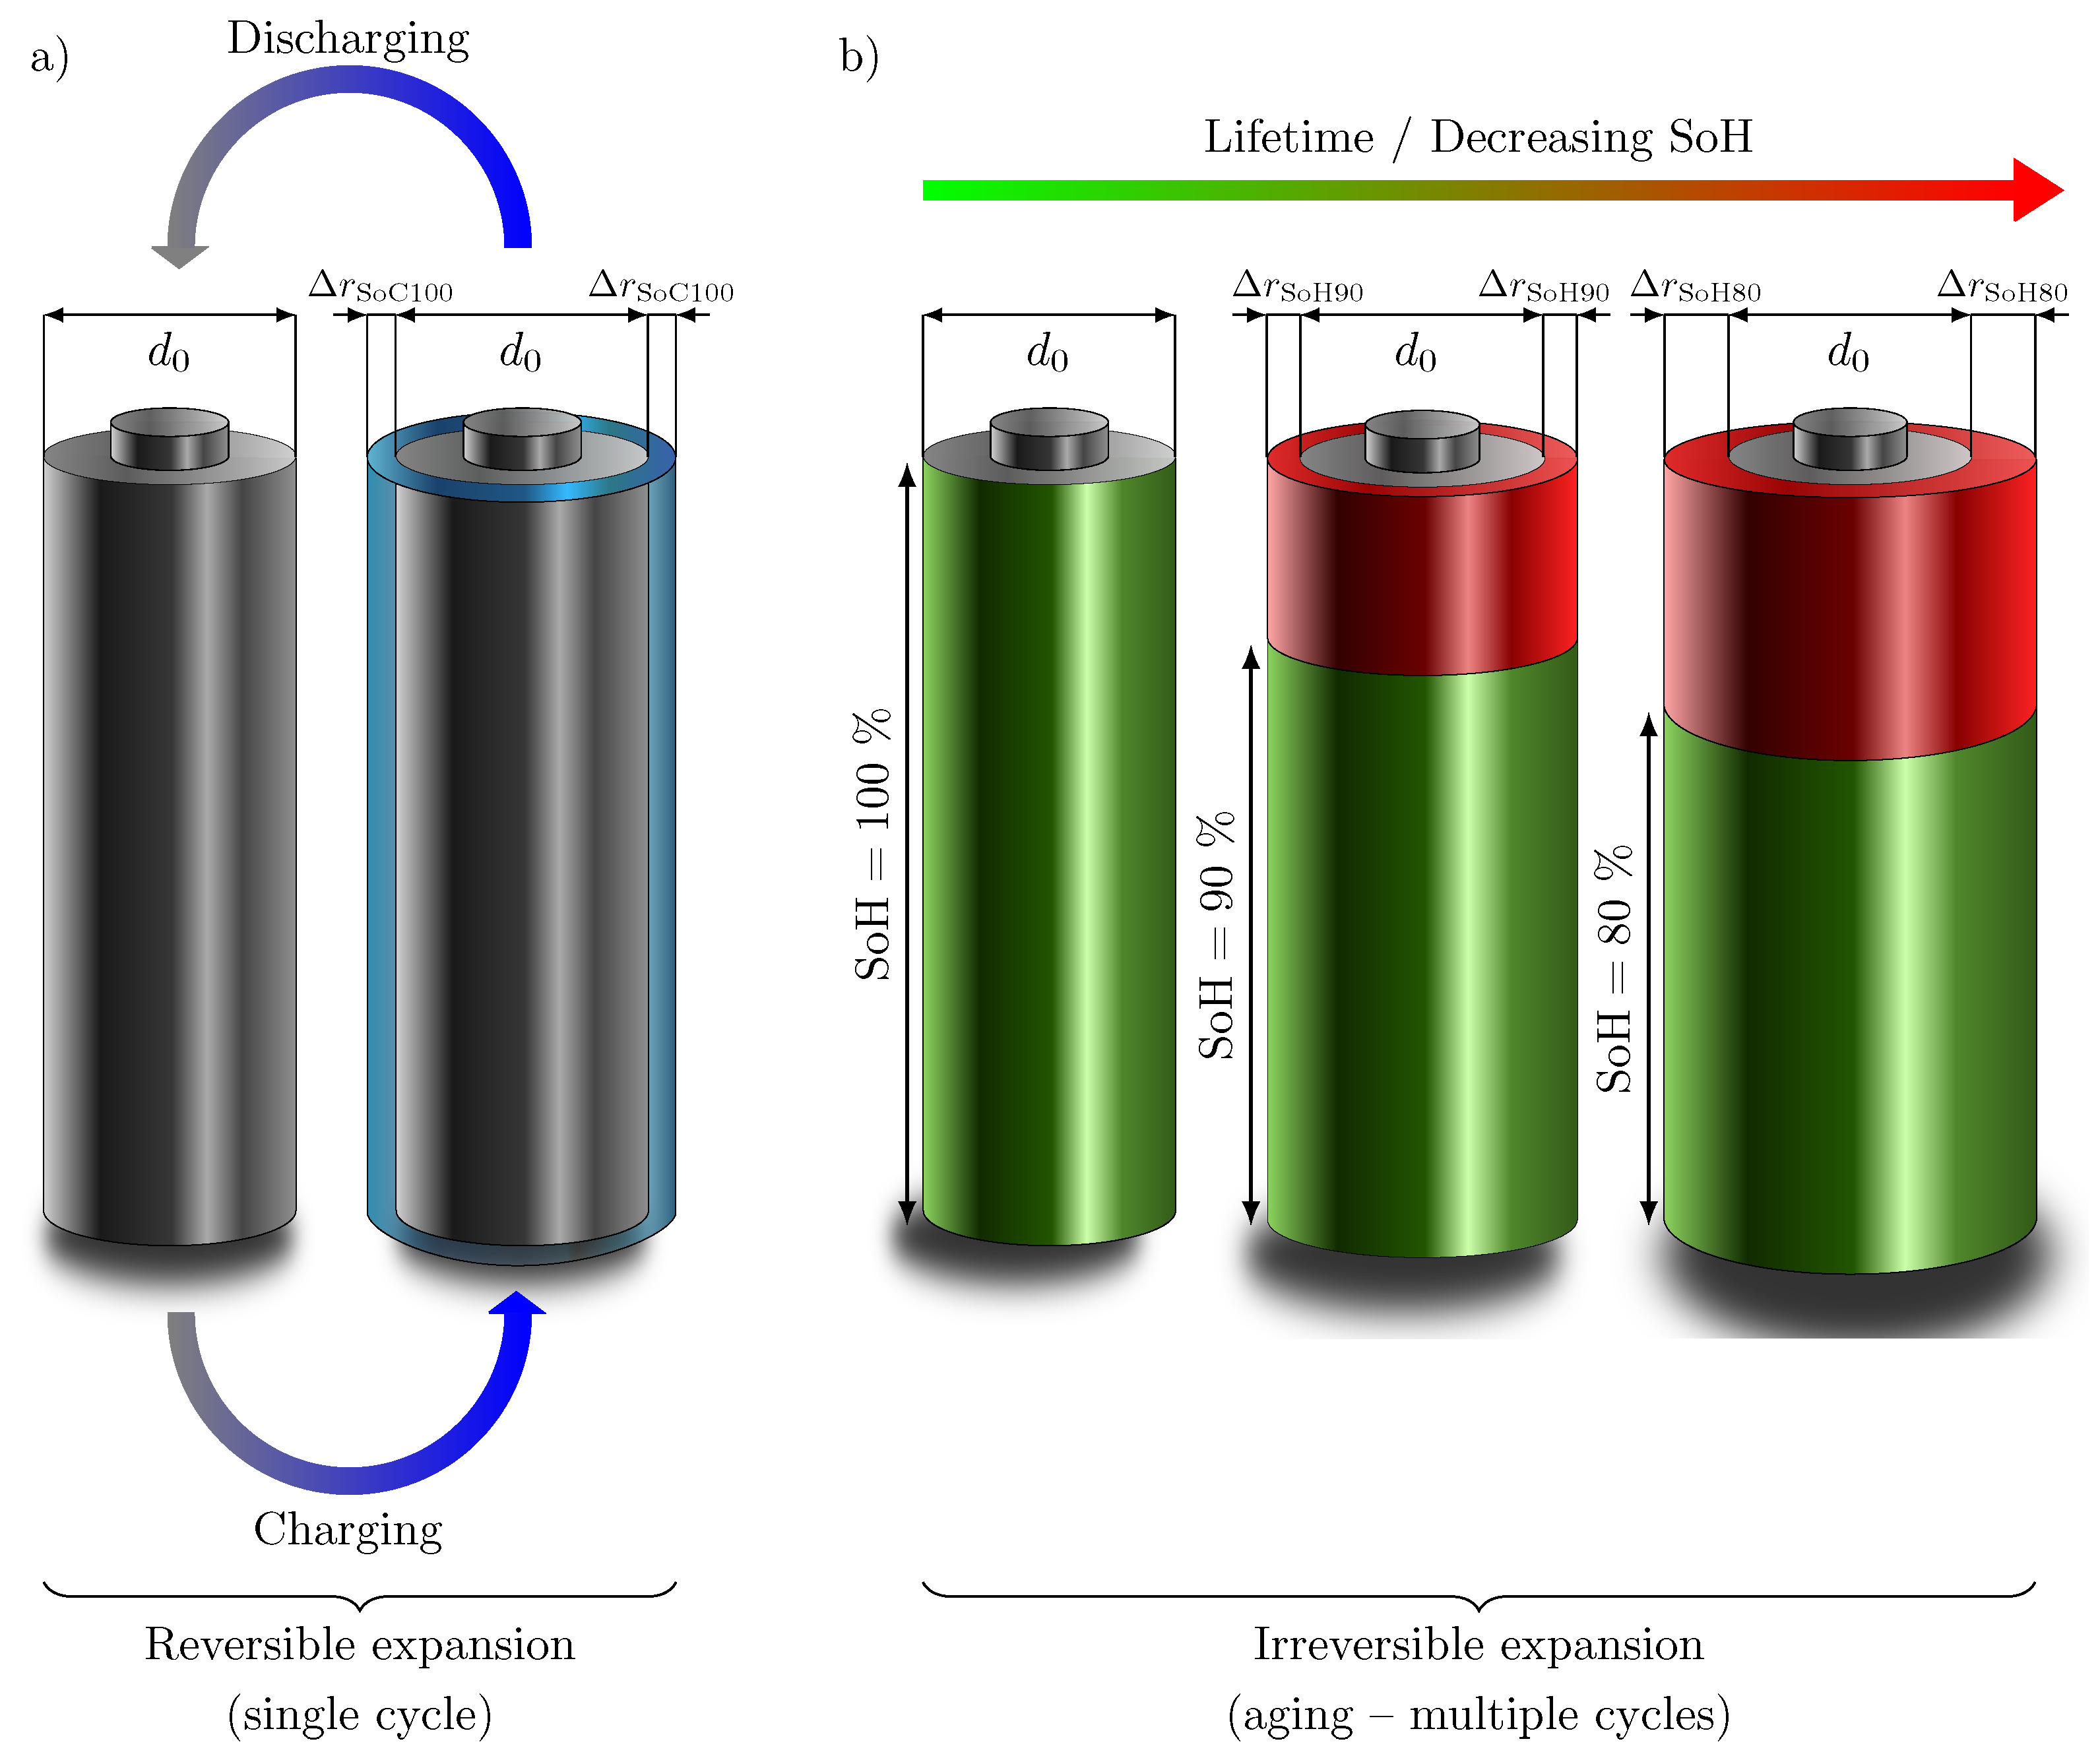
Figure 1a schematically shows the assumed cell thickness growth of a cylindrical cell with increasing SoC as a result of the lithiation of the anode, which expands much more than the cathode. The increase in the radius of the cell is shown in blue. During discharge, the cell completely returns to its original shape as the lithium delithiates completely from the graphite. In
Figure 1b, the assumed cell thickness growth of the cylindrical battery cell with decreasing SoH (marked in green) is visualized. The red area marks the aging, which increases with higher number of cycles over lifetime. The increase in battery cell radius
is directly related on the residual capacity, as already proven by Willenberg et al. [
9]. Thus, by correlating with the SoC and the SoH, a state variable estimation can also be attempted by measuring the battery cell thickness change. However, a requirement for this is the uniform expansion of the battery cell over the entire circumference.
The central question of this work was whether the cell really expands uniformly as expected. Both manufacturing and geometric variables are important here – the position and thickness of the current collector tabs that connects the electrodes, the number of layers of electrodes, and the position in the housing. How these influence and what difficulties can arise in measuring battery cell thickness growth are discussed below. It remains to be tested whether cell thickness growth can be used for cell state estimation.
2. Materials and Methods
The study of battery cell thickness growth is performed on a commercial cylindrical Li-Ion cell, LG INR18650 M29. The battery cell has a positive electrode made of nickel-rich NCM active material and a negative electrode made of graphite. The specifications of the battery cell are listed in
Table 1. The battery cell has a usable voltage range of
according to the producer’s datasheet [
17].
2.1. Experimental Setup
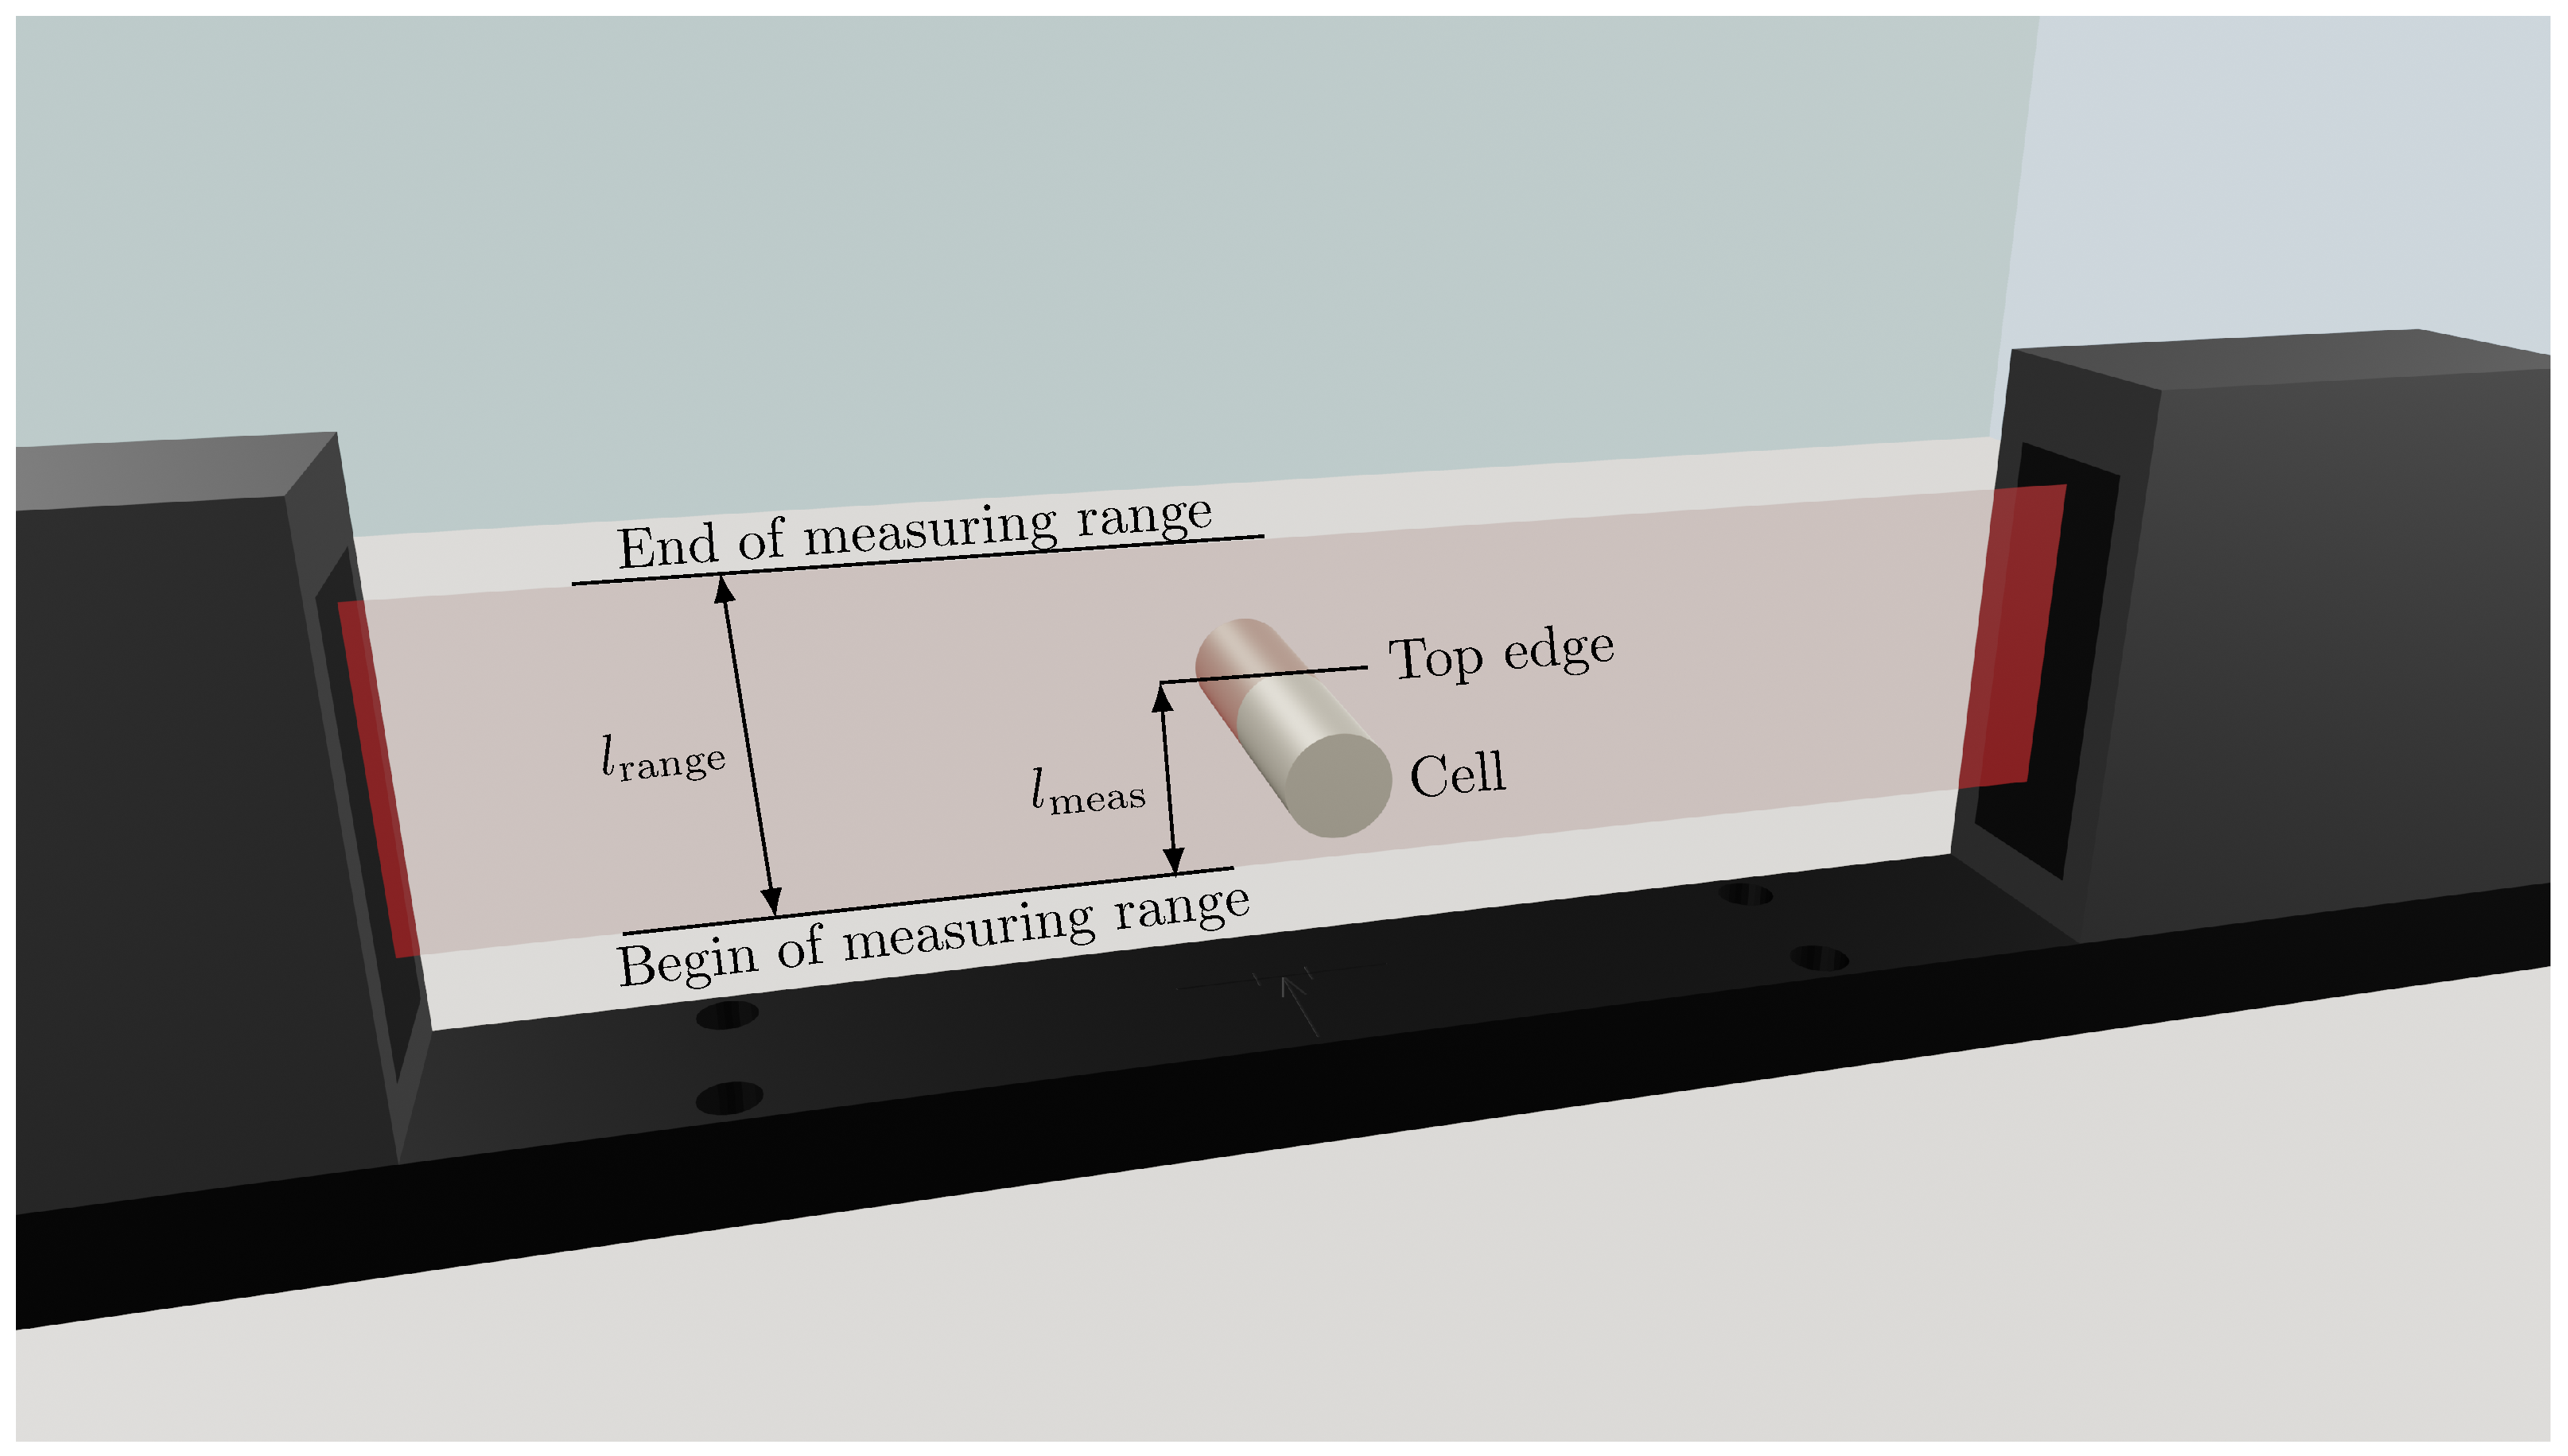
To investigate the punctual radial expansion of the LG INR18650 M29 battery cell, an optoCONTROL ODC2600 light band micrometer with a high-resolution CCD camera for measuring geometric quantities from Micro-Epsilon Messtechnik GmbH & Co. KG (Ortenburg, Germany) is used. The light band micrometer is shown schematically in
Figure 2. The measuring range (red band between laser and acquisition unit) has a total height of
. The linearity
l, i.e., the deviation between an ideal straight characteristic curve and the real characteristic curve, is max.
. The resolution
of the measurement signal is
, at a measurement rate
f of up to
. The micrometer operates on the principle of shading or light quantity measurement and thus detects the dimension and position of the object to be measured.
To examine the expansion of the battery cell, the cell is clamped at the poles in a holder for contacting so that it is free and orthogonal to the light band in the measuring area marked in red, as shown in
Figure 2. The light band micrometer has different setting modes. The transition between the shading by the cell and the adjacent light edge of the laser is used as a reference point. Either the path between the upper edge of the battery cell and the lower edge of the measuring range, or the path between the lower edge of the battery cell and the upper edge of the measuring range can be measured. As the battery cell expands, the top edge of the cell shifts, resulting in increased shading and thus increased measurable distance. In addition, the diameter of the shading through the cell or a gap between two shadings can be determined. However, this mode is not suitable for the following investigations because the expansion of one position and a contraction at the opposite position can cancel each other out. Therefore, the change of the battery cell radius is always indicated in the following. The acquisition can only be performed for one position or one diameter at a time. To examine the cell thickness growth over the entire circumference, the battery cell must be rotated manually.
2.2. Measurement Procedure
The cylindrical Li-ion battery cell is subjected to the same measurement procedure at each position around the circumference. An ACT0550 battery tester from PEC Corp. (Leuven, Belgium) is used to cycle the battery cell. The battery cell tester can provide currents up to 50 A per channel and apply a voltage of 5 V maximum. All measurements are performed in a climatic chamber of Memmert GmbH & Co. KG (Schwabach, Germany) at a temperature of . To investigate the effect of temperature, a temperature sensor PT100 is attached to the outside of the cell and connected to the battery tester.
The cell is always clamped in the cell holder with the position to be examined facing upwards. The battery cell is first fully charged with a current of
(
) and also fully discharged again with
in the voltage range of
. Charge and discharge period consist of a CC phase and a CV phase as listed in
Table 2. The termination criterion for the CV phase is when the current drops below 1/100 C, which corresponds to a current of
. For the following investigations, only this one current rate is used. Willenberg et al. [
9] showed that expansions also occur at lower current strengths. The influence of the current strength on the uniformity of the expansion has yet to be shown in subsequent work.
The cell is rotated manually by after each charge and discharge cycle and measured again. During the measurement, voltage, current, and temperature are logged with one data point per second, averaged from the last 1000 recorded values at a frequency of . After a total of 36 cycles, the individual positions can be compared with each other.
2.3. Computed Tomography
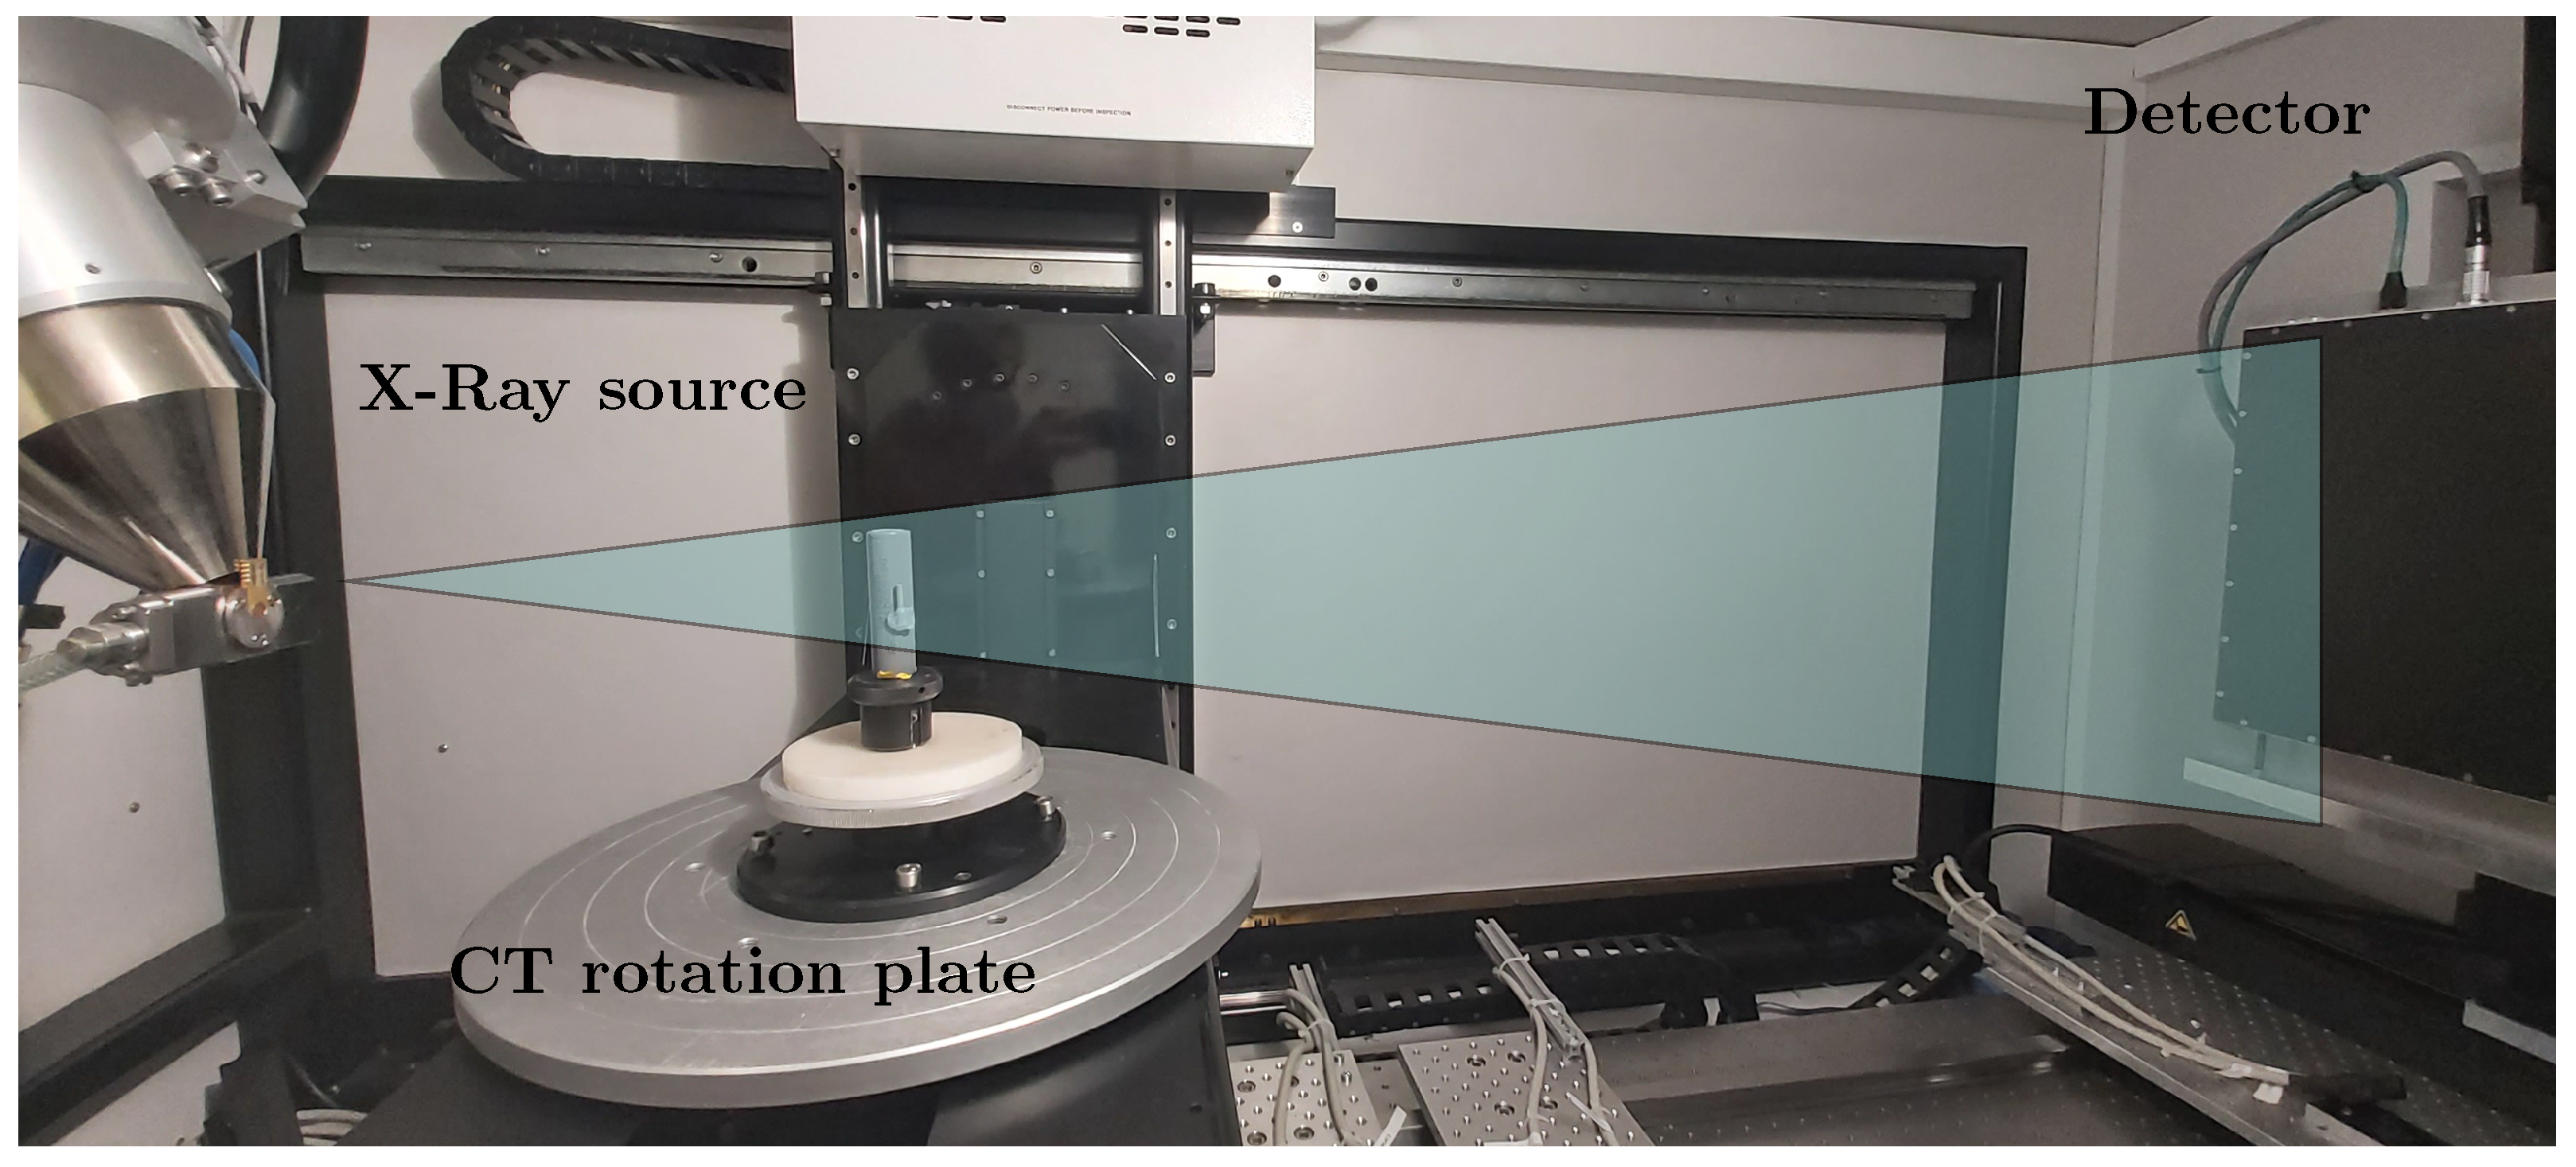
In order to verify the measurements with the light band micrometer, a 3D non-destructive measurement was needed with high spatial resolution. X-ray computed tomography is one such method with the capability of providing high resolution 3D scans of objects. The combination of non-destructive methodology and high resolution makes it apt for analyzing the non-uniform expansions of Li-ion cells. A cone-beam X-ray computed tomography is used specifically in our experiment as shown in
Figure 3. In this setup, at one end is an X-ray source radiating a cone shaped beam and on the other end there is a flat-panel X-ray detector. The object to be scanned is placed on a high precision rotation stage between the source and the detector. During the scan, the object is rotated slowly over 360° and, in this duration, several thousand 2D images called the projections are captured by the detector. This stack of 2D projections of the object to be measured is then fed into a tomographic reconstruction algorithm to generate the 3D volume of the scanned object. The resolution of the scan depends on how close the object is to the source. Like a shadow approach, the closer the object is to the source, the higher is the scan resolution; however, the field of view is smaller. If we move away from the source, we have a greater field of view but at the cost of resolution.
The Li-ion cell is scanned in two states, once with
and once with
. In both of the cases, the resolution of the 3D reconstructed volume was 10 µm. This was followed by a surface determination on the 3D volume data to determine the surface of the cell in the two states. These generated surfaces from both scans were then used to calculate the non-uniform expansion of the cell walls in 3D. In order to have an absolute co-relation between the two states, a reference metal tube was fixed to the setup, which was used to register the 3D volumes of both scans. This would ensure that there is no geometric shift or rotation influencing the measurement of the non-uniform expansion of the cells. Although CT has been used to study various effects in batteries [
9,
18,
19,
20], to the best of the author’s knowledge, a 3D non-uniform expansion of Li-ion cells measured with CT is investigated for the first time in this work.
Figure 3 shows the setup of the computed tomography for the 3D measurement of the battery cell with the source for the X-rays and the detector.
In order to be able to evaluate which local expansions belong to which geometrical influences within the cell later on also during the measurements with the light band micrometer, a picture of the cell examined in the light band micrometer was also taken with the computed tomography. In addition, the position of the anode current collector was marked on the housing of the battery cell to assign the corresponding positions.
3. Results
3.1. Position-Dependent Volume Change
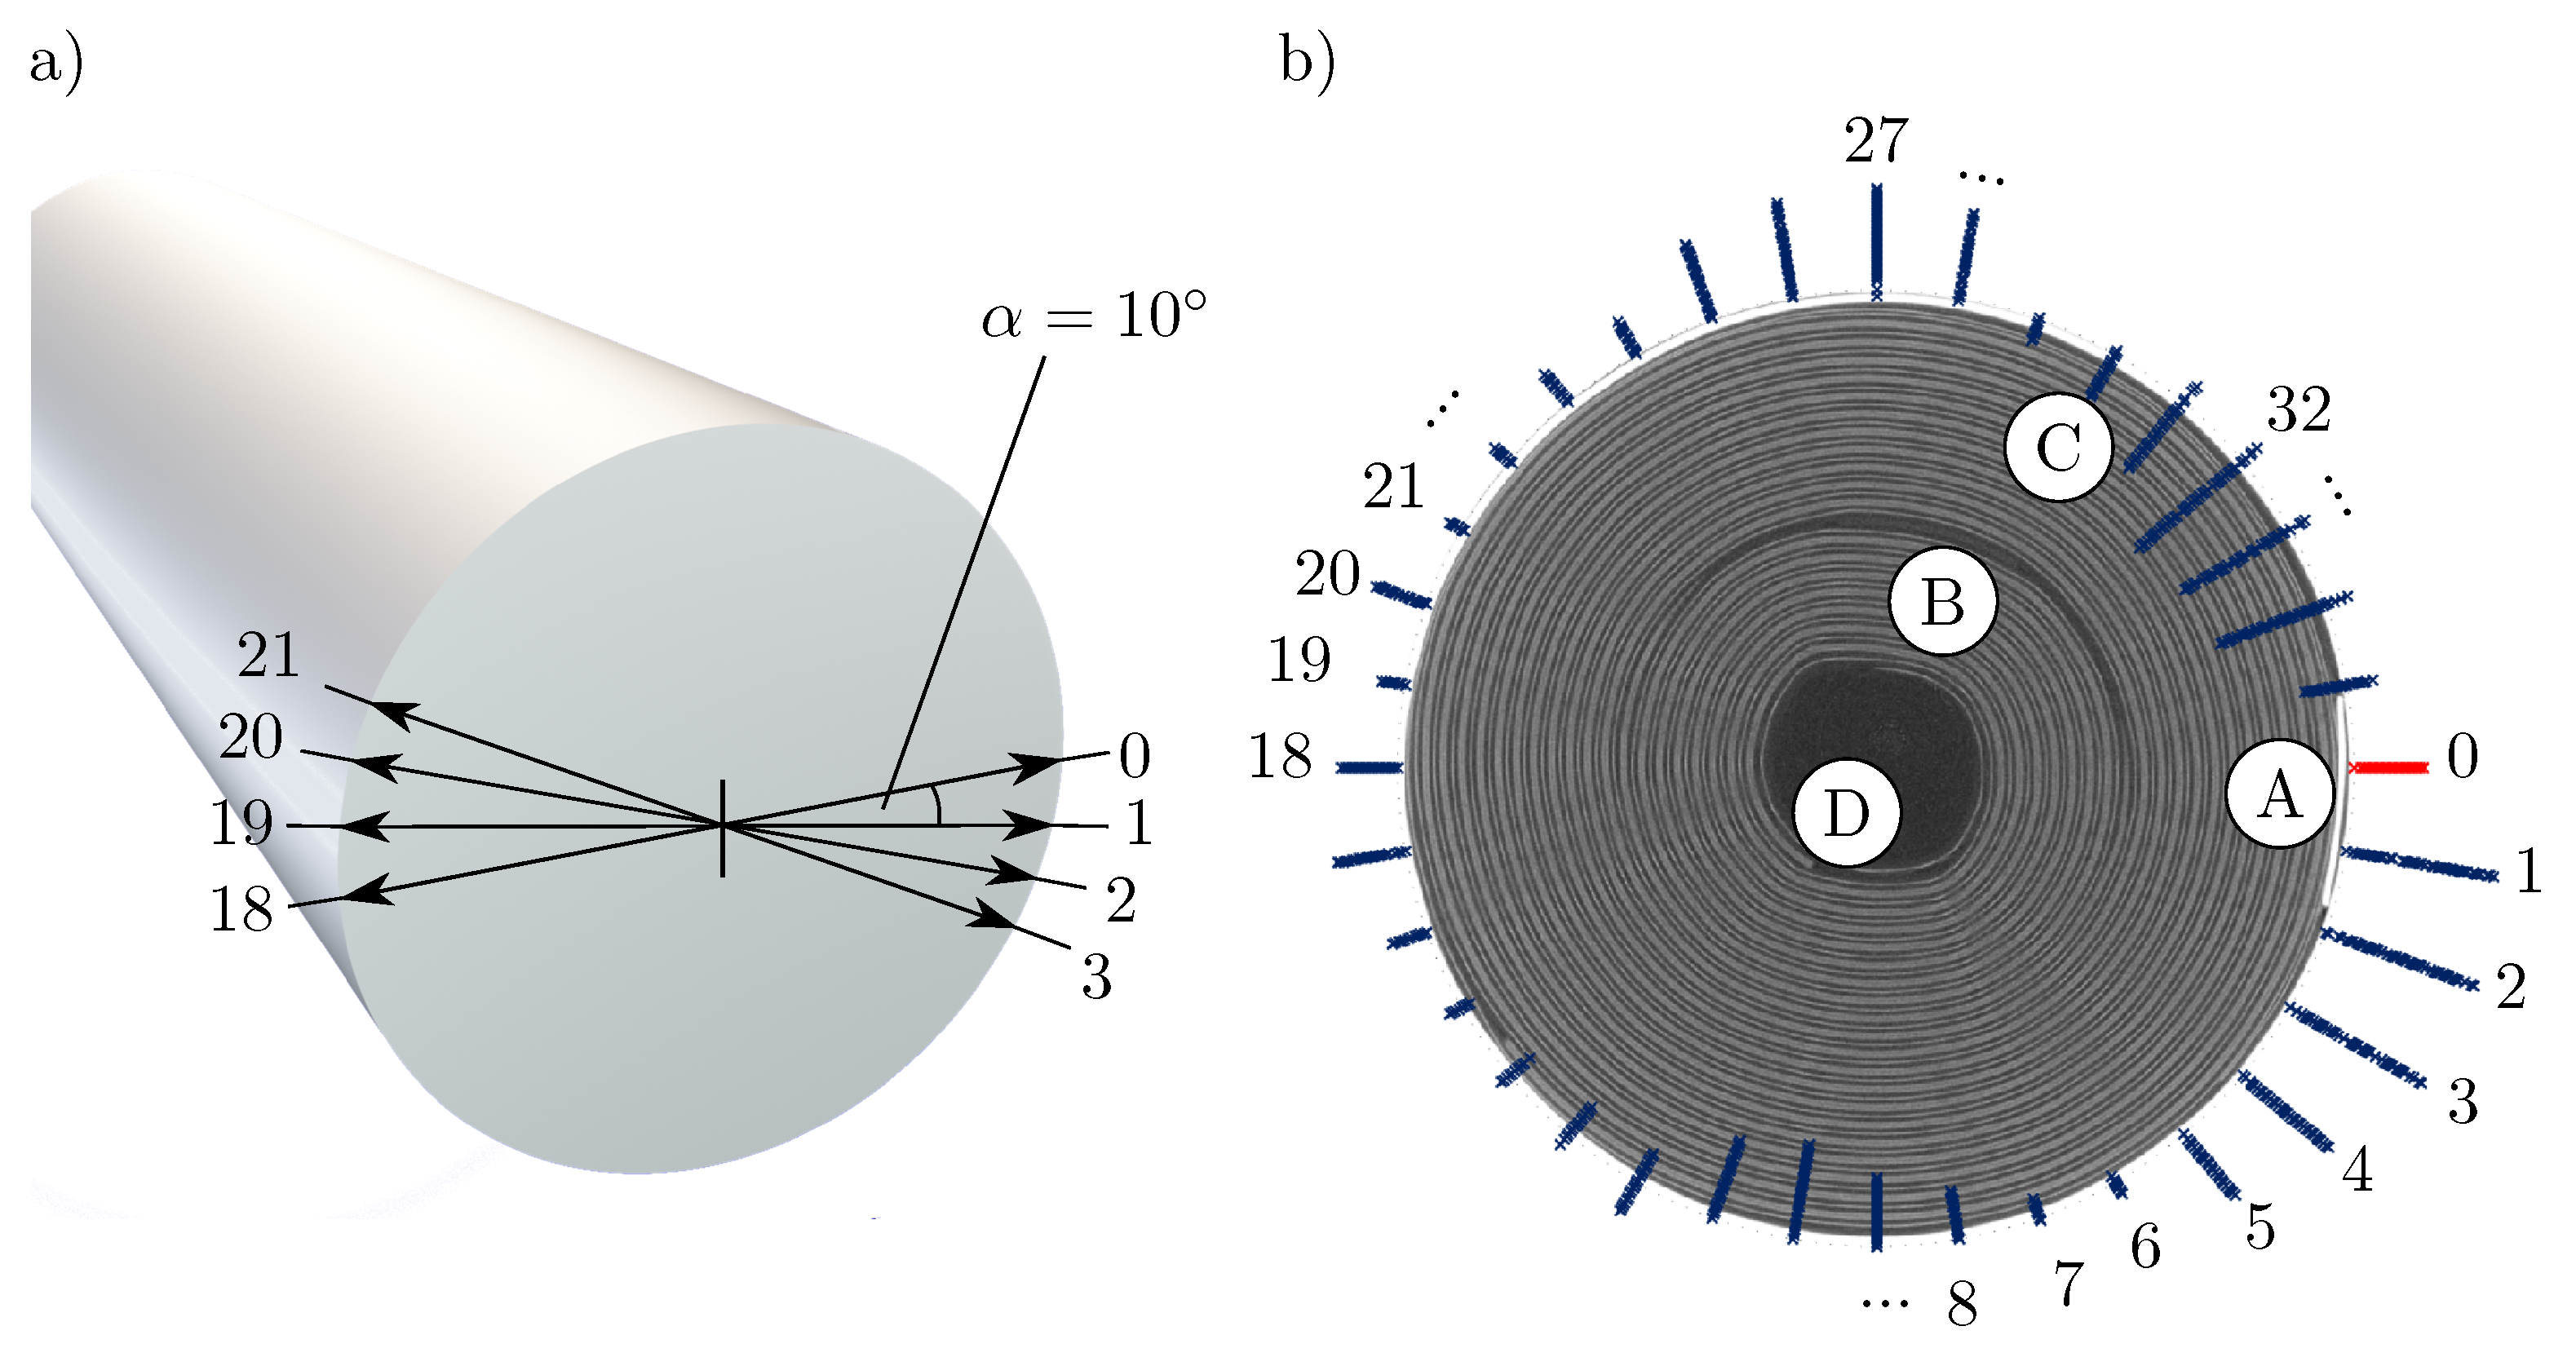
Figure 4a shows the schematic illustration of a Li-ion cell as well as the examined positions over the circumference of the cell, starting at pos. 0, where the negative current collector (marked A in
Figure 4b) is located inside the cell. Each further position is offset by
from the previous one (pos.
, pos.
).
Figure 4b shows the change of the radius of the respective position
over the circumference of the battery cell per SoC change of
amplified by a factor of 100. Between positions 0 and 5, a clear expansion of the cell is evident, which continues to flatten and reverses at position 7. The battery cell also shows significant expansion directly opposite the negative current collector tab and at the position of the positive current collector tab (marked B). The marks C (associated measurement positions: 30–35) and D (associated measurement positions: 8–11) each highlight locations where the jelly roll is not as tight as at the other locations and thus does not press against the housing. Both locations show a contraction of the cell over a wide range. Whether the cell wrap is more densely or less densely packed is determined by the distance between the cell wrap and the housing. If the cell coil lies directly against the housing, a denser packing can be assumed then if there is still a cavity between the cell coil and the housing (as in mark C in
Figure 4b).
The results of the change in radius over the circumference of the battery cell suggest that, in particular, expansion occurs at those locations where the packing of the jelly roll is significantly tighter than normal due to the current collector tabs. Contraction occurs mostly at locations where the jelly roll is significantly looser. This ultimately leads to a potato-shaped cell form, also visualized in
Figure 5.
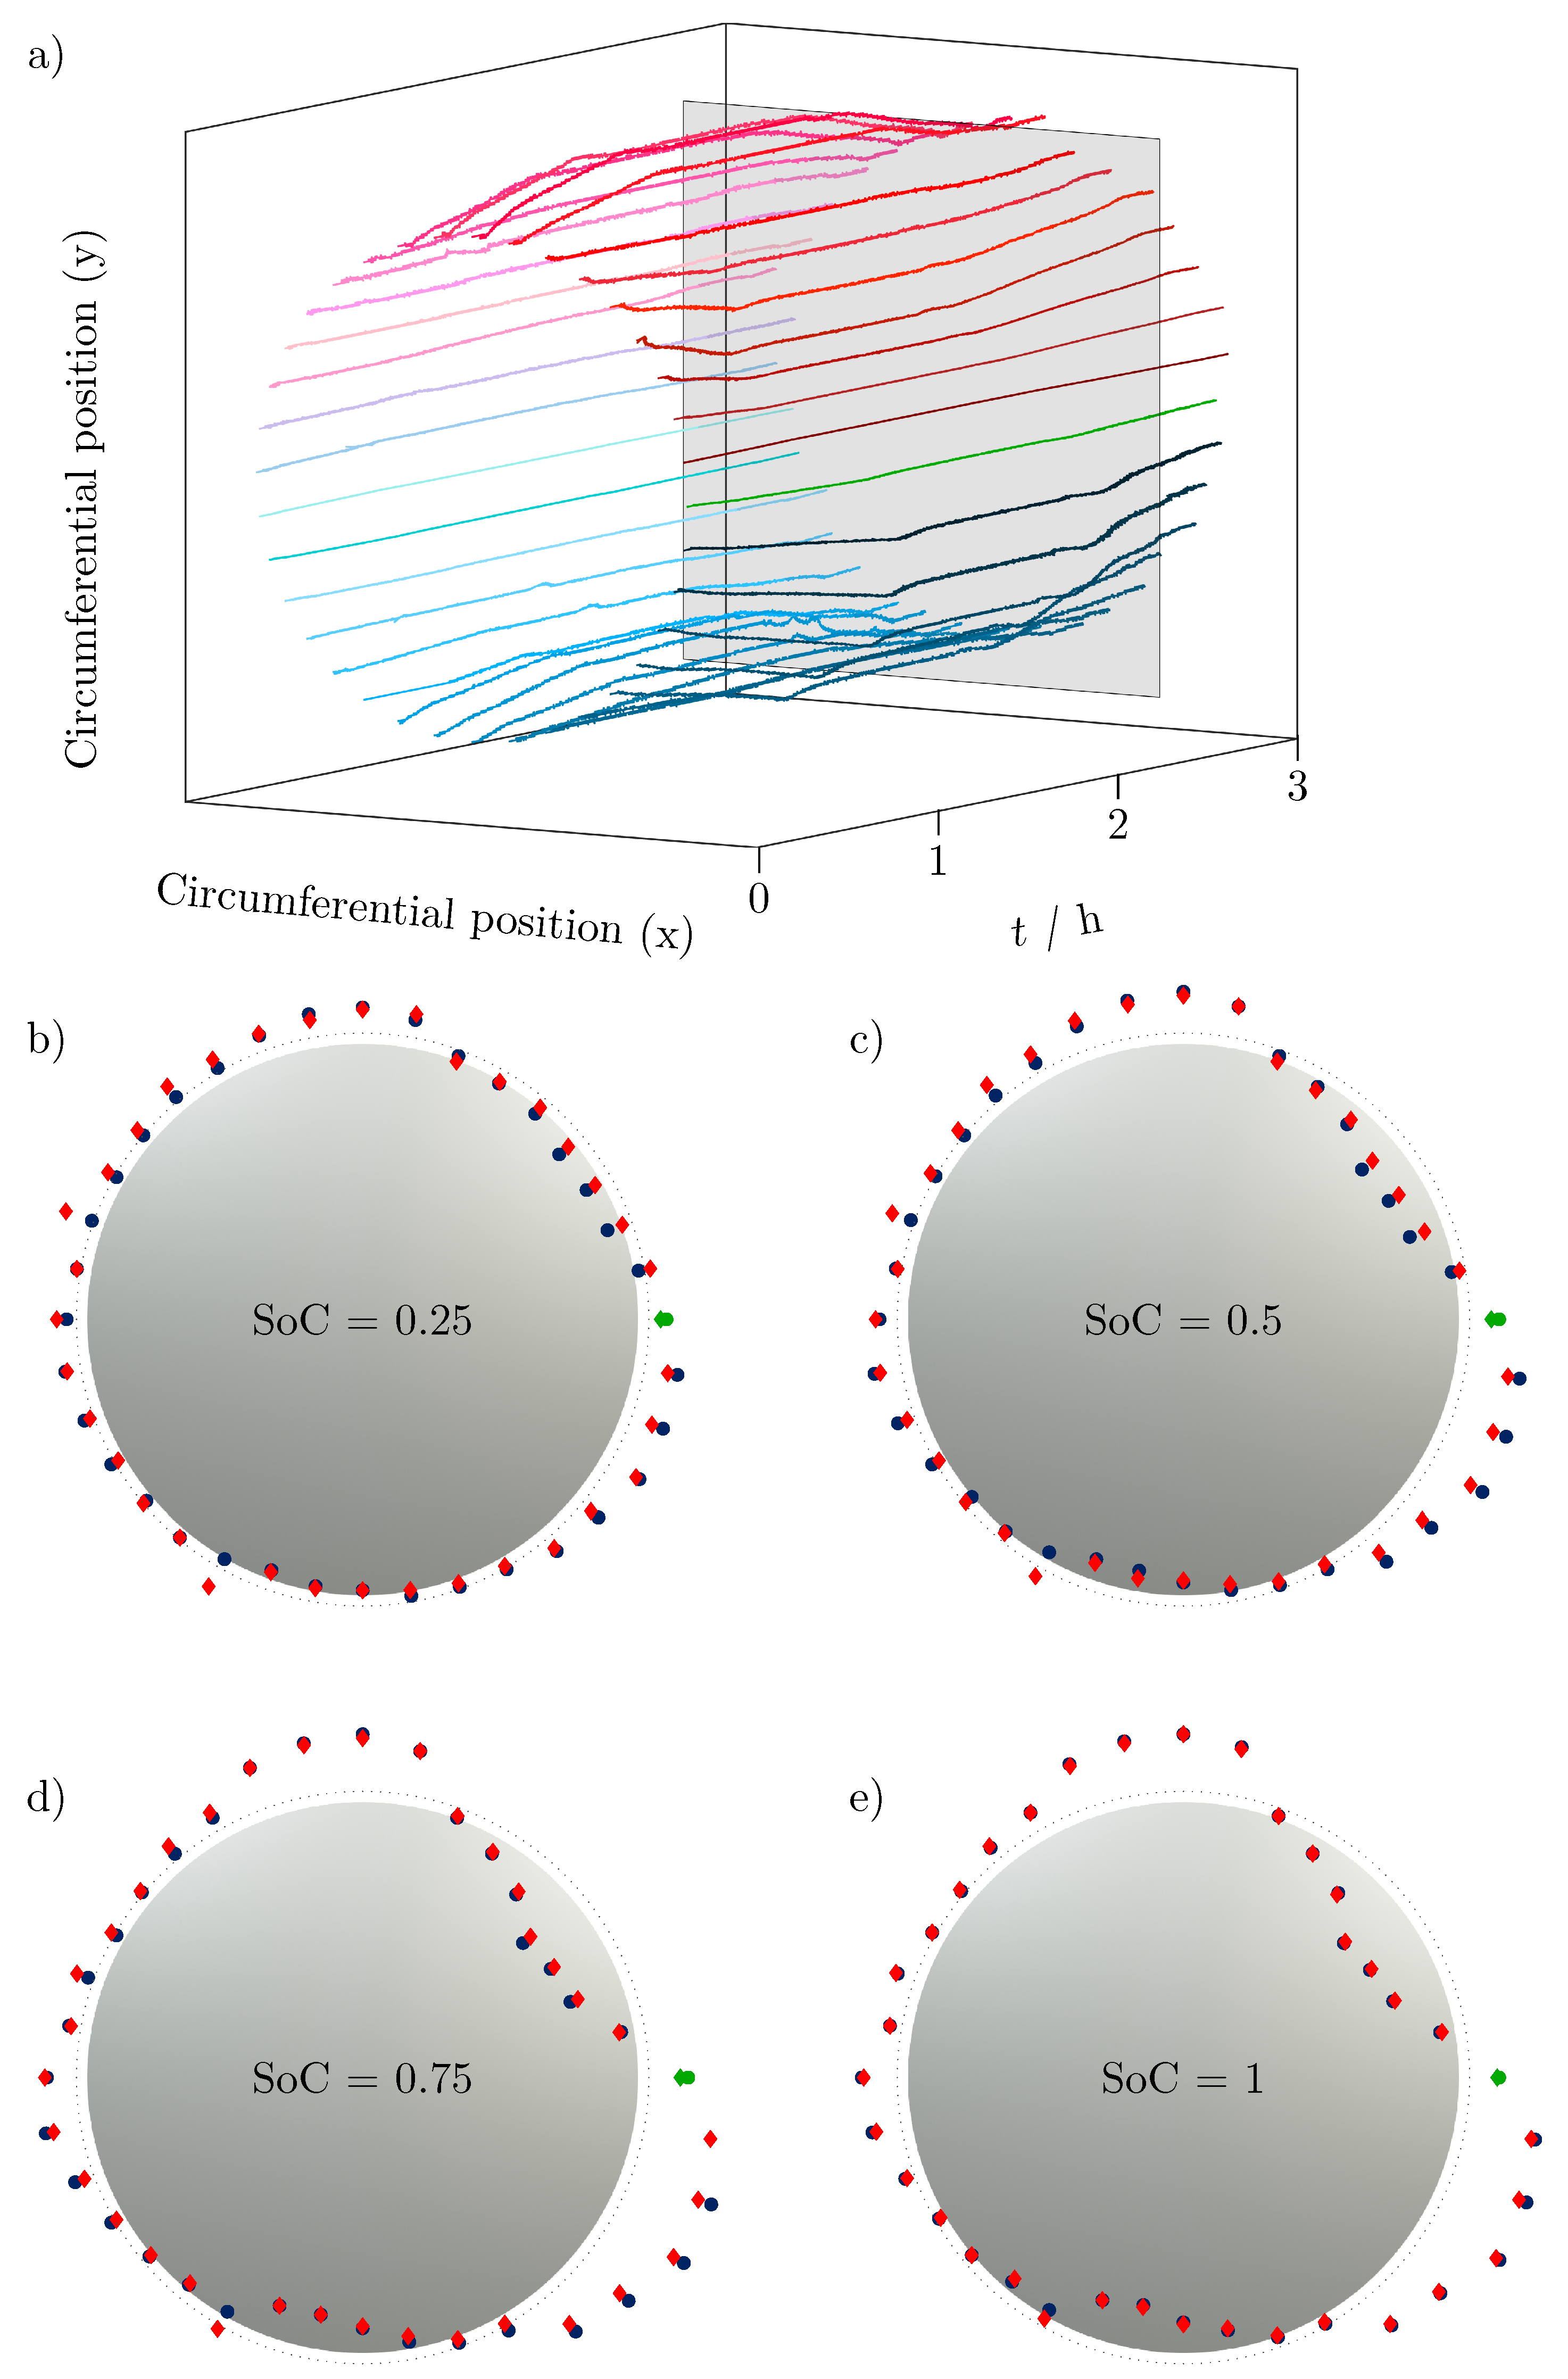
Figure 5a shows the radial change
(amplified by a factor of 100) over time
t added to a fixed cell radius
to visualize the change in cell volume of each circumferential position over time. Each line reflects the recorded expansion or contraction of the battery cell
in the light band micrometer at that point. The contraction at the bottom of the cell and the bulge near the negative current collector tab can be seen particularly clearly. The plane in gray shows the section plane applied at different states of charge to study the volume change of the battery cell for different states of charge.
Figure 5b–e show the sectional views at different states of charge (SoC = 0.25 ... 0.5 ... 0.75 ... 1), which once more clearly show the potato-shaped form of the battery cell. The change in radius at the position of the negative current collector tab is marked in green. The top view of the battery cell in gray reflects the initial shape of the cell.
The change in radius during charging is shown in blue, and the change when the corresponding SoC is reached during discharging is shown in red.
An increase in the extreme points over the SoC can be clearly seen: the expansion becomes larger as the charge increases, but the contraction also becomes stronger as other regions expand. The hysteresis of the voltage due to the applied load has already been investigated many times [
21,
22,
23]. However, the expansion also has a hysteresis, recognizable by the non-overlapping points especially at the extreme points.
3.2. Detailed Radial Change and Influencing Factors
For a better understanding of the volume change, a detailed consideration of the alteration of the radius is useful. This also allows for identifying any influencing factors.
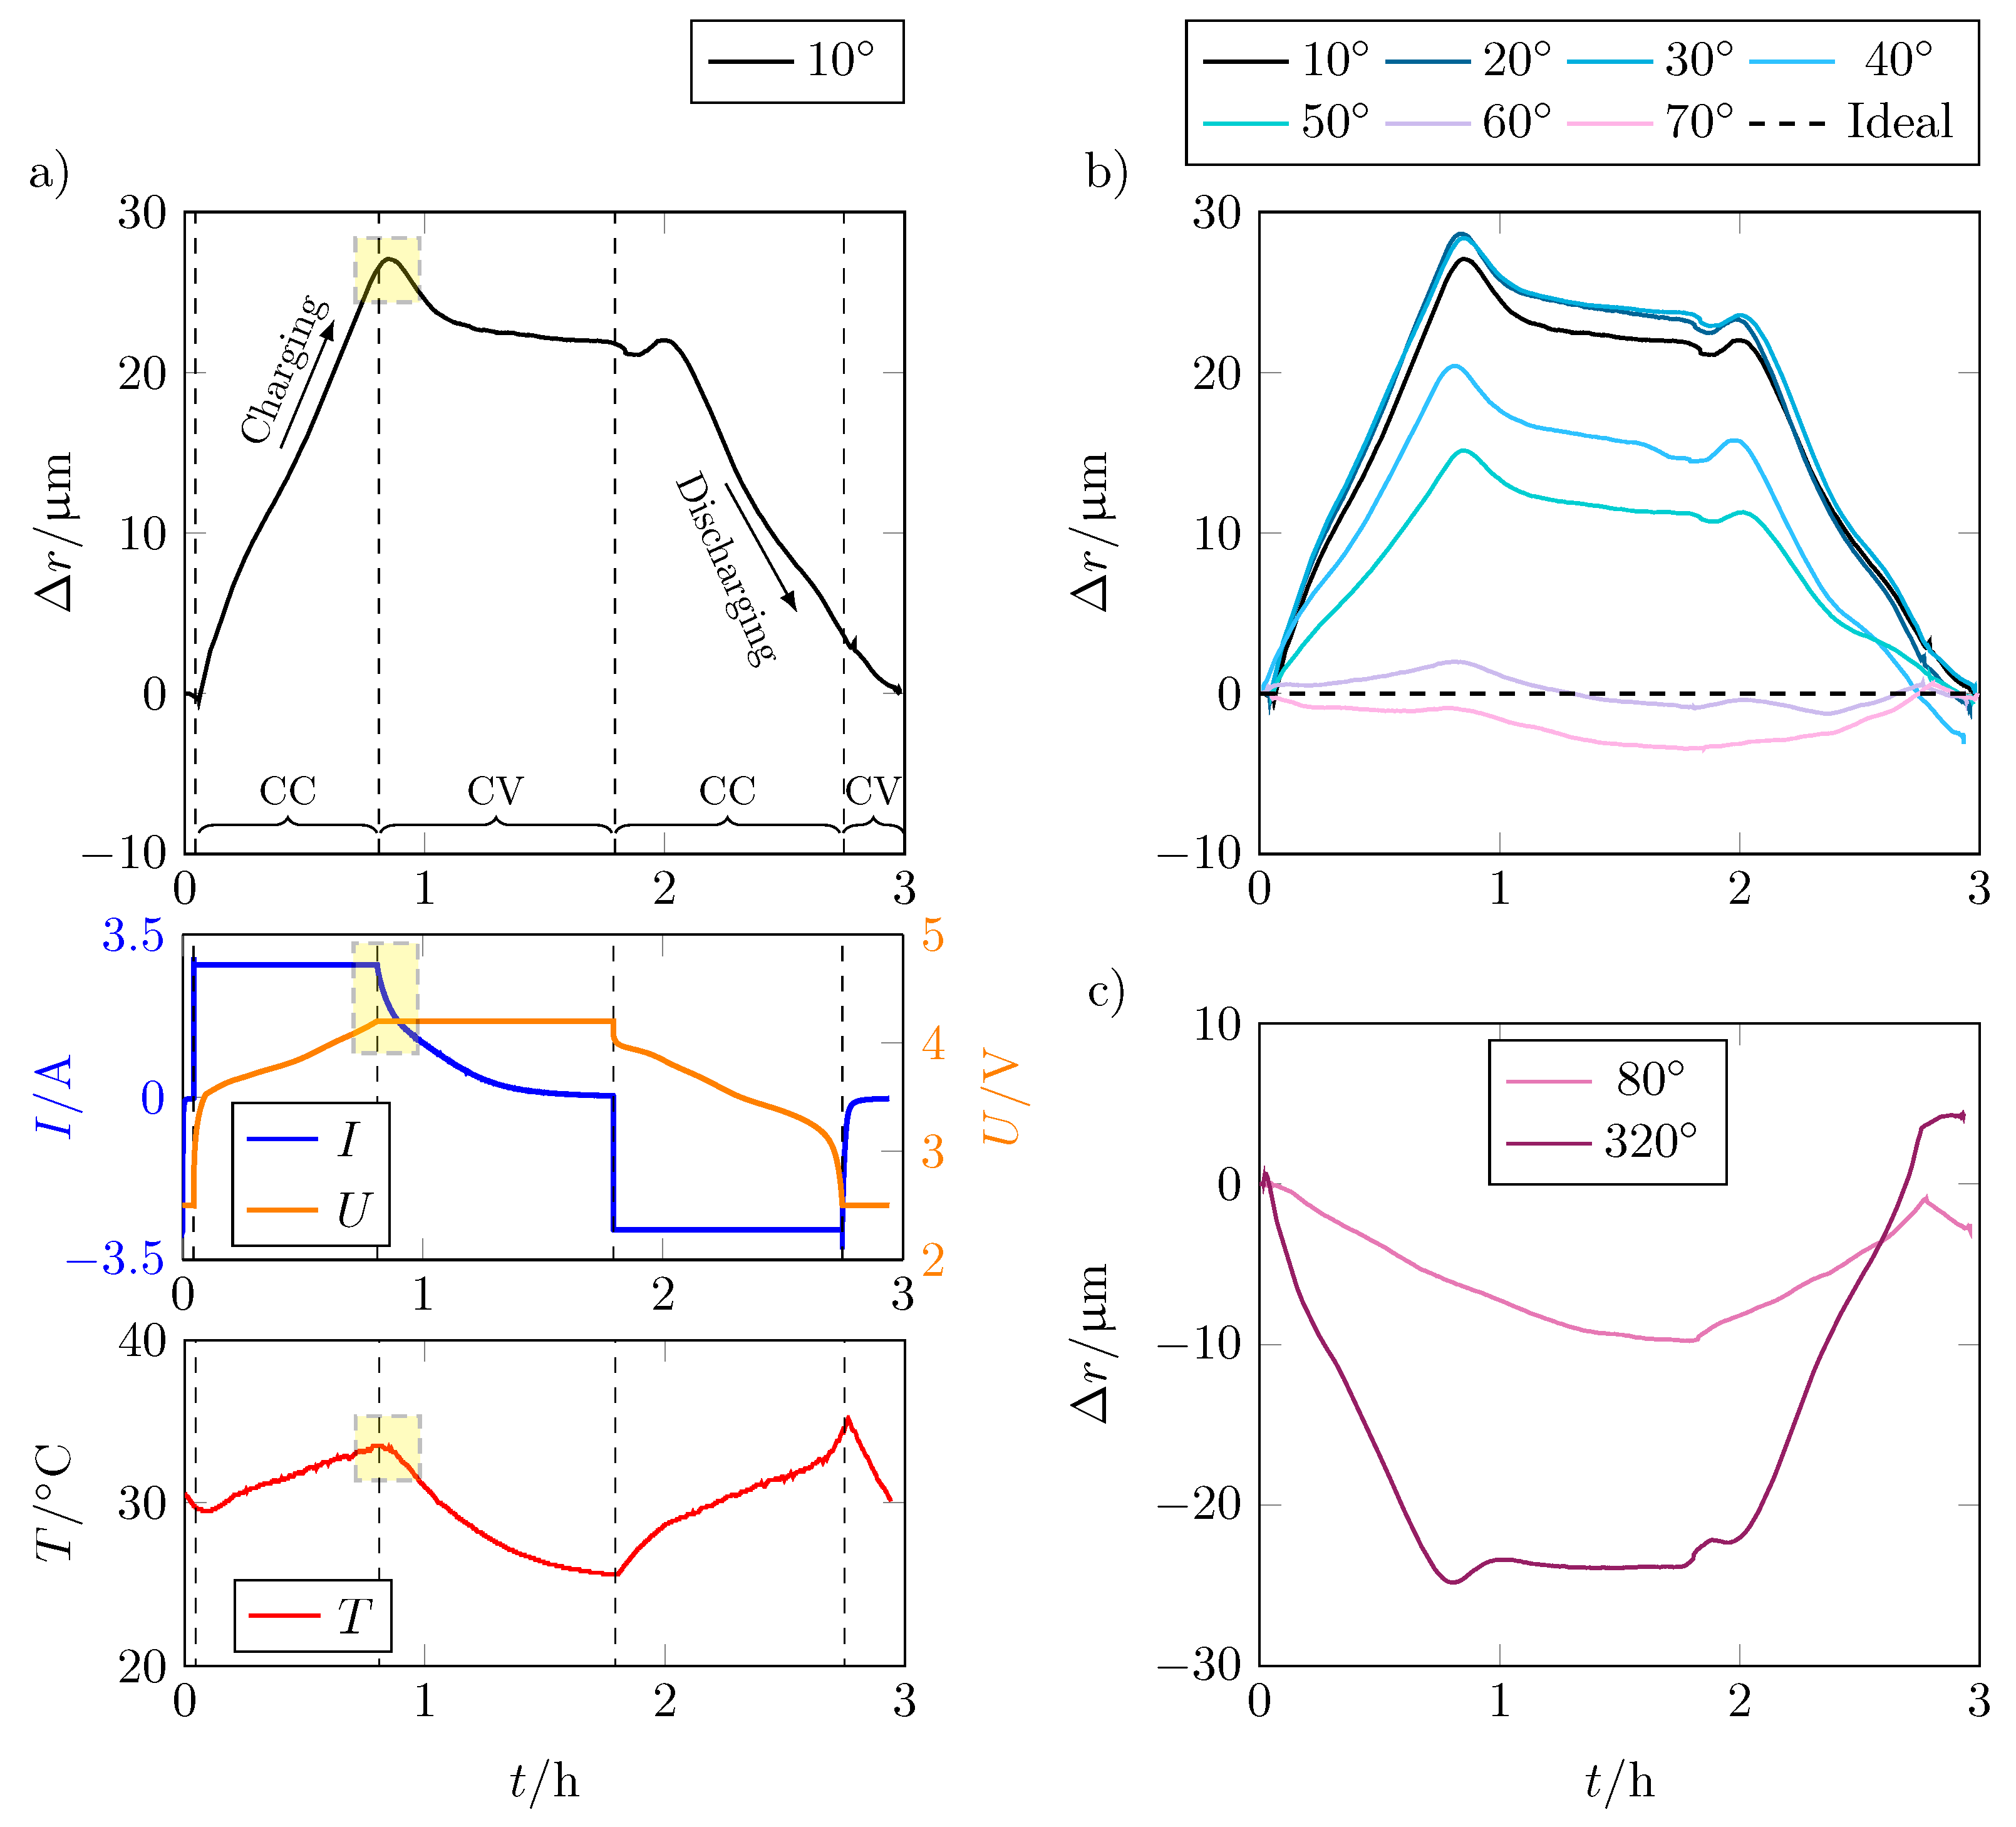
Figure 6a shows the change in radius
over time
t for the entire cycle of the position that expands the most, as well as current (
I), voltage (
U), and temperature (
T) characteristics of the test.
The change in radius over the CC charge phase is about . It decreases somewhat as the cell enters the CV charging phase. At the start of the discharge, there is a very brief increase in radius until the decrease in cell thickness due to the mechanical processes predominates and the cell contracts again. At the end of the CC discharge phase, respectively at the beginning of the CV discharge phase, a kink in the curve is visible.
If only the voltage was decisive for the expansion of the battery cell, the change in the radius would correspond to the voltage curve. Looking at the voltage curve and the expansion of the cell in
Figure 6a, this means that other effects besides lithiation have an influence on the expansion. Particularly noticeable is the sharp peak between the CC and CV charging phases, which is marked in yellow here. Although the applied current drops and the voltage remains constant, the expansion continues to rise. Looking at the temperature curve, the peak of the expansion correlates with the temperature increase of the cell. This is due to the ideal gas law, according to which the gas pressure increases with increasing temperature while the volume remains constant. The increase in gas pressure also causes the battery cell to expand further, although no further electrode growth takes place. By decreasing temperature and thus also gas pressure, the expansion also decreases to an almost constant level until the end of the CV discharge phase.
At the beginning of the discharge phase, the expansion initially decreases analogously to the voltage due to the delithiation of the graphite, which leads to a contraction of the electrode. Shortly after the start of the CC discharge phase, the radius increases again despite progressive delithiation. The reason is presumably the increasing temperature, which causes the internal gas pressure to rise again and superimposes the reduction in the radius, thus leading to expansion again until the effect of delithiation predominates and the radius of the battery cell decreases again. Due to the temperature effect, the slope of the radius change is smaller during discharge than during charge.
Figure 6b,c show that the above effects also apply to lower expansions and even to locations where contraction of the battery cell occurs. At points where the cell contracts, an additional contraction occurs as the temperature rises. This is due to the strong expansion at other points (see positions 1–7 in
Figure 6b), which causes the spaces between the bulges to contract due to the mechanical rigidity of the housing.
As already indicated in
Figure 5, the expansion exhibits a hysteresis.
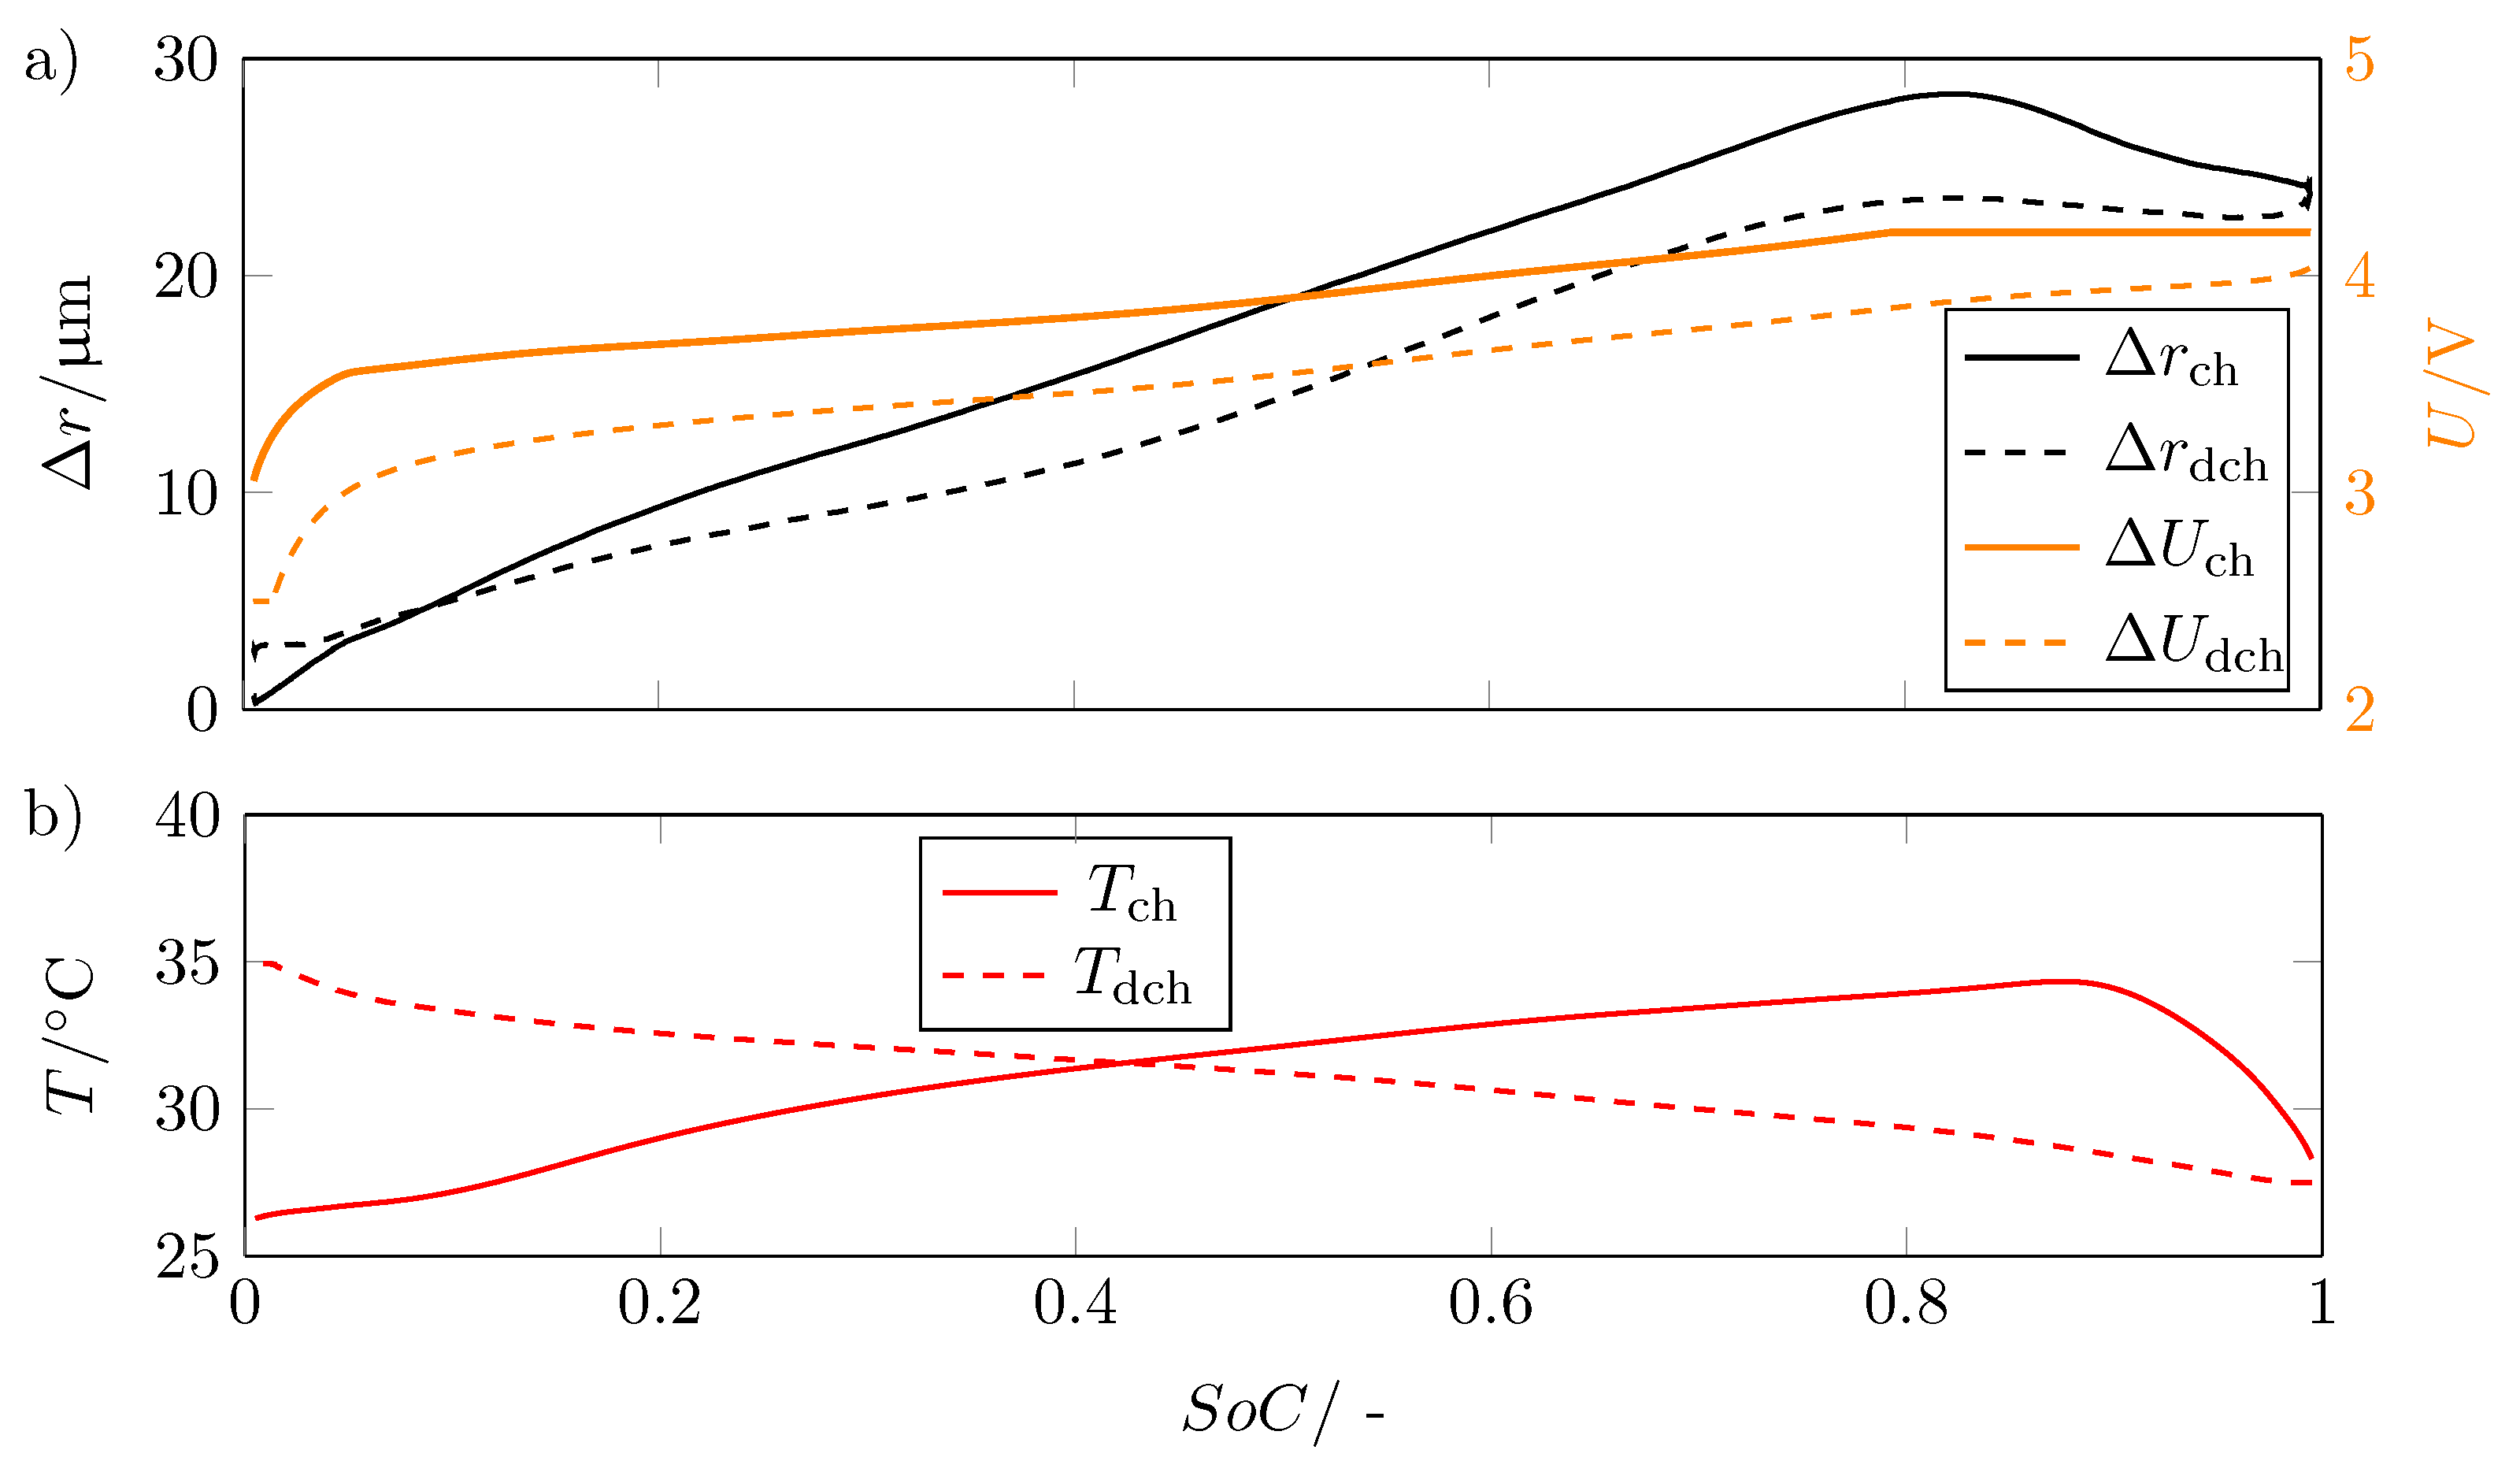
Figure 7a shows the voltage for charging
and discharging
as well as the corresponding change in radius
and
plotted versus SoC.
As expected, the voltage exhibits hysteresis due to structural changes in graphite and non-uniform distribution of lithium ions [
24,
25]. The expansion also shows this hysteresis, with the curves of the radius change for charge and discharge intersecting at SoC = 0.08.
This hysteresis shows that the lithiation and delithiation of the electrodes results in an asymmetric volume change.
The overlap of the curves of the radius progression can be explained with regard to the temperature. The temperature increases with decreasing SoC due to the high applied current at a discharge rate of 1C to a temperature of at the corresponding SoC. This causes the internal gas pressure to increase, which results in the radius not decreasing as fast as it increased during charging. This causes the two curves to meet. This is also the reason why the hysteresis becomes smaller for SoCs close to 1.
3.3. Investigations with the Help of Computed Tomography
To validate the measurements with the light band micrometer, computed tomography was used to determine battery cell thickness growth, as shown in
Figure 8.
Therefore, images of the cell in a fully discharged state and in a fully charged state are generated, creating two three-dimensional models of the battery cell.
By superposing these models, the difference in the shape of the outside of the casing between the two states of charge of the battery cell can be visualized.
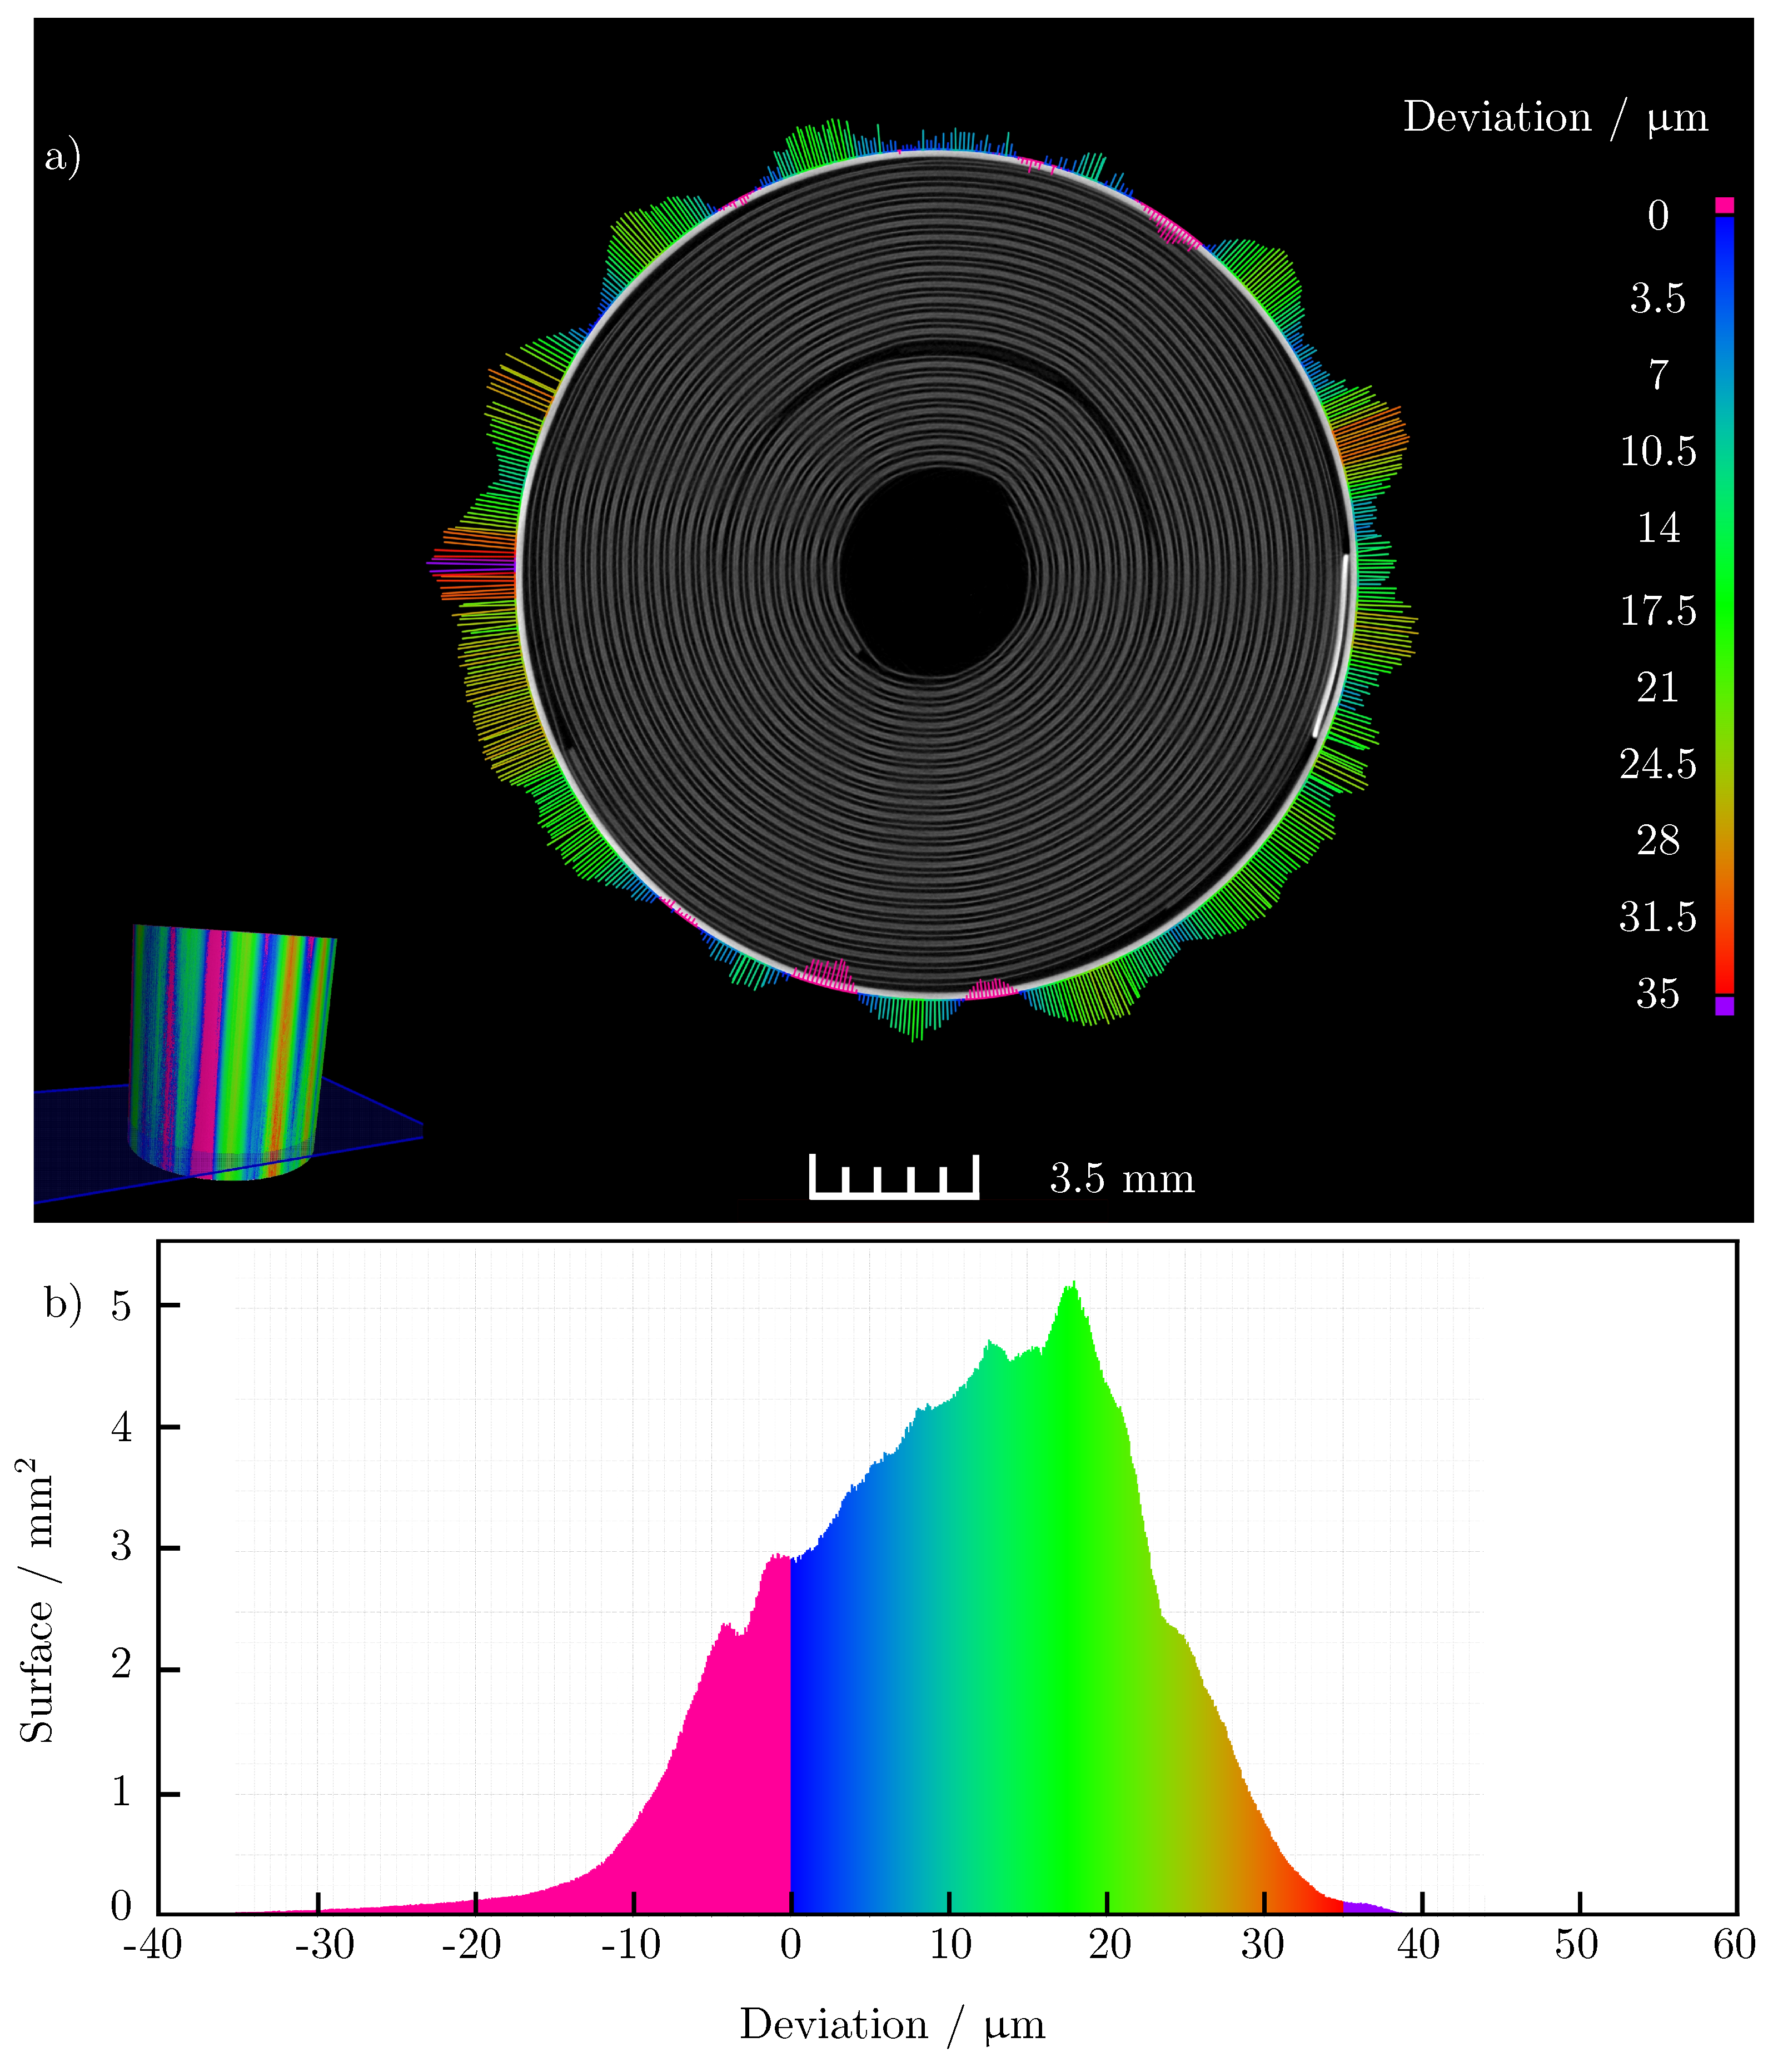
Figure 8a shows a sectional view of the three-dimensional scan of the cell and the 50-fold amplified change on the outer side of the cell. The figure confirms the clear expansion of the cell housing in the area of the anode current collector tab and at the opposite position of the cell (180° offset). The maximum absolute radius change at expanding regions of the cell is also of the same order of magnitude. In contrast to the measurements with the micrometer, the expansion in the area of the anode current collector tab does not go directly into a contraction of the surrounding positions around the circumference of the battery cell. Overall, there is a smaller number of contraction positions seen around the circumference of the cell. The absolute change in radius also lags well behind the maximum contraction that occurred in the micrometer. While the averaged radius change of the cell in the light band micrometer measurement is only about
, it is about
in the computed tomography measurements. Nevertheless, the inhomogeneous expansion of the cell is clearly emphasized. The potato shape due to the increased expansion is also clearly recognizable. In addition to the differently expanding areas, a sinusoidal shape of the change of the cell housing can be seen in the images. It is possible that this is due to the manufacturing process of the cell housing. Confirmation of this effect by subsequent measurements is still to be conducted.
Figure 8b shows how much area of the outer housing expands or contracts. It is clear that the largest proportion of the surface of the housing exhibits a radius change of
during charging compared to the discharged state of the cell.
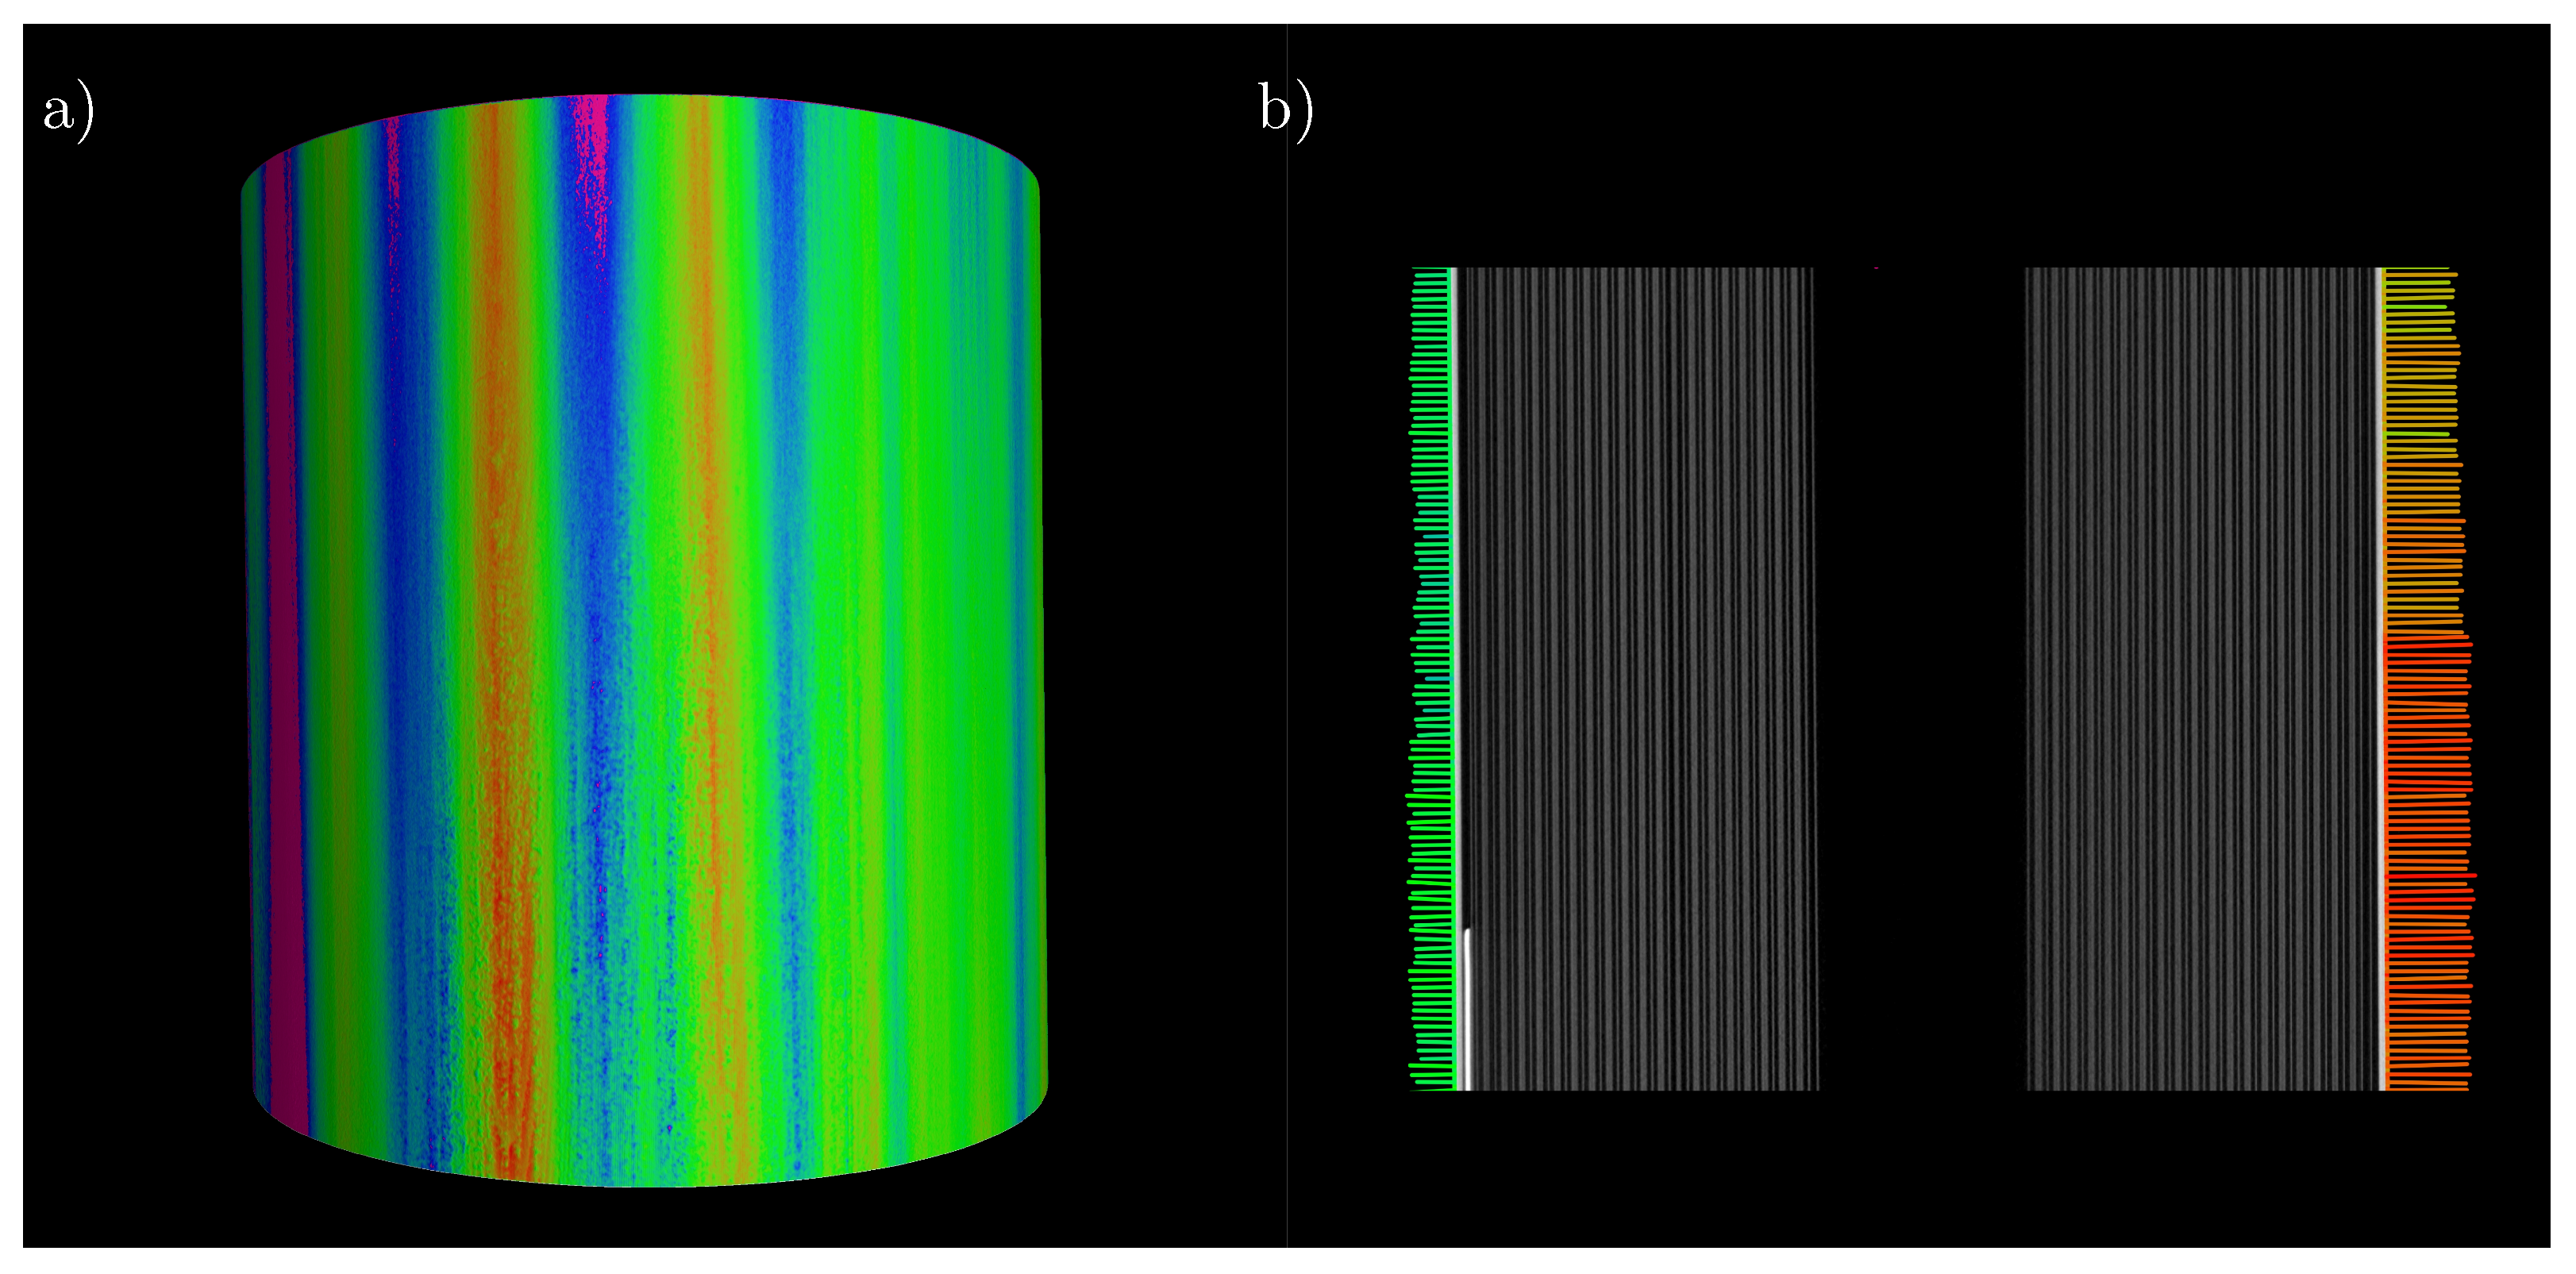
Figure 9a shows a representation of the 3D image of the cell including the analysis. The coloring clearly shows an area of contraction on the left side and areas of varying degrees of expansion on the remaining surface. The color scale can be found in
Figure 8.
Figure 9b shows the expansion of a cross-section over the height of the cell, proving that there is no significant change in cell thickness growth over height. Only the absolute expansion decreases in the direction of the poles. In addition, the left side of the plot shows that, even after the end of the current collector tab, there is a reduction in the absolute expansion of the cell over the height of the battery cell.
4. Discussion
As shown in the section Results, the use of a light band micrometer is a stable and reliable method to study cell thickness growth. During the cycling of LG INR18650 M29, the change in radius of a single position could be measured with an accuracy of . The operating temperature of the light band micrometer is between , so, when measuring in a climatic chamber at a constant temperature of , a temperature effect of the environment on the measuring device and the battery cell can be neglected.
The measurement of the volume change over the complete circumference of the battery cell shows that a non-uniform change in the shape of the cell takes place. Instead of the expected uniform expansion, the cell takes on a potato shape, putting it simply. The roundness of the cell decreases and bulges and valleys form around the circumference depending on the position and orientation of the jelly roll inside the housing. Where the negative current collector tab is located, the cell expands at an above-average rate, while it contracts more than average at points where the jelly roll is not directly against the housing and a cavity is created.
The measured change in radius, caused by the intercalation and deintercalation of Li-ions in the electrodes, is up to a maximum of
on expansion of the cell (as seen in
Figure 6a) and up to
on contraction (as seen in
Figure 6c). A SoC dependent volume change behavior was observed at all locations of the battery cell. The averaged diameter of the battery cell with a low SoC is
. The change in radius over charge averages
for each position by the circumference of the cell, respectively
, resulting in an averaged diameter of the battery cell in the fully charged state of
. As shown by the small difference between the average diameter when fully discharged and the average diameter when fully charged, the volume change of the battery cell is non-uniform because the areas of expansion and the areas of contraction compensate each other. The actual change of radius of different zones around the circumference of the cell is up to 12 times higher than the average expansion. Since the expansion of the individual positions was investigated in 36 consecutive cycles, deviations due to forming processes, aging processes, and possibly existing influences due to different relaxation of expansion and pressure are to be expected. The absolute values are therefore to be considered critically and must be validated elsewhere with an extended setup that allows the investigation of all of the different positions within a single cycle for multiple samples and different cell chemistries. In addition, the influence of the current and the ambient temperature on the uniformity of the expansion still need to be considered in future studies.
The CT scan could confirm the non-uniform change in the shape of the cell and the potato-shaped expansion. The absolute maximum radius change of both measurement methods is between . However, there is a significant difference between the absolute surface area expanding and the absolute surface area contracting. It should be noted that the resolution of computer tomography is much higher than that of manual measurement or rotation by in the light band micrometer. In addition, there is a risk that peaks or valleys near the area of interest will falsify the measurement due to the arrangement of the measurement area with the light band micrometer. Therefore, optimization of the measurement setup is mandatory for further investigations.
By analyzing a section of a battery cell with a height of , computed tomography is able to confirm the initial assumption that the change in radius of the cell does not change significantly with height. Only the absolute value of the expansion or contraction decreases in the direction of the poles.
As shown in
Figure 6 and
Figure 7, a correlation of the radius change with the SoC is very well possible. This correlation between the lithiation of the electrodes and the change in radius can be established regardless of whether the cell expands or contracts at the corresponding position. The characteristic points, for example, the end of the CC charging and discharging phase, as well as the influence of the temperature rise and the relaxation at the respective CV phases, can be seen over almost all of the examined positions. However, this correlation is much clearer for positions where the absolute value of the change in radius is higher.
Figure 7 also shows that the intercalation and deintercalation of Li-ions result in different swelling and contraction, which leads to a visible hysteresis. The variation in the slope of the radius change in
Figure 6 is probably related to the stage formation during the lithiation of graphite. Further investigation of this will be reported elsewhere. In addition, investigation of the influence of the SoH on the expansion at various locations is still outstanding.


 ,
, 


