1. Introduction
The chlor-alkali industry uses brine and electricity for chemical production, like chlorine, hydrogen, and sodium hydroxide [
1,
2]. Chlorine manufacture made by chlor-alkali electrolysis is the second-biggest industrial electrochemical process, with more than 70 million tons of
produced yearly and requires more than 200 TWh of power supply [
3].
Chlorine and sodium hydroxide are the top 10 chemicals produced worldwide, and are the raw materials for a huge number of products used in everyday life. Soda is employed in the making of detergent soap, fabric, paints, glass, and ceramics [
4], in addition to its usage in pH regulation and acid neutralization, caustic soda is employed as a reactant in the production of many chemicals [
5].
By applying direct-current (DC) electricity to a pair of electrodes (positive and negative) submerged in aqueous sodium chloride (NaCl), hydrogen (
), chlorine (
), and sodium hydroxide (NaOH, often referred to as “alkali”) are simultaneously produced [
6].
Chlor-alkali production requires a lot of electricity consumption that usually represents 40–50% of process expenses in operation; power consumption depends on different technologies used in production [
7]. Most of the chlor-alkali is made by electrolyzing a brine (NaCl) solution that requires mercury, diaphragm, and membrane technologies. However, the chlor-alkali process generates polluting emissions that causes a serious impact on the environment, and people. Thus, development of more efficient and cleaner processes is required [
8].
European countries willingly accepted to change their mercury cell technology due to environmental protection laws and huge power costs. The Minamata Convention on Mercury began to be applied on 16 August 2017, and this agreement requires less usage and emissions of mercury; at the same time, it claims for more research and development of technologies that do not use mercury.
The production of chlorine and sodium hydroxide by membrane technology was introduced into industrial practice in the mid-1970s as an alternative to mercury diaphragm and cathode methods, and in 1990 about 20% of NaOH and
were produced by membrane technology. At the end of 2016, membrane technology in Europe accounted for approximately 66% of chlorine production. Lately, membrane technology has been the top preferred process in Europe, having more than 83% of the chlorine yield in the EU 27 and EFTA countries in 2018 [
9]. The global reaction in electrolytic cells is shown in Equation (
1):
The top challenge that the chlor-alkali industry has to face is finding efficient processes that use less power supply, and to produce maximum yield. Considering the currently high costs of electric power, the benefits of the industry mainly depend on such new technologies [
10].
Mercury cells were widely used in the United States; they represented 20% of full chlor-alkali yield in the 1980s, but they have become banned because of mercury pollution laws, including the National Emissions Standards for Hazardous Air Pollutants [
11,
12]. The process consists of two principal steps, the electrolyzer and the decomposer [
4].
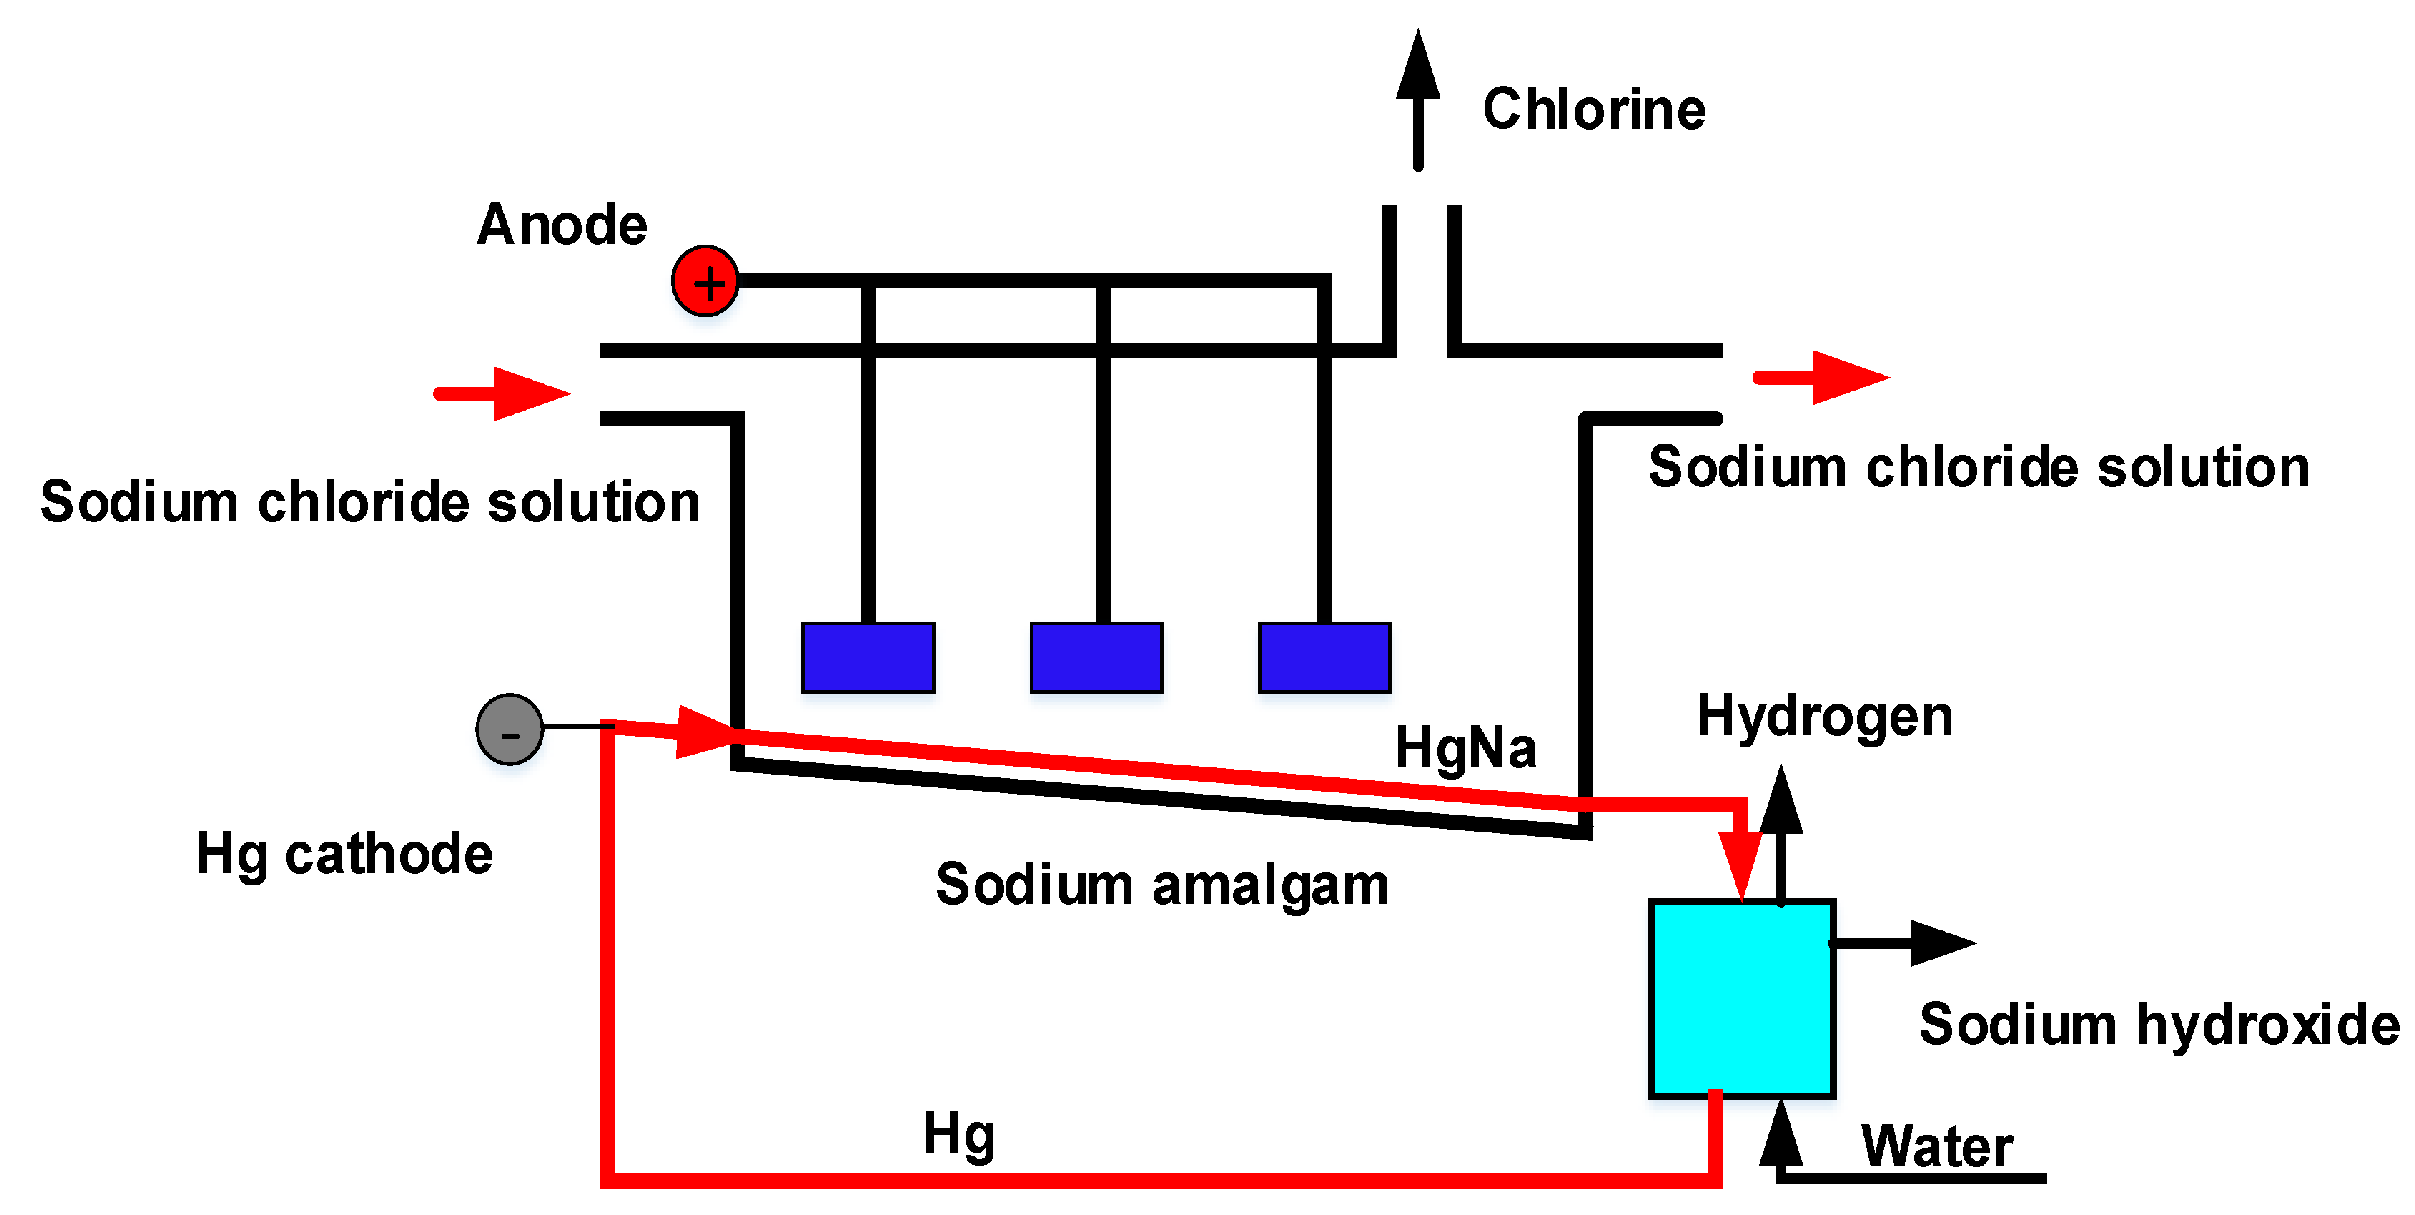
A simplified diagram of the production process is shown in
Figure 1. Then the brine enters the electrolytic cell from the side near the anode, and the diluted brine exits the other end of the cell. At the anode, which is the positively charged electrode, the chloride ion oxidizes to chlorine gas. The reaction is shown in Equation (
2).
Reduction at the cathode: At the cathode the sodium ion is reduced and produces an amalgam with the mercury, and the reaction is shown in Equation (
3):
The sodium amalgam then reacts with the water in a separate reactor called a decomposer where gaseous hydrogen, ordinary hydroxide solution, and mercury are produced, which is recirculated to the electrolytic cell. The reaction is shown in Equation (
4):
At the outlet of the decomposer, the sodium hydroxide holds a 50% purity.
The mercury cell process is known to produce the highest-quality caustic soda, but its major drawback is that its products have some mercury present [
13].
Because of incidents of mercury contamination in Minamata and Niigata in 1972, Japan began changing to membrane cells, and today there are mercury-free cells operating [
4,
14]. Membrane cell technology is a clean, feasible technique for the reuse of these wastes, but simultaneously, it relies on many aspects, like brine pureness, flow density, and pH factor [
15].
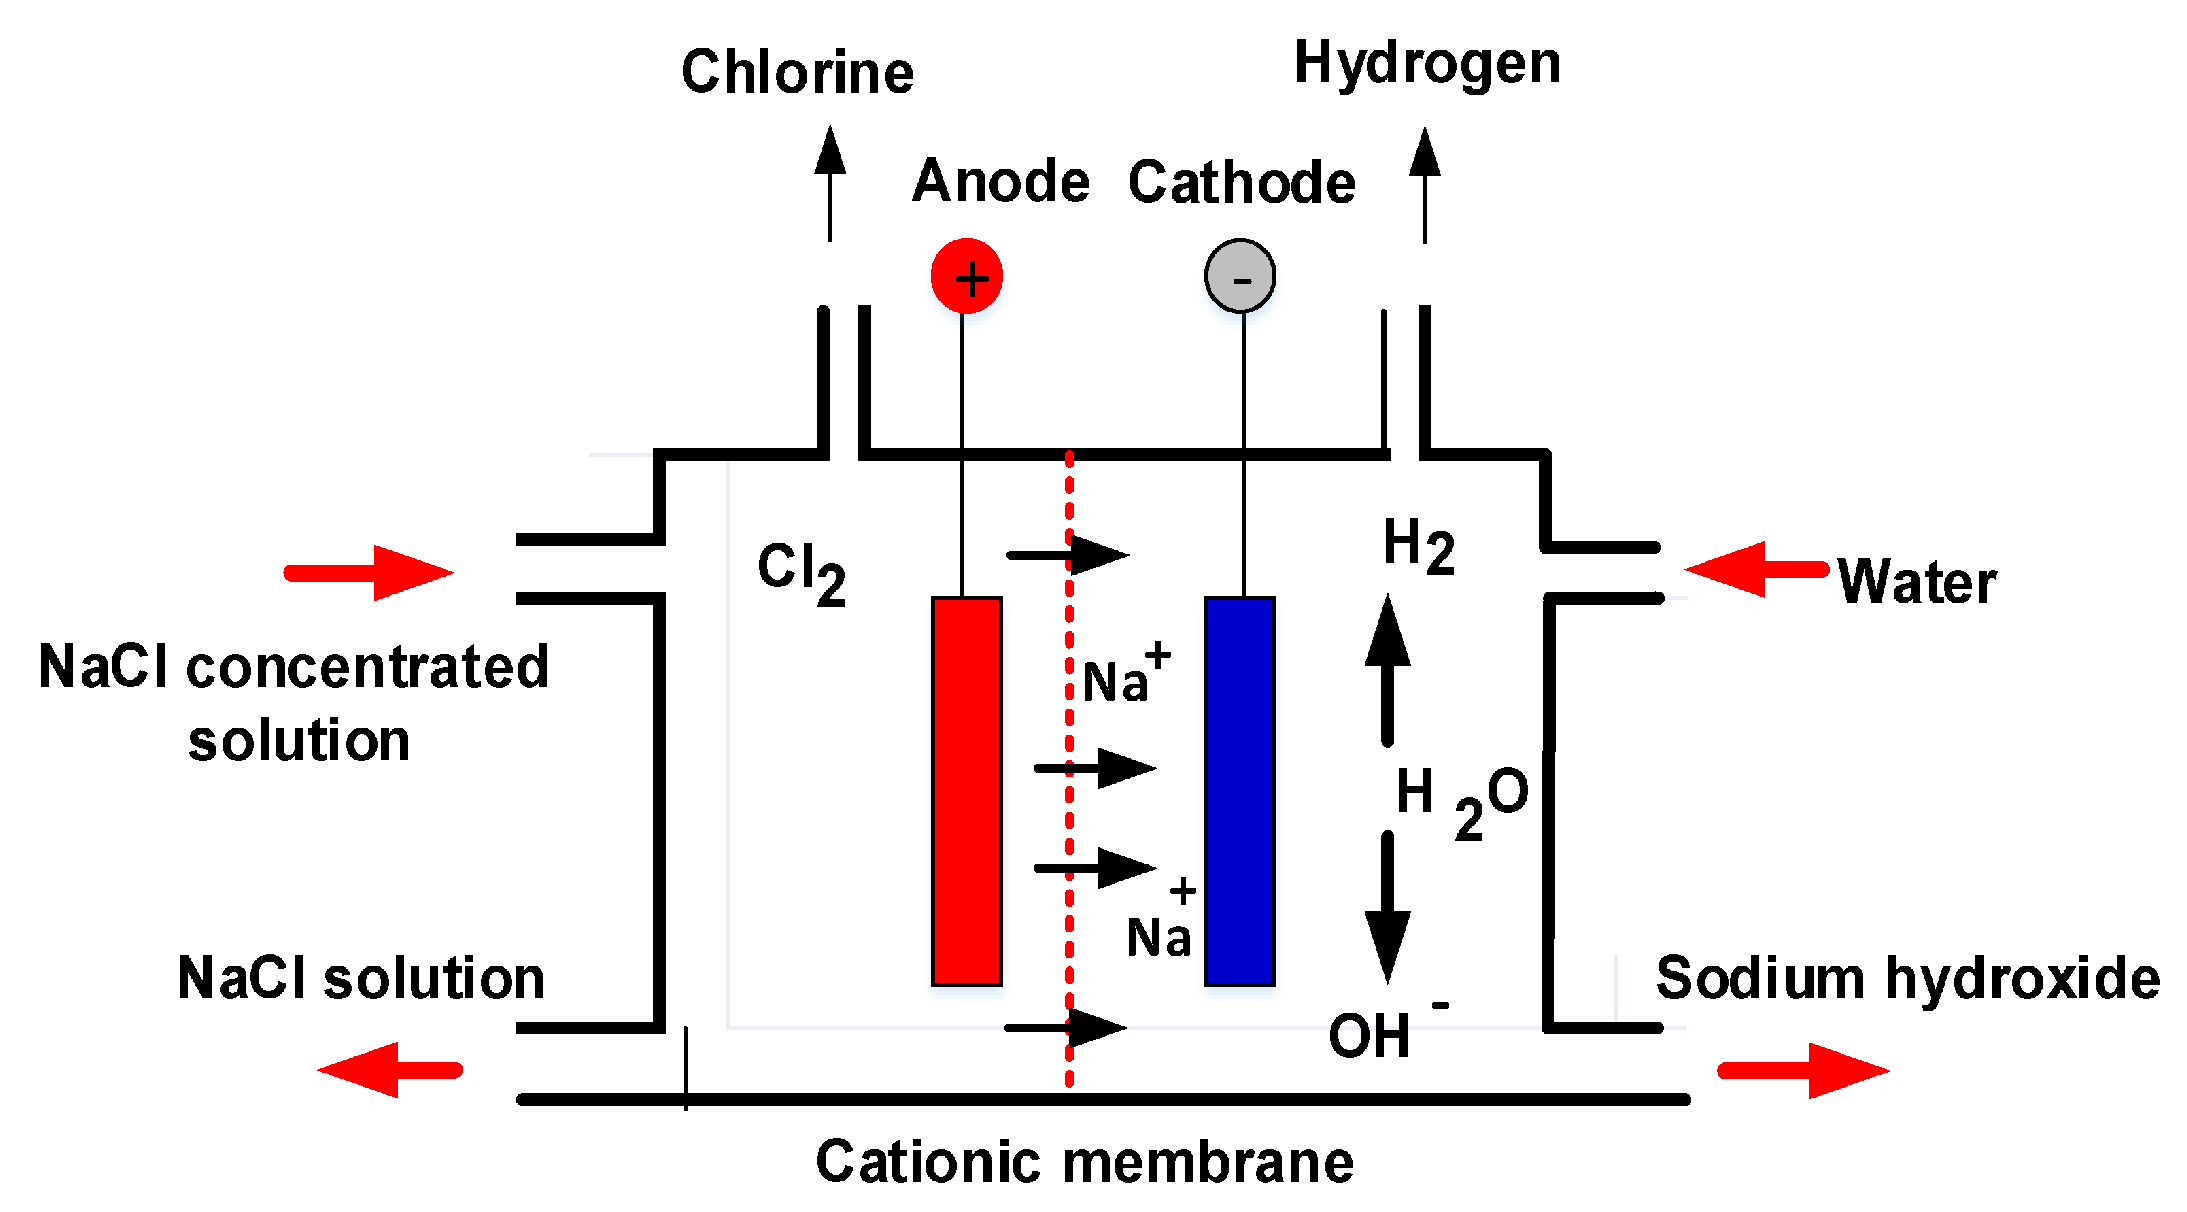
The anode and cathode are isolated by an ion exchange membrane. This membrane avoids the transit of chlorine ions (negatively charged) but permits sodium ions (positively charged) to move freely through the cell [
11]. In this process, sodium chloride brine is added to the cell through the anode compartment [
16], while the water moves along the cathode compartment. The continuation of the reactions occur at the anode and the cathode [
3]. These are shown in Equations (5) and (7).
In addition to the release of chlorine gas, the evolution of unwanted oxygen gas is mainly due to the oxidation of water:
In the cathode, water is electrolyzed into and hydrogen gas.
A cation-exchange membrane divides the anode and cathode solutions, but is permeable to
. The sodium ions merge with hydroxyl ions and form sodium hydroxide [
17]. The reaction is shown in Equation (
8).
The full electrolysis reaction of NaCl to NaOH and
can be seen below [
18], and the reaction is shown in Equation (
9).
In this method, sodium chloride solution is poured into the cell through the anode compartment, while the water moves through the cathode compartment. The by-product of hydrogen is frequently employed to supply heat by combustion [
13]. In addition, other usages can be found in the future, such as use in fuel cells [
19]. A typical membrane electrolysis cell is shown in
Figure 2. On the anode, chloride is oxidized to chlorine gas, and then dissolved in the anolyte [
20].
Table 1 shows the main advantages and disadvantages of mercury cells and membranes, adapting and modifying from [
2].
Because the capital investment, operating costs, and power consumption expenses are lower than that of diaphragm and mercury technology [
21], membrane cell technology is used in all new chlor-alkali plants. Another technique for NaOH production is by the diaphragm cell, which operates at a lower voltage than mercury cells, the discharge is free from mercury problems and requires less brine purity than membrane cells, which reduces the brine pretreatment charge [
22]. Because of the separated formation of
and NaOH, the mercury cell generally produces a purer product than do the diaphragm and membrane cells but with higher energy consumption because of the increased cell voltage for electrolysis [
23].
The main objective of our study was to evaluate the operational factors that influence the reached concentration of sodium hydroxide in the chlor-alkali membrane cell using experiments with synthetic brine. The initial NaOH concentration, electric potential, and temperature factors were studied in a laboratory scale experiment.
The present work is divided up as follows: in
Section 2 the experimental procedure to be used is shown, in
Section 3 we present the results, and finally, in
Section 4 the conclusions obtained from the present study are presented.
2. Experimental Procedure
2.1. Materials
The chemicals used in our research were analytically pure, such as sodium chlorid (NaCl), sodium hydroxide (NaOH), and hydrochloric acid (HCl). For the analysis, deionized water was used, supplied by a Chiwatec Water Treatment Technology brand for electroionization equipment. The glass materials used were burettes to carry out the titration operation. A heating system with an rpm and temperature indicator was also used.
2.2. Chemical Analysis
The changes in the sodium hydroxide concentration were determined by an acid-base titration with a calibrated solution of HCL of 0.01 N using phenolphthalein as an indicator. The
concentration was calculated using Equation (
10).
: concentration of the calibrated solution.
: volume of the acid.
: volume of NaOH used for titration.
The conductivity of the hydroxide was evaluated using the ADW 310 conductimeter, and the pH of the NaOH using the AD 12 pH meter.
2.3. Characteristics of the Ion Exchange Membrane
A cation exchange membrane type FTCM-E (Fumatech Bwt GmbH, Bietigheim-Bissingen, Germany) [
24] was used in this study. According to the manufacturer, this is a high-durability membrane for electrolysis application. The membrane has a thickness of (0.17–0.19 mm) and a very low specific area resistance (2.5–3.5
.cm
) at 0.5 M NaCl and 25
C and an ion exchange capacity of 1.5–1.8 meq/g. For good functioning of the membrane, it is first immersed in distilled water for a period of 24 h and then in a 0.25 N aqueous solution of NaCl for the other 24 h.
When conducting the experiments, there are factors that could affect the membranes. The paper [
21] mentioned that the application of depolarized cathodes with oxygen in the cell affects the membrane, reducing the consumption of electrical energy in the chlor-alkali process. Then in [
25] it was mentioned that the membrane is susceptible to being contaminated with ions such as
and
in the brine, which shortens its useful life. Regardless, [
26] mentioned that calcium and magnesium in precipitated form decrease efficiency and increase energy consumption. Furthermore, the high pressure gases in the electrolytic cell exacerbate the degradation of the membrane.
2.4. Electrolytic Cell
An electrolytic cell was constructed with compartments divided by a 90 cm
fumartch-type cationic membrane (FTCM-E) [
24] section, as shown in
Figure 3, where the volume of the cells was 200 ml for each compartment, electrodes of 10 cm × 10 cm graphite, and the space between the electrode and the membrane was 5 mm. The reactor was connected to a power supply with a voltage of 30 volts and a current intensity of 5 A.
The anolyte compartment was connected to a 1 L container containing a NaCl solution and the catholyte compartment was connected to a 1 L capacity sodium hydroxide reservoir. Both compartment reservoirs were connected to a pump with silicone rubber tubing.
The electrolysis cell is of the filter press type was built with acrylic material on which a cationic membrane with a mesh-shaped turbulence promoter was assembled and secured with eight cross bars with nuts to avoid leaks, mixing, or spilling of the liquid.
Rubber gaskets were placed between each frame and membrane, which allows for sealing and maintenance of the uniform distribution of flow within the cells, and two acrylic plates were also placed at the ends, each one with an inlet and outlet for the flow of solutions. The external acrylic plates allowed the system to be kept under pressure, providing stability and resistance to the set of cells. Two 1.5 cm-thick acrylic frames were used, into which the electrodes were inserted, each with an inlet and outlet through which the sodium hydroxide and sodium chloride solutions entered.
2.5. Procedure
The experiences were made in a batch system for the formation of sodium hydroxide. The sodium chloride solution enters the cell through the anode compartment through a submerged pump from a container containing 1.0 L capacity. Silicone tubing was used to recirculate the brine solution evenly, while dilute sodium hydroxide solution was fed to the cathode side by means of a submerged pump from 1.0 L capacity.
Electrolysis occurs when a direct current passes through anodes and cathodes inside the electrolyte electricity solution. During electrolysis, gas is absorbed by a 2 M sodium hydroxide solution in a 2 L container, and hydrogen is simultaneously generated at the cathode and collected in a similar manner. After each experiment the setup was rinsed completely with distilled water, and the electrolysis run time was 150 min. The feed tanks were heated with jacketed heaters and a digital thermometer monitored their temperature. A direct-current power supply was also used.
In our experiment, the operating time was 150 min. This was not an optimal value chosen. In Franco et al. [
27] mentioned that the potential and electric current in an industrial chlor-alkali membrane electrolyzer is a tool used to evaluate the progress of its operating efficiency over time. The authors also analyzed the performance of an industrial electrolyzer as a function of its service time for approximately 8 years, recording variations in cell potential and current density.
3. Results and Discussion
As a hypothesis in our research, we tried to verify how certain operating parameters affected the concentration of NaOH produced in the membrane cell. In our experiments, these parameters were: cell temperature, initial concentration of NaOH (N), and the applied electric potential. How these evaluated parameters have a significant influence on the conductivity and pH of the NaoH solution in 150 min was also verified. For all the experiments carried out, the concentration of the NaCl solution was kept constant at 40 g/L, and the feed flow of the NaOH and NaCl solution at 400 mL/min.
Figure 4 shows the effect of the variation of the initial concentration of NaOH at three different concentration values, such as 0.01 N, 0.05 N, and 0.1 N. Operating conditions were maintained at 6.5 V and 35
C.
Figure 5 shows the effect of the voltage variation applied to the initial concentration of NaOH at three different voltage values, such as 5.0 V, 6.5 V, and 7.5 V. Operating conditions were maintained at 25
C and 0.01 N.
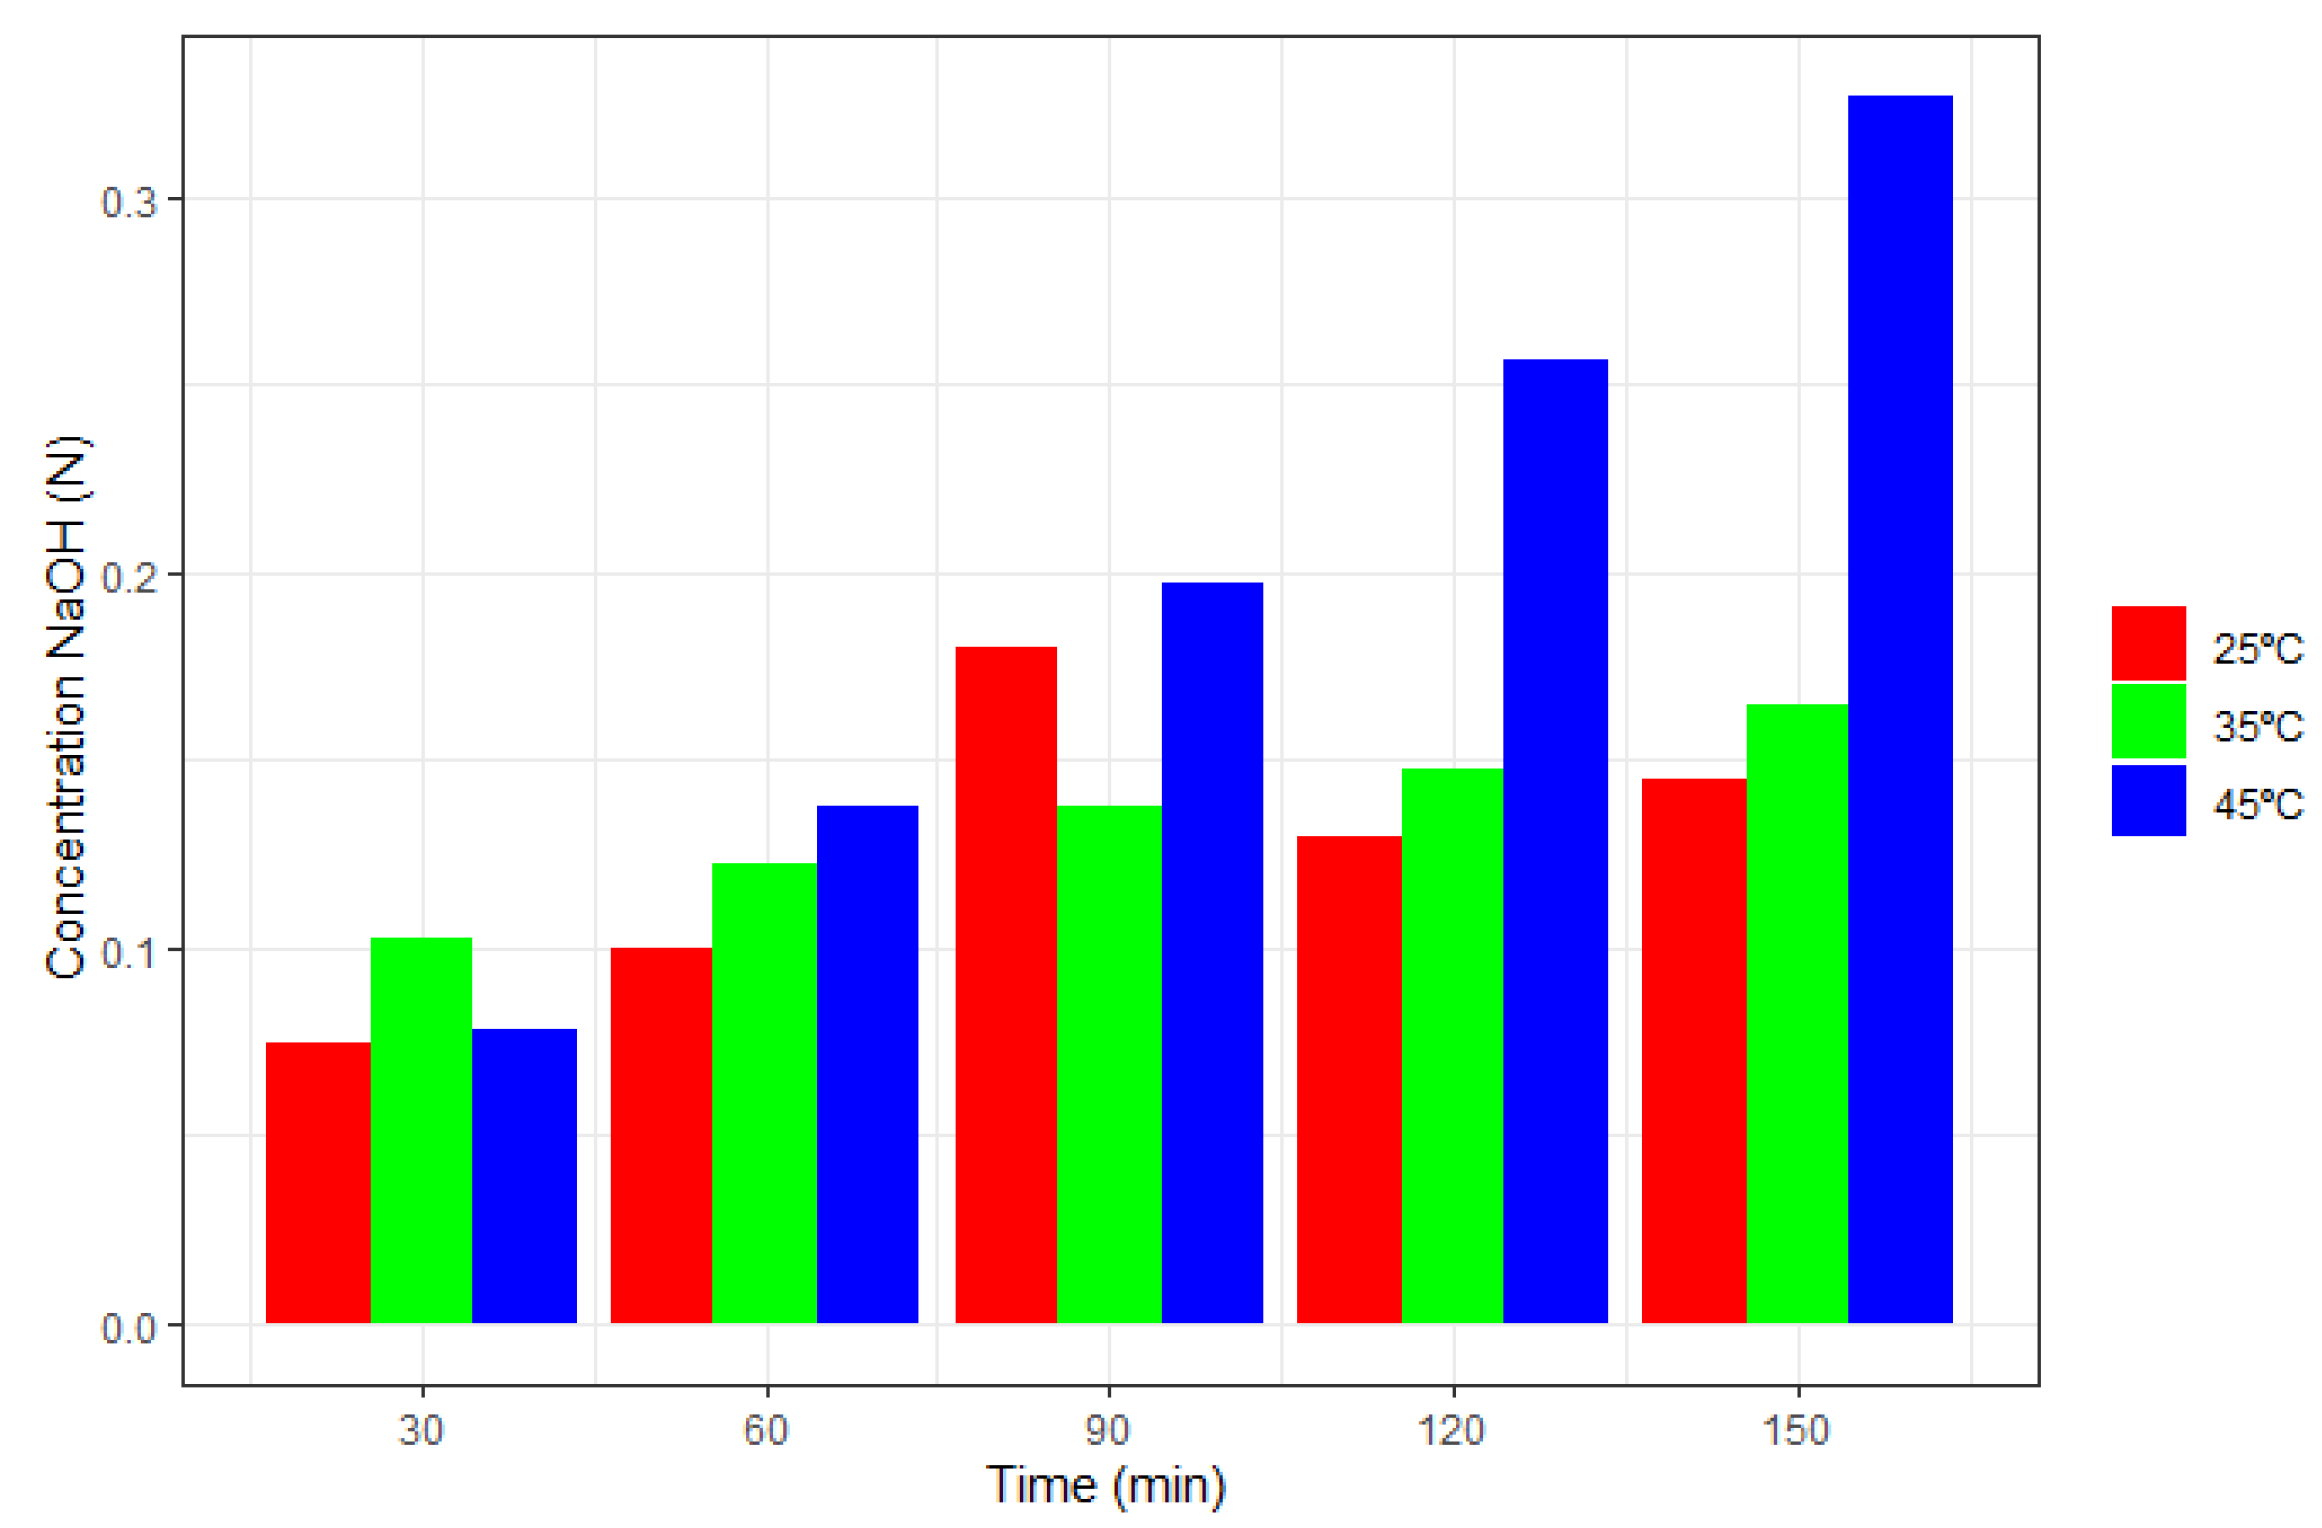
Figure 6 shows the effect of the temperature variation on the initial concentration at three different temperature values, such as 25
C, 35
C, and 45
C. Operating conditions were maintained at at 6.5 V and 0.05 N.
With these three experiments carried out, it was possible to verify how these operational parameters affected the concentration of NaOH produced and how they also increased linearly with time.
To verify the influence of the previously evaluated parameters on conductivity and pH, the following experiments were performed.
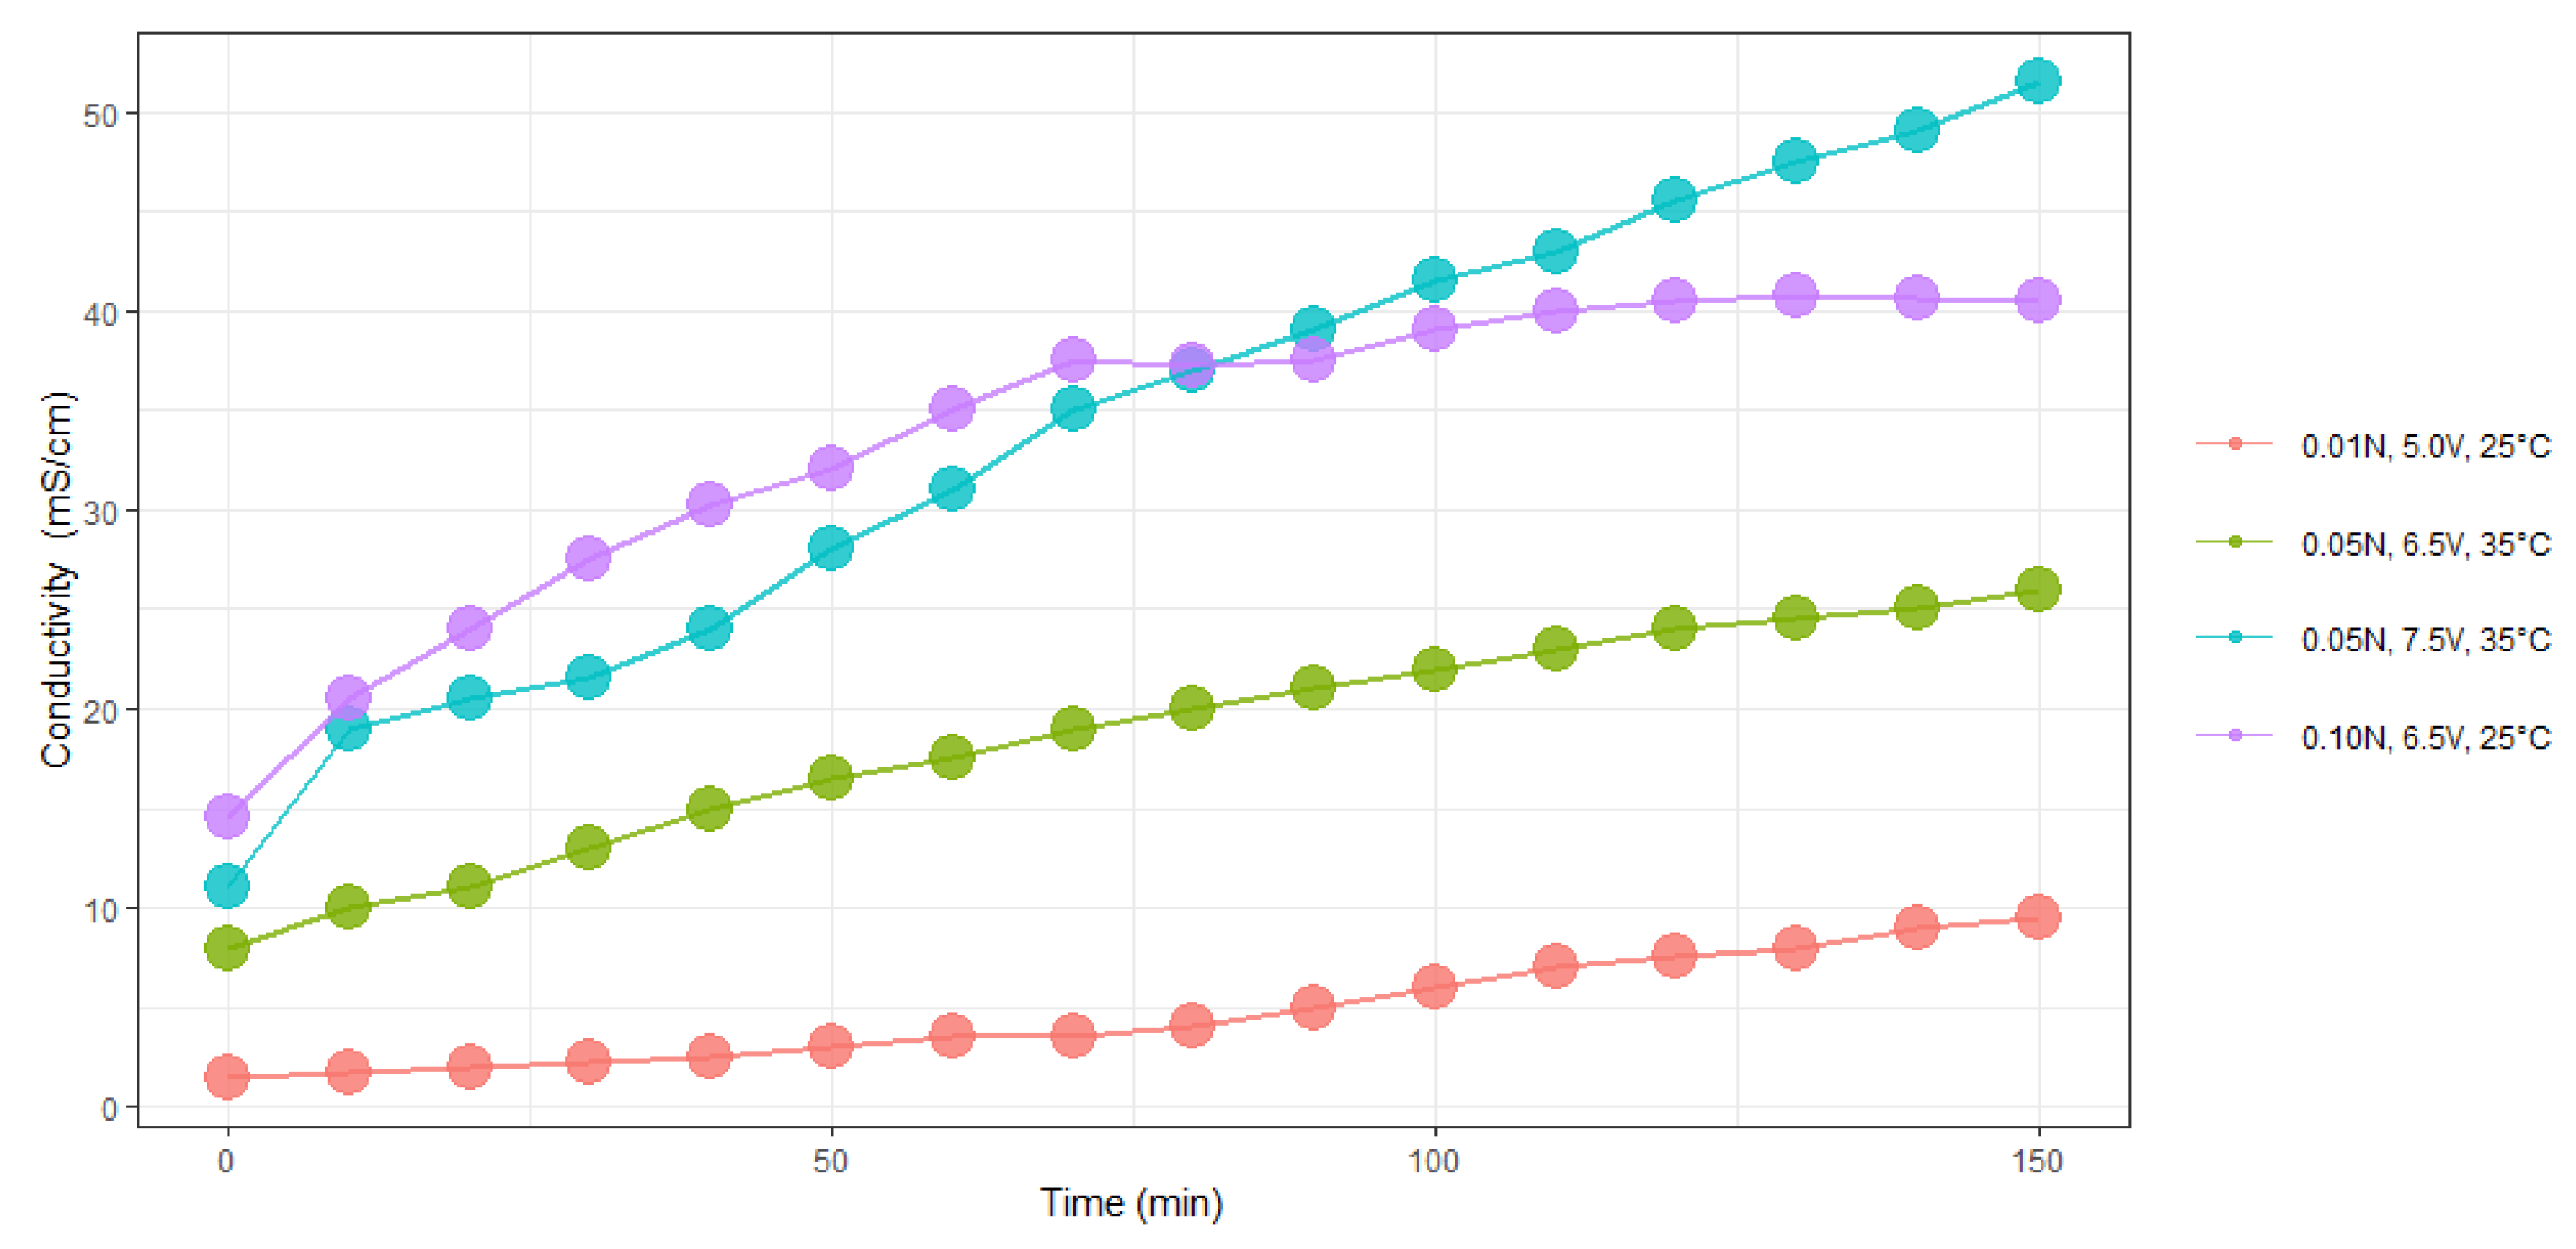
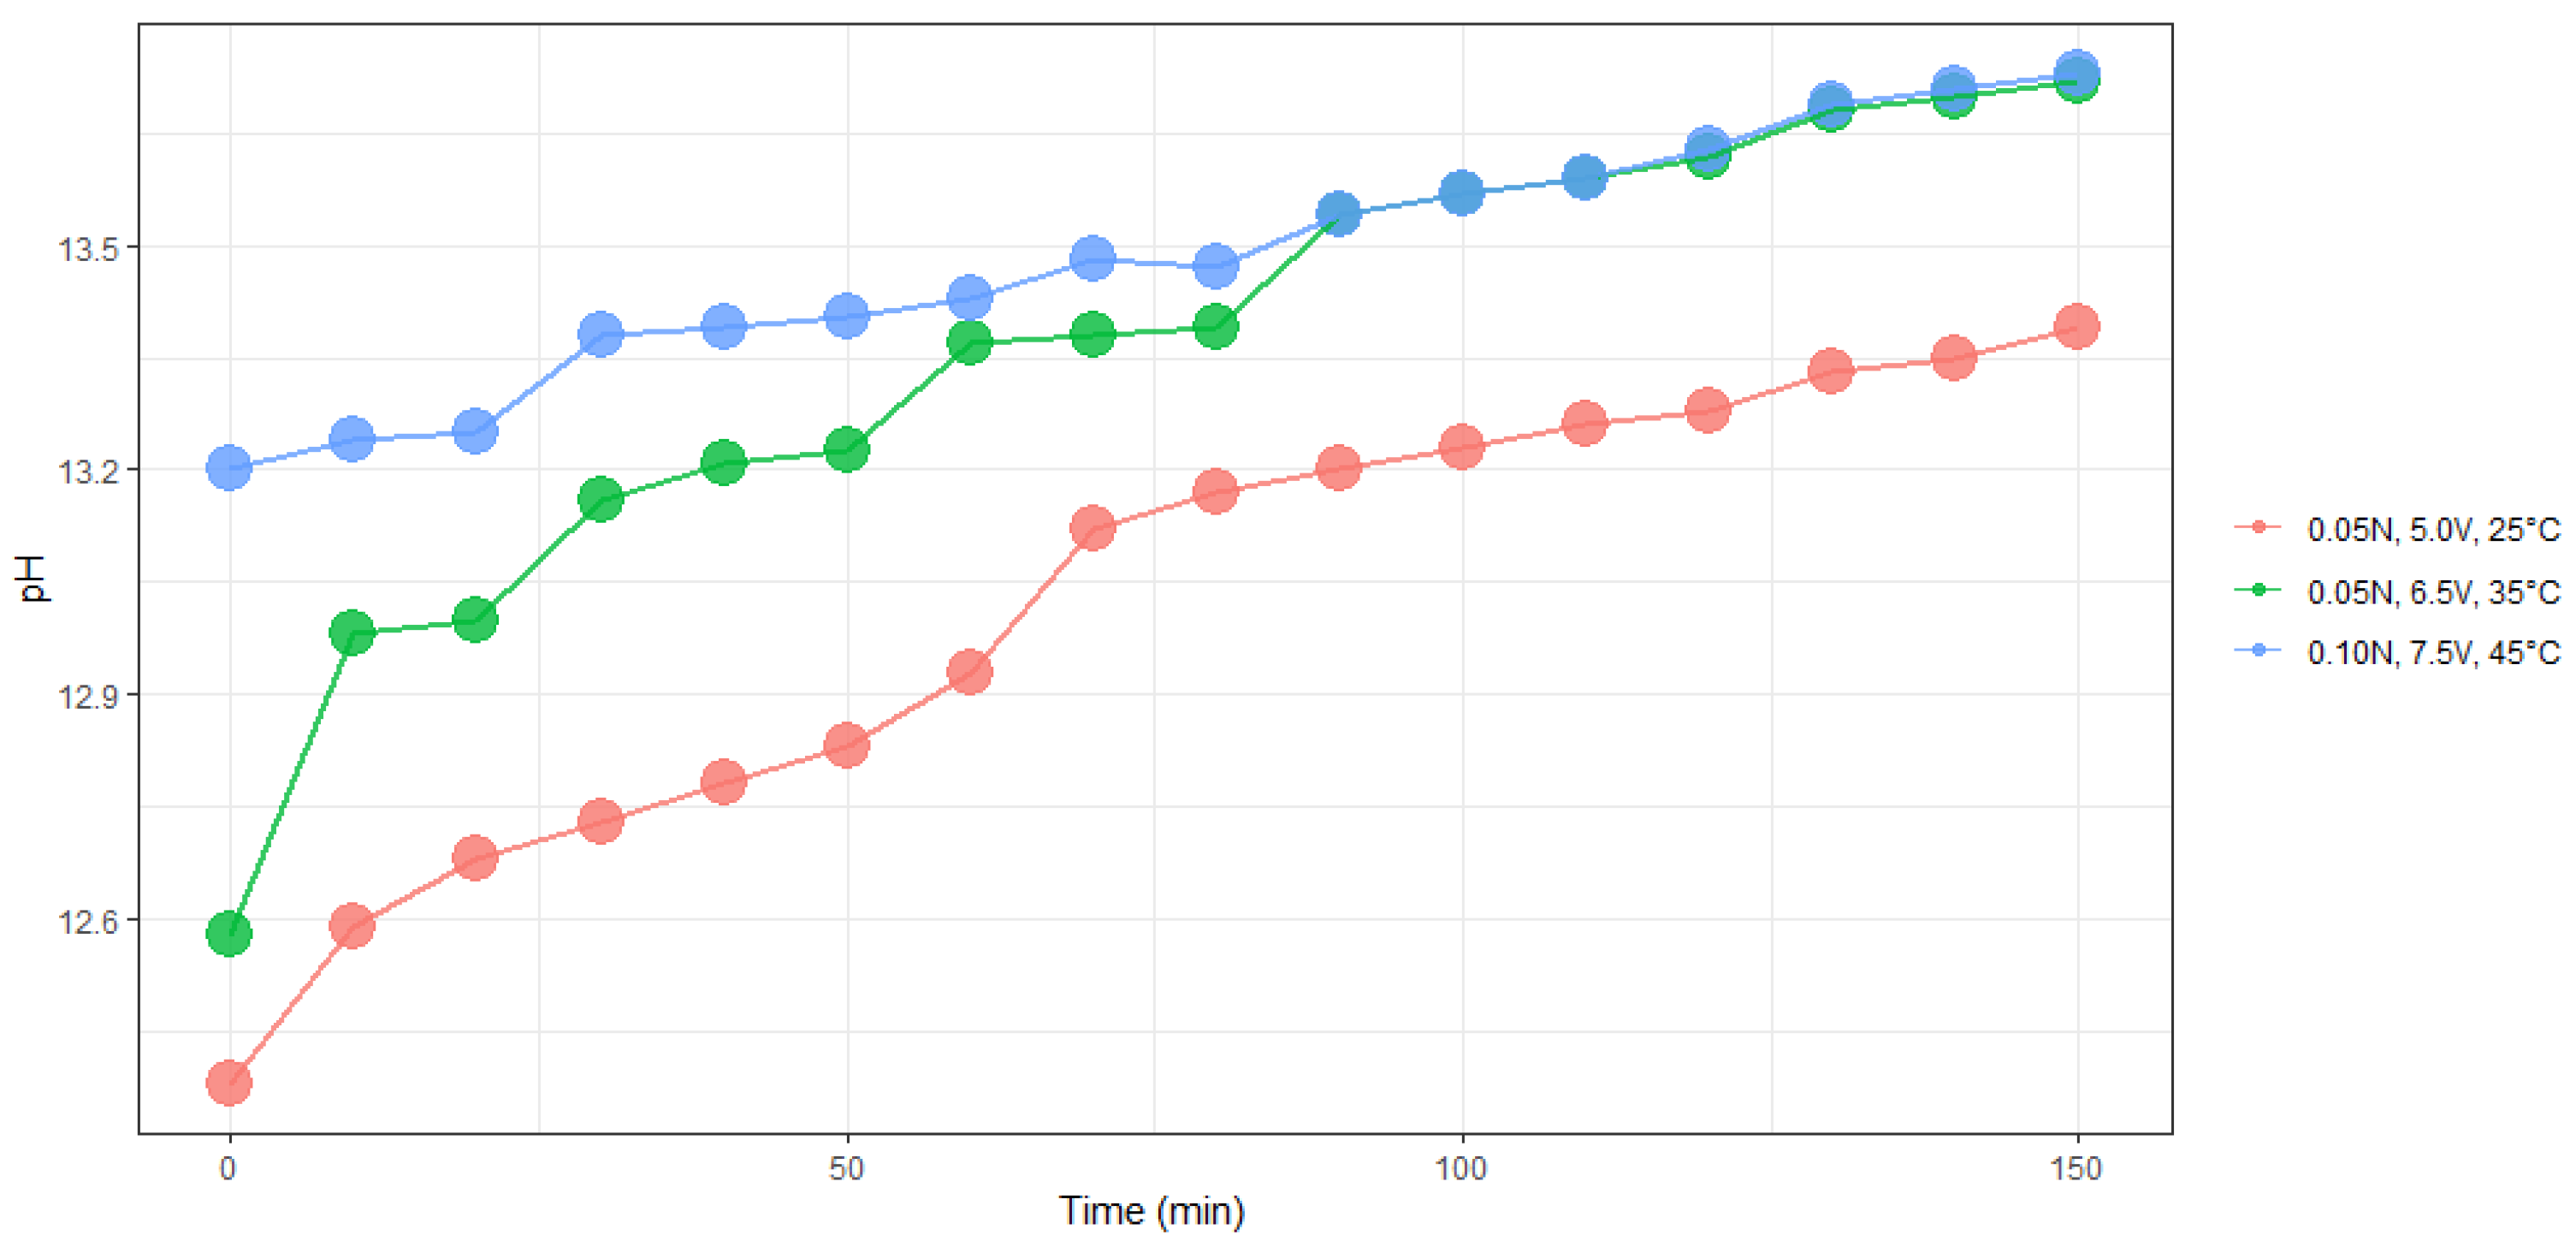
Figure 7 and
Figure 8 show the evolution of electrical conductivity and pH over time at different conditions of concentration, temperature, and voltage.
In both experiments, we found a linear trend between electrical conductivity and pH with time of electrolysis.
To evaluate the influence of current intensity on NaOH production, experiments were carried out at an electric potential of 5.0 V, 6.5 V, and 7.5 V at 25
C and an initial concentration of 0.05 N of NaOH. This is shown in
Figure 9.
In this experiment we appreciate that in the first few minutes the intensity of the current increased, then its value changed, and finally stabilised over time.
Current efficiency is an important parameter in determining the operating range of an electrolytic cell. The current efficiency was calculated based on the concentrations of the final base. It is defined as the ratio of the electrical charge used for the transport of ion to the total electrical current charge [
28], and is calculated by (11):
current efficiency.
F: Faraday constant (96,500 A.s/ mol).
: initial and final concentration of the solution mol/L.
i: electric current intensity .
number of cell pars.
: volume of recirculated solution.
z: electric charge.
The efficiency for each experiment was carried out at 25
C, an initial concentration of 0.01N NaOH, a workflow of 400 mL/min, and a NaCl concentration of 40 g/L. This current efficiency is presented in
Table 2.
The result of the current efficiency obtained can be compared with other work carried out under different operating conditions. In Savari et al. [
29] used a flow of 66 mL/min, a NaCl concentration of 58.5 g/L, and a commercial NAFION-117 membrane [
30] was also used. In this work, an average efficiency was obtained that was quite similar to our work, equal to 80.1% at different operating conditions. In both cases, the same operating time of 150 min was used. This information is shown in
Table 3, adapting and modifying from [
29].
We can conclude that the average efficiency in our research was 80.2%, which represents a good efficiency of our experimental equipment, and a greater quantity of NaOH was also produced. Regarding the economic considerations of our cell to carry out the experiment, we mentioned that the design and construction cost an average of 500 dollars. This cost can be considered quite low compared to other similar research.
4. Conclusions
In the present study, the operating parameters of the electrolysis of a model sodium chloride solution on the formation of NaOH were studied, using graphite electrodes and a cation exchange membrane.
The results obtained in our experiment indicate that the best operating conditions are found at a cell voltage of 7.5 V, an initial concentration in the cathodic compartment of 0.1 N NaOH, and a temperature of 45 C. Obtained in each case were the highest values of the NaOH concentration after 150 min.
In addition, the average electric current efficiency was obtained at the conditions of 25 C, initial NaOH concentration of 0.01 N, and voltages of 5.0 V, 6.5 V, and 7.5 V. Its average value was 80.2%.
The applied tension was identified as one of the most significant variables to reach the concentration of sodium hydroxide. This is mainly due to its direct relationship with the consumption of electrical energy. Finally, we mention that the results of the study show that the electrochemistry of the membrane process offers a method that is an interesting economic alternative for the synthesis of NaOH.
As future work, we hope to study other operational variables, such as: sodium hydroxide flux, types of membranes and their durability, electrode materials in relation to specific energy consumption, and process efficiency.
