Article

Calendar Aging of Li-Ion Cells—Experimental Investigation and Empirical Correlation

Institute of Thermal Process Engineering (TVT), Karlsruhe Institute of Technology (KIT), Engelbert-Arnold-Str. 4, 76131 Karlsruhe, Germany
*
Authors to whom correspondence should be addressed.
Batteries 2021, 7(2), 28; https://doi.org/10.3390/batteries7020028
Submission received: 1 March 2021 / Revised: 4 April 2021 / Accepted: 24 April 2021 / Published: 30 April 2021
(This article belongs to the Special Issue Lithium-Ion Batteries Aging Mechanisms)

Abstract

:
The lifetime of the battery significantly influences the acceptance of electric vehicles. Calendar aging contributes to the limited operating lifetime of lithium-ion batteries. Therefore, its consideration in addition to cyclical aging is essential to understand battery degradation. This study consequently examines the same graphite/NCA pouch cell that was the subject of previously published cyclic aging tests. The cells were aged at different temperatures and states of charge. The self-discharge was continuously monitored, and after each storage period, the remaining capacity and the impedance were measured. The focus of this publication is on the correlation of the measurements. An aging correlation is obtained that is valid for a wide range of temperatures and states of charge. The results show an accelerated capacity fade and impedance rise with increasing temperature, following the law of Arrhenius. However, the obtained data do also indicate that there is no path dependency, i.e., earlier periods at different temperature levels do not affect the present degradation rate. A large impact of the storage state of charge at 100% is evident, whereas the influence is small below 80%. Instead of the commonly applied square root of the time function, our results are in excellent agreement with an exponential function.

1. Introduction

Due to their advantages over other energy storage systems, lithium-ion batteries are used in numerous applications, especially in electric mobility. A severe drawback to the acceptance of electric vehicles is the battery’s limited lifetime. Many authors studied aging [1,2,3,4,5,6,7,8,9,10,11,12] and determine various mechanisms that lead to a reduced lifetime [13,14,15].
These processes cause a capacity and power fade at the cell level, which is usually quantified by the remaining capacity and the impedance. The typical end of life criterion for electric vehicles is a remaining capacity of less than 80% or an increase in the impedance of 100% [16]. Although the battery is not used during significant parts of its lifetime, it ages during those idle periods. The studies show that for calendar aging, the two main parameters which affect degradation behavior over time are the storage temperature and the state of charge (SoC). Both, for higher temperatures and higher SoC, the aging is accelerated [3,4,5,6,7,8,9,10,11,12]. Nevertheless, temperature is the main influencing variable and significantly determines long-term behavior.
Dubarry et al. reviewed how battery cells age differently during storage, depending on the cells’ chemistry [17]. Comparing the capacity fade of graphite anodes combined with different cathode materials, they found a high temperature and SoC dependency for LCO, especially for an SoC above 50%. These dependencies are less pronounced for NCA, while NMC lies somewhere in between.
The analysis of different cathode compositions by Kasnatscheew et al. and Xu et al. also showed the high temperature and SoC dependency of LCO cathodes during cyclic aging. It also revealed a complex dependency on the NMC composition with respect to the stability of the materials to a temperature rise and increased cut-off voltage. An increase in the nickel content to enhance energy density reduces the stability and raises the degradation rate, which can be counteracted by an increase in the manganese content within the composition [18,19,20,21].
The SoC dependency of graphite/NCA cells investigated by Keil et al. [8,11] revealed two linear dependencies above and below 60% storage SoC. They have the same slope versus SoC, but the average aging rate is increased above 60% storage SoC.
In many applications, it is essential to know and predict the aging behavior of batteries. A wide variety of models can be used for this purpose. The model should be as simple as possible while providing good accuracy. A common approach is fitting an empirical model to measurement data.
Many empirical aging models apply a square root function to characterize capacity fade and impedance rise over time during the aging of Li-ion cells. This approach is based on the consideration of Peled [22] on the growth of the solid electrolyte interface (SEI). He related the resistivity of the SEI to its thickness and derives a parabolic law as a “first approximation only” [23] for an ideal SEI growth rate. Assuming that SEI growth is the primary aging mechanism and active lithium is lost in the process, this approach might be justified for the capacity fade. For the increase in the polarization resistance, however, the theoretical basis is lacking. This approach is widely applied in the literature, although in many cases the square root function does not adequately describe the measured data. To improve this discrepancy, modifications were made concerning the exponent [5,10,12,24,25], or a linear term is added to enhance the model regarding the long-term or fast aging [4,26]. However, approaches that are completely detached from the root are scarce [12]. Examples are the Eyring equation employed by Redondo et al. [27,28] or an exponential approach by Cuervo-Reyes et al. [29].
While there are different correlations in the literature for the time dependency of the aging behavior, the authors agree on the description of the temperature influence. The Arrhenius approach is usually used for this purpose [4,5,6,12,30,31,32]. It describes the exponential increase in the chemical reaction rate with increasing temperature and explains accelerated aging at higher temperatures [33].
Another rarely addressed aspect is the path dependency of aging processes. If the influence of past conditions could be excluded, the modeling of the aging behavior would be a lot easier. Su et al. found a path dependency of the impedance rise regarding the SoC, but no dependency on temperature [34]. For the capacity fade, they did not reveal any path dependency.
Lithium-ion batteries exhibit a relatively low self-discharge during storage compared to other battery technologies. There is not much literature on this topic, although this phenomenon gains importance for higher SoC, especially when combined with high temperature.
The combination of elevated temperatures and high SoC leads to self-discharge during the storage periods if the cell voltage is not kept constant by external measures. The resulting voltage drift is equivalent to a changing SoC during storage. The exponential decay model approach by Deutschen et al. is suitable to describe the voltage course for short- and long-time storage periods [35]. Similarly, Redondo et al. described the self-discharge with an exponential decay model for the cell leakage current during storage over time [27].
In this work, the results of a calendar aging study are presented, including the progress of capacity fade and impedance rise for different conditions, as well as findings concerning self-discharge and path dependency. The experimental results will be interpreted, correlated with the storage conditions, and an alternative empirical modeling approach will be proposed and discussed.

2. Experimental Setup

2.1. Boundary Conditions and Testing Procedure

This study is based on a lithium-ion cell from Kokam Co., Ltd. (Gyeonggi-do, Korea) with a graphite anode and a blended cathode comprising LiCoO2 and LiNixCoyAlzO2. It has a nominal capacity of 3.2 Ah, a nominal voltage of 3.7 V, and voltage limits of 2.7 V and 4.2 V. The voltage-SoC characteristic of these cells, acquired as a quasi-open-circuit voltage (OCV) at a low C-rate of C/20 at beginning of life (BoL), is depicted in Figure 1a. The same cell type was already used for the study on cyclic aging, as published in [1,2].
The cells were aged at open-circuit (OC) condition at 35, 50, 65, 80 and 100% SoC at three temperature levels of 40 °C (green), 50 °C (yellow) and 60 °C (red), respectively, and at 20% and 90% SoC at 60 °C. These conditions are provided in Figure 1b as an overview and marked on the quasi-OCV in Figure 1a. The most extreme boundary condition, namely 100% SoC and 60 °C, was chosen for float measurements at a constant voltage. For all combinations, the same conditions were applied to at least two cells. The colors and marker shapes used in Figure 1 indicate throughout this publication the temperatures and SoC, respectively.
Temperature control via individually designed cell holders with fluid temperature control enabled precise and constant temperature regulation. This results in a mean setpoint deviation of less than 0.01 K over all aging periods with a mean standard deviation less than 0.03 K. The temperatures were measured using thermocouples type K connected to a NI 9213 thermocouple module (National Instruments Corporation, Austin, TX, USA). Similar to the test series of cyclic aging [1], springs were used for the cell mountings to ensure that the cells are clamped with a constant pressure of p = 3.3 N cm−1. The whole setup was placed in insulated safety boxes that were purged with dehumidified air. During aging, the temperature, as well as the voltages of the individual cells, were permanently monitored, so that in addition to mere aging data, conclusions about self-discharge can be drawn.
The remaining capacity and the impedance were determined in intermediate characterizations described in the cyclic aging study [1]. The characterizations were carried out using a CTS Lab cell test device (BaSyTec GmbH, Asselfingen, Germany) and the electrochemical impedance spectroscopy (EIS) measurements were conducted using the ZENNIUM Electrochemical Workstation extended by a PMux-S cell multiplexer (both ZAHNER-Elektrik GmbH & Co. KG, Kronach, Germany). These measurements were performed at 25 °C and 50% SoC for the EIS measurements, while the cells remained permanently in their original positions.
The SoC for the subsequent aging period refers to the capacity determined in each intermediate characterization. The impedance was evaluated by extracting the ohmic and polarization resistance from the recorded impedance spectra. Therefore, the same equivalent circuit model (ECM) used in the corresponding study on cyclic aging [2] is fitted to the measurement data.
To keep the alteration of the calendar aging process as low as possible, the intermediate characterizations are designed for a minimum charge throughput and the lowest possible load intensity.

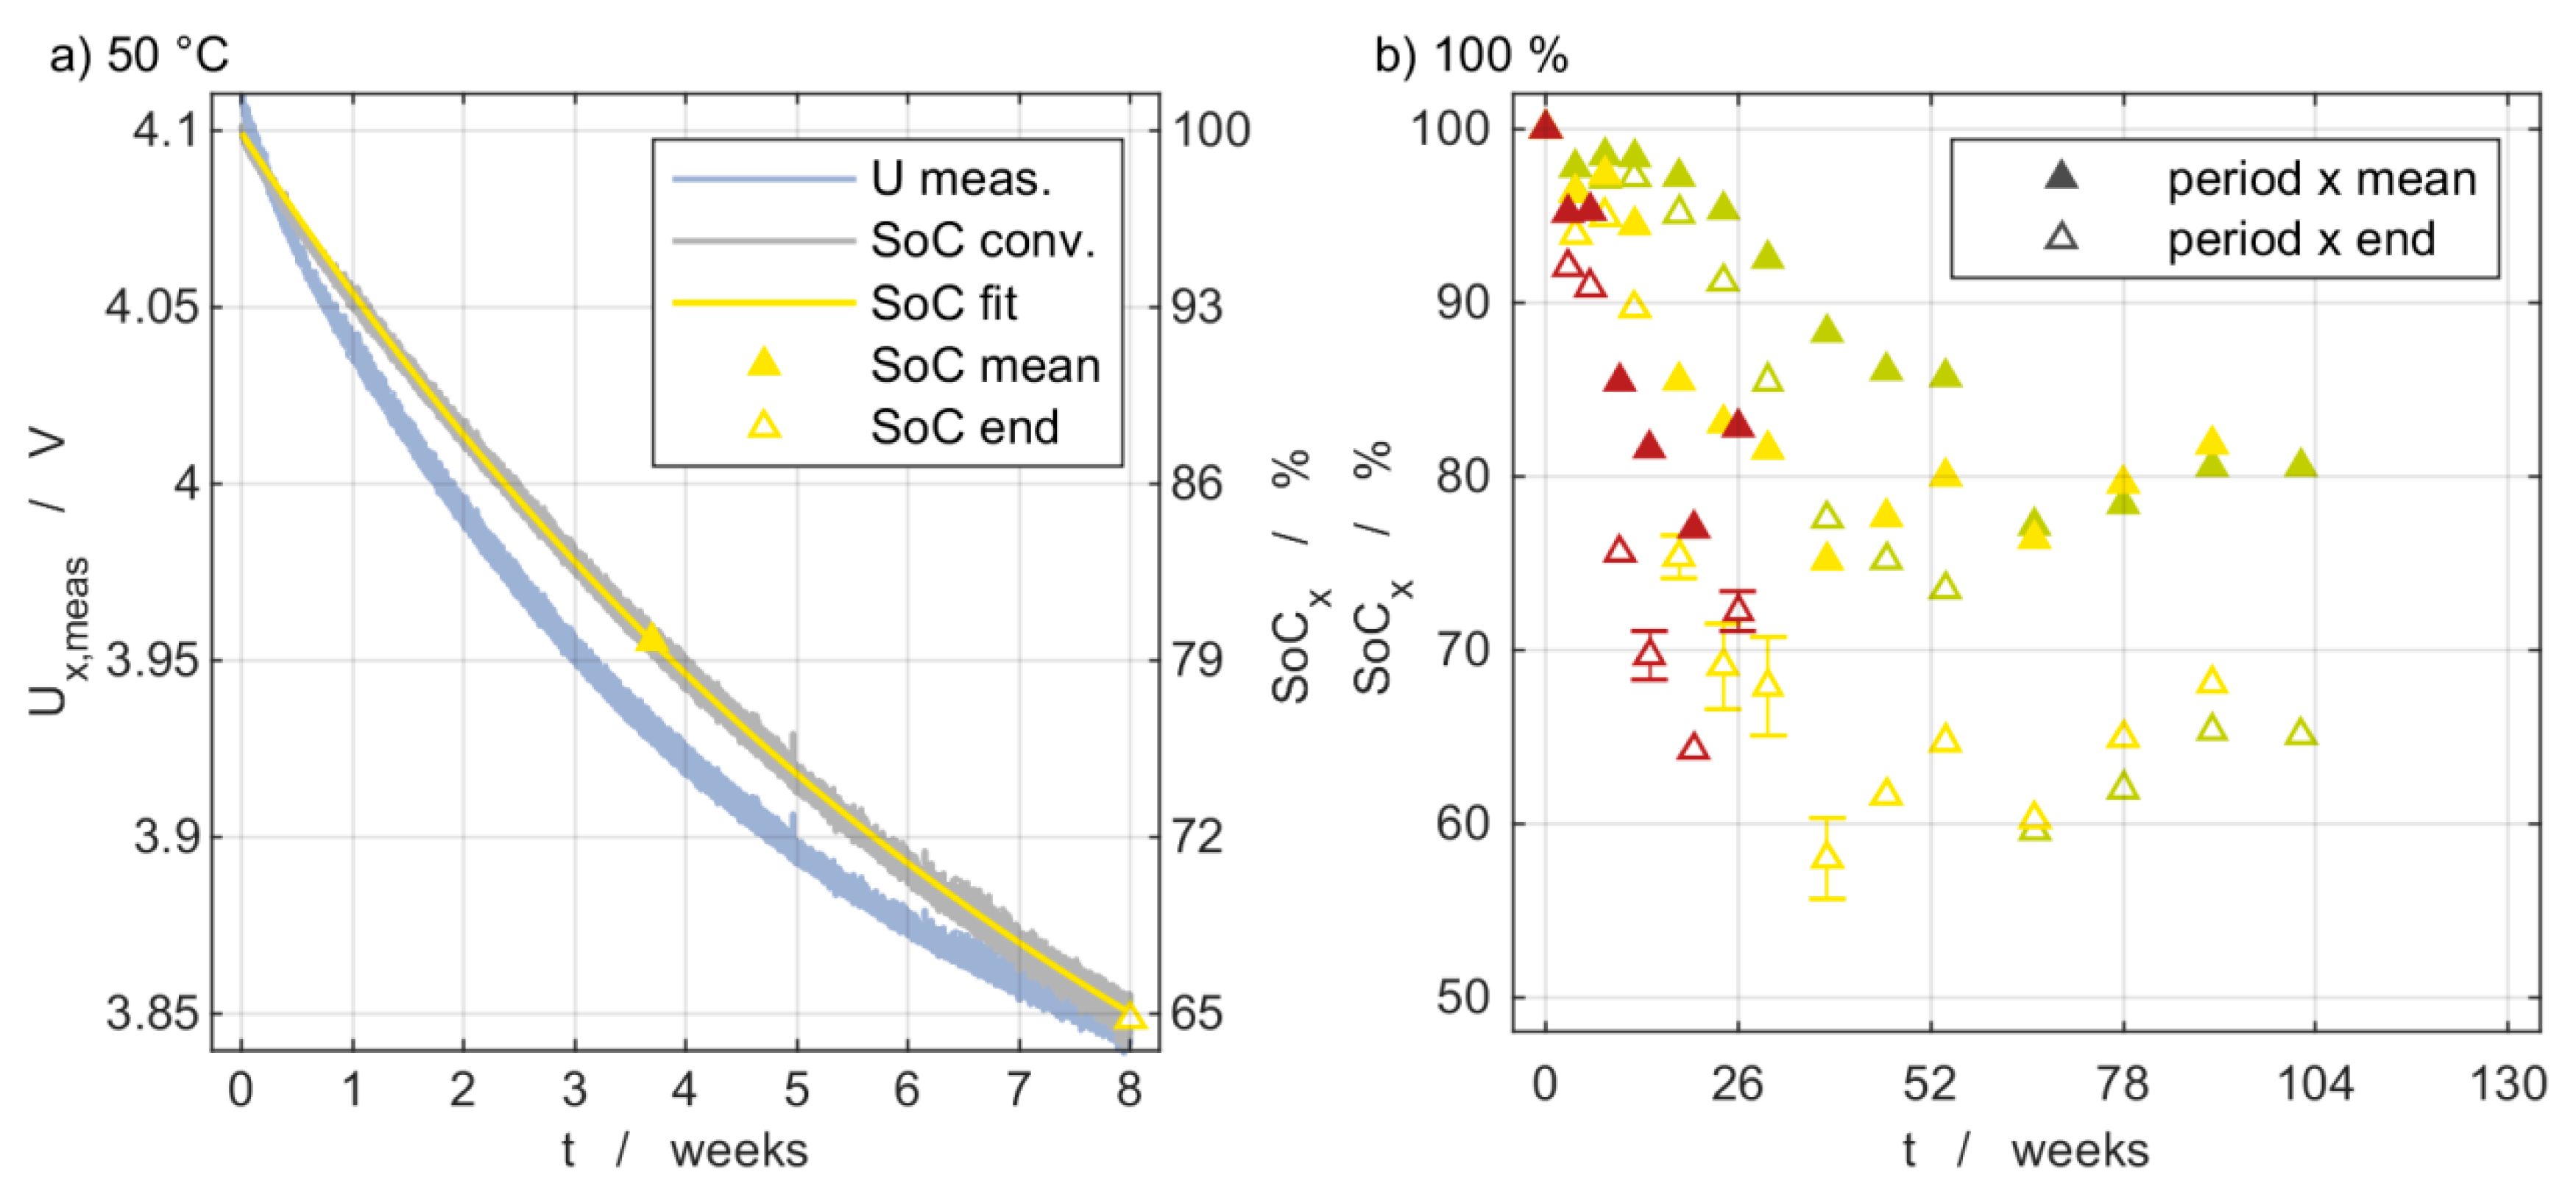
2.2. Self-Discharge during Storage

The cells were stored under open-circuit (OC) conditions. In contrast to constant-voltage (CV) or so-called float conditions, the voltage decreases during each storage period. In this publication, self-discharge refers to the voltage decline of the cell during the storage period and thus comprises all internal processes that lead to such a voltage drop. During storage periods, the cell voltages were measured by NI 9205 multifunction modules (National Instruments Corporation, Austin, TX, USA).
Two approaches are applied to determine the self-discharge. Firstly, by measuring the charge throughput after each storage period to reach 100% SoC. Equation (1) is used to calculate the self-discharge (SDx) during aging period x. The charge throughput QSoC,x−1 for charging to the desired SoC after the intermediate characterization x − 1 is added to the charge throughput for charging to 100% SoC (Q100%−SoC,x) at the beginning of the characterization after aging period x. The sum is normalized to the cell capacity CN,x−1 measured during the intermediate characterization x − 1.
S D x = C N , x 1 ( Q SoC , x 1 + Q 100 % SoC , x ) C N , x 1 < 0
Secondly, the self-discharge can be determined by assigning the measured voltages during aging periods to the previously measured open-circuit voltage (OCVx−1). Following the process described in Equation (2), the voltage is converted into an SoC via reverse interpolation.
U x , meas t O C V x 1 S o C x , intp t
S o C x , fit t = S o C x , fit , + ( S o C x , fit , start S o C x , fit , ) e x p ( s 1 t )
Due to the self-discharge, the SoC decline is especially crucial for storage, starting at 100% SoC. To consider this phenomenon for evaluation, the voltage decrease is transferred into an SoC decrease, and a mean storage SoC is determined. The procedure follows the steps below for the cells stored at 100% SoC:
  • Transferring the voltage progression into an SoC progression. Based on the OCV from the previous intermediate characterization x − 1, an SoC value is assigned to each voltage value according to Equation (2). The approach is comparable to the long-time model equations for self-discharge presented by Deutschen et al. [35].
  • Fitting of the SoC decline over time according to Equation (3) This approach is in accordance with the exponential decay model describing leakage current during self-discharge presented by Redondo et al. [27].
  • Calculating an equivalent mean storage SoC via integration over time.
Measurement points with self-discharge larger than 5% are not considered for later calculations due to the high uncertainty in assigning them to a certain SoC. Cells stored at a lower SoC experienced a lower self-discharge, so it is sufficient to perform a linear averaging of initial and final SoC. To prevent self-discharge and to obtain data points at 100% SoC, additional float measurements were performed at 60 °C.

2.3. Path Dependency of Temperature Changes

In addition to the temperature influence on aging, the path dependency is considered. This aspect was investigated on cells with 35% and 80% SoC and by means of temperature changes between 60 °C and 50 °C. The measurements were performed later and also served as replicate measurements; therefore, these cells are referred to as Batch II. The comparison of Batch I and Batch II is given in Table 1 and shows that the initial parameters are in good agreement.
To check a potential path dependency, one SoC in the higher and one in the lower SoC range were selected. The highest examined SoC without severe self-discharge is 80% and the lowest is 35%. Both, for 35% and 80% SoC, the cells at the two temperatures exhibit a similar capacity fade, but after different storage times of 3 and 8 weeks due to their different storage temperatures. The same is valid for the comparison of their capacity at the storage times of 6 and 18 weeks at 60 °C and 50 °C respectively. This enables a comparison of the results from Batch I with the results from Batch II with a temperature change during storage. During this follow-up measurement with Batch II, cells with the additional SoC levels of 20% and 90% were investigated.

3. Results and Discussion
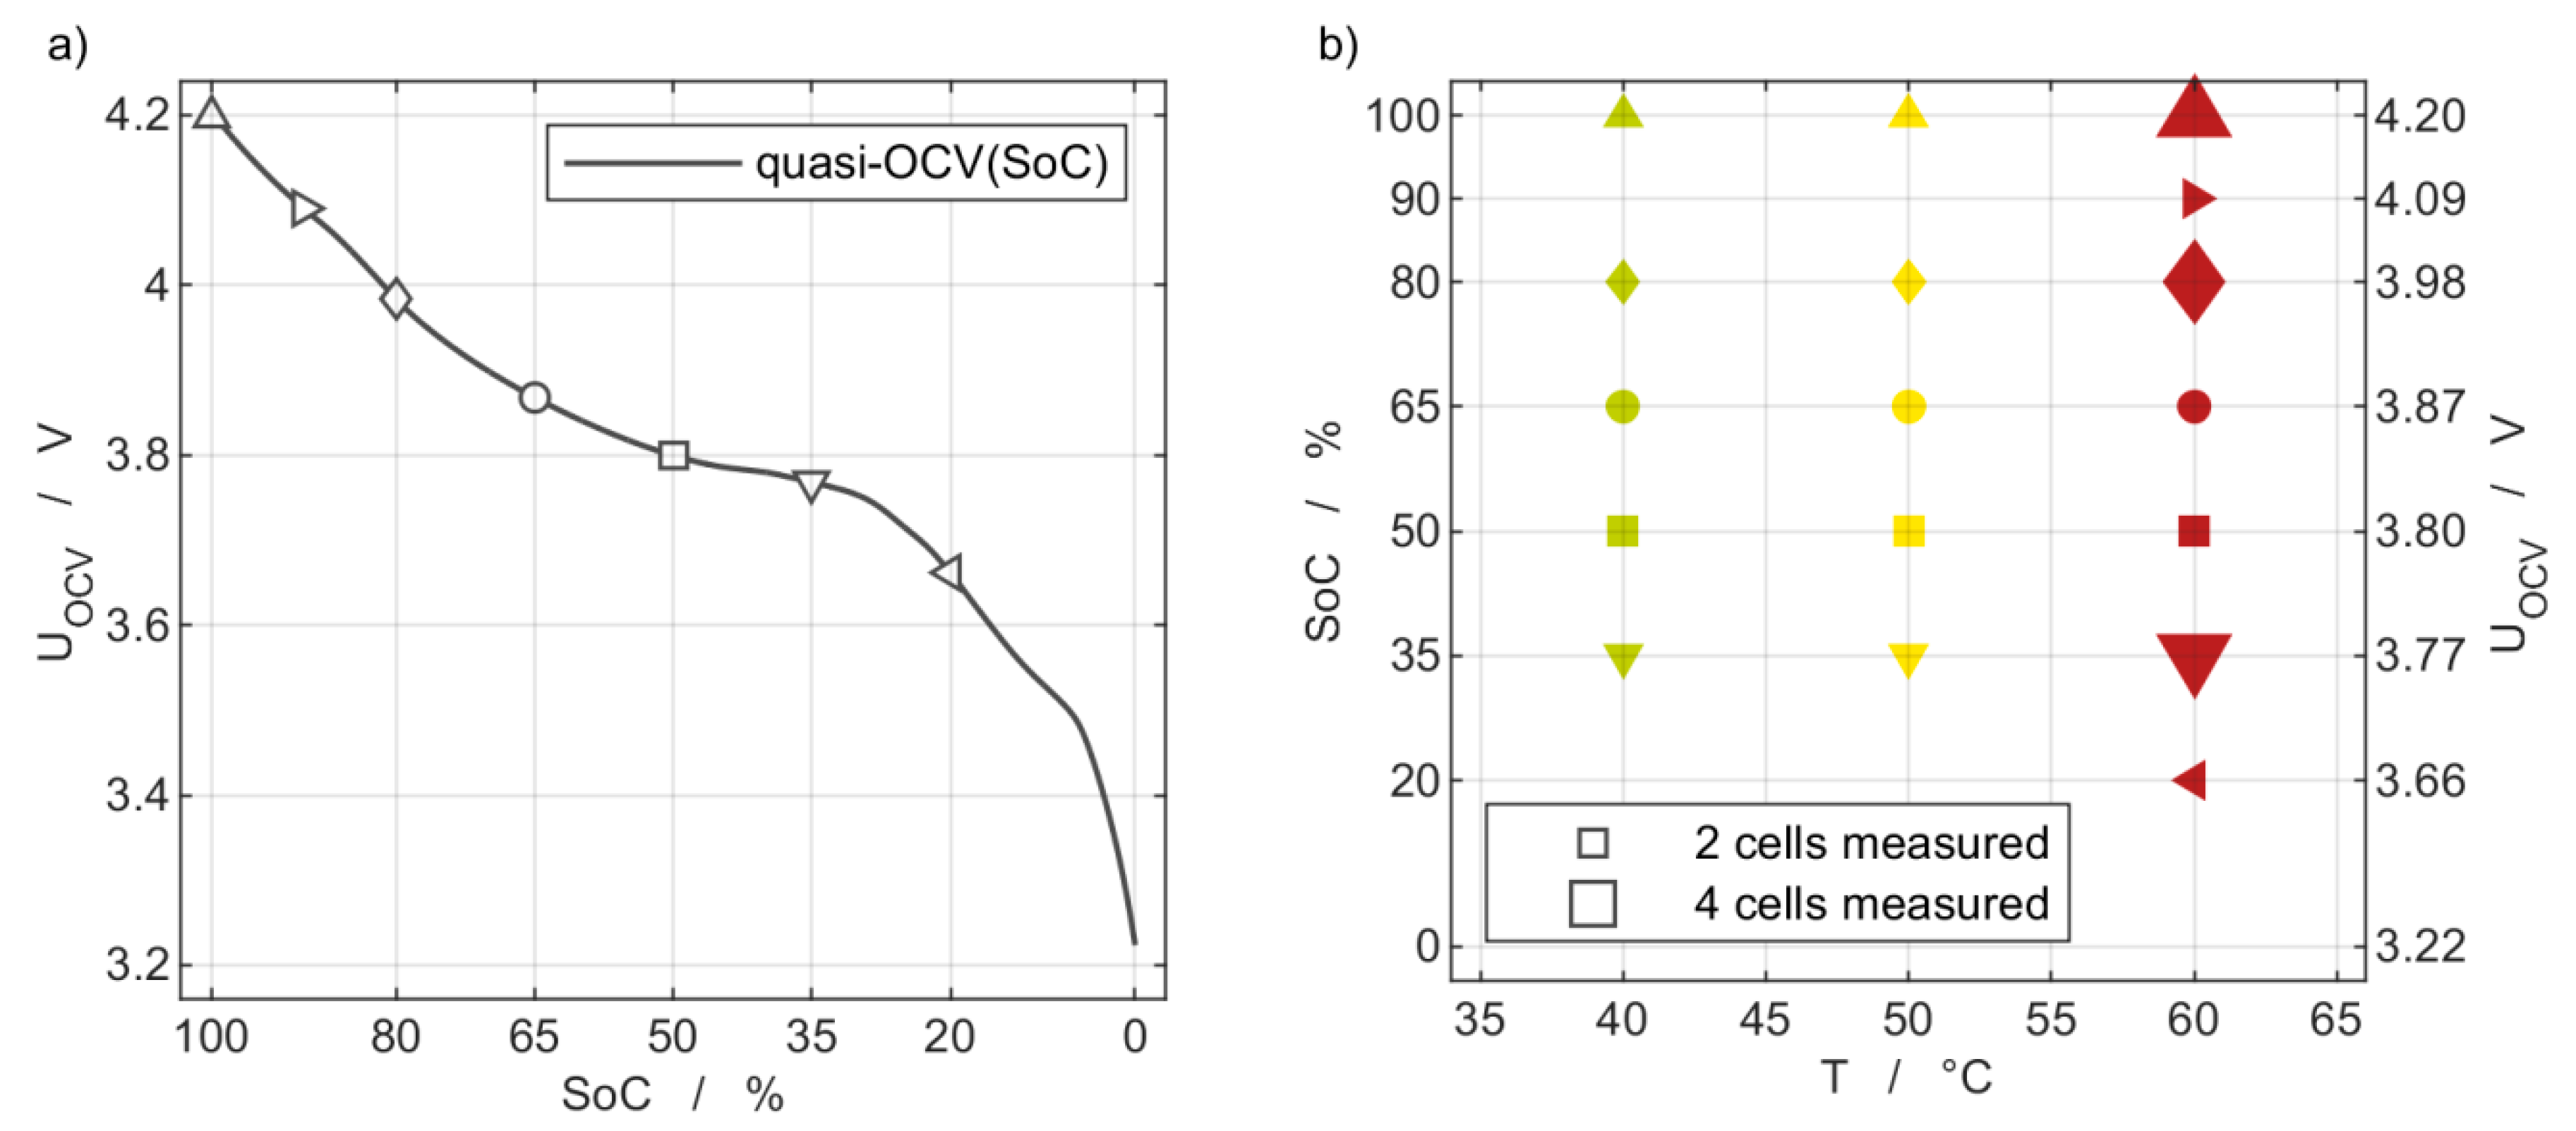
3.1. Initial State

The 38 cells were exposed to 60 full cycles at C/5 current rate and a temperature of 25 °C before BoL characterization, and electrochemical impedance was measured after 0, 10, 30, and 60 cycles. The BoL state was defined similarly to the cyclic aging study [1] and based on a first-time increasing polarization resistance and a stable discharge capacity. Both were observed after the completion of the initial 60 full cycles.
The following initial characterization was used to determine the reference state at BoL. Table 1 shows the values for the quantities CC/20, Rohm and Rpol examined and discussed in the further course of the publication and by which the aging is assessed. The discharge capacity CC/20 was measured at a C/20 current rate between the cut-off voltages 4.2 V and 2.7 V. The two impedance values Rohm and Rpol result from the ECM fit of the measured impedance spectra following the evaluation described in [2]. The cells exhibit minimal scattering for all quantities. The deviations between Batch I and Batch II are negligible despite the intermediate storage over 21 months at approximately 25 °C and 50% SoC.

3.2. Self-Discharge Evaluation

Since the tests were performed under OC conditions after adjusting the designated storage SoC, the voltage decline was recorded during aging. The self-discharge is relatively low for most conditions within the measuring matrix and is typically less than 2.5%, as shown in Table 2.
However, at the storage SoC of 100%, the self-discharge is substantial and increases with aging. It also increases for higher temperatures. Figure 2a illustrates the self-discharge at 100% and 50 °C during an aging interval of eight weeks. The measured voltage profile Umeas depicted in blue is converted into the SoC profile SoCconv in gray according to the second approach described above in Section 2.2. The graphs are noisy because of the low resolution of the voltage measurement. Nevertheless, the decrease in the voltage, respectively the SoC over time is apparent and can be approximated by an exponential function SoCfit illustrated by the yellow line. Besides the noise, there is a slight offset in the voltage when measuring via the NI modules compared to the measurement of the CTS Lab cell test device. Since this offset is constant in the voltage range of the cell, it can be easily corrected. The empty marker SoCend represents the first approach for determining the self-discharge mentioned in Section 2.2. It gives the SoC of the cell at the end of the aging period and is calculated by the set-SoC of 100% and the charge that was necessary to recharge the cell to this SoC. At this point, the SoCend values are only used for the validation of the SoCfit. The difference between SoCend and the evaluation of SoCfit at the end of the storage period is typically 1.0 ± 1.1%. The yellow marker SoCmean indicates the equivalent mean storage SoC via integration of SoCfit over time.
The self-discharge alters the supposed SoC influence, as the SoC decreases during storage. Redondo et al. studied the self-discharge at different combinations of SoC and temperature and found a strong influence on model fit parameters describing the voltage course over time [36]. To consider the self-discharge within our model in Section 3.4 and Section 3.5, the mean SoC is calculated for the evaluation and correlation of the degradation with the SoC.
In Figure 2b, the development of the self-discharge of the cells at 100% SoC is illustrated for the different temperatures. Empty symbols illustrate the SoC at the end of the aging period, while filled symbols indicate the mean SoC of each interval that was used for further evaluation. The self-discharge at the end of the storage periods increases for all temperatures as the aging proceeds until it reaches a level of saturation between 60% and 70% SoC. The scattering of the mean values and the values at the end of the periods can be mainly addressed to two issues. Firstly, besides the noise of the storage voltage measurements, the shape of the self-discharge voltage profiles over time changes during the overall aging process. Secondly, the OCV used for the subsequent conversion into SoC according to Equation (2) also changes its shape during the overall aging process. Both effects directly influence the calculation of the equivalent mean storage SoC via integration over time. A thorough explanation of the achieved and eventually limited SoC values at the end of the storage periods would require the investigation by means of half-cell measurements of each boundary condition and storage period during the overall aging process. These were not part of this investigation.

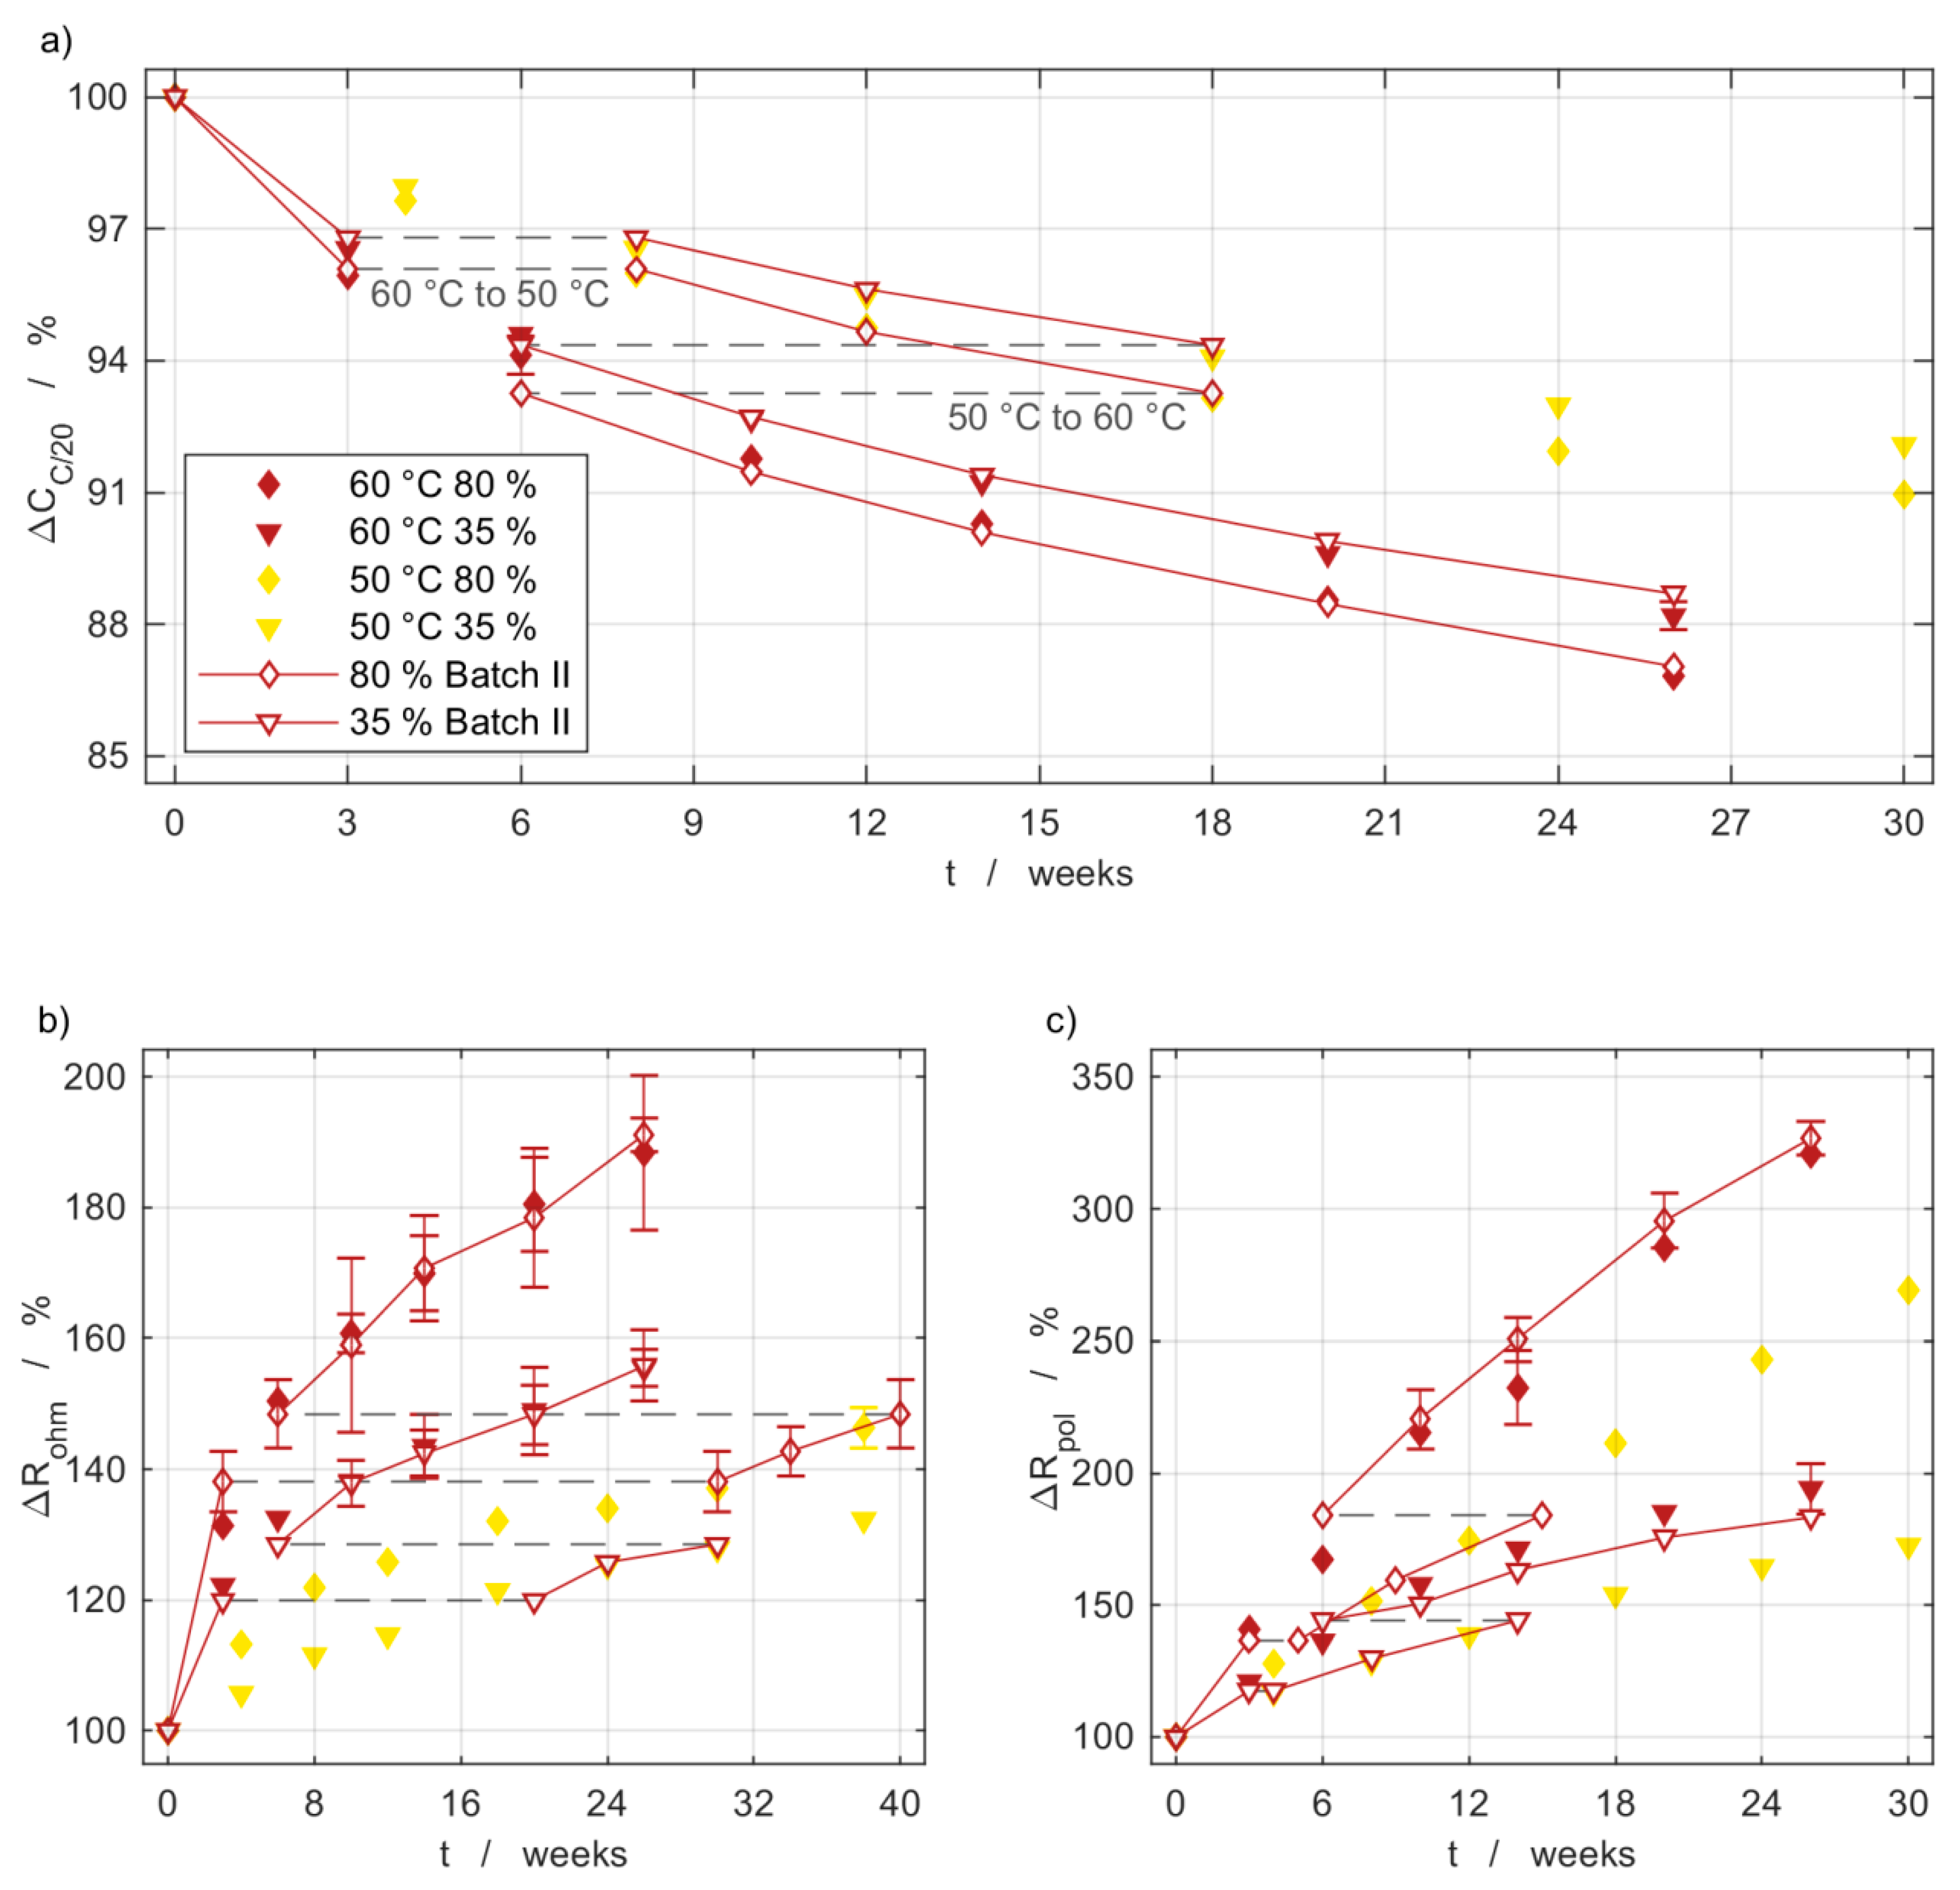
3.3. Path Dependency and Reproducibility

The path dependency regarding temperature was analyzed by a temperature variation between 60 °C and 50 °C with cells at 35% and 80% SoC. For those conditions, the cells at the two temperatures have a similar fade of capacity, but after different storage times. This was the criterion for the time when the temperature was changed.
In Figure 3, the results and procedure for the path dependency are shown. The results of Batch I for storage temperatures of 60 °C and 50°C are indicated with filled-in markers in red and yellow, respectively. The triangles represent the measurement results for the cells stored at 35%, while the diamonds represent those at 80%. The results of Batch II are depicted with empty red markers, which are connected with the solid line, whereas the dashed gray lines represent the two temperature changes. The markers show the mean value of the two cells that were aged under the same conditions, and the error bars indicate the standard deviation. When the error bars are not given in the diagram, the deviation is smaller than the symbol. The cells were firstly stored at 60 °C for three weeks. At this time, they had a similar capacity fade compared to the cells of Batch I stored at 50 °C after eight weeks, so then the temperature was changed the first time. The following aging paths of the ohmic and polarization resistance at 50 °C are assigned to the equivalent aging over time of the Batch I cells. After ten weeks of storage at 50 °C, the temperature was switched back to 60 °C.
The selection of the time for the temperature change was based on the capacity fade after three weeks at 60 °C and eight weeks at 50 °C so that the aging continues comparable to the cells without temperature transition. Obviously, this selection also affects the resistance, but neither the ohmic nor the polarization resistance has corresponding values at different intermediate characterizations at 60 °C and 50 °C. For this reason, the values are shifted in such a way that they fit to the course of the measured values on the curve of resistance rise. That is why the assignment is not unambiguous, and the time shift is not the same for the three quantities and the two SoC. However, the shift relative to the time after aging at 50 °C equals the shift before the aging period at 50 °C in each case.
First of all, it is evident from all three diagrams that aging is accelerated at a higher temperature or a higher SoC. Furthermore, the results for the first aging period show a high reproducibility. After the first temperature change of the cells from Batch II, the further aging of the capacity loss is identical to that of the cells in Batch I. The same applies when changing back the temperature to 60 °C. The slight deviations lie within the error bars. Due to the offset of the measuring points for the resistance values and the higher error bars for the results of the ohmic resistance, the statement regarding the resistance is not as distinct after changing to 50 °C. Nevertheless, the progression after the temperature change is very similar. In addition, the curves after the change back to 60 °C are almost exactly aligned. This means that in this case, the previous temperature has no relevance for the ongoing calendar aging process.

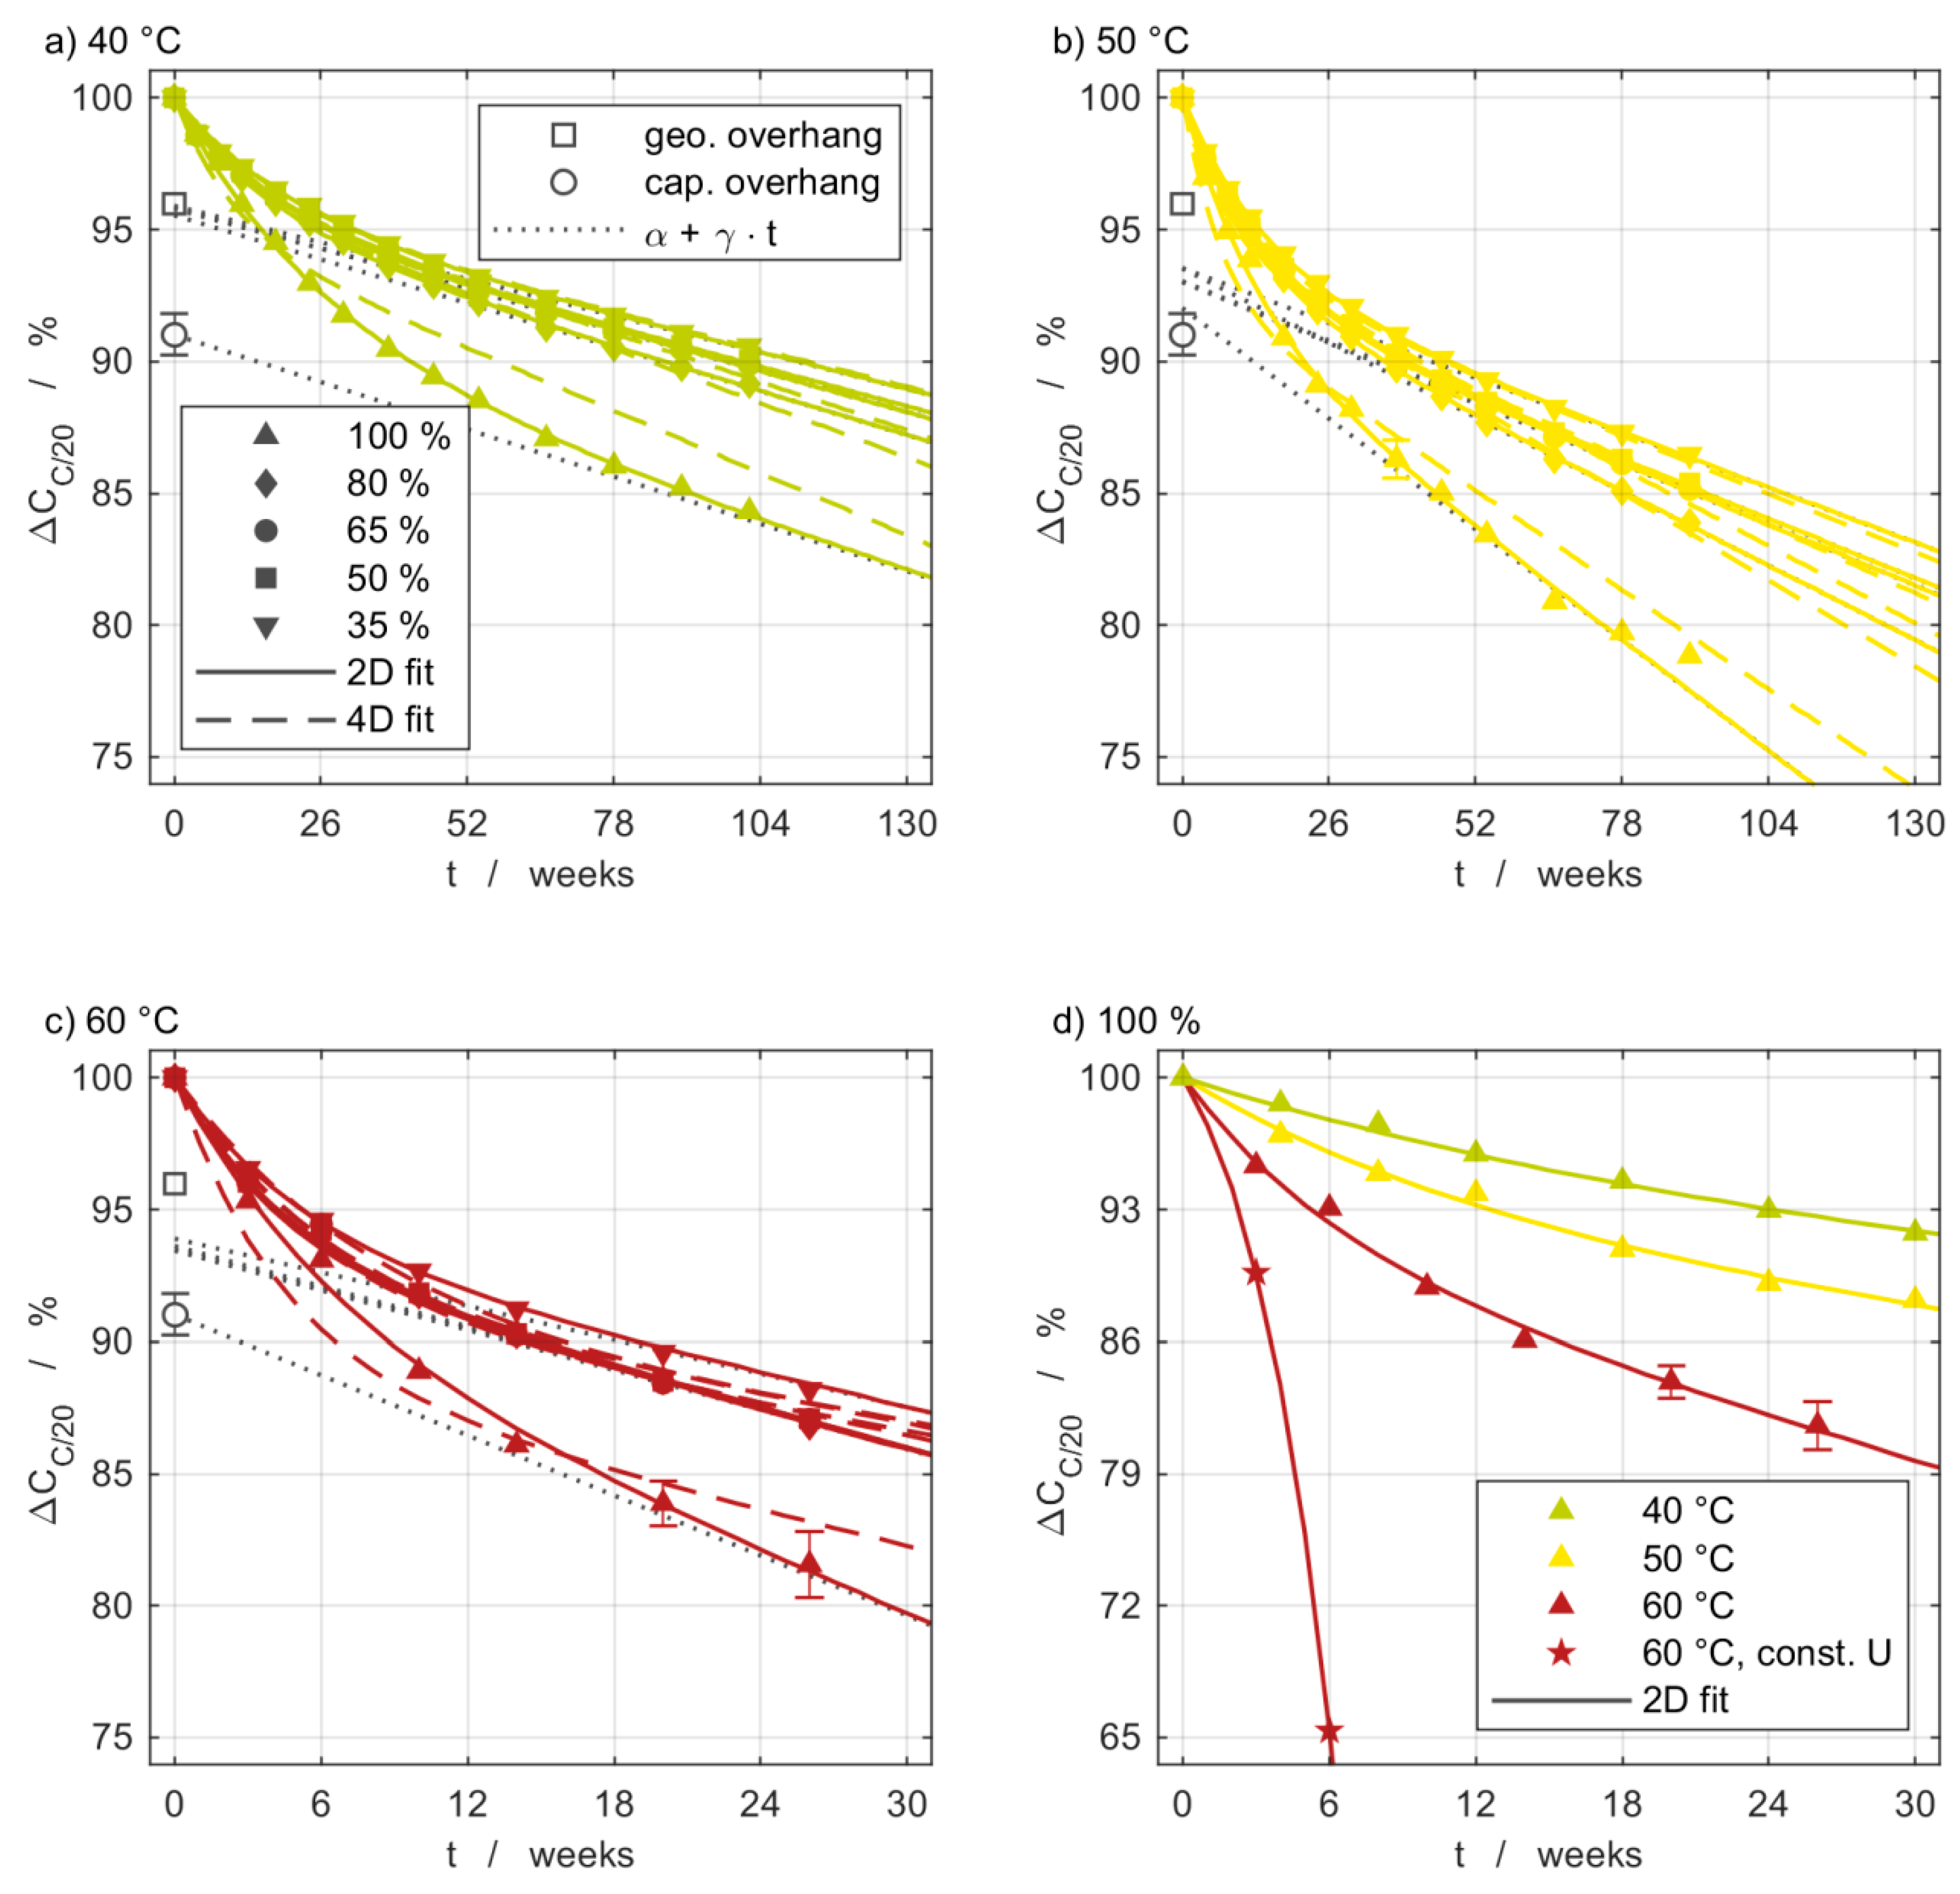
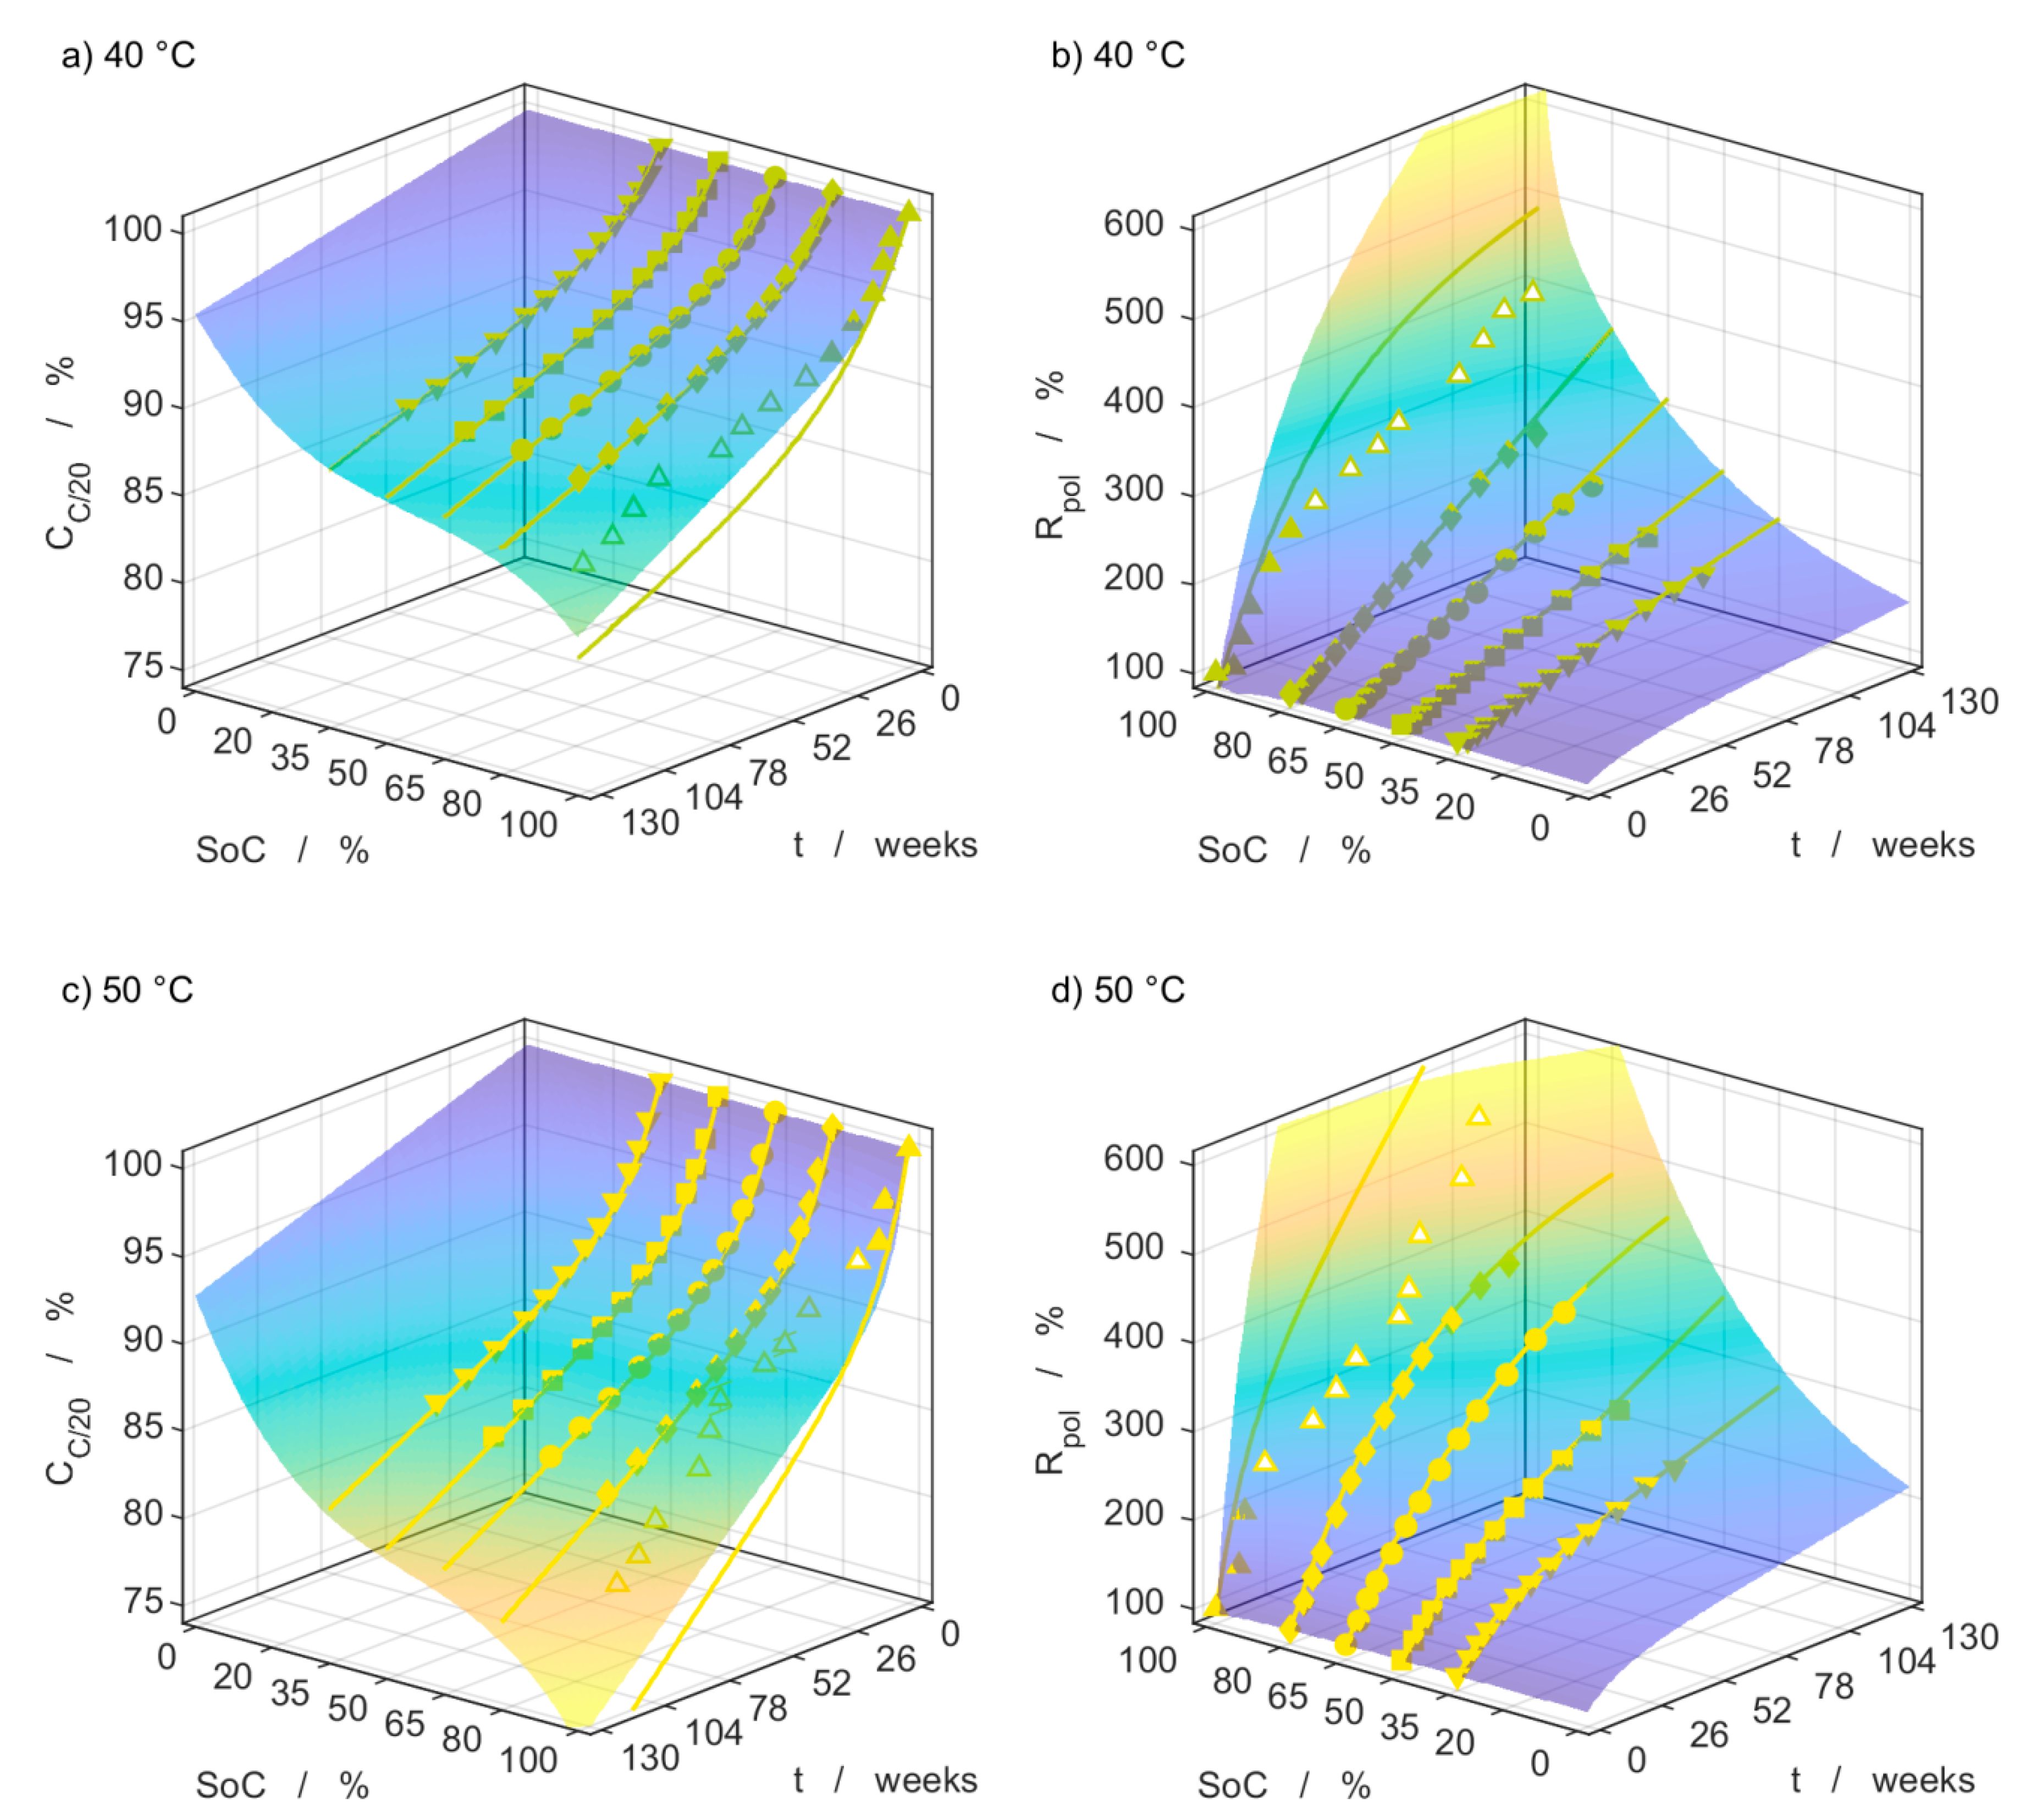
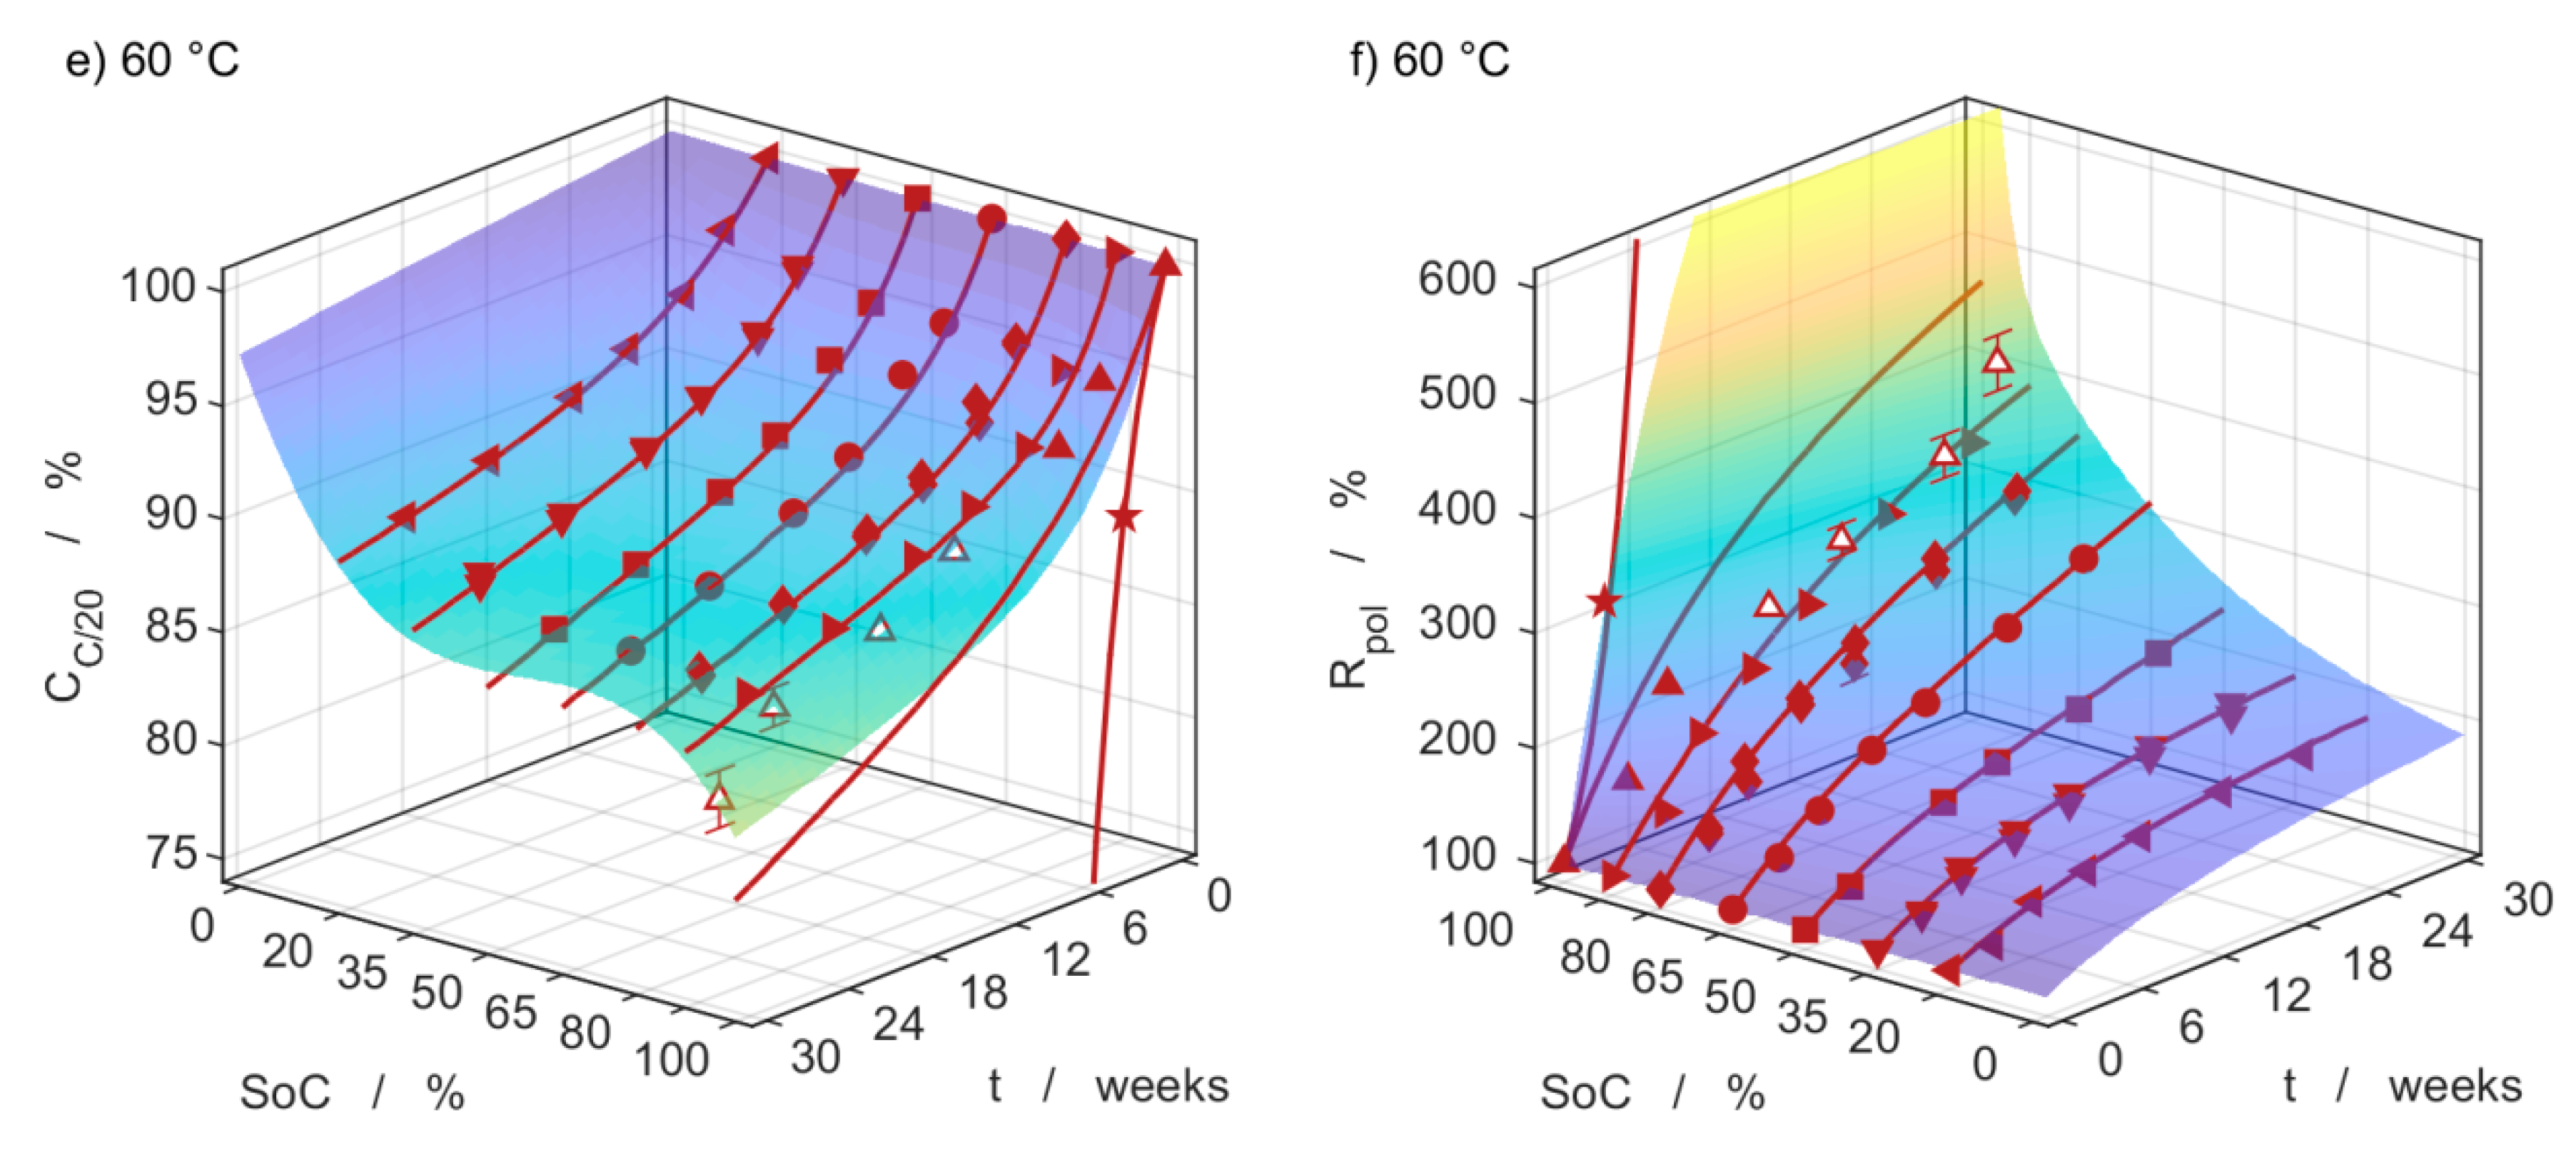
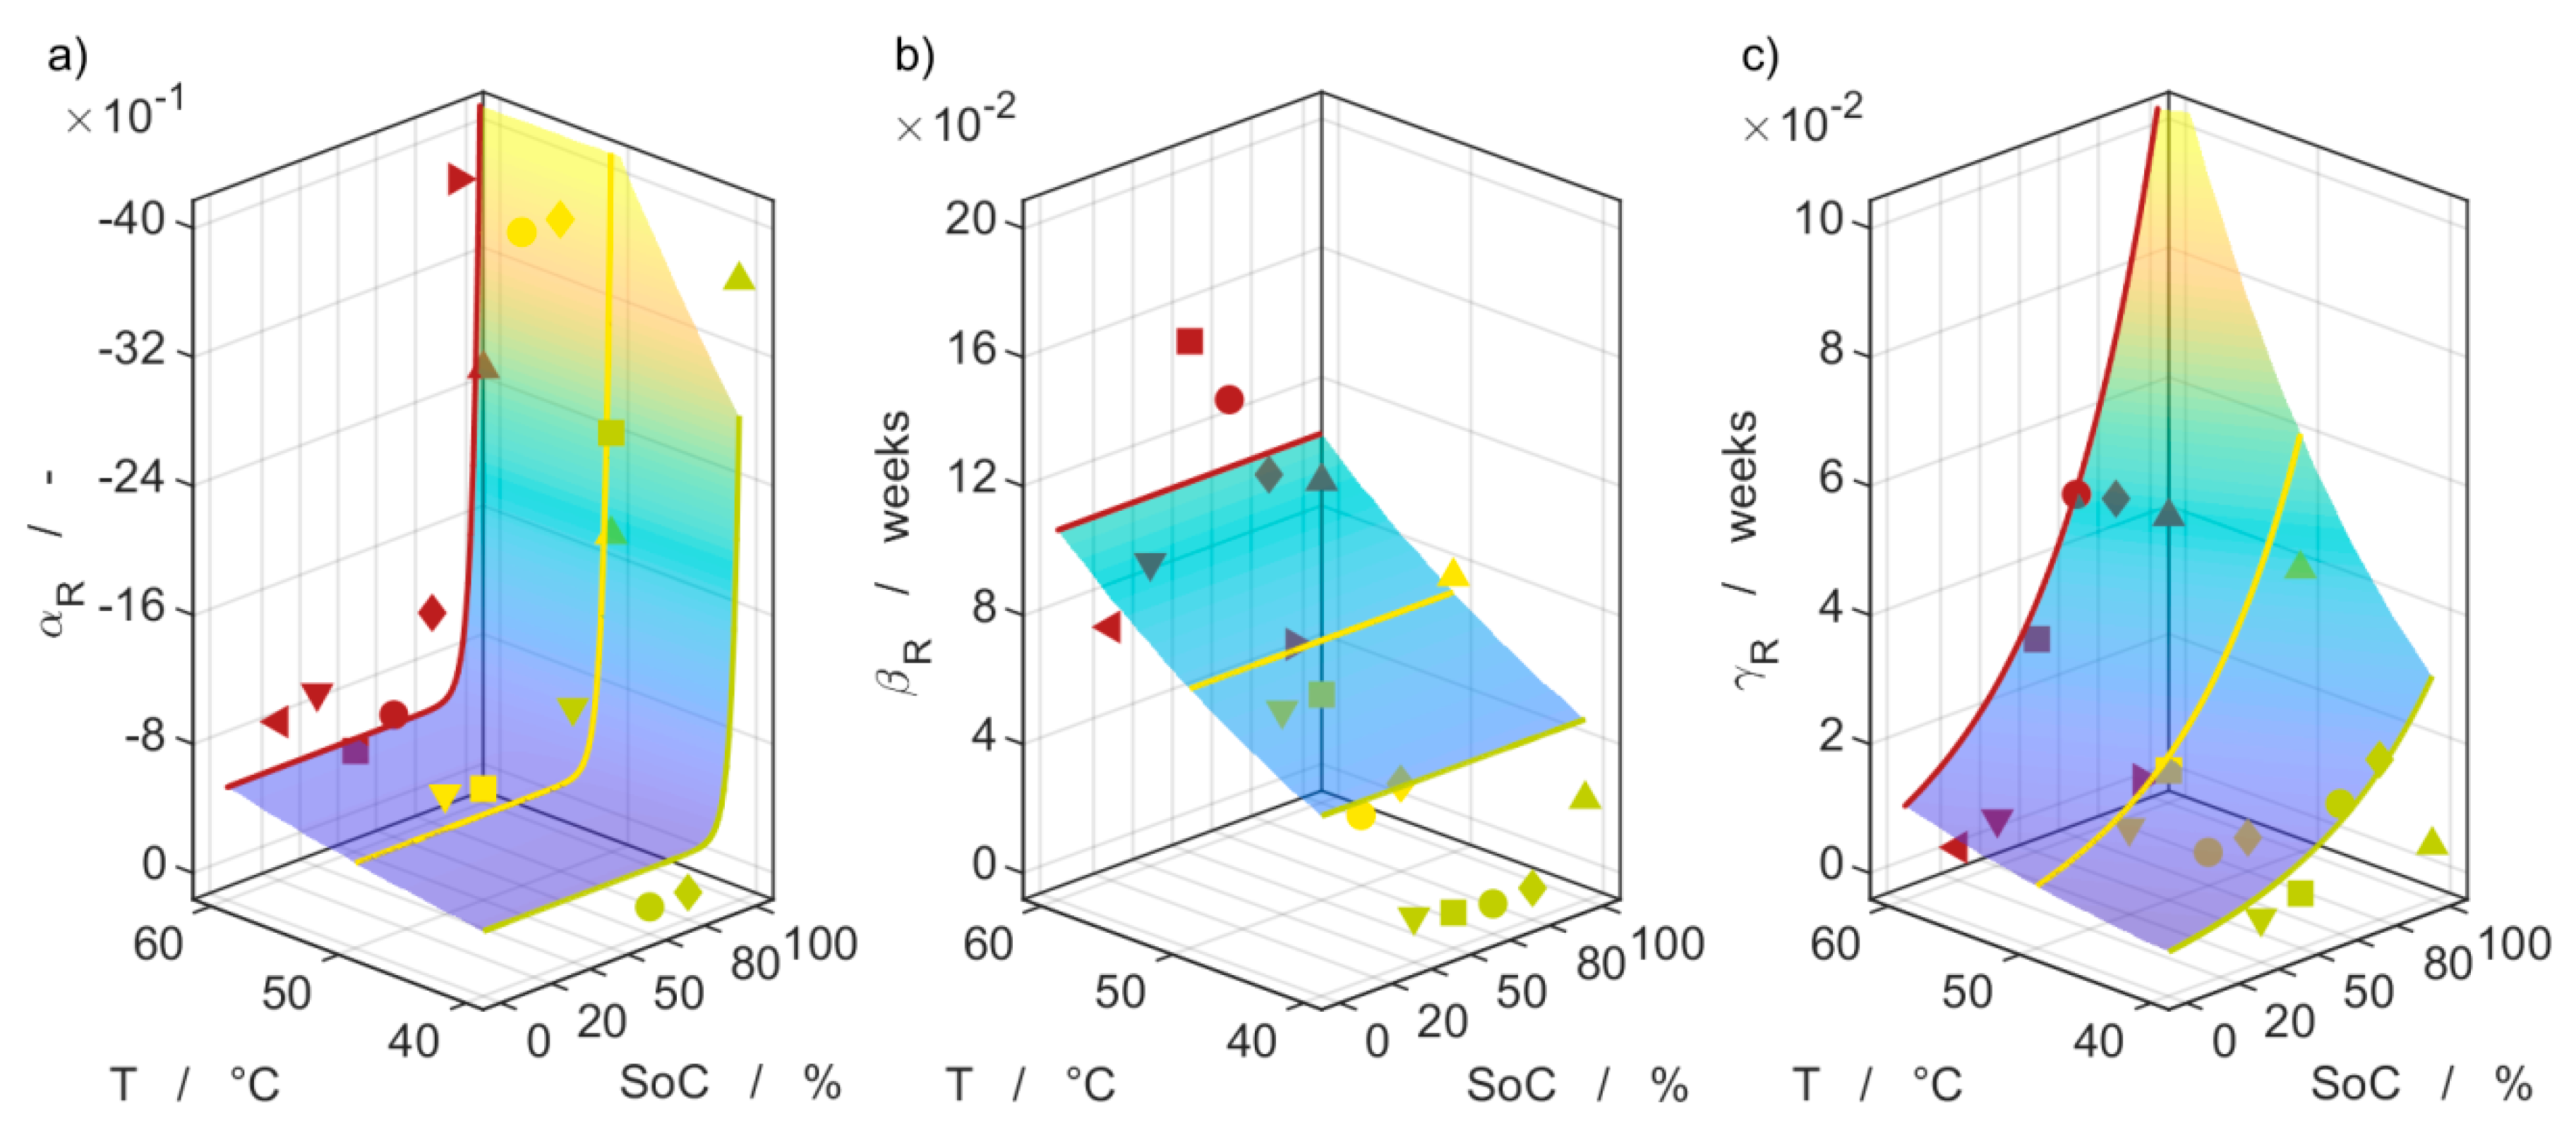
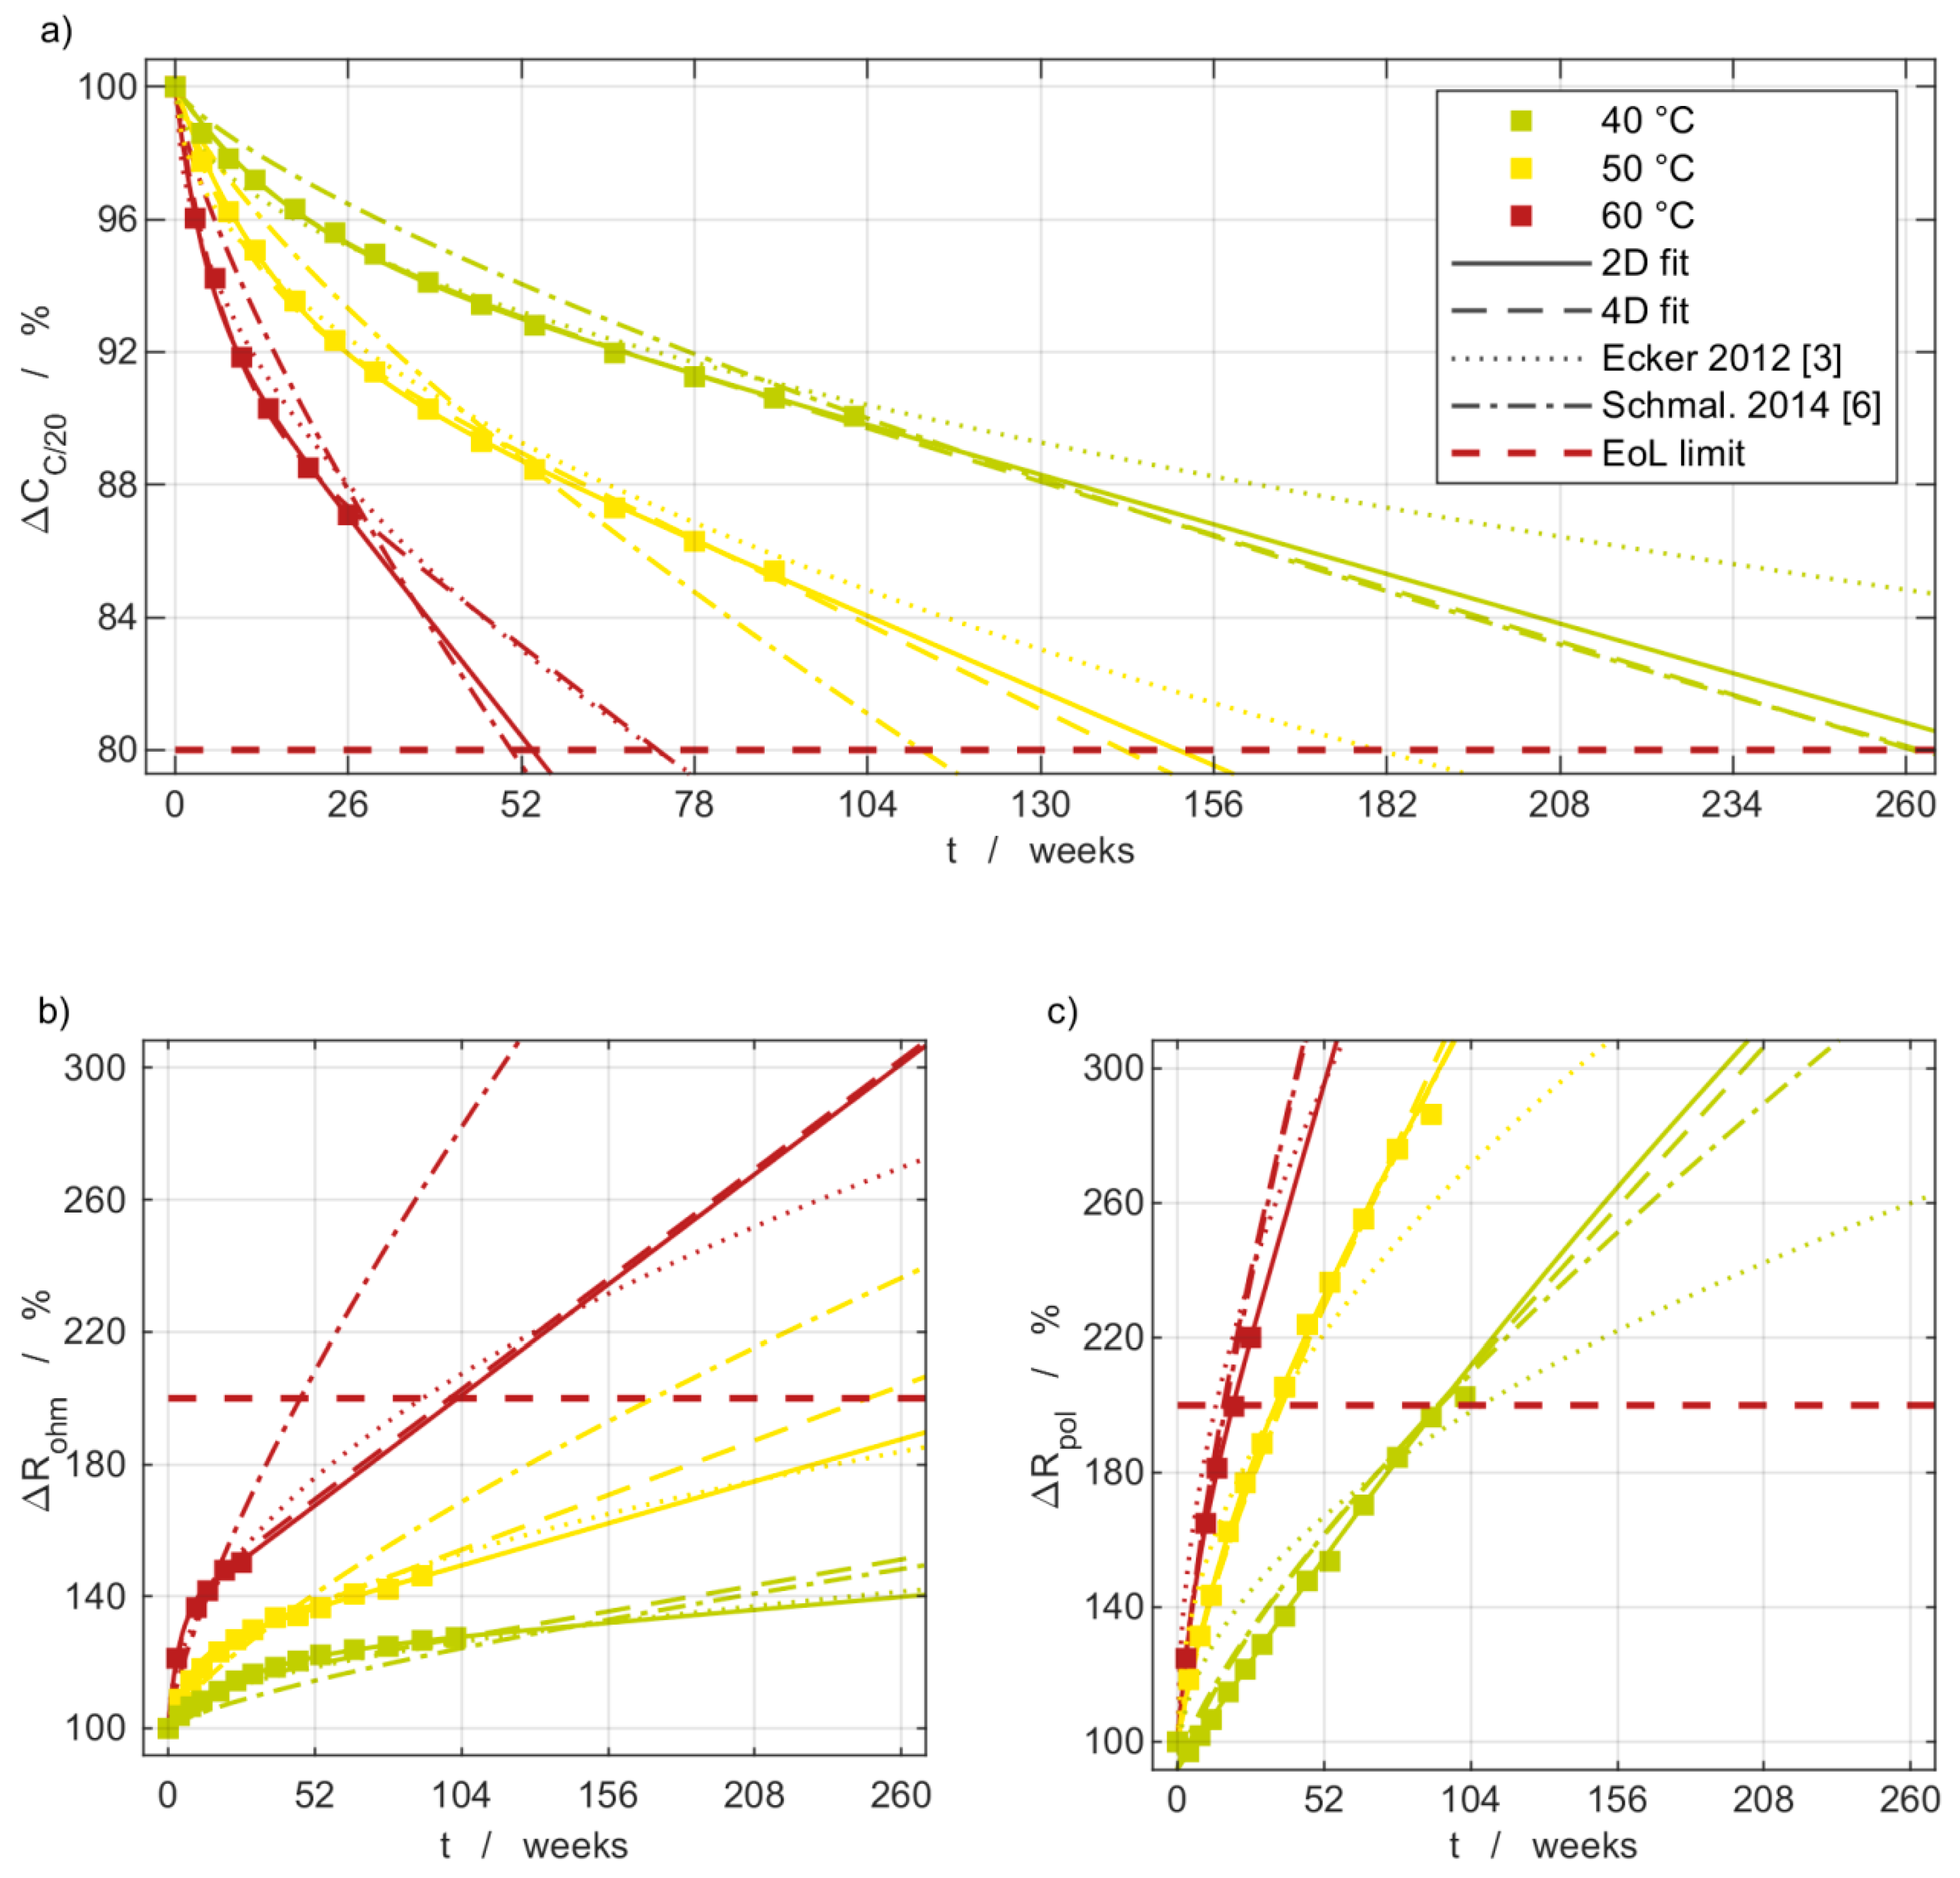
3.4. Capacity Measurements

Figure 4 shows the aging results of the remaining capacity at different storage SoC and constant temperatures of Batch I. The markers represent measurement values obtained from the intermediate characterizations, and the dashed and solid lines are fits, which will be discussed later on in this Section together with the gray dotted lines and markers. Figure 4a–c depict the characteristics of different SoC at 40 °C (green), 50 °C (yellow), and 60 °C (red), respectively. The markers represent the measured values of the C/20 discharge capacity, and their different shape indicates the various SoC. The SoC dependency is evident. The higher the SoC, the greater is the loss of capacity over time. This is particularly pronounced for 100%, while the influence decreases at lower storage SoC.
Comparing the diagrams among each other, the temperature dependency of calendar aging is apparent. The aging is considerably accelerated by increasing the temperature. Note that at 60 °C, the experiments were terminated after 26 weeks, as the cells had already reached their end of life (EoL) criterion by this time. In contrast, the experiments at 40 °C and 50 °C continued for about 100 weeks. Figure 4d emphasizes the influence of temperature on aging behavior. Again, the measured data for the considered temperatures at 100% SoC is shown, and a different aging rate is clearly discernible. This temperature dependency can be well expressed by the Arrhenius function, as shown in Section 3.6. Since the self-discharge at 100% SoC is comparably high, the storage SoC is not actually 100% but lower. Therefore, two additional cells were aged at 60 °C and 100% under CV condition to judge this influence. These data points are marked as stars in Figure 4d and show a total collapse of the cell within only six weeks. In addition, note the different scaling of the y-axis, which is necessary due to the massive capacity fade. In summary, the self-discharge prevents the cell from degrading even stronger in the case of 100% storage SoC.
Both time-dependent 2D fits and time-, SoC- and temperature-dependent 4D fits are analyzed to derive a meaningful model for the aging behavior. The model not only shows a high consistency with all test data and is physically plausible even for extrapolation, it also consists of a simple equation design with few parameters. The implemented procedure is explained further on in this chapter. A comparative analysis of selected functions commonly found in the literature for describing the capacity fade during calendar aging and their evaluation with regard to the measurement data determined in this work is provided in Section 3.6.
The solid lines in Figure 4 represent the adaption of the capacity fade over time, according to Equation (4). The equation has three coefficients αC, βC and γC that are individually adjusted for SoC and temperature.
The superposition of an exponential and a linear function is in good accordance with the measurements for all SoC and temperatures. It reflects the aging progress better than the widely used square root dependency. The characteristic shape of a square root function has the disadvantage of overestimating the capacity fade at the beginning of aging, intersects the actual curve and underestimates aging in the further process, especially when it is extrapolated [3,25,30]. This was shown by the measurements of Keil et al. with an almost linear capacity degradation course for long-time aging of graphite/NCA cells [11]. Lewerenz et al. propose a linear regression of the capacity degradation after an initial curved progression [37].
To cover the combination of an initial curved progression followed by a linear course, the chosen 2D fit model consists of an exponential and a linear part as described in Equation (4). It accurately captures all measurement points over the entire aging period that is considered. With this description, it is even possible to depict the aging under CV conditions at 100% SoC and a temperature of 60 °C. A detailed comparison between models reported in the literature and the one presented here is provided in Section 3.6.
Equations (5)–(8) give the description of the time-, SoC- and temperature-dependent 4D fit. Thereby, Equation (5) has the same structure as Equation (4); however, the coefficients are not individually adapted for each combination of SoC and temperature, but the SoC and temperature dependencies are simultaneously adjusted to all values shown in Figure 1b. The Arrhenius activation energy Ea,αβ is the same for both coefficients of the exponential contribution αC and βC, but different for γC that describes the linear contribution via Ea,γ. The result of the 4D fit is shown in Figure 4 as dashed curves. They still accurately describe the measurement results, but the deviations are slightly greater than those of the 2D fits. Only when aging at 100% SoC the results of the 4D fit model underestimate the measured data.
C C / 20 t = 1 + α C | SoC , T ( e x p ( β C | SoC , T t ) 1 ) + γ C | SoC , T t
C C / 20 t , S o C , T = 1 + α C S o C , T ( e x p ( β C S o C , T t ) 1 ) + γ C S o C , T t
α C S o C , T = ( α C , 1 S o C + α C , 2 S o C 2 + α C , 3 S o C 3 ) e x p ( E a , α β R T )
β C S o C , T = ( β C , 0 + β C , 1 S o C ) e x p ( E a , α β R T )
γ C S o C , T = ( γ C , 0 + γ C , 1 S o C ) e x p ( E a , γ R T )
According to Lewerenz et al. [37,38,39] and Fath et al. [40], the anode overhang considerably influences the behavior of the cells during calendar aging. This is due to the fact that the anode has a geometrically larger size than the cathode. According to Lewerenz et al., this overhang has a lower lithium concentration after charging and leads to a lithium flux into the overhang coming from the anode part with an opposite cathode. This can be accounted for as reversible lithium loss but is identified as capacity fade during the intermediate characterizations. When the lithium concentration within the anode is homogeneous, the cell enters the linear aging section [37].
The anode area of the investigated cell is 4.0 ± 0.3% larger than the cathode area. This value is depicted in the diagrams in Figure 4a–c by the empty gray square at BoL. Assuming a uniform area-specific capacity of the anode and the cathode, the linear part of the function, which is illustrated by the gray dotted lines for each SoC, should intersect with the y-axis in this point. This applies roughly to the measured data and fits best for aging at 40 °C.
Besides the geometrical overhang, the anode is also oversized in terms of its capacity. By measuring the area-specific capacity of the anode and cathode as half-cells versus lithium, the anode overhang’s excess capacity of the investigated cell was quantified to 9.0 ± 0.8%. This value is depicted in the diagrams in Figure 4a–c by the empty gray circle at BoL. The values were used as the upper boundary limits for the parameter αC of the 2D fits. According to Lewerenz et al., this y-axis intersection represents the usage of the whole anode capacity overhang and is therefore appropriate for the aging at 100% SoC. At 100% SoC, the lithium flux into the anode overhang is highest because the increased concentration differences enhance diffusion.
Figure 5 illustrates the temperature and SoC dependency of the three fit coefficients αC, βC and γC for the capacity fade. The markers indicate the coefficients that result from the 2D fits in Equation (4) for the respective temperature and SoC, while the lines represent the SoC dependency and the colored plane both the SoC and temperature dependency of the 4D fit in Equation (5). Equations (6)–(8) show the mathematical description of the individual coefficients. The temperature dependency for all coefficients is expressed using the frequently applied Arrhenius relation [4,5,6,10,12,30,31,32,33], which gives the plane its slight curvature.
For the SoC dependency of the coefficients, a third-degree polynomial is considered. The overall fit result is best for a linear SoC dependency of coefficients βC and γC, and it corresponds well to the results for the coefficients from the 2D fit. The SoC dependency of coefficient αC requires the polynomial S-shape to capture the accelerated degradation at 100%. The contribution of the exponential function described by αC and βC vanishes towards 0% SoC, leading to a purely linear aging behavior described by γC at 0% SoC. These considerations reveal the higher complexity, which is necessary to describe the aging process as a function not only of time but also of temperature and SoC. The adapted parameters to describe the capacity fade are given in Table 3.
The 4D fit of the capacity fade according to Equation (5) is shown by the colored plane in the 3D diagrams in Figure 6a,c,e for each temperature as a function of SoC and time. The color scale from purple to yellow reflects intensified aging. The markers illustrate the measurement data, and the lines indicate the 2D fits. If the self-discharge exceeded 5% per storage period, the measured values are not considered for the fit. Those can be identified by the empty symbols. This only occurred at 100% SoC and only after the cells have undergone some aging.

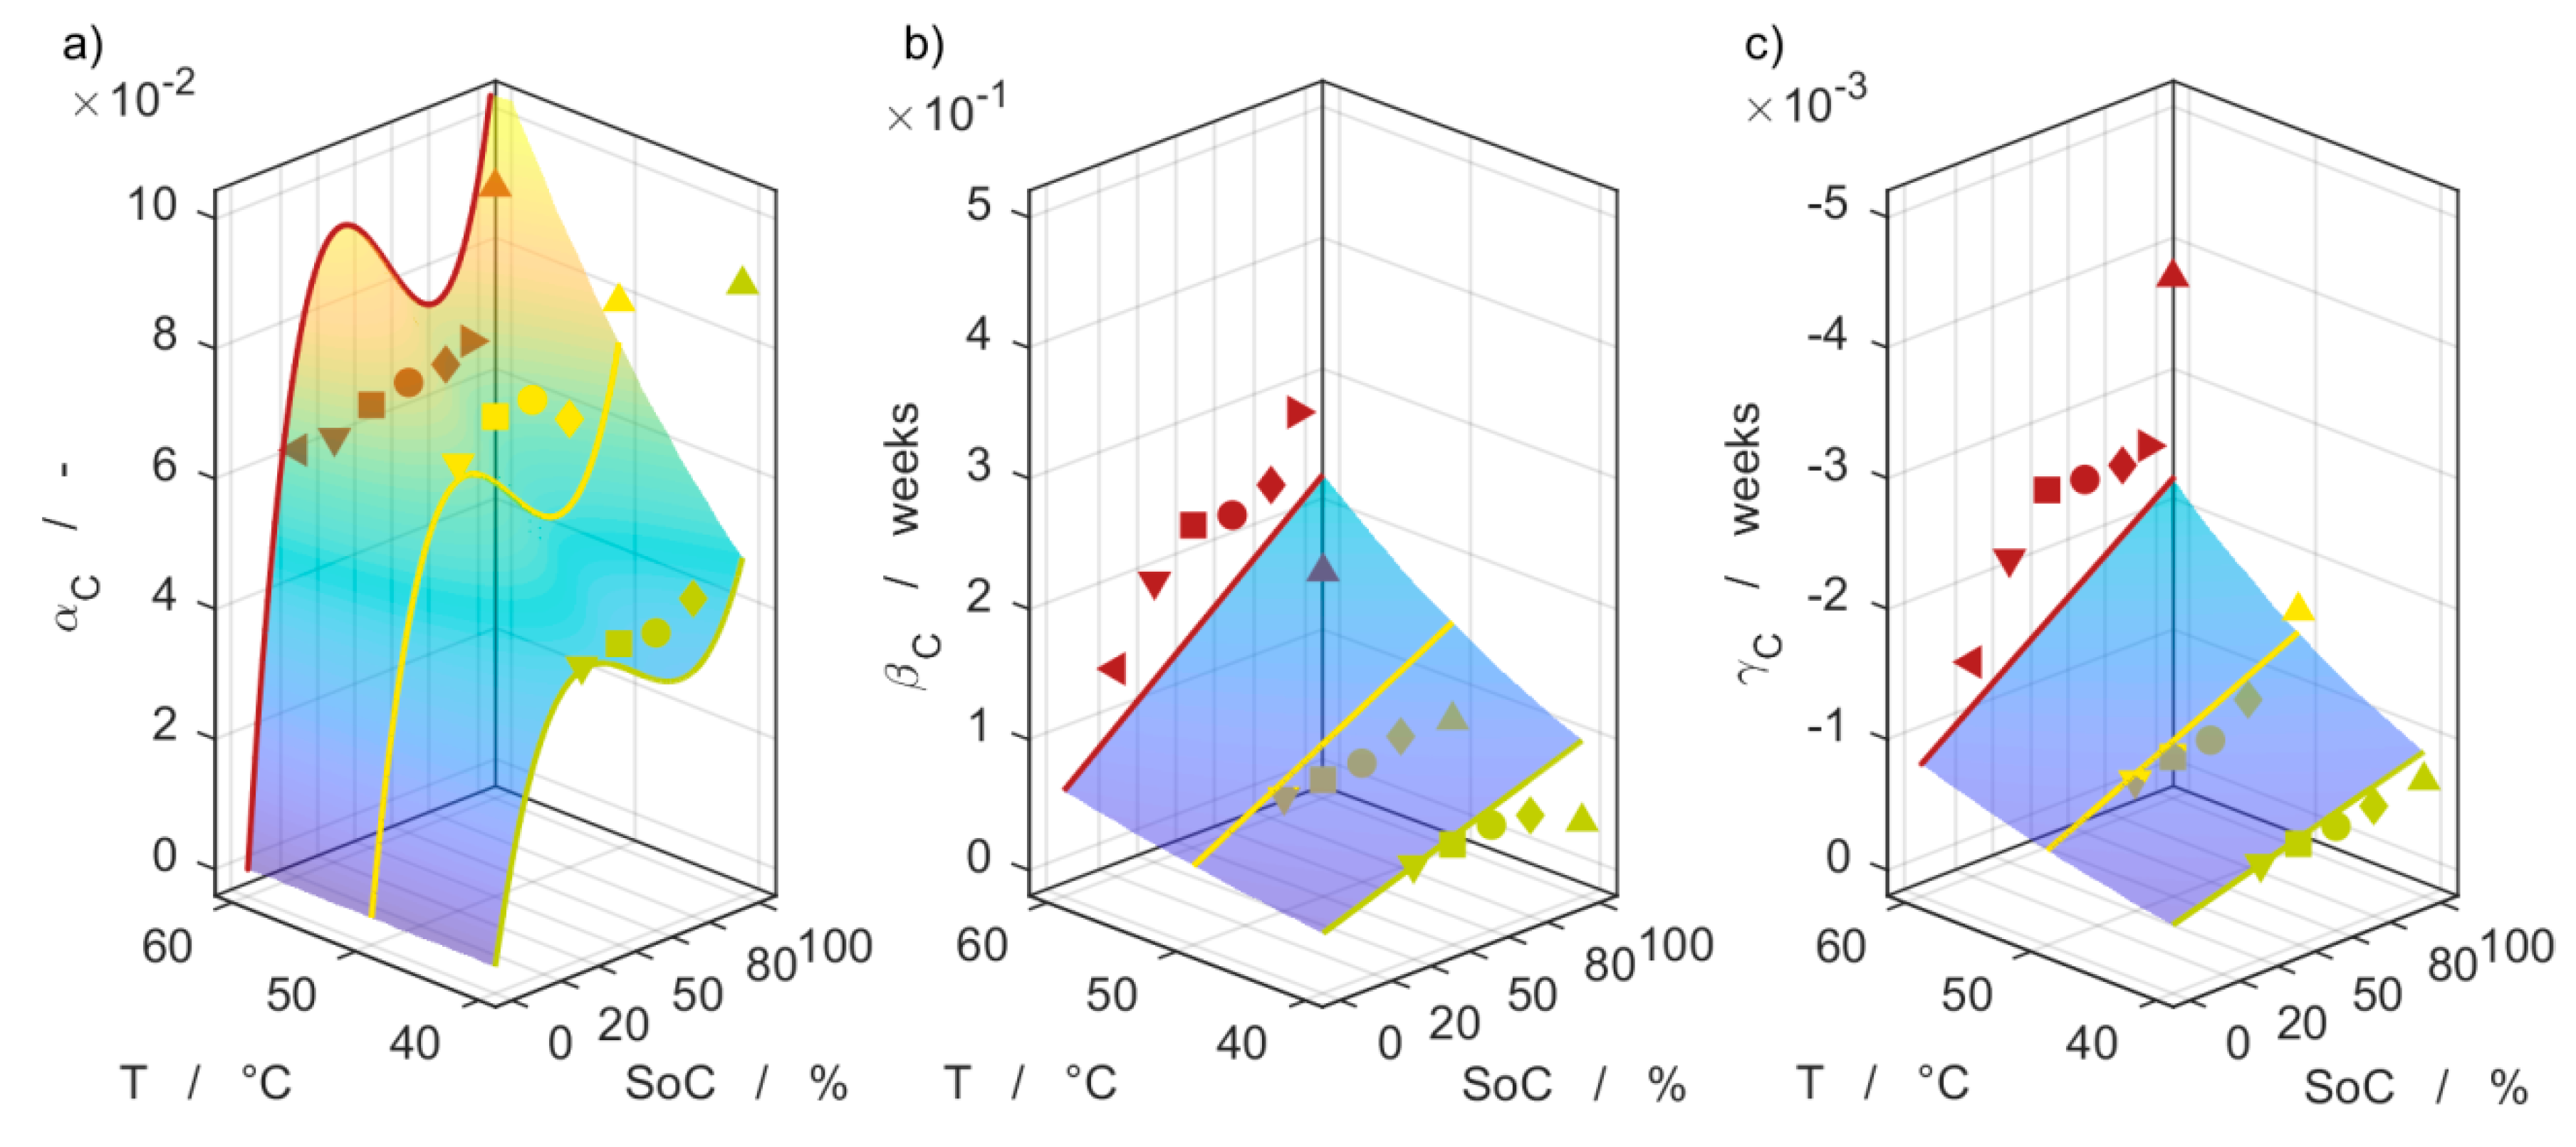
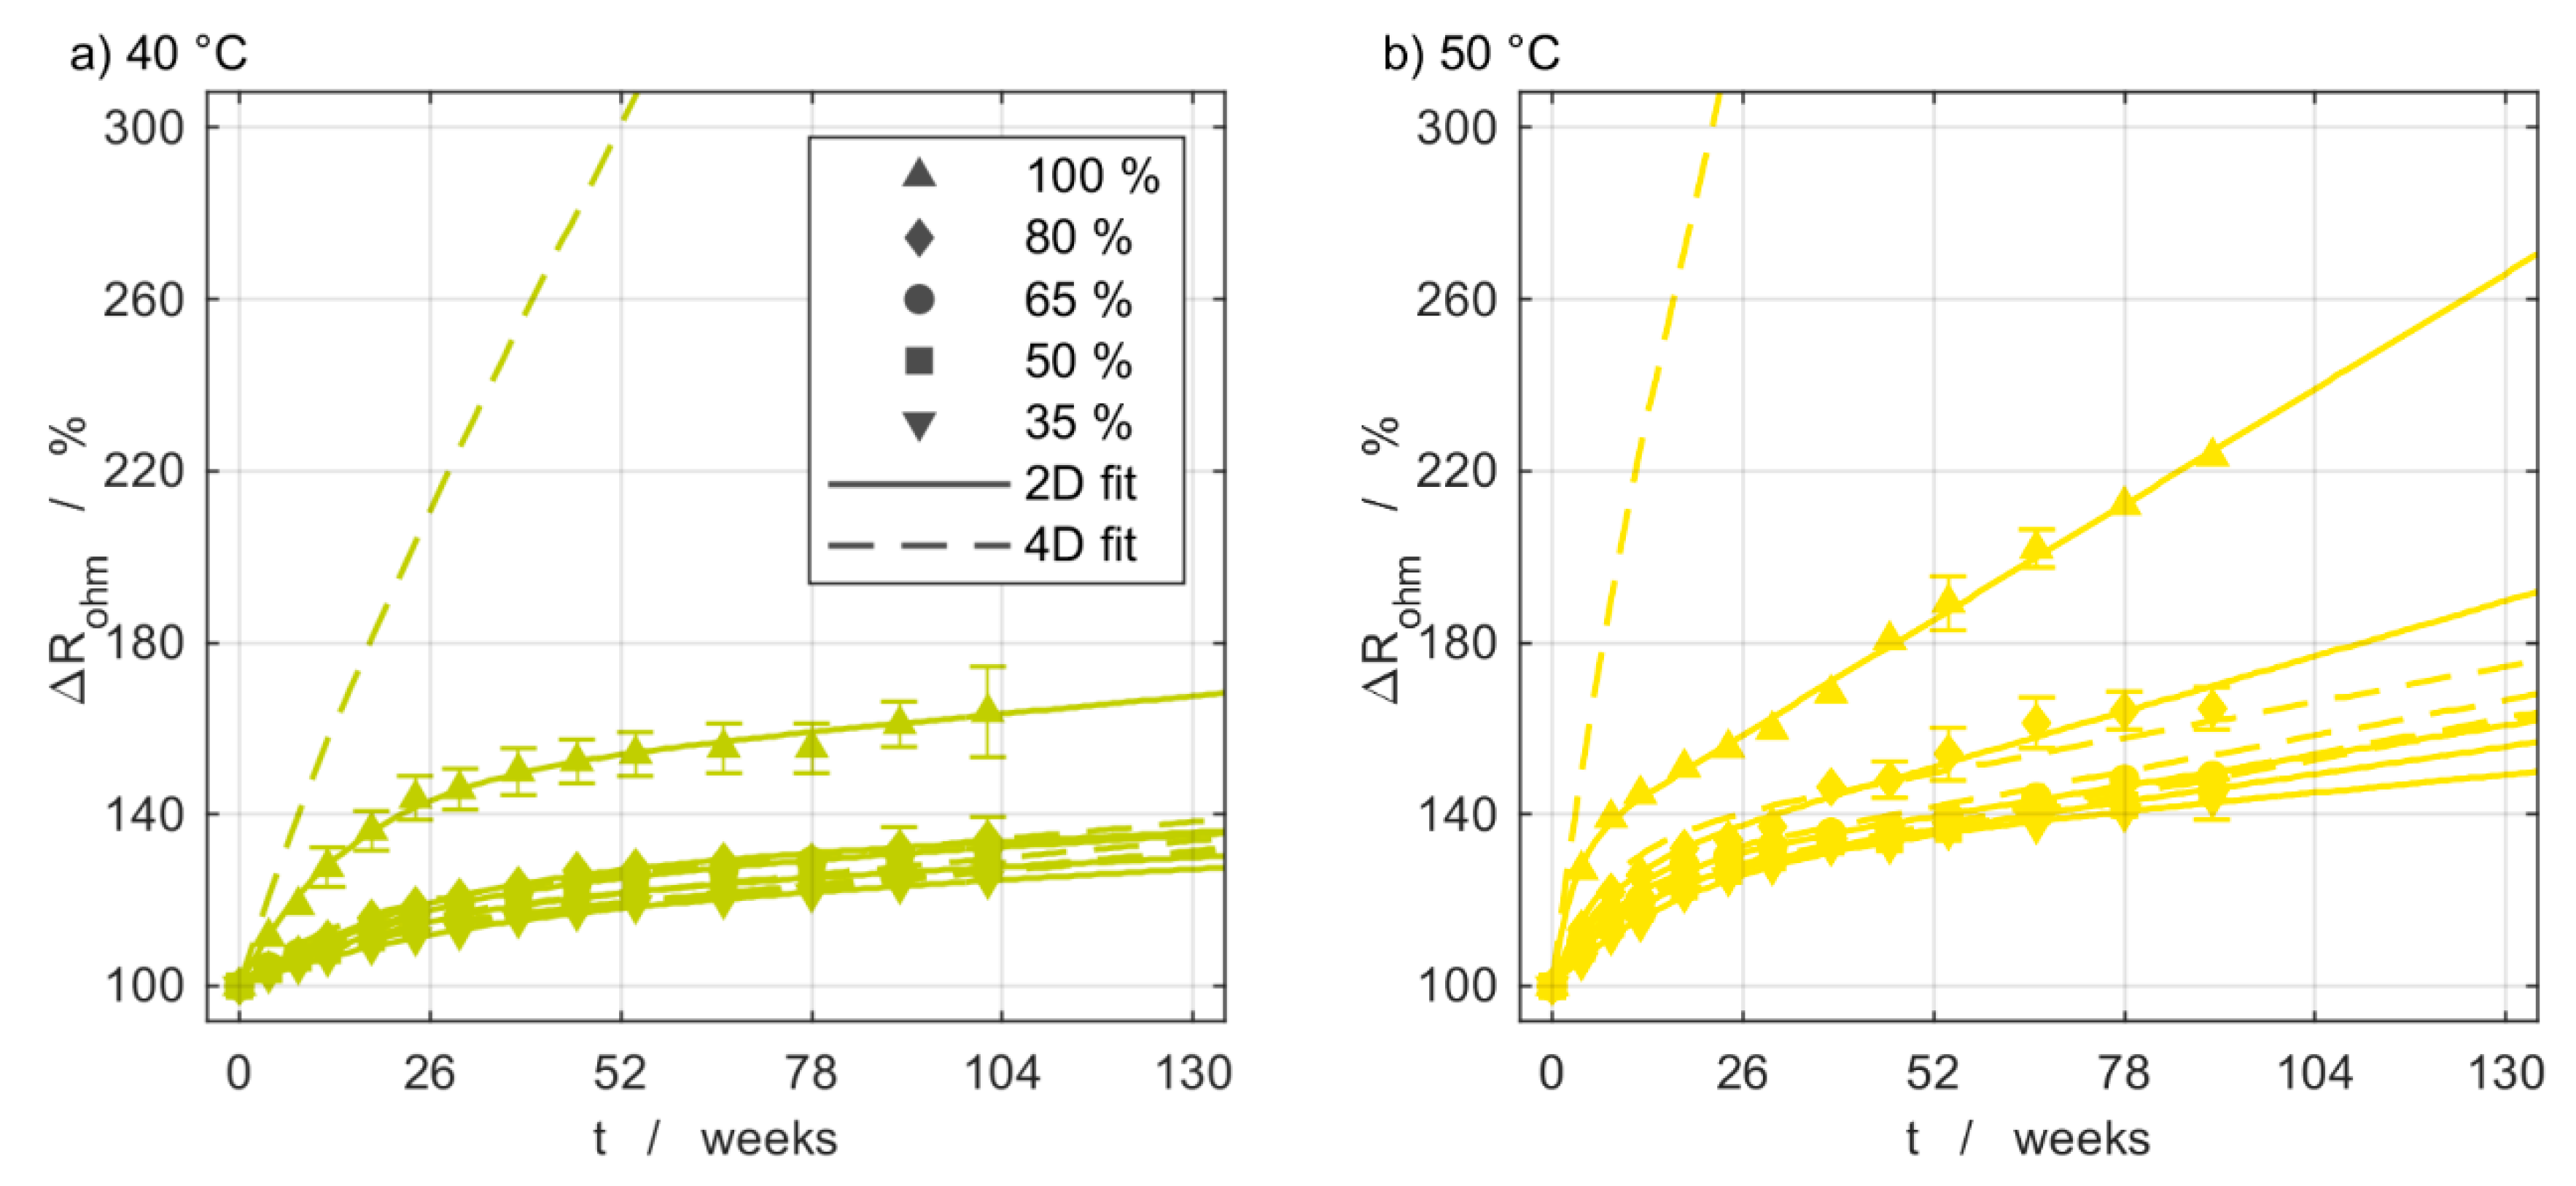
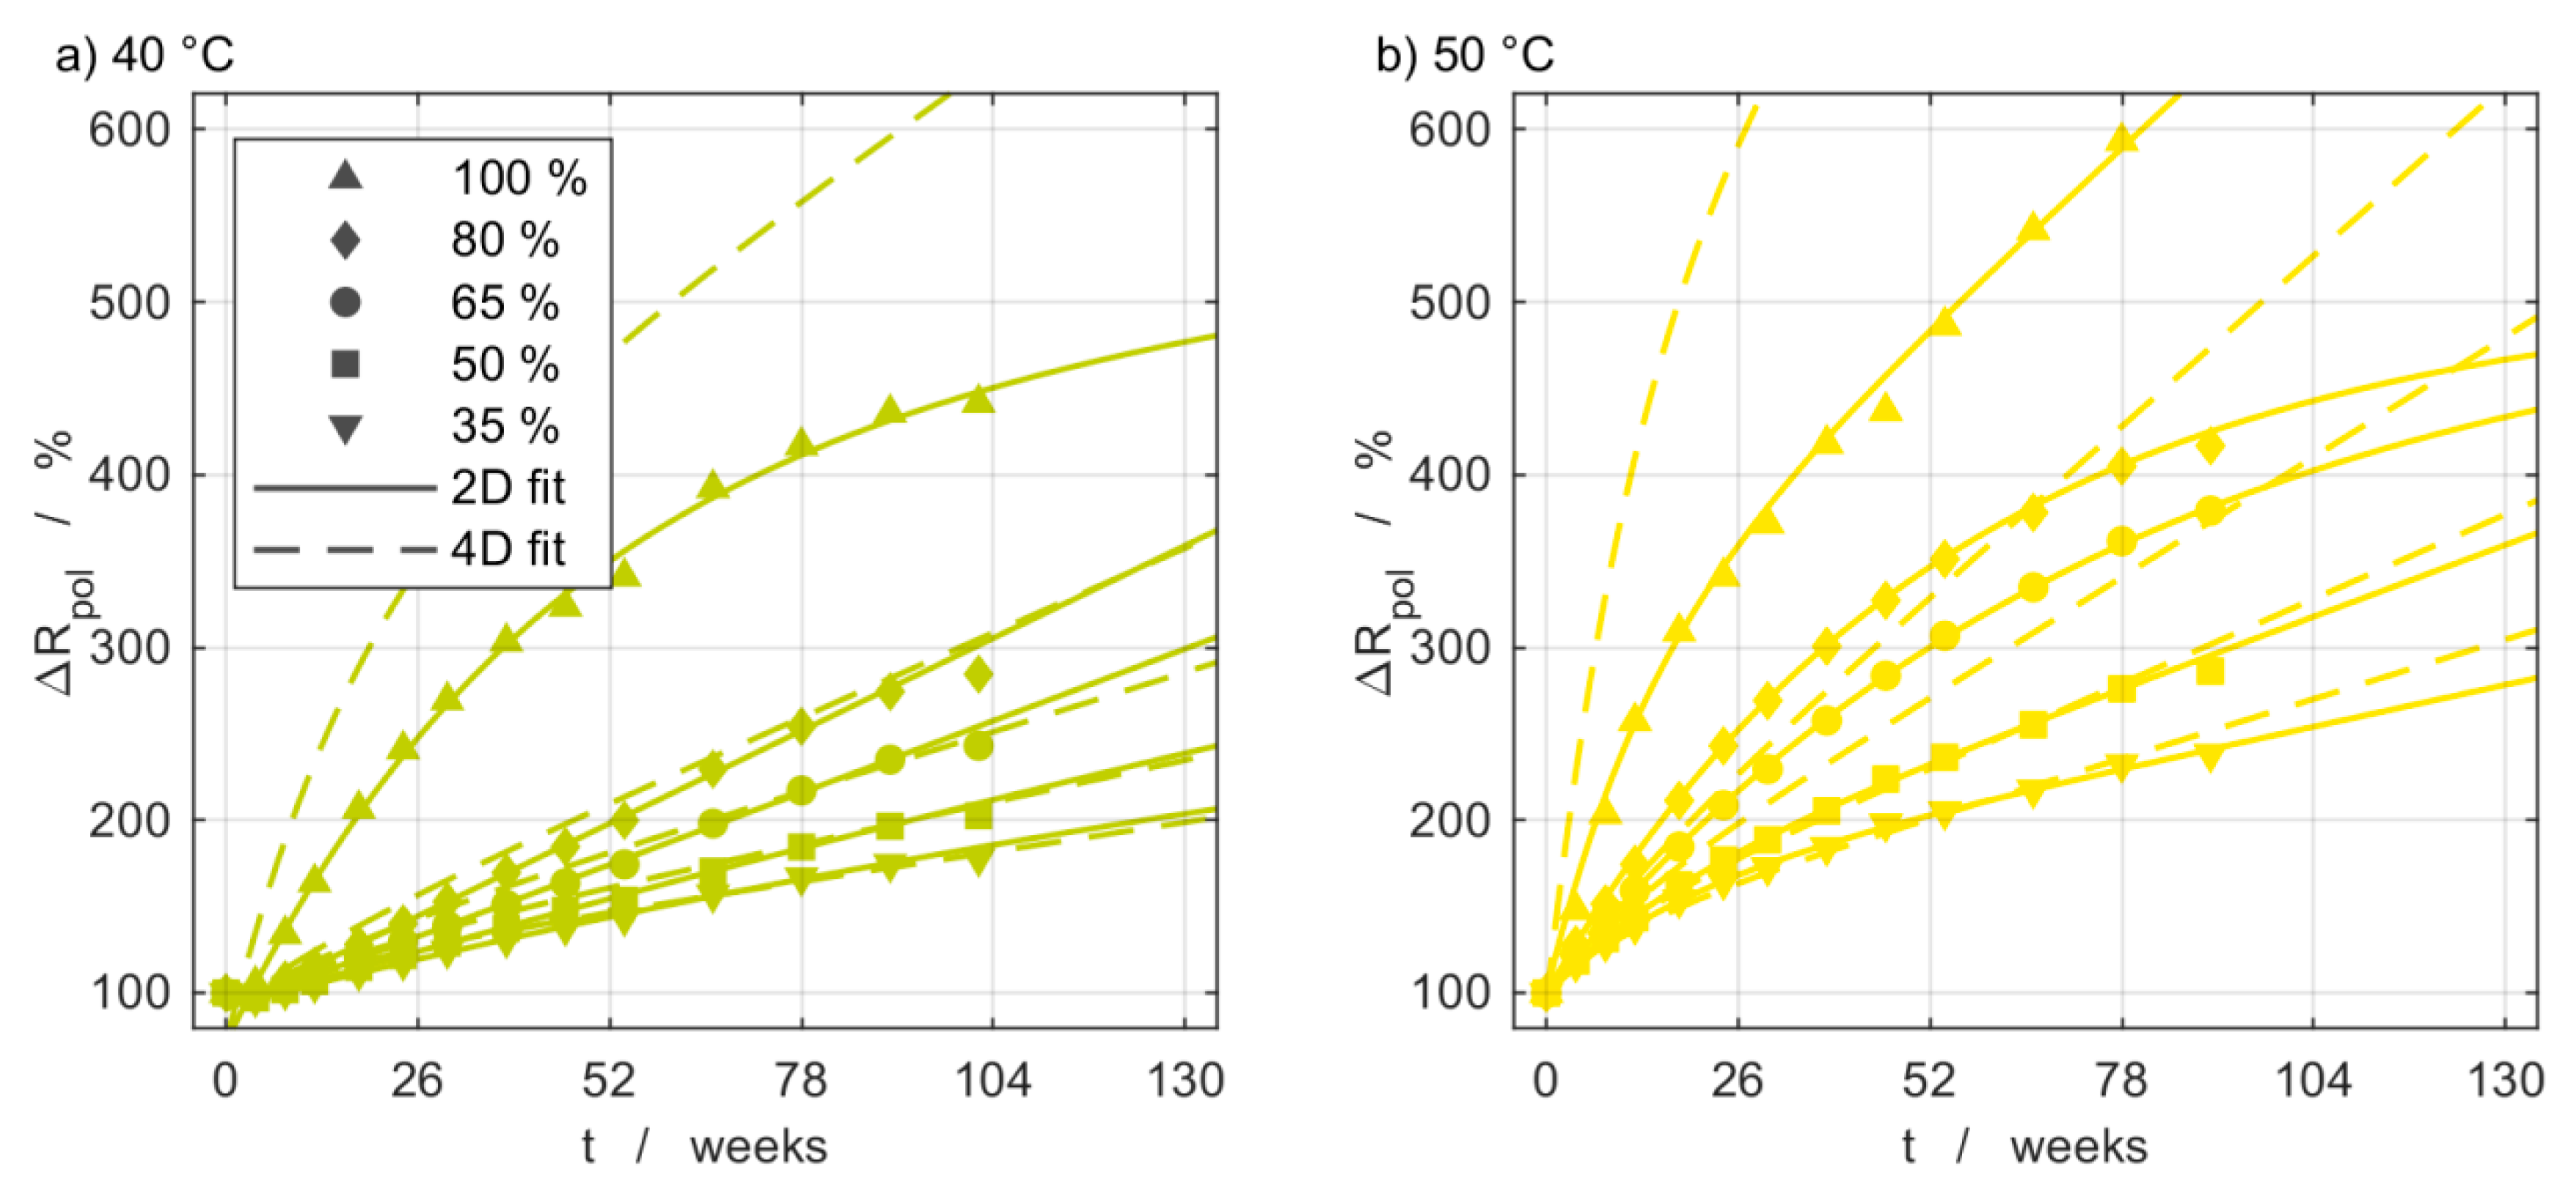
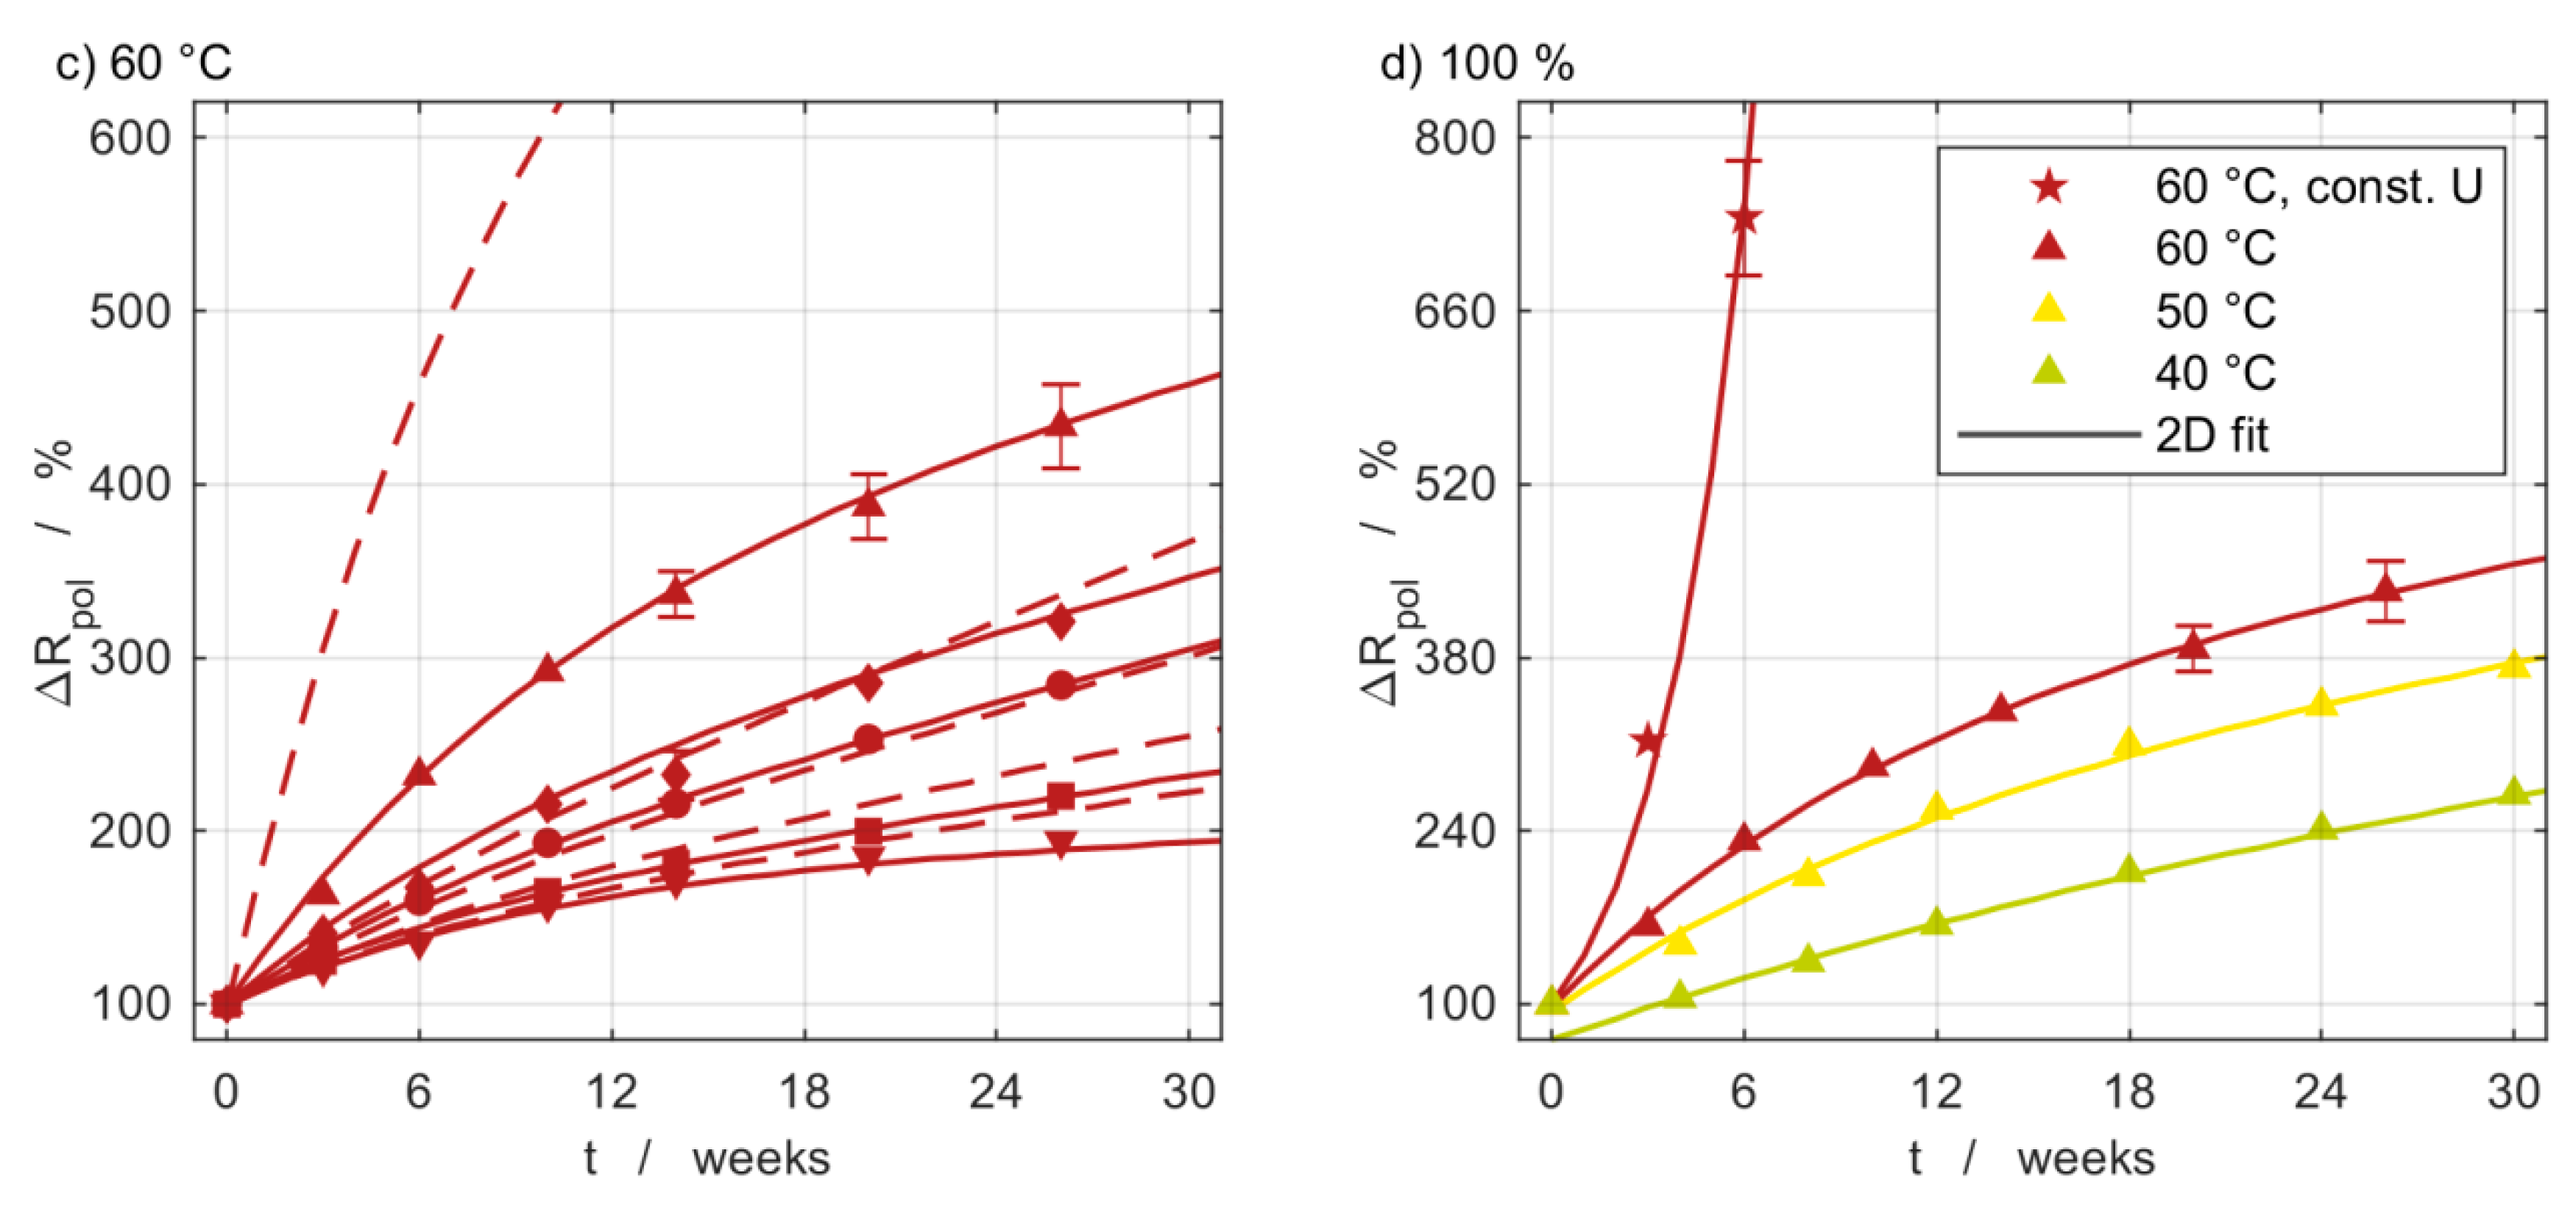
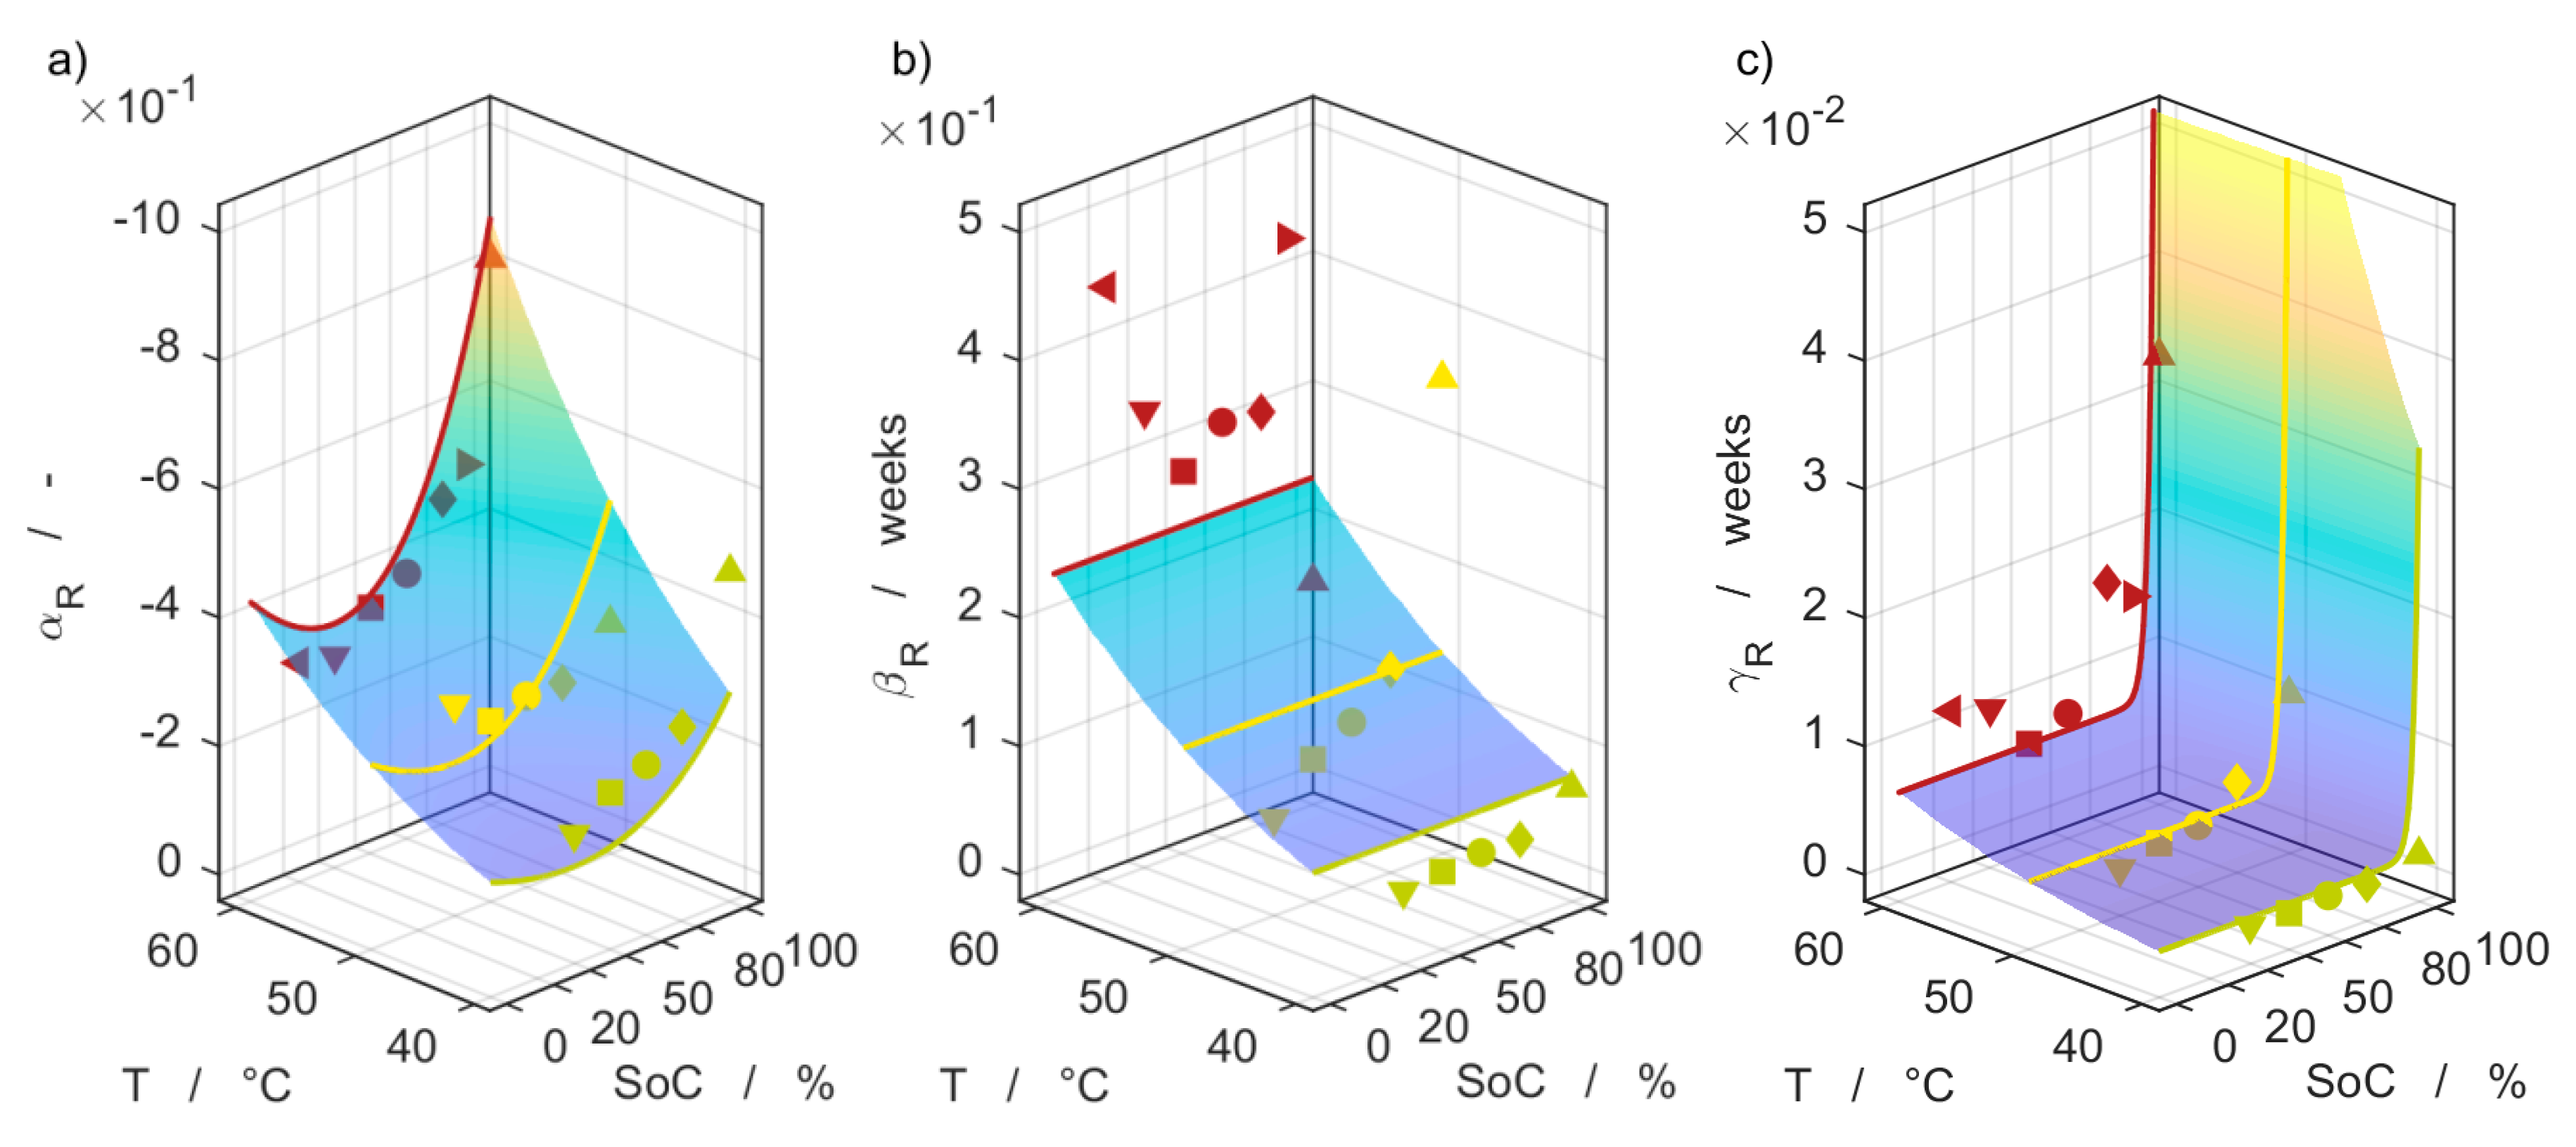
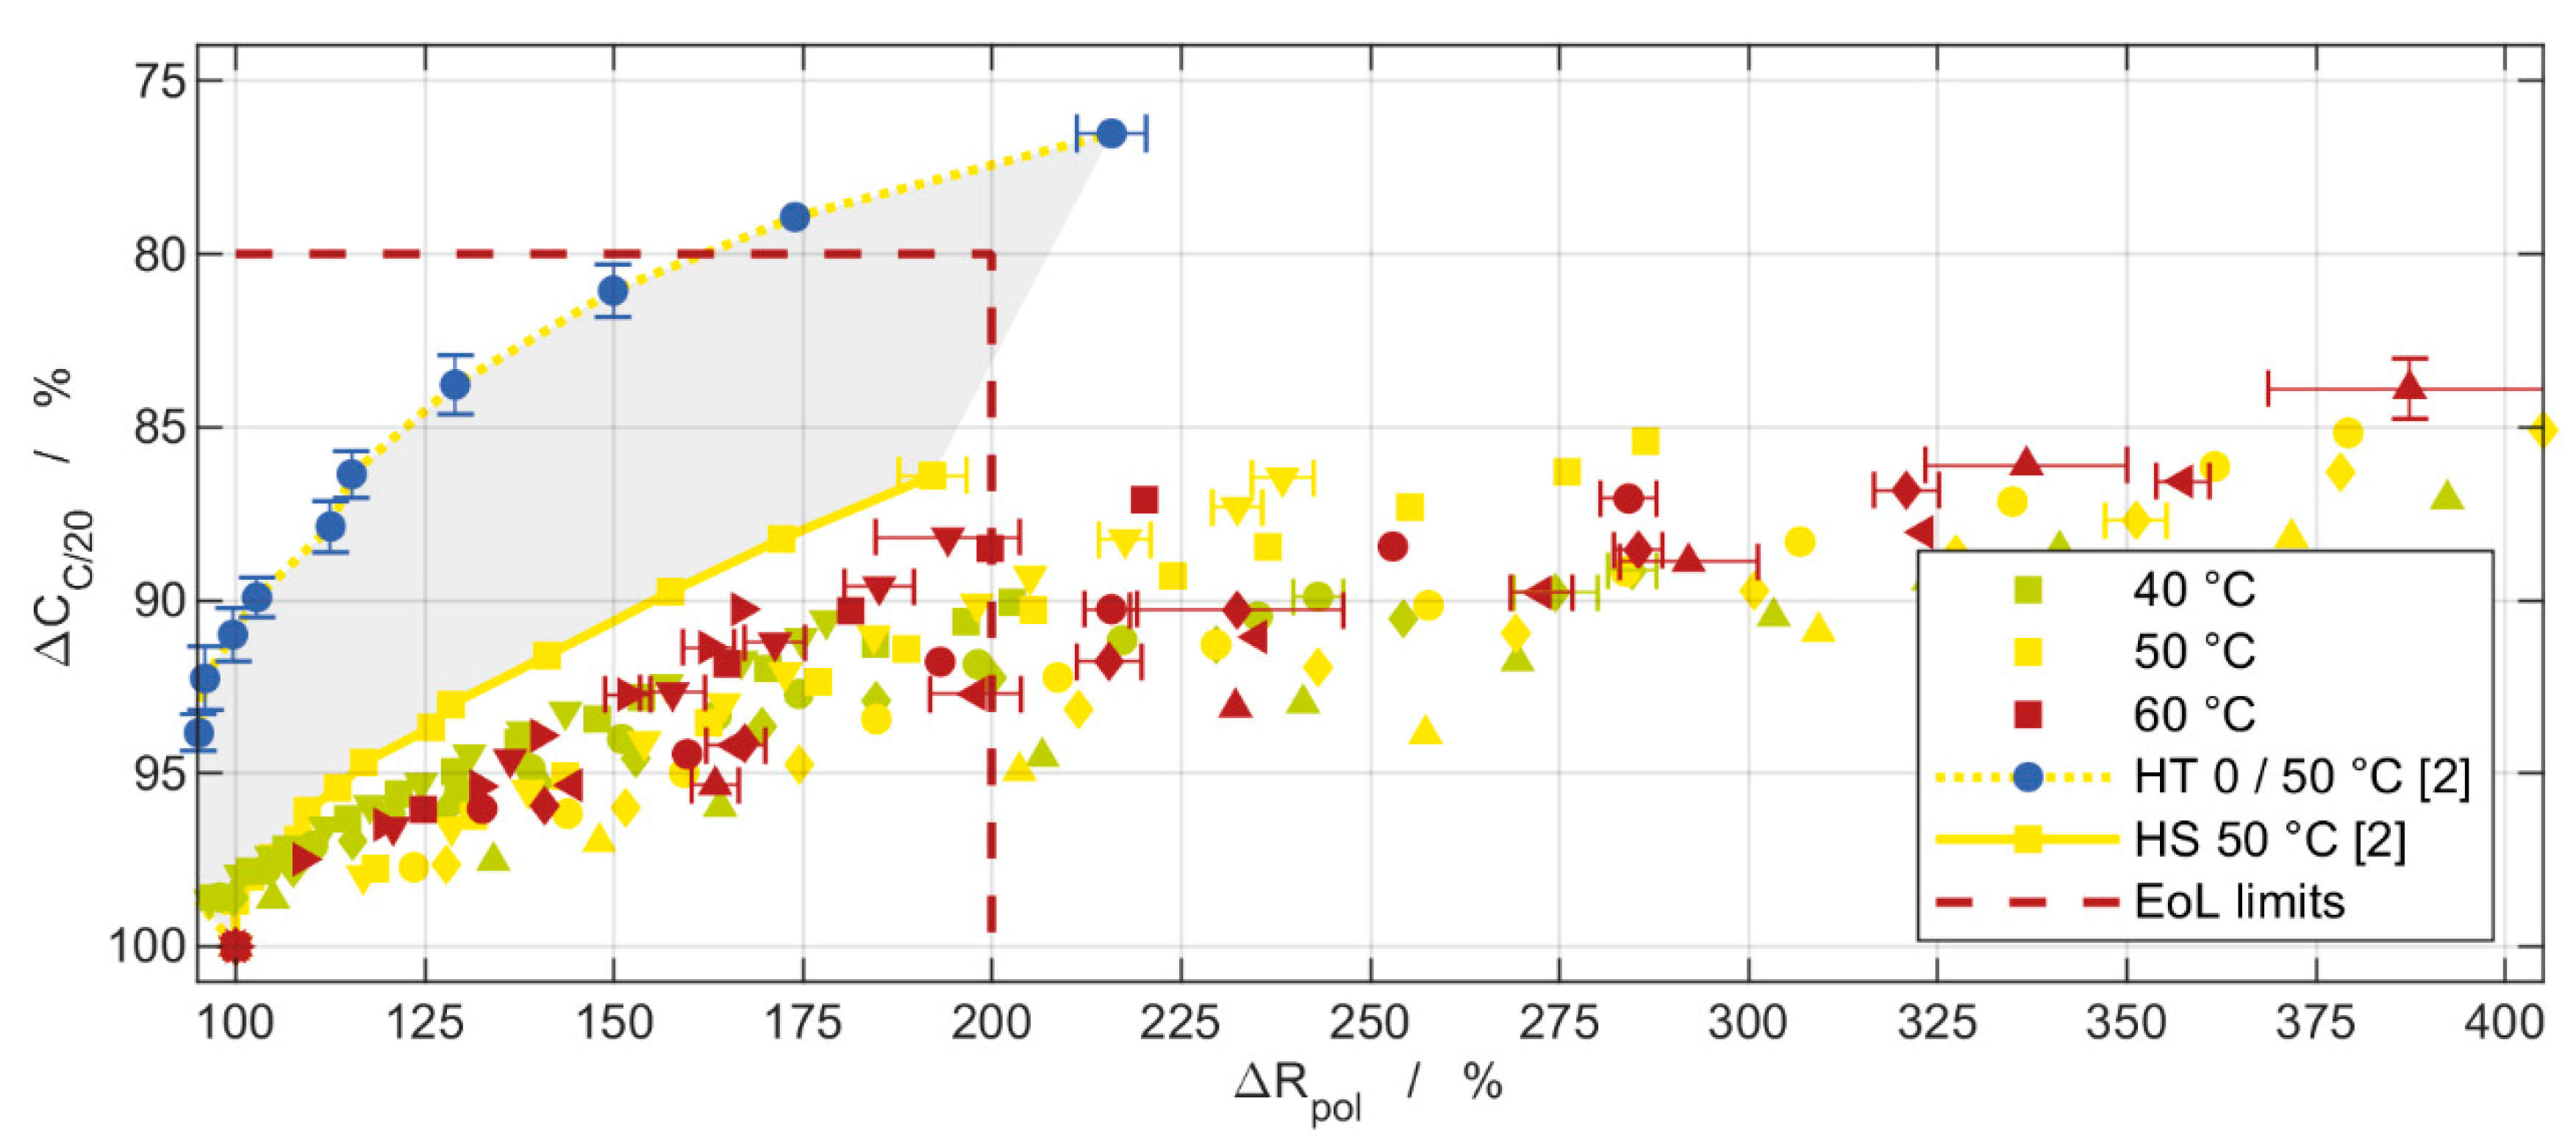
3.5. Impedance Measurements

The increase in the ohmic and polarization resistance obtained from the impedance measurements at 50% SoC during the intermediate characterization is presented in Figure 7 and Figure 8, respectively. Again, the measurement data are visualized by the markers, while the solid and dashed lines represent the 2D and 4D fit. Qualitatively, they reveal the same dependencies with respect to SoC and temperature as the capacity. With elevated SoC, the aging rate is higher, i.e., the resistances increase over time, which is particularly prominent at 100% SoC. The same applies to the influence of the temperature in Figure 7d and Figure 8d.
For aging at 40 °C, an initial reduction in polarization impedance occurs. This is not observed at 50 °C and 60 °C, probably because the higher aging rate outweighs this phenomenon. The effect also arises in aging tests performed by Redondo-Iglesias et al. [27]. They attribute this to the SEI formation in new commercial cells and state that it can be minimized by capacity measurements with a C-rate of C/5 or lower. To cover this effect, the cells were cycled with a current of C/5 prior to the BoL characterization, and all capacity measurements were performed with C/20. In the subsequent model, the initial impedance decrease is considered by not defining the BoL state of the impedance at 100%. It can take values slightly below 100% as an additional degree of freedom of the 2D fits. The initial impedance values from the 2D fits are then used for the 4D fits.
The comparison between the ohmic and the polarization resistance shows that the polarization resistance increases significantly faster. Initially, the fitting curves of the ohmic resistance have a more substantial curvature. This, however, quickly merges into a pronounced linear component. The exponential part of the polarization resistance is relevant for a longer time and then changes into a linear function with a steeper gradient. As a result, it reaches the EoL criterion sooner than the ohmic resistance. A comparison of the points in time, at which the EoL criterion is reached, is given in Table 8 in Section 3.6. Additionally, the absolute value of the polarization resistance is considerably greater. Thus, it determines the aging behavior of the cells regarding the impedance.
Equations (9)–(13) give the mathematical functions for the 2D and 4D fit used to adopt the experimental data. They are valid for both the ohmic and the polarization resistance. Their design is identical to the one employed for the capacity fade. The difference is that βR has a linear SoC dependency, while αR and γR additionally have an exponential SoC dependency.
R ohm / pol t = 1 + α R | SoC , T ( e x p ( β R | SoC , T t ) 1 ) + γ R | SoC , T t
R ohm / pol t , S o C , T = 1 + α R S o C , T ( e x p ( β R S o C , T t ) 1 ) + γ R S o C , T t
α R S o C , T = ( α R , 0 = 0   for   R ohm + α R , 1 = 0   for   R pol S o C + α R , 2 e x p ( α R , 3 SoC ) ) e x p ( E a , α β R T )
β R S o C , T = β R , 0 e x p ( E a , α β R T )
γ R S o C , T = ( γ R , 0 + γ R , 2 e x p ( γ R , 3 S o C ) ) e x p ( E a , γ R T )
The solid line of the 2D fit characterizing the mere time dependency reproduces the measurement results for the ohmic and polarization resistance well for all SoC and temperatures. The 4D fit gives good accordance for the ohmic resistance at low SoC. The aging at 100% SoC is entirely overestimated. However, it is crucial to consider that the fit presumes an actual SoC of 100%, but the cell protects itself through self-discharge. It is worth noting that the 4D fit of the polarization resistance also covers the first measurement point of the CV measurements at 100% SoC in Figure 6f. The same applies to the 4D fit of the ohmic resistance, whose 3D diagram is not shown. This supports the applicability of the selected empirical model, even for high SoC.
The 4D fit of the polarization resistance has a dominant linear contribution. Thus, the description of the measurement data is more demanding and accompanied by larger deviations, especially for the extrapolation. This statement is supported when comparing the fit coefficients for the resistance functions. The SoC dependency of the 2D and 4D fit coefficients is almost identical for the ohmic resistance in Figure 9. In contrast, the coefficients of the 2D fit for the polarization resistance do not have a consistent dependency in Figure 10.
Both the ohmic and the polarization resistance show a solely temperature-dependent coefficient βR. The SoC dependencies of αR and γR are switched, with respect to the different characteristic course of the quantities in the overall view versus SoC and time. This becomes apparent in the first two coefficients of Equations (11) and (13) and leads to the adapted parameters given in Table 4.
The EoL criterion is often defined as a remaining capacity of 80% or an increasing impedance by 100% [16]. In Figure 11, the capacity fade and the increase in the polarization resistance are compared to evaluate the dominating aging process. The red dashed square marks the EoL criterion for the capacity and the resistance. In the cyclic aging study of the same cell type, the data were similarly evaluated. The gray shaded patch and the HT 0/50 °C and HS 50 °C as boundaries span the range of the results from the cyclic aging study [2]. The cells of HS 50 °C were cycled at a homogeneous stationary (HS) temperature of 50 °C and the boundary condition HT 0/50 °C is characterized by an imposed homogeneous transient (HT) temperature switching between 0 °C and 50 °C during electrical cycling.
Looking at the results obtained from calendar aging, all conditions lead to much stronger aging of the resistance than of the capacity. For cyclic aging, the capacity fade is the more dominant aging parameter at the beginning of cycling. The ratio is also much more dependent on the boundary condition under which the cycling was performed. The only comparable boundary conditions of the calendar and cyclic aging study are the storage at 50 °C and 50% SoC, and the cycling at a constant temperature of 50 °C [2]. This boundary condition is closest to the results of the calendric aging study, but still with a more dominant capacity fade. In the overall view of the cyclic aging results, the impedance rise versus the remaining capacity is less dominant and almost corresponds to the diagonal of the square of the designated EoL limit values. An intensified impedance rise during calendar aging compared to cyclic aging also appears in the investigation of Schuster et al. on graphite/NMC cells [41]. The authors attribute this to a continuous SEI reconstruction during cycling, which dampens the growth rate of resistive obstacles in the interface of the electrodes and the electrolyte.

3.6. Model Comparison

As discussed in the introduction in Section 1, there are various experimental studies on calendar aging in the literature. Some of them likewise suggest time-, SoC-, and temperature-dependent empirical correlations for the aging behavior. Two of these empirical models serve as a basis for comparison and discussion in this chapter.
Ecker et al. present and compare several empirical model equations. They conclude that their measurement data have a negligible linear component and use the Equations (14)–(16) due to the low RMSE and the smaller number of coefficients for the capacity, ohmic, and polarization resistance. Schmalstieg et al. take a similar approach. They use the Arrhenius function for the temperature dependency of aging, while a linear relationship describes the voltage dependency. Those two dependencies are consistent with the approach taken in this paper. However, Schmalstieg et al. use a derived version of the square root with the exponent 0.75 for the time dependency. They conducted their experiments under constant voltage conditions to prevent self-discharge during storage. A comparison is still valid, as the OC and CV conditions only show a significant difference for aging at 100% SoC [4]. Both Ecker et al. and Schmalstieg et al. base their empirical equations on the OCV at BoL. Technically, the OCV then serves as an additional set of coefficients depending on the SoC grid points to be considered. Furthermore, the OCV can significantly change its shape during long-term aging [42]. For this reason, the idea of implementing the OCV was not picked up here.
Equations (14)–(16) and (17)–(18) represent the aging model of Ecker et al. [3] and Schmalstieg et al. [5] respectively. The nomenclature of the variables is adjusted to the one of this work.
C C / 20 t , V , T = 1 + c V V V 0 Δ V c T T T 0 Δ T c t t 0.5
R ohm t , V , T = 1 + ( c V ( V V 0 Δ V ) 2 + 1 ) c T T T 0 Δ T c t t 0.5
R pol t , V , T = 1 + c V V V 0 Δ V c T T T 0 Δ T c t t 0.5
C C / 20 t , V , T = 1 ( c V 1 V c V 0 ) 10 6 e x p ( c T T ) t 0.75
R ohm / pol t , V , T = 1 + ( c V 1 V c V 0 ) 10 5 e x p ( c T T ) t 0.75
The variables V0 and T0 are constants set by Ecker et al. and Schmalstieg et al., respectively. These are varied as additional parameters during the fitting, and the OCV shown in Figure 1a was used to apply the equations to our data.
The resulting values are given in Table 5. The adapted values for the capacity are very close to those defined by Ecker et al. and Schmalstieg et al. The same applies to cα, cV and cT of the resistance fits, except the ohmic resistance cV = 0.0471 obtained by Ecker et al. In contrast, the constants of the impedance fits defined to V0 = 16 and αV = 5 V−1 by Schmalstieg et al. are by magnitudes lower than those fitted here. This may be due to the unequal comparison of the ohmic and polarization resistances considered separately here with pulse resistances obtained after 10 s from pulse power characterization profiles (PPCP) of Schmalstieg et al.
Besides the coefficients already mentioned, the activation energy Ea, which appears as one (or two) parameter(s) in the fit, is of interest. In most cases, the activation energy is assumed to be constant over aging. For all those studies, the activation energy values are in the same order of magnitude as shown in Table 6. This qualifies the utilization of an exponential approach for temperature dependency. Following the idea of Arrhenius, it is, however, essential to employ this correlation on rates.
Considering the strictly mathematical criterion of the root-mean-square error (RMSE) in Table 7, the 2D fit has the smallest error. Since it fits the individual progress over time without considering the SoC or temperature dependency, this is expected. All models agree on having the smallest error for the capacity. Slightly worse, but ranking second-best consistently is the 4D fit. The model from Ecker et al. shows a better result for the capacity fade, while the model from Schmalstieg et al. is more accurate for the two impedance quantities.
The larger RMSE value of the Schmalstieg model for the capacity is also evident in Figure 12a. Compared to the measured values and other models, the curve is less pronounced for all temperatures, thus initially flatter and then becoming steeper at longer aging times. The same is valid for the ohmic and polarization resistances shown in Figure 12b,c. The characteristic course leads to an early end of life for the three quantities and boundary conditions. At the beginning, the model from Ecker et al. is in good accordance with the measurements of the three quantities, especially for 50 °C. In further progress, it underestimates the aging slightly, which is most pronounced for the polarization resistance in Figure 12c. This is a typical effect of the square root of time dependency and can only be improved by adjusting the exponent of the time.
The differences of the models, which are apparent in the graphs of Figure 12, have a significant impact on extrapolation. Table 8 shows the lifetime prediction for all models and all quantities. For the capacity prediction of the model by Ecker et al. and the 4D fit, a factor of 1.4 lies between the expected durations until the EoL criterion is reached, although the RMSE is similar. These discrepancies are significantly smaller for the polarization resistance. This is because the EoL criterion was reached during the measurement time, and no extrapolation of the model fit is necessary for this analysis. While the square root dependency of time achieves quite good results for the capacity fade, its drawbacks become more apparent for the resistances. Here, a better agreement is obtained for the root function with the adjusted exponent of 0.75, as in the model of Schmalstieg et al.

4. Conclusions

This paper investigates the calendar aging of a graphite/NCA pouch cell as a function of temperature, SoC, and time under OC condition, considering self-discharge. During the storage periods, the voltage was continuously monitored. For high temperatures and high SoC, a significant self-discharge was observed, especially for 100% SoC combined with a storage temperature of 60 °C. We assume that the dominant aging mechanism leading to degradation is the loss of cyclable lithium which causes a shift in the electrode balancing as other authors suggest for similar investigations of graphite/NCA cells [8,11].
An empirical model is derived for the relevant quantities describing the degradation of the cell. These are the capacity, the ohmic, and the polarization resistance. The model’s coefficients can be individually adjusted for the three quantities, while the equation structure is the same for all. The quality of a moderate time extrapolation is also considered in the evaluation of the equation. The 4D model simultaneously describes aging depending on SoC, temperature and time and gives almost the same results as individual 2D adjustments over time. The representation of the aging over the entire, extrapolated, SoC range is also plausibly reproduced. The model and its coefficient are compared in detail with two other empirical models [3,5] describing calendar aging. Overall, a relatively simple, physically meaningful empirical model is derived that describes calendar aging in a holistic way and is in very good accordance with measurement data.
This empirical model can be implemented in battery models to describe aging phenomenologically. To facilitate this, a method is proposed to consider the SoC shift due to self-discharge when parameterizing the model.
In addition, this work considers a possible path dependency regarding temperature. The results indicate that there is no dependency on the cells past temperature conditions.
However, in order to capture aging in its overall complexity, the function found here has to be combined with the function for cyclic aging [1,2] using the appropriate constraints. This includes the consideration of reversibility aspects such as lithium recovery from the anode overhang [39,43] and potentially amplifying effects based on a path dependency [34,41].

Author Contributions

Conceptualization, D.W. and T.W.; methodology, D.W. and S.P.; software, D.W.; validation, D.W. and S.P.; formal analysis, D.W. and S.P.; investigation, D.W. and S.P.; writing—original draft preparation, D.W. and S.P.; writing—review and editing, D.W., S.P. and T.W.; visualization, D.W. and S.P.; supervision, T.W.; project administration, T.W. All authors have read and agreed to the published version of the manuscript.

Funding

The APC was funded by the Institute of Thermal Process Engineering (TVT), Karlsruhe Institute of Technology (KIT).

Acknowledgments

The authors would like to thank Lisa Cloos for the thorough proofreading and the helpful comments. We acknowledge support by the KIT-Publication Fund of the Karlsruhe Institute of Technology.

Conflicts of Interest

The authors declare no conflict of interest.

References

  1. Werner, D.; Paarmann, S.; Wiebelt, A.; Wetzel, T. Inhomogeneous Temperature Distribution Affecting the Cyclic Aging of Li-Ion Cells. Part I: Experimental Investigation. Batteries 2020, 6, 13. [Google Scholar] [CrossRef] [Green Version]
  2. Werner, D.; Paarmann, S.; Wiebelt, A.; Wetzel, T. Inhomogeneous Temperature Distribution Affecting the Cyclic Aging of Li-Ion Cells. Part II: Analysis and Correlation. Batteries 2020, 6, 12. [Google Scholar] [CrossRef] [Green Version]
  3. Ecker, M.; Gerschler, J.B.; Vogel, J.; Käbitz, S.; Hust, F.; Dechent, P.; Sauer, D.U. Development of a lifetime prediction model for lithium-ion batteries based on extended accelerated aging test data. J. Power Sources 2012, 215, 248–257. [Google Scholar] [CrossRef]
  4. Käbitz, S.; Gerschler, J.B.; Ecker, M.; Yurdagel, Y.; Emmermacher, B.; André, D.; Mitsch, T.; Sauer, D.U. Cycle and calendar life study of a graphite|LiNi1/3Mn1/3Co1/3O2 Li-ion high energy system. Part A: Full cell characterization. J. Power Sources 2013, 239, 572–583. [Google Scholar] [CrossRef]
  5. Schmalstieg, J.; Käbitz, S.; Ecker, M.; Sauer, D.U. A holistic aging model for Li(NiMnCo)O2 based 18650 lithium-ion batteries. J. Power Sources 2014, 257, 325–334. [Google Scholar] [CrossRef]
  6. Ecker, M.; Nieto, N.; Käbitz, S.; Schmalstieg, J.; Blanke, H.; Warnecke, A.; Sauer, D.U. Calendar and cycle life study of Li(NiMnCo)O2-based 18650 lithium-ion batteries. J. Power Sources 2014, 248, 839–851. [Google Scholar] [CrossRef]
  7. Baghdadi, I.; Briat, O.; Delétage, J.-Y.; Gyan, P.; Vinassa, J.-M. Lithium battery aging model based on Dakin’s degradation approach. J. Power Sources 2016, 325, 273–285. [Google Scholar] [CrossRef]
  8. Keil, P.; Schuster, S.F.; Wilhelm, J.; Travi, J.; Hauser, A.; Karl, R.C.; Jossen, A. Calendar Aging of Lithium-Ion Batteries. J. Electrochem. Soc. 2016, 163, A1872–A1880. [Google Scholar] [CrossRef]
  9. de Hoog, J.; Timmermans, J.M.; Ioan-Stroe, D.; Swierczynski, M.; Jaguemont, J.; Goutam, S.; Omar, N.; Van Mierlo, J.; Van Den Bossche, P. Combined cycling and calendar capacity fade modeling of a Nickel-Manganese-Cobalt Oxide Cell with real-life profile validation. Appl. Energy 2017, 200, 47–61. [Google Scholar] [CrossRef]
  10. Redondo-Iglesias, E.; Venet, P.; Pelissier, S. Eyring acceleration model for predicting calendar ageing of lithium-ion batteries. J. Energy Storage 2017, 13, 176–183. [Google Scholar] [CrossRef] [Green Version]
  11. Keil, P.; Jossen, A. Calendar Aging of NCA Lithium-Ion Batteries Investigated by Differential Voltage Analysis and Coulomb Tracking. J. Electrochem. Soc. 2017, 164, A6066–A6074. [Google Scholar] [CrossRef]
  12. Hahn, S.L.; Storch, M.; Swaminathan, R.; Obry, B.; Bandlow, J.; Birke, K.P. Quantitative validation of calendar aging models for lithium-ion batteries. J. Power Sources 2018, 400, 402–414. [Google Scholar] [CrossRef]
  13. Broussely, M.; Herreyre, S.; Biensan, P.; Kasztejna, P.; Nechev, K.; Staniewicz, R.J. Aging mechanism in Li ion cells and calendar life predictions. J. Power Sources 2001, 97–98, 13–21. [Google Scholar] [CrossRef]
  14. Broussely, M.; Biensan, P.; Bonhomme, F.; Blanchard, P.; Herreyre, S.; Nechev, K.; Staniewicz, R.J. Main aging mechanisms in Li ion batteries. J. Power Sources 2005, 146, 90–96. [Google Scholar] [CrossRef]
  15. Vetter, J.; Novák, P.; Wagner, M.R.; Veit, C.; Möller, K.-C.; Besenhard, J.O.; Winter, M.; Wohlfahrt-Mehrens, M.; Vogler, C.; Hammouche, A. Ageing mechanisms in lithium-ion batteries. J. Power Sources 2005, 147, 269–281. [Google Scholar] [CrossRef]
  16. Scrosati, B.; Garche, J.; Tillmetz, W. Advances in Battery Technologies for Electric Vehicles; Elsevier: Amsterdam, The Netherlands, 2015. [Google Scholar]
  17. Dubarry, M.; Qin, N.; Brooker, P. Calendar aging of commercial Li-ion cells of different chemistries—A review. Curr. Opin. Electrochem. 2018, 9, 106–113. [Google Scholar] [CrossRef]
  18. Kasnatscheew, J.; Evertz, M.; Kloepsch, R.; Streipert, B.; Wagner, R.; Cekic Laskovic, I.; Winter, M. Learning from Electrochemical Data: Simple Evaluation and Classification of LiMO2-type-based Positive Electrodes for Li-Ion Batteries. Energy Technol. 2017, 5, 1670–1679. [Google Scholar] [CrossRef]
  19. Kasnatscheew, J.; Evertz, M.; Streipert, B.; Wagner, R.; Nowak, S.; Cekic Laskovic, I.; Winter, M. Improving cycle life of layered lithium transition metal oxide (LiMO2) based positive electrodes for Li ion batteries by smart selection of the electrochemical charge conditions. J. Power Sources 2017, 359, 458–467. [Google Scholar] [CrossRef]
  20. Kasnatscheew, J.; Röser, S.; Börner, M.; Winter, M. Do Increased Ni Contents in LiNixMnyCozO2 (NMC) Electrodes Decrease Structural and Thermal Stability of Li Ion Batteries? A Thorough Look by Consideration of the Li + Extraction Ratio. ACS Appl. Energy Mater. 2019, 2, 7733–7737. [Google Scholar] [CrossRef]
  21. Xu, G.; Liu, X.; Daali, A.; Amine, R.; Chen, Z.; Amine, K. Challenges and Strategies to Advance High-Energy Nickel-Rich Layered Lithium Transition Metal Oxide Cathodes for Harsh Operation. Adv. Funct. Mater. 2020, 30, 2004748. [Google Scholar] [CrossRef]
  22. Peled, E.; Yamin, H. The Passivating Layer on Lithium in Lithium Tetrachloroalumnate-SOCl2 Solutions. In Proceedings of the 28th Power Sources Symposium, Atlantic City, NJ, USA, 12–15 June 1978; p. 237. [Google Scholar]
  23. Peled, E. The Electrochemical Behavior of Alkali and Alkaline Earth Metals in Nonaqueous Battery Systems-The Solid Electrolyte Interphase Model. J. Electrochem. Soc. 1979, 126, 2047–2051. [Google Scholar] [CrossRef]
  24. Schmitt, J.; Maheshwari, A.; Heck, M.; Lux, S.; Vetter, M. Impedance change and capacity fade of lithium nickel manganese cobalt oxide-based batteries during calendar aging. J. Power Sources 2017, 353, 183–194. [Google Scholar] [CrossRef]
  25. Attia, P.M.; Chueh, W.C.; Harris, S.J. Revisiting the t 0.5 Dependence of SEI Growth. J. Electrochem. Soc. 2020, 167, 090535. [Google Scholar] [CrossRef]
  26. Pinson, M.B.; Bazant, M.Z. Theory of SEI Formation in Rechargeable Batteries: Capacity Fade, Accelerated Aging and Lifetime Prediction. J. Electrochem. Soc. 2012, 160, A243–A250. [Google Scholar] [CrossRef]
  27. Redondo-Iglesias, E.; Venet, P.; Pelissier, S. Global Model for Self-Discharge and Capacity Fade in Lithium-Ion Batteries Based on the Generalized Eyring Relationship. IEEE Trans. Veh. Technol. 2018, 67, 104–113. [Google Scholar] [CrossRef]
  28. Redondo-Iglesias, E.; Venet, P.; Pelissier, S. Modelling Lithium-Ion Battery Ageing in Electric Vehicle Applications—Calendar and Cycling Ageing Combination Effects. Batteries 2020, 6, 14. [Google Scholar] [CrossRef] [Green Version]
  29. Cuervo-Reyes, E.; Flückiger, R. One Law to Rule Them All: Stretched Exponential Master Curve of Capacity Fade for Li-Ion Batteries. J. Electrochem. Soc. 2019, 166, A1463–A1470. [Google Scholar] [CrossRef]
  30. Wang, J.; Purewal, J.; Liu, P.; Hicks-Garner, J.; Soukazian, S.; Sherman, E.; Sorenson, A.; Vu, L.; Tataria, H.; Verbrugge, M.W. Degradation of lithium ion batteries employing graphite negatives and nickel-cobalt-manganese oxide + spinel manganese oxide positives: Part 1, aging mechanisms and life estimation. J. Power Sources 2014, 269, 937–948. [Google Scholar] [CrossRef]
  31. Lewerenz, M.; Käbitz, S.; Knips, M.; Münnix, J.; Schmalstieg, J.; Warnecke, A.; Sauer, D.U. New method evaluating currents keeping the voltage constant for fast and highly resolved measurement of Arrhenius relation and capacity fade. J. Power Sources 2017, 353, 144–151. [Google Scholar] [CrossRef]
  32. Schimpe, M.; von Kuepach, M.E.; Naumann, M.; Hesse, H.C.; Smith, K.; Jossen, A. Comprehensive Modeling of Temperature-Dependent Degradation Mechanisms in Lithium Iron Phosphate Batteries. J. Electrochem. Soc. 2018, 165, A181–A193. [Google Scholar] [CrossRef] [Green Version]
  33. Arrhenius, S. Über die Reaktionsgeschwindigkeit bei der Inversion von Rohrzucker durch Säuren. Z. für Phys. Chem. 1889, 4, 226–248. [Google Scholar] [CrossRef] [Green Version]
  34. Su, L.; Zhang, J.; Huang, J.; Ge, H.; Li, Z.; Xie, F.; Liaw, B.Y.B.Y. Path dependence of lithium ion cells aging under storage conditions. J. Power Sources 2016, 315, 35–46. [Google Scholar] [CrossRef]
  35. Deutschen, T.; Gasser, S.; Schaller, M.; Siehr, J. Modeling the self-discharge by voltage decay of a NMC/graphite lithium-ion cell. J. Energy Storage 2018, 19, 113–119. [Google Scholar] [CrossRef]
  36. Redondo-Iglesias, E.; Venet, P.; Pelissier, S. Influence of the non-conservation of SoC value during calendar ageing tests on modelling the capacity loss of batteries. In Proceedings of the 2015 Tenth International Conference on Ecological Vehicles and Renewable Energies (EVER), Monte Carlo, Monaco, 31 March–2 April 2015; pp. 1–5. [Google Scholar]
  37. Lewerenz, M.; Fuchs, G.; Becker, L.; Sauer, D.U. Irreversible calendar aging and quantification of the reversible capacity loss caused by anode overhang. J. Energy Storage 2018, 18, 149–159. [Google Scholar] [CrossRef]
  38. Lewerenz, M.; Sauer, D.U. Evaluation of cyclic aging tests of prismatic automotive LiNiMnCoO2-Graphite cells considering influence of homogeneity and anode overhang. J. Energy Storage 2018, 18, 421–434. [Google Scholar] [CrossRef]
  39. Lewerenz, M.; Dechent, P.; Sauer, D.U. Investigation of capacity recovery during rest period at different states-of-charge after cycle life test for prismatic Li(Ni1/3Mn1/3Co1/3)O2-graphite cells. J. Energy Storage 2019, 21, 680–690. [Google Scholar] [CrossRef]
  40. Fath, J.P.; Alsheimer, L.; Storch, M.; Stadler, J.; Bandlow, J.; Hahn, S.; Riedel, R.; Wetzel, T. The influence of the anode overhang effect on the capacity of lithium-ion cells–a 0D-modeling approach. J. Energy Storage 2020, 29, 101344. [Google Scholar] [CrossRef]
  41. Schuster, S.F.; Brand, M.J.; Campestrini, C.; Gleissenberger, M.; Jossen, A. Correlation between capacity and impedance of lithium-ion cells during calendar and cycle life. J. Power Sources 2016, 305, 191–199. [Google Scholar] [CrossRef]
  42. Farmann, A.; Sauer, D.U. A study on the dependency of the open-circuit voltage on temperature and actual aging state of lithium-ion batteries. J. Power Sources 2017, 347, 1–13. [Google Scholar] [CrossRef]
  43. Wilhelm, J.; Seidlmayer, S.; Keil, P.; Schuster, J.; Kriele, A.; Gilles, R.; Jossen, A. Cycling capacity recovery effect: A coulombic efficiency and post-mortem study. J. Power Sources 2017, 365, 327–338. [Google Scholar] [CrossRef]
Figure 1. (a) OCV characteristic at 25 °C and BoL state with indicated SoC levels of the conducted storage tests. (b) Design of experiment matrix for the aging tests, including the corresponding number of cells investigated at the specific storage conditions.
Batteries 07 00028 g001
Figure 2. (a) Temporal development of the voltage (light gray) and the SoC (dark gray) and a fit of the SoC with the representative mean value of the SoC (yellow) during an exemplary aging period after 54 weeks at 50 °C with a significant self-discharge starting from 100% SoC. SoCend value based on Equation (1) used for fit validation and the derived SoCmean value as assigned storage SoC; (b) SoC decline caused by self-discharge during each aging period for cells initially stored at 100% SoC.
Batteries 07 00028 g002
Figure 3. Comparison of Batch I and Batch II cells at 80% and 35% SoC, including two temperature changes between 60 °C and 50 °C; (a) Discharge capacity fade and increase in ECM parameters (b) ohmic resistance and (c) polarization resistance. The filled-in markers represent cells of Batch I, and the gray dashed lines indicate the two temperature changes.
Batteries 07 00028 g003
Figure 4. Discharge capacity fade for different SoC at the three temperatures of (a) 40 °C, (b) 50 °C and (c) 60 °C. The comparison between OC and CV storage at 100% SoC and 60 °C is shown in (d). The markers indicate intermediate cell characterizations, and the models are shown as lines. The dotted lines show the linear parts of the 2D fits compared to the anode overhang area and anode overhang capacity. Based on the initial values in Table 1, a capacity fade of 5% corresponds to a loss of approximately 152 mAh.
Batteries 07 00028 g004
Figure 5. Comparison of the fit coefficients obtained from the 2D and 4D fits of the CC/20 degradation. The markers indicate the results of the individual 2D fits with constant (a) αC, (b) βC and (c) γC. The colored lines represent the characteristic SoC pattern of the overall 4D fit evaluated at the three temperatures. The color shaded plane shows the SoC and Arrhenius temperature dependency of the 4D fit.
Batteries 07 00028 g005
Figure 6. Discharge capacity fade (left column, (a,c,e)) and increase in polarization resistance (right column, (b,d,f)) as a function of SoC and time for the three temperatures of 40 °C, 50 °C and 60 °C (from top-down). The markers indicate intermediate cell characterizations, the lines the 2D fit, and the plane the SoC dependency of the 4D fit.
Batteries 07 00028 g006aBatteries 07 00028 g006b
Figure 7. Increase in ohmic resistance evaluated from EIS measurements at the three storage temperatures of (a) 40 °C, (b) 50 °C and (c) 60 °C. The comparison between OC and CV storage at 100% SoC and 60 °C is shown in (d). The markers indicate intermediate cell characterizations, and the models are shown as lines. Based on the initial values in Table 1, an ohmic resistance increase of 40% corresponds to an increase of approximately 0.611 mΩ.
Batteries 07 00028 g007aBatteries 07 00028 g007b
Figure 8. Increase in polarization resistance evaluated from EIS measurements at the three temperatures of (a) 40 °C, (b) 50 °C and (c) 60 °C. The comparison between open-circuit and floating voltage storage at 100% SoC and 60 °C is shown in (d). The markers indicate intermediate cell characterizations, and the models are shown as lines. Based on the initial values in Table 1, a polarization resistance increase of 100% corresponds to an increase of approximately 5.992 mΩ.
Batteries 07 00028 g008aBatteries 07 00028 g008b
Figure 9. Comparison of the fit coefficients obtained from the Rohm aging 2D and 4D fits. The markers indicate the results of the individual 2D fits with constant (a) αR, (b) βR, and (c) γR. The colored lines represent the characteristic SoC dependency of the overall 4D fit evaluated at the three temperatures. The color shaded plane shows the SoC and Arrhenius temperature dependency of the 4D fit and the markers are same as in Figure 7.
Batteries 07 00028 g009
Figure 10. Comparison of the fit coefficients obtained from the Rpol aging 2D and 4D fits. The markers indicate the results of the individual 2D fits with constant (a) αR, (b) βR, and (c) γR. The colored lines represent the characteristic SoC dependency of the overall 4D fit evaluated at the three temperatures. The color shaded plane shows the SoC and Arrhenius temperature dependency of the 4D fit, and the markers are same as in Figure 8.
Batteries 07 00028 g010
Figure 11. Capacity fade versus power fade in terms of polarization resistance increase in all storage aging conditions compared to range of the results from the cyclic aging study. The coloring and line style of HT 0/50 °C and HS 50 °C are taken from [2]. The designated EoL limits are indicated as dashed red square while the BoL state is located in the lower-left corner.
Batteries 07 00028 g011
Figure 12. Comparison of the empirical models applied to (a) discharge capacity, (b) ohmic resistance, and (c) polarization resistance for aging at 50% SoC and the different temperatures. Based on the initial values in Table 1, a capacity fade of 4% corresponds to a loss of approximately 121 mAh and a resistance increase of 40% corresponds to an increase of approximately 0.611 mΩ and 2.397 mΩ for the ohmic and polarization resistance.
Batteries 07 00028 g012
Table 1. Mean cell parameters and their deviation at beginning of life.
ParameterBatch IBatch II
CC/20(3.033 ± 0.017) Ah(3.021 ± 0.011) Ah
Rohm(1.528 ± 0.059) mΩ(1.542 ± 0.082) mΩ
Rpol(5.992 ± 0.300) mΩ(6.038 ± 0.215) mΩ
Table 2. Maximum and average self-discharge at the investigated storage conditions shown in Figure 1b. Compare Figure 2b for the self-discharge of 100% SoC at each storage period.
SoC40 °C
Max./Avg.
50 °C
Max./Avg.
60 °C
Max./Avg.
100%−40%/−20%−42%/−28%−36%/−23%
90%not measurednot measured−5.0%/−3.6%
80%−1.4%/−1.1%−2.4%/−1.6%−3.4%/−2.4%
65%−1.1%/−0.83%−1.7%/−1.3%−2.5%/−1.7%
50%−1.0%/−0.69%−1.3%/−1.1%−1.9%/−1.5%
35%−0.84%/+0.59%−1.1%/−0.88%−1.6%/−1.2%
20%not measurednot measured−1.1%/−0.89%
Table 3. The 4D fit model parameter for CC/20.
ParameterαC,1
103%−1
αC,2
%−2
αC,3
%−3
βC,0
103
βC,1
%−1
γC,0
10−3
γC,1
%−1
Ea,αβ
kJ mol−1
Ea,γ
kJ mol−1
CC/202.635−52.160.307227.20749.5−1.225−21.6136.0439.40
Table 4. The 4D fit model parameter for Rohm and Rpol.
ParameterαR,0
103
αR,1
103%−1
αR,2
-
αR,3
10−3%−1
βR,0
103
γR,0
103
γR,2
-
γR,3
10−3%−1
Ea,αβ
kJ mol−1
Ea,γ
kJ mol−1
Rohm0476.8−1.818 × 10715.4510,05039,790−2.220 × 10−14519.848.6862.46
Rpol−151.30−8.351 × 10−10352.230.18116.91.114 × 10724.1234.7857.61
Table 5. Comparison of the number of parameters and additional parameters needed for each SoC at which the aging is to be evaluated. Comparison of the obtained values for the parameters.
ParameterCC/20RohmRpol
2D fit333
4D fit999
Ecker et al. [3]7 + 1 per SoC7 + 1 per SoC7 + 1 per SoC
cα−0.0044790.079200.4558
cV1.0728.2441.290
cT1.7552.0291.869
V0 = 3.5 V *3.501 V3.777 V4.086 V
T0 = 25 °C *28.34 °C56.04 °C55.37 °C
V = 0.1 V *0.09940 V0.8563 V0.09853 V
T = 10 °C *12.27 °C10.03 °C13.08 °C
Schmalstieg et al. [5]3 + 1 per SoC3 + 1 per SoC3 + 1 per SoC
V06.5812.147 × 1082.406 × 103
αV2.434 V−16.377 × 10⁷ V−16.728 × 10² V−1
αT6445 K10,500 K6214 K
* Parameter set constant by Ecker et al. and Schmalstieg et al. and adjusted during the fitting as an additional parameter.
Table 6. Arrhenius activation energies (Ea) of the two 4D fit model parts and comparison with values from the literature.
ParameterCC/20RohmRpol
Ea,αβ36.04 kJ mol−148.68 kJ mol−134.78 kJ mol−1
Ea,γ39.40 kJ mol−162.46 kJ mol−157.61 kJ mol−1
αT *53.59 kJ mol−187.34 kJ mol−151.67 kJ mol−1
Ea [5]58.0 kJ mol−1 (C1C)49.8 kJ mol−1 (R10s)
Ea [4]43.60 kJ mol−1 (C1C)36.85 kJ mol−1 (R10s)
Ea [6]≈55 kJ mol−1 (C1C)≈55 kJ mol−1 (R17s)
Ea [10]≈69.6 kJ mol−1 (C1C)--
Ea [12]>28 kJ mol−1 (C1C)--
Ea [30]24.5 kJ mol−1 (CC/2)--
Ea [31]≈86 kJ mol−1 (C1C)--
Ea [32]20.6 kJ mol−1 (C1C)--
* This work, based on the equations of Schmalstieg et al. [5].
Table 7. Model RMSE.
ParameterCC/20RohmRpol
2D fit(0.155 ± 0.121)%(1.31 ± 0.840)%(3.50 ± 2.43)%
4D fit0.437%3.08%12.1%
Ecker et al. [3]0.575%4.66%27.2%
Schmalstieg et al. [5]1.17%10.1%17.8%
Table 8. Lifetime forecast until EoL criterion of the 2D and 4D fits at 50% SoC.
Parameter
60 °C/50 °C/40 °C
CC/20
tEoL/Weeks
Rohm
tEoL/Weeks
Rpol
tEoL/Weeks
2D fit274/151/541059/310/10393/35/20
4D fit261/142/72582/248/10092/37/16
Ecker et al. [3]452/181/721515/369/90108/35/14
Schmalstieg et al. [5]262/112/50686/172/4793/37/17
Publisher’s Note: MDPI stays neutral with regard to jurisdictional claims in published maps and institutional affiliations.

