Article

Experimental and Numerical Investigation of the Thermal Performance of a Hybrid Battery Thermal Management System for an Electric Van

1
CEA LITEN, F-38054 Grenoble, France
2
Unit Energy Technology, VITO, Boeretang 200, BE-2400 Mol, Belgium
3
Energyville, Thor Park Poort Genk 8310, BE-3600 Genk, Belgium
4
Institute for Electrical Energy Storage Technology, Technical University of Munich (TUM), Arcisstr. 21, 80333 Munich, Germany
*
Author to whom correspondence should be addressed.
Batteries 2021, 7(2), 27; https://doi.org/10.3390/batteries7020027
Submission received: 15 February 2021 / Revised: 16 April 2021 / Accepted: 19 April 2021 / Published: 28 April 2021

Abstract

:
The temperature and the temperature gradient within the battery pack of an electric vehicle have a strong effect on the life time of the battery cells. In the case of automotive applications, a battery thermal management (BTM) system is required to maintain the temperature of the cells within a prescribed and safe range, and to prevent excessively high thermal gradients within the battery pack. This work documents the assessment of a thermal management system for a battery pack for an electric van, which adopts a combination of active/passive solutions: the battery cells are arranged in a matrix or composite made of expanded graphite and a phase change material (PCM), which can be actively cooled by forced air convection. The thermal dissipation of the cells was predicted based on an equivalent circuit model of the cells (LG Chem MJ1) that was empirically calibrated in a previous study. It resulted that, in order to keep the temperature of the battery pack at or below 40 °C during certain charge/discharge cycles, a purely passive BTM would require a considerable amount of PCM material that would unacceptably increase the battery pack weight. Therefore, the passive solution was combined with an air cooling system that could be activated when necessary. To assess the resulting hybrid BTM concept, CFD simulations were performed and an experimental test setup was built to validate the simulations. In particular, PCM melting and solidification times, the thermal discrepancy among the cells and the melting/solidification temperatures were examined. The melting time experimentally observed was higher than that predicted by the CFD model, but this discrepancy was not observed during the solidification of the PCM. This deviation between the CFD model results and the experimental data during PCM melting can be attributed to the thermal losses occurring through the mock-up casing as the heating elements are in direct contact with the external walls of the casing. Moreover, the temperature range over which the PCM solidifies was 6 °C lower than that estimated in the numerical simulations. This occurs because the simple thermodynamic model cannot predict the metastable state of the liquid phase which occurs before the onset of PCM solidification. The mockup was also used to emulate the heat dissipation of the cells during a highway driving cycle of the eVan and the thermal management solution as designed. Results showed that for this mission of the vehicle and starting from an initial temperature of the cells of 40 °C, the battery pack temperature could be maintained below 40 °C over the entire mission by a cooling air flow at 2.5 m/s and at a temperature of 30 °C.

1. Introduction

The lifetime of lithium-based battery cells is strongly correlated to the temperature levels to which they are exposed during operation and storage. Heat is dissipated in a battery cell both during charging and discharging and its intensity depends on the chemistry of the cells as well as on the rate of this process, which is generally characterized in terms of the so-called C-rate (i.e., the ratio between the actual charge/discharge current and the theoretical current draw under which the battery would deliver its nominal rated capacity in one hour). To improve battery life, it is necessary to keep its operating temperature within a prescribed optimal range and minimize the temperature gradients within a cell as well as the battery pack. Excessively high or low temperatures can reduce lifetime, increase safety risks and even cause permanent damage to the battery [1].
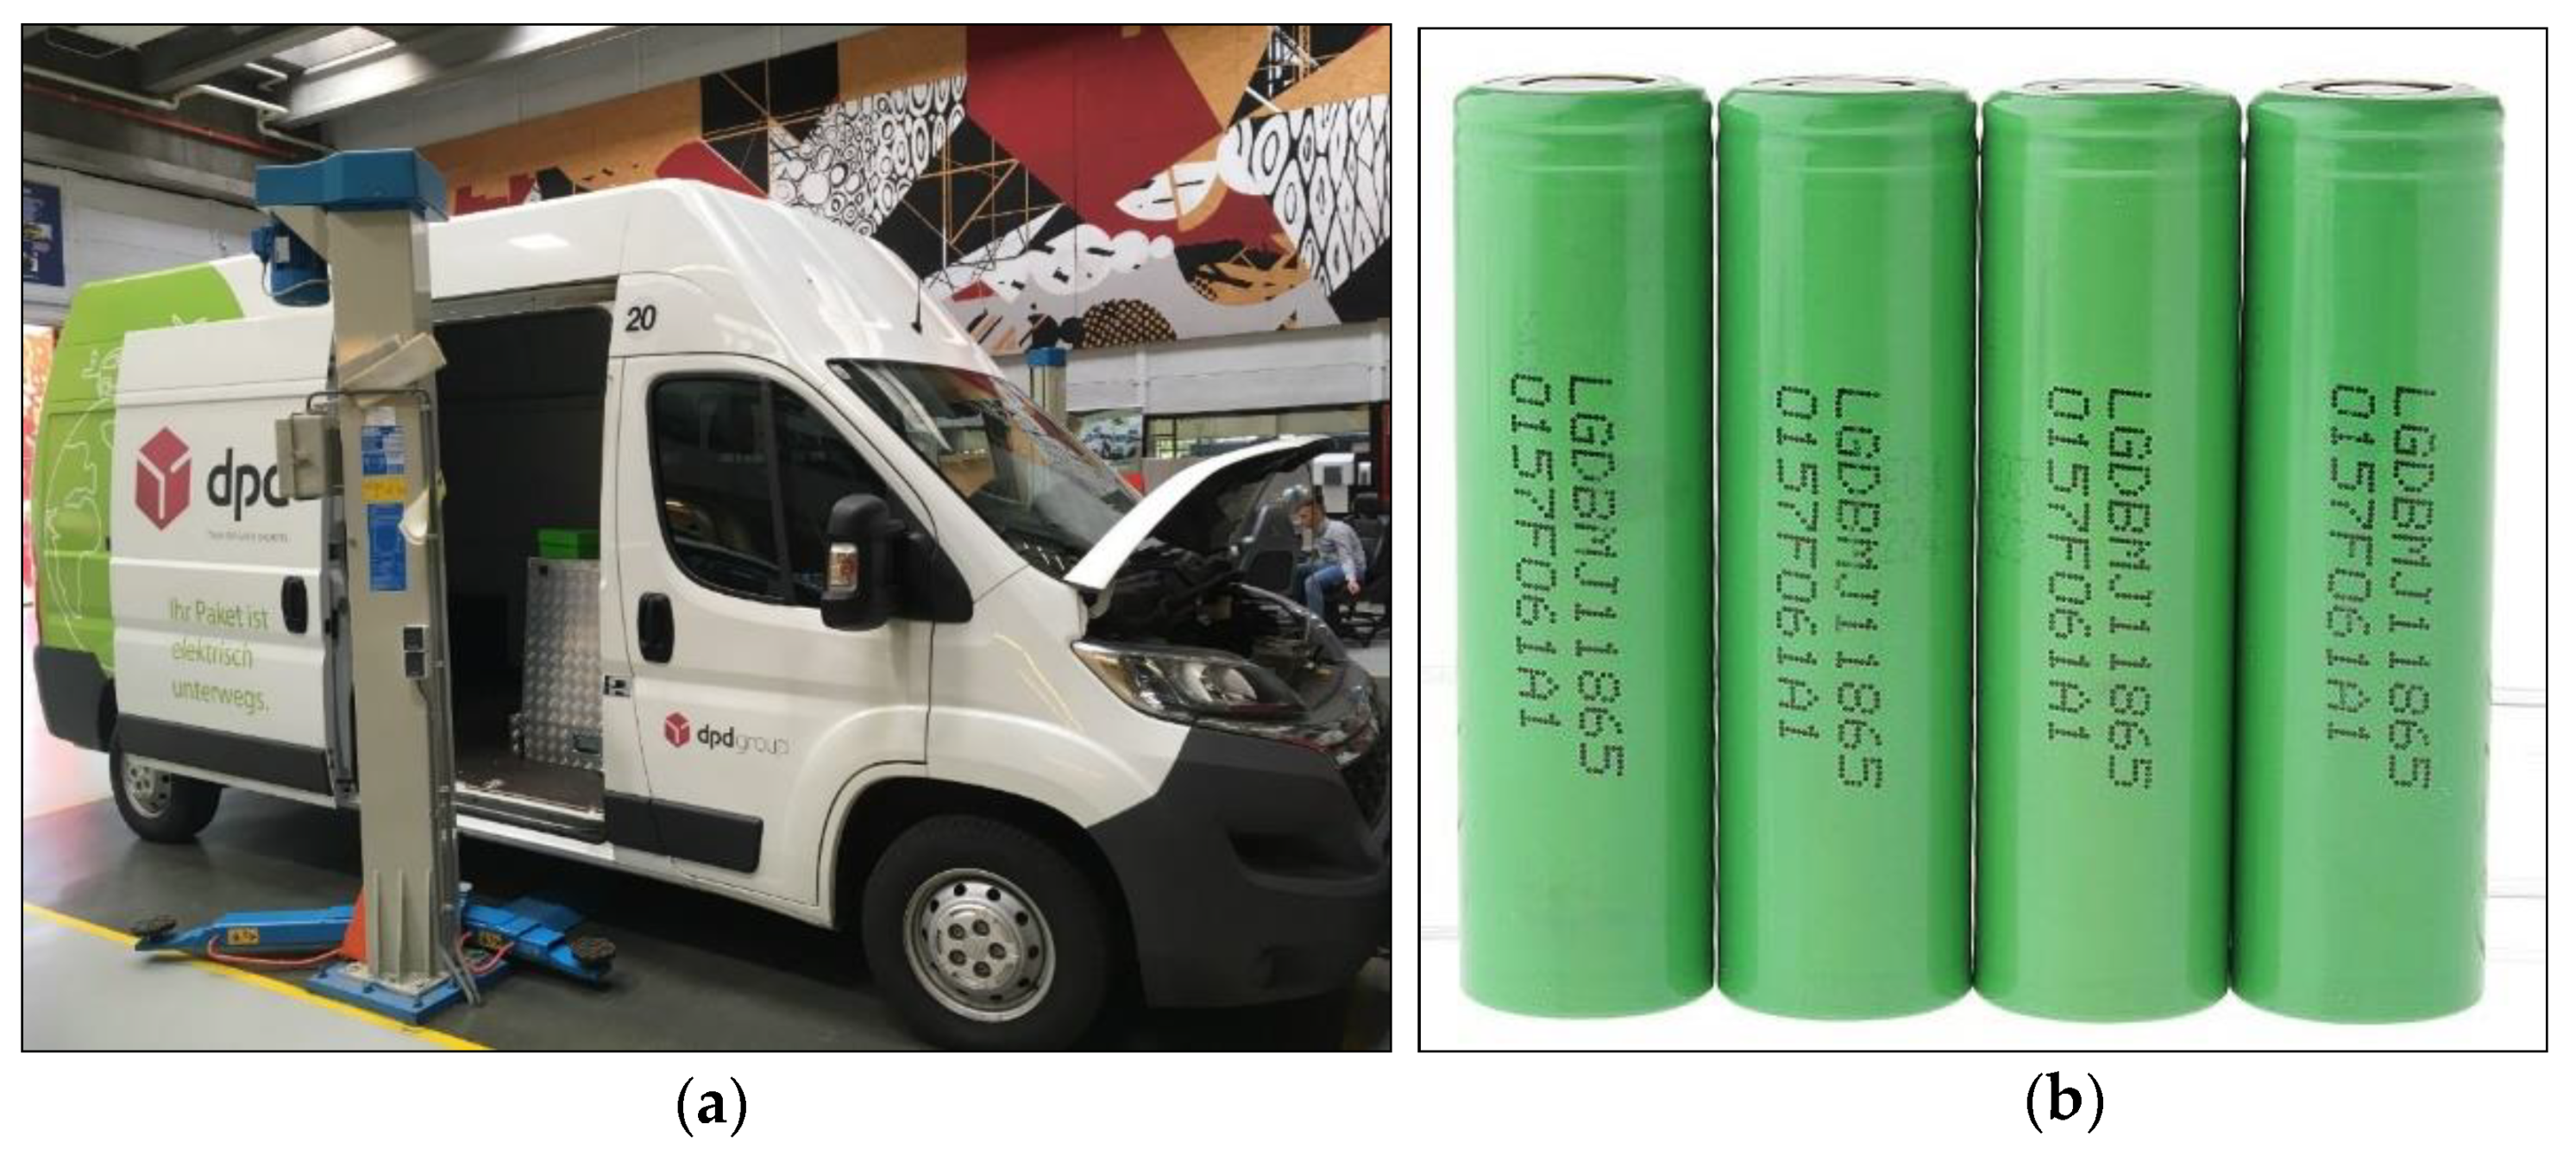
Electric vehicles (EVs) are equipped with battery packs consisting of hundreds or even thousands of battery cells connected in a specific serial-parallel configuration. As the cells aging rate depends on the operating temperature, a nonuniform temperature distribution within the battery pack (temperature gradient) may lead over time to a significant discrepancy in the characteristics of the cells, thereby affecting the overall performance of the battery pack. For example, as discussed in Ref. [1], a single poorly performing cell may lead to insufficient charging and discharging of the whole battery pack.
The optimal operating temperature of battery packs depends on the chemistry of the cells, the required performance and the desired lifetime. In literature, the optimal temperature range indicated for Li-ion battery cells differs. Refs. [1,2] indicate a range between 15 °C and 35 °C, while Ref. [3] between 20 °C and 40 °C, and Refs. [4,5] between 20 °C to 50 °C. Regarding the temperatures gradients within a battery pack, there is, instead, general agreement that differences in the operating temperature of the single cells should not exceed 5 °C [4]. It is, then, apparent that the thermal management of the battery pack is key to ensuring safe operation and avoiding fast degradation of the cell performance.
It is possible to distinguish between three battery thermal management (BTM) system configurations [6]:
  • Passive: heat dissipation occurs without energy consumption;
  • Active: a (gas or liquid) coolant is forced to circulate through the battery pack;
  • Combined or hybrid: battery cooling is performed by a combination of both passive and active cooling solutions.
In [7], Huaqiang Liu et al. documented the state-of-the-art developments in recent years concerning various BTM systems for batteries. The authors list the advantages and disadvantages of four types of active cooling systems based on the coolant characteristics as:
  • Air cooling (forced convection)
  • Liquid cooling
  • Evaporative cooling (heat pipe)
  • Melting of a phase change material
Passive cooling has several advantages, such as no power consumption, no additional control systems required, construction and implementation simplicity, no additional safety risks, low maintenance needs and low-cost potential. However, it is very challenging to fulfil all the requirements in terms of cooling demand and temperature uniformity of battery packs for EVs only by means of passive cooling. One of the most promising passive solutions is the use of a phase changing material (PCM). A PCM stores and releases thermal energy via a melting−freezing cycle: when the material freezes, it releases thermal energy to the surrounding environment and when it melts, an equal amount of thermal energy is absorbed. In theory, the temperature of the PCM remains constant during phase transition. In practice, due to the unavoidable presence of impurities in commercially available PCMs, the solid−liquid phase transition occurs with a temperature glide.
In the literature, the use of a PCM in Li-ion batteries has been investigated experimentally as well as by numerical simulations. The PCM allows the temperature rise in the battery pack to be reduced (below the upper safety limit) and a homogeneous temperature distribution inside the pack and the cell itself to be maintained. Ling et al. [4] have tested experimentally two different thermal management systems for a module made of 20–18,650 Samsung cells:
  • A fully passive solution with a PCM RT44HC and expanded graphite (EG) composite.
  • A hybrid solution where the composite PCM RT44HC- EC is cooled by air (forced convection).
The tests showed that, if the battery pack was charged at 1-C rate and discharged at 1.5/2-C rate, the cell temperature rose above 60 °C with the passive BTM solution only after two charging/discharging cycles. A room temperature of 25 °C was maintained during the tests. In the contrast, with the hybrid solution, the temperature of the battery pack did not exceed 45 °C. It must be noted that the thermal capacity of the PCM/EG composite was high since the cells were arranged in the composite with a square pattern at a distance of 12 mm from one another.
Hemery et al. [8] experimentally assessed the performance of a BTM system adopting a PCM and that of an air cooled BTM in the case of natural and forced convection. The battery pack mock-up was equipped with 27 electric heaters embedded in cylindrical stainless-steel cases to reproduce the heat dissipation occurring in the battery cells. The authors measured the temperature rise within the battery pack for the two BTM concepts during multiple subsequent driving cycles. Large temperature variations were measured with the air-cooled BTM, while with the use of PCM, the increase over time in the average cell wall temperature was significantly lower. As long the PCM was not fully melted, the temperature increase was around 1 °C. Similarly, the temperature gradients within the mock-up were largely reduced by the PCM.
W.Q. Li et al. [9] studied a BTM concept where the battery cells were packed in a structure made of copper metal foam saturated with paraffin (RT 44HC). The authors performed experiments to assess this BTM concept versus a passively air-cooled BTM system. The tests showed that, with the air-cooled battery pack, the cells located in the center of the module reached the upper temperature limit indicated by the manufacturer (i.e., 65 °C) under a 1-C discharge rate after approximately 50 min. This temperature limit was not exceeded by the outer cells of the battery pack, thanks to the cooling provided by ambient air through natural convection. The temperature difference (DT) between the inner and outer cells was higher than 10 °C. The battery pack structure combining copper metallic foam with paraffin featured, instead, a maximum temperature lower than 50 °C and the temperature difference across the pack reduced to about 4 °C for the same battery discharge rate. If the cells were surrounded only by paraffin, the maximum temperature of the inner cells increased to 53 °C, while that of the outer cells was around 47 °C (DT = 6 °C). It was concluded that the metallic foam increased the thermal conductivity within the PCM, thus improving the performance of the passive BTM system.
Similar results were found by Guiwen Jiang et al. [10], who investigated the adoption in the battery pack of a composite made of a phase change material and expanded graphite (CPCM). The authors also varied the amount of expanded graphite (EG) in the composite and observed that the leakage of melted PCM occurring during phase transition tended to reduce as the EG mass fraction was increased. Without PCM/CPCM, the surface temperature of a cell increased almost linearly over time and reached a temperature higher than 60 °C in less than one hour. With PCM, the cell temperature started increasing only after 700 s, when the PCM that was in contact with the cells had completely melted. Due to the poor thermal conductivity of the material, the PCM outer layers did not melt. The expanded graphite of the composite material allows the thermal conductivity to be enhanced. The outcome was a more homogeneous temperature within the battery pack and, therefore, a more effective BTM system. The amount of EG in the composite must be, nevertheless, limited since it decreases the overall specific enthalpy variation of the CPCM during phase transition. The authors concluded that the EG fraction has to be limited to around 16–20 wt.%. This represents a trade-off between the reduction in PCM leakage and the decrease in the overall thermal inertia of the composite.
In [11], Huang et al. studied three different kinds of BTMs. In the baseline solution, 30 cylindrical 18,650 lithium iron phosphate batteries were inserted in a PCM-graphite matrix. The other BTMs made use of flat heat pipes to cool the PCM-graphite matrix. The working fluid of the heat pipes was either air (BTM solution No. 2) or ethyl alcohol (BTM solution No. 3). During a single full discharge test, the melting temperature was not reached for all the BTM configurations, even for a 2-C discharge rate. If the discharge/charging cycle was repeated, the temperature of the PCM in the uncooled configuration progressively increased, while for the BTM systems using heat pipes the average temperature tended to stabilize. With a 3-C discharge/charge rate, the cell temperature was around 50 °C for the BTM system adopting air as the working fluid of the heat pipes and 45 °C in the ethyl alcohol case.
Based on the results reported in the literature, it is possible to conclude that the adoption of a PCM in the battery pack is not sufficient to maintain cell temperature low enough to preserve their performance and lifetime. In this respect, M. Alipour et al. [5] report that, for the majority of Li-ions batteries, the optimal operating range is between 10–35 °C.
This work presents the design of a combined active/passive BTM solution for the battery pack of an electric van. The research was carried out in the framework of the European funded project Everlasting, that aims at enhancing the range, the lifetime and the safety of Li-ion batteries through innovative battery management. The proposed BTM system combines the use of PCM in the battery pack with air cooling. The cooling air is precooled to maintain the battery temperature below 35 °C under all operating conditions. The air is cooled by a refrigerating loop whose realization requires the adaptation of the heat pump installed aboard the eVan for cabin air conditioning. The design of the heat pump is, however, not documented in this paper, which is structured as follows: Section 2 provides an overview of the application and of the design requirements of the battery pack. Section 3 documents the CFD model of the battery pack used to assess the hybrid BTM system and the experimental setup realized to validate the numerical results. Section 4 compares the performance of the fully passive solution against that of the hybrid BTM system for a prescribed driving cycle of the eVan.

2. Design Requirements and Preliminary Considerations

2.1. Battery Pack Description and Design Conditions

The electric vehicle for which the battery pack and the BTM system were designed, see Figure 1a, was an electric utility eVan of the company Voltia, commercialized with the name eVan20, and currently used by Schachinger Logistik Holding, a logistics company in Austria. The eVan was realized in 2016 by revamping a Citroen Jumper 35 L3H3 2.2 HDi 130, i.e., the donor vehicle, and it had done 5365 km so far. The vehicle was equipped with a swappable lithium ion battery of 90 kWh of capacity, allowing for a range up to 240 km per charge.
The new battery pack for this demonstrator would have a total capacity of 48 kWh, a nominal voltage of 610 V, a maximum charge current of 34 A, a minimum voltage of 420 V and a maximum voltage of 705 V. The battery features 3840 LG MJ1 cells arranged in a 192 serial × 20 parallel configuration. Each cell has a cylindrical shape and standard dimensions (diameter 18.65 mm; height 65.30 mm), see Figure 1b.
The operating conditions and requirements considered in the project for the design of the BTM system were:
  • The temperature gradient along each cell should be less than 1 °C.
  • The maximum temperature gradient among the modules of the battery pack should not exceed 5 °C.
  • The energy density of the battery pack should not be reduced by more than 5% by the adoption of the PCM in the battery pack.
  • Outdoor ambient temperature equal to 40 °C.

2.2. Thermal Dissipation versus Discharge/Charge Rate of an Electric Cell and of the Whole Battery Pack

To determine the amount of thermal energy released as heat by the cells of the battery pack during operation, it is essential to know the thermal characteristics of the cells. In the project at hand, these were experimentally assessed by means of calorimetric measurements in an adiabatic chamber [12]. Notably, the experiments allowed the thermal energy released by one LG Chem MJ1 cell under different discharge rates to be determined. The measurements were used to validate a battery cell model that could predict the voltage and the average temperature of a cell for any dynamic or constant load applied to it. The cell model is an equivalent circuit model (ECM) consisting of an open circuit voltage source (OCV) and a polarization network (Ri + R1||C1). The cell temperature is determined by solving the energy balance which accounts for (i) the thermal energy released as heat by the cells due to their internal resistance, (ii) the change of entropy that occurs in the cell during (dis)charge, and (iii) the thermal energy rejected into ambient by convection. The energy balance reads
m   c c e l l   d T c e l l d t = I 2 R + T c e l l   Δ S   I n F + A h   T c e l l   T a m b  
In this equation, m is the mass of the cell, c c e l l is the heat capacity, T c e l l   is the temperature of the cell, R is the internal resistance, Δ S is the entropy change, A is the heat exchange area, h is the convective heat transfer coefficient, I is the charge/discharge current, F is Faraday constant, T a m b   is the ambient temperature and n is the charge number pertaining to the reaction (for Lithium Ion it is 1) [13]. If the temperature of the cell is known, the thermal power released by a cell under adiabatic conditions is evaluated by Equation (2)
P = V r c   I + I 2 R + d V o c v d T   T c e l l   I  
where V r c   is the overpotential from the RC network and d V o c v d T   is the entropy of the cell.
Figure 2 shows a comparison between the cell heat dissipation at a 0.5-C discharge rate determined by means of Equation (2) and the experiments in the adiabatic chamber. There is a good agreement between the measurements and the simulation. The larger deviation between the experimental and numerical values is observed when the state of charge of the cell is about 50%.
Table 1 shows the heat dissipation for the different discharge rates of the cell and the estimated total energy dissipation of the whole battery pack of the e-Van.

2.3. PCM Choice and Preliminary Sizing of the Heat Storage System

PCMs are often used to limit temperature peaks in the battery pack to keep the cell temperature below the upper safety limit [14]. In the present work, the PCM is used as a heat storage system (HSS) to keep the battery pack at a temperature lower than 40 °C. As previously mentioned, PCMs do not usually melt at a fixed temperature but over a temperature glide of a few degrees. To have a safety margin with respect to the upper temperature limit of 40 °C, the PCM PureTemp 37 [15], whose theoretical melting temperature is equal to 37 °C, was, therefore, chosen. To properly accommodate the PCM and the cells within the battery pack, a matrix is needed, such as those shown in Figure 3. The US company AllCell Technologies [16] manufactures a solid matrix made of expanded graphite, which embeds a PCM (wax). There are two main advantages with this product: since the matrix is solid, no special casing is needed, and the use of graphite strongly increases the thermal conductivity. The characteristics of the PCM-graphite matrix adopted for the battery pack are summarized in Table 2.
As can be noted in Table 2, the equivalent thermal conductivity of the composite is higher than 10 W/m/K (depending on the considered plane) while the thermal conductivity of the sole PureTemp 37 is lower than 0.5 W/m/K.
However, the composite has a lower heat capacity than the pure PCM which decreases proportionally to the EG mass fraction in the composite. Given the density of graphite and of PureTemp 37, it is possible to estimate from the data of the manufacturer in Table 3 that the amount of PCM in the composite is around 75% in mass. Based on this information, the variation of the equivalent specific heat capacity of the composite with temperature can be estimated as reported in Figure 4.
Knowing the thermal energy absorbed by the composite material during melting, the driving cycle duration, and the dissipated thermal energy by the cells, a preliminary calculation of the required weight of the HSS can be performed.Table 3 provides an overview of the result of this estimate for multiple discharge C-rates and the consequent decrease in energy density of the battery pack of the eVan.
Table 3 clearly shows that, under the hypothesis of no significant heat transfer from the battery pack into its surroundings, the required amount of composite material to store the thermal energy released by the cells when discharged at a 2-C rate is considerable. The consequent decrease in energy density of the battery would be equal to 33%, much larger than the target pursued in the project, i.e., 5%. To comply with this target, the weight of the composite material cannot exceed 15 kg. Figure 5 and Figure 6 show the expected temperature evolution in the battery pack when the discharge rate was equal to 0.5-C and 1-C, respectively, and a 15 kg HSS was adopted. The trends in the charts were calculated by solving the energy balance for the battery pack under these assumptions:
  • the thermal inertia of the cells was determined given their number (3840), weight (49 g/cell) and Cp (792 J/kg/K);
  • the specific heat capacity of the solid and liquid phases of the PCM-graphite matrix was as reported in Table 2;
  • the specific heat capacity of the PCM-graphite matrix during phase transition varied with temperature as described in Figure 4;
  • no thermal losses from the battery pack.
It is apparent that the passive BTM system can maintain cell temperatures below 40 °C only in the case of a 0.5-C discharge rate and an initial temperature of the battery pack equal to 15 °C. For a 1-C discharge rate, the battery pack always reached a temperature higher than 45 °C, regardless of its initial temperature. Due to the limitation on the HSS weight, it was not, thus, possible to fulfil the design requirement on the cell temperature by using a purely passive BTM system for charging/discharging rates higher than 0.5-C. The BTM system designed for the eVan 20 combined, then, the use of a PCM with active cooling.

3. Modeling of the Hybrid BTM System

To assess the combined active/passive BTM solution of the battery pack, a combination of modelling and experimental activities were carried out. Computational fluid dynamics (CFD) simulations were performed to calculate the temperature variations of the cells and to simulate the effect of two cooling air channels at the top and the bottom of the battery pack on the temperature gradient among the cells. An experimental mock-up was, then, built to test the passive and the active cooling solutions, and thus validate the numerical calculations. The CFD modelling approach and the experimental setup are discussed in the following.

3.1. CFD Model

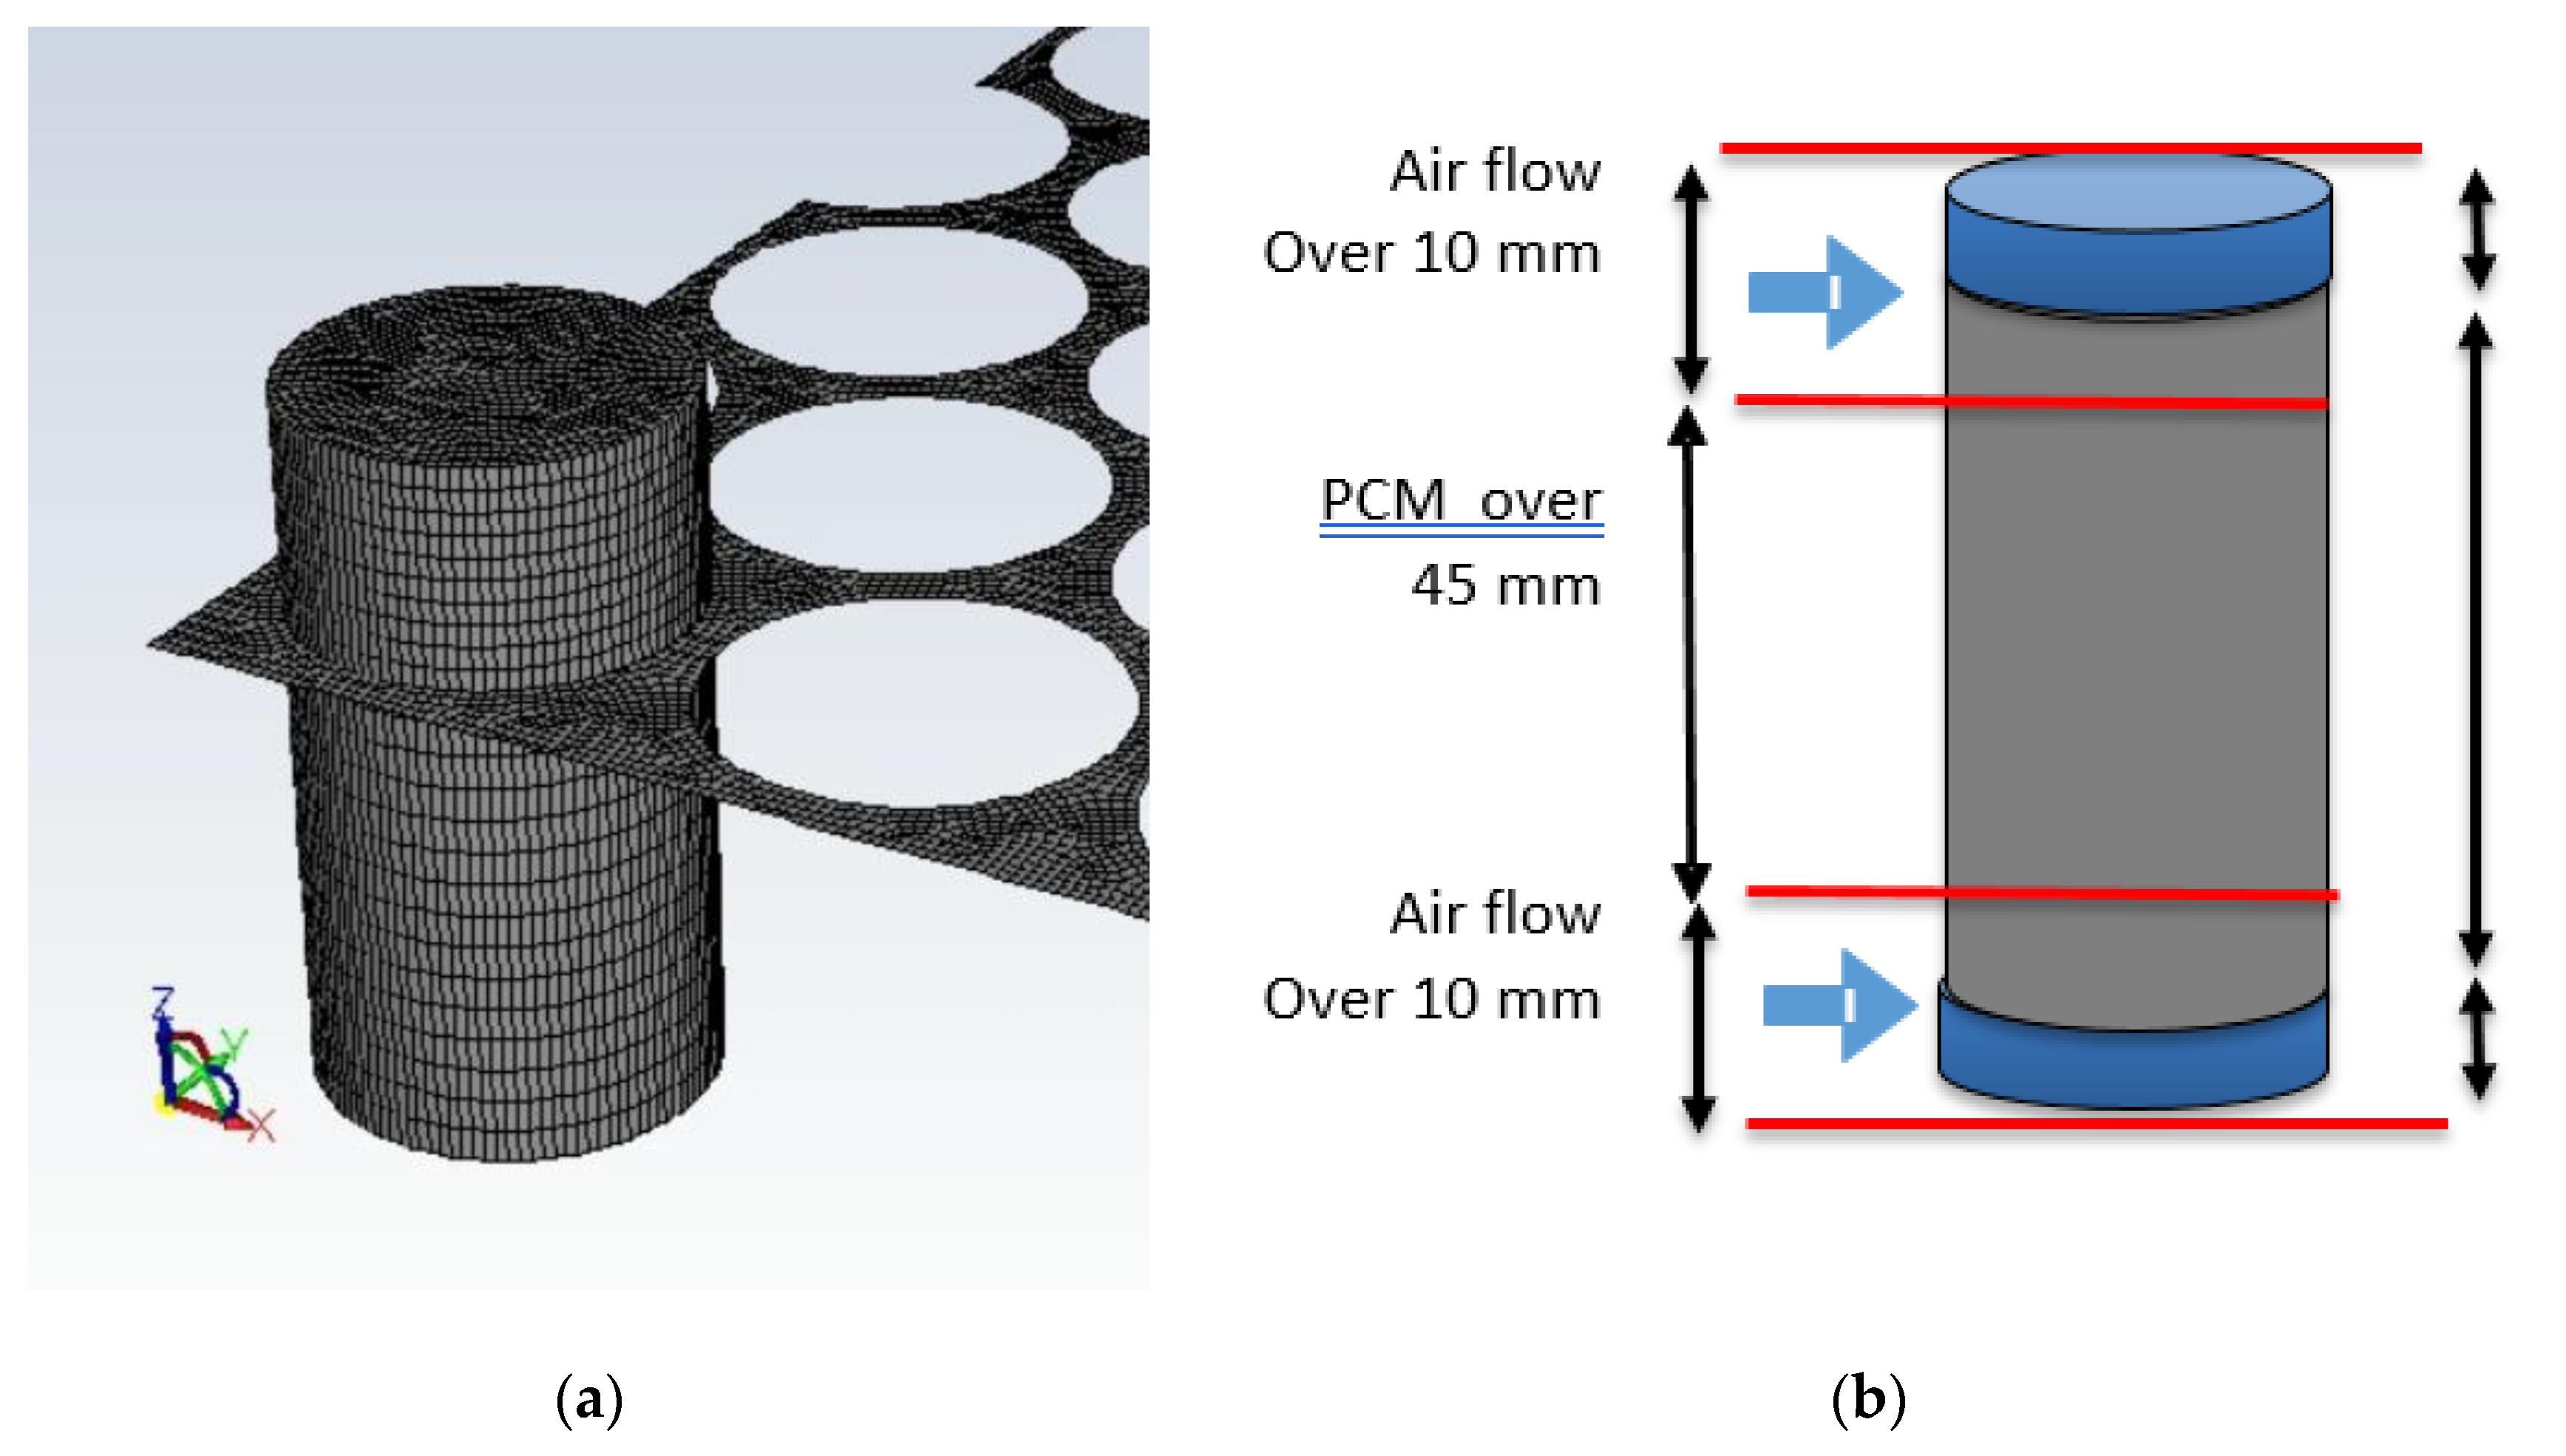
The CFD model was developed in ANSYS Fluent. A grid independence study was carried out and showed that a mesh size of 2.1 × 10⁶ elements was the most suitable for this study. A portion of the mesh domain is shown in Figure 7a. The simulation domain encompassed only a portion of a battery pack module, as symmetry boundary conditions could be applied at planes parallel to the main flow direction of the cooling air and passing through the vertical axes of the cells, see lateral boundaries of the CFD model in Figure 8a. Moreover, it was also possible to identify a symmetry plane with respect to the vertical axes of the cells: only half of the cells required, then, to be modeled.
For the purely passive thermal management solution, the standard pressure-based solver was used. The considered time step was equal to 5 s while the simulation was deemed converged when the scaled energy residual was lower than 1 × 10-11. When air cooling was simulated, the standard k-eps model was used. The time-step of the solution varied from 0.05 s at the beginning of the simulation and it was progressively increased up to 1 s. The adopted convergence criterion required that the scaled residual for the continuity equation decreased to 1 × 10⁻³.
The PCM-graphite matrix surrounds the cells along 45 mm of their height. The lower and upper ends of the cells extends into the cooling air channels by 10 mm, as shown in Figure 7b. Figure 8b shows an exemplary temperature distribution in the battery pack module calculated by the CFD model at the end of a charge/discharge cycle performed at a 1-C rate.

3.2. Experimental Setup

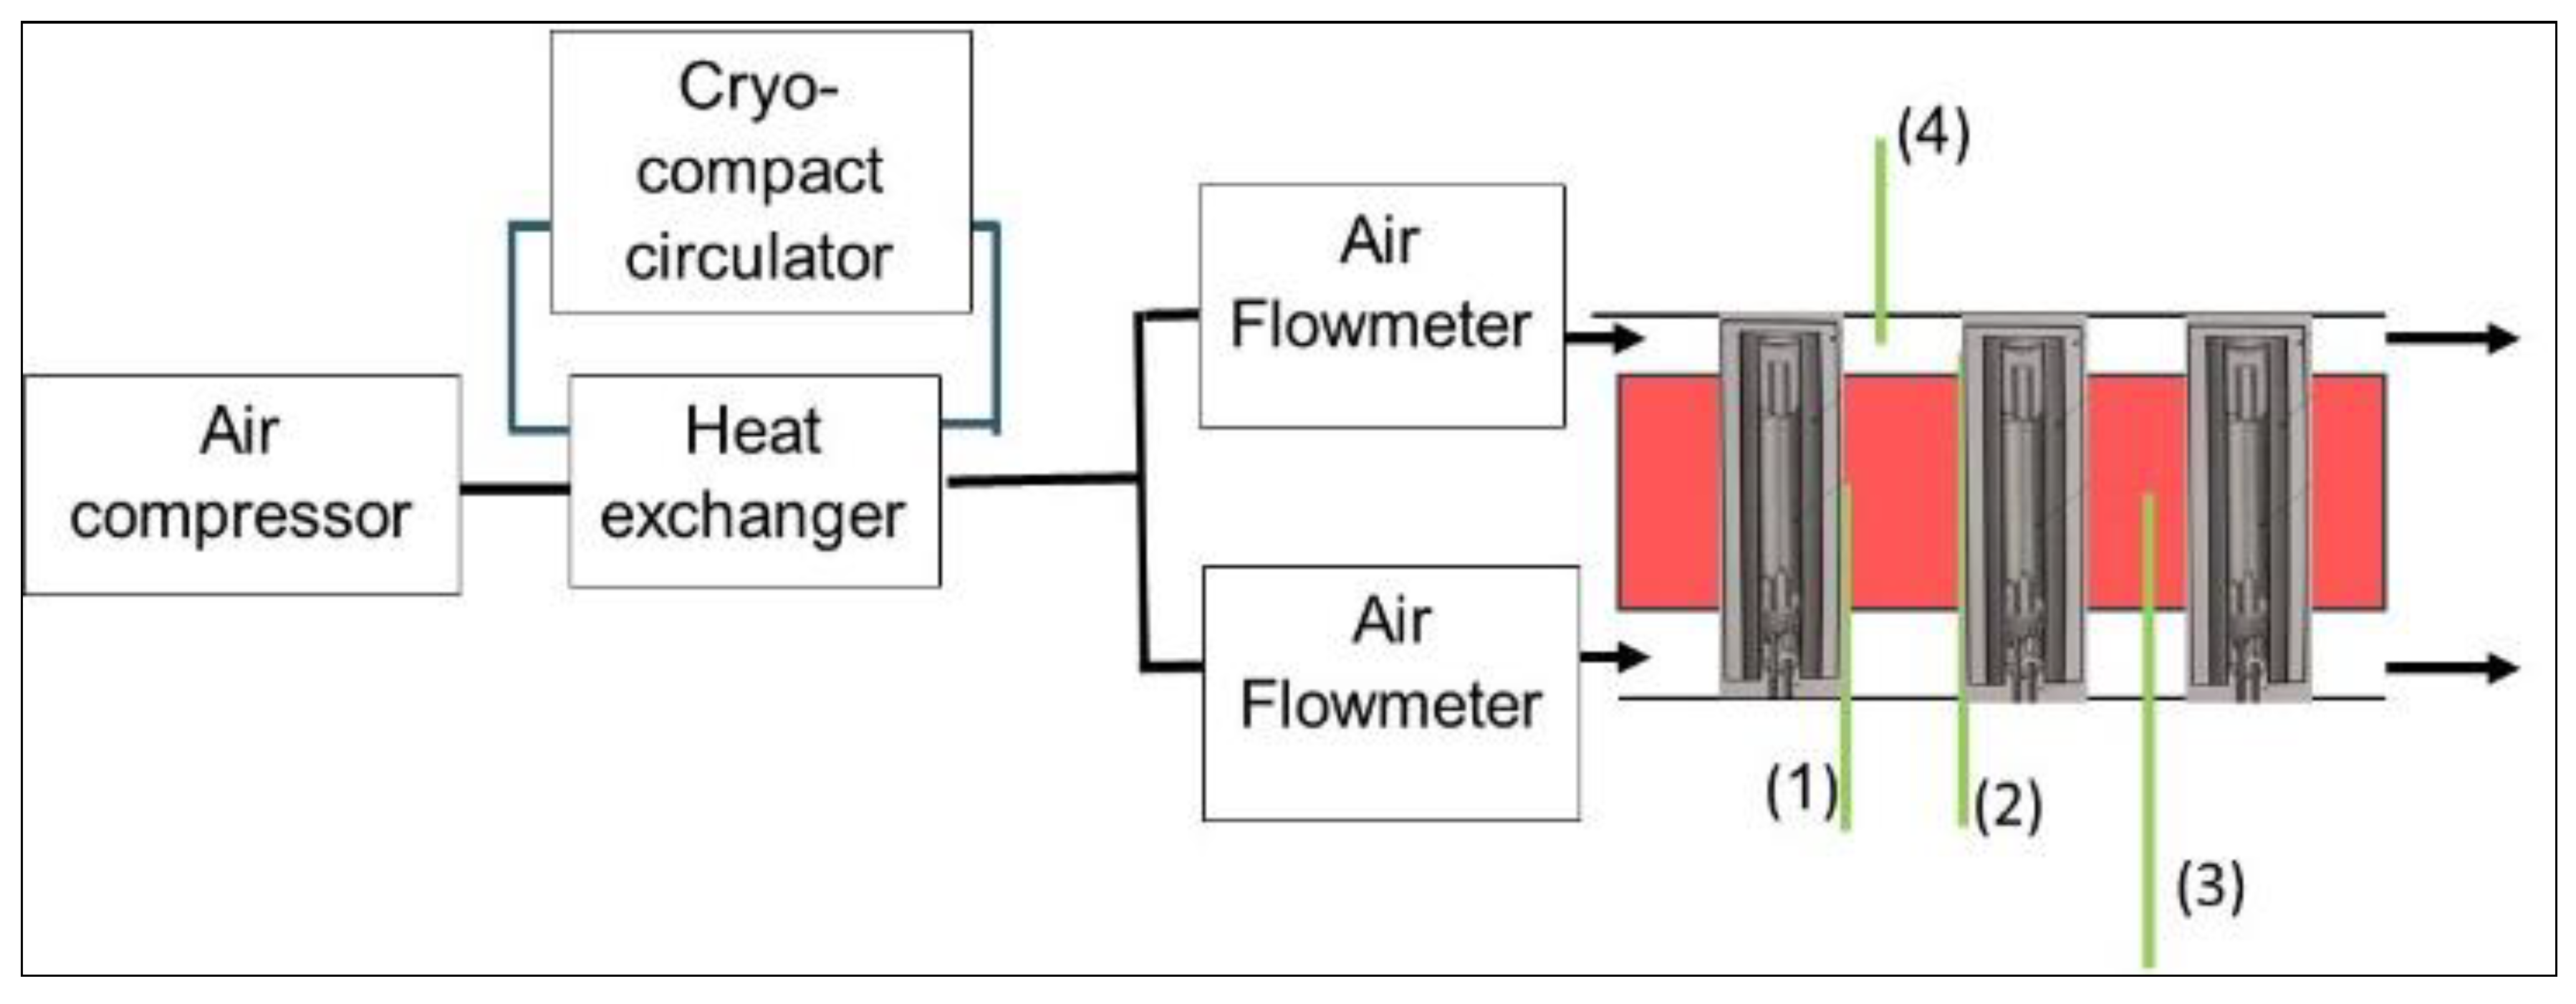
To validate the calculations of the CFD model and to assess the actual performance of the PCM-EG matrix, an experimental setup and a mock-up of the battery pack were built. A schematic of the experimental setup is shown in Figure 9. The prescribed temperature of the cooling air mass flow rate was attained in all operating conditions via a heat exchanger located downstream of the air compressor. The mockup was instrumented as follows:
  • Two air flowmeters, one for each cooling channel.
  • Absolute and differential pressure sensors at the inlet and at the outlet of the mock up.
  • Forty thermocouples type K to measure:
    o
    External temperature of the cells at the center of the PCM—graphite matrix (position 1 in Figure 9) and in the cooling channels (position 2)
    o
    Temperature inside the PCM—graphite matrix (position 3)
    o
    Air temperature in the cooling channel at the top of the battery pack (position 4)
Figure 10 shows two photos of the setup. The first one displays one of the cooling air channels highlighting the direction of the airflow (a), while the second one shows the whole mockup with the instrumentation cabling (b).
The battery pack mockup does not feature real cells. As shown in Figure 11, these were replaced by electric heating elements in an aluminum cylinder. The current of the heating elements could be adjusted to reproduce the heat dissipation of the battery cells. The thermal power that was transferred from the heating elements to the PCM matrix and the cooling air could be accurately estimated by measuring the electrical power. The aluminum casings also featured two grooves along the external surface in contact with the PCM-graphite matrix. Thermocouples were inserted into the grooves to measure the temperature of the battery pack mockup. The heating elements were arranged in the PCM matrix with a triangular pattern. To reduce the overall mass and size of the mockup, the space between two cells/heating elements was limited to 2 mm. The height of each heating element—aluminum cylinder assembly was 65 mm for a total weight of 53 g, 4 g more than the actual electric cells.
Two kinds of tests were performed with the battery pack mock-up. The first consisted of heating up the HSS till the PCM was completely melted. The temperature of the composite was measured at different locations to estimate the melting time and the temperature gradients within the battery pack mock-up. In the second test, the battery pack was cooled by an airflow at 30 °C, starting from an initial condition where the PCM was already completely melted. The solidification time and the temperature gradients in the mock-up were estimated based on the thermocouple measurements.

3.2.1. PCM Melting Time

The PCM melting time was monitored for different values of thermal dissipation of the cells, ranging from 0.55 W to 6.6 W/cell (corresponding to a 0.5-C–4-C discharge rate range). The experimental results and the predictions of the CFD model are shown in Figure 12 and Figure 13, respectively.
It is apparent that there is a large deviation in the actual and predicted melting time. This was confirmed also for the other thermal power levels, as reported in Table 4.
The difference between the experimental and the simulated melting time strongly increases, the lower the thermal power released by the cells/heating elements. Experimental tests were repeated several times and the same trend was observed. The cause thereof lay in the heat losses occurring at the top and bottom surfaces of a cell mock-up which were in direct contact with the PEEK casing that absorbed part of the thermal power released by the heating elements. No clearance between the heating elements and the external casing was considered in the design as preliminary CFD calculations showed an inefficient flow distribution when there was a gap between the top/bottom surfaces of the cells and the external PEEK casing. A possible solution to reduce these heat losses may consist of adding an insulation layer between the upper surface of the cooling air channels and the two ends of a heating element. However, this modification could not be put in place due to the very tight construction of the PEEK casing.

3.2.2. Thermal Gradients in the Battery Pack

Figure 14, Figure 15 and Figure 16 show the wall temperatures of the cells when the thermal dissipation is, respectively, equal to 0.55 W, 2.2 W and 6.6 W. The figures report also the maximum temperature difference between the cells over time. This quantity is indicated as DT max-min in the charts and is deemed representative of the thermal gradients among the cells. It is calculated as the difference between the maximum and minimum temperature of the cells in the battery pack mock-up.
In all the experimental tests reported in the figures above, DT max-min was less than 2.5 °C as long as the PCM was not completely melted in a given position. When the thermal power of the heating elements was low (0.55 W), the thermal energy was evenly transferred by heat conduction throughout the PCM matrix and the value of DT max-min remained almost constant, except when there were inhomogeneities in the state of the PCM over the mock-up: in the zones where PCM melting was completed the temperature of the cells rose rapidly. Once the PCM was fully melted throughout the composite matrix, the value of DT max-min lowered to levels similar to those in the initial phase of the experiment. When the thermal power of the heating elements was higher (6.6 W), the value of DT max-min tended to increase more rapidly if the PCM was completely melted. However, in all test cases, the temperature differences among the cells remained below 5 °C. This is a key feature enabled by the adoption of the EG-PCM matrix in the battery pack.

3.2.3. Thermal Gradients in the Battery Pack when Air Cooling Is Activated

As previously discussed, the amount of PCM of the HSS is not sufficient to maintain the battery pack at temperatures lower than 40 °C in all operating conditions. Thus, a cooling system is needed. In the experiments described in this section, air cooling was activated to cool down the cells from an initial temperature of 44 °C, while the heating elements were turned off. A possible situation where operating conditions similar to those of this experiment may occur is the charging of the eVan battery pack. Future charging stations may, indeed, feature a cooling system to cool down to the battery pack once the charging is completed.
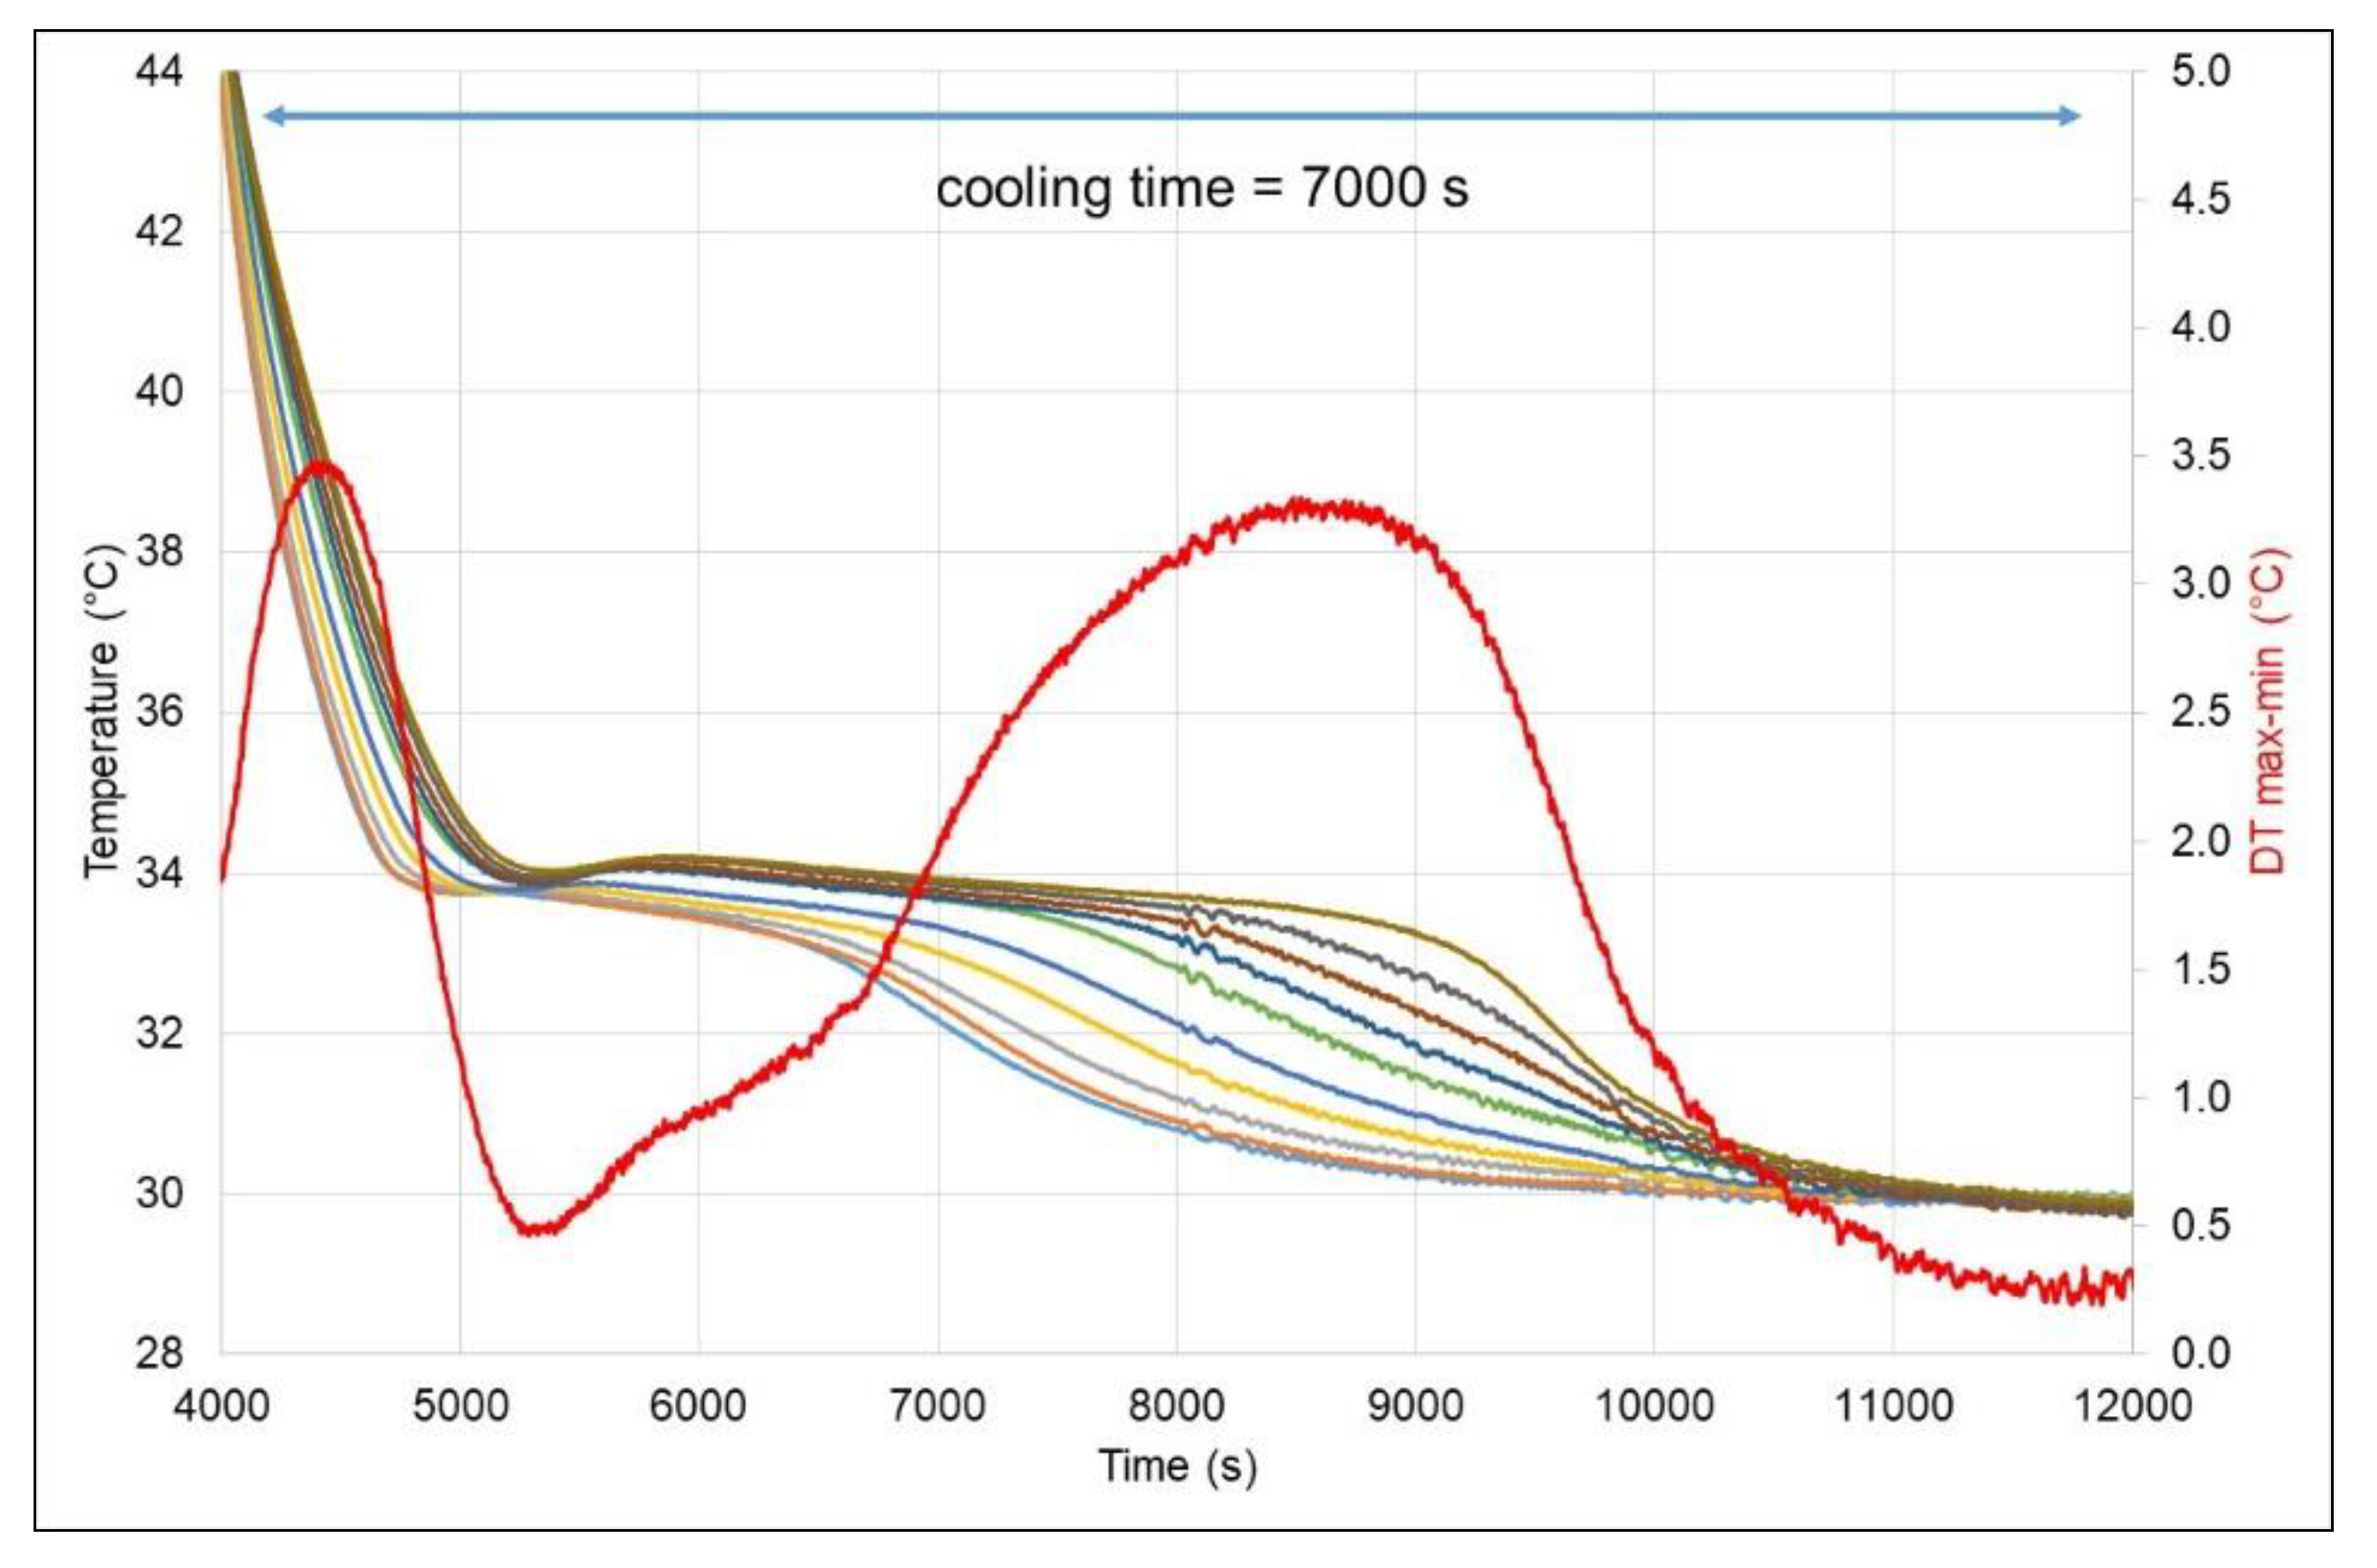
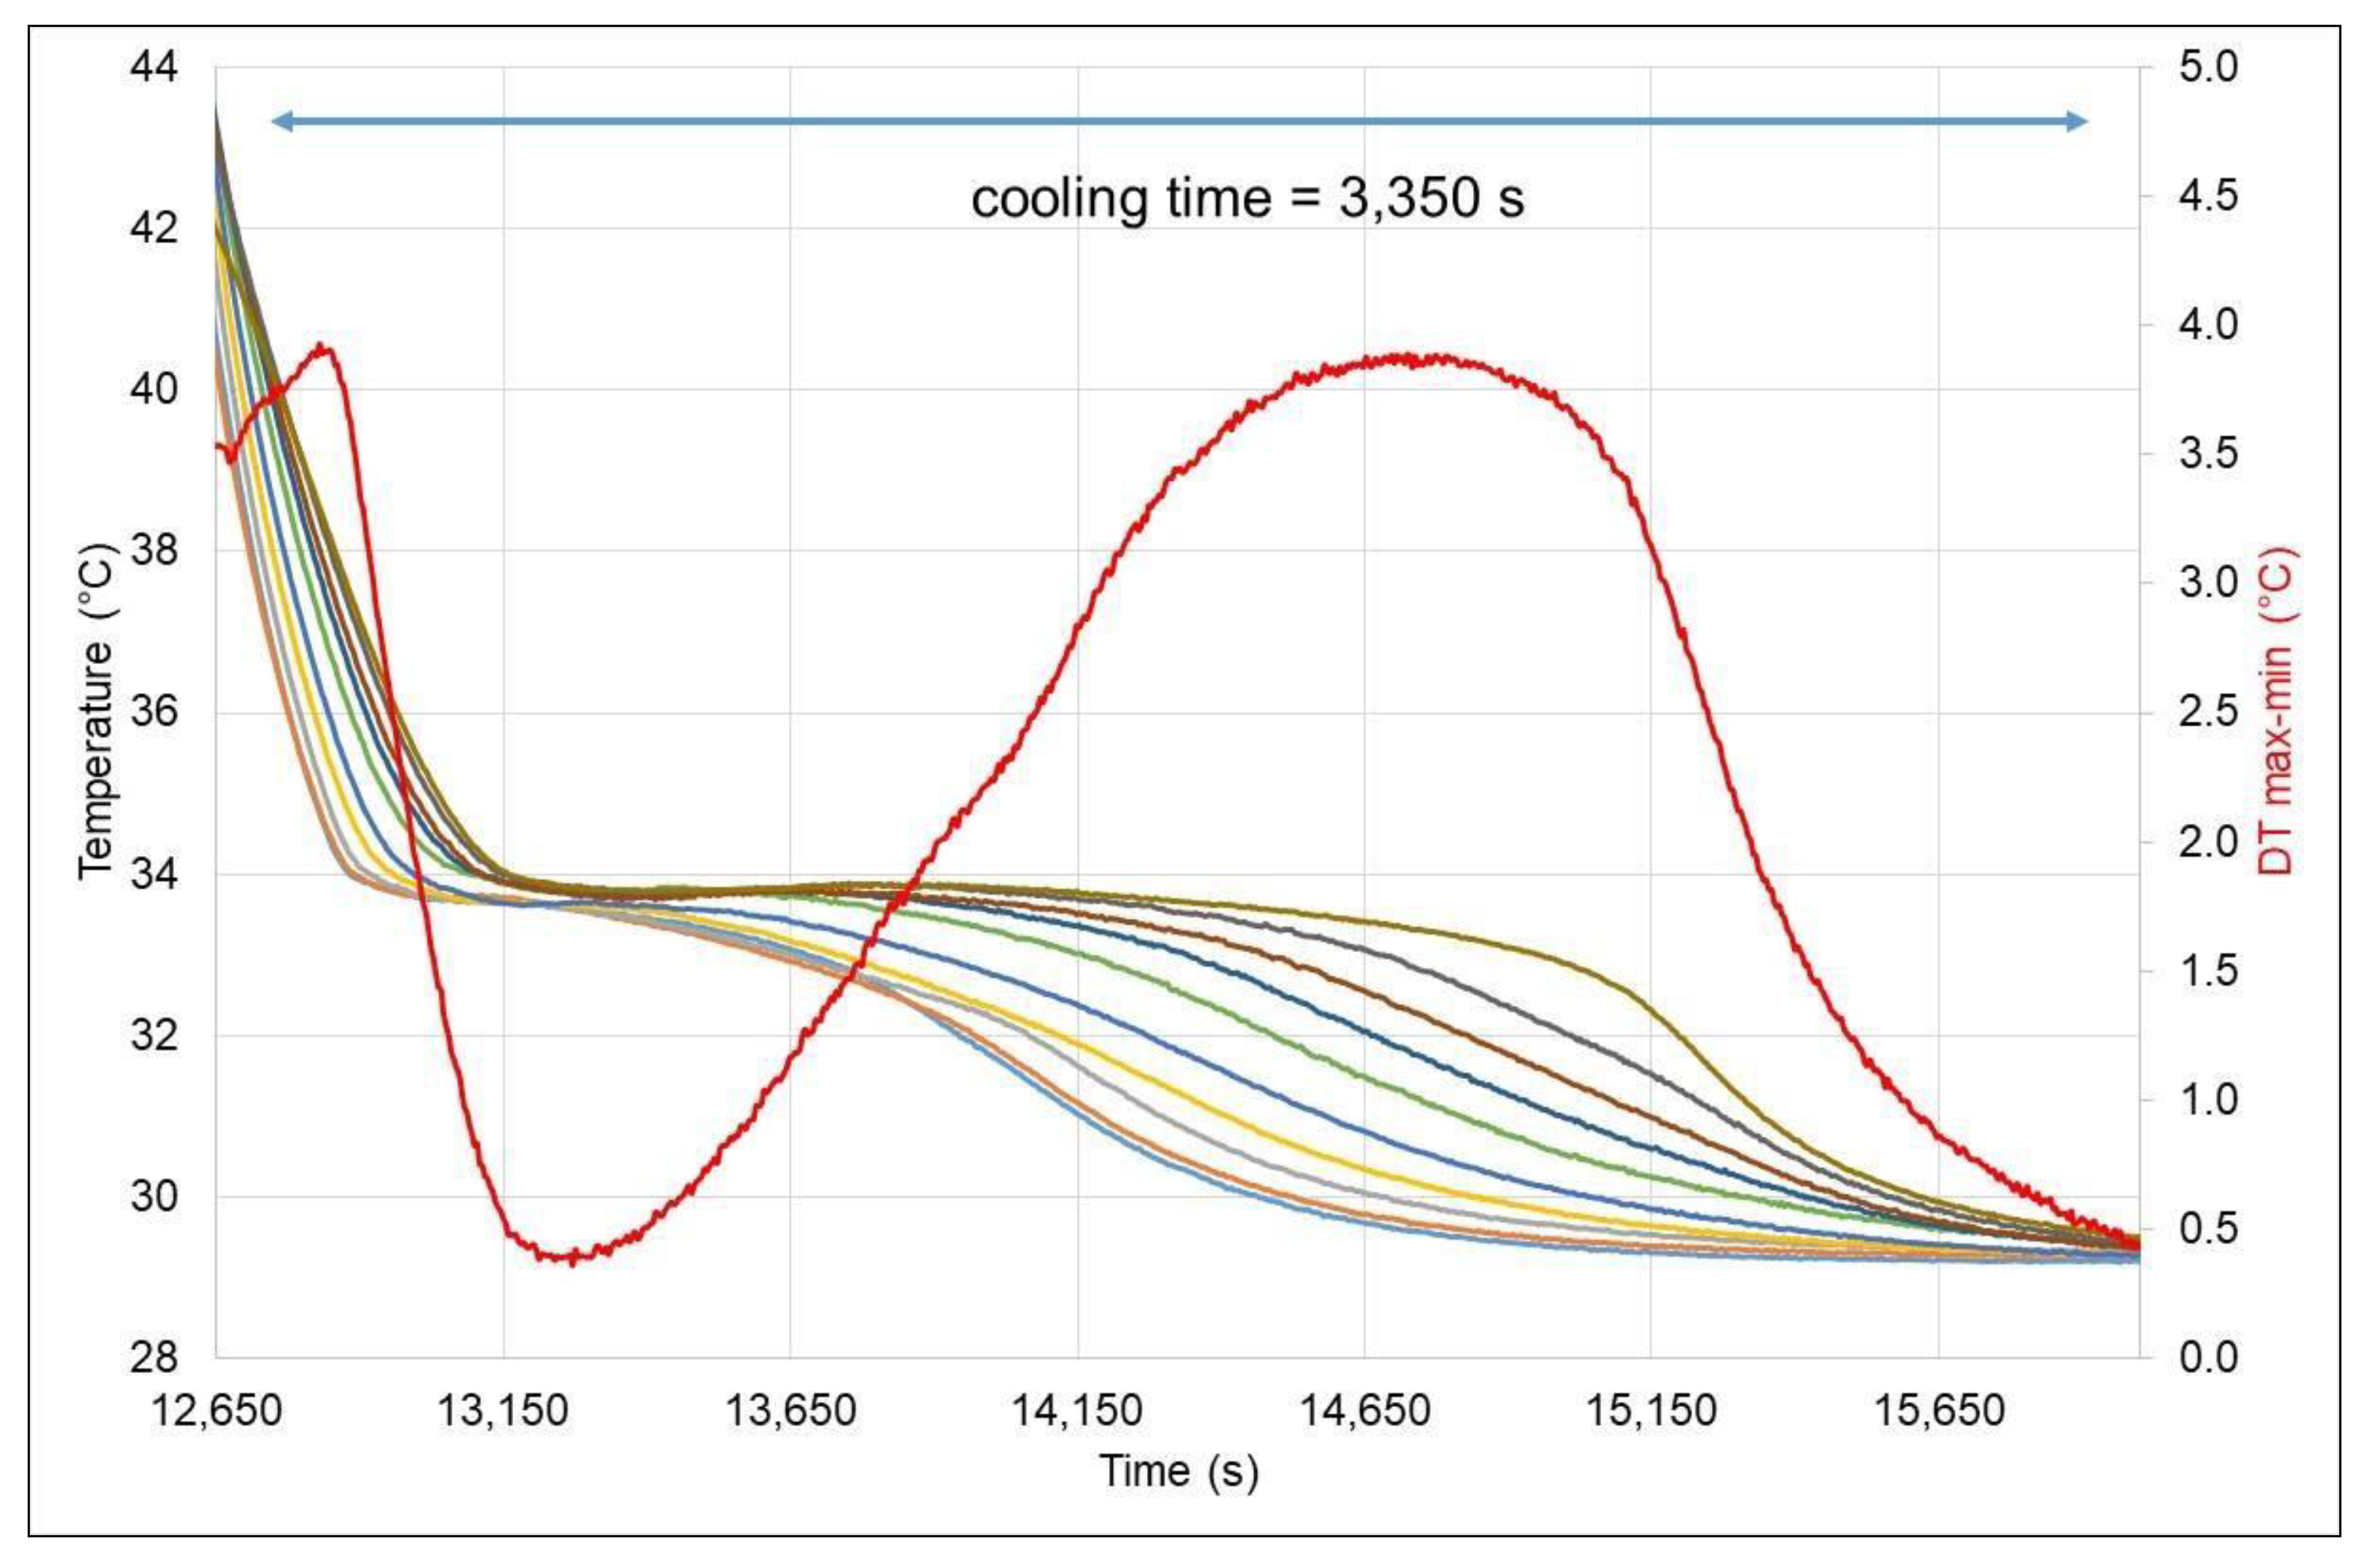
Figure 17, Figure 18 and Figure 19 show the measured surface temperature of the different cells in the battery pack mock-up when the airflow speed was 0.5 m/s, 1 m/s and 2 m/s. The cooling air temperature at the battery pack inlet was kept constant and equal to 30 °C. The chart of the figures also report the variation of DT max-min over time, see the red curve in the charts.
As expected, the higher the air velocity, the shorter the cooling period. At the same time, the temperature differences among the cells tended to increase, though only slightly. The maximum value of DT max-min never exceeded 4 °C. The experimental tests also showed that melting and solidification of the PCM did not occur over the same temperature range, as already observed in the literature, e.g., in Ref. [17]. The melting of the PCM considered in this project occurs around 37 °C while its solidification starts at about 34 °C.
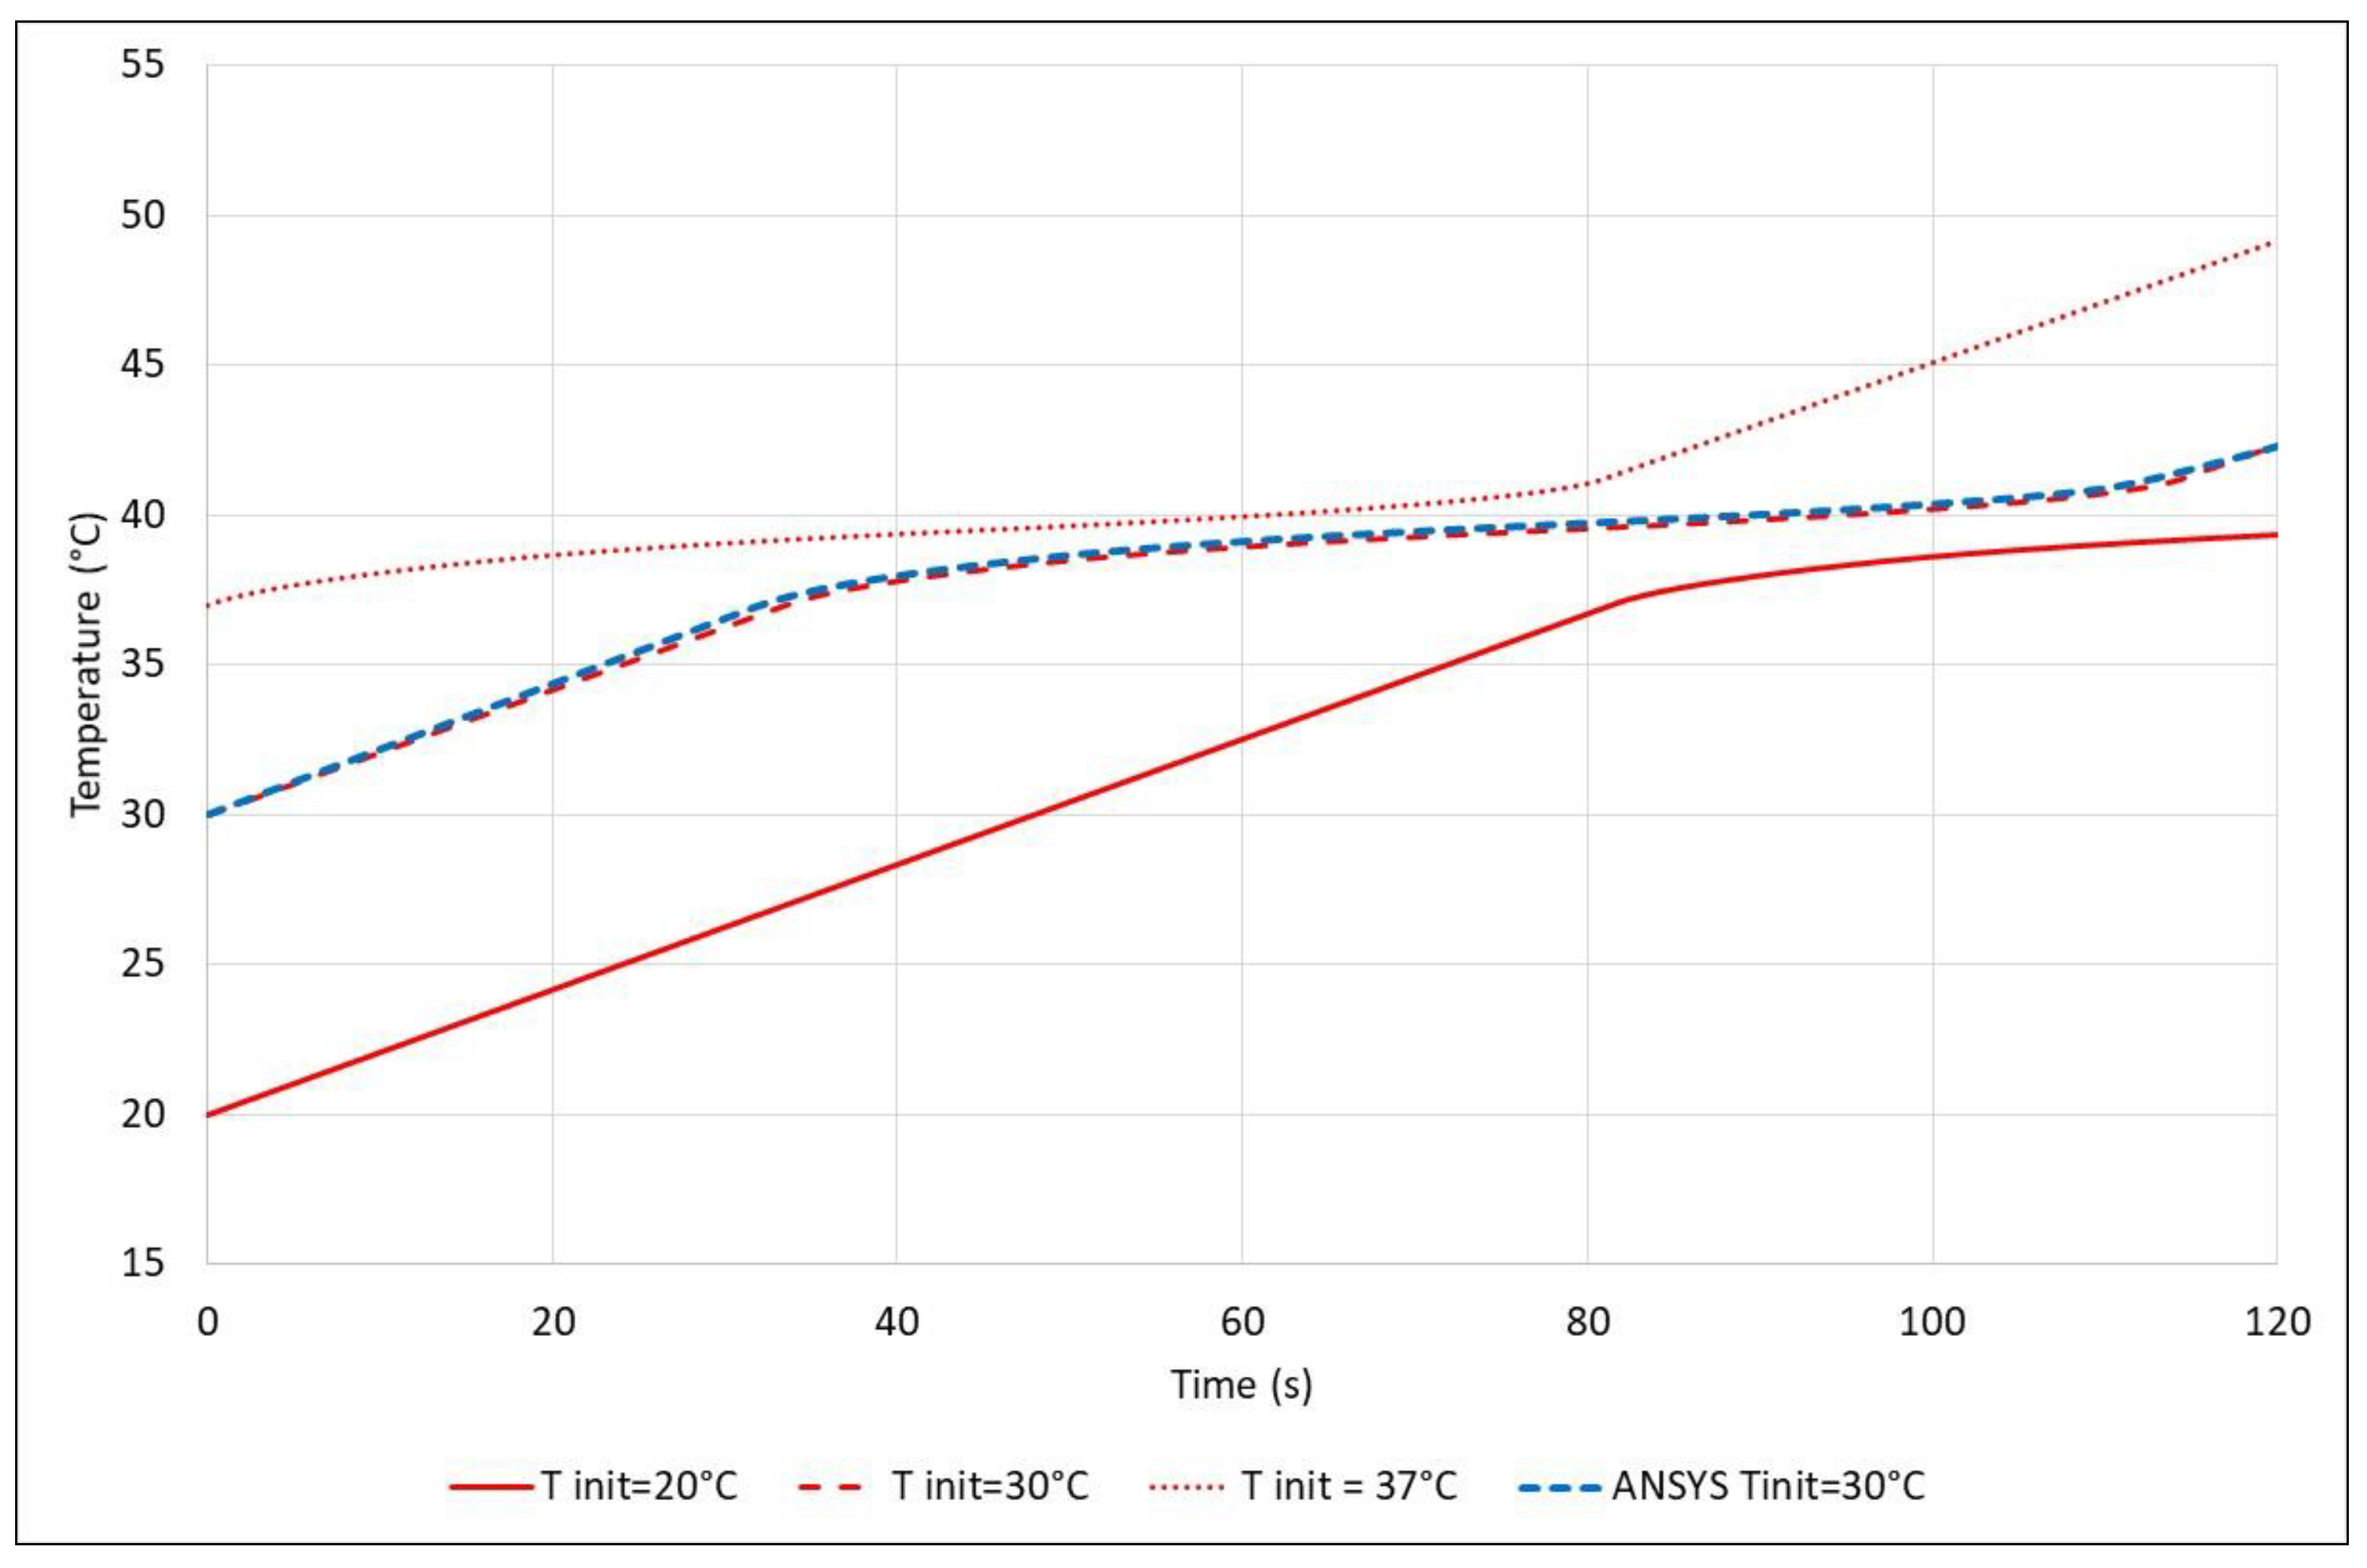
For this kind of experiment, the CFD calculations are in good agreement with the measurements. 
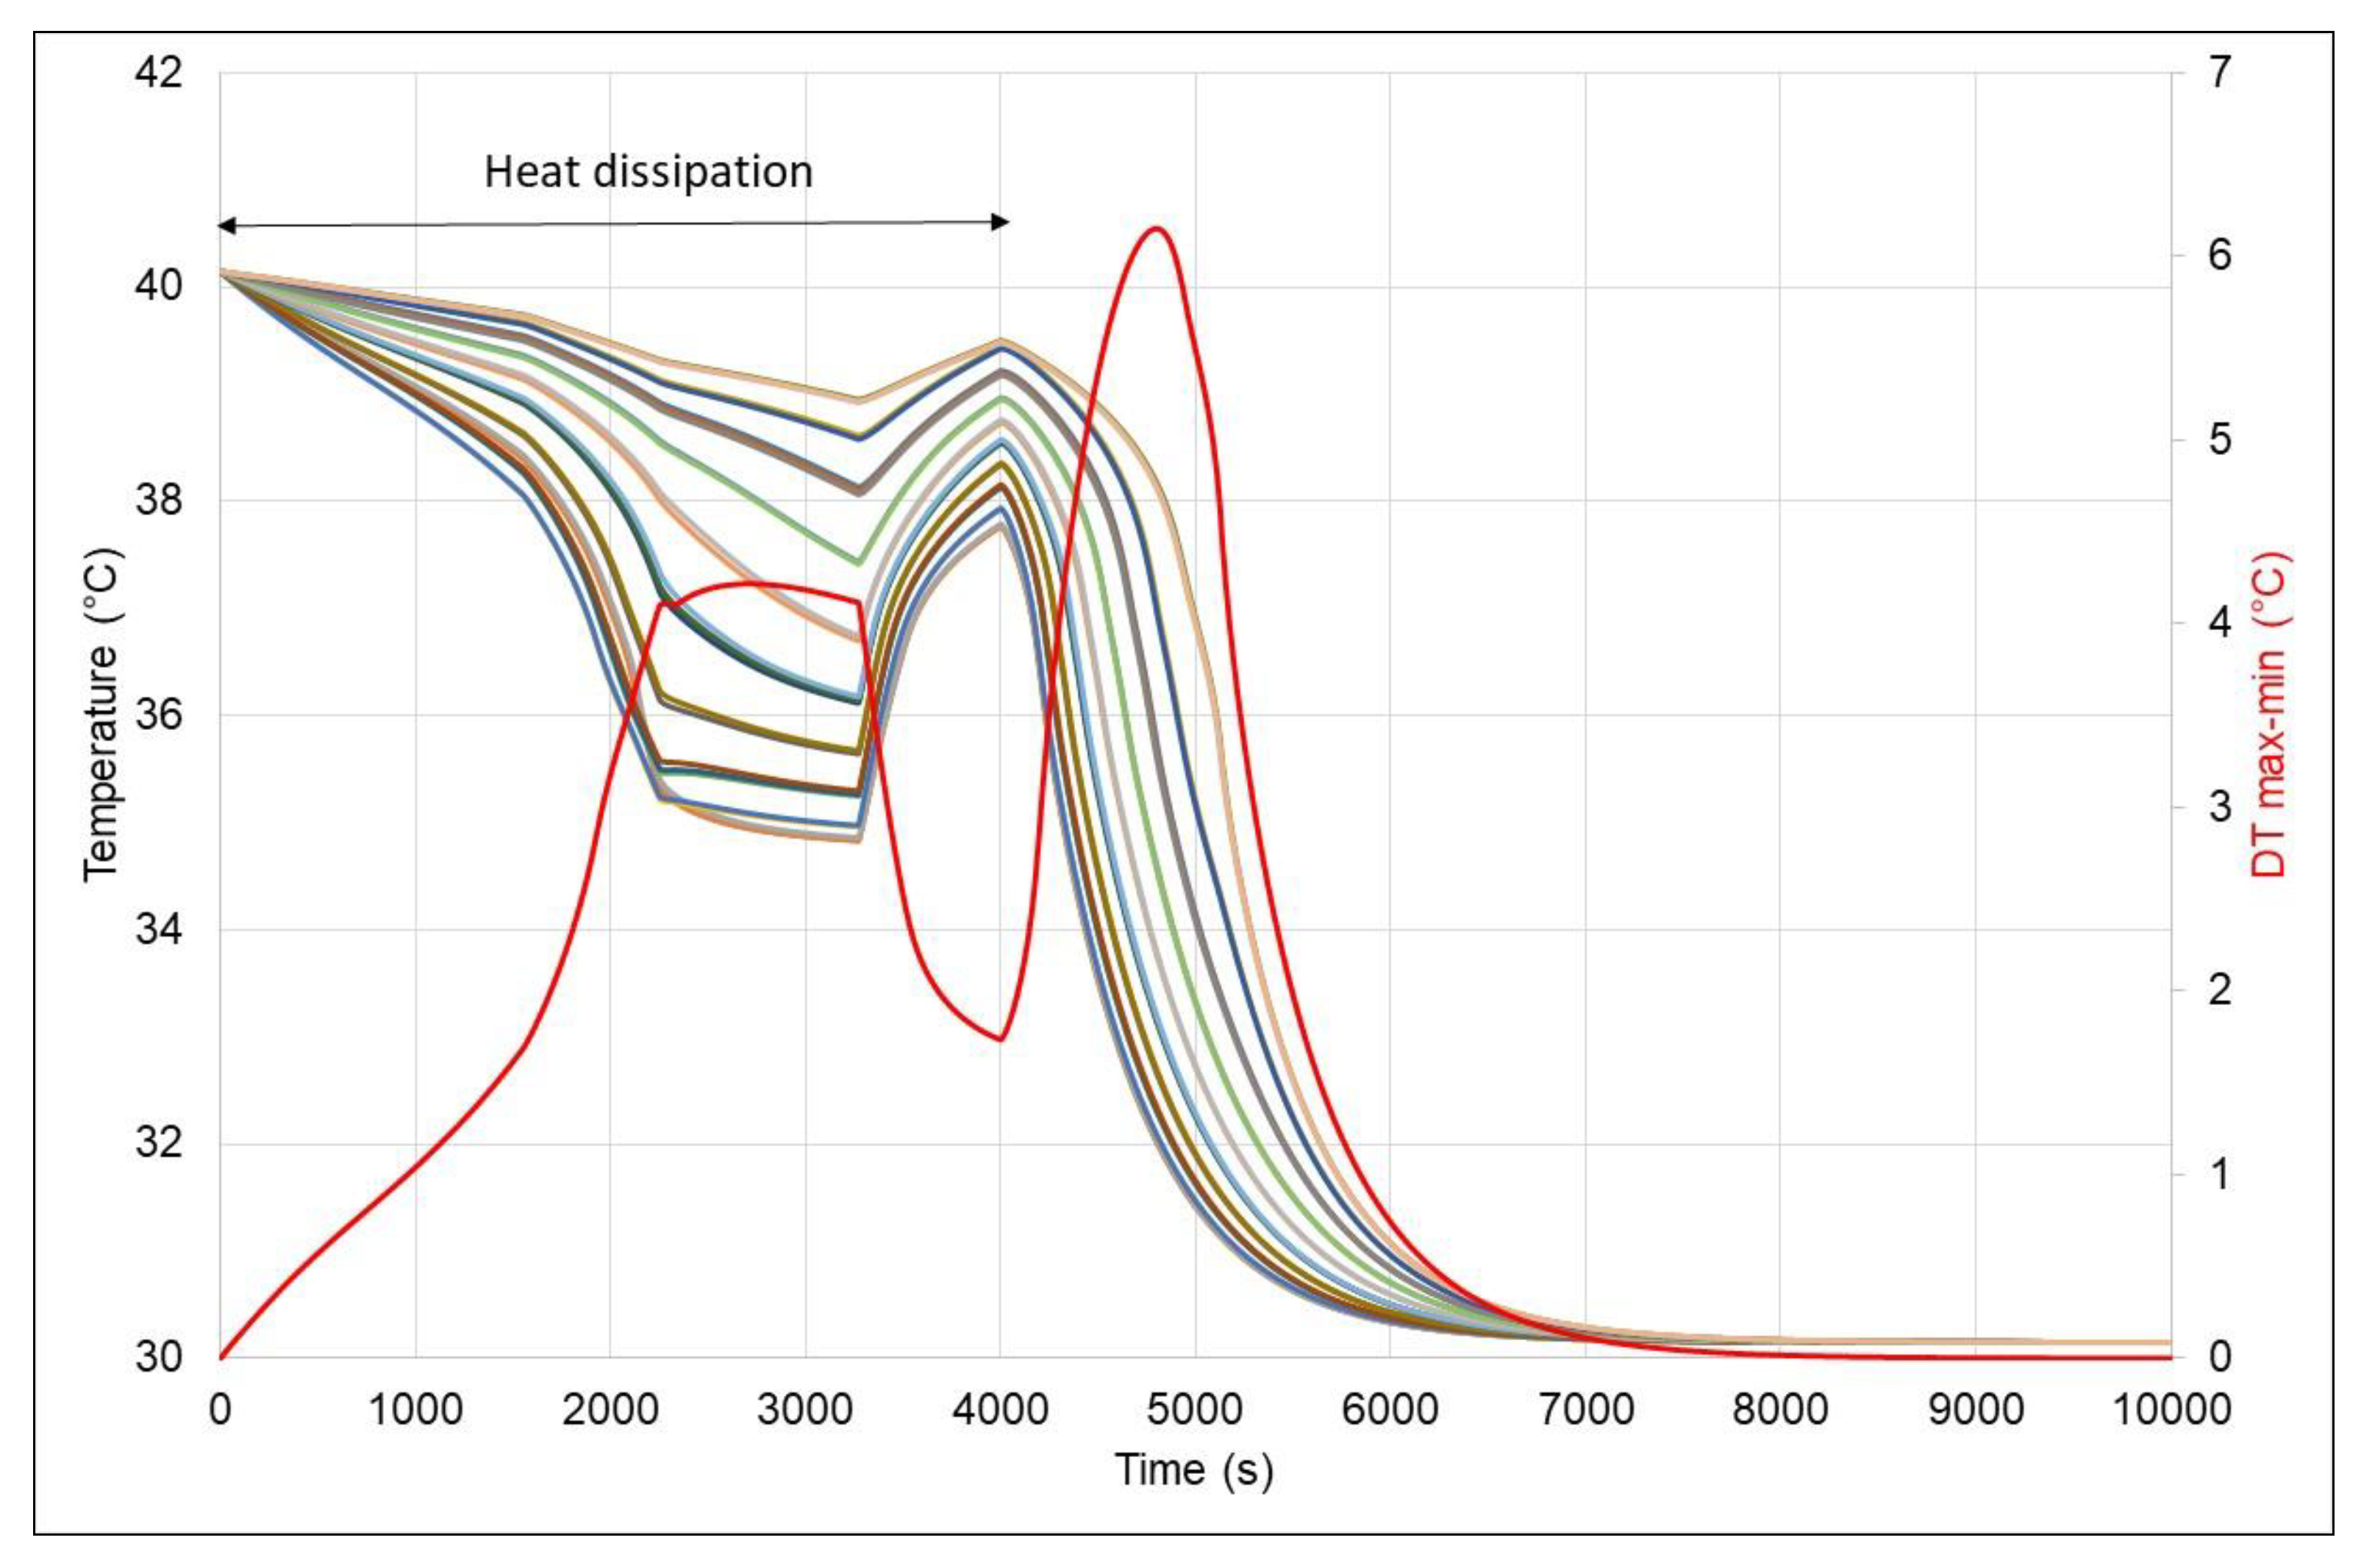
Figure 20 shows the cell temperature when the battery mock-up was cooled by an airflow characterized by a speed of 1 m/s. The same figure also displays the evolution over time of DT max-min, that is, the difference between the minimum and maximum temperature measured in the battery pack, when the airflow speeds were 0.5 m/s, 1 m/s and 2 m/s.
The trend of DT max-min determined by CFD simulations is similar to that observed in the experiments. For instance, with reference to the case where the airflow velocity was equal to 1m/s, the maximum values of DT max-min according to the CFD model and the estimated one based on the thermocouples measurements are both close to 3.5 °C. The CFD model tends to predict a more homogeneous temperature distribution than that found experimentally. The value of DT max-min remains above 1 °C during PCM solidification for about 3500 s in the experiment against 2000 s of the CFD simulation. At the same time, the numerical results shows that about 7000 s are required to cool down the mock-up to about 30 °C. This estimate is very close to that observed in the experiment. The time required for PCM solidification is also comparable in the test and the simulation, though the temperature range at which this phenomenon occurred differs by about 6 °C. Similar conclusions can be drawn also for the other two test cases.

3.3. CFD Model Validation

The comparison of the simulation results with the experimental data previously presented revealed that:
(1)
The melting time experimentally observed was twice as high as that predicted by the CFD model. Given that such a large discrepancy was not observed when the battery pack was cooled down and the PCM solidified, the melting time estimated on the basis of the thermocouple measurements was, arguably, highly influenced by the thermal losses occurring through the mock-up casing as the heating elements were in direct contact with the external walls of the casing. For the same reason, the temperature differences among the cells predicted by the CFD model did not match those experimentally observed during PCM melting.
(2)
In the contrast, when the battery pack mock-up was cooled down and the heating elements were turned off, the CFD model captured reasonably well the trend over time of the temperature difference among the cells and the time required to cool down the mock-up.
(3)
The temperature range over which the solidification of the PCM occurred was about 6 °C lower than that in the numerical simulations. The reason thereof is that the PCM, when cooled from a superheated liquid state, reaches a subcooled metastable state before the melting process starts. This nonequilibrium thermodynamic state has been observed for different PCMs during solidification [11]. The simple thermodynamic model implemented in the CFD model cannot account for that.
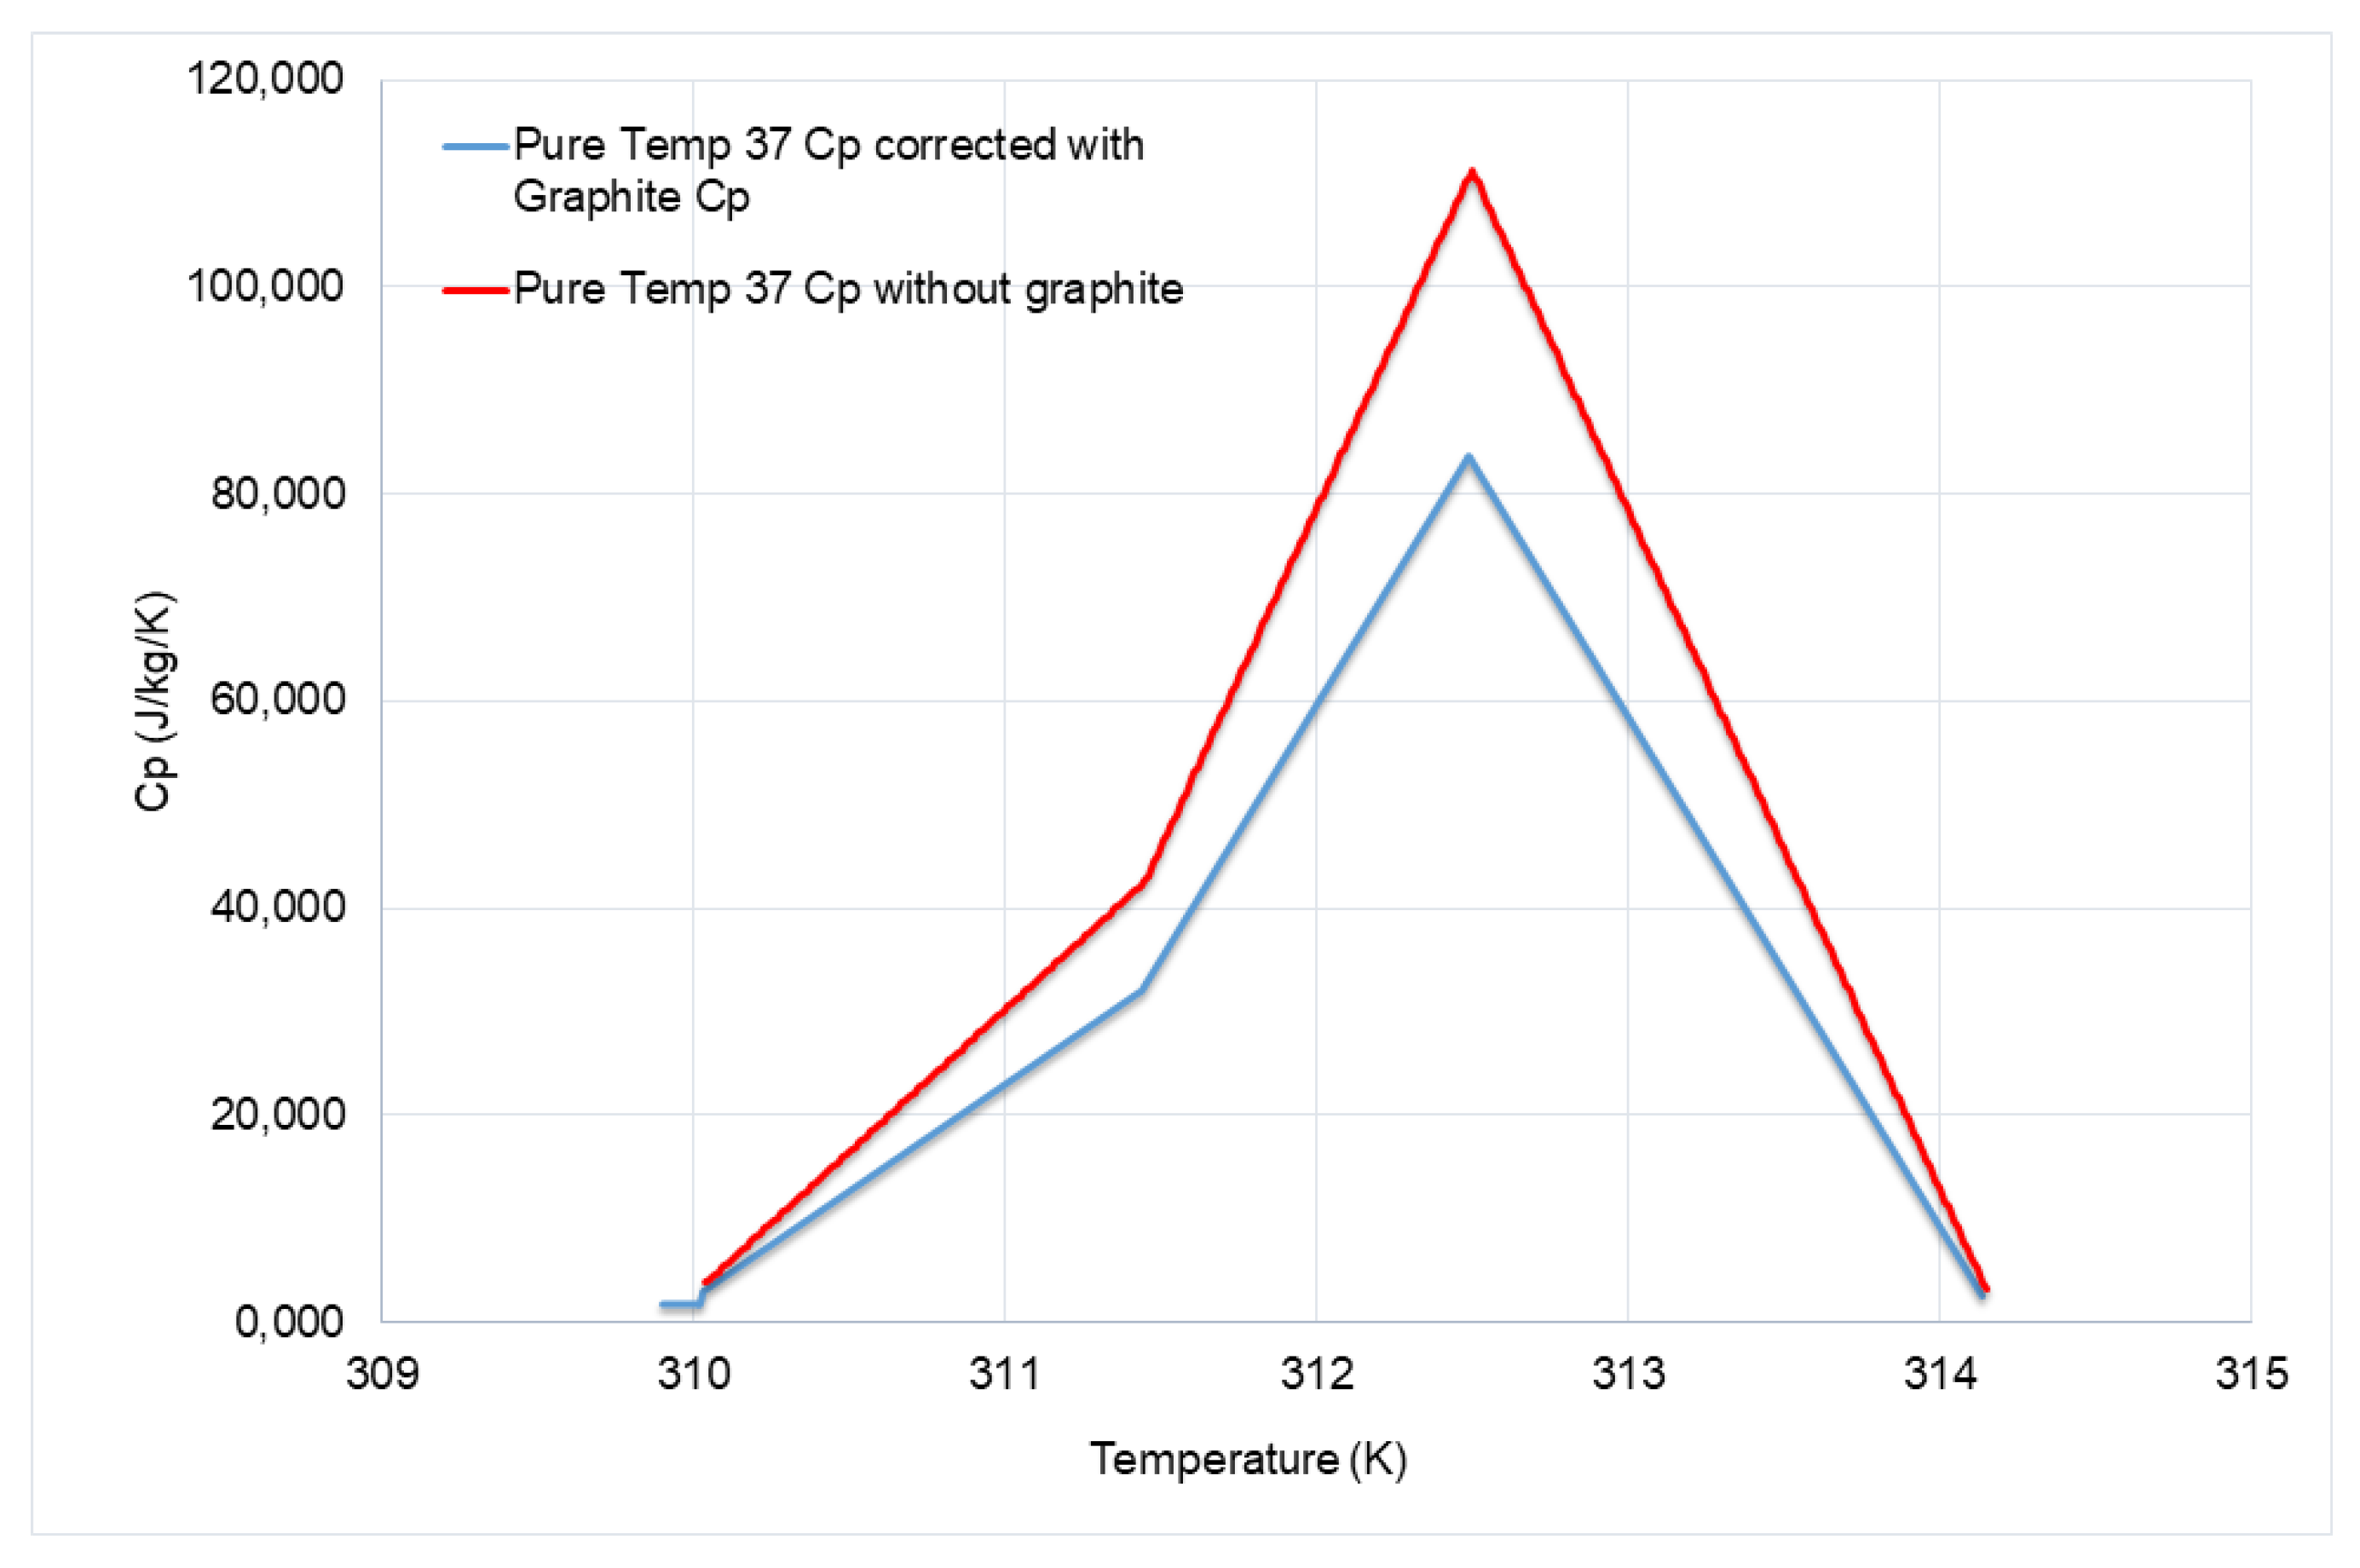
Regarding the last consideration, Figure 21 compares the equivalent specific heat capacity of the composite considered in the model with that estimated based on the experimental data. The latter can be evaluated by dividing the thermal energy provided by the electric heaters over a given time interval, here taken equal to 15 s, by the mass of the composite and the average temperature variation measured during the same period.
Based on the considerations above, it can be argued that the CFD model correctly predicts the heat conduction within the battery pack and the heat transfer between the cooling air and the composite matrix. Thus, it can be considered validated.

4. BTM Assessment for a Reference Driving Cycle of the eVan

The analysis described in this section focused on determining a suitable flow rate and temperature of the cooling air for the thermal management solution of the battery pack, given the reference mission of the eVan.

4.1. Driving Profiles Heat Dissipation

Multiple driving tests of a relative short duration (between 8 and 20 min) were performed to measure the battery pack current versus the vehicle speed for different driving scenarios: urban, rural (hills), highway, and mixed urban−highway. This information was used to estimate the heat dissipation of the battery pack of the e-Van by means of the EC model of the cells previously calibrated. To this purpose the EC model was implemented in Simcenter Amesim, a commercial simulation software for the modeling and analysis of multidomain systems. The simulations showed that the heat dissipation of the cells was highest for the rural and the highway driving cycle: the battery pack average temperature increased by around 5 °C in 6.5 min. For the city and the mixed driving cycles, the temperature increase was, instead, relatively low. Given that the eVan is more often driven on a highway rather than in a rural/hilly setting, the highway driving cycle was chosen as the reference scenario for the assessment of the hybrid BTM solution. As the duration of the driving test was limited to about 10 min, the original highway driving cycle was extended by repeating it as many times as necessary to simulate a full discharge of the battery pack from an initial state of charge (SOC) equal to 100%. Figure 22 shows the thermal power released by a cell during the resulting driving cycle. The average dissipated thermal power is 0.6 Watts/cell or 2.3 kW for the whole battery pack.
As the controller of the experimental setup cannot provide a high frequency modulation of the electric elements of the battery pack mock-up, the thermal load applied in the experimental tests is as reported in Table 5. This modulation of the electric heaters guaranteed that the average temperature of the composite matrix had a trend over time similar to that predicted in the numerical simulations when the thermal load profile in Figure 22 was considered, see Figure 23. It should be noted that the thermal loads applied in the experimental tests were twice as high as those considered in the simulations to compensate for the thermal losses through the mock-up casing.

4.2. Purely Passive Solution

When the thermal power of the heating elements of the mock up was modulated according to the values in Table 5 and no cooling airflow was fed to the mock-up, the temperature of the cells varied as shown in Figure 24. The value of DT max-min remained lower than 2.5 °C, but the final HSS temperature was about 60 °C.
The CFD results for the same test case are shown in Figure 25. It should be noted that the variation of the average temperature of the composite matrix over time was very close to that observed experimentally. The main difference lay in the values of DT max-min which were significantly lower in the CFD simulation. This can be explained by the thermal losses occurring across the external walls of the mock-up which tended to increase the temperature inhomogeneity inside the mock-up and also by the measurement uncertainty of the thermocouples.

4.3. Cooling Air Velocity and Temperature Determination

The experimental tests were run considering an initial pack temperature equal to 40 °C. Figure 26 and Figure 27 present, respectively, the experimental results for Vair equal to 1 m/s and 2.5 m/s. In both cases, the air temperature was 30 °C. The maximum temperature gradient within the battery pack is also plotted (y-axis in the right hand-side of the charts). It is clear from the experimental setup that an air velocity of 1 m/ is not enough to keep the temperature of the battery pack below 40 °C. With an air velocity of 2.5 m/s, instead, this design condition is met. Also the temperature gradient inside the pack stays below 5 °C. This result is confirmed by the numerical simulations, see Figure 28.
Based on the experimental tests and the CFD results, it is possible to conclude that:
  • The cooling air system allows the temperature of the HSS to be maintained below 40 °C during a driving cycle characterized by a large thermal dissipation of the cells, even starting from an initial temperature of the composite of 40 °C. The main difference between the experimental and numerical results lies in the solidification temperature due to the metastable liquid state reached by the PCM before the onset of solidification, as also previously discussed.
  • The temperature gradient in the battery pack is at most equal to 4.5 °C in experimental tests and 6 °C in the CFD calculations. The larger value estimated by the CFD model can again be explained by the higher predicted solidification temperature of the PCM.

5. Conclusions

The study presented in this paper investigated an active/passive solution for the battery pack of an electric van. In the first part of this study and also in Section 4.2, it was shown that, a purely passive BTM solution employing a PCM-expanded graphite composite matrix would require a large amount of PCM in order to keep the temperature of the battery pack at or below 40 °C in all the driving conditions of the electric van. It was, then, decided to couple this passive solution with an air cooling system that can be activated when necessary. Notice that the cooling system may be necessary also in the case the capacity of the HSS were enough to maintain the temperature of the cells in the prescribed range. The PCM is, indeed, to be cooled down to return into solid phase. This can be accomplished, for example, when the vehicle is parked after a drive.
The assessment of such a hybrid BTM configuration has been performed based on a combination of numerical analysis and experiments in ad-hoc setup. A mock-up of the battery pack was built: a PCM-expanded Graphite matrix houses 40 electric heating elements whose current can be modulated to reproduce the thermal dissipation of the battery cells. Simulations and experimental tests were performed and compared for different cases.
The melting time experimentally observed was higher than that predicted by the CFD model, but this discrepancy was not observed during the solidification of the PCM. This discrepancy could be attributed to the thermal losses occurring through the mock-up casing as the heating elements were in direct contact with the external walls of the casing. Moreover, the temperature range over which the PCM melted was 6 °C lower than that of the numerical simulations. This occurred because the simple thermodynamic model cannot predict the metastable state reached by the liquid phase before the onset of solidification.
The mockup was then used to emulate the heat dissipation of the cells during a reference driving cycle of the eVan and the thermal management solution as designed. Results showed that considering a highway driving cycle, even starting from an initial temperature of the composite of 40 °C the battery pack temperature can be maintained below 40 °C by a cooling air flow characterized by a velocity of 2.5 m/s and a temperature of 30 °C. Moreover, the temperature gradient within the battery pack remains below 5 °C, meeting the design requirements for the application at hand.

Author Contributions

F.P. made the sizing of the HSS, participated in designing the mock up, made CFD calculations and participated in running tests, simulations at cell level and provided heat dissipation for different C-rates. J.A.K. used Simcenter Amesim and provided information about heat dissipation of the cell for different driving profiles. F.P. and J.A.K. wrote a draft version and J.A.K. updated it. F.P. and C.M.D.S. reviewed it. Validation: F.P. and S.L. All authors have read and agreed to the published version of the manuscript.

Funding

This work has received funding from the European Union’s Horizon 2020 research and innovation programme under the grant ’Electric Vehicle Enhanced Range, Lifetime And Safety Through INGenious battery management’ (EVERLASTING-713771).

Institutional Review Board Statement

Not Applicable.

Informed Consent Statement

No Applicable.

Data Availability Statement

Not Applicable.

Acknowledgments

The authors would like to thank Lucas Rigal, Franck Chiarucci and Mathieu Monteremand from CEA for the support in the realization of the test setup and the support during testing and to Matthieu Ponchant from Siemens Industry Software S.A.S. for his support in the use of Simcenter Amesim.

Conflicts of Interest

The authors declare no conflict of interest.

References

  1. Guodong, X.; Lei, C.; Guanglong, B. A review on battery thermal management in electric vehicle application. J. Power Sources 2017, 367, 90–105. [Google Scholar]
  2. Chen, D.; Jiang, J.; Kim, G.-H.; Yang, C.; Pesaran, A. Comparison of different cooling methods for lithium ion battery cells. Appl. Therm. Eng. 2016, 94, 846–854. [Google Scholar] [CrossRef] [Green Version]
  3. Yuanwang, D.; Changling, F.; Jiaqiang, E.; Zhu, H.; Jingwei, C.; Ming, W.; Huichun, Y. Effects of different coolants and cooling strategies on the cooling performance of the power lithium ion battery system. Appl. Therm. Eng. 2018, 42, 10–29. [Google Scholar]
  4. Ling, Z.Z.; Wang, F.; Fang, X.; Gao, U.; Zhang, Z. A hybrid thermal management system for lithium ion batteries combining phase change materials with forced-air cooling. Appl. Therm. Eng. 2015, 148, 403–409. [Google Scholar] [CrossRef] [Green Version]
  5. Alipour, M.M.; Ziebert, C.; Conte, F.V.; Kizilel, R. A review on temperature-dependent electrochemical properties, aging, and performance of lithium-ion cells. Batteries 2020, 6, 35. [Google Scholar] [CrossRef]
  6. Rao, Z.H.; Wang, S.F. A review of power battery thermal energy management. Renew. Sustain. Energy Rev. 2011, 15, 4554–4571. [Google Scholar] [CrossRef]
  7. Liu, H.H.; Wei, Z.; He, W.; Zhao, J. Thermal issues about Li-ion batteries and recent progress in battery thermal management systems. Energy Convers. Manag. 2017, 150, 304–330. [Google Scholar] [CrossRef]
  8. Hémery, C.-V.; Pra, F.; Robin, J.-F.; Marty, P. Experimental performances of a battery thermal management system using a phase change material. J. Power Sources 2014, 270, 349–358. [Google Scholar] [CrossRef]
  9. Li, W.Q.; Qu, Z.G.; He, Y.L.; Tao, Y.B. Experimental study of passive thermal management system for high-powered lithium ion batteries using porous metal foam saturated with phase change materials. J. Power Sources 2014, 255, 9–15. [Google Scholar] [CrossRef]
  10. Jiang, G.G.; Huang, J.; Fu, Y.; Cao, M.; Liu, M. Thermal optimization of composite phase change material/expanded graphite for Li-ion battery thermal management. Appl. Therm. Eng. 2016, 108, 1119–1125. [Google Scholar] [CrossRef]
  11. Huang, Q.; Li, X.; Zhang, G.; Zhang, J.; He, F.; Li, Y. Experimental investigation of the thermal performance of heat pipe assisted phase change material for battery thermal management system. Appl. Therm. Eng. 2018, 141, 1092–1100. [Google Scholar] [CrossRef]
  12. Sturm, J.; Ludwig, S.; Zwirner, J.; Ramirez-Garcia, C.; Heinrich, B.; Horsche, M.F.; Jossen, A. Suitability of physicochemical models for embedded systems regarding a nickel-rich, silicon-graphite lithium-ion battery. J. Power Sources 2019, 436, 226834. [Google Scholar] [CrossRef] [Green Version]
  13. Kazuo, O.; Takamasa, O.; Masato, N.; Kenichi, F.; Takuto, A. Thermal behavior of small lithium-ion battery during rapid charge and discharge cycles. J. Power Sources 2006, 158, 535–542. [Google Scholar]
  14. Sabbah, R.; Kizilel, R.; Selman, J.R.; Al-Hallaj, S. Active (air-cooled) vs passive (phase change material) thermal management of high power lithium-ion packs: Limitation of temperature rise and uniformity of temperature distribution. J. Power Sources 2008, 182, 630–638. [Google Scholar] [CrossRef]
  15. PureTemp. Available online: http://www.puretemp.com/stories/puretemp-37-tds (accessed on 18 January 2021).
  16. AllCell Technologies. Available online: www.allcelltech.com/pdf/specsheetv1.pdf (accessed on 18 January 2021).
  17. Zahir, M.H.; Mohamed, S.A.; Saidur, R.; Al-Sulaiman, A.F. Supercooling of phase-change materials and the techniques used to mitigate the phenomenon. Appl. Energy 2019, 240, 793–817. [Google Scholar] [CrossRef]
Figure 1. (a) The eVan20, the project demonstrator, and (b) the LG MJ1 cells of the battery pack.
Batteries 07 00027 g001
Figure 2. (a) Measured and simulated values of thermal power released by a cell at a 0.5-C discharge rate. (b) Deviation between estimated thermal power and adiabatic chamber measurements.
Batteries 07 00027 g002
Figure 3. (a) Different shapes of the PCM EG matrix, and (b) overall pack assembly (with the courtesy of AllCell Technologies).
Batteries 07 00027 g003
Figure 4. Equivalent specific heat capacity of the pure PCM versus that of the composite PCM-EG.
Batteries 07 00027 g004
Figure 5. Calculated average temperature of the battery HSS during a 0.5-C discharge for different initial temperatures of the pack.
Batteries 07 00027 g005
Figure 6. Calculated average temperature of battery HSS during a 1-C discharge for different initial temperatures of the pack.
Batteries 07 00027 g006
Figure 7. (a) Portion of the mesh domain of the CFD model, (b) simplified structure of the battery pack.
Batteries 07 00027 g007
Figure 8. (a) Simulation domain of the CFD model implemented in ANSYS fluent and (b) battery cells temperature (in °C) at the end of a charged/discharge cycle, without active cooling.
Batteries 07 00027 g008
Figure 9. A schematic of the test setup.
Batteries 07 00027 g009
Figure 10. (a) Cooling air channel at the top of the mockup, (b) battery pack mockup and cabling of the instrumentation.
Batteries 07 00027 g010
Figure 11. (a) Aluminum 10 W heating element and (b) the PCM-graphite matrix with the holes for the heating elements.
Batteries 07 00027 g011
Figure 12. Average external temperature of the cells experimentally observed with P = 0.55 W/cell.
Batteries 07 00027 g012
Figure 13. Average external temperature of the cells estimated by CFD calculations with P = 0.55 W/cell.
Batteries 07 00027 g013
Figure 14. Wall temperature of the cells during an experimental run with a thermal dissipation of P = 0.55 W per cell.
Batteries 07 00027 g014
Figure 15. Wall temperature of the cells during an experimental run with a thermal dissipation of P = 2.2 W per cell.
Batteries 07 00027 g015
Figure 16. Wall temperature of the cells during an experimental run with a thermal dissipation of P = 6.6 W per cell.
Batteries 07 00027 g016
Figure 17. Measured surface temperature of the cells when the cooling airflow was characterized by a speed of 0.5 m/s. The heating elements were off over the time period indicated in the chart.
Batteries 07 00027 g017
Figure 18. Measured surface temperature of the cells when the cooling airflow was characterized by a speed of 1 m/s. The heating elements were off over the time period indicated in the chart.
Batteries 07 00027 g018
Figure 19. Measured surface temperature of the cells when the cooling airflow was characterized by a speed of 2 m/s. The heating elements were off over the period indicated in the chart.
Batteries 07 00027 g019
Figure 20. Temperature of the cells calculated by the CFD model when the battery pack is cooled down by an airflow characterized by V air = 1 m/s and there is no thermal dissipation from the cells. Trend of DT max-min from CFD simulations for an airflow with Vair = 0.5, 1 and 2 m/s.
Batteries 07 00027 g020
Figure 21. Comparison between the specific heat capacity of the composite evaluated from the experimental data during PCM solidification and that assumed in the CFD model.
Batteries 07 00027 g021
Figure 22. Thermal power released by a cell of the battery pack for the highway driving cycle.
Batteries 07 00027 g022
Figure 23. Average cell temperature for repeated highway driving profiles.
Batteries 07 00027 g023
Figure 24. Experimental temperature of cell wall for repeated highway driving profiles.
Batteries 07 00027 g024
Figure 25. Surface temperature of the cells predicted by the CFD model for a highway driving profile.
Batteries 07 00027 g025
Figure 26. Experimental results with initial temperature of the mockup equal to 40 °C and an airflow characterized by V = 1 m/s and T = 30 °C.
Batteries 07 00027 g026
Figure 27. Experimental results with initial temperature of the mockup equal to 40 °C and airflow characterized by V = 2.5 m/s and T = 30 °C.
Batteries 07 00027 g027
Figure 28. CFD calculations with initial temperature of the mockup equal to 40 °C and an airflow characterized by V = 2.5 m/s T = 30 °C.
Batteries 07 00027 g028
Table 1. Thermal energy released by a cell and corresponding energy dissipation of the whole battery pack at different discharge C-rates.
C-RateAverage Thermal Dissipation Per Cell (W)Thermal Energy Released by the Whole Battery Pack (kWh)
0.5-C0.161.25
1-C0.532.04
2-C2.24.1
1-C (charge)0.6252.34
Table 2. Properties of the PCM-graphite matrix [16].
SpecificationsUnitDetailsPCC37-1000
Melting point(°C) 37
Melting range(°C) 32–38
Density(kg/m3)@ Room temperature895
Thermal expansion—solid phase(%/°C)Average value t0.100
Thermal expansion during melting(%/°C)-0.841
Thermal expansion—liquid phase(%/°C)Average value 0.075
Thermal conductivity(W/m/K)Horizontal plane
Vertical direction
10–25
6–12
Latent heat(J/g) 160
Specific heat(J/g/°C)Solid
Liquid
1.91
2.25
Electrical resistance(10-3 Ωm)Horizontal plane
Vertical direction
0.41
0.19
Thermal cycle life Number of melting cycles>10,000
Table 3. HSS specifications for different discharge rates.
Discharge RateLatent Heat (J/g)Nominal Melting Temp.
(°C)
Density (Kg/m3)Eth Released by Cells (kWh)Decrease in Energy Density
(%)
Mass of HSS
(Kg)
Eth Storable in 15 kg of Composite (%)
0.5-C160378951.25928.153
1-C 2.041445.933
2-C 4.13392.316
Table 4. Expected and experimental melting times for different thermal powers.
P/Cell (W)Expected Melting Time (s)Experimental Melting Time Based on Tc (2) (s)Experimental Melting Time
Based on Tc (3) (s)
0.55 (~1C)200041604070
2.2 (~2C)500780700
4.4250200454
6.6160125195
Table 5. Thermal load of the electric heaters during experiments for the highway driving cycle test.
Duration of Heat Dissipation (s)P (W/Cell)
0 → 14001.13
1400 → 24400.72
2440 → 32501.08
3250 →40002.12
Publisher’s Note: MDPI stays neutral with regard to jurisdictional claims in published maps and institutional affiliations.

