Abstract
Internal short-circuit tests were carried out in a battery safety investigation chamber to determine the behavior of batteries during the nail penetration test. So far, systematic investigations regarding the test setup and its influence are rarely found in the literature. Especially, to improve the comparability of the multitude of available results, it is essential to understand the effects of the geometric, operating and ambient parameters. In this study commercial lithium ion batteries with a capacity of 5.3 and 3.3 Ah were used to study the influence of the varied parameters on the voltage drop, the development of surface temperatures and of infrared active gas species. We studied both the influence of the geometry of the penetrating nail and concentration of water in the inert atmosphere especially on the quantities of the reaction products under variation of cell capacity. It could be shown that the geometry of the nail, within certain limits, has no influence on the processes of the thermal runaway of high energy density lithium ion batteries (LIBs). However, a change in capacity from 5.3 to 3.3 Ah shows that in particular the gaseous reaction products differ: The standardized gas concentrations show a higher measurable concentration of all gases except CO for the 3.3 Ah LIBs. This circumstance can be explained by the intensity of the reactions due to the different battery capacities: In the 5.3 Ah cells a larger amount of unreacted material is immediately discharged from the reaction center, and by the different available amounts of oxidizing reaction partners. An increase of the water content in the surrounding atmosphere during the thermal runaway leads to a reduction of the measurable gas concentrations of up to 36.01%. In general, all measured concentrations decrease. With increased water content more reaction products from the atmosphere can be directly bound or settle as condensate on surfaces.
1. Introduction
In recent years, the lithium ion battery (LIB) has become increasingly important in both stationary and mobile applications. Especially in mobile applications, the increase of the volumetric and gravimetric energy density is a challenge [1,2,3,4]. More energy stored in the same installation space means a higher risk of serious incidents in the case of misuse or accident. In order to avoid this, it is important that newly developed batteries are safe both in the normal use phase and in critical situations. Safety tests for lithium-ion batteries have been established for the purpose of developing and evaluating batteries in critical situations, especially during the thermal runaway. Most of the time, today’s test methods include nail penetration, bruising, mechanical shock, overloading and are described in the literature and standards (UN T 38.3, UN ECE R 100, ISO 12405 1-3, SAE J2464, SAE J 2929 and QC/T 743) [5,6]. Unfortunately, many of these test methods and standards have a number of differences in execution that do not take into account the influence of individual external parameters on the test and make it difficult to compare test results [5]. With the help of the analysis of the gas products resulting from the thermal runaway (TR), the type of atmosphere and its humidity is decisive for the outcome of the measurement [7]. Nevertheless, the geometry, both the diameter and the nature of the tip should also be important for the test results.
Among the different test scenarios of LIBs, the internal short circuit is one of the most critical cases [8]. When using LIBs, the internal short circuit can be triggered by mechanical impact (crash) or production failures. However, nail penetration is mostly used for research purposes to trigger the internal short circuit between the electrodes [6,8]. The nail penetration triggers a defined short circuit between the internal electrodes and, according to the law of current heat, heat is generated during the current flow depending on the electrical resistance [8]. Depending on the heat generated during the accelerated discharge process, the cell can remain in a safe condition or goes into TR. Exothermal chemical reactions within a thermal runaway of a LIB start with the decomposition of the solid electrolyte interface (SEI) at 90–120 °C [9]. Subsequently, intercalated lithium reacts with the electrolyte at >120 °C. Followed by the decomposition of the organic electrolyte (>200 °C), the reaction of intercalated lithium with binders ( °C) starts [10,11,12]. The cathode active material begins to decompose at >250 °C. These reactions lead to the formation and release of various hazardous gaseous reaction products, e.g., CO, HF and organic carbonates [13,14]. In addition, a critical amount of energy can be generated, which can lead to thermal propagation of the TR within modules or even packs [15].
However, the results of the thermal runaway within nail penetration tests are influenced by many external factors. One example is the geometric nature of the nail. In theory, as the diameter of the nail increases, the same amount of current can be transported with less resistance. In general, this means that with a larger diameter of the nail, a higher current can be transported simultaneously. So far, it is not known how the nail diameter affects the test results and their comparability. Moreover, the test specifications usually do not specify, which ambient conditions should be set with regard to the prevailing humidity. Water reacts in many different chemical or non chemical reactions with components of the LIB or the thermal runaway. Therefore, it can be assumed that in combination with gas analysis the measured reaction products will be different.
The aim of this paper is to determine and compare the influence of the nail geometry, both the diameter and the condition of the tip. Furthermore, the influence of an increased concentration of water in an inert nitrogen atmosphere was determined. It is known that a variation of the availability of oxygen in the atmosphere shifts the gas products towards the oxidized substances (CO and CO2). With the information gained, test procedures can be designed and developed in such a way that the results are more comparable and the deviation between different battery safety tests can be minimized. To describe the test results obtained, the cell voltage during nail penetration, the temporal course of temperatures on the cell surface and the temporal course of the gas concentrations present are determined and presented.
2. Materials and Methods
Variations of nail diameter and angle of the nail tip, and increasing water content in the atmosphere have been realized in the battery cell safety investigation chamber to investigate their effect on the nail penetration of two different high energy density lithium ion pouch cells. All results of this work were generated by a minimum of three tests performed under identical test parameters. Mean values and standard deviation of all recorded test parameters were calculated.
2.1. Battery Cell Safety Investigation Chamber and Test Set Up
The battery cell safety investigation chamber is a specially constructed steel chamber for the execution of mechanical abuse test of lithium ion batteries. With its integrated sensor and gas measuring technology, it is able to monitor the process of thermal runaway. While the processes take place, it is possible to record voltage, internal temperature, surface temperature, nail tip temperature and internal pressure data and to perform online infrared active gas concentration measurements. The detailed design and methodology of the chamber has already been published by Diekmann et al. [7].
A nitrogen atmosphere was used to obtain better gas measurement results and to eliminate the influence of the surrounding atmosphere, especially oxygen, on the reaction results. The nail velocity was set to 1 mm/s and cell tension was defined to 0.166 MPa. As thermal insulation material, an inorganic glass fiber tape with a layer thickness of 5 mm was used. The material was applied above and below the cell while it was provided with a hole for penetration. Additionally, the voltage based nail control presented by Diekmann et al. [7] was used to stop the nail movement if a significant voltage drop (short circuit of the electrodes) occurred. The target point of penetration is the middle of the cell. The voltage was measured via crocodile clamps at the end of the battery terminals. The cell surface temperature was recorded via two thermocouples type K (maximum 1200 °C). The thermocouples were fixed with adhesive tape to the surface of the cell with a distance of 10 mm to the penetration point. To describe the cell surface temperature the mean value and standard deviation of both temperatures were calculated.
2.2. Nail Geometries
Four different geometries of nails out of mild conductive steel were used to perform these experiments (Figure 1). To determine the influence of the shape of the nail tip and the diameter of the steel nail on the reactions of the thermal runaway, the diameter of the nail was varied from 2 to 5 mm. The angle of the nail tip was varied between 20 and 40° (Figure 1). The aim of this was to keep the tip length of every nail similar to guarantee different short circuit areas.
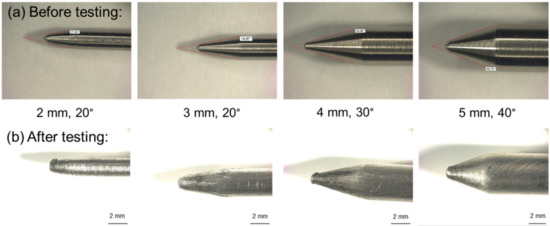
Figure 1.
Representation of the nail geometries used for the nail penetration of lithium-ion batteries. (a) Nails with diameters of 2–5 mm and opening angles of 20–40° before the tests. (b) Nails after the tests.
2.3. Modified Setup for the Increase of Humidity
For investigating the effect of humidity in the test chamber, a modification of the test setup was needed. Therefore, the battery cell safety investigation chamber was extended with a gas bubbler unit containing 500 mL of liquid water at 20 °C. During the tests, the nitrogen gas bubbles with 6 L min−1 through the water before entering the chamber. With this extension, the humidity could be increased from 5 (N2, 5.0 quality) to 13,000 ppm based on a Fourier-transform infrared spectroscopy (FTIR) reference measurement.
2.4. Gas Measurement Via Fourier-Transform Infrared Spectroscopy (FTIR)
The gas measurement was fulfilled with a FTIR (Gasmet Technologies GmbH, CX4000, Karlsruhe, Germany) that was extended with a gas sampling and dilution system. The system contains a particle filter in the sampling probe (pore size: 3 µm) and is capable of measuring a continuous sample gas flow (volume flow: 6 L min−1) directly from the investigation chamber. For the gas transport from the probe sampling to the outlet of the measuring chamber at 180 °C, a temperature controlled transport system was used [7].
In order to describe the test results, the gas components water (H2O), carbon dioxide (CO2), carbon monoxide (CO), hydrogen fluoride (HF), methane (CH4), ethane (C2H6), ethylene (C2H4), ethyl methyl carbonate (EMC) and ethylene carbonate (EC) were detected and quantitatively determined by simultaneous comparison with reference spectra of the related compound. For this purpose, the FTIR measuring chamber had an optical path length of 500 cm by multiple reflections and a spectral resolution of 7.7 cm−1 in the mercury-cadmium-telluride (MCT)-detector (Manufacturer information).
2.5. X-Ray Imaging
X-ray images of the cells before and after nail penetration test were taken for the nail variation tests. The cells were irradiated from the penetration side with an X-ray inspection system (Viscom AG, X8011-II PCB flex, Hannover, Germany).
2.6. Investigated Cells
For the execution of the experiments, commercial pouch cells (SLPB776495 5.3 Ah, SLPB526495 3.3 Ah, Kokam Ltd., Siheung, South Korea) were used. After transport, these cells showed voltages of 3.7 V on average. The cells were charged with 0.1 C (CCCV, cut off voltage 4.2 V) before the test was carried out. Other important characteristic parameters of the cells are listed in Table 1.

Table 1.
Technical data of the investigated battery cells (SLPB776495 5.3 Ah, SLPB526495 3.3 Ah). EMC: ethyl methyl carbonate, DMC: dimethyl carbonate, EC: ethylene carbonate, LNCO: lithium nickel cobalt oxide, LCO: lithium nickel cobalt oxide.
3. Results and Discussion
3.1. Variation of the Nail Geometry
The ohmic resistance of an electrical conductor decreases with increasing diameter or cross-sectional area, if both the material and the length remain constant:
: ohmic resistance (Ω);
: specific resistance of a material (Ωm);
: length of the nail (m);
: area of the nail (m2).
The specific resistance of a material can be determined by resistance measurement of a known geometry.
The geometry of the penetrating object and, thus, the nail should have an influence on the measured results of the thermal runaway of LIBs. For example, the speed and the triggering of the voltage drop should depend directly on the penetrating object. In previously standardized and applied tests, the diameter of the nail made of mild conductive steel is usually defined at 3 mm [5,6]. Since all other parameters are kept constant during the test, all changes in voltage courses, temperature development and gas concentrations can be related directly to the selected nail geometry as confirmed by our results in Figure 1 and Figure 2 that show the resulting courses of the cell voltage Ucell of both, 3.3 and 5.3 Ah, battery cells after nail penetration with a velocity of 1 mm/s in dependency of the nail diameter. In general, the voltage drop of a battery cell after nail penetration can be divided into three phases in order to describe the processes during the thermal runaway: The first phase represents the initial voltage drop after the nail has penetrated the cell, causing the internal short circuit of the electrode layers. The movement of the nail stops at this point due to the used nail control variant [7]. In the second phase, the voltage starts to increase for a short period of time. It is suspected that at this point the reaction gases produced will be released from the cell through the penetration hole and damaged pouch cell seals. Due to the gas release, the short circuit is suppressed briefly and the voltage values increase for a short period of time. This is attributed to the still existing undamaged compartments maintaining a compensating current due to the parallel connection of the electrodes to maintain the cell voltage. The reincrease of the voltage values reached its maximum after 2 s (3.3 Ah) and 2.5 s (5.3 Ah), respectively. In the following third phase, the equalizing current maintaining the cell voltage and the melting of the separator caused a rapid discharge due to the resulting areal contacts of the electrodes and, thus, a decrease of the whole cell voltage to 0 V. In both test cases using 3.3 and 5.3 Ah cells, it can be observed that the voltage drop from 4.2 to 0 V with respect to the standard deviation took 3.29 ± 0.37 s and 4.88 ± 0.76 s, respectively, without observable dependencies of the penetrating nail geometry. As the cells had a very high area capacity of 5.392 (3.3 Ah) and 5.196 (5.3 Ah) mAh cm−2 per coated electrode side, the energy required to trigger the thermal runaway was achieved immediately upon piercing the first electrode layer independent of the nail geometry (Figure S1). In the described third phase the standard deviation increased noticeably. The separator melt completed over time over the entire cell or electrode area. It is assumed that the separator melt temporally did not take place exactly at the same time in all tested cells, which means the surface contact of the electrodes varied slightly from cell to cell and led in this phase to the increasing standard deviation.
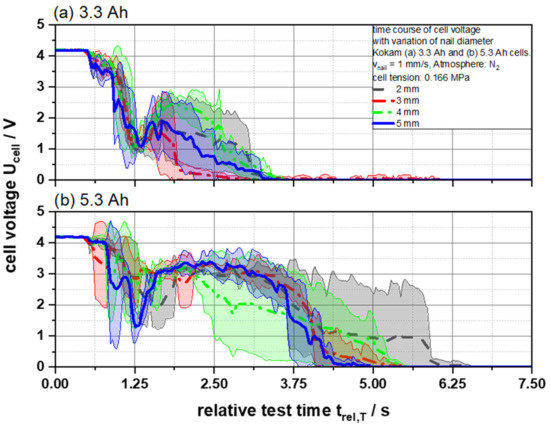
Figure 2.
Average cell voltage UCell as a function of the relative test time trel,T of (a) 3.3 and (b) 5.3 Ah cells for different nail geometries from 2 to 5 mm.
In summary, no direct indication of a change in the voltage drop could be found that could be attributed to changed nail geometry.
In Figure 3 the resulting temperature courses of the cells are demonstrated. The initial temperature rise was caused by Joule’s heat. This is released during the short circuit since, according to the first Joule’s law, heat is generated when a current flows through a conductor. Assuming that a large part of the short circuit current flows directly through the nail, the measured surface temperatures around the penetration point should show different behavior due to the increasing electrical resistance with decreasing nail diameter. However, both the 3.3 Ah and the 5.3 Ah cells show no significant differences in the course of the test when penetrated with the different nail diameters. Neither the heating phase nor the cooling phase differs considering the standard deviation. Maximum temperatures of 521 °C (3.3 Ah) and 533 °C (5.3 Ah) were reached on the surface within 8.05 ± 0.46 s (3.3 Ah) and 11.49 ± 0.92 s (5.3 Ah) on average for the different nail geometries. The authors suspect that a fast global separator melt down due to a low melting point and the high area capacity of the cells is responsible for this effect. In the following, the separator melt down causes a short-circuit area, which is no longer dependent on the nail used. Therefore, no dependence of the temperature development and the maximum temperatures on the nail diameters used can be concluded with these cells.
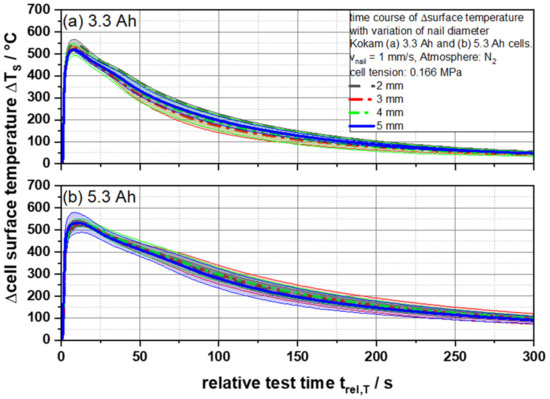
Figure 3.
Average cell surface temperatures ΔTS as a function of the relative test time trel,T of (a) 3.3 and (b) 5.3 Ah cells for different nail geometries from 2 to 5 mm.
In general, the similar conclusions can be observed with the main gaseous reaction components water (H2O), carbon dioxide (CO2), carbon monoxide (CO), hydrogen fluoride (HF), methane (CH4), ethane (C2H6), ethylene (C2H4), ethyl methyl carbonate (EMC) and ethylene carbonate (EC) from any cell (Figures S2–S15). The used nail geometries did not seem to have an influence on formation of these gas species during the tests. Furthermore, additionally recorded X-ray images (Figure 4) support the findings. In the images, bright areas represent lower material densities and dark areas represent those with higher density. Thus, brighter areas show the path of the gaseous reaction products and transport routes of ejected solids. By comparison of all images it can be concluded that the seals at the long sides and at the tips were the weak points. Nevertheless, the total mass loss of the cells after the test, 37.52 ± 0.62 g for 3.3 Ah cells and 38.18 ± 0.26 g for 5.3 Ah cells, show no dependence of the nail geometries, and, thus, underline the lack of differences in the images. The ratio of brighter to darker areas was constant for all nail geometries.
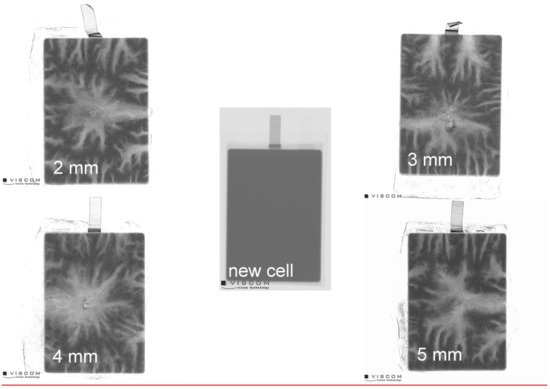
Figure 4.
X-Ray images of 5.3 Ah cells before and after the nail penetration test with different nail geometries from 2 to 5 mm.
All in all, from the recorded voltage and temperature values it can be concluded that the temperature development in the cells after nail penetration was very extensive due to Joules heat. In a first step, the generated heat melted the separator directly at the penetration side and caused a local short circuit including an intensive voltage drop. After a short time due to further melting of the separator, the short circuit extended to the whole cell and a global short circuit with complete separator meltdown arose. Thus, the short circuit area was independent of the nail and its appearance. Furthermore, no differences of the gaseous reaction compounds could be detected during the tests. In summary, no correlation between the thermal runaway and the nail geometries used was found in relation to the tests carried out with these pouch cell type high energy density lithium ion battery cells. This information could be very helpful when testing batteries to investigate their safety characteristics. For example, the use of a nail of a slightly different shape, for instance due to the manufacturing process or the degradation of the nail in a previous test, did not show any changes in test results. It could be concluded that this parameter had no influence on the test results generated, thus allowing different test results to be compared with each other without having to consider the nail geometry within certain limits in relation to each other.
3.2. Influence of the Cell Capacity on Gaseous Reaction Compound Concentrations
The determination of the proportion of hazardous gaseous reaction products arising from the thermal runaway is a core parameter for evaluating the safety of Li-ion battery cells. Hazardous gases are formed due to the reactions of the different cell components [2]. Depending on external and internal factors, the gaseous reaction products can have a specific chemical composition. In this study two different pouch cell capacities of 3.3 and 5.3 Ah with the same battery chemistry were tested under equal testing conditions.
As described in the previous section, the measured gas concentrations (e.g., CO, CO2, and HF) of the tested cells did not differ significantly from each other within the same cell capacity (3.3 Ah and 5.3 Ah) although they were tested with different nail geometries (Figures S2–S15). However, especially the methane (CH4) concentration for the 5.3 Ah cell shows a very characteristic and individual but reproducible course, which suggests a dependence of the methane concentration on the tested cell capacity (Figure 5) [16]. Cells with a capacity of 3.3 Ah show a rather expected and typical course of the time-resolved concentration. After penetration of the cell, the methane concentrations increased strongly and reached a maximum peak value of 3897 ± 217 mg m−3 after 25.23 ± 2.86 s. This was followed by a steady concentration decrease, until the gas concentration was completely flushed out and the detection limit was reached. In contrast, cells with a capacity of 5.3 Ah show a deviating course for especially the methane concentration: At first, a strong increase of the methane concentration is observed until a maximum peak value of 3835 ± 222 mg m−3 was reached after 24.03 ± 7.1 s, which was very similar to the smaller cell. This is followed by a strong and temporary decline passing through a brief concentration minimum, after which a quick reincrease to 3568.5 ± 201 mg m−3 after 66.34 ± 0.26 s was recorded. This second peak was followed by the expected continuous decrease of the measured values until the measurable methane concentration was rinsed out. However, the constant decrease occurred slower than for the lower battery capacity. This effect could be observed via a statistically relevant number of battery cells independent of the nail geometry used. Therefore, it could be assumed that this effect was dependent on the cell or the cell capacity, since all other experimental parameters were kept constant.
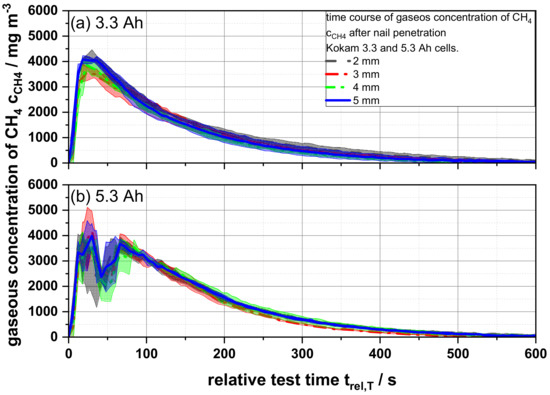
Figure 5.
Average gaseous concentrations of methane cCH4 as a function of the relative test time trel,T of (a) 3.3 and (b) 5.3 Ah cells for different nail geometries from 2 to 5 mm.
In Figure 6, the normalized peak concentration of the first peak in mg Ah−1 m−3 of the main reaction components related to the electrolyte degradation are shown and calculated as follows:
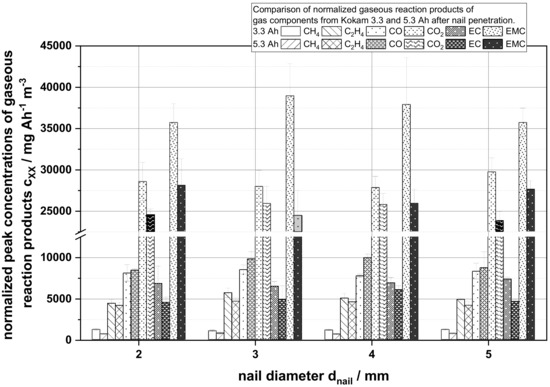
Figure 6.
Comparison of the normalized measured peak gas concentrations cxx in mg Ah−1 m−3 in dependency of the nail diameter of the gases CH4, C2H4, CO, CO2, EC and EMC as a part of the main reactions components from the thermal runaway.
In contrast to Figure 5 as shown in Figure 6, the maximum peak concentration after normalization allowed us to distinguish differences for the individual reaction gases. For both cell capacities, it can be observed that the maximum peak concentrations of all gas components for each capacity did not change on average. However, comparing the obtained values for the different cell capacities, a difference in the specific normalized composition between the gases could be detected. While the 3.3 Ah cells show a higher normalized concentration of CH4, C2H4, and CO2, the 5.3 Ah cells show a slightly higher normalized CO concentration.
An explanation for the CH4 concentration course of the process shown in Figure 5 is the availability of oxygen and reactants in the cells. In contrast to the 5.3 Ah cell, the 3.3 Ah cell contains a percentage by weight electrolyte of 15.67% (3.3 Ah) compared to 11.25% (5.3 Ah). The electrolyte components of the cell are the main sources for oxidizing reactions in the surrounding nitrogen atmosphere, which are needed to produce CO and CO2 as reaction products from methane oxidation. It is assumed that in the first phase of the reaction the amount of chemically available oxidizing reactants was higher in the 5.3 Ah cells due to the stronger reaction, the fast evaporation of liquid electrolyte components and the decomposition of cathode active material. Combined, this ensures that the oxidation reaction of CH4 for instance was stronger for a short period of time and, consequently, the methane concentration decreased temporarily, as seen in the time window of 25–50 s relative test time. In the further course of time, the measured methane concentration increased again due to the decreased availability of oxidizing reaction partners and was rinsed out as an accumulated reaction product over time. Since the electrolyte quantity was always adapted to the specific properties of a cell, the electrolyte quantity for the 5.3 Ah, as already described, was lower than for the 3.3 Ah cells used. Assuming that the amount of electrolyte used was related to the battery capacity, it could be concluded from the normalized peak concentrations in Figure 6 that the measured normalized peak concentrations of the 5.3 Ah cells were lower. This could be explained on the one hand by the lower availability of chemical reaction partners (lower amount of electrolyte) and on the other hand due to the intensity of the thermal reaction. As battery capacity increased, the strength of the reaction increased as more stored energy was available and, therefore, more material could be suddenly ejected from the out of the cell that might not be available for the chemical reactions taking place. This results in less detectable reaction products per Ah of battery capacity in the 5.3 Ah cells. Only the CO peak concentration deviates from this observation. Here, the 5.3 Ah cell shows a higher amount. This is attributed to the lower availability of oxidizing reaction partners due to the above-mentioned lower relative quantity of electrolyte used. Thus, the reaction products in the 3.3 Ah cell could more easily be completely oxidized to CO2. In summary, it could be shown that the composition of the reaction products and the formation of reaction gases over time depend on the battery capacity, amount of electrolyte and the behavior of the battery cells, e.g., the opening of sealings and the ejection of the reaction material.
3.3. Influence of an Increase of Humidity in the Measuring Chamber
A lithium-ion battery can be affected by various environmental parameters during cycling in the field. Water plays a key role as the environmental parameter; it reacts strongly both with one of the most important components of the battery, lithium and with the reaction product hydrofluoric acid (HF). In this study, 5.3 Ah lithium ion batteries were tested under variation of the water content, i.e., under humidity of 5 and 13,000 ppm H2O, in the surrounding inert atmosphere during thermal runaway initiated by nail penetration.
In order, to analyze the process, the drop in voltage, the temperatures generated on the cell surface and the infrared-active gases were recorded. However, it could be observed that neither the time course of the drop in cell voltage nor the surface temperatures were influenced by the changed atmospheric condition (Figures S16 and S17). To evaluate the influence of the water content on the reactions and on the products of the thermal runaway of lithium ion batteries, the compositions of the gaseous reaction products have to be analyzed. Figure 7 shows the CO concentration over time after the thermal runaway of three battery cells each for the humidity of 5 and 13,000 ppm H2O. The temporal course of both curves resembles the expected behavior with a rapid rise to a concentration maximum and an exponential decrease in CO concentration while the gas was flushed out of the test facility. However, the different maximum CO concentrations were remarkable. While the maximum concentration at 5 ppm H2O was 42,129.74 mg m−3, it reached only 28,257.94 mg m−3 at 13,000 ppm H2O.
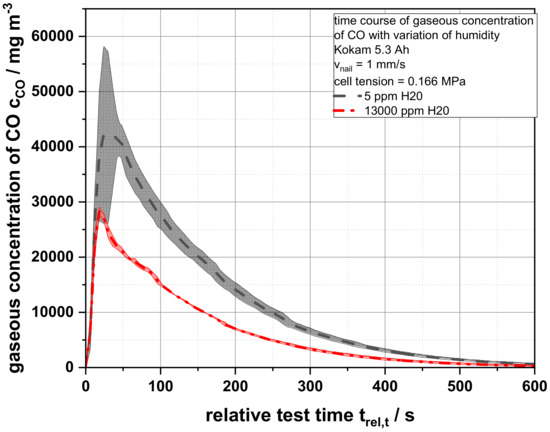
Figure 7.
Average gaseous concentrations of carbon monoxide cCO as a function of the relative test time trel,T of a 5.3 Ah cells for an air humidity of 5 ppm and 13,000 ppm H2O.
In addition, Table 2 shows that the reduction of the measured CO concentrations also applied to the other detected gases (Figures S18–S24). The reduction of the gas concentration in% was calculated as follows:

Table 2.
Percentage reduction of the measurable peak concentrations of the infrared-active reaction gases under variation of the water content (5 ppm and 13,000 ppm) in the measuring chamber of the thermal runaway of 5.3 Ah LIBs.
While gases such as HF, CO, CO2, EMC and C2H6 show a reduction in value by 30.16%–36.08%, the gases EC, CH4 and C2H4 show a much lower reduction in concentration by 15.64%–23.85%. In general, it can be concluded that the water content in the surrounding atmosphere had an influence on the measurable concentrations of the reaction gases. The additional water introduced into the system by the gas bubbler could dissolve some of the gases during the reaction and thus remove them from the environment. In addition, the increased water content could facilitate condensation on the chamber surfaces so that these gases were also not contained in the measuring stream.
In summary, the study showed that the surrounding amount of water in the atmosphere had an important influence on the composition of the reaction products. At the higher water content in the atmosphere the measurable concentrations of the reaction gases decreased remarkably compared to a lower water concentration.
4. Conclusions
The results presented in this work led to a deeper understanding of the processes taking place during the thermal runaway of lithium ion batteries. On the one hand it could be shown that the nail geometry used had no influence on the processes of the thermal runaway of a high energy density lithium ion pouch cell within certain limits. The voltage drop, the development of temperatures up to 521 °C (3.3 Ah) and 533 °C (5.3 Ah) respectively and the infrared-active gas products show no change when using different nail geometries. This fact can be very useful in the evaluation of safety tests of LIBs, as this influencing factor does not need to be taken into account when comparing tests of different facilities. On the other hand it could also be clarified that the capacity of the tested battery had an influence on the composition and also the temporal formation of gas components. Particularly the course of CH4 was influenced because the measured quantity was spontaneously strongly reduced by short-term high availability of oxidizing reactants through reaction with electrolyte components and decomposition of cathode active material. At this moment the formation of oxidation products, like CO and CO2, was accelerated before it decreased again as expected. It could also be shown that depending on the composition of the cell, e.g., the amount of electrolyte, the normalized composition of the resulting gases differs. With fewer oxidizing reactants present, the oxidation of substances to CO and CO2 was influenced. When less oxygen was available, relatively more CO was produced.
Furthermore, the influence of water in the surrounding atmosphere on the quantities of detectable gas could be shown. The gases were bound faster at higher humidity and could condense on surfaces more easily. Thus, measurable gas concentrations decreased and it could be assumed that in case of a thermal runaway these gases were not available for further reactions in the atmosphere and were bound by the condensed water.
With reference to these results, the use of a nail with a diameter of 3 mm, as already proposed in some existing standards, was recommended. When interpreting the test results for different battery capacities, it should also be noted that they did not necessarily have the same concentrations of gaseous products. For better comparability of test results, it should also be considered that the influence of the water content in the atmosphere caused a strong reduction of detectable gaseous reaction products. In real application, however, water could play a useful role in reducing the harmfulness of the thermal runaway if it could bind or reduce certain measurable gaseous products.
Supplementary Materials
The following are available online at https://www.mdpi.com/2313-0105/7/1/6/s1, Figure S1: Average time to cell voltage UCell = 0 V depending on the nail geometry (2–5 mm) used in mm for 3.3 and 5.3 Ah battery cells, Figure S2: Average gaseous concentrations of C2H4 cC2H4 as a function of the relative test time trel,T of 3.3 Ah cell for different nail geometries from 2 to 5 mm, Figure S3: Average gaseous concentrations of C2H6 cC2H6 as a function of the relative test time trel,T of 3.3 Ah cell for different nail geometries from 2 to 5 mm, Figure S4: Average gaseous concentrations of CO cCO as a function of the relative test time trel,T of 3.3 Ah cell for different nail geometries from 2 to 5 mm, Figure S5: Average gaseous concentrations of CO2 cCO2 as a function of the relative test time trel,T of 3.3 Ah cell for different nail geometries from 2 to 5 mm, Figure S6: Average gaseous concentrations of EC cEC as a function of the relative test time trel,T of 3.3 Ah cell for different nail geometries from 2 to 5 mm, Figure S7: Average gaseous concentrations of EMC cEMC as a function of the relative test time trel,T of 3.3 Ah cell for different nail geometries from 2 to 5 mm, Figure S8: Average gaseous concentrations of HF cHF as a function of the relative test time trel,T of 3.3 Ah cell for different nail geometries from 2 to 5 mm, Figure S9: Average gaseous concentrations of C2H4 cC2H4 as a function of the relative test time trel,T of 5.3 Ah cell for different nail geometries from 2 to 5 mm, Figure S10: Average gaseous concentrations of C2H6 cC2H6 as a function of the relative test time trel,T of 5.3 Ah cell for different nail geometries from 2 to 5 mm, Figure S11: Average gaseous concentrations of CO cCO as a function of the relative test time trel,T of 5.3 Ah cell for different nail geometries from 2 to 5 mm, Figure S12: Average gaseous concentrations of CO2 cCO2 as a function of the relative test time trel,T of 5.3 Ah cell for different nail geometries from 2 to 5 mm, Figure S13: Average gaseous concentrations of EC cEC as a function of the relative test time trel,T of 5.3 Ah cell for different nail geometries from 2 to 5 mm, Figure S14: Average gaseous concentrations of EMC cEMC as a function of the relative test time trel,T of 5.3 Ah cell for different nail geometries from 2 to 5 mm, Figure S15: Average gaseous concentrations of HF cHF as a function of the relative test time trel,T of 5.3 Ah cell for different nail geometries from 2 to 5 mm, Figure S16: Average cell voltage Ucell as a function of the relative test time trel,T of a 5.3 Ah cells for an air humidity of 5 ppm and 13,000 ppm H2O, Figure S17: Average cell surface temperature ΔTS as a function of the relative test time trel,T of a 5.3 Ah cells for an air humidity of 5 ppm and 13,000 ppm H2O, Figure S18: Average gaseous concentrations of C2H4 cC2H4 as a function of the relative test time trel,T of a 5.3 Ah cells for an air humidity of 5 ppm and 13,000 ppm H2O, Figure S19: Average gaseous concentrations of C2H6 cC2H6 as a function of the relative test time trel,T of a 5.3 Ah cells for an air humidity of 5 ppm and 13,000 ppm H2O, Figure S20: Average gaseous concentrations of CH4 cCH4 as a function of the relative test time trel,T of a 5.3 Ah cells for an air humidity of 5 ppm and 13,000 ppm H2O, Figure S21: Average gaseous concentrations of CO2 cCO2 as a function of the relative test time trel,T of a 5.3 Ah cells for an air humidity of 5 ppm and 13,000 ppm H2O, Figure S22: Average gaseous concentrations of EC cEC as a function of the relative test time trel,T of a 5.3 Ah cells for an air humidity of 5 ppm and 13,000 ppm H2O, Figure S23: Average gaseous concentrations of EMC cEMC as a function of the relative test time trel,T of a 5.3 Ah cells for an air humidity of 5 ppm and 13,000 ppm H2O, Figure S24: Average gaseous concentrations of HF cHF as a function of the relative test time trel,T of a 5.3 Ah cells for an air humidity of 5 ppm and 13,000 ppm H2O.
Author Contributions
S.D. carried out the experiments. S.D. and W.H. wrote the manuscript with support from A.K. W.H. helped supervise the project. A.K. supervised the project. All authors have read and agreed to the published version of the manuscript.
Funding
This research work was funded by the German Federal Ministry for Economic Affairs and Energy within the research project BaSiS (Reference No. 03ETE005A) and the German Federal Ministry for Education and Research funded this research within the research projekt BaSS (Reference No. 16EMO0318).
Data Availability Statement
The data presented in this study are available in this manuscript and the accompanying supplemental material.
Acknowledgments
The authors thank the German Federal Ministry for Economic Affairs and Energy for the funding of research project BaSiS (Reference No. 03ETE005A) and the German Federal Ministry for Education and Research for the funding of the research projekt BaSS (Reference No. 16EMO0318). We acknowledge support by the German Research Foundation and the Open Access Publication Funds of Technische Universität Braunschweig. Furthermore, thank you to Marcel Wuwer and Markus Moeller from Viscom AG for the preparation of X-ray images of the cells. The authors also thank Uwe Stüwe, Ernst Jelting, Alexander Diener, Detlev Hille for the technical support in the realization of the test stand and the method.
Conflicts of Interest
The authors declare no conflict of interest. The funders had no role in the design of the study; in the collection, analyses, or interpretation of data; in the writing of the manuscript, or in the decision to publish the results.
References
- Kwade, A.; Haselrieder, W.; Leithoff, R.; Modlinger, A.; Dietrich, F.; Droeder, K. Current status and challenges for automotive battery production technologies. Nat. Energy 2018, 3, 290–300. [Google Scholar] [CrossRef]
- Korthauer, R. Handbuch Lithium-Ionen-Batterien; Korthauer, R., Ed.; Springer Vieweg: Berlin, Germany, 2013; ISBN 978-3-642-30653-2. [Google Scholar]
- Nishi, Y. The development of lithium ion secondary batteries. Chem. Rec. 2001, 1, 406–413. [Google Scholar] [CrossRef] [PubMed]
- Placke, T.; Kloepsch, R.; Dühnen, S.; Winter, M. Lithium ion, lithium metal, and alternative rechargeable battery technologies: The odyssey for high energy density. J. Solid State Electrochem. 2017, 21, 1939–1964. [Google Scholar] [CrossRef]
- Ruiz, V.; Pfrang, A.; Kriston, A.; Omar, N.; van den Bossche, P.; Boon-Brett, L. A review of international abuse testing standards and regulations for lithium ion batteries in electric and hybrid electric vehicles. Renew. Sustain. Energy Rev. 2018, 81, 1427–1452. [Google Scholar] [CrossRef]
- Lamb, J.; Orendorff, C.J. Evaluation of mechanical abuse techniques in lithium ion batteries. J. Power Sources 2014, 247, 189–196. [Google Scholar] [CrossRef]
- Diekmann, J.; Doose, S.; Weber, S.; Münch, S.; Haselrieder, W.; Kwade, A. Development of a New Procedure for Nail Penetration of Lithium-Ion Cells to Obtain Meaningful and Reproducible Results. J. Electrochem. Soc. 2020, 167, 90504. [Google Scholar] [CrossRef]
- Mao, B.; Chen, H.; Cui, Z.; Wu, T.; Wang, Q. Failure mechanism of the lithium ion battery during nail penetration. Int. J. Heat Mass Transf. 2018, 122, 1103–1115. [Google Scholar] [CrossRef]
- Kim, J.; Lee, J.G.; Kim, H.-S.; Lee, T.J.; Park, H.; Ryu, J.H.; Oh, S.M. Thermal Degradation of Solid Electrolyte Interphase (SEI) Layers by Phosphorus Pentafluoride (PF 5) Attack. J. Electrochem. Soc. 2017, 164, A2418–A2425. [Google Scholar] [CrossRef]
- Yang, H.; Zhuang, G.V.; Ross, P.N. Thermal stability of LiPF6 salt and Li-ion battery electrolytes containing LiPF6. J. Power Sources 2006, 161, 573–579. [Google Scholar] [CrossRef]
- Tebbe, J.L.; Fuerst, T.F.; Musgrave, C.B. Mechanism of hydrofluoric acid formation in ethylene carbonate electrolytes with fluorine salt additives. J. Power Sources 2015, 297, 427–435. [Google Scholar] [CrossRef]
- Von Sacken, U.; Nodwell, E.; Sundher, A.; Dahn, J.R. Comparative thermal stability of carbon intercalation anodes and lithium metal anodes for rechargeable lithium batteries. J. Power Sources 1995, 54, 240–245. [Google Scholar] [CrossRef]
- Larsson, F.; Andersson, P.; Blomqvist, P.; Mellander, B.-E. Toxic fluoride gas emissions from lithium-ion battery fires. Sci. Rep. 2017, 7, 10018. [Google Scholar] [CrossRef] [PubMed]
- Peng, Y.; Yang, L.; Ju, X.; Liao, B.; Ye, K.; Li, L.; Cao, B.; Ni, Y. A comprehensive investigation on the thermal and toxic hazards of large format lithium-ion batteries with LiFePO4 cathode. J. Hazard. Mater. 2020, 381, 120916. [Google Scholar] [CrossRef] [PubMed]
- Feng, X.; Sun, J.; Ouyang, M.; Wang, F.; He, X.; Lu, L.; Peng, H. Characterization of penetration induced thermal runaway propagation process within a large format lithium ion. battery module. J. Power Sources 2015, 275, 261–273. [Google Scholar] [CrossRef]
- Roth, E.P.; Orendorff, C.J. How electrolytes influence battery safety. Electrochem. Soc. Interface 2012, 21, 45–49. [Google Scholar] [CrossRef]
Publisher’s Note: MDPI stays neutral with regard to jurisdictional claims in published maps and institutional affiliations. |
© 2021 by the authors. Licensee MDPI, Basel, Switzerland. This article is an open access article distributed under the terms and conditions of the Creative Commons Attribution (CC BY) license (http://creativecommons.org/licenses/by/4.0/).