Article

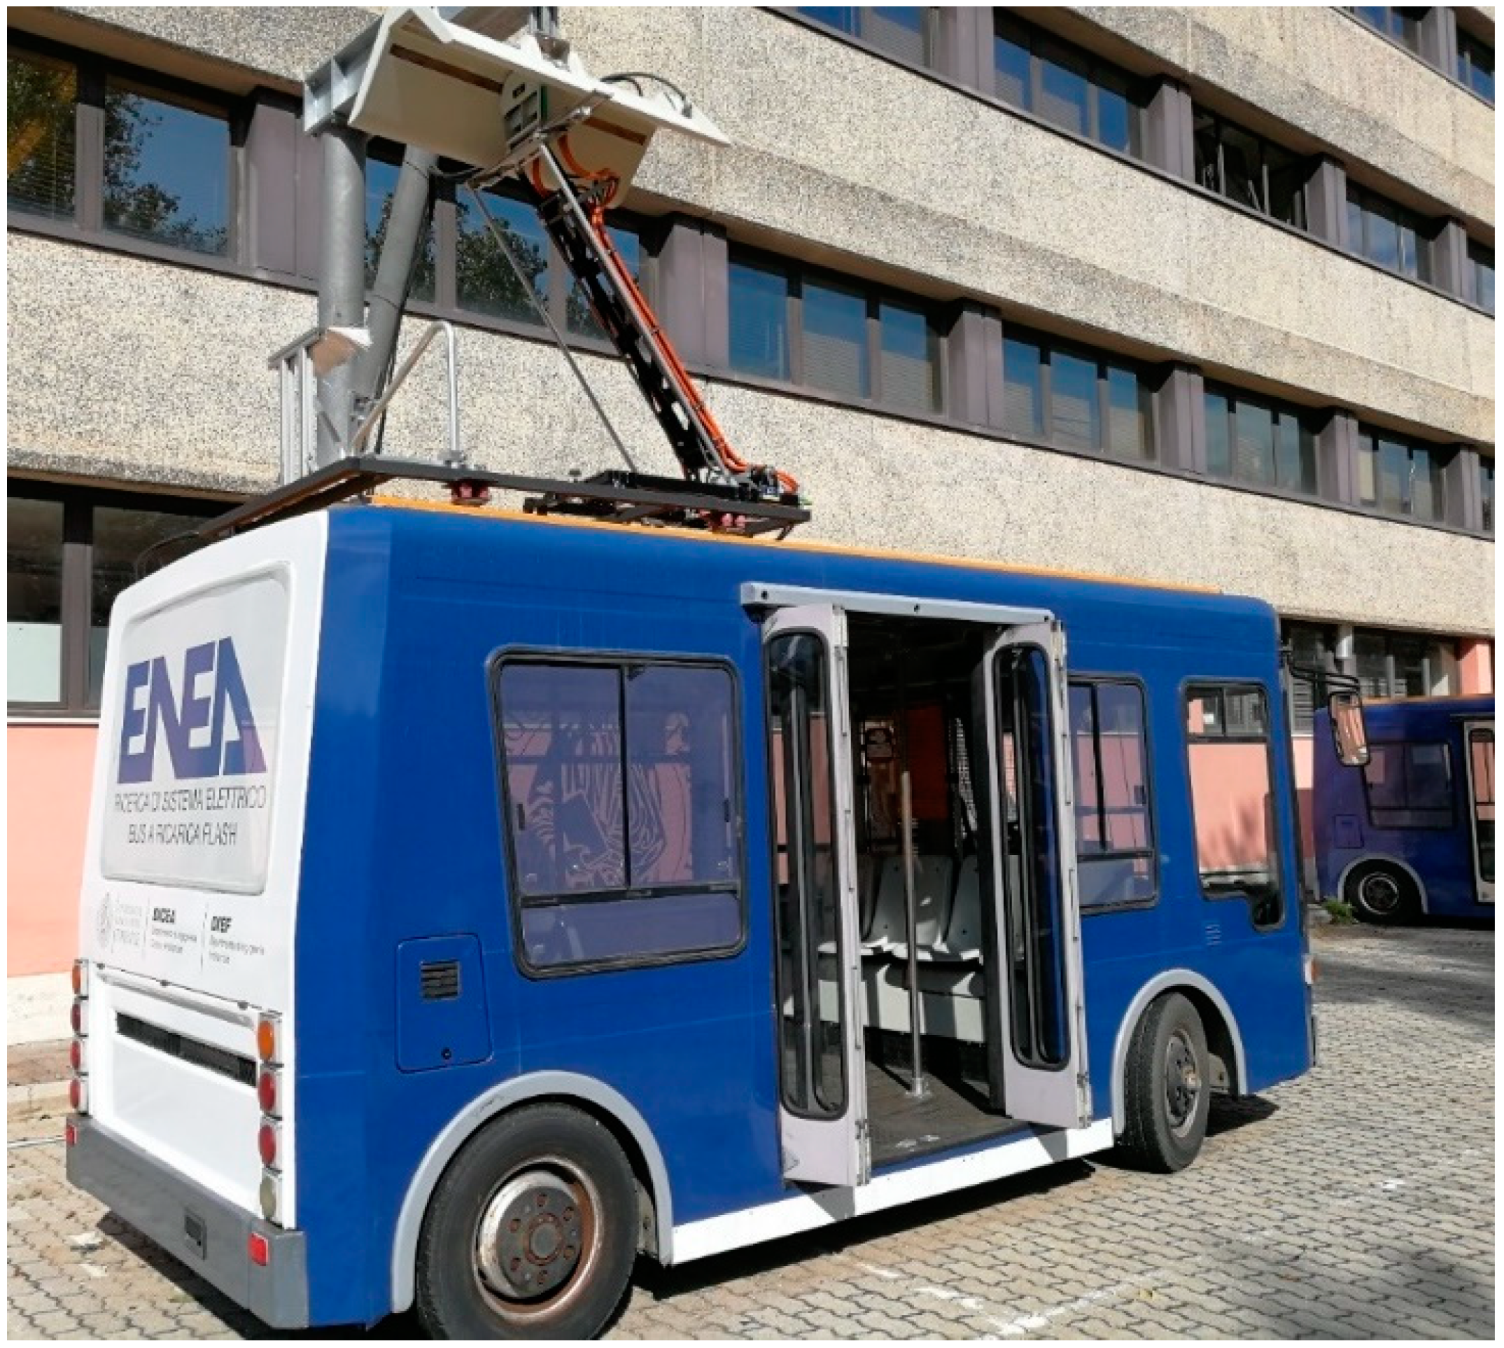
Experimental Data Comparison of an Electric Minibus Equipped with Different Energy Storage Systems

1
Italian National Agency for New Technologies and Environment (ENEA), 00123 Rome, Italy
2
Department of Civil and Environmental Engineering (DICEA), University of Florence (UNIFI), 50139 Florence, Italy
3
Department of Industrial Engineering (DIEF), University of Florence (UNIFI), 50139 Florence, Italy
*
Author to whom correspondence should be addressed.
Batteries 2020, 6(2), 26; https://doi.org/10.3390/batteries6020026
Submission received: 6 April 2020 / Revised: 22 April 2020 / Accepted: 23 April 2020 / Published: 28 April 2020
(This article belongs to the Special Issue Battery Management Systems of Electric and Hybrid Electric Vehicles)

Abstract

:
As electric mobility becomes more important every day, scientific research brings us new solutions that increase performance, reduce financial and economic impacts and increase the market share of electric vehicles. Therefore, there is a necessity to compare technical and economic aspects of different technologies for each transport application. This article presents a comparison of three bus prototypes in terms of dynamic performance. The analysis is based on the collection of real data (acceleration, maximum speed and energy consumption) under different settings. Each developed prototype uses the same bus chassis but relies on different energy storage systems. Results show that the dynamic bus performance is independent on the three energy storage technologies, whereas technologies affect the management costs, charging time and available range. An extensive experimental analysis reveals that the bus equipped with a hybrid storage (lithium-ion batteries and supercapacitors) had the most favorable net present value, in comparison with storage composed of only lead–acid or lithium-ion batteries. This result is due to the greater life of lithium-ion batteries and to the capability of supercapacitors, which reduce both batteries depth of discharge and discharge rate.

1. Introduction

Recent developments in energy storage systems (ESS) and fast charging technologies extend the range of electric vehicles and their increasing market share are reducing prices [1,2,3].
The European Union set the target of 40% reduction of greenhouse gas (GHG) emissions and of 27% share of renewable energy by 2030 [4], with a potential reduction of 80%–95% of GHG and 55%–75% of gross final energy consumption from renewable sources [5] by 2050.
The transport sector contributes almost a quarter of Europe’s GHG emissions and buses are responsible for 8% of transport emissions. In 2019, electric buses all over Europe count 2200 units [6], less than 1% of European bus fleet (about 770,000 units [7]). A study forecasts that electric buses will reach more than 23,000 units in 2025 [8].
An opportunity to shift towards electric transportation is the retrofit [9]. This was fostered in Italy by a recent national policy initiative. The Italian Ministry Economic Development (MISE) issued the order no. 219 of 1 December 2015 [10] to allow this procedure.
A retrofit replaces an Internal Combustion Engine (ICE) with an electric kit (composed by a motor, a battery and some electronics). Today, it is applicable only to M1 and N1 vehicle categories (cars weighing up to 3.5 tons), however there are future possibilities to extend this opportunity to larger vehicles.
This study focuses on small public transport vehicles; those minibuses are maximum 6 m long with a passenger capacity of 30 people. It shows a comparison of the data gathered by three consecutive projects all founded by MISE in the last four years. Project partners were ENEA and four Italian Universities (University of Firenze, Sapienza of Rome, Roma Tre and Pisa).
Each project used the same bus model, a Tecnobus Gulliver ESP500, equipped with different prototypes of energy storage systems (ESS). Figure 1 shows the buses of the three projects:
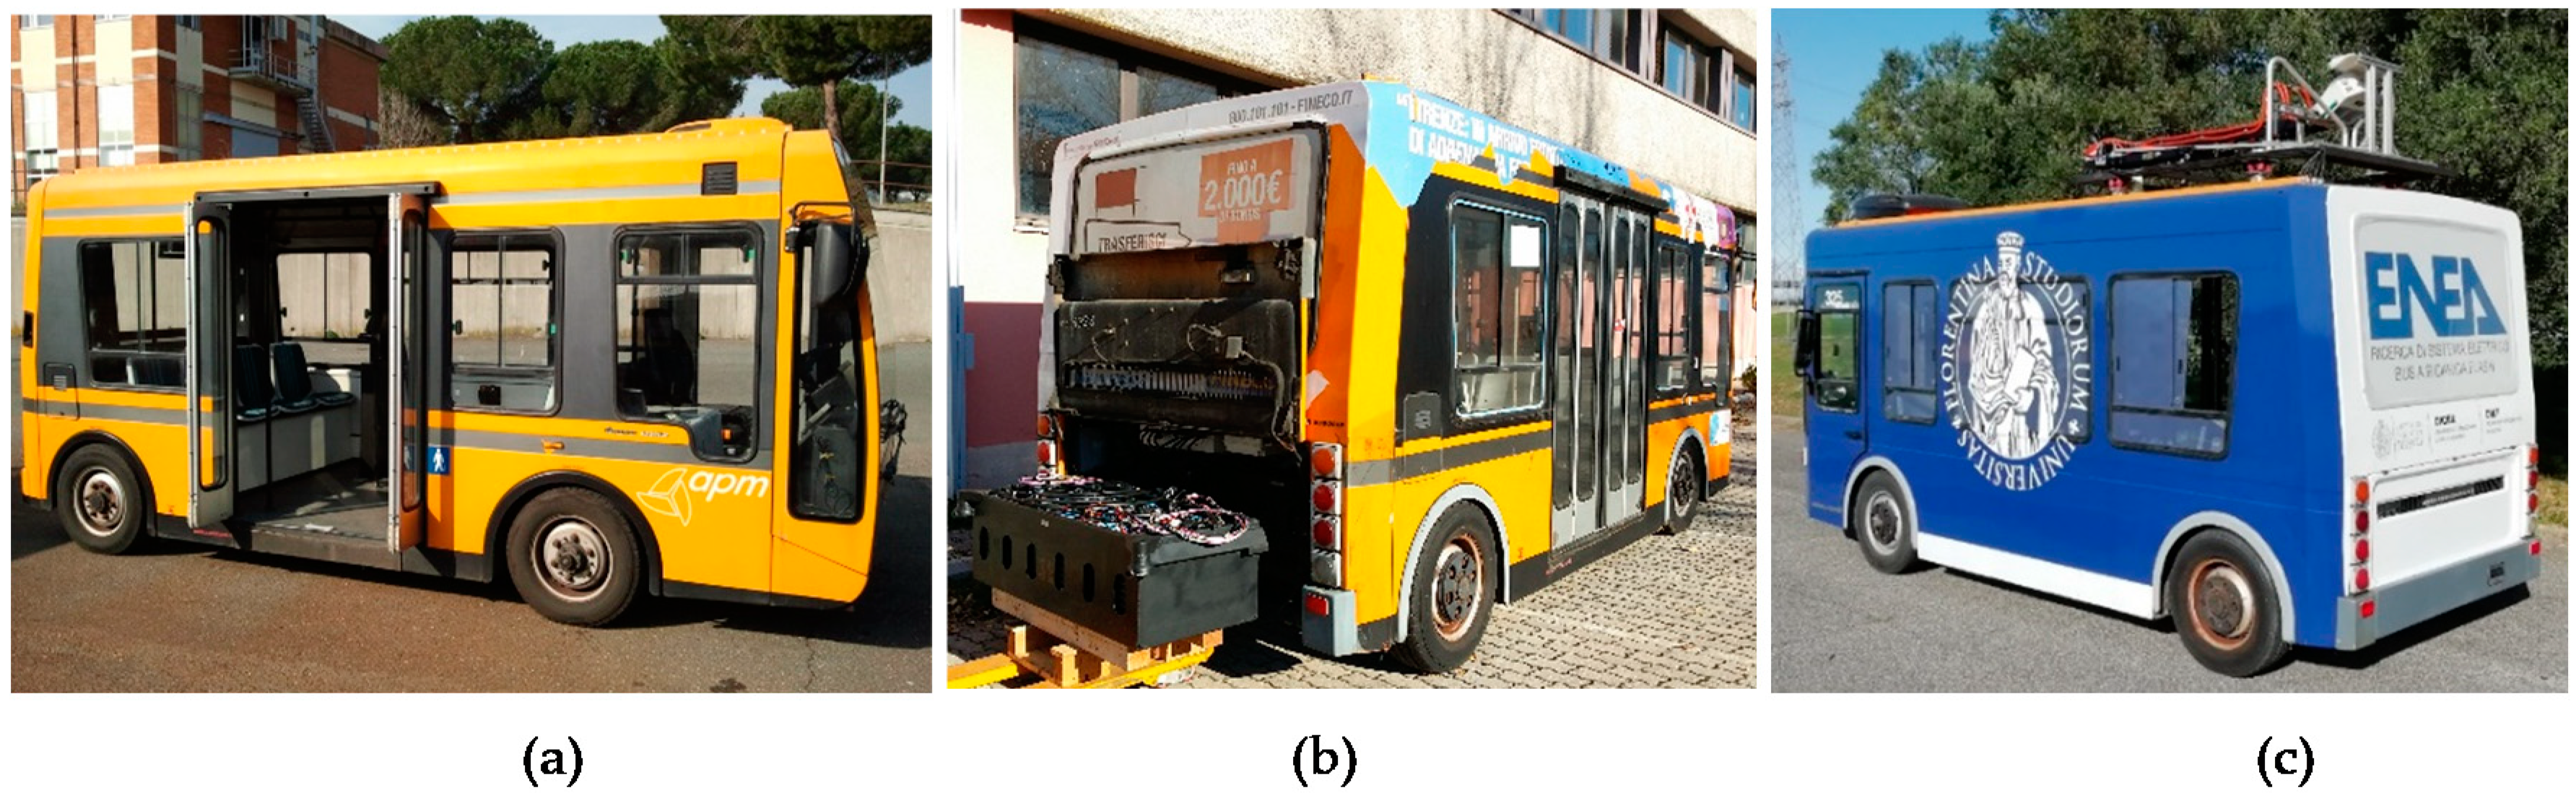
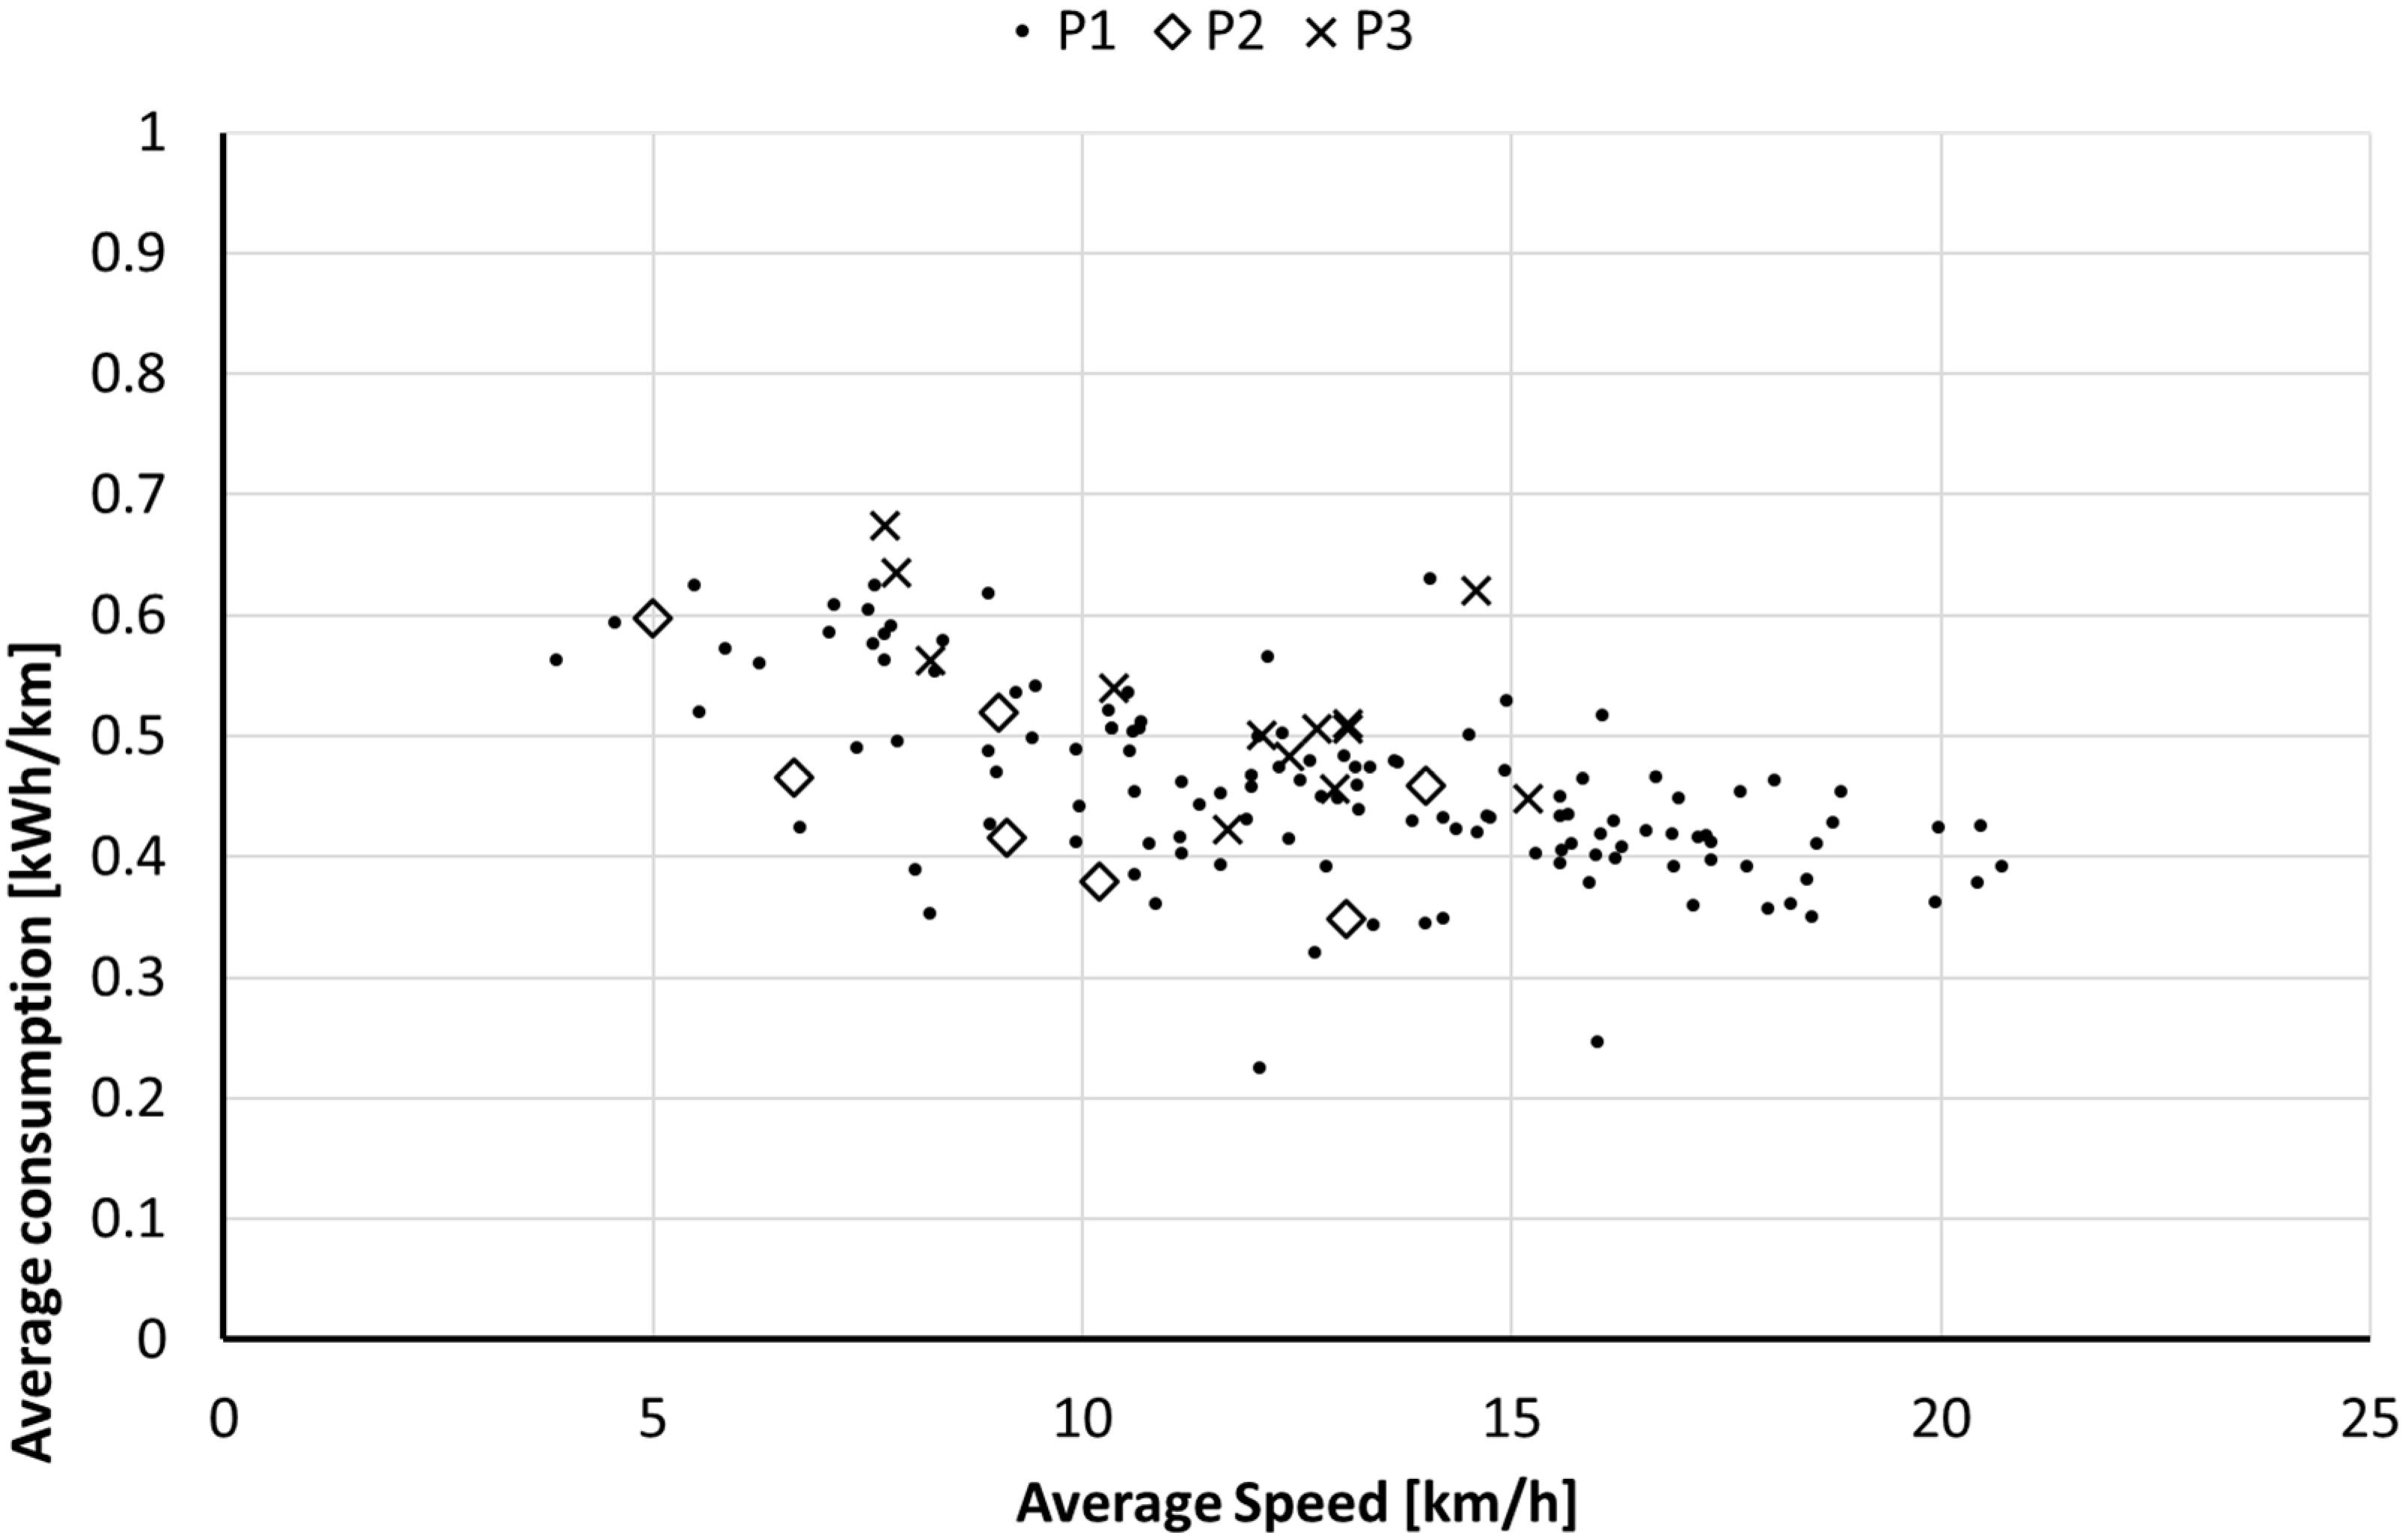
  • Project 1 (P1): Bus equipped with lead–acid batteries, as provided by the original equipment manufacturer (OEM). The project tested an innovative on-demand transport service [11].
  • Project 2 (P2): lithium-ion iron phosphate batteries designed for 3C (three times the nominal capacity C) fast charging.
  • Project 3 (P3): Hybrid storage with supercapacitors (SC) and absorbent glass mat (AGM) lead batteries, with a flash charging system.
Each project had its own experimental testing campaign, each taking place into the ENEA campus. The campus has about ten kilometers of internal roads, so there are many workers moving during the day. This allowed us simulating a common transport service.
Preliminary results have shown that each bus has same performance and the energy consumption of the vehicle is not influenced by the energy storage. Moreover, P3 achieved better economic results with lower costs. The authors argued the economic benefit is due to less frequent replacements of the battery in a hybrid ESS. Hence, it was evaluated whether it is convenient to replace battery with a more expensive lithium battery. A new project starting from P3 and replacing the AGM battery with a lithium-ion one was simulated and indicated as P4 in the study.
An economical comparison was carried out among these four alternatives: the three experimental projects with real data plus the simulated scenario. It was hypothesized that all prototypes must supply the same transport service with a daily range of 100 km. The comparison of the projects is based on life cycle cost with the net present value (NPV) indicator [12]. The incomes are the same for all of them and costs change from one to another. The project with lower costs has a better NPV.
The present study demonstrates that the best results are achieved in P4, which is characterized by hybrid ESS (as the one of P3) combined with lithium-ion batteries (as the one of P2). P4 combines two technologies with a more efficient usage that give longer life expectation to the electric and storage components.
This study is organized in four sections: the current introduction; Section 2, which presents the details of compared projects; Section 3, which presents the results; and Section 4, the conclusions.

2. Details of the Compared Projects

This section details nominal specifications and analysis of real data for the three projects (from 1 to 3). P4 combines specifications of P2 and P3 and its input data are explained in Section 3.
Project 1 had the lead–acid batteries provided by the OEM. The batteries have no sensors, but the chopper (DC regulator) of the motor provides upon request voltage and current to and from the batteries.
Energy storage system prototypes were manufactured, specifically in P2 and P3. In P2, a battery management system (BMS) measures voltage, current and temperature of each battery-cell individually for safety and advanced management. In P3, a buck-boost DC-DC converter was inserted between the ultracapacitors and the batteries. Therefore, P2 and P3 had very accurate measurement systems installed directly on the energy storage.
These three prototypes have different measurement systems. The first had a 1 Hz sampling rate; the traveled distance was about 100 km. P2 and P3 had an acquisition rate, respectively of 2 Hz and 10 Hz. These two projects had less data and the traveled distance was about 20 km each.
Energy consumption was compared by observing the average consumption per kilometer of many trips, each with different driving cycles, terrain orography, payload and driving styles.
Range and charging times are also different from among projects. In order to be compared and fulfil the same transport service, they required some adaptation:
  • P1 had not enough range for a day, considering a typical transport line of 100 km; this required two battery packs and two chargers for each bus. A full charge of battery required eight hours and it covered only about four hours of service, so at midday, driver went to depot, where battery was swapped with a second one (just fully charged).
  • P2 had a fast charging feature that allowed for twenty-minute ride followed by seven-minute stop (or forty-minute ride and fourteen-minute stop). The long stop was necessary to charge battery.
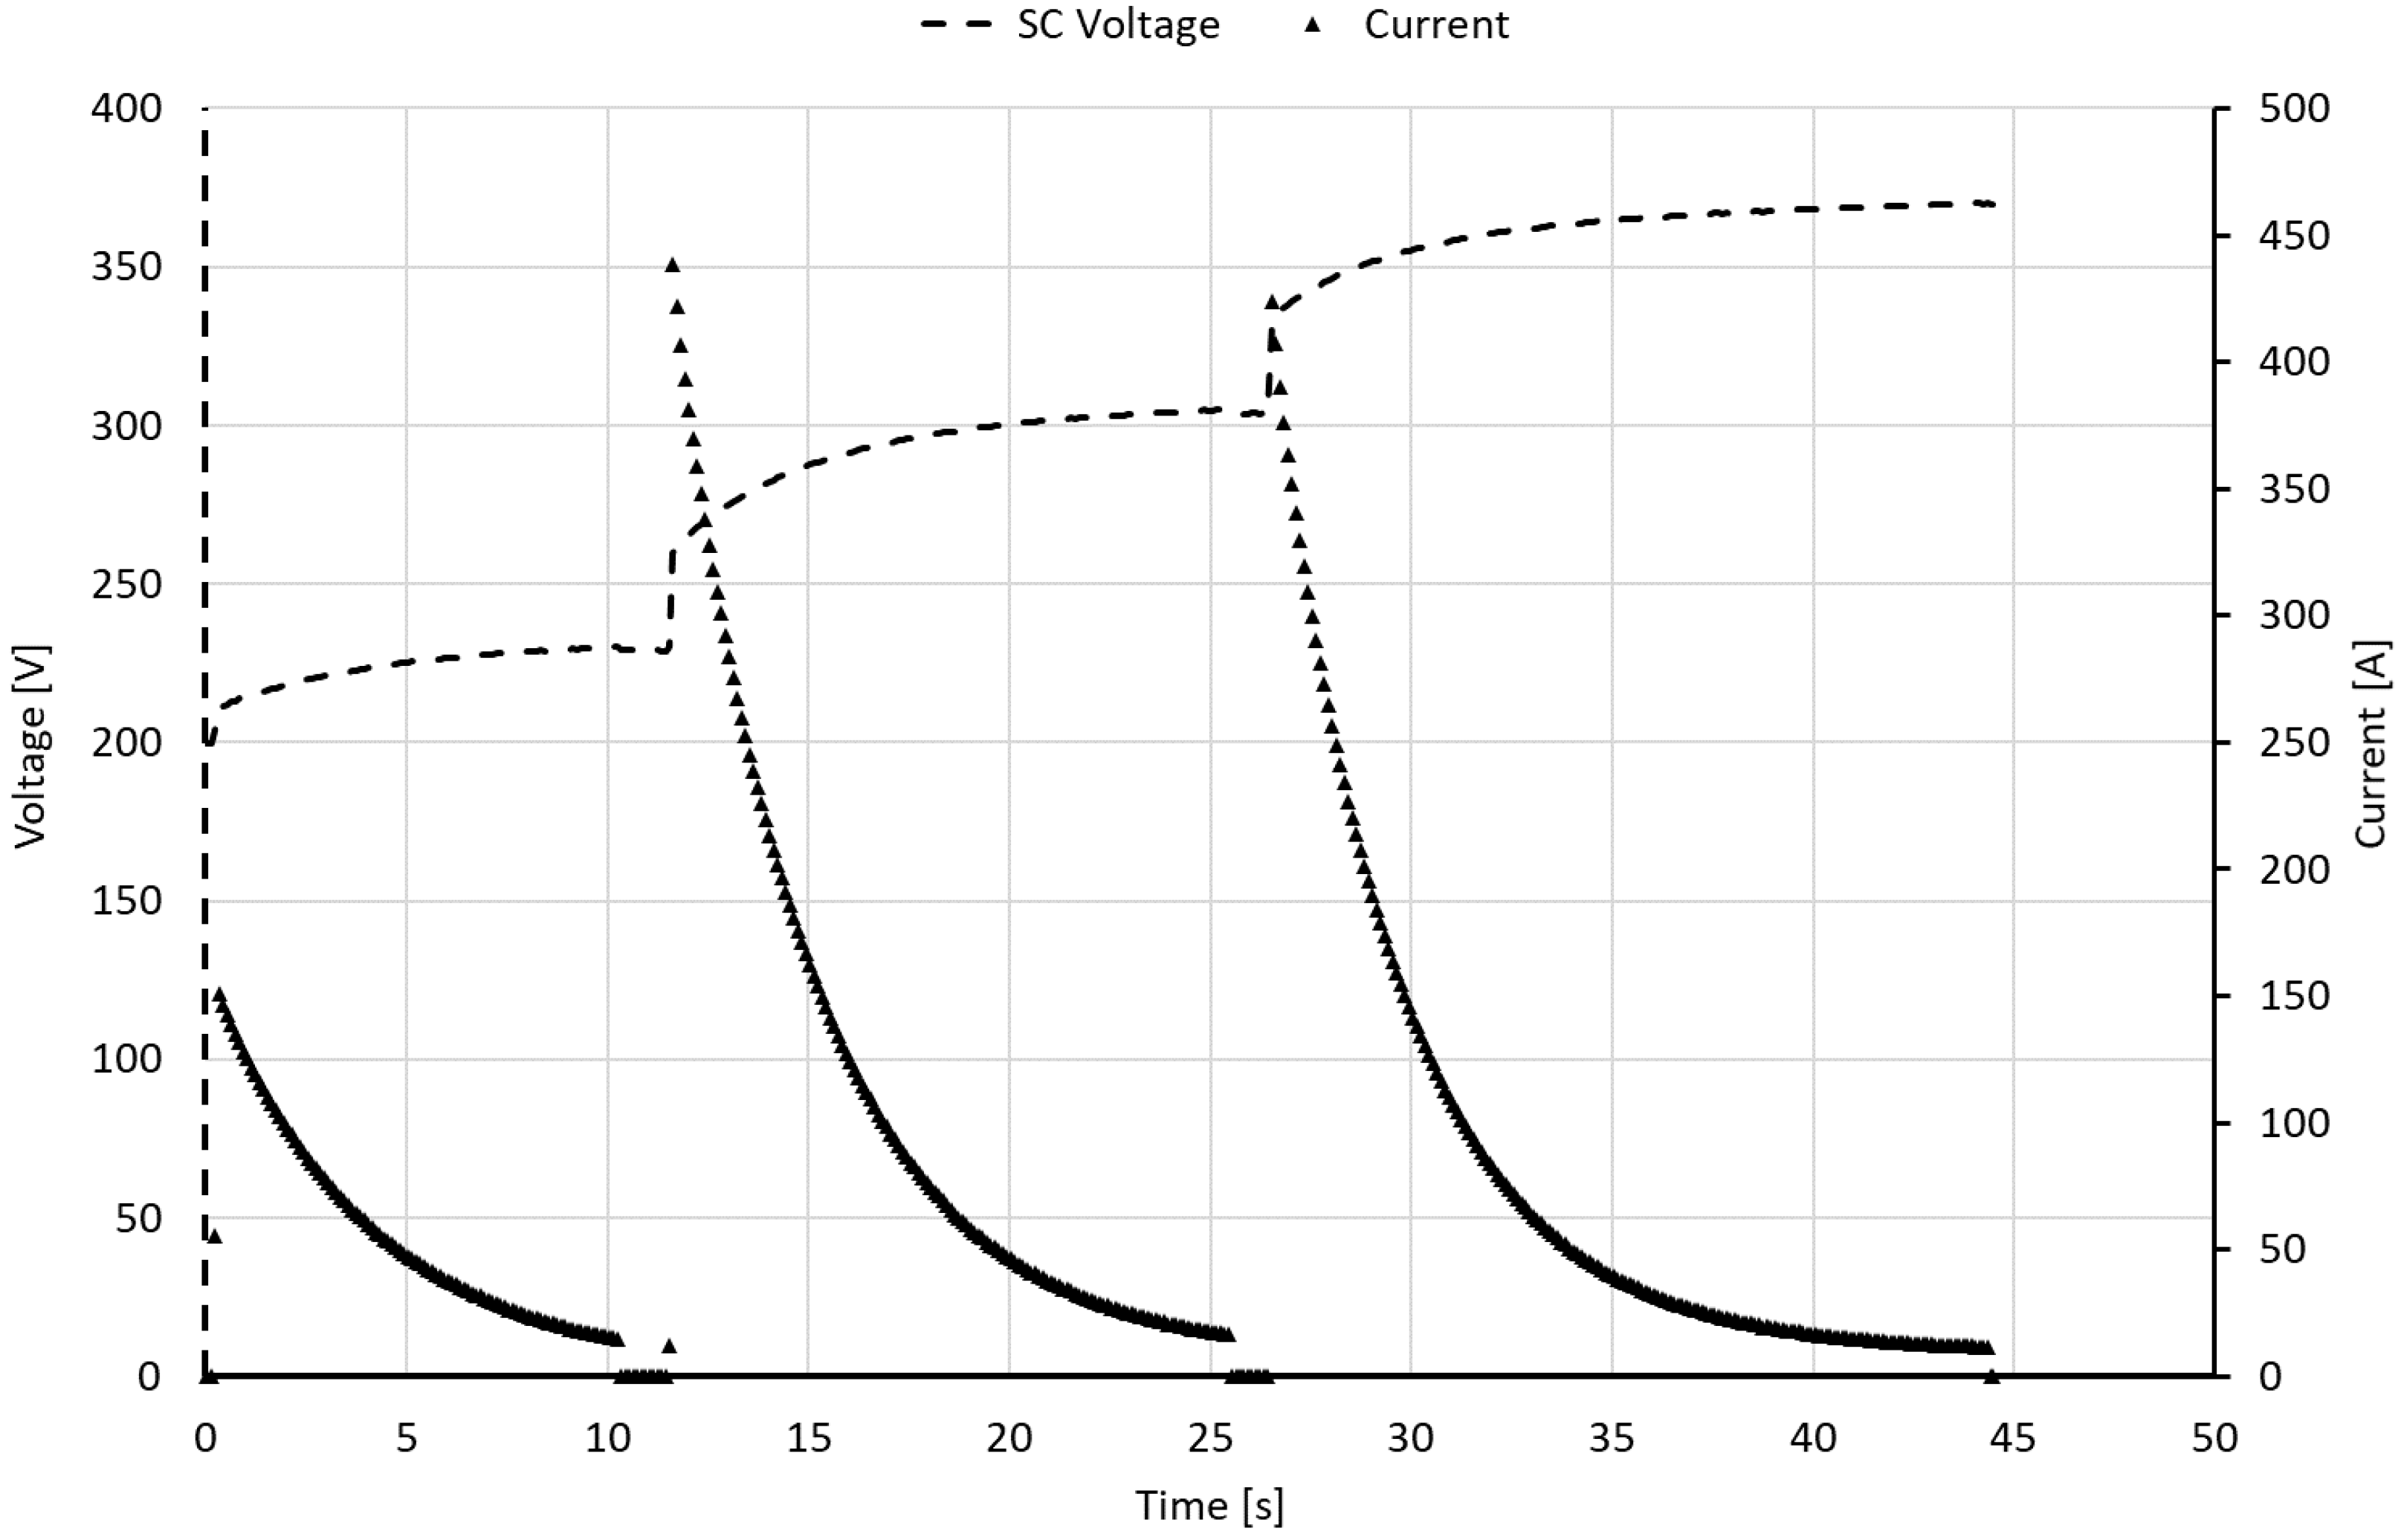
  • P3 had a flash charging feature that allowed to charge SC in thirty seconds, so it could be charged during transport service stops (while passengers are on board), but it had to happen every 700 m [13].
  • P4 has a SC with the flash charging feature, as for P3 and, a LiFePO4 battery (as for P2 but with lesser energy stored).
The choice of LiFePO4 is due to the availability of experimental data [14], where it was estimated the maximum life cycle of a battery with conditions comparable to current bus usage.
A performance and economic evaluation were done. The first one is based on maximum speed, maximum acceleration and time to reach maximum speed with a standing start.
Indeed, the economic evaluation is a cost benefit analysis using the net present value as main indicator of economic value, was performed over a twenty-four-year time frame, to consider a least common multiple of the lifetime expectations of the different technologies (called also cycle life, CL) [15,16].
The periodic replacement of exhausted batteries during the lifetime of the bus has also been considered. An ESS lasts up to a few years depending on the usage. Bus lifetime ranges from 10 to 15 years depending on its size, for example a 12-m long bus has 15 years of depreciation in Italy. The bus used in this analysis is 6-meter long and a lifespan of 12 years was assumed. SC lifetime is longer than a million cycles (according to manufacturer specifications) [17,18].
The bus lifetime was assumed 12 years as reference value, so, the economic evaluation expects at least 24 years, considering at least a replacement for the bus and all ESS components. The SC lifetime is more than twenty years, considering the expected life cycle and their usage in a bus, while, battery life depends on several factors [19]. The main factors are: depth of discharge (DoD), discharge rate (measured in multiples of the nominal capacity C), charge rate, aging, working and environmental temperatures.
For the tests of the all projects, the working temperature of the battery was maintained within the limits prescribed by manufacturer. While the environmental temperatures of these projects were the same, all tests made in the ENEA campus were conducted with mild weather.
It can be assumed that for a bus application, number of cycles life of ESS components is lower than the calendar life (it is the elapsed time before a battery becomes unusable, whether it is in active or inactive use). The manufacturer of the AGM battery, used in P1 and P3, declares 20 months of life, while lithium lasts up to five years [20,21].
Meanwhile, DoD has the highest impact to a battery; for the P1 equipped with a lead–acid battery, the DoD was about 80% and it had 500 cycles to failure [22], as shown in Figure 2. Hence, if the transport service application requires a full charge every day, the battery must be replaced every 500 days.
Figure 3 shows DoD effects applied to three lithium batteries with different chemistry [23]. A LiFePO4 battery (as those of P2) has about a thousand CL if used up to 80% of DoD or, if used only up to 40%, it will last three times longer.
Such effects become very important from an economic point of view especially in the case of higher costs of lithium compared with lead–acid.
C rate, during charging and discharging, reduces the battery lifetime even more. As described in Figure 4, the capacity of a lead–acid battery drops when discharge rate raises from 0.5C to 10C, then battery capacity decreases from 100% of initial value (battery fully charged) to 70% [24]. Lithium-ion batteries suffer from the same issues but have different effects [14,25], accordingly to the discharge rate capability and battery life cycle given by battery manufacturers.
Experimental results of three cited project are described one by one as follows.

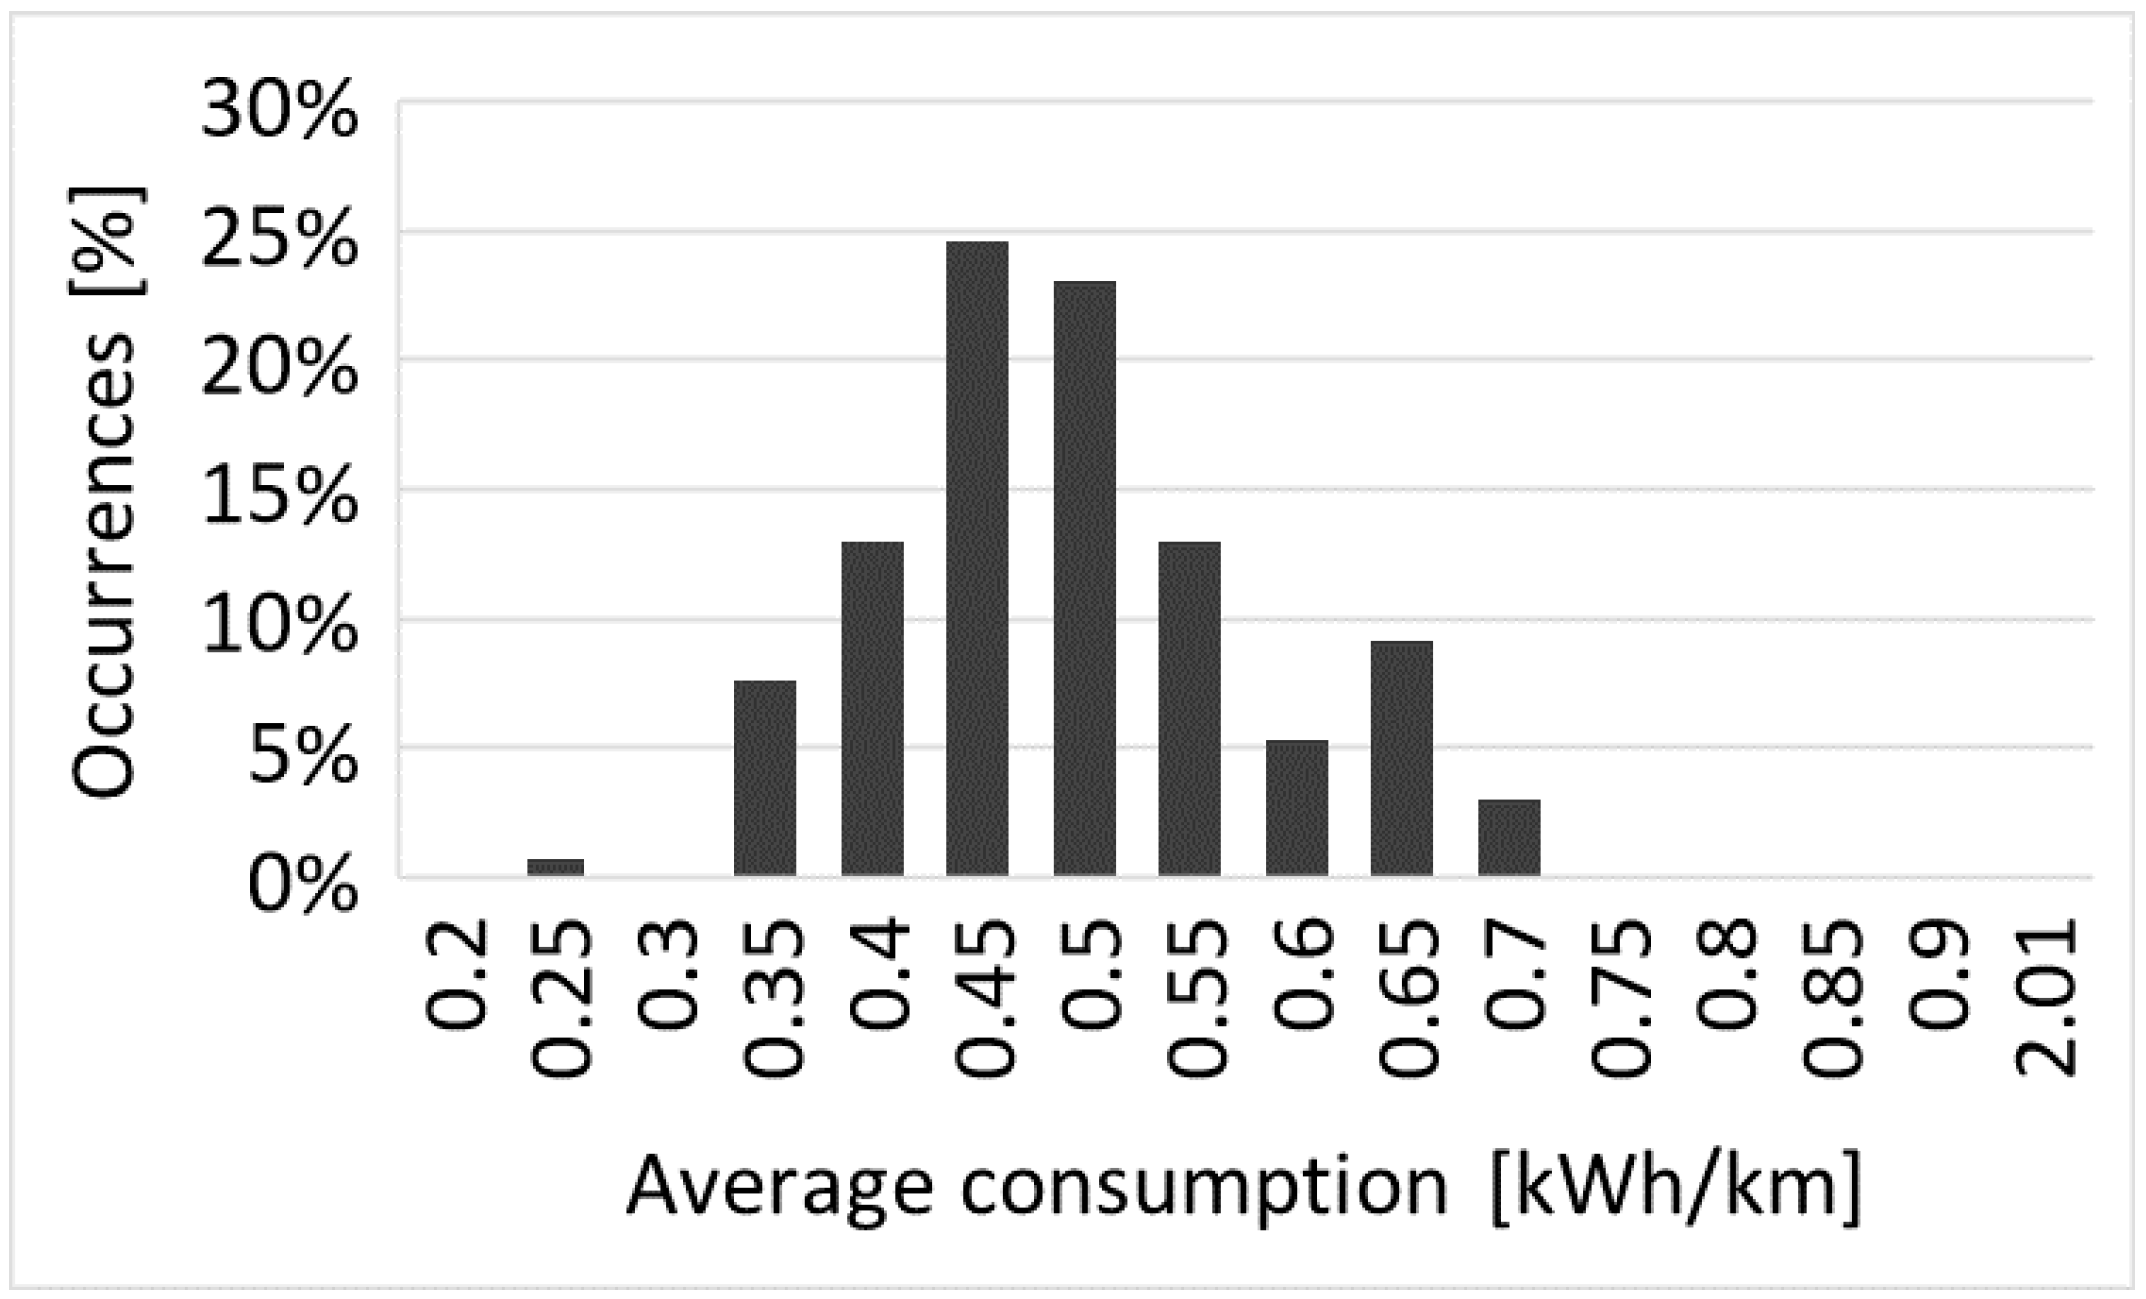
2.1. Project 1 (P1): Lead–acid Batteries

The goal of the project was to develop an on-demand transport system between ENEA facilities. The bus was equipped with a lead–acid battery of 43 kWh at 72 V, with a capacity of 600 Ah. It was composed by 36 batteries of 100 Ah–12 V each. The configuration consisted of 2 strings in series, each one composed of eighteen batteries, meaning six groups in parallel of three batteries in series.
It had long running acquisition including different missions. Each one of them included a running distance of at least 500 m. It started and stopped at zero speed (minimum measuring time of 10 s).
This project ran for almost three months and data for about 100 kms were collected. In order to evaluate such amount of data, focusing only on the average consumption and with a wide variety of driving conditions (slopes, payload, etc.), data were divided into more than 110 stretches. Figure 5 shows the histogram of the occurrences for the average consumption.
This bus consumes from 0.35 to 0.70 kWh/km, with a modal value of 0.45 kWh/km.
Figure 6 shows the current and voltage trend during a stretch. The ESS provided more than 320 A and each battery up to 55 A of maximum current. The chopper of P1 did not show negative values through the interface used, but it also computed energy consumption with both negative and positive currents.
Figure 6 highlights the voltage of battery drops due to high internal resistances.
The internal resistance further reduces the life expectation of lead–acid batteries. A new battery features this behavior only with low state of charge (SOC), but it gets worse with age and number of cycles.
Table 1 shows the results of a few rides during transport service of P1.

2.2. Project 2 (P2): Lithium-Ion Batteries

This project developed a prototype of fast charging battery pack for a small minibus [26,27].
The prototype battery pack was composed of 17 kWh of lithium batteries. It is composed of 96 cells of 3.7 V and 60 Ah each. The configuration was four strings of twenty-four cells in series each and the whole battery reached 76 V–240 Ah. It was capable of 3C charging rate.
The chemical composition was LiFePO4; it could be charged with 1.4 kWh in 110 s as shown in Figure 7, where current and energy during fast charging are plotted. Current values of Figure 7 are negative due to sign convention of the measurement system. Hence, the energy decrease means a charge.
Figure 8 shows voltage and current trend during a bus ride.
There are two important differences between P1 and P2:
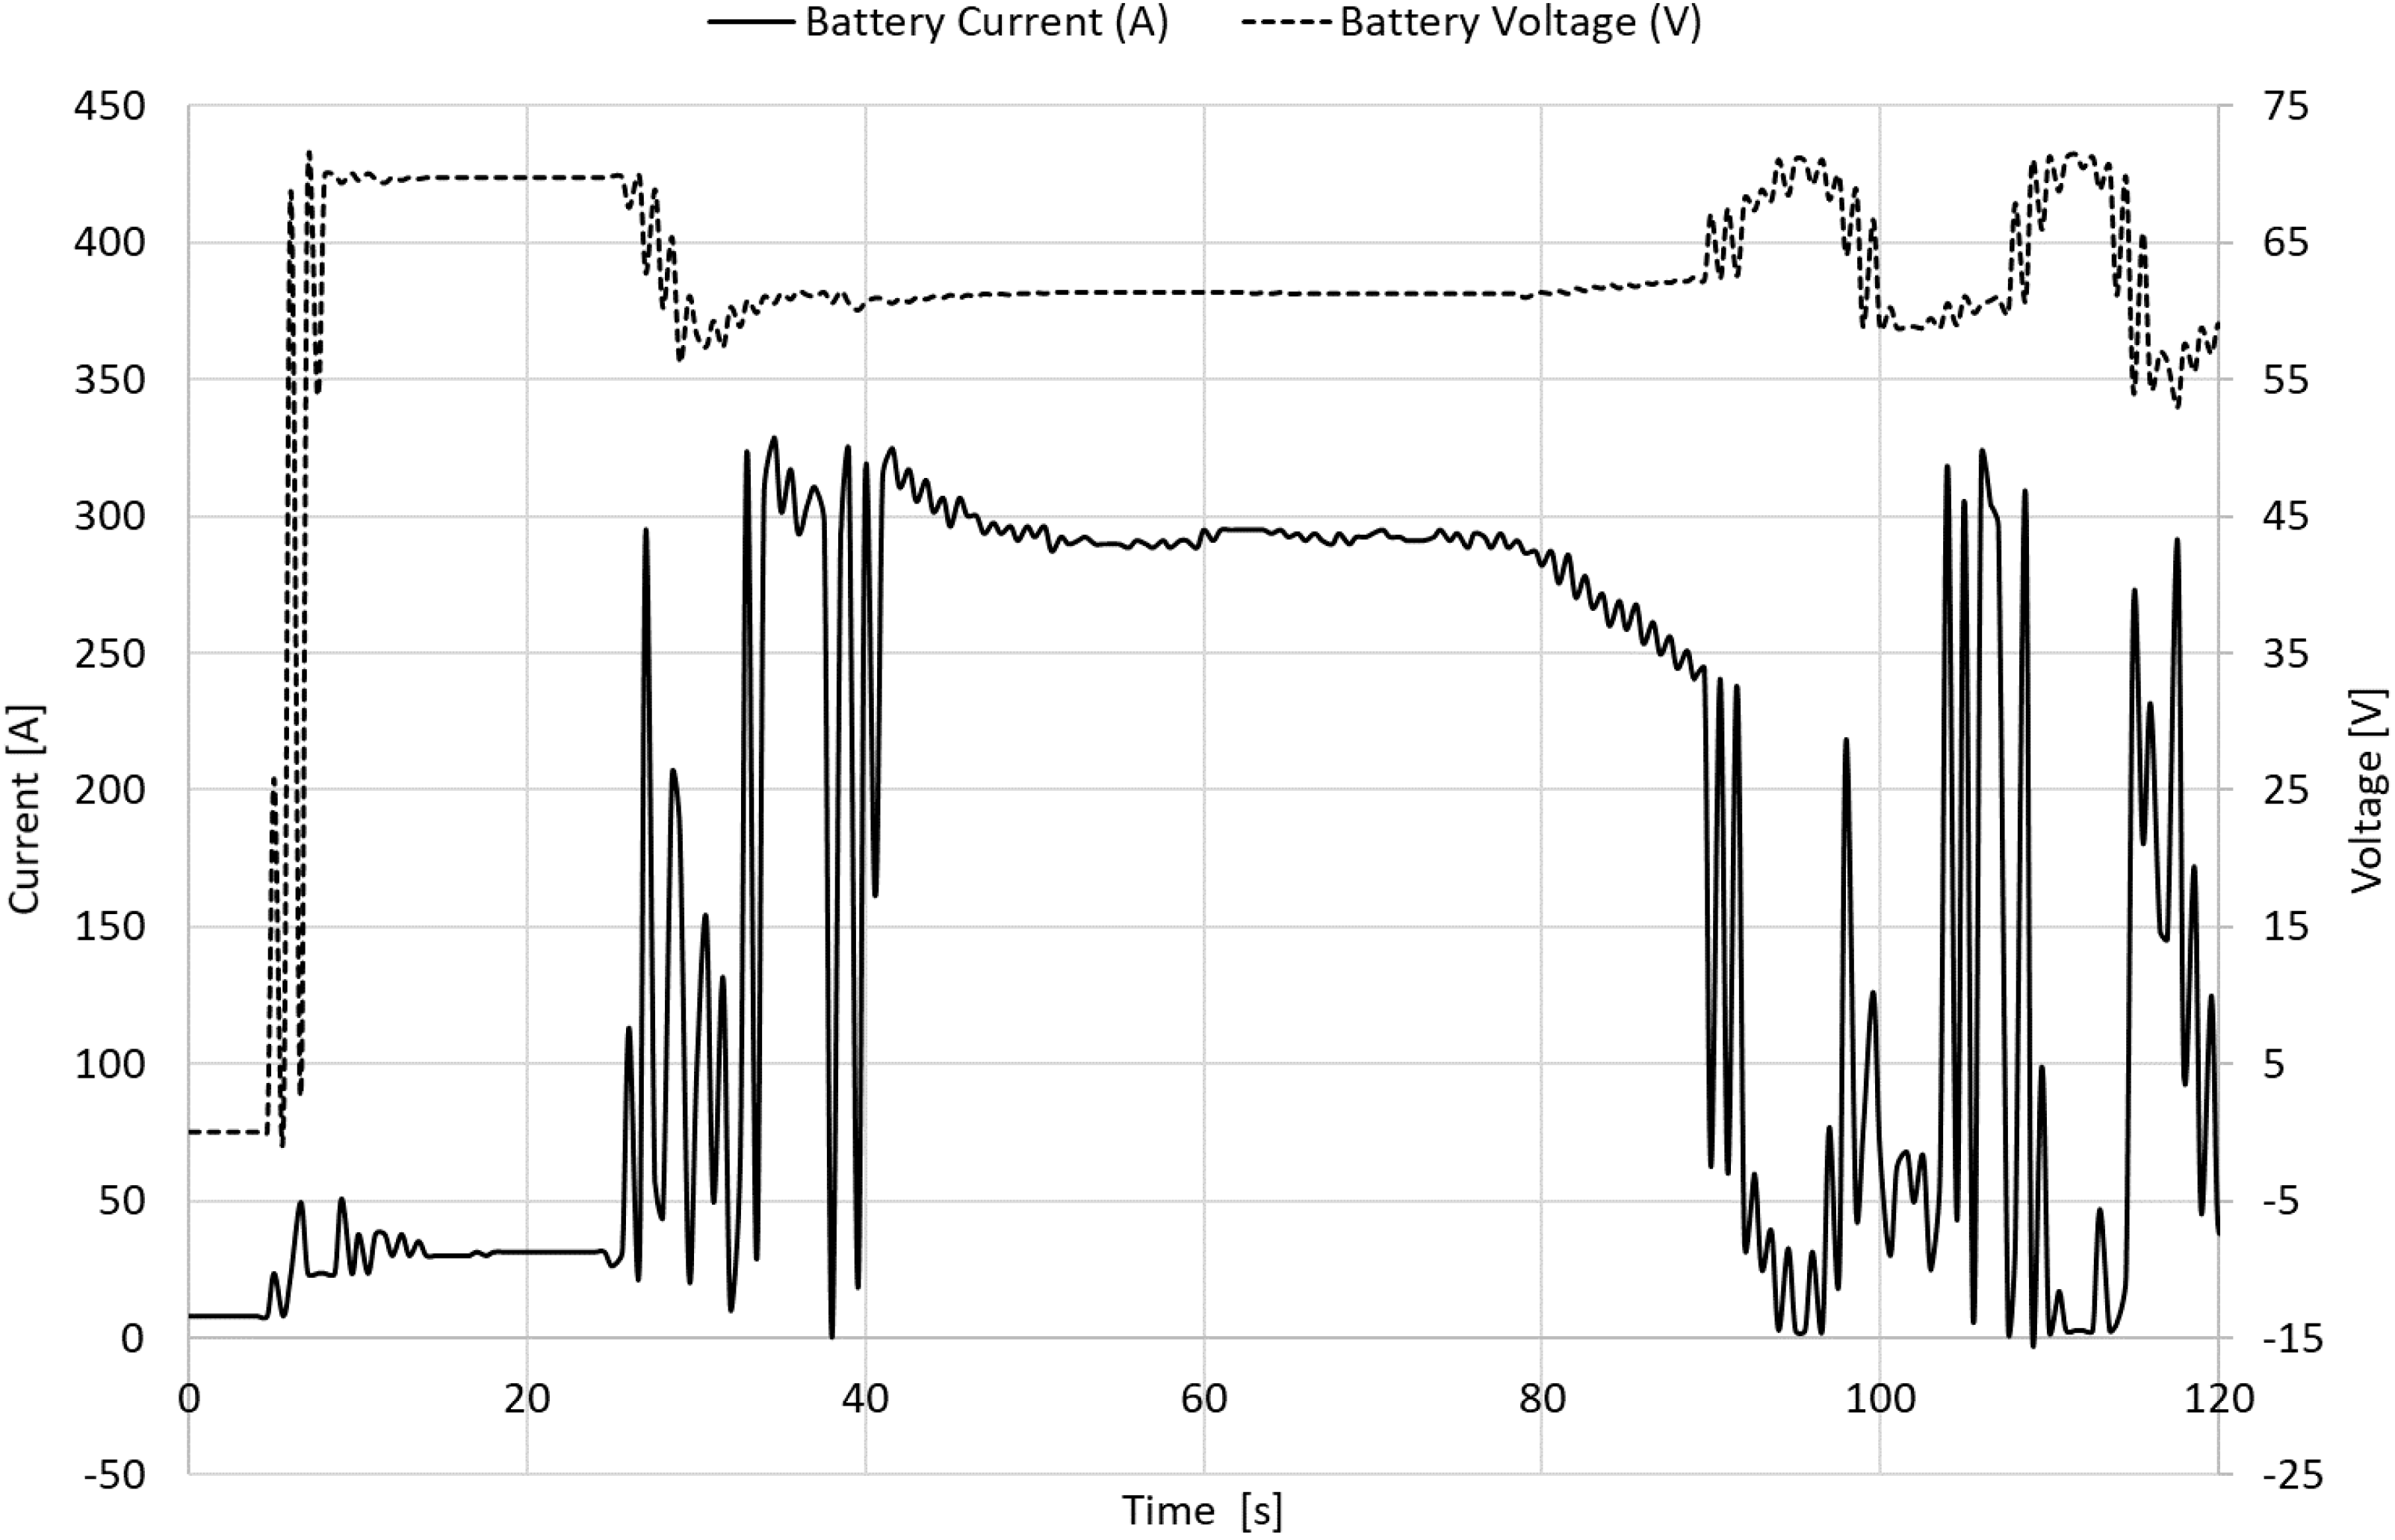
  • Maximum discharge current of whole battery pack: the lead–acid one had a greater current (330 A against 280 A). Thanks to parallel and series connections the maximum current of whole ESS was divided among batteries, so each lead–acid ESS achieved up to 50 A of maximum current, while lithium-ion achieved up to 70 A.
  • Voltage range: The lead–acid battery had about 20 V (from 53 V to 73 V), whereas the lithium-ion battery had 8 V (from 73 V to 81 V)
The lowest value of minimum voltage is probably due to high-power-request battery with degraded state of health or even low levels of SOC. These low-voltage situations cause malfunctioning in auxiliary devices (i.e., DC–DC converters, steering pump, brake pump, relays, etc.) and increase currents.
Such situation starts a chain reaction that alters the battery composition. A given power request with lower voltage means higher current (in comparison with another one at higher voltage). The higher current, in turn, means higher losses in heating and further lower voltage (due to rise of internal resistances) and again much higher current.
Table 2 shows the results of a few rides for P2; that needs 422 Wh of energy per kilometer.

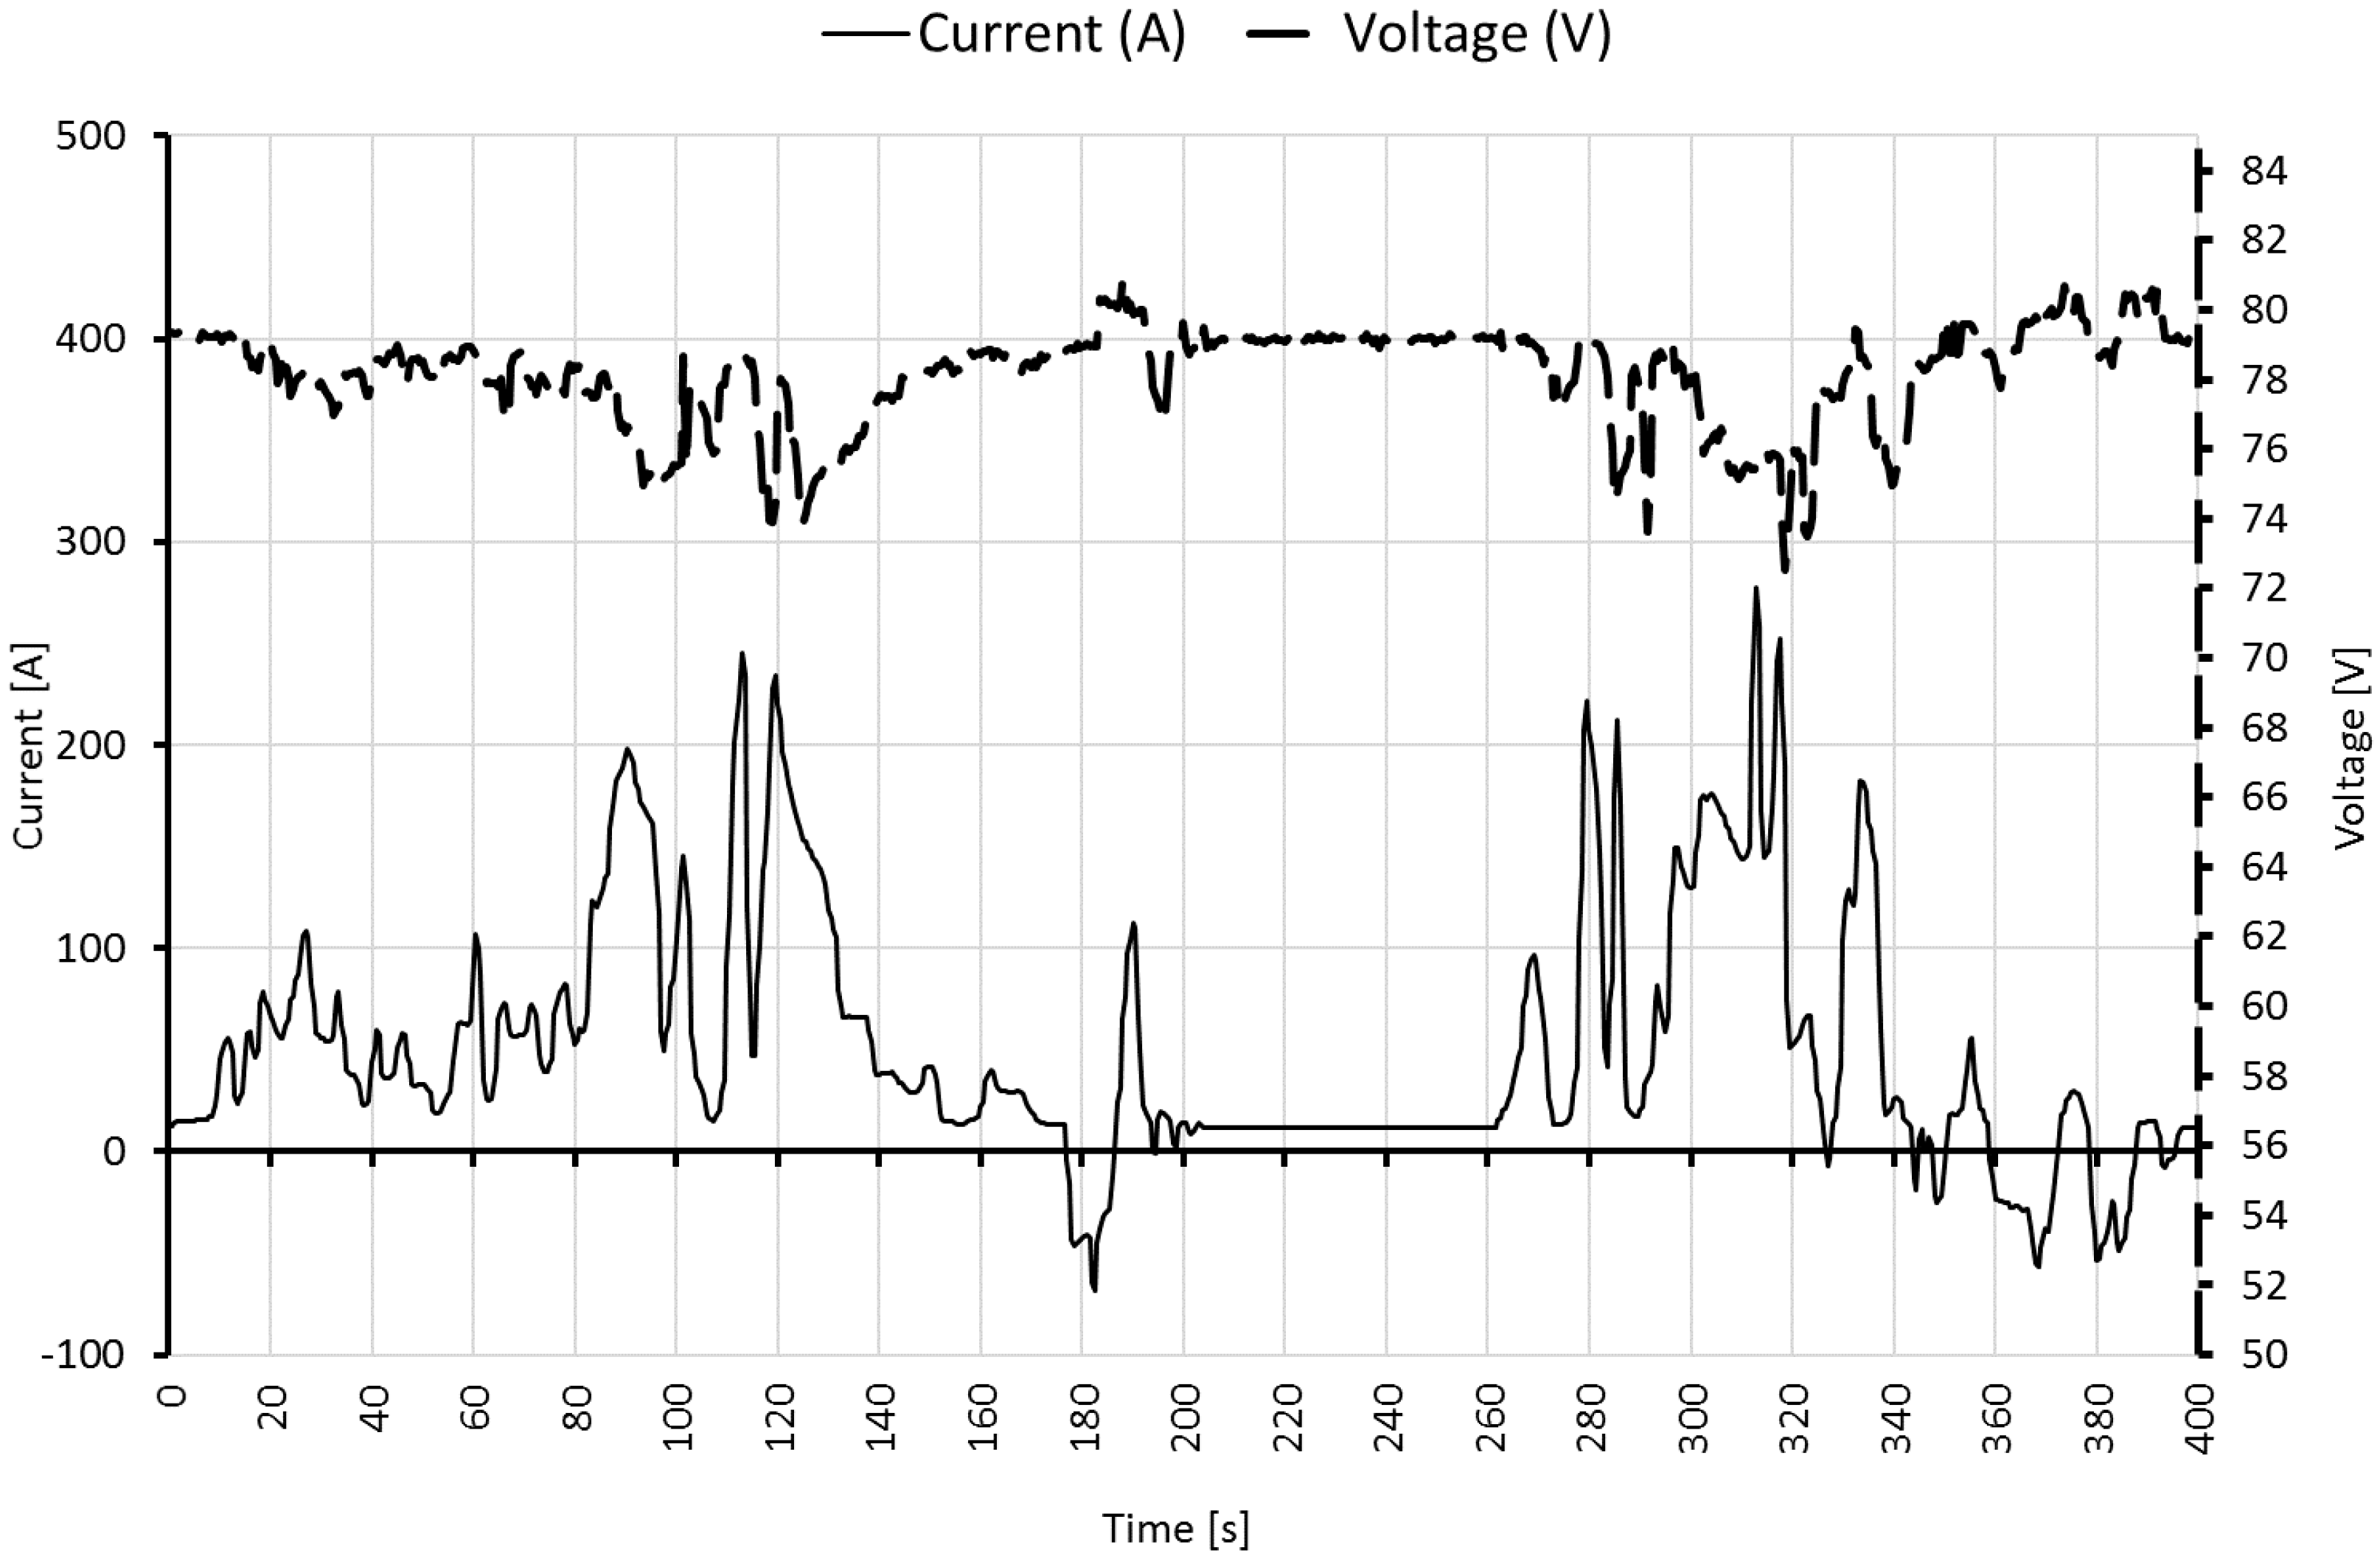
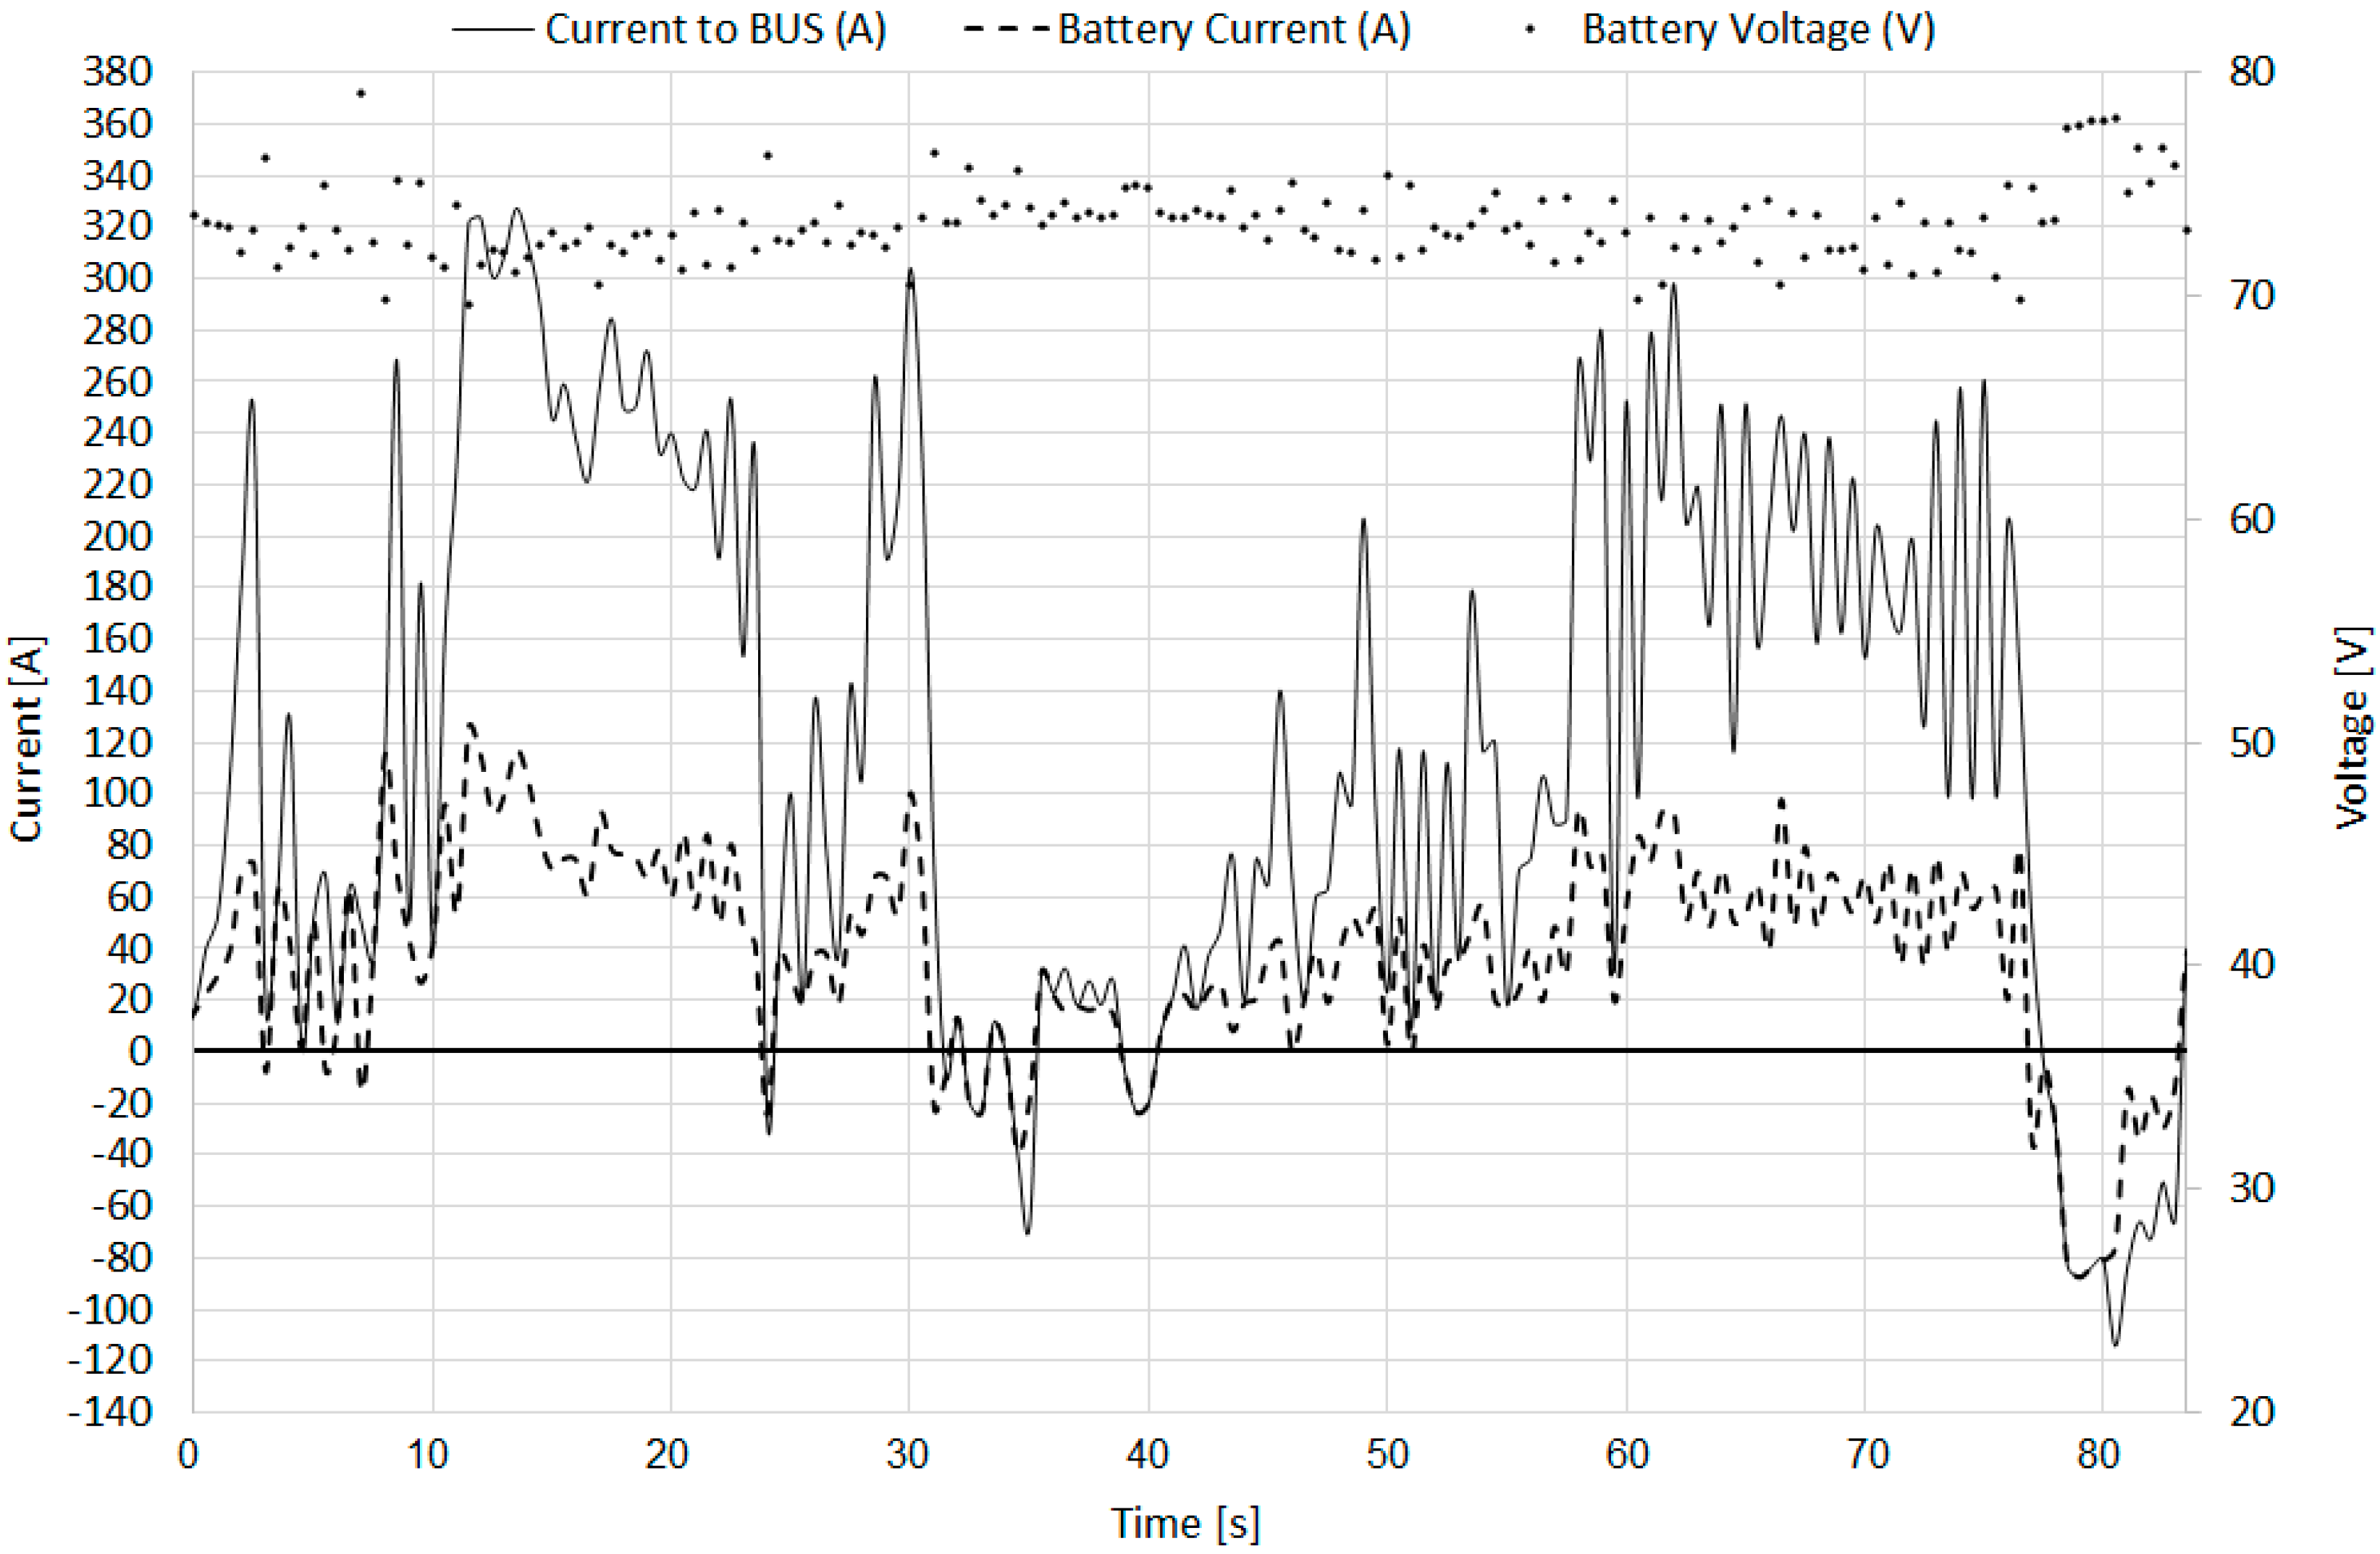
2.3. Project 3 (P3): Hybrid Storage SC and AGM Batteries

Figure 9 shows the prototype while it charged at bus stop. The project design was published [28,29,30].
The bus was equipped with a hybrid storage system composed of AGM batteries and supercapacitors. The goal of this project was to develop a flash charging technology for public transport that can charge small quantities of energy very quickly at every stop.
The SC provides through the DC–DC converters some energy directly to the chopper, reducing the energy provided by the battery [31,32].
Figure 10 shows voltage and current trends during charging. This phase lasts 45 s and charges up to 302 Wh, current reaches 350 A. Supercapacitor voltage ranges from 200 V to 375 V. These features can be further improved by optimizing the charging phase; after some tests, an optimistic hypothesis is 20 s (to be validated).
This project requires a charging station at least every 600 m. Larger distances between two charging station can deplete the energy stored on board [33].
Table 3 shows main results of experimental campaign, it also shows more parameters than previous projects due to a larger number of installed sensors (i.e., DC–DC converters and SC).
Every hour the control strategy of DC–DC drains 35 Ah from the battery, so this prototype guarantees an autonomy of 3 h, or about 35 km, if the battery capacity is 120 Ah as in the P3 prototype. After that, it requires a slow full charge of AGM battery.
This project tested only a few strategies to manage the hybrid storage; a next step will be to reduce the current drained from the battery in order to increase its life.
Further developments come from using different strategies in order to keep the energy provided by battery close to zero, for example a depleting strategy allows to fulfil daily mileage required.
Figure 11 shows that the maximum current drained from the hybrid storage is about 320 A, 100 A of which are provided by the battery. The maximum current provided by the battery is the main difference between P3 and previous P1 and P2. Moreover, it brings a great benefit to lead–acid battery that has less voltage fluctuation (between 69 V and 78 V) than P1.

3. Results Comparison

This chapter compares the results of the three described energy storage systems installed on the same bus, with nominal specification described in Table 4. The comparison refers to those systems that offer the same transport service of 100 km per day (300 day per year). The bus powertrain remains the same, the traction motor requires 25 kW during peak request and 20 kW continuously.
Each prototype had a different weight, due to different technology installed, from batteries (SC if present), BMS, mechanical supplementary frame, pantograph, to additional electronics, etc. Weights are detailed in Table 5. Such differences of weight could affect performances. Hence, it was conducted tests of maximum speed, maximum acceleration and time from zero to maximum speed. The results indicate that there were no relevant differences, all buses reach 33 km/h in 60 s with a maximum acceleration of 0.6 m/s2.
The comparison shown in Figure 12 allows to assume the same average consumption, independently from technology. Due to minimum differences measured during tests, it could be different due to phenomena such as orography, payload, driving behavior, etc. Hence, the adoption of the same energy consumption value is a conservative choice. Figure 12 shows the average consumption versus the average speed trend, during different missions for the three projects P1, P2 and P3. The cloud is denser for P1, due to the large amount of data.
A slight difference in average consumption, e.g., of about 0.1 kWh/km (20% of average consumption), corresponds to consumption of 10 kWh per day and 3000 kWh per year.
The average energy cost depends on market factors and power requirements; in Italy, this value is between 0.1 and 0.3 Euro per kWh, leading to a cost of 300 to 900 Euro per year.
Hence, the economic value of energy is negligible in comparison with the battery itself.
Table 6 shows a comparison of parameters (partly proposed by [34]), costs and results.
Table 6 is divided into main components: battery, supercap and charger; each component is detailed in the following.
Battery parameters are:
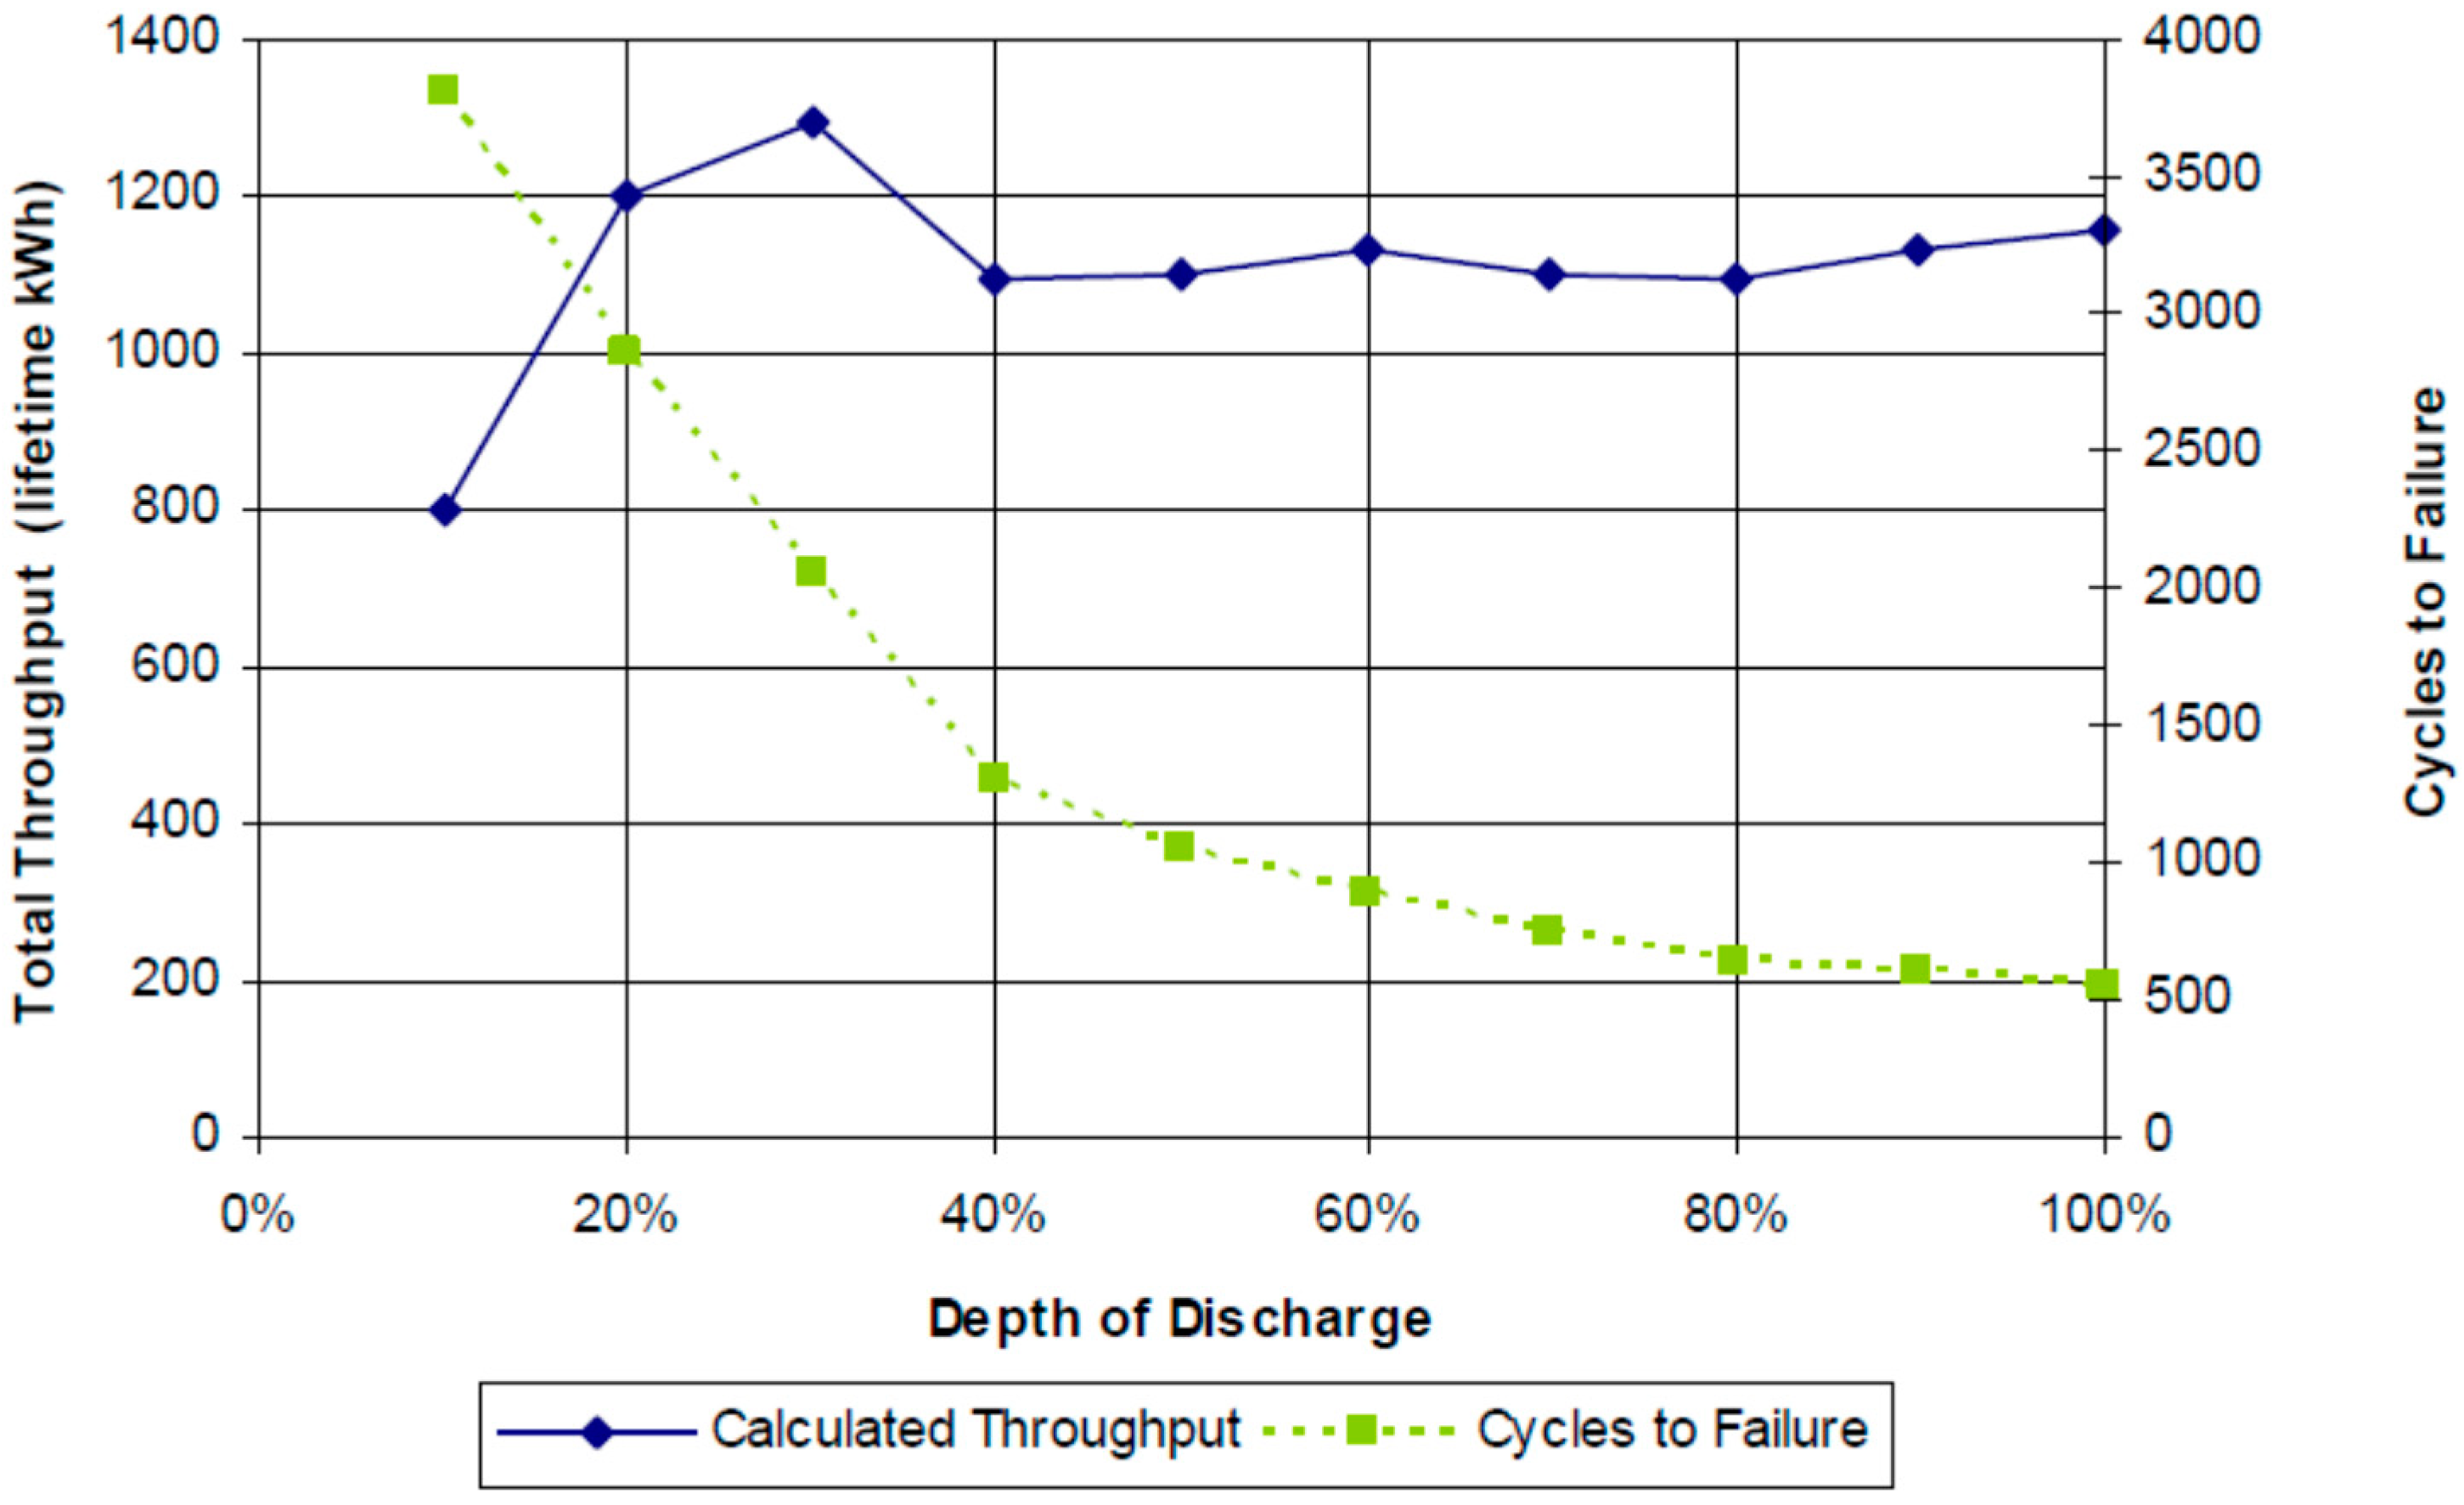
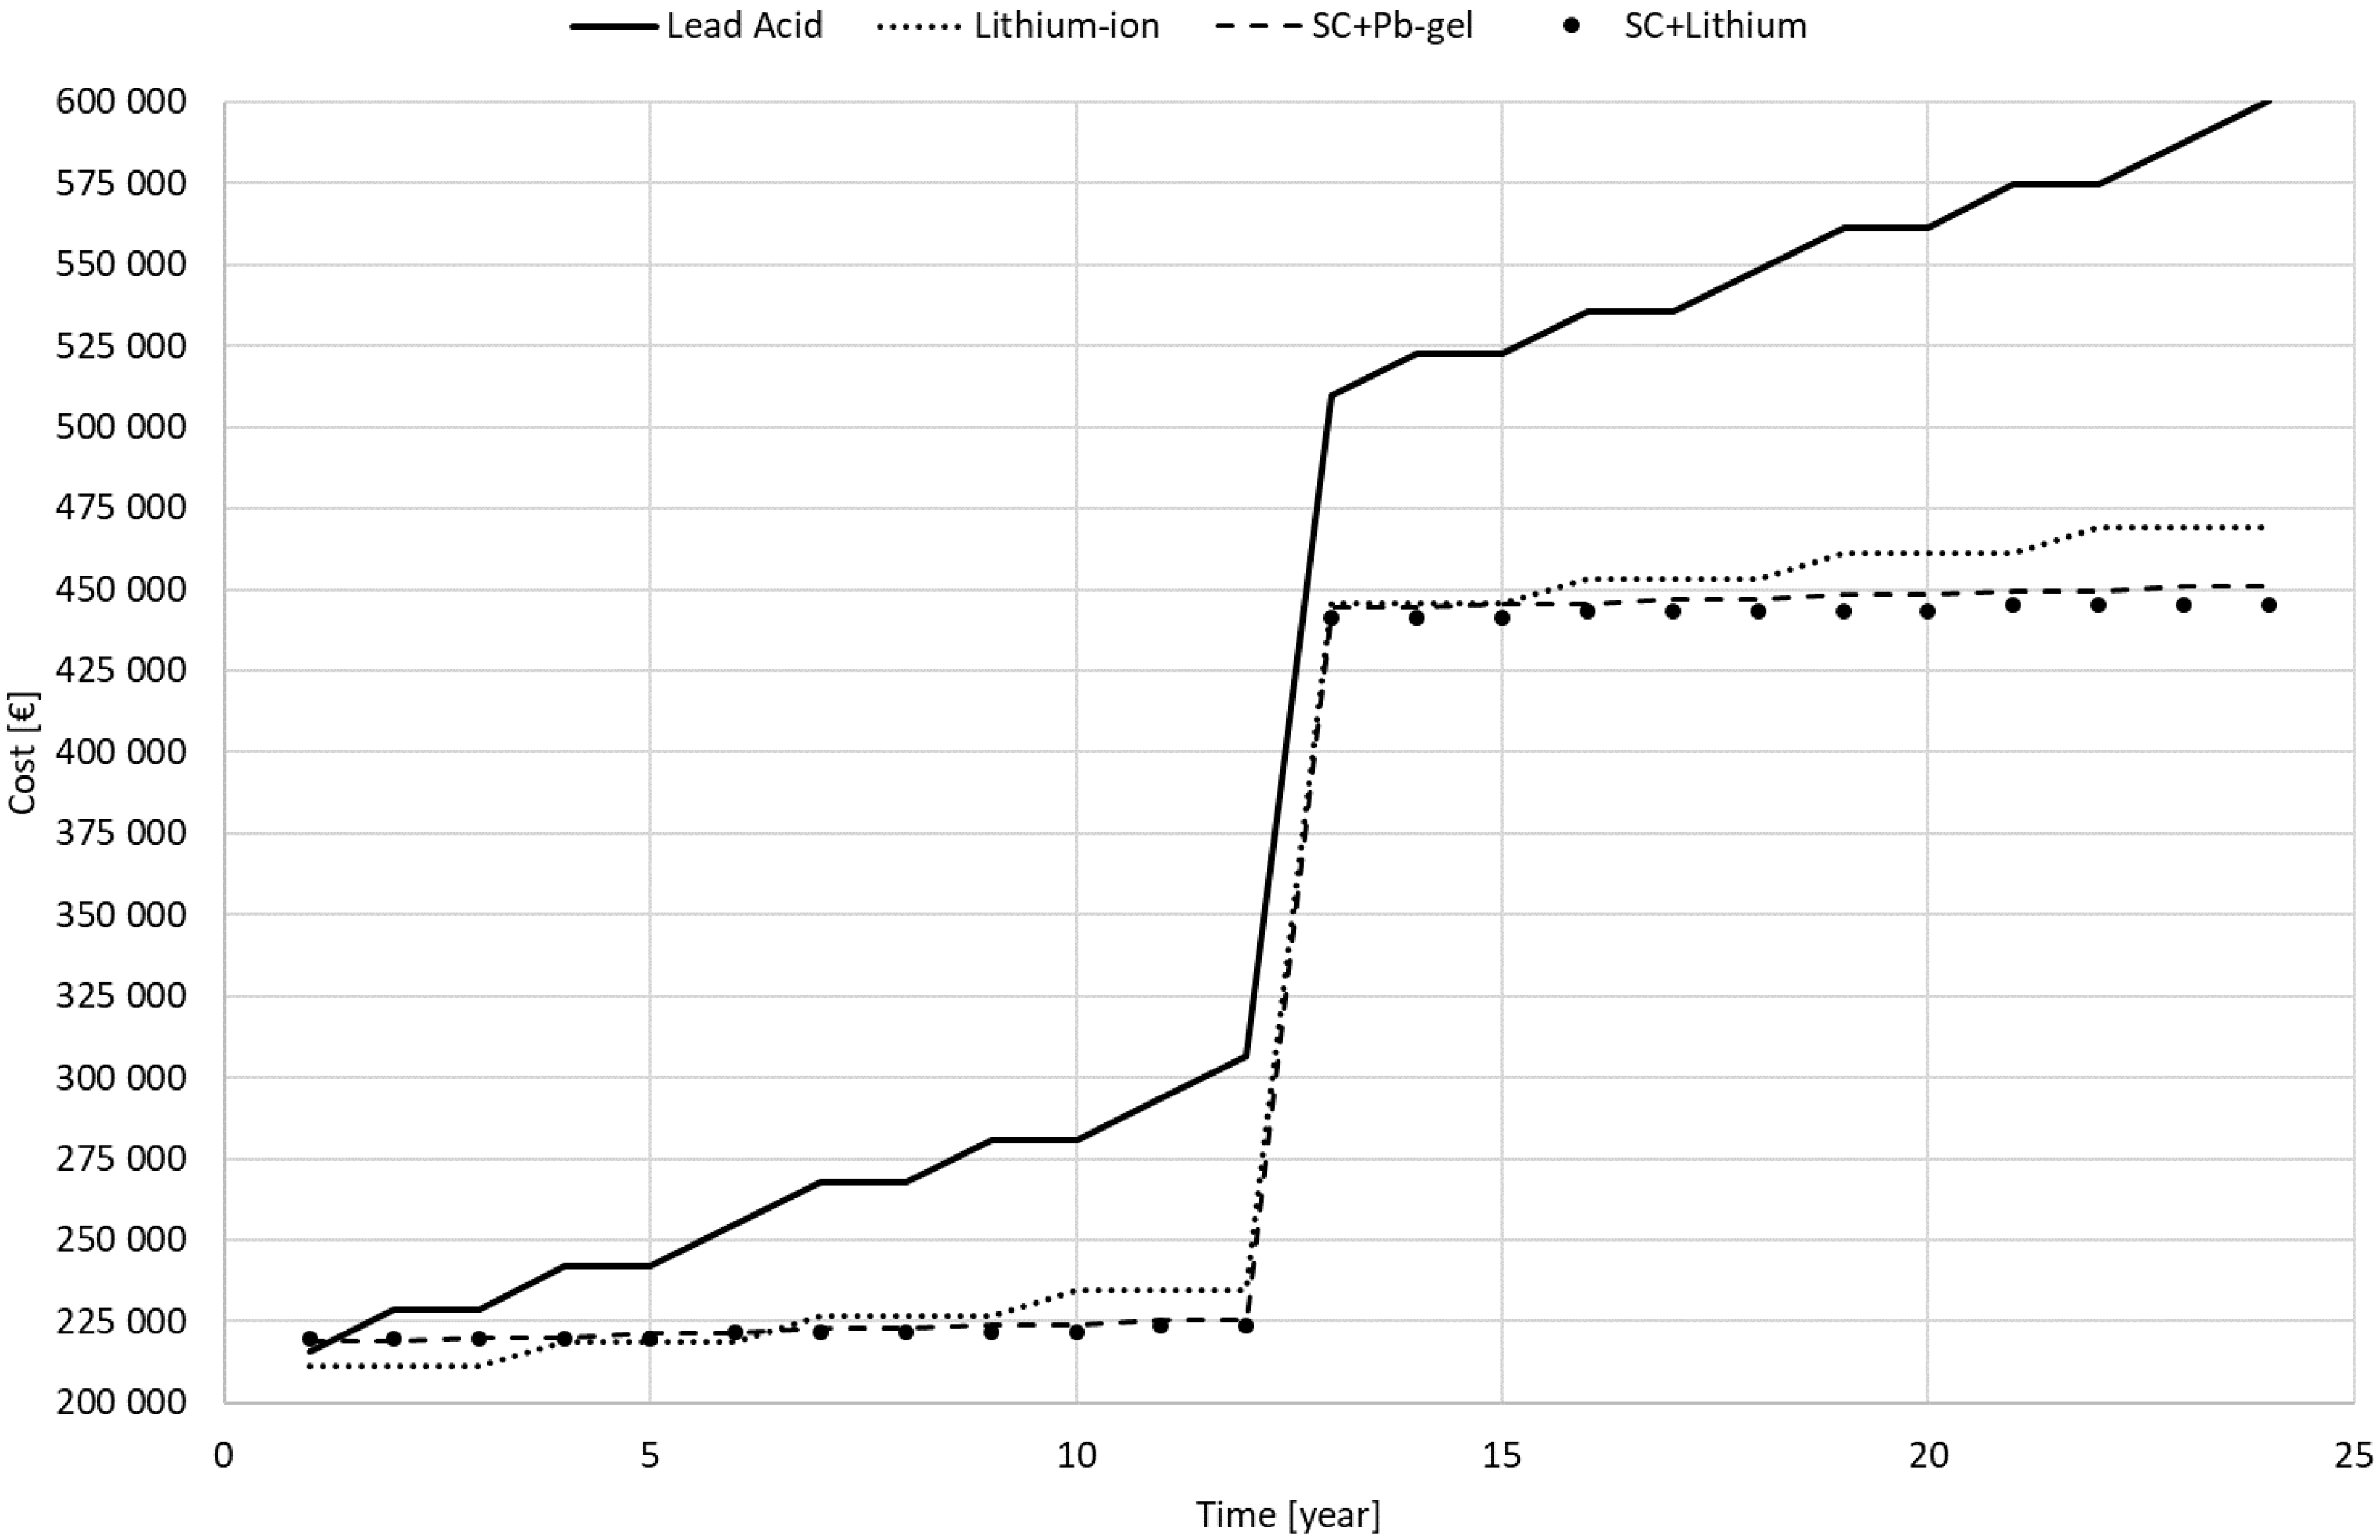
  • Lifecycle of P1 and P2 comes from project results.
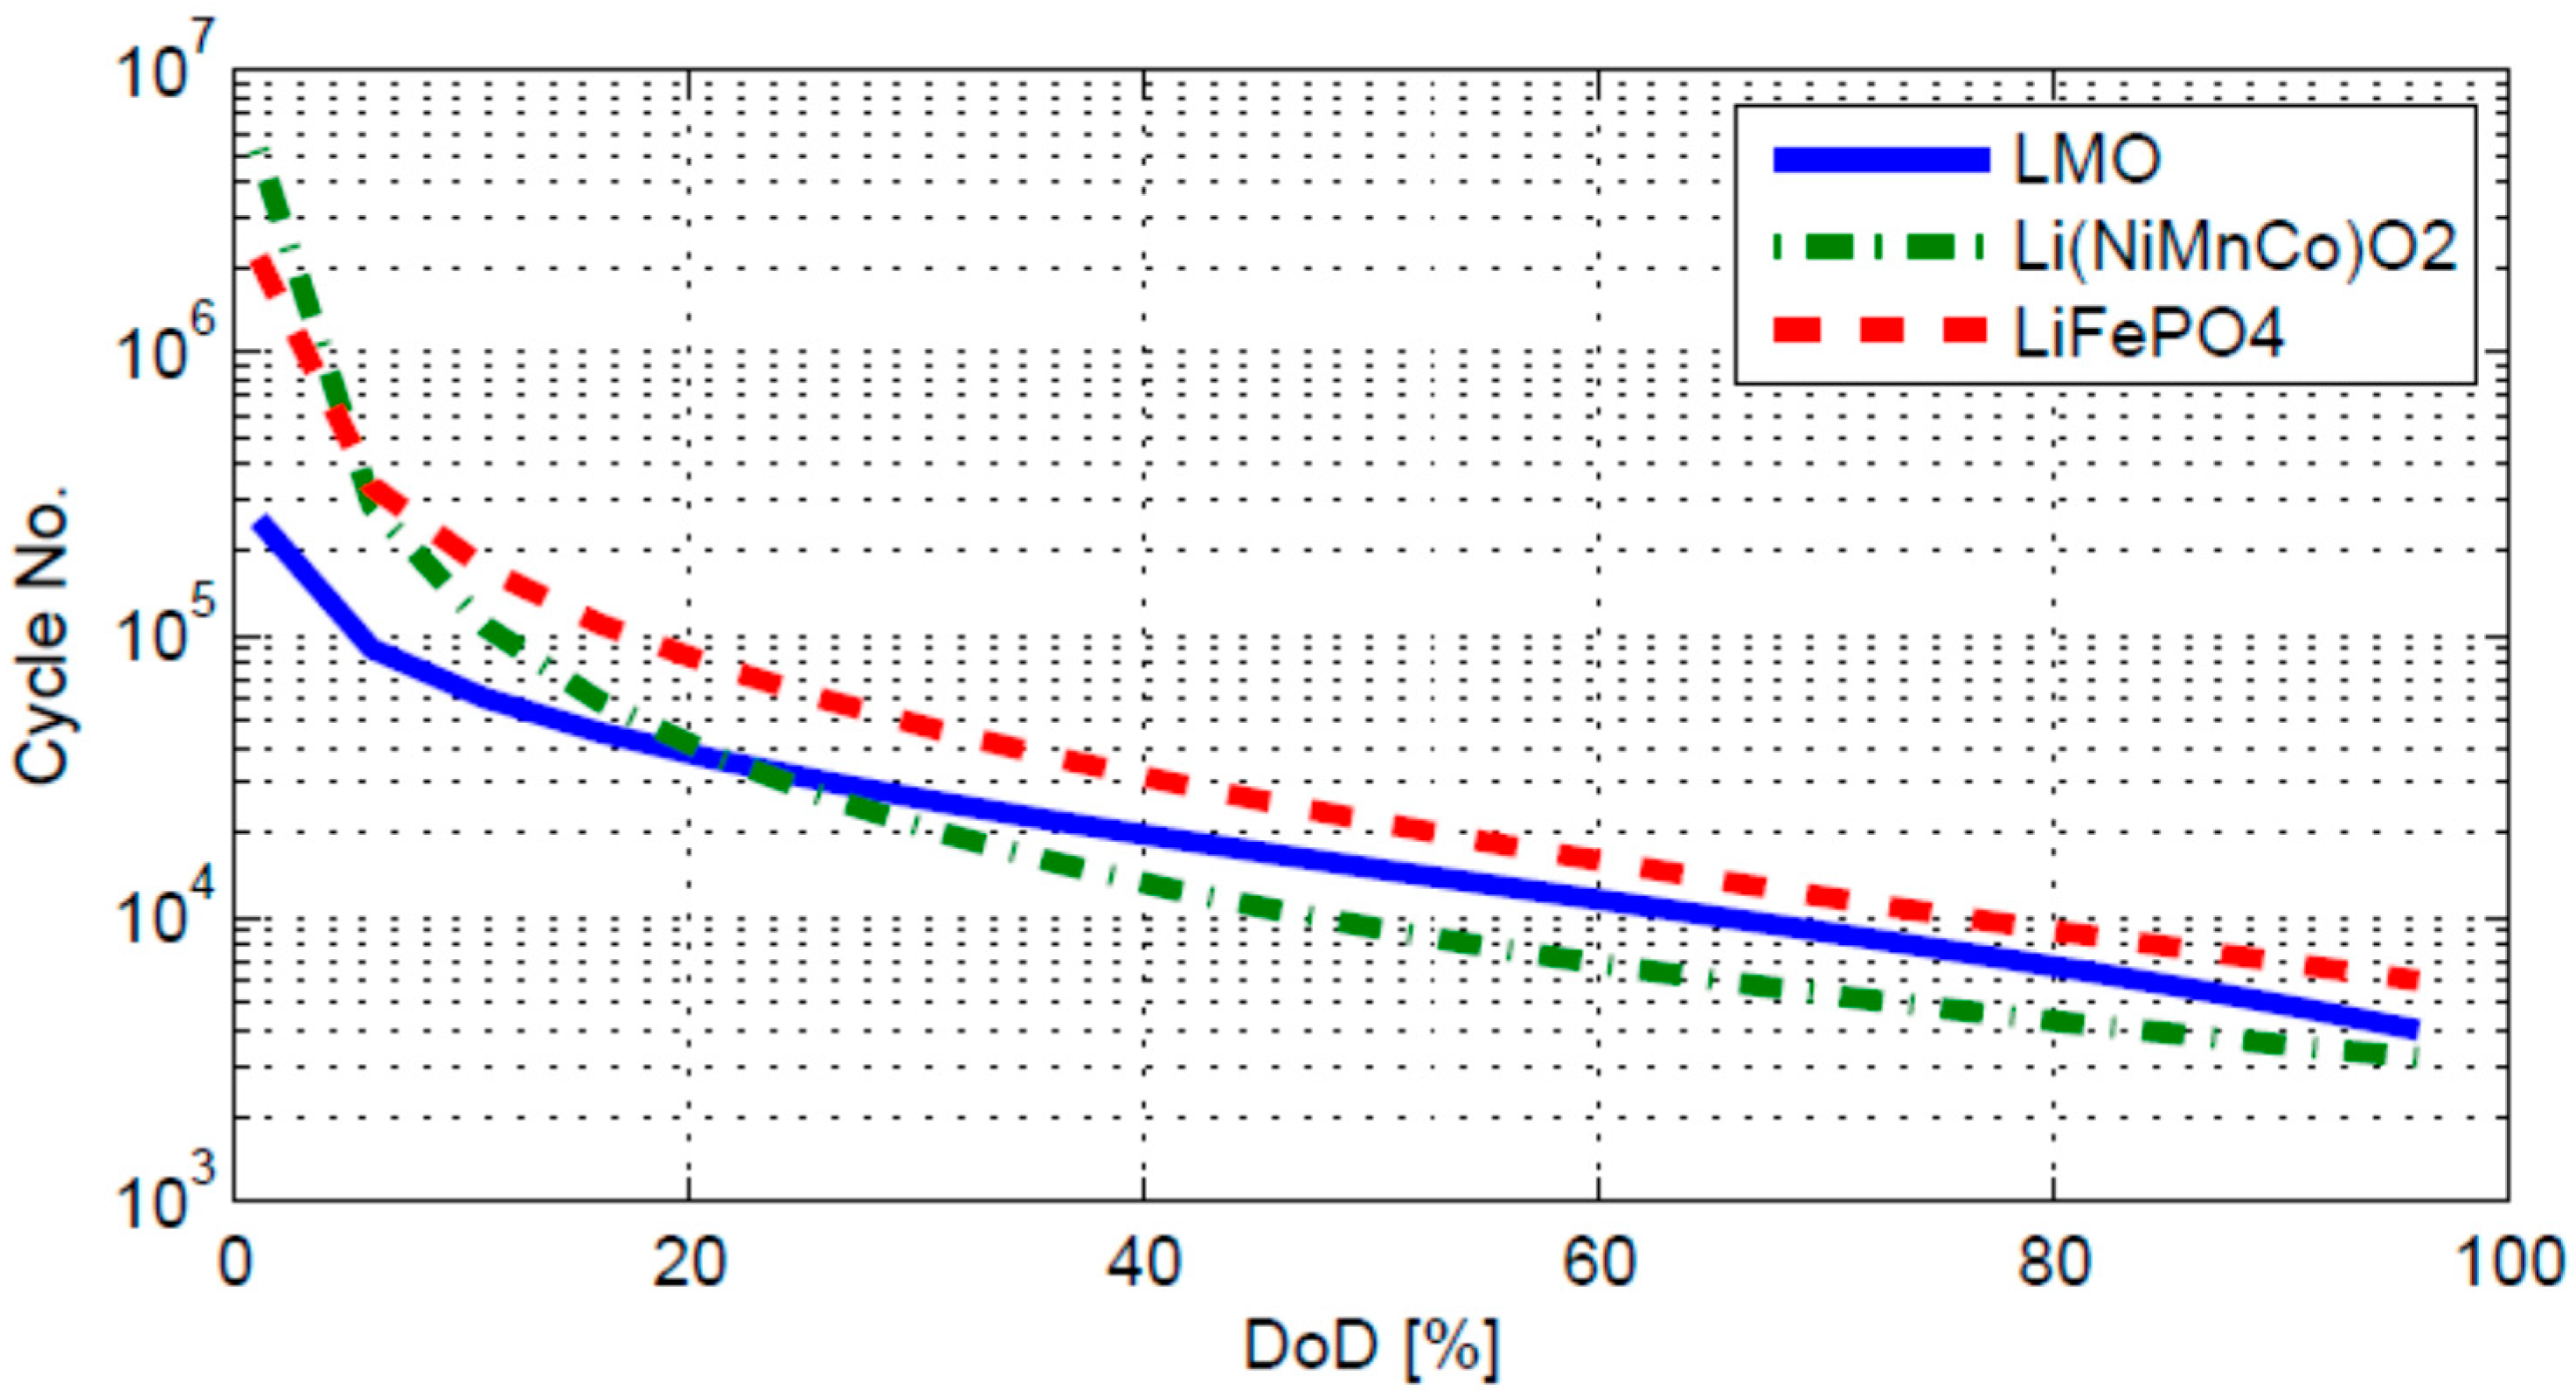
  • Lifecycle of P3 is an estimation based on theory [22] and a maximum DoD of 20%.
  • Lifecycle of P4 is evaluated with a mixed approach from theory and results obtained in P2. The LiFePO4 battery lasts 3000 cycles at 80% of DoD, P4 uses only the 40% of DoD so according to [23] its battery lasts three times that of the P2.
  • Energy is the total energy stored in the ESS. P1 and P2 need the battery to provide power for traction motor and energy for the daily service, whereas P3 and P4 require less battery capacity. In fact, the presence of SC and fast charge feature (P3 and P4) ensure the energy needs, so, battery is dimensioned with at least 20 kW of power (to supply motor request in case of SC failure).
  • Unitary costs refer to available products on the market.
  • Range with a single charge is the maximum range without intermediate charging.
  • Number of daily full charge represents the number of charges needed daily for the required transport service; each charge refills the battery up to daily initial SoC.
  • Life is the expected time in years before replacement due to battery usage, it is the lifecycle parameter divided by annual cycles (number of daily full charge per daily of transport service, 300 days per year). But it must not exceed the battery calendar life (as in the P4, the LiFePO4 has 5 years).
Supercap parameters are:
  • Lifecycle is provided by manufacturer under nominal working conditions.
  • Energy stored is total energy of supercapacitor from maximum voltage to half voltage, as prescribed by manufacturer in order to preserve their life.
  • Unitary costs are equal to the costs paid for the prototype of P3; recent updates suggest a reduction down to 32,000 $/kWh [34,35] or even, calculated in Farad, from 1 cent €/F down to 0.1 cent€/F [36]. P3 has three modules in series of SC, each composed by forty-eight cells of 3000 F.
  • Range with a single charge is the maximum range, it considers the effective energy (up to half nominal voltage).
Charger parameters are:
  • Cost due to one bus: some chargers can be used for many buses. The cost is the same paid for prototypes, but it can be reduced with a large-scale production. In other words, the P3 was equipped with flash charge and it used a charger only for forty seconds, then charger required five minutes more to restore its energy before charging another bus. A single charger costs up to twenty thousand Euros.
The SC adoption in P3 and P4 achieves two great benefits: it reduces the maximum current and the overall energy drained by the battery, during a daily transport service. Such benefits enlarge the number of battery cycles, while reduce the amount of energy stored on board (it decreases battery dimension, weight and cost).
Figure 13 shows trends of costs for each project, included the P4 with supercapacitor and lithium batteries (represented by black dots). Figure 13 highlights when hardware replacements will occur (as bus chassis, batteries, etc.) in a twenty-four-year timeframe.
All projects have the same incomes, due to the same transport service; only the costs change from one to another. Hence, a lower cost means a better NPV.
Worth of incomes depends on factors as transport policy, economic situation, social aspects, political choices, etc. Thus, calculating the incomes is not useful since they will equally affect all systems.
Table 7 shows results of the sum between the actualized costs for the four alternatives. This parameter is used in the net present value (NPV) evaluation [12], the cost of capital is set to 3%. P4 has lower actualized costs, closer to P3. These two projects have a higher purchase cost due to SC, but they have larger lifetime. However, starting from the seventh year, the sum of costs (as shown in Figure 13) is lower than in P1 and P2.

4. Conclusions

This study compares different energy storage systems for electric minibuses. They were prototyped and tested. A cost-benefit analysis was carried out to compare the different solutions from two points of view: economic and performance.
The compared solutions are based on experimental data of four projects (from to P1 to P4). The performance analysis shows that each prototype reaches maximum speed of 33 km/h in 60 s with same maximum acceleration of 0.6 m/s2.
By economic point of view, the best choice is SC + lithium, which has the lowest actualized costs (so the best NPV), but they are close to SC + Pb. These results can change with fluctuation of product prices. Moreover, expected lifecycle of batteries must be demonstrated under several different conditions that were at this stage hypothesized. Indeed, P2 and P3 have both a large cost reduction compared to P1, so, P4 joins their technical advantages and have at same time a favorable actualized cost.
Technology choices in transport must consider several technical factors, i.e., in case of failure of supercapacitors, the battery must guarantee enough range to reach next stop or even to return to the depot. Other important factors are the capabilities of fast charging and the high power.
Based to the aforementioned considerations indicate P4 as the best option. lithium-ion battery coupled with SC guarantees required energy, sufficient power and highest charging rates.
Further developments may come from new testing campaigns to demonstrate the lifecycle increasing of a LiFePO4 battery combined with SC (as hypothesized in P4)—or even with a new battery chemistry. Experimental counting of the number of cycles will allow a realistic evaluation of battery life and could enrich the current economic evaluation.

Author Contributions

All the authors equally contributed to state-of-the-art survey, prototype project and experiments design. A.G. acquired funding and supervised, A.A. and F.O. managed resources and administrated projects. The data curation was conducted by L.B., R.B., F.C. and L.P. Moreover, L.B., F.O. and L.P. developed software required to manage electronic devices. F.C. together with L.P. and R.B. validated the results. All authors have read and agreed to the published version of the manuscript.

Funding

This research was funded by Italian Ministry for Economic Development (MISE), program agreement MISE-ENEA 2015–2017.

Conflicts of Interest

The authors declare no conflict of interest. The funders had no role in the design of the study; in the collection, analyses or interpretation of data; in the writing of the manuscript or in the decision to publish the results.

References

  1. Aneke, M.; Wang, M. Energy storage technologies and real life applications—A state of the art review. Appl. Energy 2016, 179, 350–377. [Google Scholar] [CrossRef] [Green Version]
  2. Peng, H. Charging Infrastructures for Electric Buses; Politecnico di Milano: Milan, Italy, 2019. [Google Scholar]
  3. Korkmaz, E. Technically and Economically Viable Future Electricity and Fuel Storage Technologies. Available online: https://aaltodoc.aalto.fi/handle/123456789/40806 (accessed on 20 January 2020).
  4. European Commission. A Policy Framework for Climate and Energy in the Period from 2020 to 2030. Available online: https://eur-lex.europa.eu/legal-content/EN/TXT/?uri=COM%3A2014%3A15%3AFIN (accessed on 20 January 2020).
  5. European Commission. A Roadmap for Moving to a Competitive Low Carbon Economy in 2050. Available online: http://www.europarl.europa.eu/meetdocs/2009_2014/documents/com/com_com(2011)0112_/com_com(2011)0112_en.pdf (accessed on 20 January 2020).
  6. Green Car Congress. Number of Electric Buses in Europe has Increased from Around 200 to 2200 in 5 years. BusWorld. Available online: https://www.greencarcongress.com/2019/10/20191020-busworld.html (accessed on 20 January 2020).
  7. European Automobile Manufacturers’ Association (ACEA). ACEA Report: Vehicles in Use. 2019. Available online: https://www.acea.be/uploads/publications/ACEA_Report_Vehicles_in_use-Europe_2019.pdf#page=7 (accessed on 20 January 2020).
  8. Quéromès, A.; Vogelaar, M.; Huisman, R. Electric Bus Fleets in Europe. Available online: https://www.accuracy.com/wp-content/uploads/2020/01/Perspectives-Print-Electric-bus-v1_anglais.pdf (accessed on 23 January 2020).
  9. Alessandrini, A.; Cignini, F.; Ortenzi, F.; Pede, G.; Stam, D. Advantages of retrofitting old electric buses and minibuses. Energy Procedia 2017, 126, 995–1002. [Google Scholar] [CrossRef]
  10. Italian Minister for Economic Development (MISE). DECRETO 1 Dicembre 2015, n. 219. 2016. Available online: https://www.gazzettaufficiale.it/eli/id/2016/01/11/15G00232/sg (accessed on 23 January 2020).
  11. Parragh, S.N.; Doerner, K.F.; Hartl, R.F. Demand Responsive Transportation. In Wiley Encyclopedia of Operations Research and Management Science; Wiley Online Library: Hoboken, NJ, USA, 15 February 2011; Online ISBN 9780470400531. [Google Scholar]
  12. Ricci, S. Tecnica ed Economia dei Trasporti; Hoepli: Milano MI, Italy, 1 March 2011. [Google Scholar]
  13. Ortenzi, F.; Pasquali, M.; Prosini, P.P.; Lidozzi, A.; di Benedetto, M. Design and Validation of Ultra-Fast Charging Infrastructures Based on Supercapacitors for Urban Public Transportation Applications. Energies 2019, 12, 2348. [Google Scholar] [CrossRef] [Green Version]
  14. Pede, G.; Vellucci, F. Fast-Charge Life Cycle Test on a Lithium-Ion Battery Module. World Electr. Veh. J. 2018, 9, 13. [Google Scholar]
  15. Cantarella, G.E. Sistemi di Trasporto: Tecnica ed Economia; UTET: Torino, Italy, 2007. [Google Scholar]
  16. Cartenì, A. Processi decisionali and Pianificazione dei Trasporti; Lulu Press, Inc.: Morrisville, NC, USA, 16 September 2016. [Google Scholar]
  17. Sheth, A.; Sarkar, D. Life cycle cost analysis for electric vs diesel bus transit in an indian scenario. Int. J. Technol. 2019, 10, 105–115. [Google Scholar] [CrossRef] [Green Version]
  18. Potkány, M.; Hlatká, M.; Debnár, M.; Hanz, J. Comparison of the Lifecycle Cost Structure of Electric. Naše More 2018, 65, 270–275. [Google Scholar] [CrossRef]
  19. Wikner, E. Lithium ion Battery Aging: Battery Lifetime Testing and Physics-based Modeling for Electric Vehicle Applications. Ph.D. Thesis, Chalmers University of Technology, Göteborg, Sweden, 2017. [Google Scholar]
  20. Miranto, A. BU-1003a: Battery Aging in an Electric Vehicle (EV). Battery University. Available online: https://batteryuniversity.com/learn/article/bu_1003a_battery_aging_in_an_electric_vehicle_ev (accessed on 13 February 2020).
  21. Ortenzi, F.; Pede, G.; Prosini, P.P.; Andrenacci, N. Ageing effects on batteries of high discharge current rate. In EVS30 Symposium; Landesmesse Stuttgart GmbH: Stuttgart, Germany, 2017. [Google Scholar]
  22. Bindner, H.; Lundsager, P.; Cronin, T.; Manwell, J.F.; Abdulwahid, U.; Baring-Gould, I. Lifetime Modelling of Lead Acid Batteries; Forskningscenter Risoe: Roskilde, Denmark, 2005. [Google Scholar]
  23. Xu, B.; Oudalov, A.; Andersson, G.; Ulbig, A. Modeling of Lithium-Ion Battery Degradation for Cell Life Assessment. IEEE Trans. Smart Grid 2016, 9, 1131–1140. [Google Scholar] [CrossRef]
  24. Jongerden, M.; Haverkort, B. Battery Modeling; (CTIT Technical Report Series; No. TR-CTIT-08-01); Design and Analysis of Communication Systems (DACS): London, UK, 2008. [Google Scholar]
  25. Yang, X.-G.; Zhang, G.; Ge, S.; Wang, C.-Y. Fast charging of lithium-ion batteries at all temperatures. Proc. Natl. Acad. Sci. USA 2018, 115, 7266–7271. [Google Scholar] [CrossRef] [PubMed] [Green Version]
  26. Baronti, F.; di Rienzo, R.; Moras, R.; Roncella, R.; Saletti, R.; Pede, G.; Vellucci, F. Implementation of the fast charging concept for electric local public transport: The case-study of a minibus. In Proceedings of the IEEE 13th International Conference on Industrial Informatics (INDIN), Cambridge, UK, 22–24 July 2015. [Google Scholar]
  27. di Rienzo, R.; Baronti, F.; Vellucci, F.; Cignini, F.; Ortenzi, F.; Pede, G.; Roncella, R.; Saletti, R. Experimental analysis of an electric minibus with small battery and fast charge policy. In Proceedings of the 2016 International Conference on Electrical Systems for Aircraft, Railway, Ship Propulsion and Road Vehicles & International Transportation Electrification Conference (ESARS-ITEC), Toulouse, France, 2–4 November 2016. [Google Scholar]
  28. Cignini, F.; Genovese, A.; Ortenzi, F.; Alessandrini, A.; Barbieri, R.; Berzi, L.; Locorotondo, E.; Pierini, M.; Pugi, L. Design of a Hybrid Storage for Road Public Transportation Systems. In IFToMM ITALY; Springer: Cham, Switzerland, 2018. [Google Scholar]
  29. Ortenzi, F.; Pasquali, M.; Pede, G.; Lidozzi, A.; Benedetto, M. Ultra-fast charging infrastructure for vehicle on-board ultracapacitors in urban public transportation applications. In EVS31, EVTeC and APE; Society of Automotive Engineers of Japan, Inc.: Kobe, Japan, 2018. [Google Scholar]
  30. Cignini, F.; Genovese, A.; Ortenzi, F.; Alessandrini, A.; Barbieri, R.; Berzi, L.; Locorotondo, E.; Pierini, M.; Pugi, L.; Baldanzini, N.; et al. Structural and energy storage retrofit of an electric bus for high-power flash recharge. Procedia Struct. Integr. 2019, 24, 408–422. [Google Scholar]
  31. Alessandrini, A.; Cignini, F.; Barbieri, R.; Berzi, L.; Pugi, L.; Pierini, M. Progettazione and Test di un Sistema Ibrido SC-accumulo per la Ricarica Rapida di un bus Alle Fermate; ENEA: Rome, Italy, 2018. [Google Scholar]
  32. Alessandrini, A.; Cignini, F.; Barbieri, R.; Berzi, L.; Pugi, L.; Genovese, A.; Pierini, M.; Locorotondo, E. A Flash Charge System for Urban Transport. In Proceedings of the International Conference on Environment and Electrical Engineering and 2019 IEEE Industrial and Commercial Power Systems Europe (EEEIC/I&CPS Europe), Genova, Italy, 11–14 June 2019. [Google Scholar]
  33. Ortenzi, F.; Pede, G.; Orchi, S. Technical and economical evalutation of hybrid flash-charging stations for electric public transport. In Proceedings of the 2017 IEEE International Conference on Industrial Technology (ICIT), Toronto, ON, Canada, 22–25 March 2017. [Google Scholar]
  34. Mongird, K.; Fotedar, V.; Viswanathan, V.; Koritarov, V.; Balducci, P.; Hadjerioua, B.; Alam, J. Energy Storage Technology and Cost Characterization Report; HydroWIRES; Pacific Northwest National Lab.(PNNL): Richland, WA, USA, 2019. [Google Scholar]
  35. Conte, M.; Ortenzi, F.; Genovese, A.; Vellucci, F. Hybrid battery-supercapacitor storage for an electric forklift: A life-cycle cost assessment. J. Appl. Electrochem. 2014, 44, 1–10. [Google Scholar] [CrossRef]
  36. Skeleton Technologies GmbH. A new approach for ultracapacitor-battery hybrid energy storage solutions. In International Workshop on Supercapacitors and Energy Storage; Skeleton Technologies GmbH: Bologna, Italy, 2019. [Google Scholar]
Figure 1. Project prototypes: P1 (a), P2 (b) and P3 (c).
Batteries 06 00026 g001
Figure 2. Lead–acid battery behavior [22].
Batteries 06 00026 g002
Figure 3. Effects of DoD to a few types of lithium battery [23].
Batteries 06 00026 g003
Figure 4. Rate capacity effect [24] with a lead–acid battery.
Batteries 06 00026 g004
Figure 5. Occurrences of average consumption for different stretches.
Batteries 06 00026 g005
Figure 6. Voltage and current trend for P1 during a bus ride.
Batteries 06 00026 g006
Figure 7. Battery energy and current trends during charging.
Batteries 06 00026 g007
Figure 8. Voltage and current trends of P2.
Batteries 06 00026 g008
Figure 9. Charging phase of the prototype of P3 with flash charging technology.
Batteries 06 00026 g009
Figure 10. Supercapacitor voltage and current trends during the ultra-fast charging phase.
Batteries 06 00026 g010
Figure 11. Battery voltage and current trends.
Batteries 06 00026 g011
Figure 12. Trend of energy consumption related to average speed.
Batteries 06 00026 g012
Figure 13. Economic comparison.
Batteries 06 00026 g013
Table 1. Road testing results of P1.
ParametersUnit12345AverageTotal
Durations241.0491.0122.0438.5576.0388.768,411
Distancekm1.081.680.682.492.971.0176
Total consumptionWh432.3846.0286.8942.91,218491.386,463
Commercial speedkm/h16.212.319.920.418.511.6n.a.
Average consumptionWh/km398.5503.3424.0378.9410.6489.4n.a.
Table 2. Road testing results of P2.
ParametersUnit12345Average *Total *
Durations4404404056405294912454
Distancem1104159911471180134012746370
Total consumptionWh5745104355505575352673
Commercial speedkm/h9.013.110.26.69.19.3n.a.
Average consumptionWh/km511313364441396422n.a.
*: based on all data measured.
Table 3. Main test results of hybrid storage prototype (P3).
ParameterUnit12345AverageTotal
Durationsec272.7263.1307.5252.5250.0279.23629.3
Distance traveledkm1.150.961.000.580.860.911.5
Total energy consumptionWh515.5487.6421.9325.1416.4457.75950.5
Energy consumption
due to auxiliary services
Wh83.479.592.977.776.484.81102.9
Traction motor energy
consumption
Wh432.1408.1329.0247.4340.1372.94847.6
Average energy
consumption
Wh/km447.7509.8422.1562.7483.5528.0n.a.
Commercial speedkm/h15.213.111.78.212.411.7n.a.
Energy provided
by battery
Wh266.5241.2175.6131.3152.5208.42709.1
Energy provided
by supercapacitors
Wh249.0246.3246.2193.8263.9249.33241.4
Supercap rate usage%58%60%75%78%78%68%n.a.
Battery AhAh3.53.22.31.72.02.735.6
Table 4. Bus nominal specifications.
Nominal ParameterUnitValue
Purchase cost (bus without battery)200,000
Lifespanyear12
Average consumption (OEM data)kWh/km0.5
Daily mileage required (min)km100
Curb weight (without battery)kg2370
Motor power (DC-brushed)kW21 (25 peak)
Motor torqueNm235 (at 950 RPM)
Table 5. ESS weight in the projects.
ComponentDescriptionUnitProject 1Project 2Project 3Project 4
Lead–acidLiFePO4SC + PbAGMSC + Lithium
ESS
weight
Battery, electronics and
other mechanical additions
total weight
kg15008001100700
Table 6. Comparison of cost parameters.
ComponentParameterUnitP1P2P3P4
lead–acidLiFePO4SC + PbAGMSC + Li
BatteryLifecycle#800300030009000
EnergykWh43.217.38.64.3
Unitary cost€/kWh150450150450
Range with a single chargekm67.230.711.65.8
Total cost12,960777612961944
Number of daily full charge#1355
LifeYear2.73.32.05.0
SupercapLifecycle#NaNa1,000,0001,000,000
Energy kWhNaNa0.40.4
Unitary costs€/kWhNaNa37,00037,000
Range with a single chargekmNaNa0.70.7
Number of daily full charge#NaNa141141
LifeYearNaNa23.623.6
Total costNaNa15,17015,170
ChargerCost due to one bus3000333325002500
Charger lifeYear12121212
Table 7. Actualized costs.
ParameterUnitProject 1 lead–acidProject 2 LiFePO4Project 3 SC + PbAGMProject 4 SC + Lithium
Actualized Costs487,156392,504381,810377,731

