Abstract
Lithium-Ion batteries are used in ever more demanding applications regarding operating range and safety requirements. This work presents a series of high-temperature abuse experiments on a nickel-manganese-cobalt oxide (NMC)/graphite lithium-ion battery cell, using advanced in-operando measurement techniques like fast impedance spectroscopy and ultrasonic waves, as well as strain-gauges. the presented results show, that by using these methods degradation effects at elevated temperature can be observed in real-time. These methods have the potential to be integrated into a battery management system in the future. Therefore they make it possible to achieve higher battery safety even under the most demanding operating conditions.
1. Introduction
Lithium-Ion batteries can nowadays be found in many applications, ranging from mobile computing devices over electric mobility up to multi-megawatt battery storage systems. Often, the battery cells are used under demanding operating conditions, like high charge and discharge current rates and high cyclic depth. the ever increasing requirements on energy and power density of battery systems leads to the development of improved electrode materials. On the anode side, alloy materials containing silicon are promising a greatly increased specific capacity compared to pure graphite. However, the large volume change during Li alloying and de-alloying processes is problematic for stability of the anodic solid electrolyte interphase (SEI) and can lead to reduced cycle life of the battery cell [1]. On the cathode side, nickel rich NMC811 (Nickel/Manganese/Cobalt) materials have a specific capacity of up to 250 mAh/g [2], which is over 60% increase compared to the conventional LiCoO2 cathode material. the resulting significant increase in energy density comes at the price of reduced thermal stability: the onset of exothermal decomposition of NMC811 is as low as 135 °C and can lead to a very strong oxygen release [3]. This reduced thermal stability consequently means a significantly reduced safety margin, compared to more stable materials with lower Ni content.
Operating conditions such as charging at high current rates, or charging at low temperatures, can lead to lithium-plating, which is the deposition of metallic lithium at the anode surface [4]. Besides the possibility of the forming of lithium-metal dendrites, which can lead to internal short circuits, this process also leads to localized exothermal decomposition of the electrolyte [4]. the resulting temperature rise can be especially dangerous for a cell with reduced thermal safety margin, and can ultimately lead to a thermal runaway and destruction of the cell.
From the perspective of battery system technology, the question arises as to how to deal with this risk and which measures can be taken to reduce it. the temperature at which exothermic processes can develop, or a risk of strong aging exists, is not much higher than the maximum temperatures occurring during operation. This condition often makes it necessary for applications with high specific power requirements either to use a generously designed cooling system or to have the available charge- or discharge power reduced by the battery management system (BMS) even at moderate temperatures. But even if this is the case, there are error mechanisms, such as internal short circuits or overcharging, which can ultimately lead to a cell failure. Battery cell manufacturers generally specify a maximum operating temperature in the cell data sheet. However, it is not possible to deduce directly from this information alone whether safety risks are imminent even if the temperature is exceeded for a short period of time, or whether the maximum temperature specified serves above all to limit the ageing that occurs more strongly for prolonged operation at high temperatures.
This poses an interesting question—if the onset of these degradation effects can be reliably detected during operation, would it be conceivable to allow the usual maximum temperature to be exceeded for a short time under certain circumstances, if this operating condition only rarely occurs? Also, there are technical applications in which high ambient temperatures regularly occur, for example in mining or space travel. In these applications, active temperature control for lithium-ion cells is used. However, irregularities in the cooling system must also be detected within a short time. the online detection and forecast of critical battery states, before hazardous processes such as decomposition and internal gas evolution take place is still one of the main challenges in developing safety algorithms for the battery management system.
The goal of this work is therefore to assess the suitability of different in-operando measurement methods for detecting degradation phenomena at high temperatures. In the following chapters, a series of high-temperature abuse experiments on a pouch-type lithium ion cell is presented. A variety of instrumentation techniques, such as fast impedance spectroscopy, strain gauges and acoustically guided ultrasonic waves are used to observe degradation phenomena in a commercial cell in real time.
Behaviour of Lithium-Ion Batteries under High-Temperature Conditions
The optimum operating temperature for lithium-ion batteries is usually between 20
°C to 40 °C [5]. In this temperature range, the electrode materials and electrolyte systems commonly used achieve a high performance with acceptable lifetimes. the results of calendar and cyclic ageing studies suggest that higher temperatures are generally expected to lead to stronger ageing. Capacity loss and internal resistance increase often show an Arrhenius behaviour [6], which is based on an approximate doubling of the reaction speed for a temperature increase of 10 K [7].
The increase in the internal resistance of lithium-ion batteries with graphite-based anode during aging is mainly due to growth in solid electrolyte interphase (SEI). the SEI growth is caused by decomposition of the electrolyte and deposition of components of the conductive salt [8]. Another ageing effect is the anode-side deposition of transition metals such as manganese, which are components of the cathode [8,9]. This causes a loss of the cathode-side active material, which leads to a capacity reduction.
Towards even higher temperatures above 60 °C these processes run at higher speeds according to the Arrhenius law. This accelerated reaction leads to a very rapid aging, combined with other observed effects such as gas formation [10]. With regard to practical operation, such a temperature range is usually avoided by a suitable design of the thermal management. Especially when using large cells in the battery pack for applications with high current rates it is likely that such temperatures can be reached locally. the same applies if the cooling system is insufficiently designed or if other misuse scenarios arise.
High temperatures become safety-critical through the onset of gas generation and cell-internal, exothermic processes. Gas formation leads to an increase in the internal cell pressure and, especially in pouch cells, to a strong deformation of the cell housing. In extreme cases, this can damage the cell housing and lead to electrolyte leakage. One mechanism for cell internal gassing is the formation of CO2 by lithium metal oxide cathode materials [11,12]. the likely cause is interactions between the electrolyte and surface films on the cathode, consisting of Li2CO3 or LiOH [11,13]. This mechanism is particularly promoted by high charge states and the corresponding strong delithiation of the cathode.
Another potential cause of gas formation at high temperatures is the decomposition processes of the solid electrolyte interphase [14] on the anode and also of the electrolyte: If the SEI is decomposed, the liithiated graphite may come into direct contact with the electrolyte [15]. This interaction of the graphite with the electrolyte leads to exothermic reactions, which generate further heat. The onset of exothermic processes can be investigated with so-called Accelerated Rate Calometry (ARC) measurements. Material samples or solid cells are heated gradually, followed by a resting phase in which the self-heating of the sample is measured. the results of such investigations show that from approximately 80–90 °C exothermic reactions may occur in cells [15,16]. However, other literature sources also give higher values in the range of approximately 110 °C [14]. The exact temperature thresholds depend very much on the exact material combinations and concentrations and can hardly be predicted due to the large number of processes involved. However, as soon as significant exothermic processes begin, the so-called thermal runaway (TR) can occur. Self-reinforcing exothermic processes lead to an increase in temperature until the cell is completely destroyed.
According to the literature, the basic sequence of events at rising temperature, which can ultimately lead to thermal runaway of a lithium-ion battery can be summarized as follows (also summarized in Figure 1).
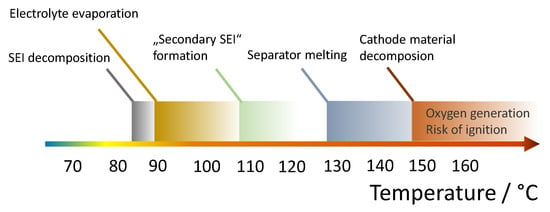
Figure 1.
Degeneration effects of lithium-ion batteries at high temperatures.
- 85–90 °C: Exothermic decomposition of the SEI at the anode begins [15].
- 90–110 °C: Commonly used electrolyte solvents, like dimethyl carbonate (DMC) and ethyl methyl, carbonate (EMC) reach their boiling points [17], which leads to gas generation [18].
- Above 110 °C: Formation of a secondary SEI film and successive decomposition [19]. This SEI film contains polymers and has significant electrical conductivity. This leads to further exothermic reactions of the solvent in the electrolyte with the anode material [20].
- Above 130–160 °C: Melting point of polyethylene (PE) separator (Polypropylene-containing separators have a slightly higher melting temperature) [21] Formation of local internal short circuits and thus further heat generation.
- Above 140 °C: Evaporation of the solvent in the electrolyte. In the presence of free oxygen ignition possible. This oxygen can be produced, for example, by decomposition reactions in the cathode [15].
- 150–250 °C: Decomposition of the cathode material with oxygen formation [15]. LiFePO4 has the highest thermal stability of all common cathode materials. With this cathode material, the probability of ignition and explosion is therefore lower, since the formation of oxygen only begins at a significantly higher temperature. As already discussed above, Nickel-rich cathode materials suffer have a significantly lower thermal stability.
2. Experimental
2.1. Fast Impedance Spectroscopy Measurements
Electrochemical Impedance Spectroscopy (EIS) measurements capture the complex impedance of a battery cell over a predefined frequency range, typically in the range of below 1 Hz up to several Kilohertz. the most often used measurement type is a frequency sweep method, in which by exciting the battery cell with subsequent sinusoidal currents of different frequencies and measuring the voltage response of the battery cell for each frequency point is measured. By using discrete fourier transform (DFT), the impedance can then be calculated in the frequency domain by dividing the complex values of voltage and current. A typical measurements takes up to several minutes. Conventional EIS techniques are therefore often not sufficient to acquire the impedance of a battery during abuse experiments. the non-stationarity and fast changes of the battery state throughout such an experiment would lead to the violation of the stationarity criterion for valid EIS measurements [22,23]. To overcome this, a multi-sine EIS technique, described in detail in reference [24], is used for all EIS measurements in this work: Using a specifically crafted excitation signal with superposed sine waves of different frequencies from 1 kHz–6 kHz down to 1 Hz allows to acquire an impedance spectrum every second. Figure 2 depicts the procedure—during continuous excitation of a multi-frequency excitation signal with a base period of , a sliding window over a period is used to calculate a new impedance spectrum from the sampled voltage and current signals for each signal period. the used frequency range covers the typical ranges for the anodic and cathodic charge transfer reaction, as well as interfacial or SEI effects at higher frequencies. the solid state diffusion processes in the active materials, which are typically visible in the very low frequency range below 0.1 Hz cannot be acquired with the used technique under dynamic operating conditions. However, this drawback is negligible for the performed measurements in this work, as the main processes of interest are changes in interfacial properties due to the decomposition of SEI and electrolyte solvents at high temperatures.
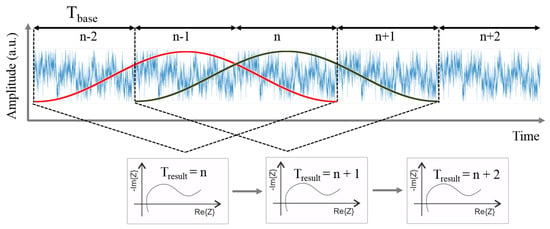
Figure 2.
Schematic illustration of the used time-resolved Electrochemical Impedance Spectroscopy (EIS) technique (adapted from [24]).
2.2. Strain Gauge Measurements
To measure the expansion of the cell’s pouch foil due to internal gas buildup, a strain gauge strip (Hottinger Baldwin Messtechnik 6/120A LY11) was glued onto the cell with an cyanoacrylate adhesive (Loctite 454) as an additional measuring instrument for one of the performed experiments. Measurement values were recorded by means of a bridge circuit via a National Instruments NI9235 measurement system. Figure 3 shows the assembled strain gauge sensor glued to the battery cell under test.
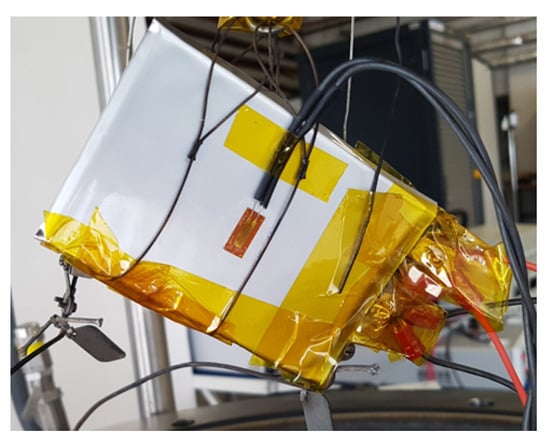
Figure 3.
Strain gauge sensor applied to pouch cell.
The used strain gauge is rated for a temperature of up to 200 °C [25]. As all strain gauges, it has a temperature drift, which can only be corrected if the thermal expansion coefficient of the substrate material on which it is applied is exactly known. Additionally, the used adhesive shows a reduction in strength at elevated temperatures [26]. This necessitates a careful interpretation of the acquired data, as a superposition of temperature related phenomena can be observed.
2.3. Ultrasonic Acoustic Guided Wave Measurements
Ultrasonic methods have been used for non-destructive testing of materials for decades. Recently, measurements with ultrasonic acoustic waves on battery cells have gained attention as a non-destructive tool to evaluate the mechanical characteristics of lithium-ion batteries [27,28], and to use the acquired parameters for state of health (SOH) and state of charge (SOC) estimation [29,30]. Using piezoelectric transducers, which can either be glued or pressed onto the cell casing, a voltage pulse excites a mechanical compressional wave. This wave travels through the cell materials and can be picked up by a second transducer. Different parameters, like time-of-flight, maximum amplitude and intensity can be evaluated.
For the course of this work, an experimental Ultrasound measurement system (Safion US100, prototype) is used to detect changes in the mechanical structure of the tested battery cell due to electrolyte and SEI dissolution. the measurement system consists of a pulse generator circuit for the generation of an excitation of up to 100 V and a low noise amplifier for response signal amplification, as well as filter- and matching circuits. the signal is digitized by a 16.25 MSPS analog to digital converter with a resolution of 14 bit. the battery cell is equipped with three piezoelectric disk transducers (PI Ceramic), glued to the cell surface. Two (generator and receiver A) are placed on the top side of the cell casing, the third one (receiver B) on the bottom side. An overview of the measurement procedure and sensor arrangement is shown in Figure 4. One of the sensors on the top side is used as a generator. This sensor configuration means that two acoustic signal paths exist: the path from the generator to receiver A, hereafter referred to as in-plane path captures the wave component along the surface of the pouch foil. the path from generator to receiver B (trough-plane) captures the component of the wave which is transferred through the individual layers of the cell acting as an waveguide.
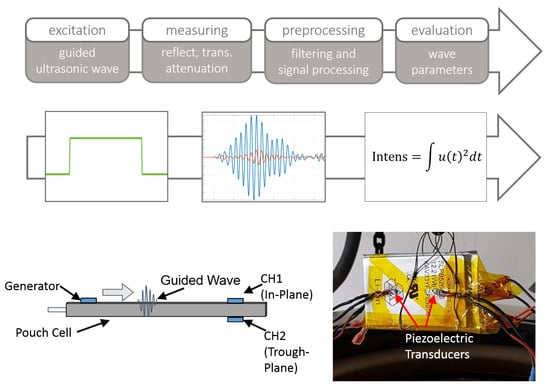
Figure 4.
Top: Measurement concept of the used Ultrasonic technique. Bottom: Schematic overview of applied sensors and photograph of the prepared cell.
A preliminary test was undertaken to assess the influence of elevated temperatures to the piezoelectric transducers, as well as the stability of the used adhesive—two transducers were glued to an aluminum sheet. While taking ultrasound measurements, the assembly was heated to 100 °C for a period of 2 h and cooled down to 25 °C thereafter. At 100 °C, a reduction in receive signal amplitude of 25% was observed, mainly caused by the temperature induced change in resonance frequency and coupling factor of the piezoelectric material. After cool-down, no change compared to the initial state was visible in the received signals. This proves the stability of the used joining process. the reduction of signal amplitude at elevated temperatures has to be taken into account when interpreting the obtained results during high-temperature experiments.
2.4. High-Temperature Abuse Experiments
In order to find out whether it is possible to detect safety critical degradation processes occurring at high temperatures using the methods introduced in the last sections, investigations were carried out in an adiabatic HEL BTC500 calorimeter (see Figure 5). This device has a pressure-resistant test chamber that can safely absorb any out-gassing of the cell that may occur, even during a thermal runaway. Integrated heating elements and temperature sensors allow an analysis of the thermal behaviour. the cell temperature can be measured using two K type thermocouples.
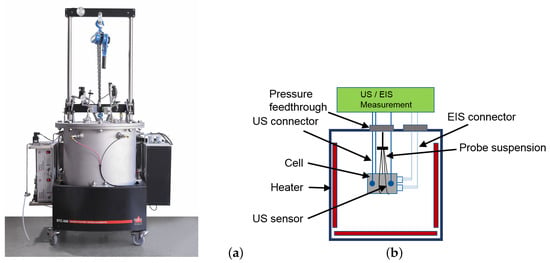
Figure 5.
Left (a): Used HEL BTC500 type adiabatic calorimeter. Right (b): Schematic depiction of cell assembly inside of the calorimeter. Temperature and strain gauge sensors not shown.
A total of three high-temperature abuse experiments were carried out, denoted as HT1–HT3 in the following sections. An overview of the experimental conditions, as well as the used instrumentation for each experiment can be found in Table 1. the temperature over time for all three experiments is shown in Figure 6. In all experiments, a Kokam SLPB526495 lithium-ion battery cell was used. the pouch-type cell with a nominal capacity of 3.3 Ah is composed of NMC/graphite as active materials and an electrolyte consisting of Ethylene Carbonate(EC)/Ethymethyl Carbonate(EMC) as solvent with lithium hexafluorophosphate LiPF6 as conductive salt.

Table 1.
Performed experiments and used instrumentation (marked with ‘x’).
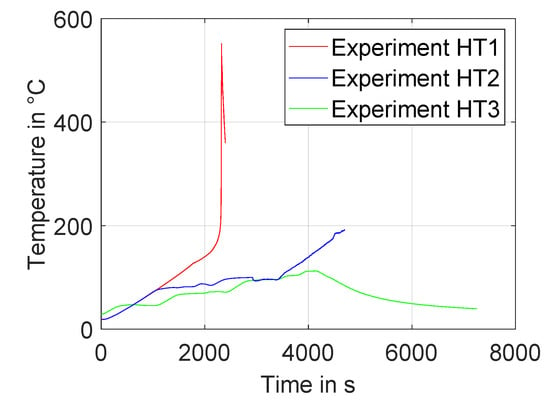
Figure 6.
Course of temperature of the three performed high-temperature abuse experiments HT1–HT3.
In the first experiment HT1, a cell with at 50% state of charge was heated in the adiabatic calorimeter with a continuous temperature ramp of a set-point value of 2 K/min. the cell had already undergone initial and cycle tests at the time of the experiment. Figure 7 shows the cell before and after the experiment.

Figure 7.
Experiment HT1: Left: Cell with applied temperature sensors before the experiment. Right: Cell after the experiment.
During the heating process continuous EIS measurements with a galvanostatic excitation with constant maximum amplitude in the range from 1 Hz to 1 kHz were performed. the amplitude was set so that the voltage response at room temperature is limited to 10 mV.
The second experiment, HT2, expanded the frequency range of the EIS measurement to an upper limit of 6 kHz. Also, the excitation amplitude of the galvanostatic EIS measurement was adjusted manually throughout the experiment, to limit the voltage response of the cell to 10 mV over the whole temperature range. Additionally, a strain gauge sensor, shown in Figure 3, was placed on the cell. the used cell had undergone initial cyclic tests, and had a remaining capacity of 96 percent compared to its initial value at the time of the experiment. The state of charge was set to 50%.
For the third experiment, HT3, a pristine cell at a SOC of 100% was used. the cell was fitted with three ultrasonic sensors, as described in Section 2.4. the EIS measurements were performed similar to the previous experiment. In this test, the cell was heated to up to 110 °C. After switching off heaters, the cell was allowed to cool off to ambient temperature.
3. Results and Discussion
3.1. Experiment HT1
Figure 8 (left) shows the time-dependent course of the measured cell temperature for experiment HT1. the right part of the figure shows the time derivative of the cell temperature over the absolute cell temperature. the rate of increase is up to a temperature of approx. 150 °C below the set-point change rate of the heaters of 2 K/min. From then on, distinct exothermic processes begin, which eventually lead to a thermal passage of the cell. Peak temperatures of over 550 °C are measured. In Figure 7 (right) accordingly strong burn marks can be seen on the cell after the experiment. Interesting is the clear drop of the temperature rise rate between about 128 °C and 147 °C, which indicates an endothermic process taking place there. This may be the melting of the polyethylene (PE) portion of the separator, as the melting point of common PE separators is very close to this value [31].
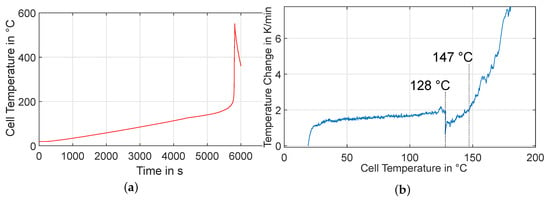
Figure 8.
Experiment HT1: Left (a): Behavior of the cell temperature over time. Right (b): Rate of temperature change as a function of cell temperature.
Figure 9 shows the course of cell voltage as a function of cell temperature during the experiment. the values shown are the moving average of the voltage over one second. Since this corresponds exactly to the base period of the average-free EIS excitation signal, the influence of the excitation current on the cell voltage is filtered out. Thus this value corresponds approximately to the open circuit voltage of the cell.
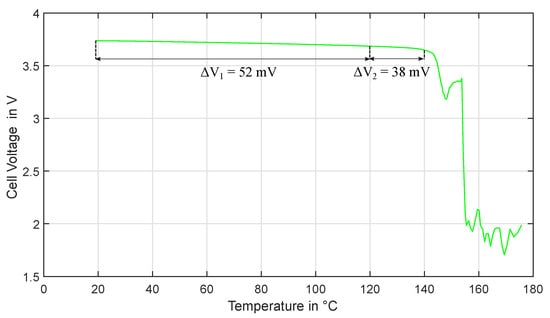
Figure 9.
Experiment HT1: Cell voltage curve as a function of cell temperature.
It can be clearly seen that the cell voltage gradually decreases as the temperature increases. the cell voltage decreases between 20 °C and 120 °C by about 52 mV. It is theoretically conceivable that the superimposed EIS signal has an undesired DC offset. However, the offset current of the EIS measurement device is in the range of a maximum of a few milliamperes. the resulting change in charge state during the measurement period is far too small to cause such a voltage change: Even at an offset current of 10 mA, the current in one hour (the time for the temperature rise from 20 °C to 100 °C) would lead to only 10 mAh charge conversion. This would correspond to a SOC drift of only 0.3%. Considering the open circuit voltage (OCV) to SOC relationship of the cell, this would cause a voltage change of less than 1 mV. It is therefore highly probable that the voltage change is not caused by the EIS superposition.
The variation of the battery cell OCV over temperature and SOC is governed by the Nernst equation [32], which describes the half cell potential for each electrode:
Here, is the lithiation dependent equilibrium potential, R the universal gas constant, T the absolute temperature (in Kelvin), n is the number of electrons involved in the reaction (equals to 1 for lithium-ion batteries), F the Faraday constant and and are the concentrations of oxidized and reduced species at the electrode surface, respectively. the open circuit voltage is the difference of both half cell voltages:
As can be seen from Equation (1), the temperature dependency of the open circuit voltage is a function of the ratio of the concentrations and on each electrode surface. This temperature dependency of the half cell potentials corresponds to a change in entropy [33]:
Viswanathan et al. [33] shows that these material-dependent change of entropy for the anode and cathode materials depends also on the state of charge, and may result in positive or negative change of the OCV over temperature change.
The reduction of cell voltage at high temperatures was also observed in other similar experiments: Feng et al. ([16,34]) performed Accelerating Rate Calorimetry (ARC) measurements in combination with pulse resistance measurements. Besides the strong increase of the pulse resistance by melting of the separator at temperatures above 140 °C, a decrease of the voltage already at temperatures of 80 °C can be observed in their work. the change of the cell voltage remains even during cooling, which indicates that it is not only a temperature dependence of the voltage value, but a degradation process causes the voltage change. Ishikawa et al. [35] performed storage tests in which cells of the 18,650 format were stored at different states of charge at a temperature of 100 °C. There, too, a gradual drop in the rest voltages could be observed. In addition, all cells (except those stored at 0% SOC) showed a sudden drop in voltage after a certain time. the authors attribute this to gas formation, which leads to an internal pressure increase and a triggering of the CID (current-interrupt device).
The cell considered in this experiment does not have a CID. the strong decrease in cell voltage observed from 140 °C is therefore probably due to the melting of the separator, which causes the cell to lose its function. the comparison with Figure 8 (right) shows that strongly exothermic processes occur in this temperature range. This could be due to the formation of internal short circuits due to separator failure.
Figure 10 shows the impedance spectra of the cell in the range from 1 Hz to 1 kHz at different temperatures. In the right part of the figure, the calculated residuals of the spectra in regard to the Kramers-Kronig criteria is shown. the values are calculated using the LinKK software tool, developed by Karlsruhe Institute of Technology [36,37,38]. These are consistently very low and thus indicate valid impedance spectra in compliance with the linearity and time invariance (LTI) criteria.
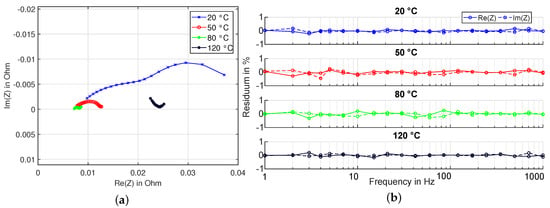
Figure 10.
Left (a): Experiment HT1 - Nyquist plot of the complex impedance in the range from 1 Hz to 1 kHz of the cell heated at 50% state of charge in the calorimeter. Right (b): Calculated Kramers-Kronig residuals of impedance spectra, showing that stationarity conditions are fulfilled.
As can also be expected, the impedance spectrum changes very strongly with increasing temperature—with increasing temperature, the series resistance (strictly speaking, the true series resistance, which corresponds to the value of the real part at an imaginary part of zero is not visible in the frequency range considered here for the measurements carried out at lower temperatures, since the imaginary part is still negative at 1 kHz. Further experiments, shown later in this section, confirm however that the series resistance at first decreases with increasing temperature.), and also the amount of the negative imaginary part decreases significantly due to the decreasing time constants of the electrochemical processes. the impedance spectrum recorded at 120 °C, however, shows an unusual shape—first of all, compared to the spectrum recorded at 80 °C, there is a clear shift towards larger values on the real axis. On the other hand, a partial capacitive semicircle is formed at high frequencies (towards the measuring points with decreasing real part). Such unusual behaviour is not observed under normal operating conditions and indicates a process with very short time constants. Due to the maximum excitation frequency limited to 1 kHz at the top, this cannot be recognized here as a typical semicircle in the Nyquist diagram.
Therefore, the question arises as to at which temperature this processes begins to get recognizable in the impedance spectrum. To answer this question, it is not helpful to look at Nyquist diagrams at individual selected temperatures. Rather, the continuous course of the impedance must be considered. This is shown in Figure 11 for the different excitation frequencies separately for real and imaginary part. Since the excitation amplitude was not readjusted in this experiment, the signal-to-noise ratio of the voltage response is relatively poor, especially at higher temperatures. This results in an increased variance of the individual impedance values, especially for lower frequencies. For this reason, the time course of the spectra was smoothed using a median filter. Nevertheless, especially with the imaginary part in the range from 1 Hz to 5 Hz, slight noise influences are still recognizable.
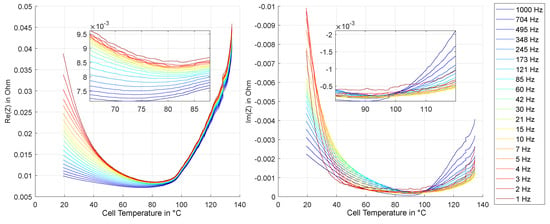
Figure 11.
Experiment HT1: Real and imaginary part of impedance at different frequencies over temperature.
The course of the real part over the rising temperature first shows the expected, decreasing behavior for all frequencies. In the range from 20 °C to 75 °C, for example, the real part of the impedance at 1 Hz is reduced by about 75%. As in this frequency range, the charge transfer process is typically dominant in the impedance spectrum, this is most likely caused by a reduction of the charge transfer resistance of one or both electrodes, which typically shows an exponential temperature dependence according to the Arrhenius law [39,40]. In contrast, the temperature dependence of the real part at higher frequencies, which are no longer dominated by the charge transfer process, is significantly lower. From about 75 °C to 80 °C there is a clear change in the trend: the real part begins to rise again as the temperature continues to rise. the corresponding area is shown enlarged on the left within Figure 11. the temperature at which the change in trend begins is slightly different: at higher frequencies, the onset of the increase can be observed somewhat earlier. For 1 kHz, already from approx. 75 °C an increase is observable, whereas at 1 Hz, the increase begins at approximately 83 °C. From about 90 °C this increase accelerates strongly, so that at 100 °C the real part for all frequencies has already increased significantly. This corresponds to the reported temperature range, at which strong SEI dissolution starts [15]. At approx. 130 °C a jump in the real part is recognizable. This coincides with the endothermic process already visible in the temperature curve in Figure 8.
The consideration of the imaginary part shows up to 90 °C with a strong decrease first a basically similar course. This is not surprising either, since the real and imaginary parts are of course coupled via the Kramers-Kronig relationships. An increase of the imaginary part becomes clearly recognizable from 90 °C upwards. Here, however, the course is strongly frequency-dependent, with a significantly stronger increase in the range of higher frequencies.
The temperature at which this process is getting visible in the impedance spectrum coincides with the temperature range at which a decomposition of the SEI is described in the literature [14,15,16,41,42]. the deduction that it is this process that shows up in the high frequency range of the impedance spectrum is obvious. However, this cannot be proven directly with the research methodology used.
3.2. Experiment HT2
In order to investigate the effect of the high-frequency process in the impedance spectrum more closely, the experiment was repeated in a slightly modified form, as already described in Section 2.4. This experiment, in the following denoted as “HT2”, results in a better signal-to-noise ratio in temperature ranges with a very low impedance, and also ensures that the measurement takes place in the linear range even with a sharp increase in impedance.
Figure 12 shows the course of the real and imaginary parts of the impedance. In contrast to Figure 11, the values are shown over time instead of temperature, since there was no constant temperature rise in this experiment. For reasons of clarity, only the first 10,000 s are plotted here, since the impedance then assumes very high values, also due to venting, and therefore the previous behavior would no longer be recognizable. First a temperature of 80 °C was reached, then the temperature was increased in several steps up to 100 °C. Afterwards the temperature was increased again, until the cell was destroyed. The graph of the cell temperature during the experiment is shown in Figure 13. In contrast to the previous experiment, no thermal runaway of the cell was observed.
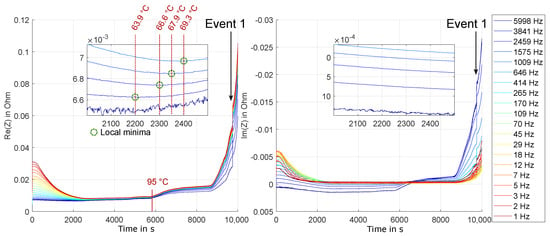
Figure 12.
Experiment HT2: Real and imaginary parts of the impedance over the first 10,000 s of the experiment. In the zoomed in area, the trend change of the real part is shown for frequencies between 1 kHz– 6 kHz. In the same temperature range, the imaginary part does not show any distinct change.
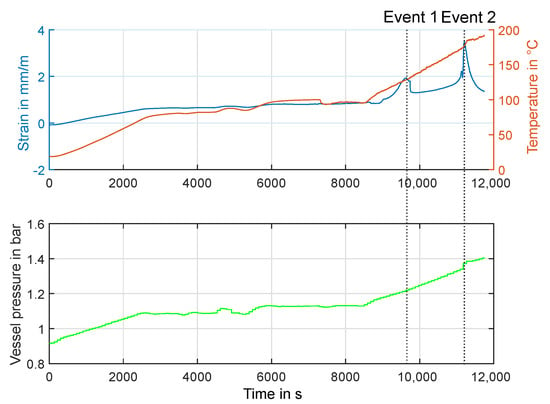
Figure 13.
Experiment HT2: Behavior of cell temperature and strain, as well as air pressure in calorimeter.
The basic development of the impedance is similar to the behaviour observed in the previous experiment, even if the initial impedance values are slightly different due to the influence of contact resistance, cables and the different ageing state.
Of special interest in this experiment is again the trend development in the range from approximately 60 °C. In Figure 12 this area is shown enlarged. Compared to the previous experiment, it can be observed that the trend change (local minima) towards an increase in the real part of the impedance can be observed much earlier at higher frequencies: While the signal-to-noise ratio at 6 kHz makes it difficult to find a distinct local minimum, the real part at 3841 Hz shows a clear local minimum at about 64 °C. With 1 kHz, this can only be observed at about 69 °C.
This hints at first degeneration processes already happening at these temperatures. Typically, this is considered a temperature range at which accelerated calendric aging of cells is occurring. This seems to happen at a rate, which makes it observable in real time with EIS measurements. Upwards of the temperature of the local minimum of the real part of impedance for a given frequency, the impedance increase due to occurring degeneration and aging processes outweigh the acceleration (and therefore impedance reduction) of charge transfer processes.
In Appendix A, results from equivalent circuit model (ECM) fitting to the impedance spectra of experiment HT2 are shown. the results of the ECM fitting are in agreement with the findings presented previously, and show a different view of the data.
In Figure 13, the trend of cell temperature and relative expansion of the strain gauge over time is shown. the expansion of the cell is, as expected, a function of the temperature due to the thermal expansion of the various materials. Especially at temperatures above 100 °C the loss of strength the used adhesive will influence the measured values, so that the accuracy ob the absolute value is unclear here. At high temperatures, however, two very noticeable, sudden increases in expansion can be observed. the first, named Event 1 in Figure 13, occurs at about the same temperature of 130 °C as was seen in the previous experiment HT1. Again, this is also visible in the impedance spectrum, plotted in Figure 12 over time. The second peak value (Event 2) can be associated with a sudden rise in temperature and an increase in vessel pressure. This most likely means that an outgassing (venting) took place at this time. Since this process takes place within fractions of a second and is therefore not stationary during the measurement time window, the recorded impedance values do not meet the stationarity criteria.
3.3. Experiment HT3
The question arises to what extent the changes in impedance spectra observed here are completely irreversible or not if the experiment is discontinued and the battery cell cools down. Therefore, one goal of the third experiment HT3 is to investigate this behaviour. the overall procedure is similar to the previous experiments, but the heating is stopped at a cell surface temperature of 110 °C and the cell is left to cool again to its initial temperature.
Figure 14 shows the impedance spectra in the range from 40 °C to 110 °C in steps of 10 °C.
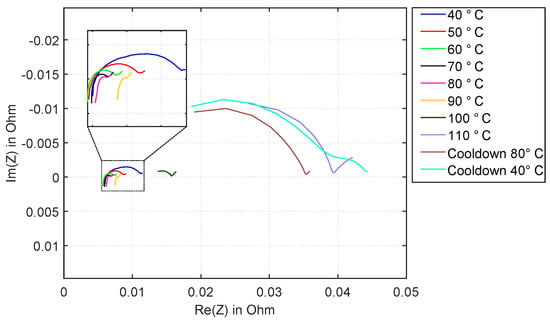
Figure 14.
Experiment HT3: Nyquist plot of the complex impedance of a Kokam 3.3 Ah cell in the range from 1 Hz to 6 kHz at different temperatures, including cool-down.
The behavior is almost identical to the previous experiments. the two additionally shown impedance spectra during the cool-down phase at 80 °C and 40 °C show only minor changes compared to the one at 110 °C, and differ very clearly from the spectra recorded at the same temperature during the heating period. This proves that irreversible damage to the cell happens here.
As mentioned in Section 2.3, for this experiment the cell was also outfitted with three piezoelectric transducers, which are able to excite and measure an in-plane and trough-plane path of an ultrasonic guided wave. the received, amplified and digitally bandpass-filtered signals are shown in Figure 15 for a temperature of 50 °C and 100 °C. These show the distinct and different shape of both waveforms at lower temperature. At 100 °C, the in-plane signal is still visible, albeit with significantly reduced amplitude. the through-plane signal is not visible above the noise floor of the measurement any more. To interpret the raw time-series signals, different metrics can be used. These should have the property of a high noise immunity, but also a high sensitivity to changes in the wanted signal. For the course of this work, two metrics have been evaluated: the first is the intensity I of the signal, which is defined as the integral of the squared amplitude values, and is closely related to the signal energy. For a discrete time signal with N samples, the intensity can be calculated as follows:
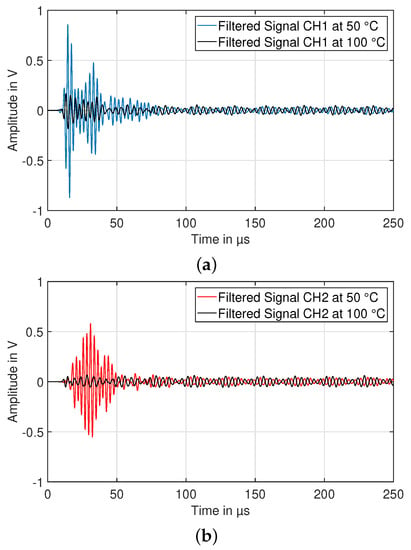
Figure 15.
Received signal (amplified and filtered) of in-plane (CH1, (a)) and through-plane (CH2, (b)) ultrasonic wave for two different temperature values.
Using an integral quantity of a signal has the advantage of a high rejection of zero-average noise. However, as already noted in Section 2.3, the used transducers and adhesive also have the property of a reduced amplitude at higher temperatures, which could potentially mask a battery-cell related change in the signal. Therefore, a second signal quantity, which is more independent of the absolute amplitude should also be considered. One such quantity is the so-called center of gravity C of a pulse signal, which relates to the time value at which the signal energy is centered. As such, it has a dependency not only on the amplitude of the excited wave, but also on the speed of sound in the media, which influences the time of flight of the ultrasonic wave. It is defined as follows:
In Figure 16, the time course of temperature, as well as signal intensity and center of gravity is shown. Due to a power supply malfunction of the calorimeter, the temperature control was interrupted in the time interval of 5200–6000 s (marked range in Figure 16a). Regarding the ultrasonic measurements, a continuous decline of the intensity during the heating process is visible for the in-plane, as well as the through-plane measurements. At about 90 °C, the intensity begins to drop at a high rate for both wave pathways. At peak temperature of about 112 °C at s, shortly before the cool-down begins, there is a distinct peak visible in the in-plane component, before the intensity drops again when crossing the 100 °C. the onset of the peak lies very close to the temperature range of the boiling point of EMC of 107 °C [18]. the change in in-plane amplitude could therefore be caused by gas generation due to electrolyte vaporization. During the cool-down phase, the in-plane wave intensity begins to rise again until saturation of the amplifier, while the through-plane measurement stays at a very low residual intensity, related to measurement noise. the center of gravity of both signals stays roughly constant until about 90 °C, followed by a sharp rise. For the in-plane measurement, a similar, but inverted behavior compared to the intensity is visible.
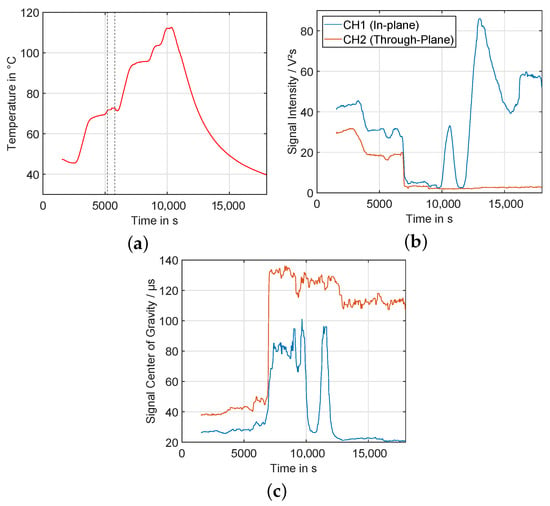
Figure 16.
Left (a): Temperature over time during experiment. Marked range shows timeframe of temperature regulation malfunction. Center (b): Signal intensity over time. Right (c): Signal center of gravity over Time (legend same as (b)).
To observe the signal behavior more closely, decoupled from the non-constant slope of the heating process, Figure 17 shows the intensity and center of gravity data as a scatter plot over the actual temperature for the heat-up phase of the experiment. In this type of plot, the intensity data shows subtle differences—between 45 °C and 60 °C, the intensity of the through-plane measurement is lowering continuously, while the in-plane component stays relatively constant. At higher temperatures than 70 °C, the behavior is similar for both signal components. the center of gravity shows a very stable behavior up to 65 °C, when it begins to shift in time in positive direction. At about 85 °C, a sharp rise begins, followed by a period with relatively steady average value, although with high fluctuations. This is most likely related to the vanishingly small amplitude of the signal, and the therefore dominating noise effects.
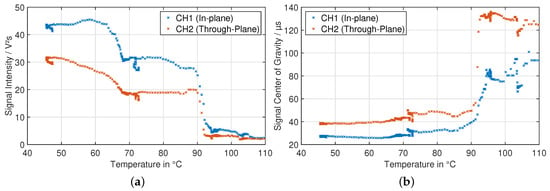
Figure 17.
Signal intensity (left, (a)) and signal center of gravity (right, (b)) over temperature during the heat-up period of the experiment.
This described behavior of the ultrasonic signal is in very good compliance with the impedance spectroscopy results presented earlier. This makes it highly likely, that at least the center of gravity is a parameter with high sensitivity to degradation and gassing processes, while rejecting the changes in transducer behavior over temperature.
4. Conclusions and Outlook
In this paper, a series of high-temperature abuse experiments on a lithium-ion cell battery were performed and analyzed with different in-operando measurement methods, which can be applied without internal modifications to the battery cell design. the results show that impedance spectroscopy and ultrasonic measurements are very sensible to safety-critical degradation effects which happen during exposure to high temperatures. Impedance and ultrasonic signals show distinct changes in temperature ranges, at which SEI dissolution, evaporation of solvents and other effects are described in literature. Even at moderate temperatures of about 65 °C, beginning degradation effects can already be observed with both methods with high sensitivity. Strain gauge measurements can also be helpful to detect a possible swelling or outgassing during operation. Changes in the impedance spectrum can be cross-correlated with the thermal behavior during separator failure. These results make clear that the used methods can be very valuable during battery cell development and validation, cell characterization, but also for online diagnostics in a battery management system in safety-critical applications. In the future, further measurements with the described methods, using various other cell chemistries and housing types should be performed to assess the similarity in behaviour for different cell types. Currently, the authors are working on further improving the noise performance and precision of both methods, which will lead to an even higher sensitivity to degradation phenomena inside the cell.
Author Contributions
Conceptualization, H.Z., G.F. and D.U.S.; Formal analysis, H.Z., A.G.; Methodology, H.Z., A.G.; Software, H.Z.; Validation, G.F.; Writing—original draft, H.Z.; Writing—review & editing, G.F., A.G. and D.U.S. All authors have read and agreed to the published version of the manuscript.
Funding
Parts of this research work were funded through the ZIM (“Zentrales Innovationsprogramm Mittelstand”) project Ausfallsichere Batterie (FKZ: KF3468301PR4) by the German Federal Ministry of Economic Affairs and Energy. the responsibility for this publication lies solely with the authors. the authors also acknowledge the continued funding of the Federal Ministry of Economic Affairs and Energy in the scope of the EXIST research transfer project sBat - safer Battery (FKZ: 03EFKNW181).
Conflicts of Interest
The authors declare no conflict of interest.
Appendix A. Equivalent Circuit Modelling of Impedance Measurements of Experiment HT2
For experiment HT2, a parameter fitting of the measured impedance spectra to an equivalent circuit model (ECM) was also conducted. the fitting, using a nonlinear least square (NRLS) approach, was performed with the open source Python library PyEIS [43]. During the the experiment, an impedance spectrum with a frequency range between 1 Hz and 6 kHz was acquired every second. Correspondingly, for each second new ECM parameters can be calculated. For each new fitting procedure, the starting parameters for the NRLS algorithm were chosen to the calculated parameters from the previous timestep.
The used ECM is shown in Figure A1 (bottom right). It consists of a series resistance element and two (also commonly called “ZARC”) elements. the series resistance commonly models all frequency-independent loss processes of the cell, like ohmic losses in current collectors and due to contact resistance, but also the transport of Li through the electrolyte. the RQ elements are parallel connections of a resistor R and a constant phase element Q and typically model charge transfer processes. An exponential factor , which is typically limited to values between 0.6 and 1, controls the “depression” of the resulting semicircle, when visualizing a RQ element in a nyquist plot. A value of corresponds to a regular RC element. For a frequency f, the following equation describes the complex impedance of the RQ element:
Two RQ elements are chosen in the hope to be able to model the charge transfer process of both electrodes, if these processes are visible in the impedance spectrum. However, due to the underdetermined nature of the fitting procedure, a direct physical interpretation of the fitting results is often not directly possible, as a large number of parameter sets exist which can be fitted to the impedance spectrum.
The results of the parameter fitting are shown in Figure A1. the included markings show the temperature values which correspond to a change in cell behavior, as already discussed in Section 3.2 and Figure 12. When comparing the trends for the series resistance and the two resistance values of the RQ elements, and , it can be seen that the series resistance only shows a weak temperature behavior at the beginning, and starts to rise at about 64 °C. behaves somewhat similar as , while shows a sharp decrease at the beginning, and begins to stabilize at a nearly constant value at 64 °C. At about 95 °C, another change in trend for and , and an increased rate of increased for . the other ECM parameters also show distinctive changes at these temperature thresholds. Overall, the results show that the used model is also sensitive to the temperature induced changes. Such an equivalent circuit model could therefore also be used in a battery management system to detect abnormal changes in cell behavior at elevated temperature. A physical interpretation of the model parameters, for example trying to attribute parameters to either cathode or anode cannot be done with sufficient confidence with the available data.
The overall impedance of the ECM is therefore:
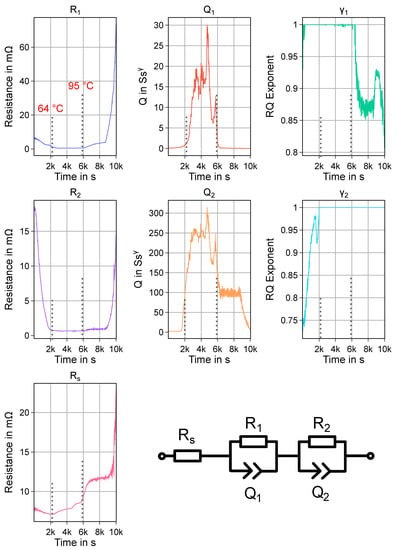
Figure A1.
Used ECM (bottom right) and fitting results for impedance spectra of experiment HT2. the marked points in time and the respective temperature values of the cell correspond to the highlighted parts in Figure 12.
References
- Ko, M.; Oh, P.; Chae, S.; Cho, W.; Cho, J. Considering Critical Factors of Li-rich Cathode and Si Anode Materials for Practical Li-ion Cell Applications. Small 2015, 11, 4058–4073. [Google Scholar] [CrossRef] [PubMed]
- Hou, P.; Yin, J.; Ding, M.; Huang, J.; Xu, X. Surface/Interfacial Structure and Chemistry of High-Energy Nickel-Rich Layered Oxide Cathodes: Advances and Perspectives. Small 2017, 13, 1701802. [Google Scholar] [CrossRef]
- Bak, S.M.; Hu, E.; Zhou, Y.; Yu, X.; Senanayake, S.D.; Cho, S.J.; Kim, K.B.; Chung, K.Y.; Yang, X.Q.; Nam, K.W. Structural Changes and Thermal Stability of Charged LiNi x Mn y Co z O 2 Cathode Materials Studied by Combined In Situ Time-Resolved XRD and Mass Spectroscopy. ACS Appl. Mater. Interfaces 2014, 6, 22594–22601. [Google Scholar] [CrossRef] [PubMed]
- Waldmann, T.; Hogg, B.I.; Wohlfahrt-Mehrens, M. Li plating as unwanted side reaction in commercial Li-ion cells—A review. J. Power Sources 2018, 384, 107–124. [Google Scholar] [CrossRef]
- Korthauer, R. (Ed.) Handbuch Lithium-Ionen-Batterien; Springer: Berlin/Heidelberg, Germany, 2013. [Google Scholar] [CrossRef]
- Käbitz, S.; Gerschler, J.B.; Ecker, M.; Yurdagel, Y.; Emmermacher, B.; André, D.; Mitsch, T.; Sauer, D.U. Cycle and calendar life study of a graphite|LiNi1/3Mn1/3Co1/3O2 Li-ion high energy system. Part A: Full cell characterization. J. Power Sources 2013, 239, 572–583. [Google Scholar] [CrossRef]
- Holleman, A.F.; Wiberg, E.; Wiberg, N. Lehrbuch der Anorganischen Chemie; de Gruyter: Berlin, Germany, 2007. [Google Scholar]
- Waldmann, T.; Wilka, M.; Kasper, M.; Fleischhammer, M.; Wohlfahrt-Mehrens, M. Temperature dependent ageing mechanisms in Lithium-ion batteries—A Post-Mortem study. J. Power Sources 2014, 262, 129–135. [Google Scholar] [CrossRef]
- Warnecke, A.J. Degradation Mechanisms in NMC-Based Lithium-Ion Batteries. Ph.D. Thesis, RWTH Aachen University, Aachen, Germany, 2017. [Google Scholar] [CrossRef]
- Ecker, M.; Gerschler, J.B.; Vogel, J.; Käbitz, S.; Hust, F.; Dechent, P.; Sauer, D.U. Development of a lifetime prediction model for lithium-ion batteries based on extended accelerated aging test data. J. Power Sources 2012, 215, 248–257. [Google Scholar] [CrossRef]
- Kim, Y. Mechanism of gas evolution from the cathode of lithium-ion batteries at the initial stage of high-temperature storage. J. Mater. Sci. 2013, 48, 8547–8551. [Google Scholar] [CrossRef]
- Wuersig, A.; Scheifele, W.; Novák, P. CO2 Gas Evolution on Cathode Materials for Lithium-Ion Batteries. J. Electrochem. Soc. 2007, 154, A449. [Google Scholar] [CrossRef]
- Xiong, D.J.; Ellis, L.D.; Nelson, K.J.; Hynes, T.; Petibon, R.; Dahn, J.R. Rapid Impedance Growth and Gas Production at the Li-Ion Cell Positive Electrode in the Absence of a Negative Electrode. J. Electrochem. Soc. 2016, 163, A3069–A3077. [Google Scholar] [CrossRef]
- Maleki, H. Thermal Stability Studies of Li-Ion Cells and Components. J. Electrochem. Soc. 1999, 146, 3224. [Google Scholar] [CrossRef]
- Bandhauer, T.M.; Garimella, S.; Fuller, T.F. A Critical Review of Thermal Issues in Lithium-Ion Batteries. J. Electrochem. Soc. 2011, 158, R1. [Google Scholar] [CrossRef]
- Feng, X.; Sun, J.; Ouyang, M.; He, X.; Lu, L.; Han, X.; Fang, M.; Peng, H. Characterization of large format lithium ion battery exposed to extremely high temperature. J. Power Sources 2014, 272, 457–467. [Google Scholar] [CrossRef]
- Hess, S.; Wohlfahrt-Mehrens, M.; Wachtler, M. Flammability of Li-Ion Battery Electrolytes: Flash Point and Self-Extinguishing Time Measurements. J. Electrochem. Soc. 2015, 162, A3084–A3097. [Google Scholar] [CrossRef]
- Lamb, J.; Orendorff, C.J.; Roth, E.P.; Langendorf, J. Studies on the Thermal Breakdown of Common Li-Ion Battery Electrolyte Components. J. Electrochem. Soc. 2015, 162, A2131–A2135. [Google Scholar] [CrossRef]
- Yang, H.; Zhuang, G.V.; Ross, P.N. Thermal stability of LiPF6 salt and Li-ion battery electrolytes containing LiPF6. J. Power Sources 2006, 161, 573–579. [Google Scholar] [CrossRef]
- Peled, E.; Menkin, S. Review—SEI: Past, Present and Future. J. Electrochem. Soc. 2017, 164, A1703–A1719. [Google Scholar] [CrossRef]
- Roth, E.P.; Doughty, D.H.; Pile, D.L. Effects of separator breakdown on abuse response of 18650 Li-ion cells. J. Power Sources 2007, 174, 579–583. [Google Scholar] [CrossRef]
- Barsoukov, E.; Macdonald, J.R. (Eds.) Impedance Spectroscopy: Theory, experiment, and Applications, 2nd ed.; Wiley-Interscience a John Wiley & Sons Inc. Publication: Hoboken, NJ, USA, 2005. [Google Scholar] [CrossRef]
- Schiller, C.A.; Richter, F.; Gülzow, E.; Wagner, N. Validation and evaluation of electrochemical impedance spectra of systems with states that change with time. Phys. Chem. Chem. Phys. 2001, 3, 374–378. [Google Scholar] [CrossRef]
- Zappen, H.; Ringbeck, F.; Sauer, D. Application of Time-Resolved Multi-Sine Impedance Spectroscopy for Lithium-Ion Battery Characterization. Batteries 2018, 4, 64. [Google Scholar] [CrossRef]
- HBM Serie Y Datasheet. Available online: https://www.me-systeme.de/produkte/dehnungsmessstreifen/catalog/Serie-Y-b4710.pdf (accessed on 21 April 2020).
- Loctite 454 Technical Datasheet. Available online: https://tdsna.henkel.com/americas/na/adhesives/hnauttds.nsf/web/A72821E60E3C0959882571870000D797/$File/454-212NEW-EN.pdf (accessed on 21 April 2020).
- Gitis, A.; Wessel, S.; Wazifehdust, M.; Heimes, H.; Sauer, D.U.; Figgemeier, E.; Kampker, A. Vom Staub zur Elektrode: Herstellungsprozess von Elektroden für Lithium-Ionen Batteriezellen.—Teil 1. Galvanotech. älteste Fachz. Für Die Prax. Der Oberflächentechnik 2017, 2017, 7–10. [Google Scholar]
- Hsieh, A.G.; Bhadra, S.; Hertzberg, B.J.; Gjeltema, P.J.; Goy, A.; Fleischer, J.W.; Steingart, D.A. Electrochemical-acoustic time of flight: In operando correlation of physical dynamics with battery charge and health. Energy Environ. Sci. 2015, 8, 1569–1577. [Google Scholar] [CrossRef]
- Davies, G.; Knehr, K.W.; van Tassell, B.; Hodson, T.; Biswas, S.; Hsieh, A.G.; Steingart, D.A. State of Charge and State of Health Estimation Using Electrochemical Acoustic Time of Flight Analysis. J. Electrochem. Soc. 2017, 164, A2746–A2755. [Google Scholar] [CrossRef]
- Gold, L.; Bach, T.; Virsik, W.; Schmitt, A.; Müller, J.; Staab, T.E.; Sextl, G. Probing lithium-ion batteries’ state-of-charge using ultrasonic transmission—Concept and laboratory testing. J. Power Sources 2017, 343, 536–544. [Google Scholar] [CrossRef]
- Arora, P.; Zhang, Z. Battery Separators. Chem. Rev. 2004, 104, 4419–4462. [Google Scholar] [CrossRef] [PubMed]
- Bard, A.J.; Faulkner, L.R. Electrochemical Methods: Fundamentals and Applications, 2nd ed.; Wiley: New York, NY, USA, 2001. [Google Scholar]
- Viswanathan, V.V.; Choi, D.; Wang, D.; Xu, W.; Towne, S.; Williford, R.E.; Zhang, J.G.; Liu, J.; Yang, Z. Effect of entropy change of lithium intercalation in cathodes and anodes on Li-ion battery thermal management. J. Power Sources 2010, 195, 3720–3729. [Google Scholar] [CrossRef]
- Feng, X.; Fang, M.; He, X.; Ouyang, M.; Lu, L.; Wang, H.; Zhang, M. Thermal runaway features of large format prismatic lithium ion battery using extended volume accelerating rate calorimetry. J. Power Sources 2014, 255, 294–301. [Google Scholar] [CrossRef]
- Ishikawa, H.; Mendoza, O.; Sone, Y.; Umeda, M. Study of thermal deterioration of lithium-ion secondary cell using an accelerated rate calorimeter (ARC) and AC impedance method. J. Power Sources 2012, 198, 236–242. [Google Scholar] [CrossRef]
- Karlsruhe Institute of Technology. Lin-KK Software. Available online: https://www.iam.kit.edu/wet/Lin-KK.php (accessed on 21 April 2020).
- Schönleber, M.; Ivers-Tiffée, E. Approximability of impedance spectra by RC elements and implications for impedance analysis. Electrochem. Commun. 2015, 58, 15–19. [Google Scholar] [CrossRef]
- Schönleber, M.; Klotz, D.; Ivers-Tiffée, E. A Method for Improving the Robustness of linear Kramers-Kronig Validity Tests. Electrochim. Acta 2014, 131, 20–27. [Google Scholar] [CrossRef]
- Witzenhausen, H. Electrical Battery Models: Modelling, Parameter Identification and Model Reduction; RWTH Aachen University: Aachen, Germany, 2017. [Google Scholar] [CrossRef]
- Illig, J. Physically Based Impedance Modelling of Lithium-Ion Cells. In Schriften des Instituts für Werkstoffe der Elektrotechnik, Karlsruher Institut für Technologie; KIT Scientific Publishing: Karlsruhe, Baden, 2014; Volume 27. [Google Scholar]
- Tanaka, N.; Bessler, W.G. Numerical investigation of kinetic mechanism for runaway thermo-electrochemistry in lithium-ion cells. Solid State Ionics 2014, 262, 70–73. [Google Scholar] [CrossRef]
- Richard, M.N.; Dahn, J.R. Accelerating Rate Calorimetry Study on the Thermal Stability of Lithium Intercalated Graphite in Electrolyte. I. Experimental. J. Electrochem. Soc. 1999, 146, 2068. [Google Scholar] [CrossRef]
- Knudsen, K. kbknudsen/PyEIS: PyEIS: A Python-based Electrochemical Impedance Spectroscopy Simulator and Analyzer. Available online: https://github.com/kbknudsen/PyEIS/ (accessed on 21 April 2020).
© 2020 by the authors. Licensee MDPI, Basel, Switzerland. This article is an open access article distributed under the terms and conditions of the Creative Commons Attribution (CC BY) license (http://creativecommons.org/licenses/by/4.0/).