Article

Accelerated Aging Characterization of Lithium-ion Cells: Using Sensitivity Analysis to Identify the Stress Factors Relevant to Cyclic Aging

1
Department of Mechanical Engineering, Institute of Automotive Technology, Technical University of Munich, Boltzmannstr. 15, 85748 Garching, Germany
2
DEE Dräxlmaier Electric and Electronic Systems GmbH, Bahnhofstr. 15-17, 84144 Geisenhausen, Germany
*
Author to whom correspondence should be addressed.
Batteries 2020, 6(1), 6; https://doi.org/10.3390/batteries6010006
Submission received: 17 October 2019 / Revised: 14 January 2020 / Accepted: 15 January 2020 / Published: 20 January 2020

Abstract

:
As storage technology in electric vehicles, lithium-ion cells are subject to a continuous aging process during their service life that, in the worst case, can lead to a premature system failure. Battery manufacturers thus have an interest in the aging prediction during the early design phase, for which semi-empirical aging models are often used. The progress of aging is dependent on the application-specific load profile, more precisely on the aging-relevant stress factors. Still, a literature review reveals a controversy on the aging-relevant stress factors to use as input parameters for the simulation models. It shows that, at present, a systematic and efficient procedure for stress factor selection is missing, as the aging characteristic is cell-specific. In this study, an accelerated sensitivity analysis as a prior step to aging modeling is proposed, which is transferable and allows to determine the actual aging-relevant stress factors for a specific lithium-ion cell. For the assessment of this accelerated approach, two test series with different acceleration levels and cell types are performed and evaluated. The results show that a certain amount of charge throughput, 100 equivalent full cycles in this case, is necessary to conduct a statistically significant sensitivity analysis.

1. Introduction

1.1. Motivation

The degradation behavior of lithium-ion cells in automotive applications concerns both research and industry. As there is still little field data available, the characterization of aging is commonly executed by cell tests under defined laboratory conditions and in advance to the application. A proper definition of the test matrix and test procedure allows the test engineer to investigate and evaluate the dependencies of aging. Based on these test results, aging models can be developed and parameterized that map the influence of application-related loads—well-known as stress factors—to the effects of lithium-ion cell aging [1,2,3,4,5,6,7]. For modeling, it is essential to investigate and simulate all aging-relevant stress factors. To this end, a sufficient number of test points and aging duration is necessary to derive the correct functional order and to investigate mutual interdependencies of stress factors. Nevertheless, note that this generic approach is associated with a considerable test effort, which increases with an increasing number of considered stress factors. Therefore, the definition of the test matrix dimension is a balancing act between testing cost and model accuracy.

1.2. Objective and Content of This Study

To meet this challenge, this study evaluates the suitability of accelerated sensitivity analyses for the effect analysis of various stress factors on the aging process of lithium ion cells. As a state-of-the-art method, a sensitivity analysis allows to identify the cell-specific, aging-relevant stress factors and select them as variation parameters within the test matrix for model parameterization. Non-relevant stress factors can be further neglected on a sound basis. This ensures that the test matrix is optimized with regard to testing cost in balance with model quality. Keeping testing costs low, this of course requires a low test effort for the sensitivity analysis itself. Therefore, this study focuses on acceleration approaches for sensitivity analyses on lithium-ion cell aging. In the context of an effective, accelerated aging characterization, the required minimum of test points and aging duration for a statistically significant sensitivity analysis is investigated. In line with this objective, the following issues are addressed in this study.
  • Theoretical investigation on the cause–effect chain of aging: To provide a basic understanding, the cause–effect chain of aging is presented. To demonstrate the need for a sensitivity analysis, existing controversies on the sensitivity of cyclic aging are discussed (Section 2).
  • Experimental test procedure for sensitivity analyses on lithium-ion cells: The experimental set-up for sensitivity analyses on cyclic aging with two distinct acceleration levels is presented. For the practical implementation of the sensitivity analyses, standard battery testing hardware is required, i.e., a battery tester and a temperature chamber (Section 3).
  • Analytical implementation of the sensitivity analyses: The experimental results are evaluated regarding their statistical significance as well as the identifiable effects of the stress factors on cyclic aging. Thereupon, the accelerated approaches are critically questioned. This evaluation is conducted using available statistical software (Section 4).

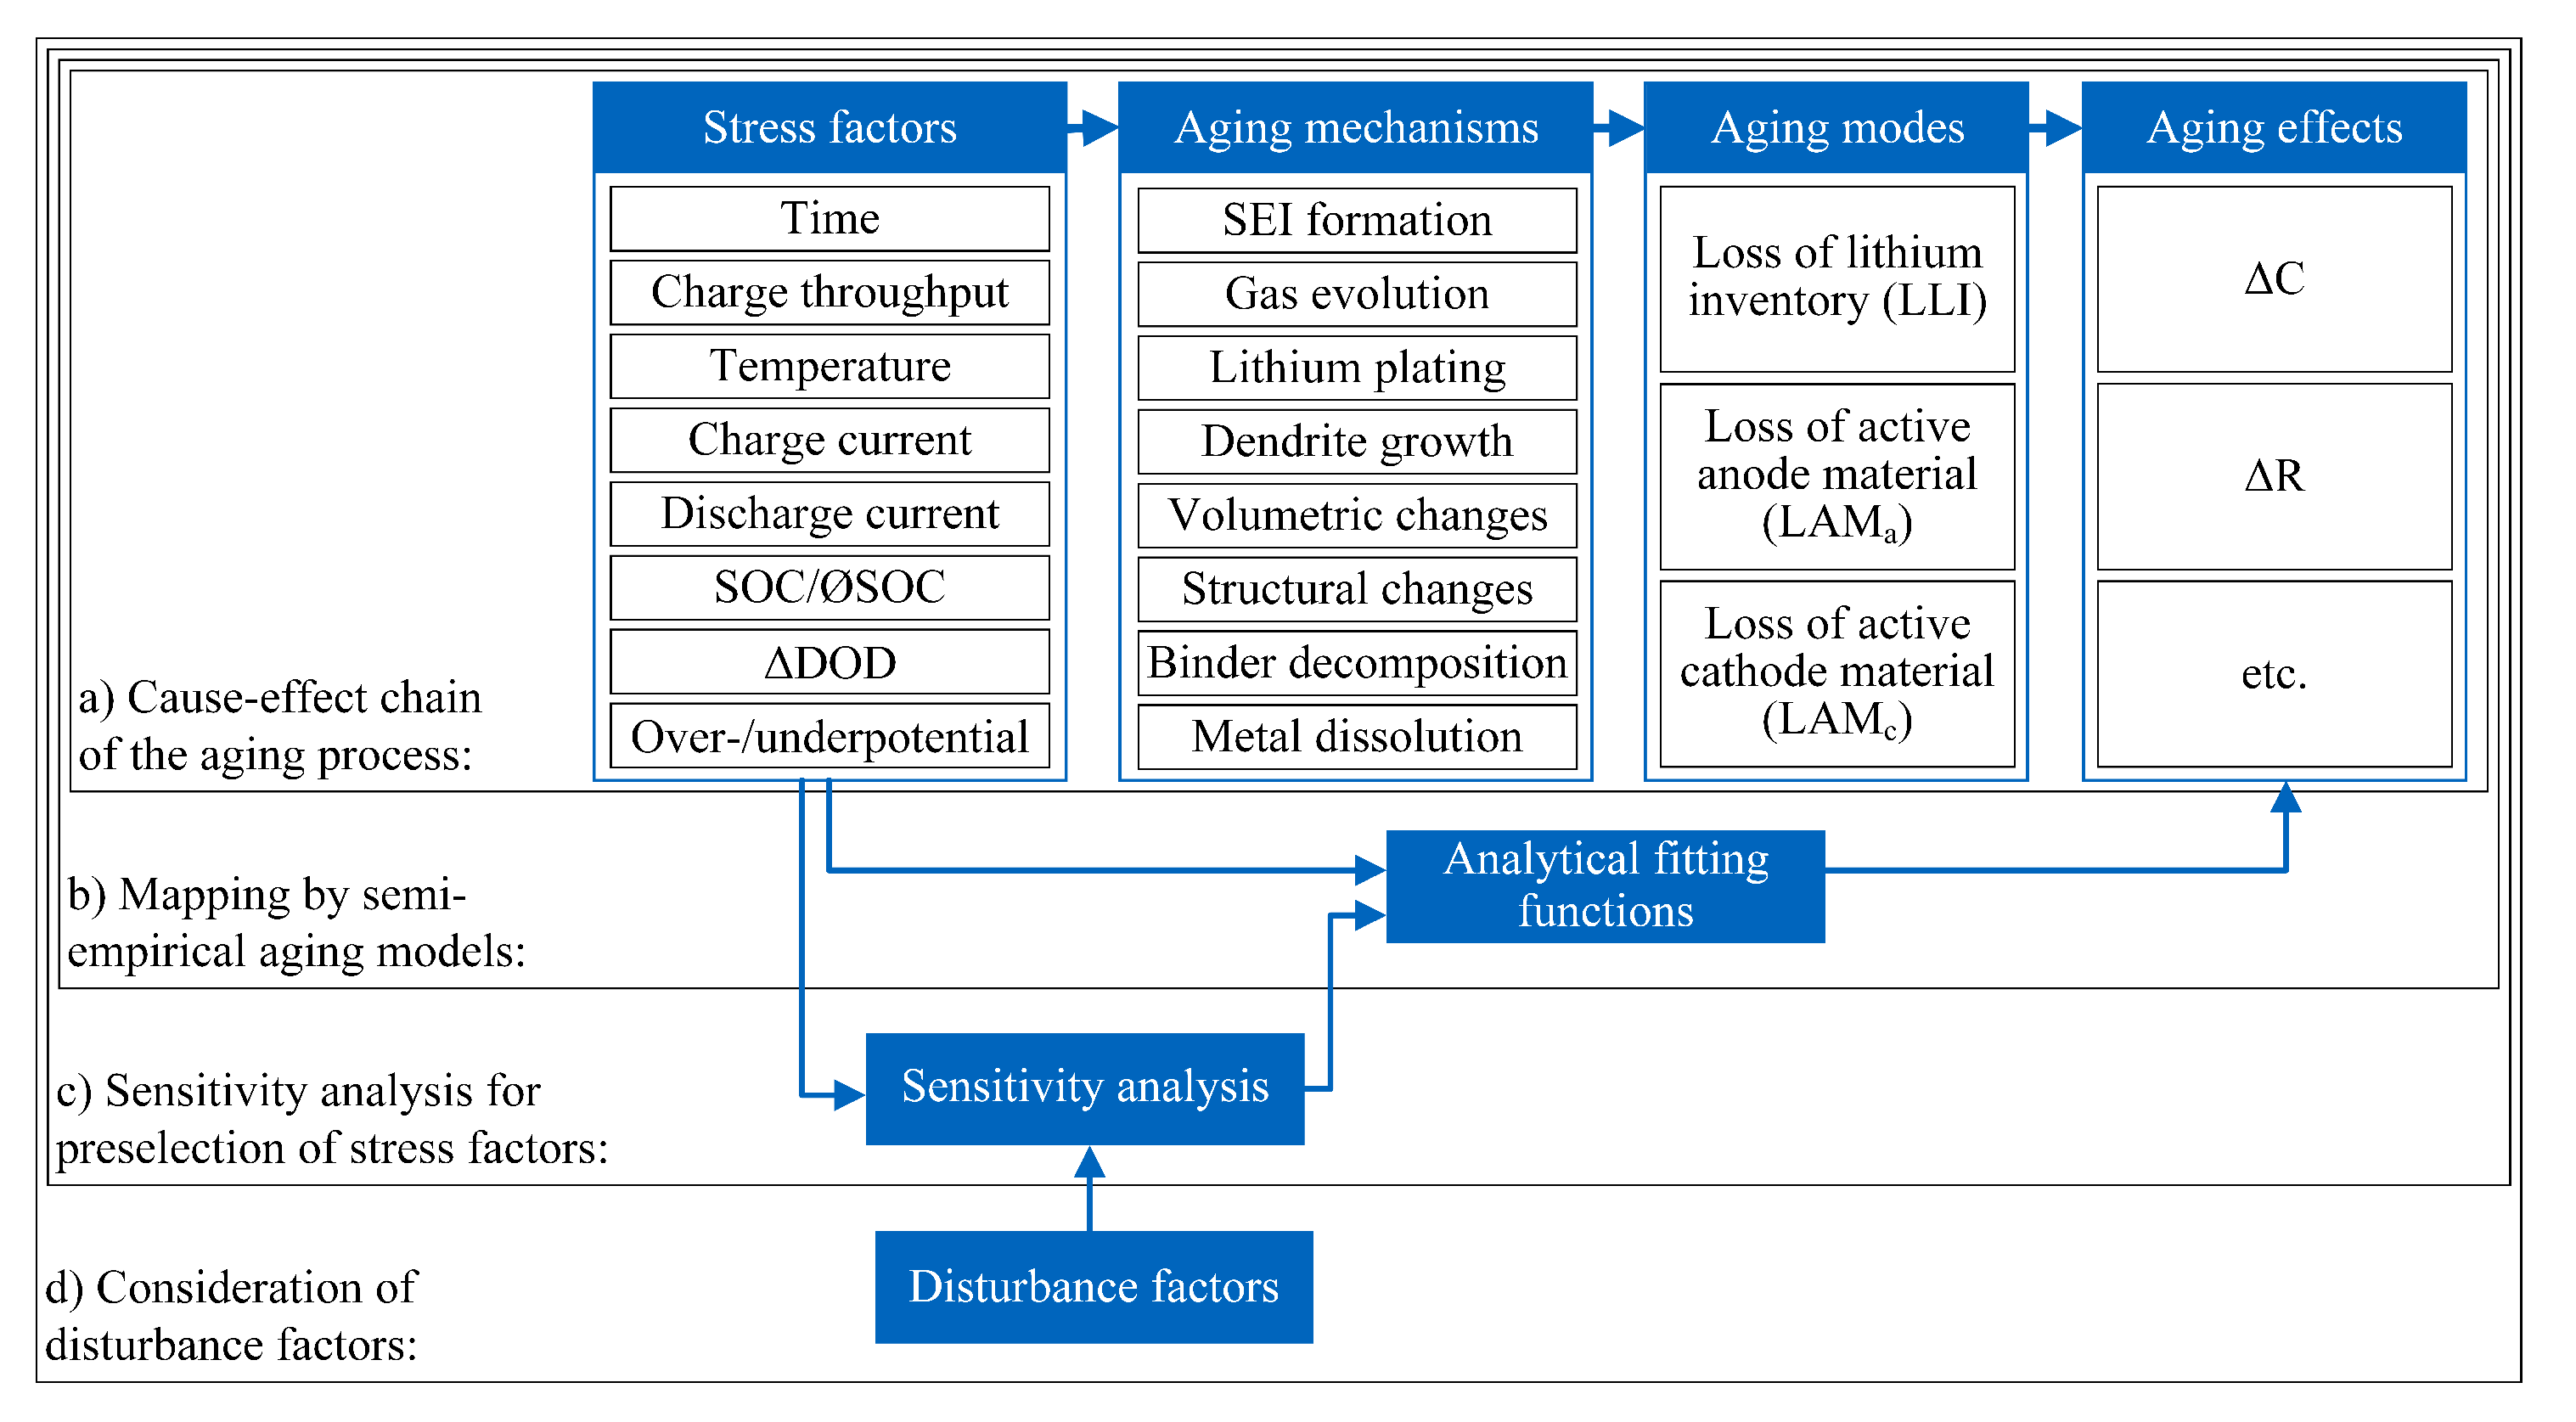
2. Cause–Effect Chain of Aging

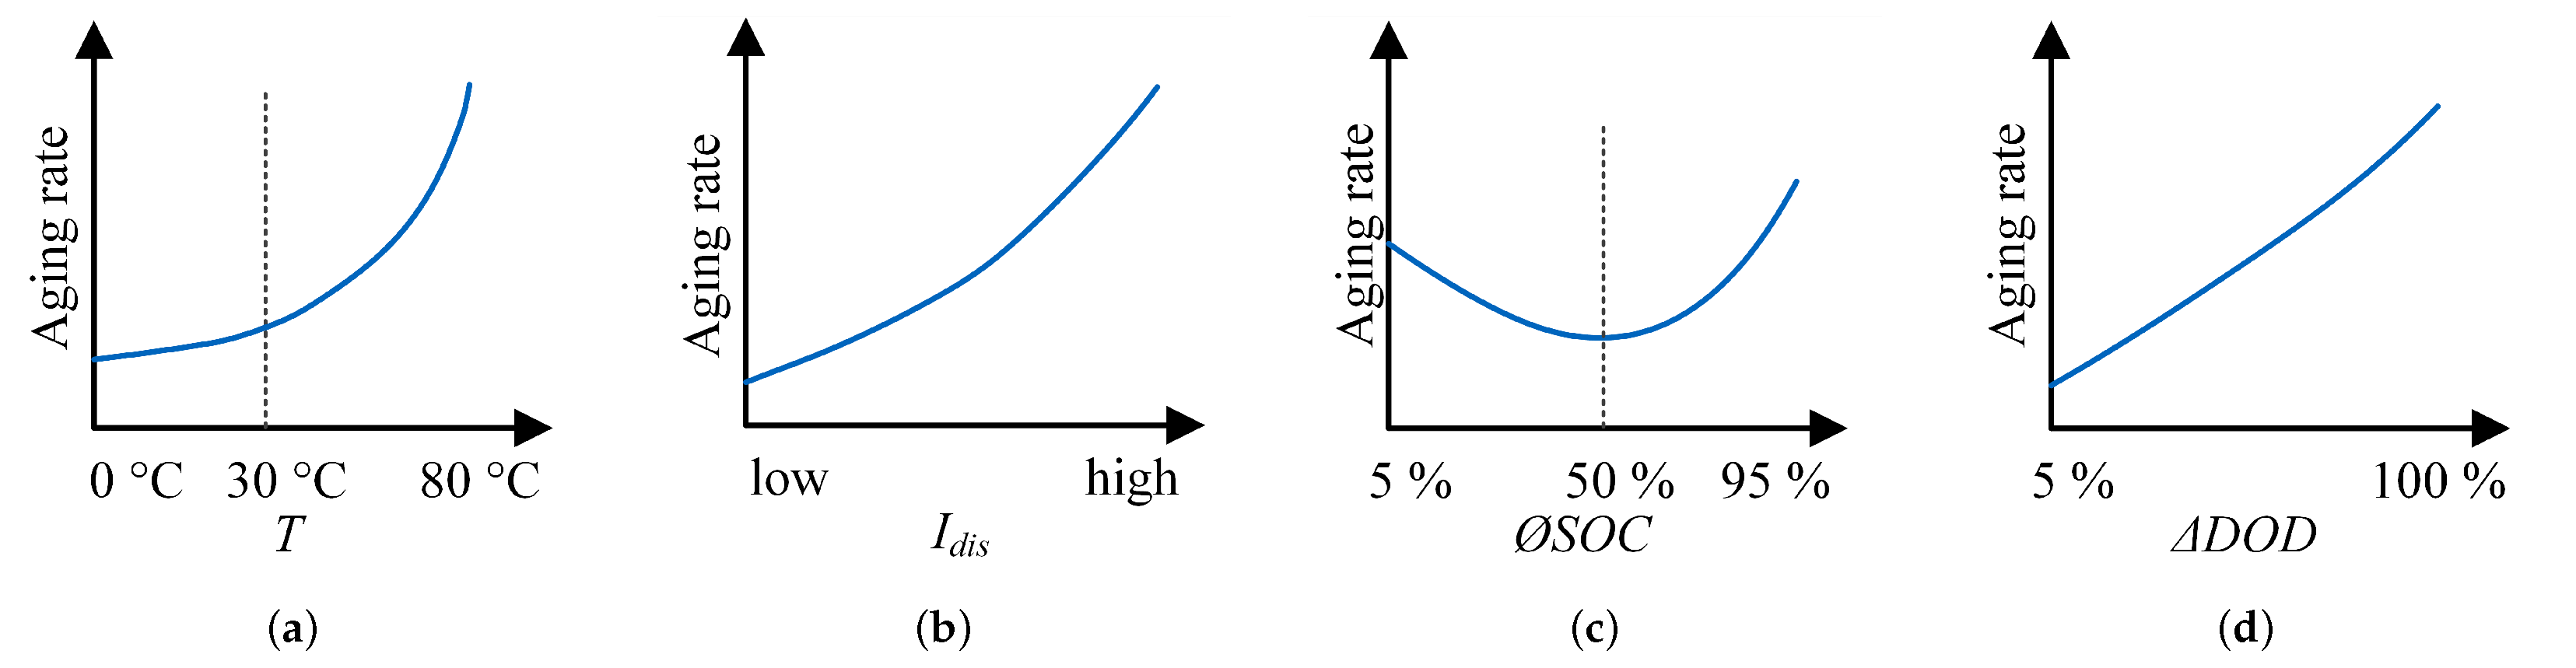
2.1. Stress Factors, Mechanisms, Modes, and Effects of Aging

Figure 1a shows the principal relationships in the cause–effect chain in the aging process of lithium-ion cells: stress factors trigger aging mechanisms, and thus aging modes, whose occurrence results in aging effects [8]. In the application, the aging effects are the consequences of the entire aging process that are actually noticeable to the user. As several cell characteristics change with time and usage in comparison to the initial and brand-new condition [9], the effects of aging are typically quantified by measuring these cell characteristics periodically and tracking their alteration over time. The change in cell capacity Δ C and cell resistance Δ R are popular parameters for this purpose. Another possible, but less widespread, parameter is the long-term relaxation time [10]. Observed aging effects can be reversible or irreversible [11,12]. The aging effects are the consequences of aging mechanisms acting inside the cell, which can be of mechanical or physico-chemical origin and occur at various components in a lithium-ion cell, such as the anode, the cathode, or within the electrolyte [11,13]. The mechanisms can be attributed to calendar aging (when the cell is resting) or cyclic aging (when the cell is charged or discharged) [13,14] and can be linked to three different aging modes [8]. The mechanisms are triggered by stress factors, aging-relevant environmental, or operational conditions to which the cell is exposed. The stress factors time t and charge throughput Q are commonly used as base functions for calendar or cyclic aging, respectively. The ambient temperature T , charging currents I c h a , and discharging currents I d i s , the state-of-charge during storage SOC , or average state-of-charge during cycling Ø SOC , as well as the depth-of-discharge while cycling Δ DOD are additional stress factors. In the scope of this study mechanical stress factors such as vibrations or compression forces are neglected, but are examined in detail by other researchers [15,16]. Similarly, the relevance of the charge current with respect to aging, for example investigated as in [17], is without question, but due to the complexity and exceptionality of lithium plating as the underlying aging mechanism, not a focus of this study.
The sensitivity of lithium-ion cell aging on different stress factors has been already investigated by a large number of researchers. In Table 1, an extractive literature review qualitatively summarizes the key messages of aging studies known to the authors with regard to the relevance of individual stress factors on the aging effects Δ C or Δ R during calendar and cyclic aging. As the cell chemistry has a significant impact on the aging characteristic, the literature review is grouped according to the chemistry of the examined cell, if specified: nickel-cobalt-aluminum (NCA), nickel-manganese-cobalt (NMC), lithium-iron-phosphate (LFP), or lithium-cobalt-oxide (LCO). This review shows a consensus that storage temperature T and SOC are the most relevant stress factors for calendar aging. Many authors also note a strong interaction between these two stress factors, as the effect of SOC on calendar aging is dependent on the prevailing cell temperature: SOC has a strong influence, if T is substantially higher than room temperature. Otherwise, SOC has no influence [11,18,19]. Temperature fluctuations as an additional factor seem to have a minor impact, but are only investigated in one publication [20]. For cyclic aging as well, the ambient temperature while cycling is widely identified as a relevant stress factor. When discussing the relevance of Ø SOC , the end-of-discharge SOC appears to have a minor impact in comparison to the end-of-charge SOC as stated in [20]. These findings lead to the relevance of Δ DOD and to its strong interaction with Ø SOC : The aging relevance of one of the two stress factors must be assessed in relation to the actual level of the other [1,3]. The relevance of Δ DOD is generally detected, but diversely evaluated [2,11,13,19,20,21]. The relevance of the discharge current is also controversially discussed, ranging from having no influence [2] to a strong influence [13,18,20,22]. This controversy allows for the following conclusions. A general statement on the effects of the individual stress factors with regard to the cyclic aging of lithium-ion cells is impossible, thereby necessitating a distinction according to the specific cell candidate. This can be explained, as lithium-ion cells have experienced continuous development and improvement in the past decades. As a consequence, not only have different chemistry groups evolved, but the specific material mass ratios also vary within these groups. In addition, electrolyte additives influence the aging characteristic [23,24].

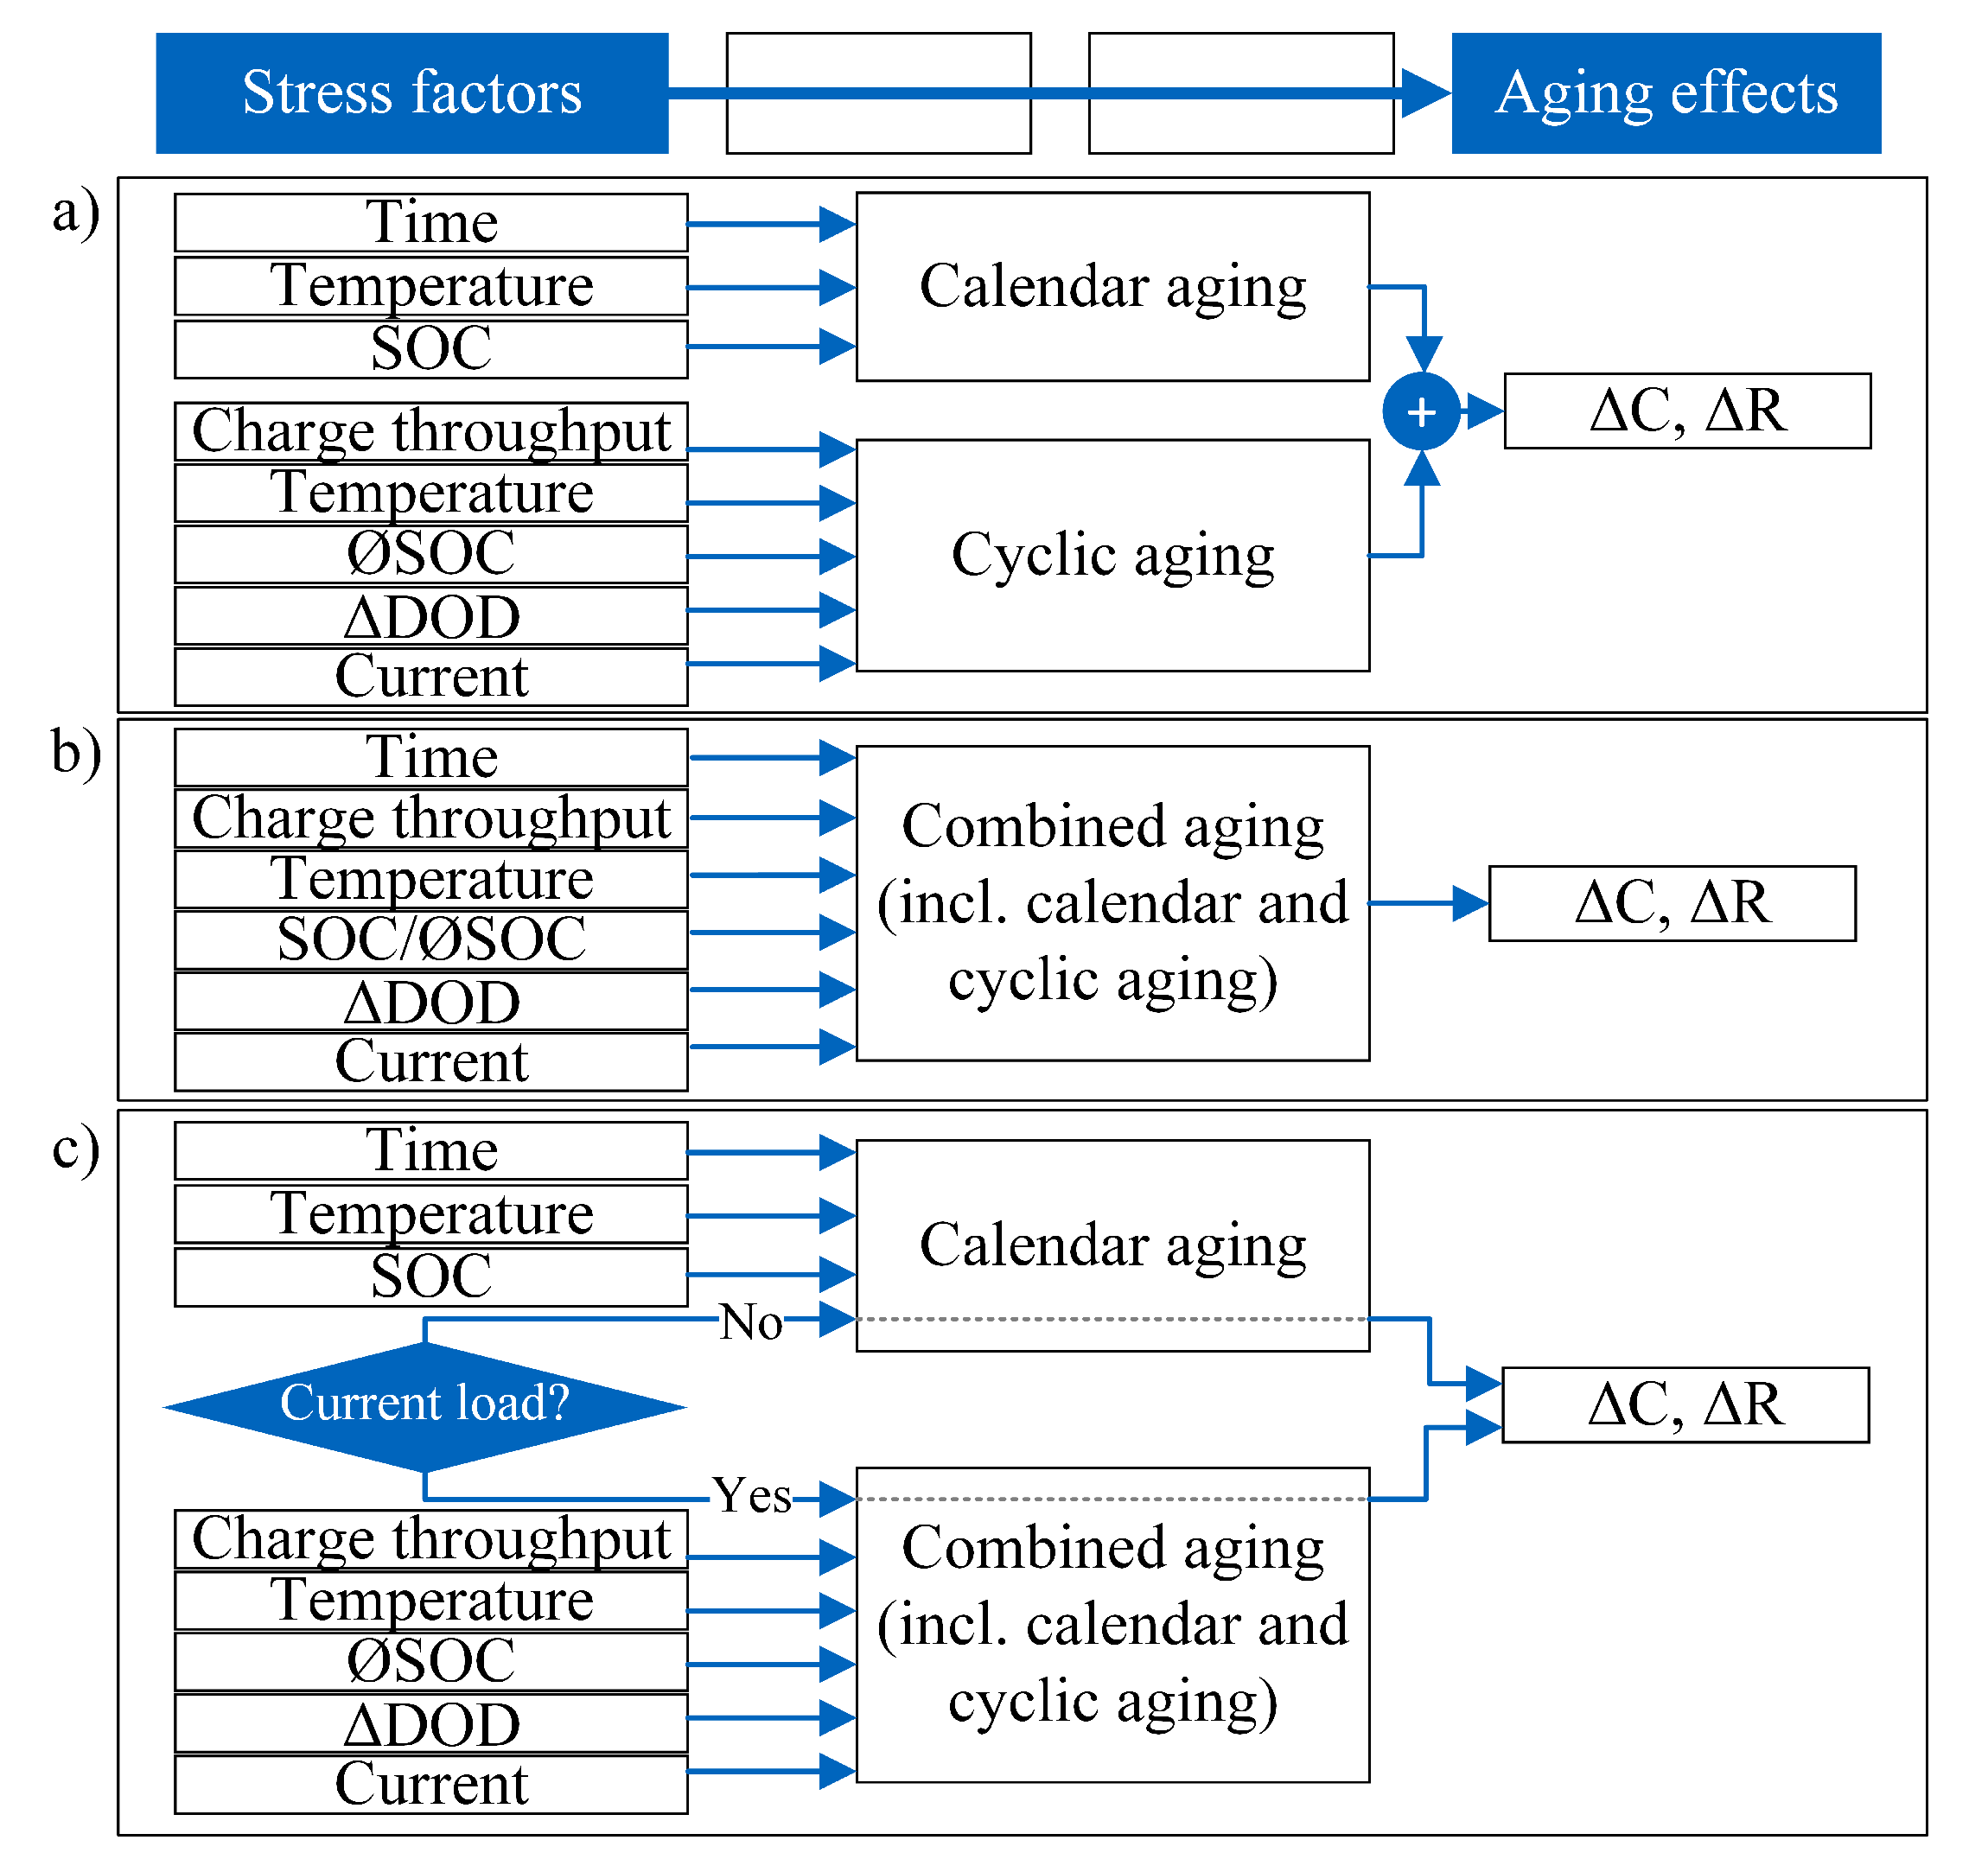
2.2. Mapping by Semi-Empirical Aging Models

The consensus on calendar aging but controversy on cyclic aging found in the literature review is also reflected in published semi-empirical aging models. In semi-empirical aging models, cell-internal processes, and thus aging mechanisms and modes, are not modeled in detail like they are in physico-chemical models. Instead, cell aging is merely analytically described by fit functions that map the impact of stress factor levels on the resulting aging effects as shown in Figure 1b. Model function and parameters are derived from empirical observations during the test series carried out. For these fit functions, analytical physical description functions are used if available—the Arrhenius dependency, for example—and therefore may improve the model accuracy. In comparison to physico-chemical modeling, semi-empirical models show the benefit of low computational complexity, which makes them applicable for on-board automotive applications.
There are different modeling approaches for those semi-empirical aging models that take both calendar and cyclic aging into account. Often a distinction is made between a calendar (with time as base function) and a cyclic (with charge throughput as base function) share of aging, using a superposition approach for the calculation of total aging effects (Figure 2a). Alternatively, a combined approach with no distinction between calendar and cyclic aging is feasible (Figure 2b). Wang et al. use a combined approach in a first model variant [27], but switch to a superposition approach in a later publication [5]. A special case of a combined modeling approach can be found in Baghdadi et al. [28], which uses Dakin’s degradation approach [29] with time as joint basic function combined for calendar and cyclic aging. As a third modeling variant, a case distinction approach is conceivable (Figure 2c). For this approach, one model branch for calendar aging is designed and parametrized as in the superposition approach with calendar aging test results. A second model branch considers combined aging during current loading, taking the calendar and cyclic share into account. Depending on the load case (current loading: yes or no), the expected aging is calculated by one of the model branches. As a benefit, with this approach, the test series results on cyclic aging do not have to be corrected by the included calendar share.
A summary of published semi-empirical aging models is shown in Table 2. In addition to the addressed cell chemistry, the table shows which stress factors are used as model inputs and which aging effects can be calculated as model outputs. For calendar aging, the majority of aging models consider storage temperature and SOC as input parameters, even though different cell chemistries are considered. This is in accordance with the consensus on relevant stress factors for calendar aging, as discussed in Table 1. For cyclic aging, the image of considered model input parameters is more diverse and confirms the controversy as depicted in Table 1. In addition, it must be noted that only a few of the listed publications in Table 2 discuss the aging-relevance of the chosen model input parameters. For example, Wang et al. state in both publications [5,27] that Δ DOD has a minor impact in comparison to temperature and discharge current. De Hoog et al. [7] consider the discharge current as an influencing factor first within their test matrix, but find no relevant effect on aging during the test evaluation, therefore the discharge current is not used as an input parameter for the simulation model. All other publications, related to the respective aging models, do not give a detailed explanation for the choice of model input parameters with regard to the specifically addressed cell candidate.

2.3. Sensitivity Analysis as an Essential Step

The controversy on relevant stress factors for cyclic aging, however, demonstrates that a well-founded selection of model input parameters is an essential step prior to semi-empirical aging modeling. To achieve the best possible model accuracy, within the limitations of the semi-empirical approach, it must be ensured that all aging-relevant stress factors are considered as input parameters. On the other hand, and for a minimum of test effort, aging-irrelevant stress factors should be excluded from the final test matrix for model parameterization. Performing a sensitivity analysis on the cell-specific aging process is a promising method to resolve this issue (Figure 1c). Different approaches using sensitivity analyses in the process of aging modeling can be found in [32,33,34,35,36]. Bauer et al. [32] focus on the investigation of the interrelations between the aging effects Δ C and Δ R as well as loss in power capability during cyclic aging. Here, the sensitivities of these interrelations are analyzed at different stress factor conditions. Edouard et al. [35] apply a sensitivity analysis to investigate the impact of temperature and discharge current on the functional parameters of an electrochemical model. Consequently, the objectives for the sensitivity analyses conducted by Bauer et al. and Edouard et al. differ significantly from the objective described in this study and therefore are not suitable for comparison. Objectives for the application of sensitivity analyses that are comparable to this work are found in Cui et al. [33], Dubarry et al. [34], and Su et al. [36]. Here, sensitivity analyses are respectively used to determine the relevant stress factors—among temperature, charge–discharge current, depth-of-discharge, and average state-of-charge during cycling—for the aging effects Δ C or Δ R and for later semi-empirical modeling. In these publications, the sensitivities are analyzed after a high number of charge–discharge cycles: up to 1000 cycles in Cui et al. [33] and Su et al. [36], as well as more than 220 cycles in Dubarry et al. [34].
This illustrates where the authors of this work still see an open research question: What progress of cyclic aging is necessary in order to provide a statistically significant sensitivity analysis? This question is important in the context of an accelerated aging characterization, where an overall low testing effort is desired, but reliability of results is essential as well. Therefore, different approaches for accelerating sensitivity analyses are investigated in this work. To this end, the idea of acceleration focuses on two aspects: On the one hand, the factor effects to be investigated should be able to be tested with a small number of test points. The factor effect thereby describes the difference in the obtained test results between the test point with a minimum and the one with a maximum factor level. On the other hand, a low summed charge throughput is intended for each test point, thus resulting in a minimum testing duration. The first mentioned aspect leads to the decision to test only one cell specimen for each test point, which allows for a higher total number of test points given a limited number of available cell specimen. When determining the factor levels for the individual test points, especially when only a small number of test points is to be realized, the approximate relationships as presented in Figure 3 must be considered. Taking the dependency on Ø SOC as example, a poor choice of factor levels—e.g., symmetrically to the minimum aging rate at around Ø SOC = 50 % —may lead to the result of “no aging relevance” during the sensitivity analysis, as the same aging rate can be expected at both factor levels. Additionally, for the two factors Ø SOC and Δ DOD , it needs to be considered that not all factor combinations can be combined, e.g., Ø SOC of 75 % and Δ DOD of 60 % cannot be realized in combination. Thus, the practical feasibility must be taken into account, when defining the factor levels or respectively the test matrix.
Note that the focus of this study is the sensitivity analysis, but not the derivation of an aging model from the test results. Therefore, the number of factor levels can be chosen comparatively freely. In the case of an intended modeling, the number of factor levels must be chosen according to the presumed functional correlation between model input and model output.

2.4. Consideration of Disturbance Factors

When planning, implementing, and evaluating a sensitivity analysis, it must also be taken into account that in addition to the stress factors under investigation, disturbance factors can also affect the aging process and thus the test results of the sensitivity analysis (Figure 1d). Disturbance factors, thus factors whose influence on aging is not of interest, must be brought under experiment control in order to keep the error dispersion low [38,39]. It is the aim of a robust test design to hold the disturbance factors and thus their influence on the results negligible or at least constant [39]. In Table 3, the relevant disturbance factors for calendar and cyclic aging tests—investigating one specific cell type—are listed.
Disturbance factors, both for calendar and cyclic tests, are fluctuations in cell production, which include but are not limited to alternating material compositions in the cell components. These fluctuations are noticeable by varying initial cell characteristics such as capacity and resistance [40,42]. For one specific cell type, a high degree of cell characteristic consistency can be achieved when performing the test series with cells from one production batch. In addition, the cells should have a similar logistics history, e.g., the same transport and storage duration until usage. When performing initial check-up tests at the beginning of a test series, a permissible spread of cell parameters must be defined and outliers, which may indicate cell-internal quality issues, must be sorted out. Environmental conditions that may further influence the aging progress include the humidity within the test environment as well as vibration and clamping as mechanical forces acting on the cell. Additional disturbance factors, especially for calendar aging, are fluctuations in the storage temperature, e.g., due to differently set temperature conditions during storage periods and regular check-up tests, due to control fluctuations within the climatic chamber or due to different positioning within the climatic chamber. Second, when conducting the calendar aging tests under open-circuit condition, self-discharge effects during the storage periods and related changes in the storage SOC must be considered. Note that the conventional approach for calendar aging test series, in which check-up tests are periodically performed, does actually not map pure calendar aging due to the regular charge throughput. Consequently, the observable aging effects are affected by the damage of the Solid Electrolyte Interphase (SEI) [8] during the check-up testing. Furthermore, Schmitt et al. [25] found that aging mechanisms in addition to the SEI layer formation will take place in calendar aging test series due to the charge throughput during the check-up testing. For the measurement of capacity loss during calendar aging, reversible effects due to the anode overhang must also be considered as a disturbance factor and optimally quantified within the measurement results [12]. As a disturbance factor during cyclic aging, fluctuations in the ambient temperature also need to be considered. The self-heating of the cell due to current loading and the associated heat loss at the cell’s internal resistance are to be considered as additional temperature effects. Consequently, temperature gradients between the cell core and surface are created. Due to the practical implementation of cell tests, it must also be taken into account that cells exchange heat, depending on the cell mounting design and resulting spatial proximity of neighboring cells. Additional heat transfer due to the chosen cell contacts must be considered as well as channel-related measurement inaccuracies. These inaccuracies may also lead to charge or voltage drifts during long-term cycling. In view of the difference between calendar and cyclic aging, the rest time during cycling as well as the ratio of rest time to cycling time must, strictly speaking, also be regarded as a disturbance factor.

3. Methods and Experimental Set-Up
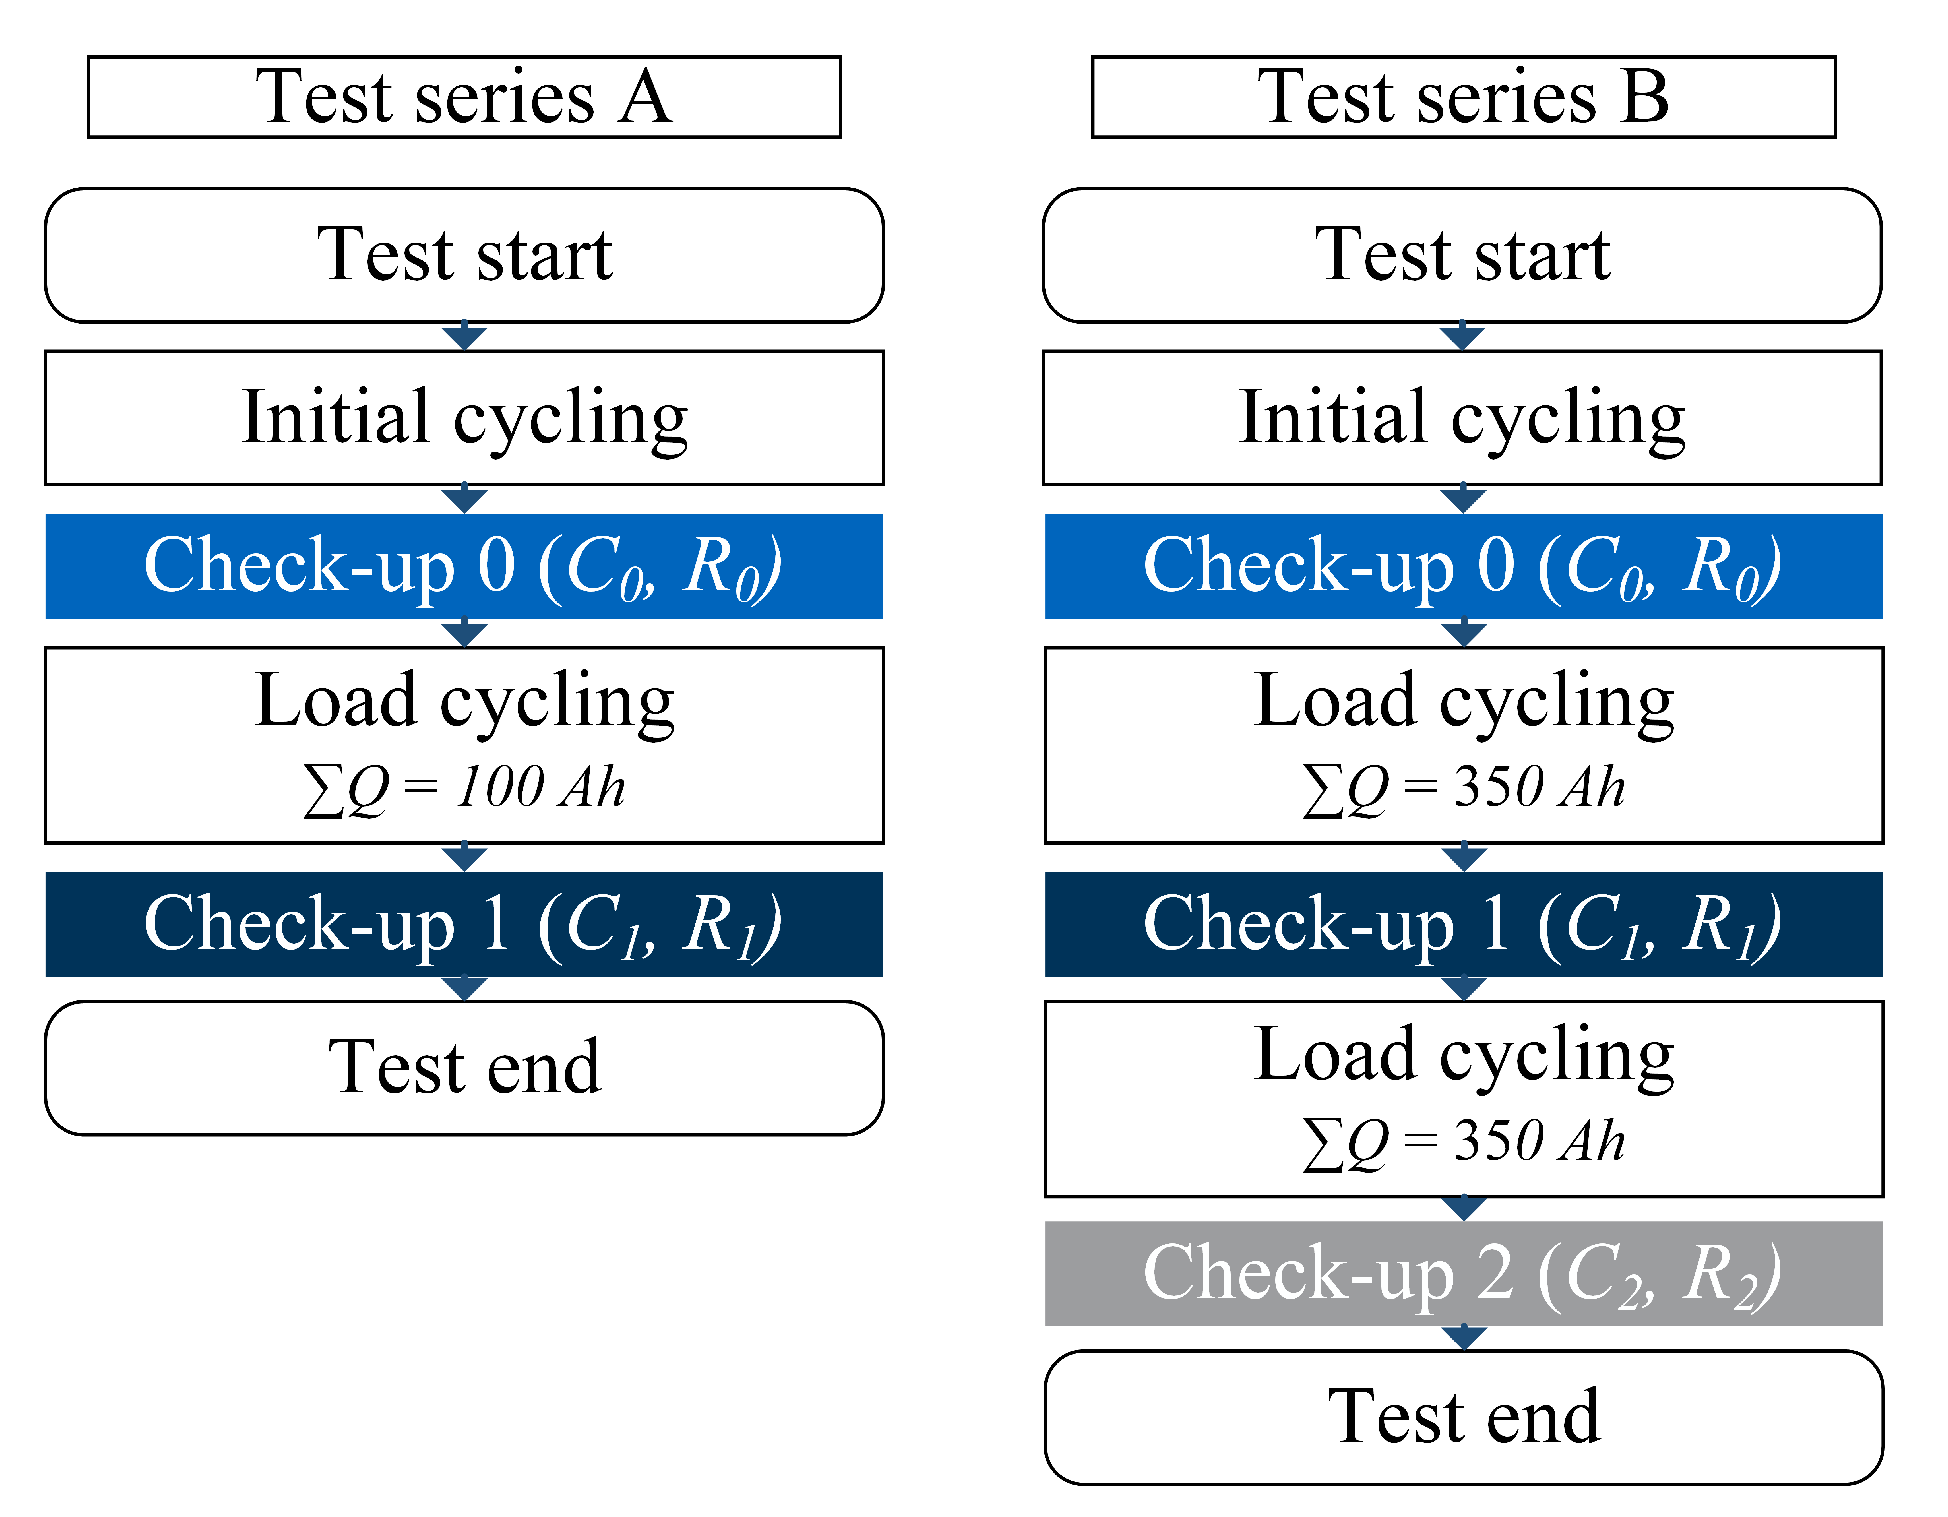
As outlined in Section 2.3, two approaches for accelerating sensitivity analyses are investigated in this study: The evaluation at a low summed charge throughput as one option, the investigation with a minimum of test points as the other. For this purpose, two different test series for sensitivity analyses are performed in this study. In the sense of design of experiments (DOE), the test series A and test series B vary in the applied test design, i.e., the factor plan. For the basics of DOE and test designs in general, the authors refer to the corresponding relevant literature [39,43]. The two test designs differ in the number of test points and also in the number of investigated factor levels (Section 3.1). In addition, different values of summed charge throughput are tested: a low summed charge throughput for test series A and a moderate for test series B. In spite of these differences, the same objective is pursued in both test series, namely to investigate the aging relevance of the stress factors T, I d i s , Ø S O C and Δ D O D to cyclic aging. Consequently, only the individual factor effects are assessed during the subsequent analysis of test results, while the interaction effects of multiple stress factors are not discussed.

3.1. Test Designs

In test series A, a full factorial design as shown in Table 4 is applied, which means that the test matrix is fully occupied and all combinatorial possibilities of stress factor levels are considered. Thus, the number of test points is calculated by n l n f , where n l is the number of considered factor levels and n f is the number of factors. With regard to a reasonable test effort, a low number of factor levels is recommendable. Therefore, two factor levels are chosen for each of the four stress factors in test series A, resulting in 2 4 = 16 test points. One cell specimen is tested for each test point. Considering the known qualitative dependencies in Figure 3 as well as manufacturer specifications, one factor level with an assumed low aging rate and one level with an assumed high aging rate is defined for each stress factor. Under these premises, only Ø SOC -values above 50 % are investigated: a low or even minimum aging for Ø SOC of 50 % , a higher aging for 75 % . To allow all combinations with the set factor levels for Δ DOD , 10 % and 50 % are chosen as levels for Δ DOD .
In test series B, a fractional factorial design is utilized. In comparison to a full factorial designs, the test matrix is not fully occupied and only a fraction of the experimental space is investigated. This is at the expense of blending individual and interaction effects for the various stress factors, but shows the essential advantage that the number of test points, and thus testing costs, are reduced, especially if a greater number of factor levels is desired. For the creation of fractional factorial designs, different well-established design guidelines are available through which valid statements can be made for the entire, though partially occupied, experimental space [39]. Especially in the case of lithium-ion cell testing, where the combination of factor levels is subjected to practical constraints, a D-optimal fractional factorial test design is a good choice. In D-optimal designs, the number of factor levels as well as the level spacing can be chosen individually for each factor. In addition, the factor levels for one test point can be adjusted to some degree to allow practical implementation. This adjustment is associated with a minimal and tolerable influence on the design quality [44]. As a result of these considerations, the test matrix in Table 5 is set up for test series B, again under consideration of manufacturer specifications. It shows that at a moderate number of 30 test points, three factor levels for T and I d i s as well as eight levels for Ø SOC and Δ DOD , respectively, can be investigated. In comparison to test series A, this resource-saving fractional factorial design allows to investigate the entire Ø SOC range. As in test series A, one cell is tested for each test point in the matrix.

3.2. Cell Candidates

In the test series A, 16 brand-new Panasonic NCR18650PF cells are used, which originate from the same production batch. After production and purchase, all cells have been stored at our institute at about 20 C for three years and thus have a similar logistics history. In test series B, 30 brand-new Sony (Murata) US18650VC7 cells are utilized. All cells stem from the same production batch, have been stored at 25 C for less than one year before the test start, and thus also have a similar history of logistics. Further cell specifications are depicted in Table 6. The use of two different cell candidates is caused by different project affiliations of test series A and B. The transferability of the applied procedure for the sensitivity analyses can thus be assessed.

3.3. Testing Procedure

All tests are conducted using a BaSyTec XCTS25 system as battery tester and the temperature chamber Memmert IPP110plus. After the test start, all cells undergo an initial cycling for activation and to ensure a similar initial condition. The cycling consists of ten consecutive half scale cycles between SOC values of 25% and 75% at 1 C in charge and discharge direction, conducted at an ambient temperature of 25 C.
The cells are regularly subjected to check-up tests to determine discharge capacity C d i s and DC resistance R D C . To determine the discharge capacity, the cells are first charged applying a constant-current/constant-voltage (CCCV) procedure with a constant charge current of C / 3 , an upper cut-off voltage of 4.2 V and a cut-off current of C / 25 . After a pause of 30 minutes for thermal and electrochemical relaxation, the cells are discharged again applying a CCCV procedure, here with a constant discharge current of C / 3 , a lower cut-off voltage of 2.5 V, and a cut-off current of C / 20 . This charge–discharge sequence is repeated twice, whereas the average of the obtained discharge capacities is used as check-up capacity. To determine the DC resistance, a pulse test according to VDA test procedure with 1 C current pulses in charge and discharge direction is performed [45]. The resistance is evaluated at the first discharge pulse using the voltage values before as well as 10 s after pulse start.
For load cycling, the cells are continuously charged and discharged in constant-current mode as specified in the test matrices, thus at specific values for T, I d i s , Ø S O C , and Δ D O D . As the charge current is not analyzed as a stress factor, the charge currents during load cycling are kept constant for all test points and at a low value of C / 3 . The stress factor T is set as ambient temperature during load cycling using a temperature chamber. A pause of 30 minutes is provided between charge and discharge phases for thermal relaxation of the cells. The factor levels for Ø S O C and Δ D O D are set based on the measured charge throughput. Depending on Δ DOD , the specified Q during load cycling and between two consecutive check-up tests requires different repetitions of charging-discharging sequences. To keep the influence of present disturbance factors constant, all test points in test series A and B are conducted using the same temperature chamber and battery testing hardware. For the entire test duration, the same position in the temperature chamber and in the cell mounting system is maintained. The cell mounting system is designed in such a way that the temperature interference between neighbored cells is minimized.
For the two test series A and B, the sequence of initial cycling, check-up testing, and load cycling is summarized in Figure 4.
In test series A, the summed charge throughput Q during load cycling amounts to 100 Ah, which corresponds to a rounded number of 17 equivalent full cycles. An equivalent full cycle is defined as a full charge and discharge related to the value of nominal capacity. Thus, the noted values for Q also include the charge throughput in charge as well as in discharge direction. In test series A, only one check-up test is performed after the initial check-up 0 before the test series is completed. This overall low summed charge throughput, in addition to the low investigated number of test points in test series A, represents the maximum level of acceleration for the sensitivity analysis investigated in this study. In comparison, in test series B, a summed charge throughput of 350 Ah or 50 equivalent full cycles between two consecutive check-up tests is specified. Furthermore, two check-up tests are performed after check-up 0 and before test end, which allows the investigation of two available conditions for sensitivity analysis and thus two different and moderate levels of acceleration.

4. Results of Sensitivity Analyses

The results of check-up testing from the test series A and B, which are the available data basis for the subsequent sensitivity analysis, are depicted in Figure 5. The measured values for capacity and resistance during the check-up testing, represented with filled bars in Figure 5, must be designated as results for total aging comprising shares of calendar as well as cyclic aging when assuming the superposition approach as shown in Figure 2a). Thus, the check-up results actually must be corrected by the included calendar share if the cyclic aging is to be evaluated. For the cell candidate used in test series A, no detailed knowledge about the calendar aging characteristic is available. Therefore, the sensitivity analysis must be conducted on the results for total aging. However, for the cell candidate used in test series B, test results from a test series on calendar aging are available [46]. Using an approach according to [1], the available test results allow to parameterize appropriate model equations, in which it is assumed that the share of calendar aging is dependent on the average cell temperature and SOC during load cycling. Subsequently, the share of calendar aging in the measured capacity and resistance changes in check-ups 1 and 2 of test series B can be calculated and subtracted. The values for cyclic aging calculated in this way are shown in Figure 5 with non-filled bars. Thus, for test series B, the values for total as well as cyclic aging are available for sensitivity analyses.

4.1. Null and Alternative Hypothesis

The first step in a sensitivity analysis is to define the null hypothesis (“The investigated factors do not have an effect on the test results.”) as well the alternative hypothesis (“The investigated factors do have an effect on the test results.”). The null hypothesis can be tested with the help of the effect-related p-values. Conventionally, a p-value less than 0.05 disproves the null hypothesis and indicates that an identified factor effect is a true effect. In literature, a p-value below the set tolerance level also refers to statistical significance or a statistically significant effect. In contrary, p-values above 0.05 do not allow to disprove the null hypothesis and indicate an identified factor effect as a possible pseudo effect [39].

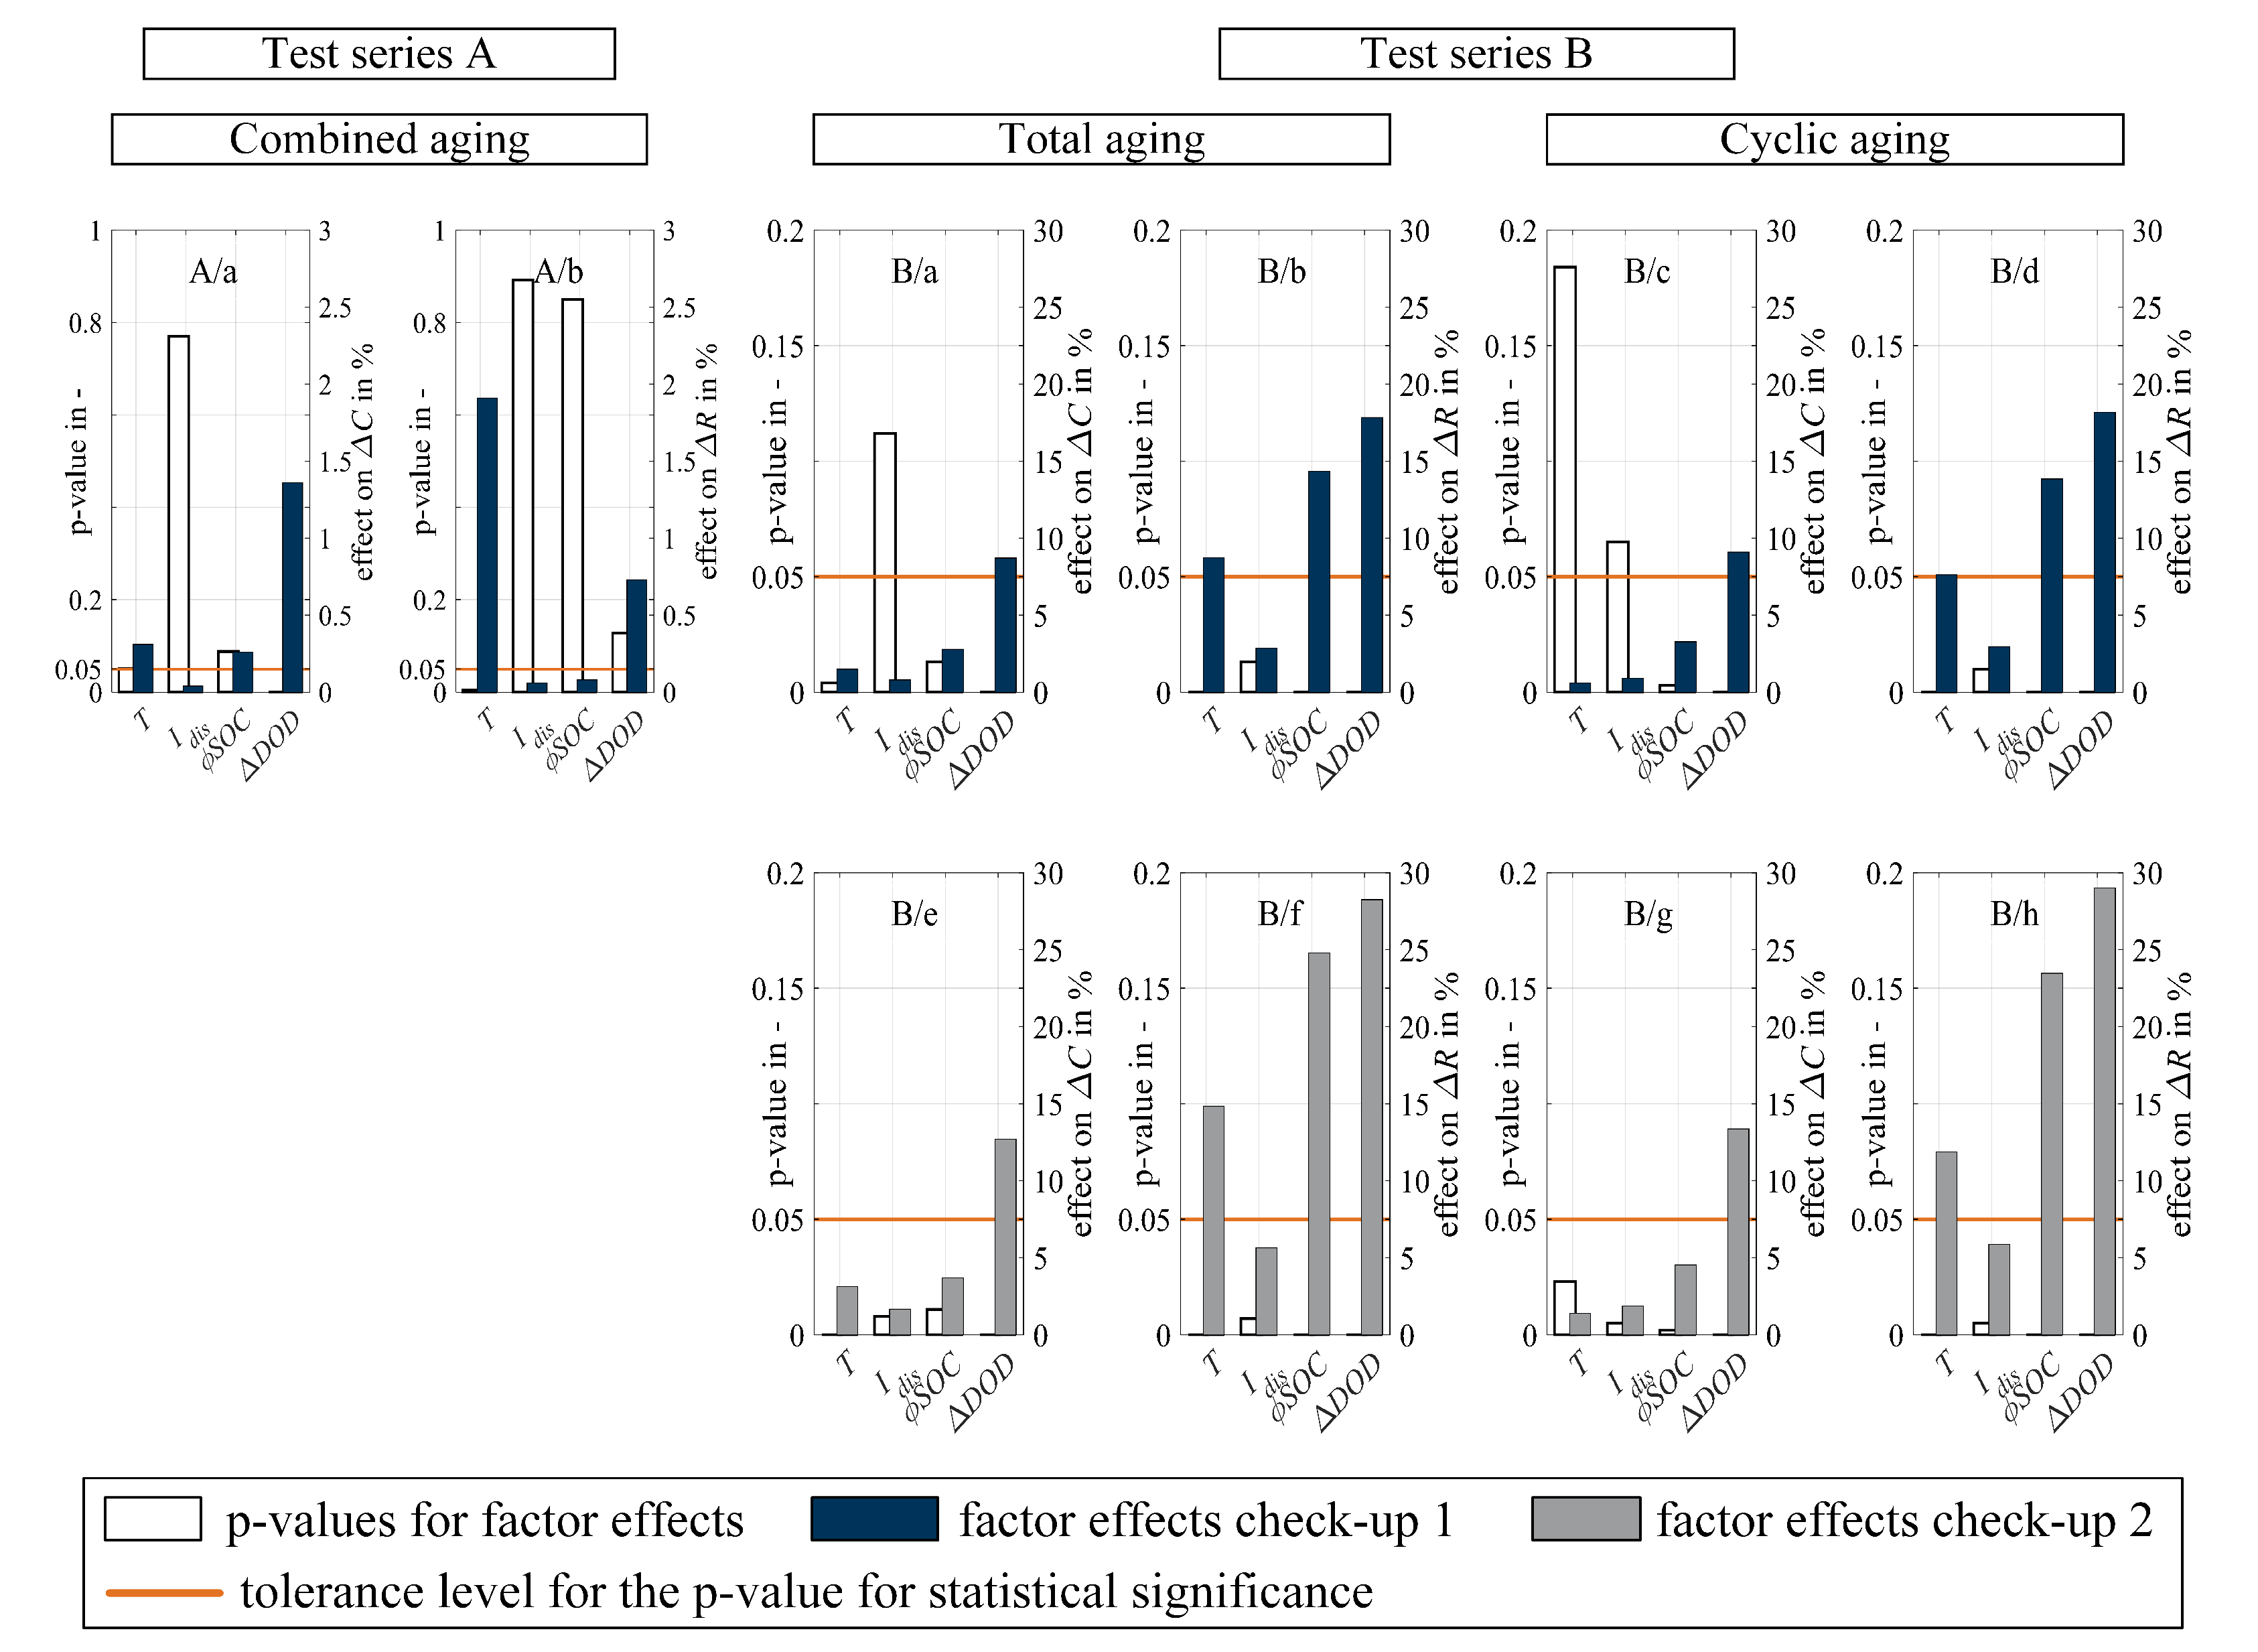
4.2. Analysis on Test Series A

As outlined in Section 2.1, the anticipated long-term effects of aging are a decrease in capacity and an increase in resistance. In contrast, Figure 5A/d states on average a decrease in resistance for check-up 1. Only cycling at harsh conditions (high factor levels for T and Δ DOD in test points 1, 3 and 5) leads to an increase in resistance. Stroe et al. [47] also noticed a transient resistance drop within an overall increasing course during the early stage of aging. Thus, the results obtained for test series A at check-up 1 emphasize an early aging condition as to be expected after only 100 Ah of cycling. Therefore, it must be questioned whether a sensitivity analysis is sensible at this point, as the aging condition of the lithium-ion cells appears unstable. This objection is supported by the p-values obtained for test series A, depicted in Figure 6A/a and Figure 6A/b, which do not allow to disprove the null hypothesis ( p value > 0.05 ). Consequently, the corresponding factor effects cannot be clearly classified as true, and the evaluation becomes obsolete.

4.3. Analysis on Test Series B

For test series B, the capacity and resistance values measured during check-up 1 and 2 (shown in Figure 5B/c–f) demonstrate the anticipated relative changes due to cyclic aging: on average a decrease in capacity and an increase in resistance. The analytically calculated results for cyclic aging show lower changes in amount, as to be expected due to the superposition approach, but on average the same tendency of decreasing capacities and increasing resistances.
As shown in Figure 6B/a–h, the obtained p-values for test series B are in a significantly lower value range than for test series A, whereas the effects are in a higher range. Discussing the results for total aging first, the p-value for the effect of I d i s on capacity for check-up 1 still exceeds the significance level (p-value > 0.05). Thus, the results for check-up 1 are not further evaluated due to potential pseudo-effects. For check-up 2, however, the sufficient low p-values (p-value < 0.05) allow to consider all factor effects as true. As outlined in Section 2.3, the factor effects describe the difference in the aging results between the test points with the minimum and those with the maximum factor level. Having higher effects in check-up 2 (Figure 6B/e and Figure 6B/f) than in check-up 1 (Figure 6B/a and Figure 6B/b), and thus reflects the increasing spreading of the cell parameters capacity and resistance along the aging process. Figure 6B/e and Figure 6B/f shows the same ranking of aging-relevant stress factors for the two aging effects Δ C and Δ R : I d i s < T < Ø SOC < Δ DOD , and rates Δ DOD as the most aging-relevant stress factor. It should be noted that the same ranking is already recognizable in the obtained factor effects for checkup 1, despite the too high p-value (p-value > 0.05) for the effect of I d i s on capacity suggested potential pseudo-effects. Despite the same ranking, the absolute effects on Δ C and Δ R in Figure 6B/e and Figure 6B/f diverge. In addition, the effect ratios differ: For example, E Ø SOC , Δ C : E Ø SOC , Δ R E Δ DOD , Δ C : E Δ DOD , Δ R . This indicates different sensitivities for the two aging effects Δ C and Δ R and can be used as evidence that the acting stress factors initiate aging mechanisms and modes that do initiate the aging effects Δ C or Δ R to different extents.
The results of cyclic aging in test series B, again show partially too high p-values (p-value > 0.05) for check-up 1 (Figure 6B/c and Figure 6B/f). For check-up 2 (Figure 6B/g and Figure 6B/h), all p-values are sufficient low (p-value < 0.05) and again allow to consider all factor effects as true. As the calendar share, which is dependent on T and SOC , is subtracted from the values of total aging to obtain the share of cyclic aging, it is obvious that the factor effects corresponding to T and SOC are affected primarily when performing the sensitivity analysis now on the calculated results for cyclic aging. In addition, also other factor effects can be influenced due to existing interaction effects between the stress factors. In consequence, the effects on Δ C now exhibit a different ranking when analyzing the cyclic aging: T < I d i s < Ø SOC < Δ DOD . The effects on Δ R for cyclic aging still shows the same ranking as for total aging. This finding is in accordance to the literature review in Table 1, which indicates different levels of relevance for the stress factors on the aging effects Δ C and Δ R .

5. Summary and Conclusions

5.1. Accelerated Sensitivity Analyses for the Aging Characterization of Lithium-Ion Cells

Many aging mechanisms and modes are involved in the process of cyclic aging of lithium-ion cells. Their sensitivity to acting stress factors—among T, I d i s , Ø SOC , and Δ DOD —is dependent on the cell chemistry as well as the specific cell candidate. This is illustrated by a literature review shown in Table 1. Another literature review on published semi-empirical aging models (Table 2) reveals contradictions on the stress factors considered as model input parameters. Besides, only a few of the related publications discuss the aging-relevance of the individual stress factors and thus motivate the choice of model input parameters with regard to the specifically addressed cell candidate. For this issue, a sensitivity analysis is an expedient step prior to modeling as it gives a sound basis for stress factor selection. However, the supplementary test effort for sensitivity analysis must be minimized, particularly with regard to the application in the automotive industry. Therefore, this study proposes acceleration approaches for sensitivity analyses on lithium-ion cell aging. Thus, testing with a low summed charge throughput or with a minimum of test points is investigated. For this purpose, test series A and B—each one with different levels of acceleration—are performed and subsequently evaluated, taking the obtained statistical significance as a criterion for the acceleration success.
The results, as presented and discussed in Section 4, show that the test set-up in test series A is not effective for an accelerated sensitivity analysis, as the obtained results for the two aging effects Δ C and Δ R after a low summed charge throughput of 100 Ah do not allow a statistically significant evaluation (p-value > 0.05). In contrast, overall statistically significant results are obtained in test series B for check-up 2 (p-value < 0.05). This demonstrates that a sufficient value of summed charge throughput—700 Ah, or 100 equivalent full cycles, for this specific cell candidate—is necessary for a valid sensitivity analysis. A possible explanation to this is the initially nonlinear, thus fuzzy, phase of the aging progress [47,48], which must be overcome to obtain statistical significance. In summary, the applied fractional factorial, D-optimal test design with a beneficial low number of 30 test points is capable of achieving the desired acceleration for the sensitivity analysis. In summary, the applied fractional factorial, D-optimal test design in test series B is capable of achieving the desired acceleration for the sensitivity analysis: a beneficial small number of 30 test points in combination with a low testing duration of 100 equivalent full cycles per test point.
The sensitivity analysis for test series B shows different sensitivities for total aging (directly measured capacity and resistance values during check-up tests) and cyclic aging (directly measured values analytically corrected by the included share of calendar aging). They differ primarily in their sensitivities to T and SOC , thus the stress factors related to the calendar share. A further analysis of the sensitivities of cyclic aging in test series B shows that the two aging effects Δ C and Δ R exhibit different sensitivities on the individual stress factors according to the ranking as well as to the effect amount. Therefore, it can be concluded that depending on the prevailing stress factor combination, and thus on the underlying aging mechanisms and modes, the ratio of Δ C to Δ R varies. Analyzing Δ DOD and Ø SOC as the stress factors with the greatest effects on both aging effects once again proves the importance of choosing a narrow operating window in the middle Ø SOC for the application of lithium-ion cells.

5.2. Application Potentials

Neglecting aging-relevant stress factors as input parameters will decrease the model quality of semi-empirical aging models. In contrast, intending stress factors as input parameters that are not aging-relevant will increase the experimental effort for parameterization to an unnecessary extent as these input parameters will not contribute to an improvement of the overall model quality. The use of an accelerated sensitivity analysis enables to quantify the impact of the individual stress factors to the resulting aging effects and thus to the model quality in advance to modeling. Therefore, the results of an accelerated sensitivity analysis serve as a basis to balance the trade-off between model accuracy and parameterization effort. However, in this context, the question must be raised as to whether the least aging-relevant stress factor can be actually classified as not aging-relevant, and thus be neglected as a model input. Taking the stress factor I d i s as example of the stress factor with the lowest effect on total aging in test series B, its effect amounts to 1.7 % on Δ C , and 5.0 % on Δ R , which means that the results for observable aging effects will vary accordingly depending on the set discharge current (0.5– 2.0 C ). Neglecting I d i s as a model input parameter, thus assuming its effect on the simulation result as constant, must therefore be interpreted as a prospective model inaccuracy already justified by the pursued modeling approach. The selection of an effect threshold below which a stress factor is neglected as a model input must therefore be coordinated with the intended model quality.
Another application potential is a systematic method for accelerated aging characterization, as outlined in [49]. Here, a sensitivity analysis with a minimized test effort is essential to gain knowledge about the aging-relevance of stress factors efficiently and thus to define an aging-effective reference cycle for aging characterization tests.

Author Contributions

T.G., the first author, was mainly responsible for the conceptualization and writing of the original draft of this paper. She conducted the investigation, data curation, and formal analysis of test series B. A.C. conducted the investigation, data curation, and formal analysis of test series A during a student research project. L.W. made an essential contribution to the conceptualization and revised the original draft critically. D.L. and A.H. made essential contributions to the conception of the research project. M.L. made an essential contribution to the conceptualization of the research project. He revised the paper critically with regard to important intellectual content. He gave final approval of the version to be published and agrees to all aspects of the work. As a guarantor, he accepts responsibility for the overall integrity of the paper. All authors have read and agreed to the published version of the manuscript.

Funding

This research was funded by DEE Dräxlmaier Electric and Electronic Systems GmbH.

Acknowledgments

The authors gratefully acknowledge the additional support through battery testing infrastructure with the help of independent funding by the Institute of Automotive Technology at the Technical University of Munich.

Conflicts of Interest

The authors declare no conflicts of interest.

References

  1. Schmalstieg, J.; Käbitz, S.; Ecker, M.; Sauer, D.U. A holistic aging model for Li(NiMnCo)O2 based 18650 lithium-ion batteries. J. Power Sour. 2014, 257, 325–334. [Google Scholar] [CrossRef]
  2. Marongiu, A.; Rocher, M.; Sauer, D.U. Influence of the vehicle-to-grid strategy on the aging behavior of lithium battery electric vehicles. Appl. Energy 2015, 137, 899–912. [Google Scholar] [CrossRef]
  3. Ecker, M.; Nieto, N.; Käbitz, S.; Schmalstieg, J.; Blanke, H.; Warnecke, A.; Sauer, D.U. Calendar and cycle life study of Li(NiMnCo)O2-based 18650 lithium-ion batteries. J. Power Sour. 2014, 248, 839–851. [Google Scholar] [CrossRef]
  4. Grolleau, S.; Delaille, A.; Gualous, H.; Gyan, P.; Revel, R.; Bernard, J.; Redondo-Iglesias, E.; Peter, J. Calendar aging of commercial graphite/LiFePO4 cell—Predicting capacity fade under time dependent storage conditions. J. Power Sour. 2014, 255, 450–458. [Google Scholar] [CrossRef]
  5. Wang, J.; Purewal, J.; Liu, P.; Hicks-Garner, J.; Soukiazian, S.; Sherman, E.; Sorenson, A.; Vu, L.; Tataria, H.; Verbrugge, M. Degradation of lithium ion batteries employing graphite negatives and nickel-cobalt-manganese oxide + spinel manganese oxide positives: Part 1, aging mechanisms and life estimation. J. Power Sour. 2014, 269, 937–948. [Google Scholar] [CrossRef]
  6. Petit, M.; Prada, E.; Sauvant-Moynot, V. Development of an empirical aging model for Li-ion batteries and application to assess the impact of Vehicle-to-Grid strategies on battery lifetime. Appl. Energy 2016, 172, 398–407. [Google Scholar] [CrossRef]
  7. de Hoog, J.; Timmermans, J.M.; Stroe, D.I.; Swierczynski, M.; Jaguemont, J.; Goutam, S.; Omar, N.; van Mierlo, J.; van den Bossche, P. Combined cycling and calendar capacity fade modeling of a Nickel-Manganese-Cobalt Oxide Cell with real-life profile validation. Appl. Energy 2017, 200, 47–61. [Google Scholar] [CrossRef]
  8. Birkl, C.R.; Roberts, M.R.; McTurk, E.; Bruce, P.G.; Howey, D.A. Degradation diagnostics for lithium ion cells. J. Power Sour. 2017, 341, 373–386. [Google Scholar] [CrossRef]
  9. Wright, R.; Christophersen, J.; Motloch, C.; Belt, J.; Ho, C.; Battaglia, V.; Barnes, J.; Duong, T.; Sutula, R. Power fade and capacity fade resulting from cycle-life testing of Advanced Technology Development Program lithium-ion batteries. J. Power Sour. 2003, 119–121, 865–869. [Google Scholar] [CrossRef]
  10. Canals Casals, L.; Schiffer Gonzalez, A.M.; Garcia, B.; Llorca, J. PHEV Battery Aging Study Using Voltage Recovery and Internal Resistance From Onboard Data. IEEE Trans. Veh. Technol. 2016, 65, 4209–4216. [Google Scholar] [CrossRef] [Green Version]
  11. Barré, A.; Deguilhem, B.; Grolleau, S.; Gérard, M.; Suard, F.; Riu, D. A review on lithium-ion battery ageing mechanisms and estimations for automotive applications. J. Power Sour. 2013, 241, 680–689. [Google Scholar] [CrossRef] [Green Version]
  12. Lewerenz, M. Dissection and Quantitative Description of Aging of Lithium-Ion Batteries Using Non-Destructive Methods Validated by Post-Mortem-Analyses. Ph.D. Thesis, Institut für Stromrichtertechnik und Elektrische Antriebe (ISEA), Aachen, Germany, 2018. [Google Scholar]
  13. Vetter, J.; Novák, P.; Wagner, M.R.; Veit, C.; Möller, K.C.; Besenhard, J.O.; Winter, M.; Wohlfahrt-Mehrens, M.; Vogler, C.; Hammouche, A. Ageing mechanisms in lithium-ion batteries. J. Power Sour. 2005, 147, 269–281. [Google Scholar] [CrossRef]
  14. Waldmann, T.; Hogg, B.I.; Wohlfahrt-Mehrens, M. Li plating as unwanted side reaction in commercial Li-ion cells—A review. J. Power Sour. 2018, 384, 107–124. [Google Scholar] [CrossRef]
  15. Bach, T.C.; Schuster, S.F.; Fleder, E.; Müller, J.; Brand, M.J.; Lorrmann, H.; Jossen, A.; Sextl, G. Nonlinear aging of cylindrical lithium-ion cells linked to heterogeneous compression. J. Energy Storage 2016, 5, 212–223. [Google Scholar] [CrossRef]
  16. Ebert, F.; Sextl, G.; Lienkamp, M. Effect of a flexible battery module bracing on cell aging. In Proceedings of the 2017 Fourteenth International Conference on Ecological Vehicles and Renewable Energies (EVER), Monte-Carlo, Monaco, 13 April 2017; pp. 1–5. [Google Scholar] [CrossRef]
  17. Somerville, L.; Bareño, J.; Trask, S.; Jennings, P.; McGordon, A.; Lyness, C.; Bloom, I. The effect of charging rate on the graphite electrode of commercial lithium-ion cells: A post-mortem study. J. Power Sour. 2016, 335, 189–196. [Google Scholar] [CrossRef] [Green Version]
  18. Broussely, M.; Biensan, P.; Bonhomme, F.; Blanchard, P.; Herreyre, S.; Nechev, K.; Staniewicz, R.J. Main aging mechanisms in Li ion batteries. J. Power Sour. 2005, 146, 90–96. [Google Scholar] [CrossRef]
  19. Keil, P.; Jossen, A. Aging of Lithium-Ion Batteries in Electric Vehicles: Impact of Regenerative Braking. World Electr. Veh. J. 2015, 7, 41–51. [Google Scholar] [CrossRef] [Green Version]
  20. Herb, F. Ageing Mechanisms in Lithium-ion Batteries and PEM Fuel Cells and Their Influence on the Properties of Hybrid Systems: (dt. Originaltitel: Alterungsmechanismen in Lithium-Ionen-Batterien und PEM-Brennstoffzellen und deren Einfluss auf die Eigenschaften von Daraus Bestehenden Hybrid-Systemen). Ph.D. Thesis, University of Ulm, Ulm, Germany, 2010. [Google Scholar]
  21. Paul, S.; Diegelmann, C.; Kabza, H.; Tillmetz, W. Analysis of ageing inhomogeneities in lithium-ion battery systems. J. Power Sour. 2013, 239, 642–650. [Google Scholar] [CrossRef]
  22. Guan, T.; Zuo, P.; Sun, S.; Du, C.; Zhang, L.; Cui, Y.; Yang, L.; Gao, Y.; Yin, G.; Wang, F. Degradation mechanism of LiCoO2/mesocarbon microbeads battery based on accelerated aging tests. J. Power Sour. 2017, 268, 816–823. [Google Scholar] [CrossRef]
  23. Scrosati, B.; Garche, J.; Tillmetz, W. (Eds.) Advances in Battery Technologies for Electric Vehicles, 1st ed.; Woodhead Publishing series in energy; Woodhead Publishing: Cambridge, UK, 2015. [Google Scholar]
  24. Pistoia, G. (Ed.) Lithium-Ion Batteries: Advances and Applications, 1st ed.; Elsevier: Amsterdam, The Netherlands, 2014. [Google Scholar]
  25. Schmitt, J.; Maheshwari, A.; Heck, M.; Lux, S.; Vetter, M. Impedance change and capacity fade of lithium nickel manganese cobalt oxide-based batteries during calendar aging. J. Power Sour. 2017, 353, 183–194. [Google Scholar] [CrossRef]
  26. Sun, S.; Guan, T.; Shen, B.; Leng, K.; Gao, Y.; Cheng, X.; Yin, G. Changes of Degradation Mechanisms of LiFePO 4 /Graphite Batteries Cycled at Different Ambient Temperatures. Electrochim. Acta 2017, 237, 248–258. [Google Scholar] [CrossRef]
  27. Wang, J.; Liu, P.; Hicks-Garner, J.; Sherman, E.; Soukiazian, S.; Verbrugge, M.; Tataria, H.; Musser, J.; Finamore, P. Cycle-life model for graphite-LiFePO4 cells. J. Power Sour. 2011, 196, 3492–3948. [Google Scholar] [CrossRef]
  28. Baghdadi, I.; Briat, O.; Delétage, J.Y.; Gyan, P.; Vinassa, J.M. Lithium battery aging model based on Dakin’s degradation approach. J. Power Sour. 2016, 325, 273–285. [Google Scholar] [CrossRef]
  29. Dakin, T.W. Electrical Insulation Deterioration Treated as a Chemical Rate Phenomenon. Trans. Am. Inst. Electr. Eng. 1948, 67, 113–122. [Google Scholar] [CrossRef]
  30. Ecker, M.; Gerschler, J.B.; Vogel, J.; Käbitz, S.; Hust, F.; Dechent, P.; Sauer, D.U. Development of a lifetime prediction model for lithium-ion batteries based on extended accelerated aging test data. J. Power Sour. 2012, 215, 248–257. [Google Scholar] [CrossRef]
  31. Stroe, D.I.; Swierczynski, M.; Kar, S.K.; Teodorescu, R. Degradation Behavior of Lithium-Ion Batteries During Calendar Ageing—The Case of the Internal Resistance Increase. IEEE Trans. Ind. Appl. 2018, 54, 517–525. [Google Scholar] [CrossRef] [Green Version]
  32. Bauer, M.; Guenther, C.; Kasper, M.; Petzl, M.; Danzer, M.A. Discrimination of degradation processes in lithium-ion cells based on the sensitivity of aging indicators towards capacity loss. J. Power Sour. 2015, 283, 494–504. [Google Scholar] [CrossRef]
  33. Cui, Y.; Du, C.; Yin, G.; Gao, Y.; Zhang, L.; Guan, T.; Yang, L.; Wang, F. Multi-stress factor model for cycle lifetime prediction of lithium ion batteries with shallow-depth discharge. J. Power Sour. 2015, 279, 123–132. [Google Scholar] [CrossRef]
  34. Dubarry, M.; Devie, A. Battery durability and reliability under electric utility grid operations: Representative usage aging and calendar aging. J. Energy Storage 2018, 18, 185–195. [Google Scholar] [CrossRef]
  35. Edouard, C.; Petit, M.; Bernard, J.; Forgez, C.; Revel, R. Sensitivity Analysis of an Electrochemical Model of Li-ion Batteries and Consequences on the Modeled Aging Mechanisms. ECS Trans. 2015, 66, 37–46. [Google Scholar] [CrossRef]
  36. Su, L.; Zhang, J.; Wang, C.; Zhang, Y.; Li, Z.; Song, Y.; Jin, T.; Ma, Z. Identifying main factors of capacity fading in lithium ion cells using orthogonal design of experiments. Appl. Energy 2016, 163, 201–210. [Google Scholar] [CrossRef]
  37. Rezvanizaniani, S.M.; Liu, Z.; Chen, Y.; Lee, J. Review and recent advances in battery health monitoring and prognostics technologies for electric vehicle (EV) safety and mobility. J. Power Sour. 2014, 256, 110–124. [Google Scholar] [CrossRef]
  38. Eichner, T. Degradations in Lithium-ion Batteries under the Demands of the Automotive Application: (Dt. Originaltitel: Degradationen in Lithium-Ionen-Batterien unter Anforderungen im Automobilen Umfeld). Ph.D. Thesis, University of Ulm, Ulm, Germany, 2014. [Google Scholar]
  39. Selvamuthu, D.; Das, D. Introduction to Statistical Methods, Design of Experiments and Statistical Quality Control; Springer: Singapore, 2018. [Google Scholar] [CrossRef]
  40. Baumann, M.; Wildfeuer, L.; Rohr, S.; Lienkamp, M. Parameter variations within Li-Ion battery packs—Theoretical investigations and experimental quantification. J. Power Sour. 2018, 18, 295–307. [Google Scholar] [CrossRef]
  41. Lewerenz, M.; Fuchs, G.; Becker, L.; Sauer, D.U. Irreversible calendar aging and quantification of the reversible capacity loss caused by anode overhang. J. Energy Storage 2018, 18, 149–159. [Google Scholar] [CrossRef]
  42. Rumpf, K.; Naumann, M.; Jossen, A. Experimental investigation of parametric cell-to-cell variation and correlation based on 1100 commercial lithium-ion cells. J. Energy Storage 2017, 14, 224–243. [Google Scholar] [CrossRef]
  43. Prochazka, W.; Pregartner, G.; Cifrain, M. Design-of-Experiment and Statistical Modeling of a Large Scale Aging Experiment for Two Popular Lithium Ion Cell Chemistries. J. Electrochem. Soc. 2013, 160, A1039–A1051. [Google Scholar] [CrossRef]
  44. Mathieu, R.; Baghdadi, I.; Briat, O.; Gyan, P.; Vinassa, J.M. D-optimal design of experiments applied to lithium battery for ageing model calibration. Energy 2017, 141, 2108–2119. [Google Scholar] [CrossRef]
  45. Schweiger, H.G.; Obeidi, O.; Komesker, O.; Raschke, A.; Schiemann, M.; Zehner, C.; Gehnen, M.; Keller, M.; Birke, P. Comparison of several methods for determining the internal resistance of lithium ion cells. Sensors 2010, 10, 5604–5625. [Google Scholar] [CrossRef] [Green Version]
  46. Gewald, T.; Lienkamp, M.; Lehmkuhl, D.; Hahn, A. Accelerated Aging Characterization of Lithium-Ion Cells: Limitation of Arrhenius Dependency. In Proceedings of the 2019 Fourteenth International Conference on Ecological Vehicles and Renewable Energies (EVER), Monte Carlo, Monaco, 8 May 2019; pp. 1–10. [Google Scholar] [CrossRef]
  47. Stroe, D.I.; Swierczynski, M.; Knudesn Kaer, S.; Martinez Laserna, E.; Sarasketa Zabala, E. Accelerated Aging of Lithium-Ion Batteries based on Electric Vehicle Mission Profile. In Proceedings of the 2017 IEEE Energy Conversion Congress and Exposition (ECCE), Cincinnati, OH, USA, 1 October 2017; pp. 5631–5637. [Google Scholar] [CrossRef] [Green Version]
  48. Schuster, S.F.; Bach, T.; Fleder, E.; Müller, J.; Brand, M.; Sextl, G.; Jossen, A. Nonlinear aging characteristics of lithium-ion cells under different operational conditions. J. Energy Storage 2015, 1, 44–53. [Google Scholar] [CrossRef]
  49. Gewald, T.; Lienkamp, M. A Systematic Method for Accelerated Aging Characterization of Lithium-Ion Cells in Automotive Applications. Eng. Res. 2019, 83, 831–841. [Google Scholar] [CrossRef]
Figure 1. Overview of the cause–effect chain of aging and the concept of semi-empirical aging models: (a) Representation of the aging process by a schematic cause–effect chain including stress factors, aging mechanisms, modes and effects [8]. (b) For simulating, semi-empirical aging models map stress factors on aging effects. (c) For a high model quality, aging-relevant stress factors must be identified by performing a sensitivity analysis and further considered as model input parameters. (d) For robust sensitivity analyses, disturbance factors must be considered.
Batteries 06 00006 g001
Figure 2. Overview of modeling approaches with different concepts to consider calendar and cyclic aging: (a) superposition approach, (b) combined approach, and (c) case distinction approach.
Batteries 06 00006 g002
Figure 3. Assumed qualitative dependencies of aging rate on stress factors (a) T, (b) I d i s , (c) Ø SOC , and (d) Δ DOD , according to [3,5,37].
Batteries 06 00006 g003
Figure 4. Testing procedures for test series A and B: Sequential order of initial cycling, check-up testing, and load cycling. For test series A, check-up 1 constitutes one available condition for performing a sensitivity analysis. For test series B, check-ups 1 and 2 constitute two available conditions.
Batteries 06 00006 g004
Figure 5. Check-up results for test series A and B: The filled bars show the measured values at check-up 0, check-up 1 (after 100 Ah for test series A, 350 Ah for test series B), and check-up 2 (not performed in test series A, after 700 Ah for test series B). The related approximate distributions illustrate the average changes as well as the increasing spreading of the cell characteristics along the aging process. The non-filled bars show the analytically calculated shares of cyclic aging for test series B.
Batteries 06 00006 g005
Figure 6. Sensitivity analysis on the check-up results for test series A and B: The p-values are plotted against the left y-axis with non-filled bars. The respective main effects of the stress factors T, I d i s , Ø SOC and Δ DOD are plotted against the right y-axis with filled bars. The values are calculated using the statistical software Visual-XSel 15.0.
Batteries 06 00006 g006
Table 1. Literature review on aging studies: The relevance of the stress factors on the aging effects Δ C or Δ R is qualitatively classified as having no influence ○, minor influence ◑, or strong influence ●. Additional information on the investigated cell chemistry and the value range of the stress factors is provided. This overview reveals a controversy on the relevance of stress factors for cyclic aging.
Stress FactorChemistryFactor Range Δ C Δ R Reference
Effects on Calendar Aging
TNCA10–40 C-Keil & Jossen, 2015 [19]
NCA Broussely et al., 2005 [18]
NMC0–5 CSchmitt et al., 2017 [25]
NMC, LFP40–70 C-Marongiu et al., 2015 [2]
LFP Herb, 2010 [20]
Vetter et al., 2005 [13]
Barré et al., 2013 [11]
Fluctuations in TLFP Herb, 2010 [20]
SOC NCA if T high ●, else ○if T high ●, else ○Broussely et al., 2005 [18]
NCA0–100%-Keil & Jossen, 2015 [19]
NMC0–100%Schmitt et al., 2017 [25]
NMC, LFP20–100%-Marongiu et al., 2015 [2]
Vetter et al., 2005 [13]
80–100%Barré et al., 2013 [11]
Effects on Cyclic Aging
TNCA10–40 C-Keil & Jossen, 2015 [19]
LFP25–55 C-Sun et al., 2017 [26]
LFP Herb, 2010 [20]
10–40 Cif T high ●, else ○Vetter et al., 2005 [13]
-Barré et al., 2013 [11]
Fluctuations in TLFP Herb, 2010 [20]
I d i s NCA, NMC -Broussely et al., 2005 [18]
NMC1.0–2.0CMarongiu et al., 2015 [2]
LFP1.0–6.0CMarongiu et al., 2015 [2]
LFP Herb, 2010 [20]
LCO0.6–3.0C-Guan et al., 2017 [22]
Vetter et al., 2005 [13]
Ø SOC NCA33–78%-Keil & Jossen, 2015 [19]
LFP if Ø SOC high ●, else ○Vetter et al., 2005 [13]
LFP Herb, 2010 [20]
80–100%-Barré et al., 2013 [11]
SOC e n d o f d i s c h a r g e LFP Herb, 2010 [20]
SOC e n d o f c h a r g e LFP Herb, 2010 [20]
Δ DOD NCA≈25%-Keil & Jossen, 2015 [19]
NMC, LFP20–80%Marongiu et al., 2015 [2]
LFP -Barré et al., 2013 [11]
LFP Herb, 2010 [20]
-Paul et al., 2013 [21]
-Vetter et al., 2005 [13]
Table 2. Overview of semi-empirical aging models: Indication of the cell chemistry, the modeling approach according to Figure 2 (if both calendar and cyclic aging are considered), the considered stress factors as model input parameters (differentiation between stress factors for calendar or cyclic aging) and aging effects as model output. This overview consolidates the controversy on relevant stress factors for cyclic aging, as shown in Table 1.
ReferenceChemistryModelling ApproachInputOutput
T ( c a l ) S O C ( c a l ) T ( c y c ) I d i s ( c y c ) Ø S O C ( c y c ) Δ D O D ( c y c ) Δ C Δ R
Petit et al., 2016 [6]NCA, LFP(c)
Baghdadi et al., 2016 [28]NCA, NMC(b)
Wang et al., 2014 [5]NMC(a)
Ecker et al., 2012 [30]NMC
Schmalstieg et al., 2014 [1]NMC(a)
Hoog et al., 2017 [7]NMC(a)
Marongiu et al., 2015 [2]NMC, LFP(a)
Wang et al., 2011 [27]LFP(b)
Herb et al., 2010 [20]LFP(a)
Grolleau et al., 2014 [4]LFP
Stroe et al., 2018 [31]LFP
Table 3. Disturbance factors for calendar and cyclic test series on lithium-ion cells [38,40,41].
Disturbance Factors for Calendar AgingDisturbance Factors for Cyclic Aging
Production fluctuationsProduction fluctuations
Fluctuations of storage temperatureFluctuation of ambient temperature
Fluctuations of storage SOCCell self-heating
Cycling during check-up testingCell temperature interference with neighbored cells
Reversible capacity loss due to anode overhangCurrent measurement error
HumidityVoltage drift during charge-based cycling
VibrationsCharge drift during voltage-based cycling
ClampingRest time during cycling
Humidity
Vibrations
Clamping
Table 4. Test matrix for test series A: Full factorial test design.
Test PointFactor TFactor I d i s Factor Ø S O C Factor Δ D O D
140 C2.0C 75 % 50 %
240 C 2.0 C 75 % 10 %
340 C 2.0 C 50 % 50 %
440 C 2.0 C 50 % 10 %
540 C 0.5 C 75 % 50 %
640 C 0.5 C 75 % 10 %
740 C 0.5 C 50 % 50 %
840 C 0.5 C 50 % 10 %
925 C 2.0 C 75 % 50 %
1025 C 2.0 C 75 % 10 %
1125 C 2.0 C 50 % 50 %
1225 C 2.0 C 50 % 10 %
1325 C 0.5 C 75 % 50 %
1425 C 0.5 C 75 % 10 %
1525 C 0.5 C 50 % 50 %
1625 C 0.5 C 50 % 10 %
Table 5. Test matrix for test series B: Fractional factorial, D-optimal test design.
Test PointFactor TFactor I d i s Factor Ø S O C Factor Δ D O D
125 C2.0C 60 % 75 %
245 C 0.5 C 60 % 75 %
335 C 2.0 C 70 % 50 %
425 C 2.0 C 80 % 10 %
525 C 0.5 C 65 % 60 %
645 C 2.0 C 35 % 60 %
745 C 0.5 C 40 % 75 %
845 C 2.0 C 65 % 60 %
925 C 2.0 C 20 % 10 %
1025 C 0.5 C 20 % 10 %
1125 C 2.0 C 35 % 60 %
1225 C 1.0 C 50 % 100 %
1345 C 2.0 C 80 % 10 %
1435 C 0.5 C 50 % 35 %
1525 C 0.5 C 80 % 10 %
1645 C 0.5 C 20 % 10 %
1745 C 1.0 C 50 % 20 %
1845 C 0.5 C 80 % 10 %
1935 C 1.0 C 80 % 25 %
2025 C 2.0 C 35 % 60 %
2145 C 2.0 C 80 % 10 %
2245 C 2.0 C 20 % 10 %
2345 C 2.0 C 20 % 10 %
2435 C 1.0 C 20 % 25 %
2535 C 2.0 C 50 % 10 %
2635 C 0.5 C 50 % 100 %
2725 C 2.0 C 20 % 10 %
2825 C 1.0 C 50 % 10 %
2925 C 0.5 C 35 % 60 %
3045 C 2.0 C 35 % 60 %
Table 6. Specifications of cell candidates for test series A and B.
HeaderTest Series ATest Series B
ManufacturerPanasonicSony (Murata)
TypeNCR18650PFUS18650VC7
High-energyHigh-energy
Nom. Capacity2.9 Ah3.5 Ah
Nom. Voltage3.6 V3.6 V
GeometryCylindrical (18650)Cylindrical (18650)
AnodeGraphiteGraphite, Si-doped
CathodeNCANCA

