Analysis of Li-Ion Battery Gases Vented in an Inert Atmosphere Thermal Test Chamber


Abstract
:1. Introduction
2. Results
2.1. Gas Volumes and Emission Rates
2.1.1. Gas Volumes Produced
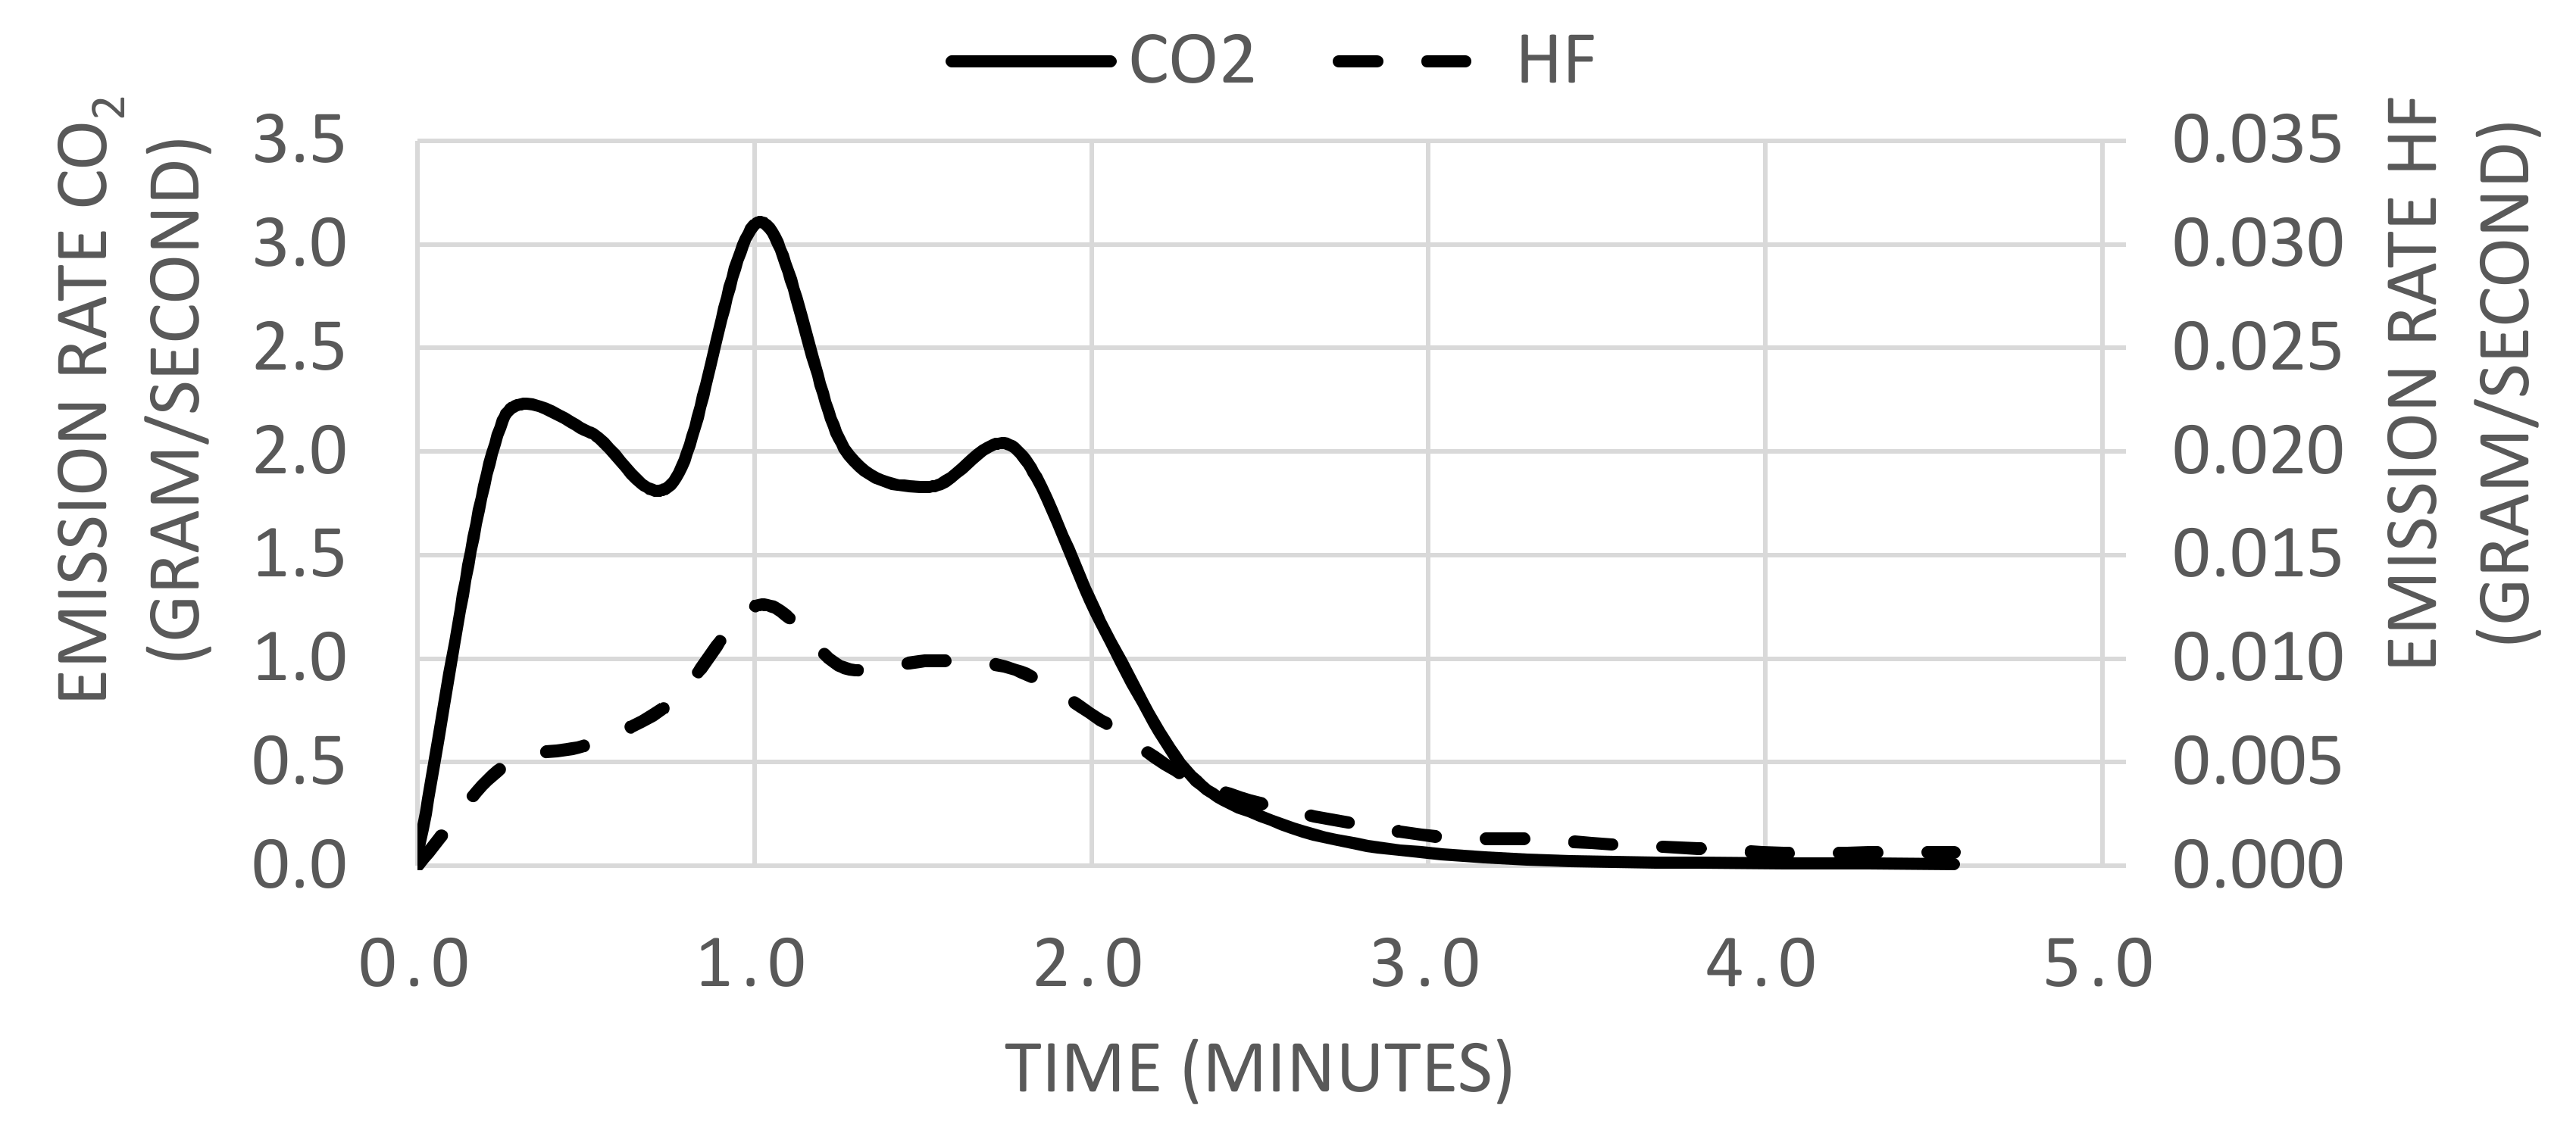
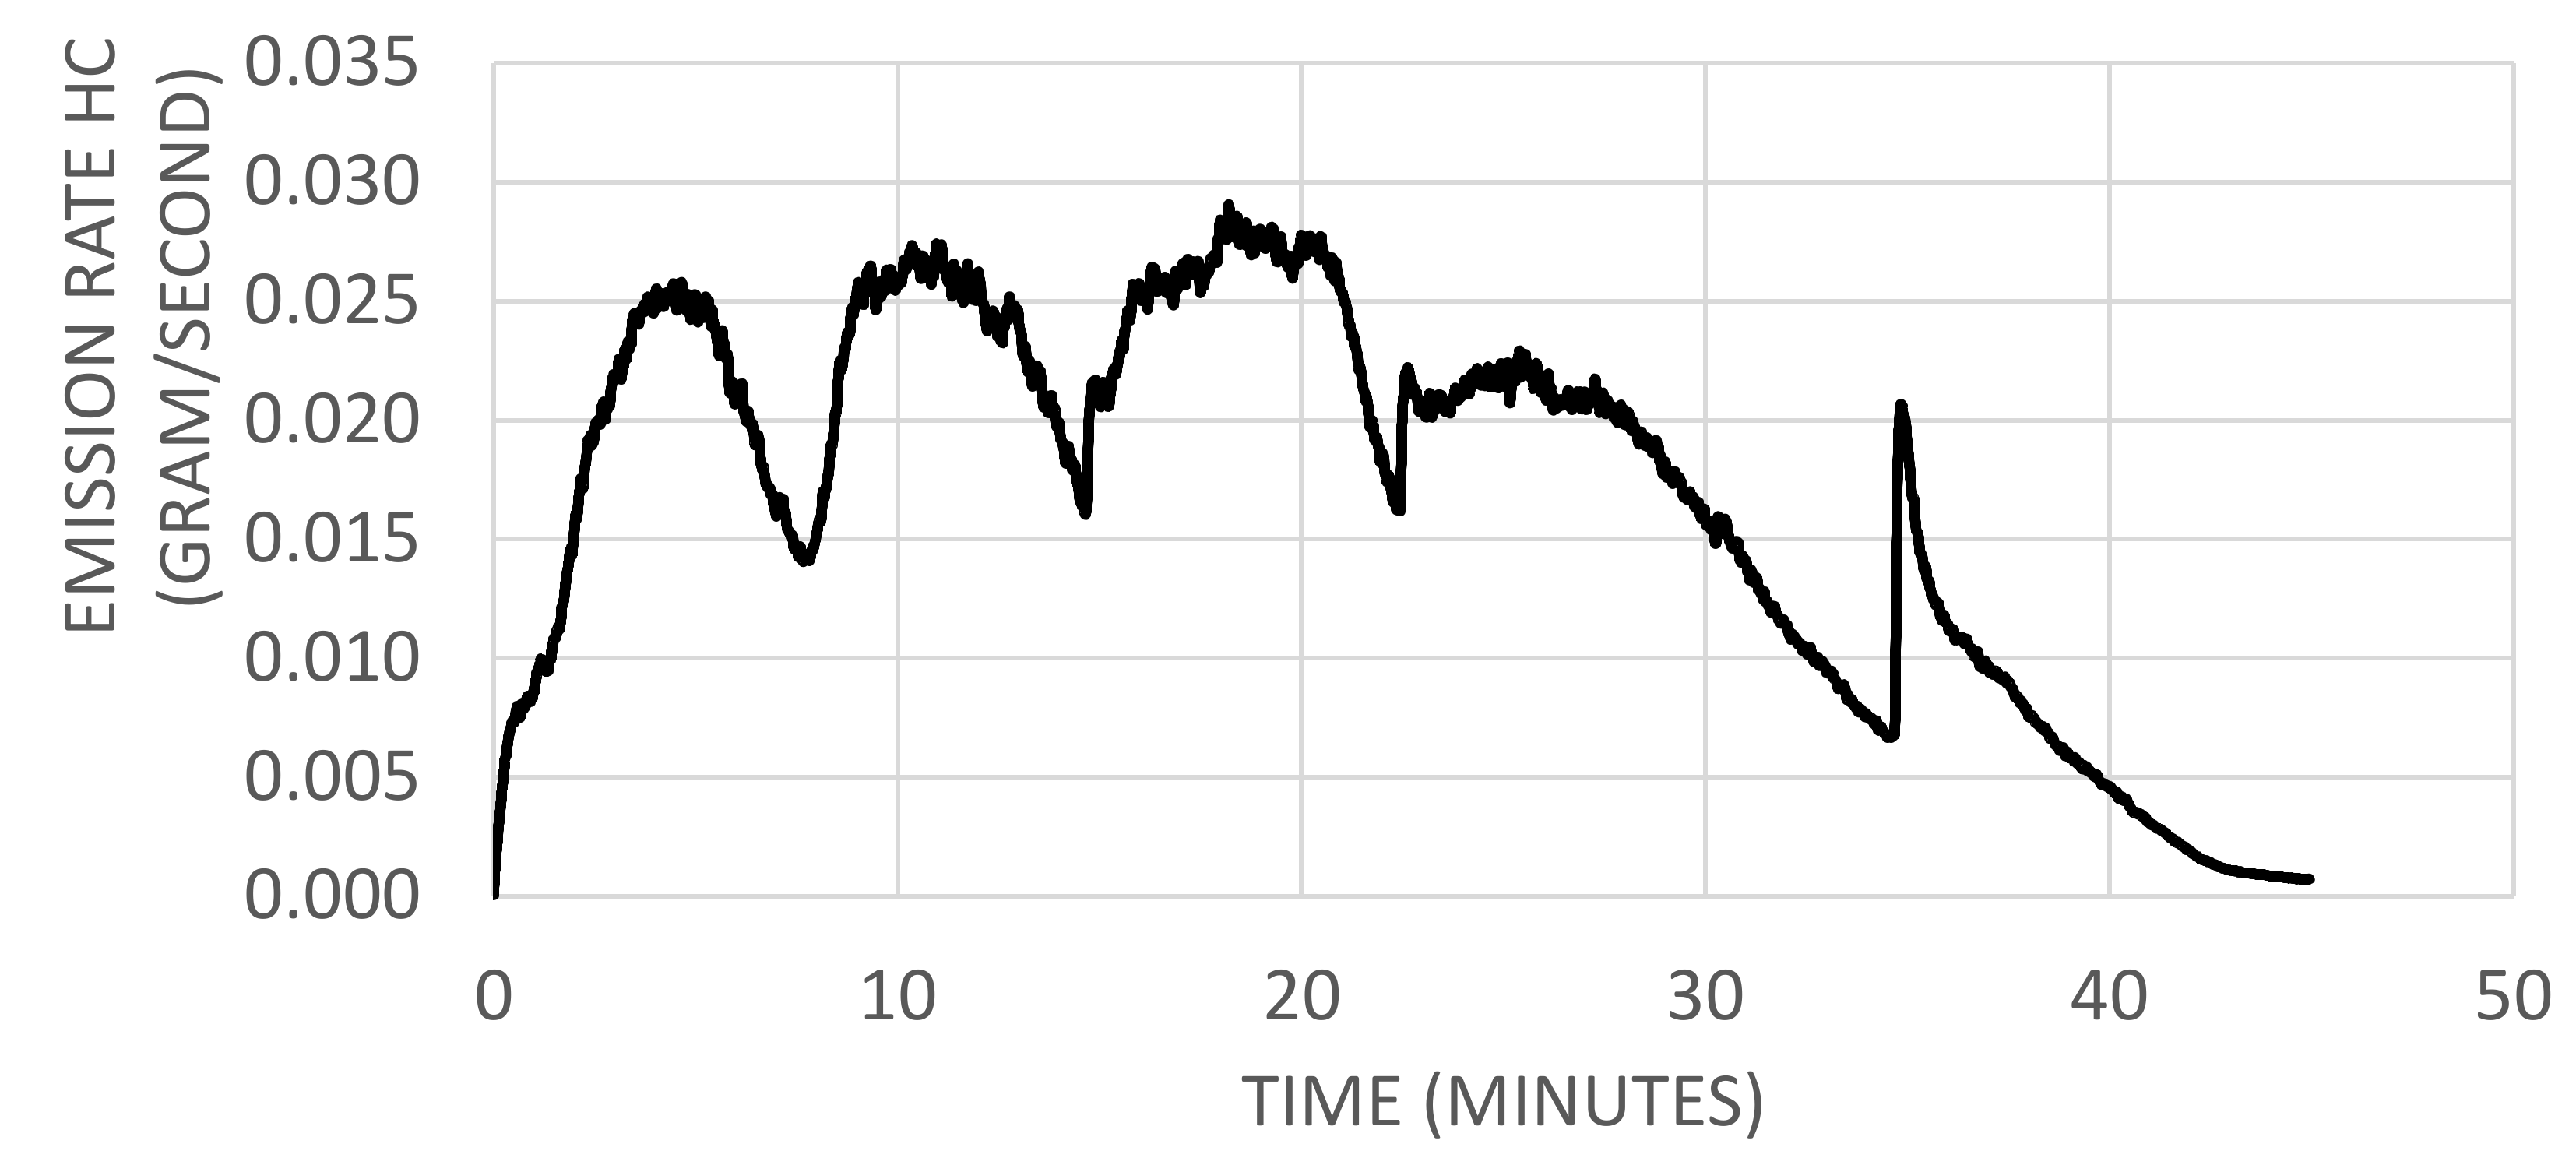
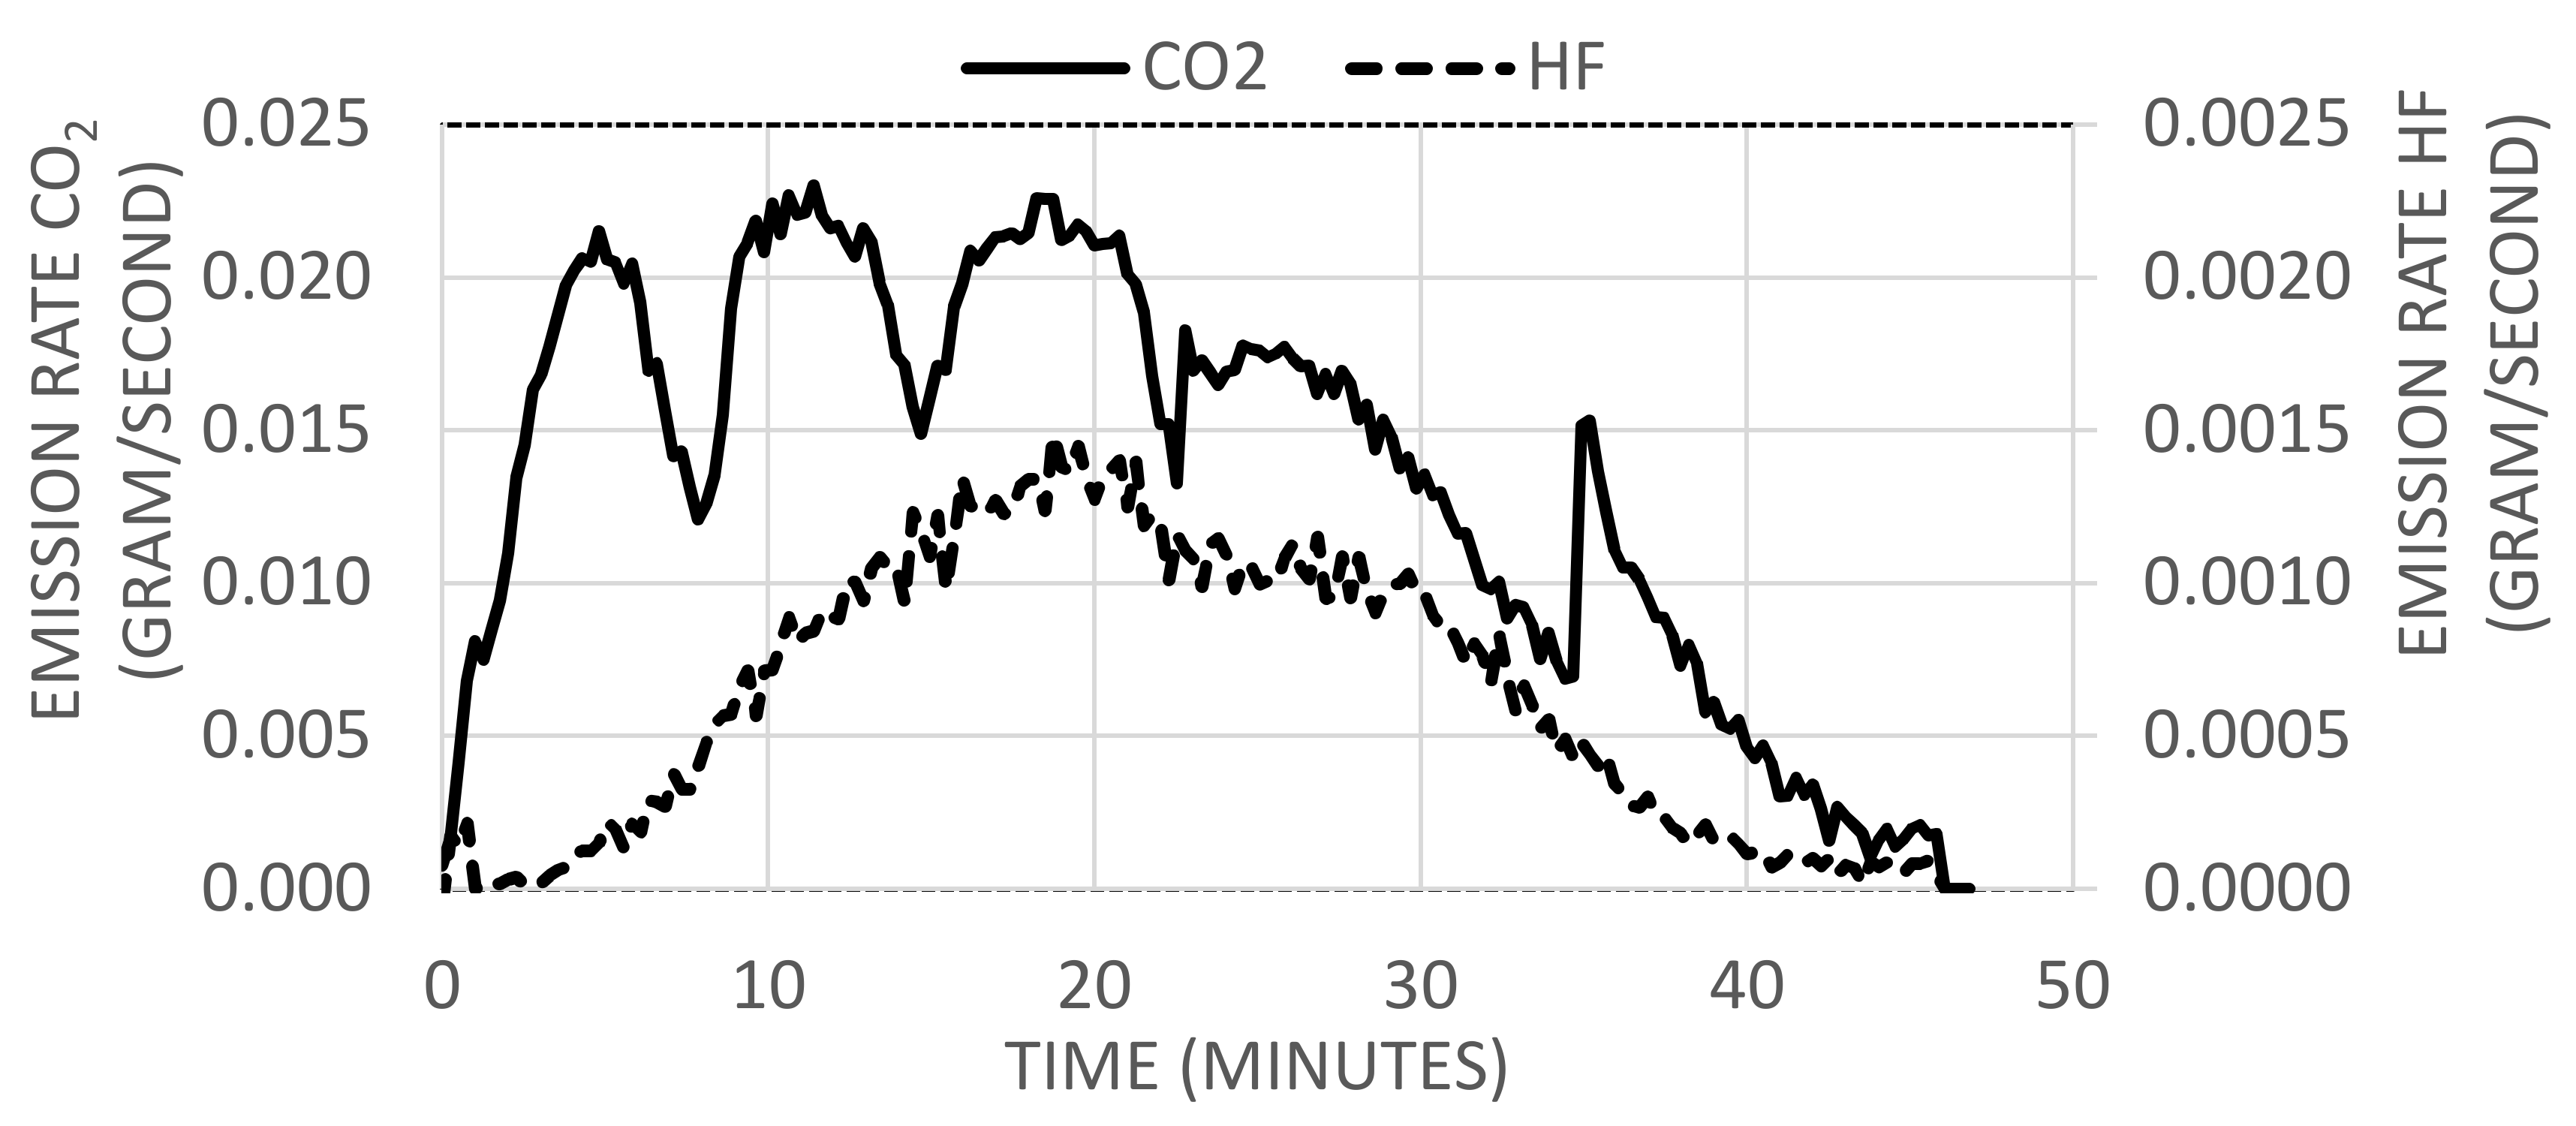
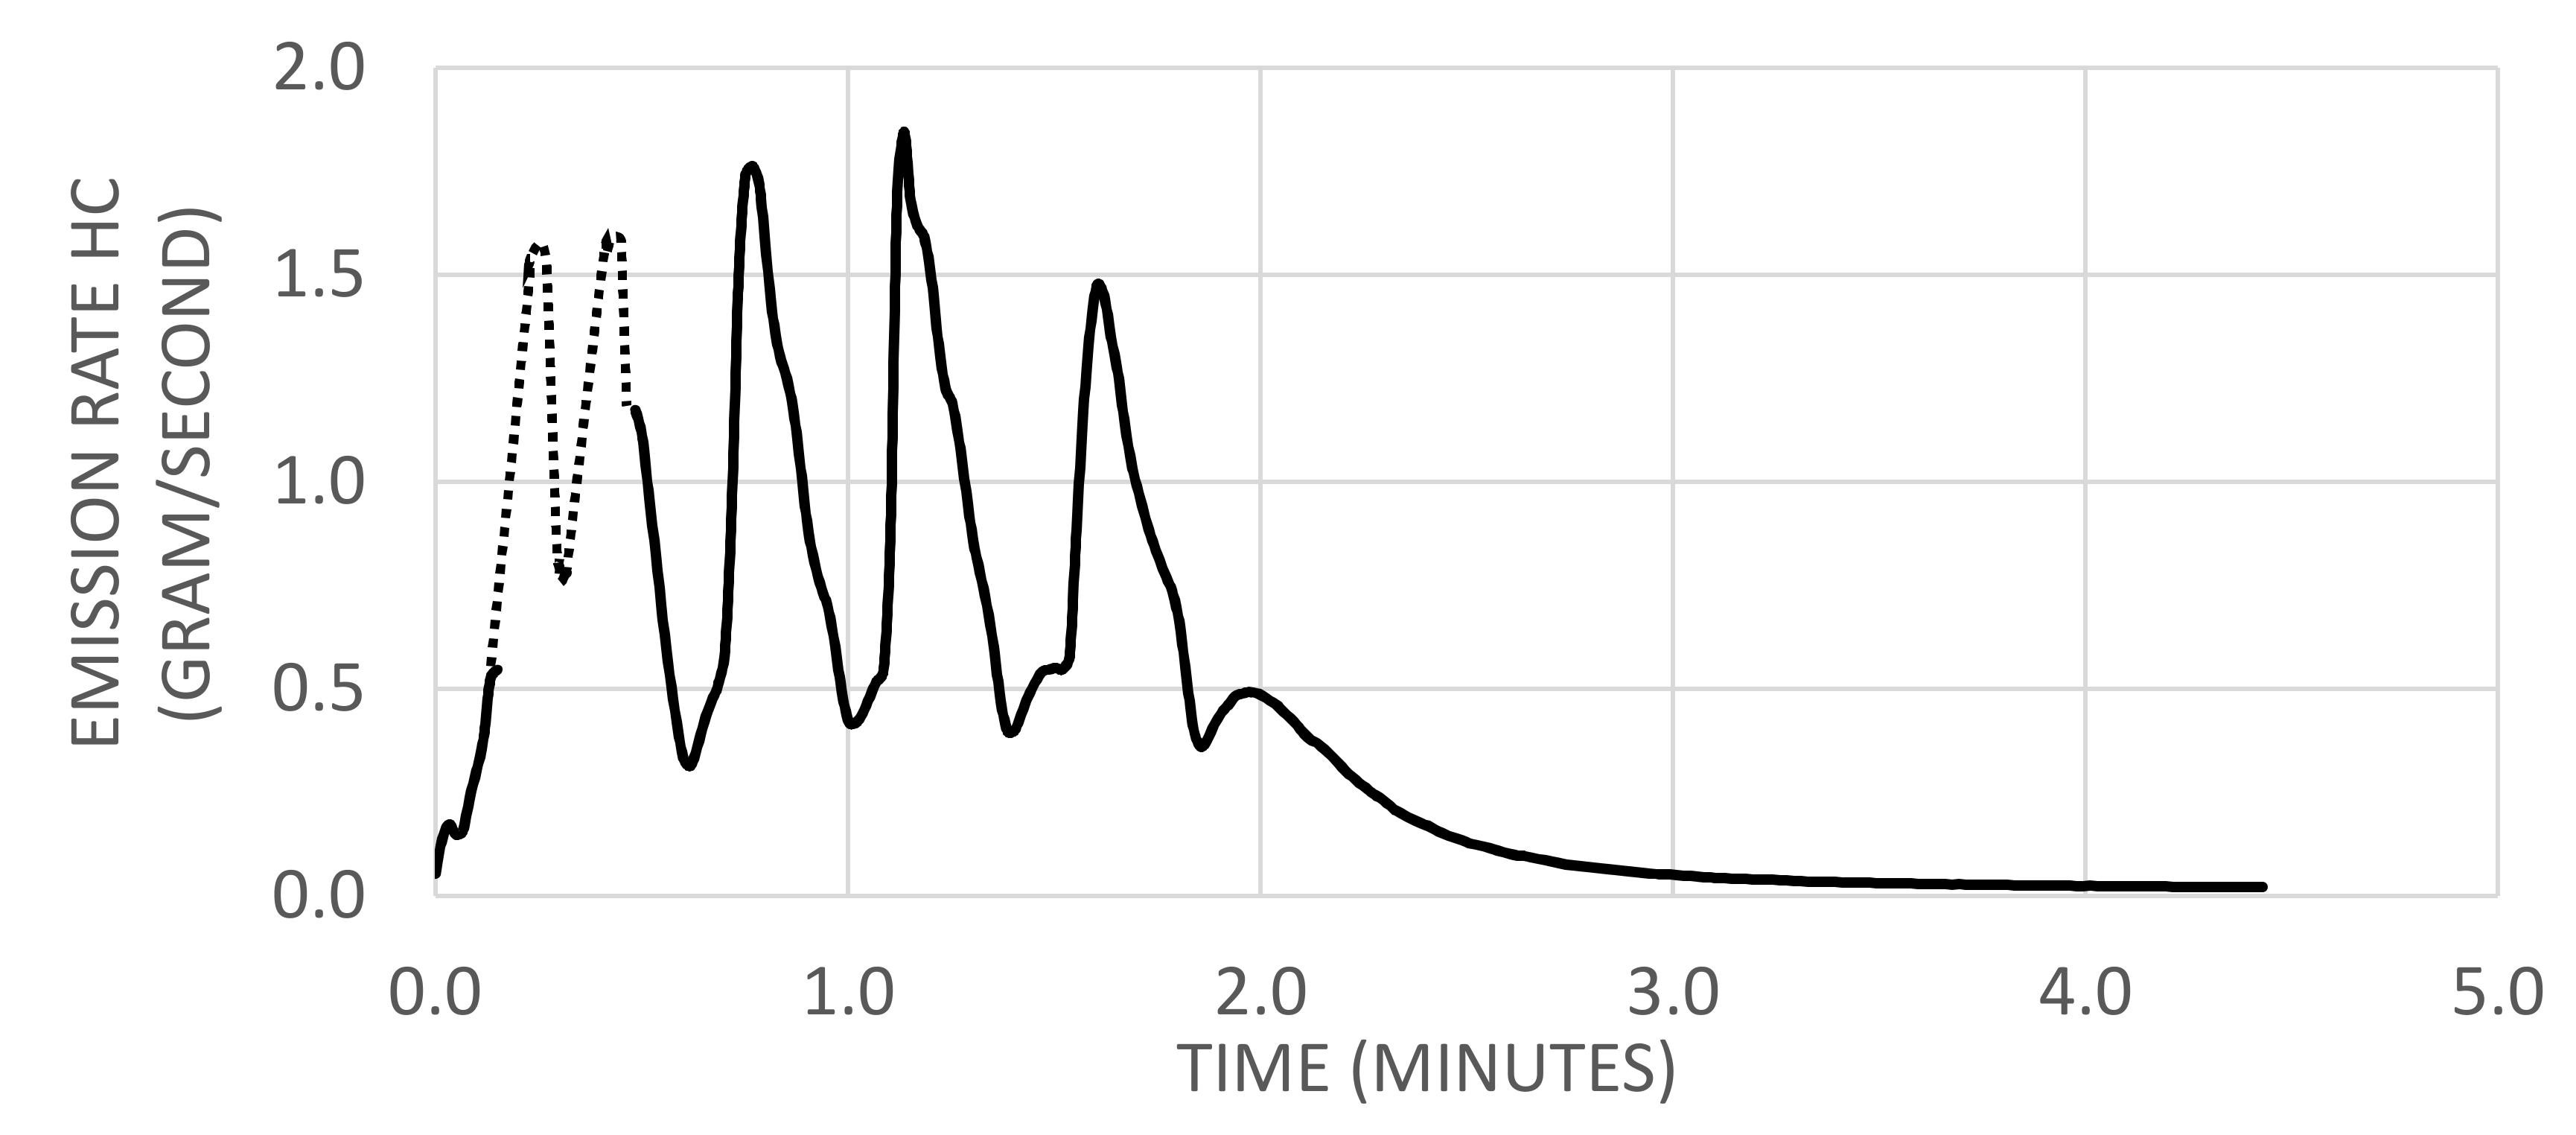
2.1.2. Emission Rates
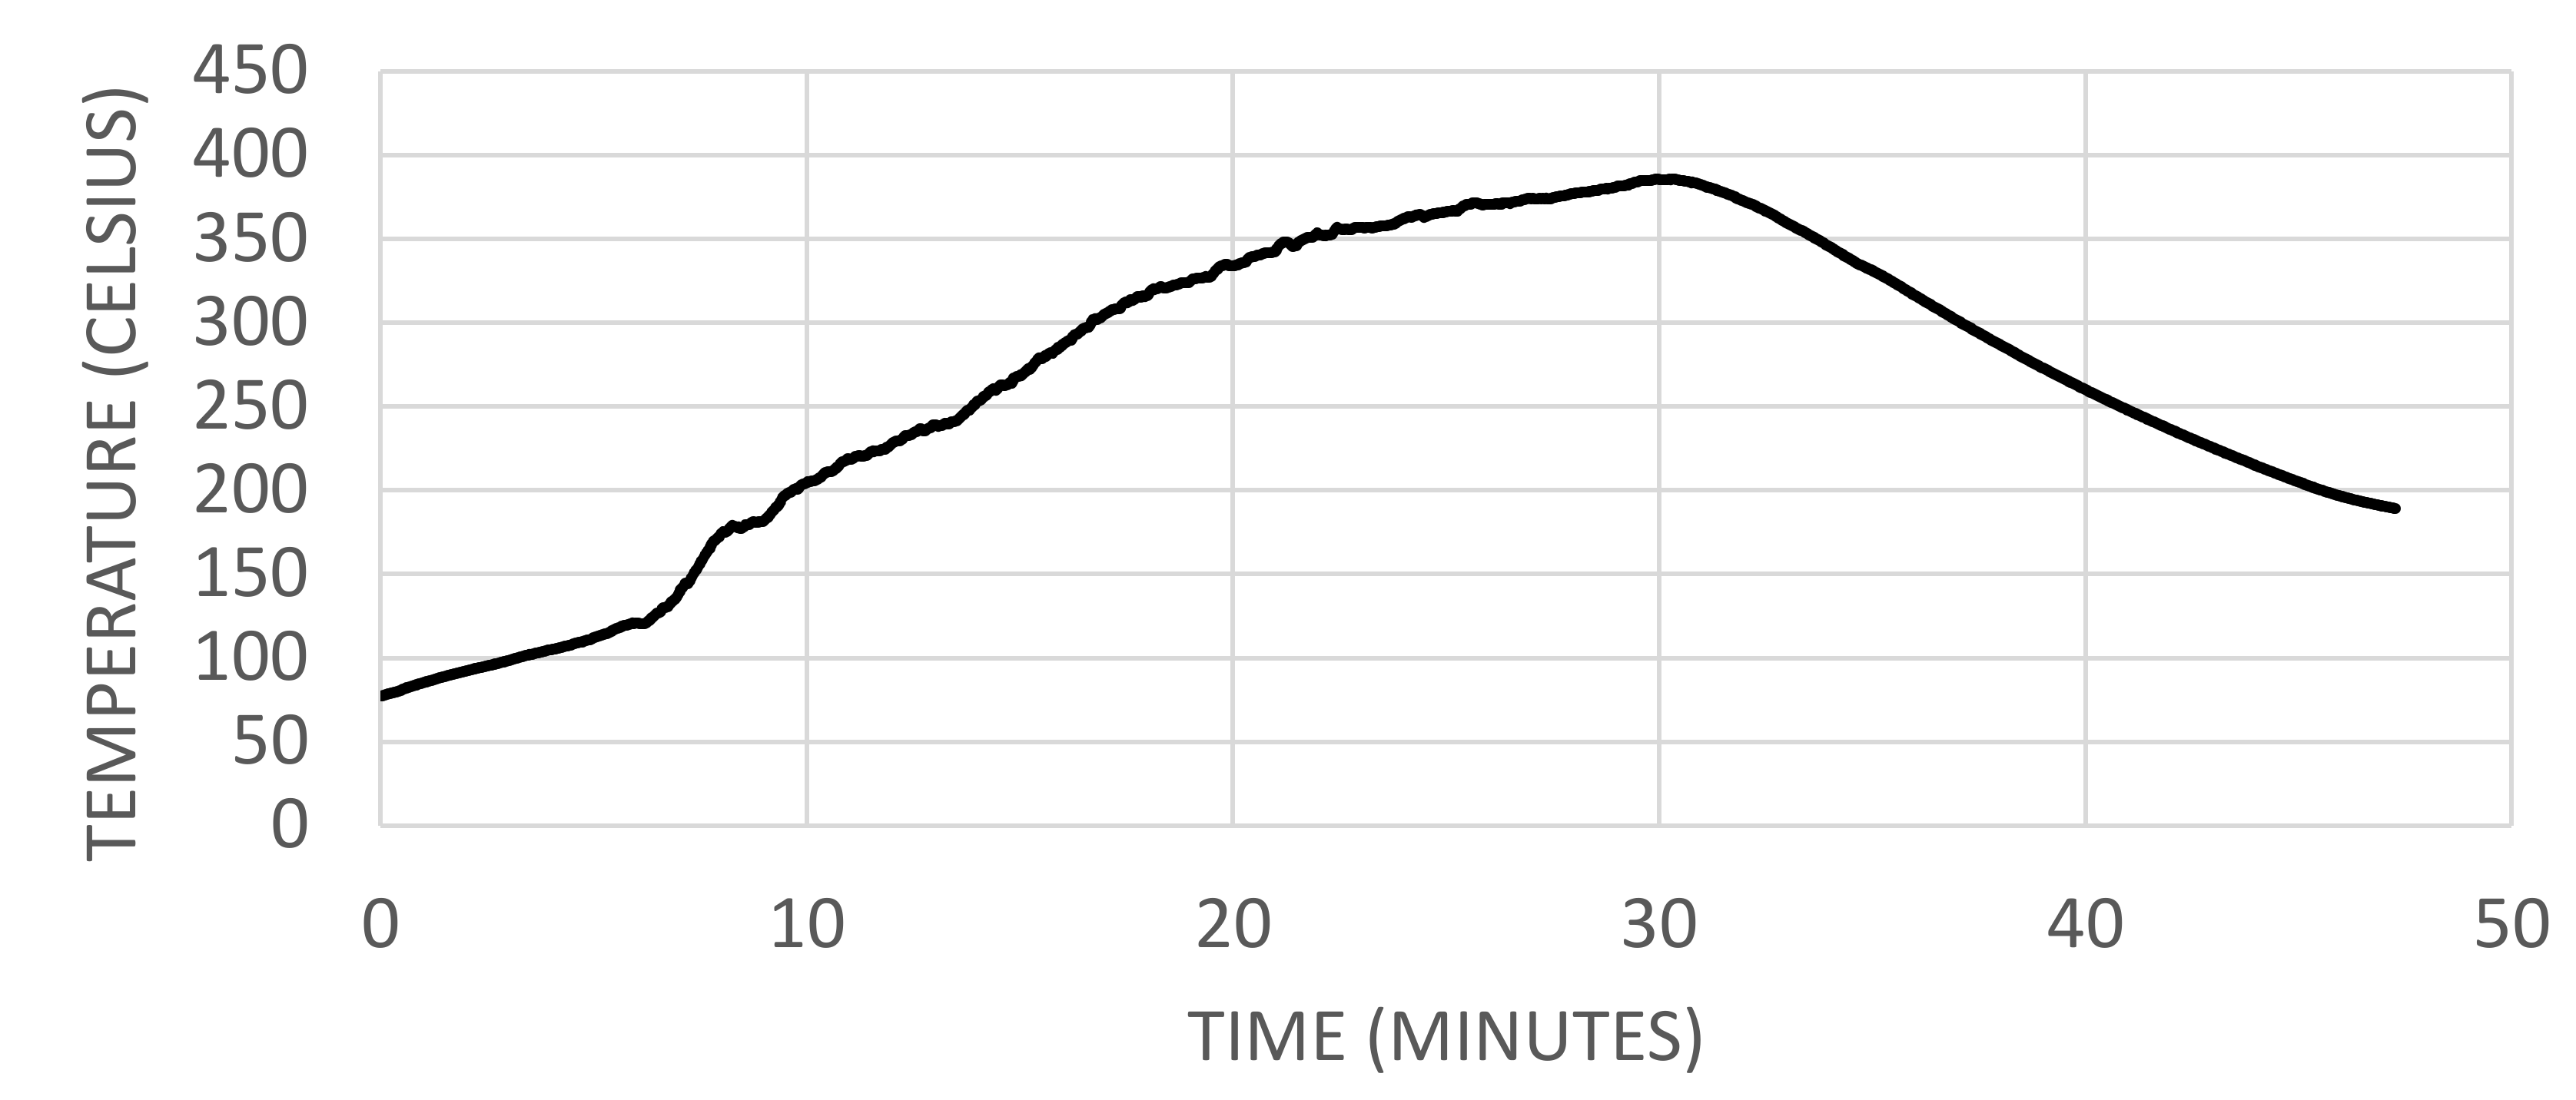
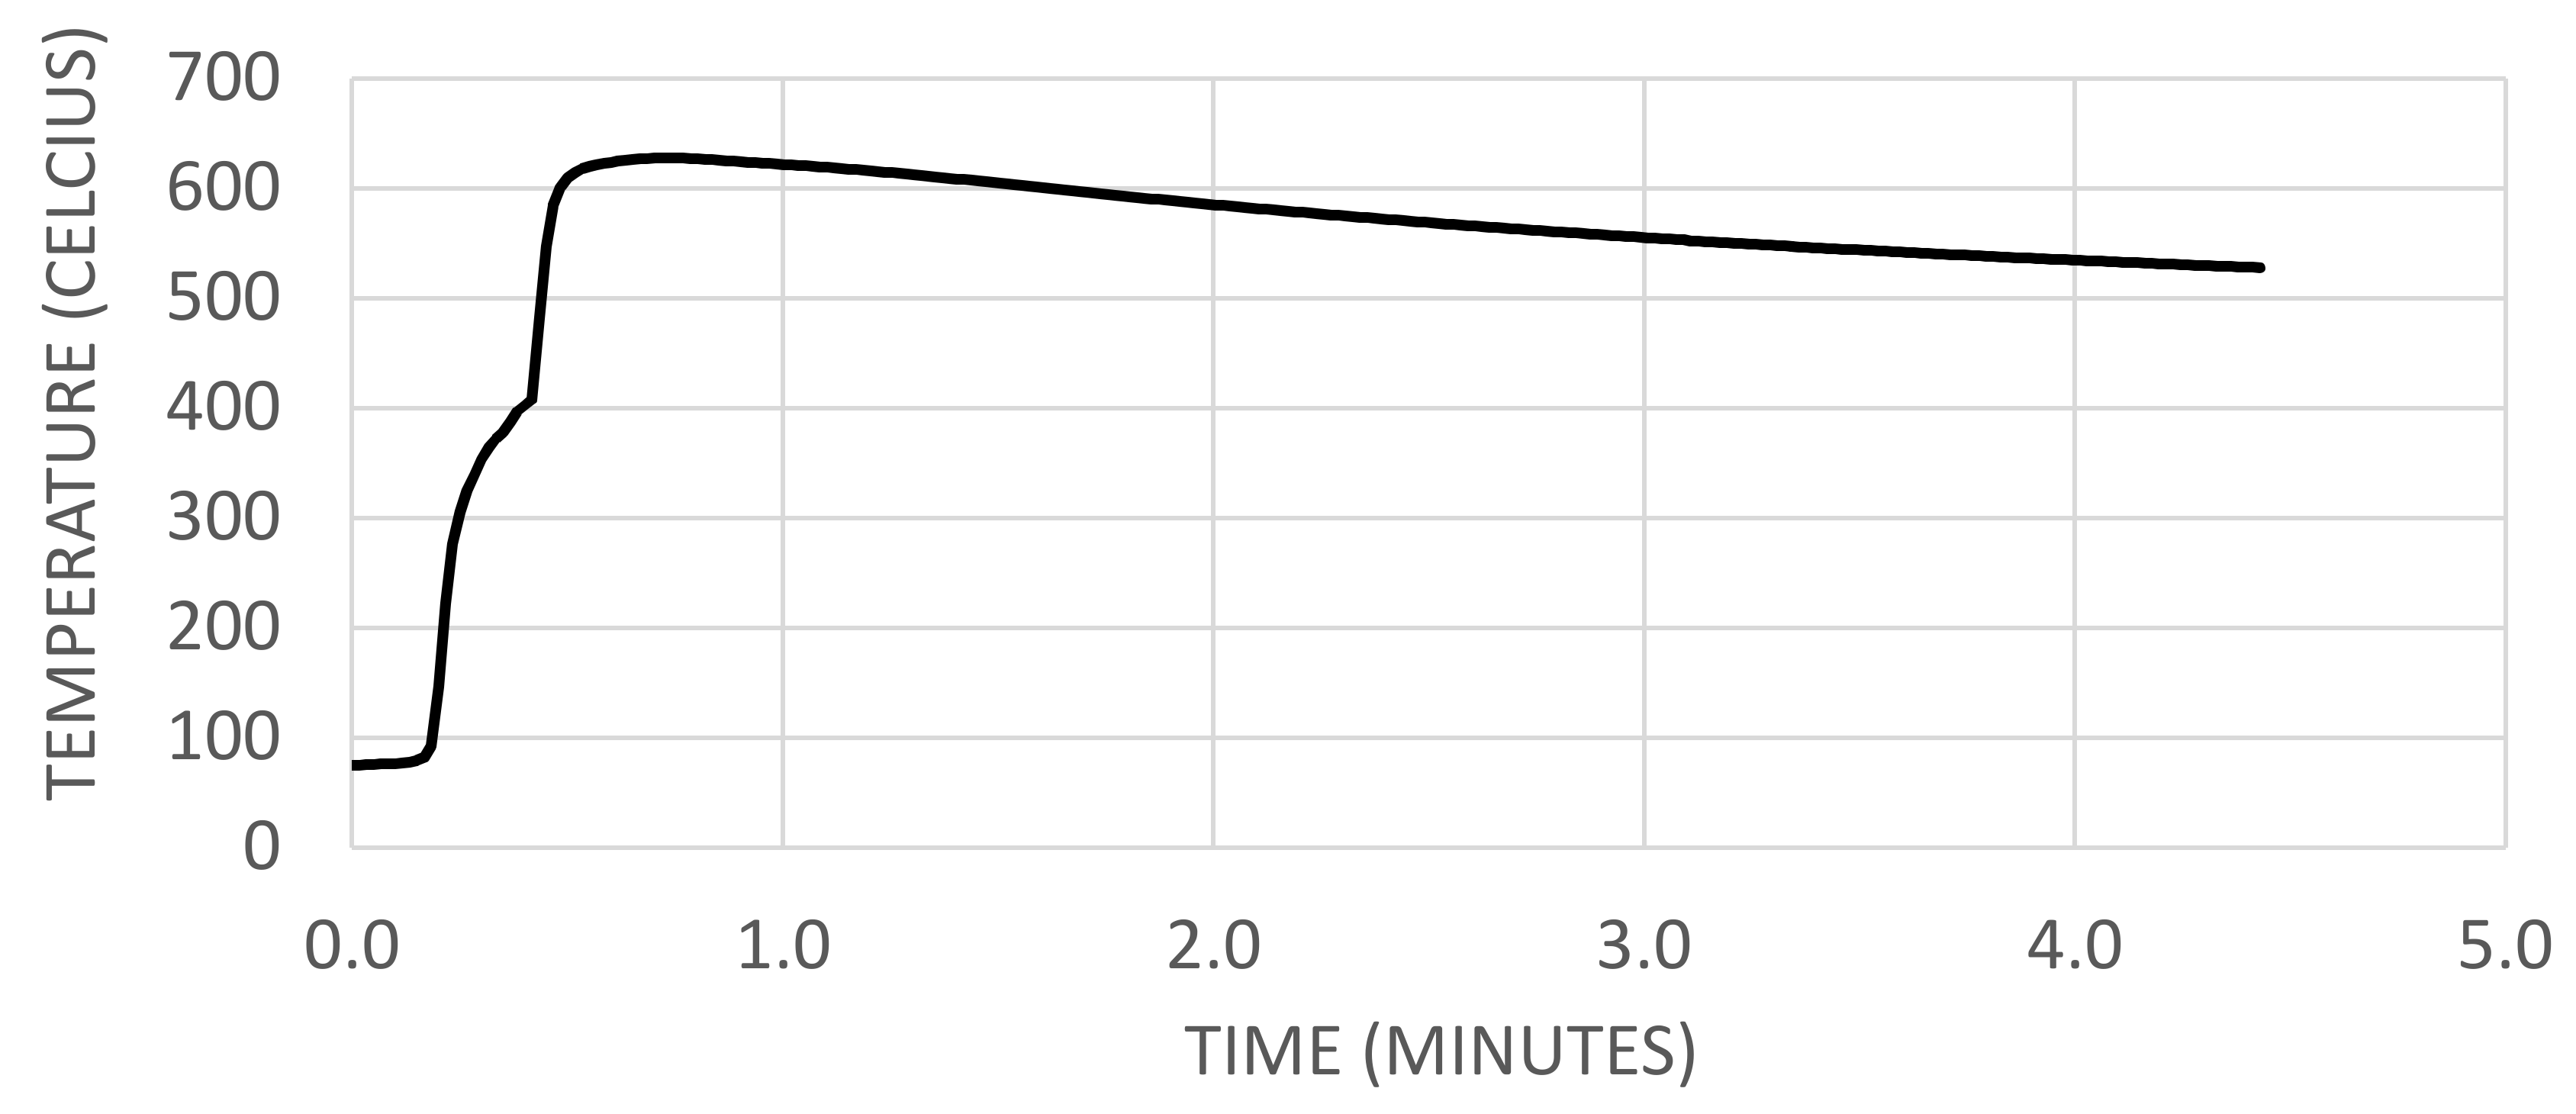
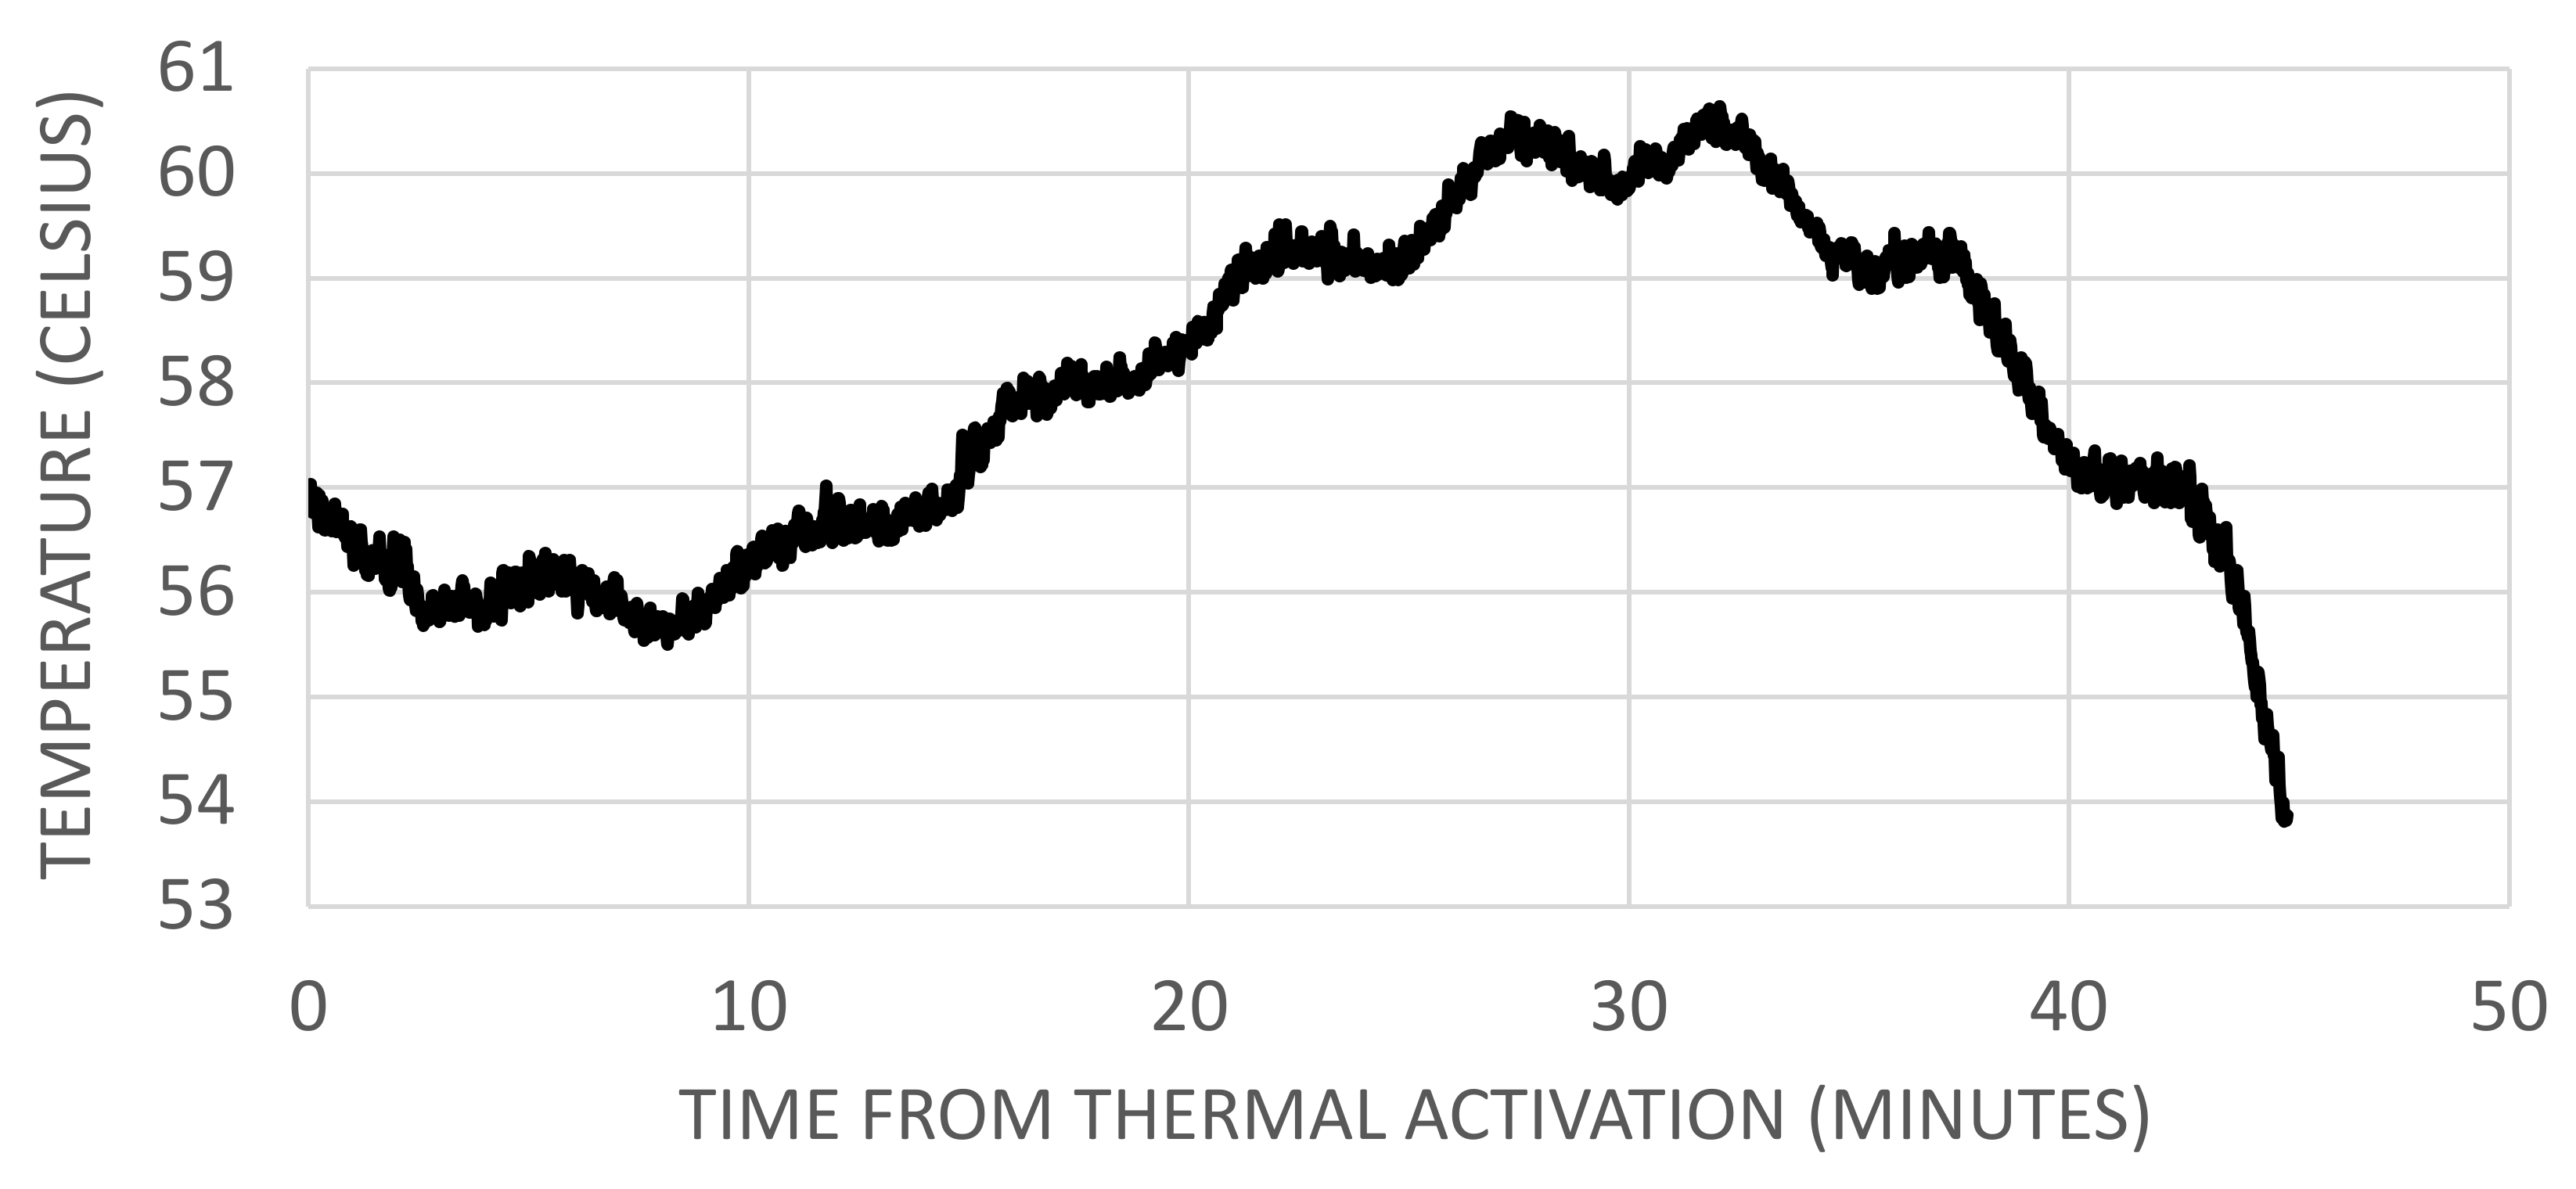
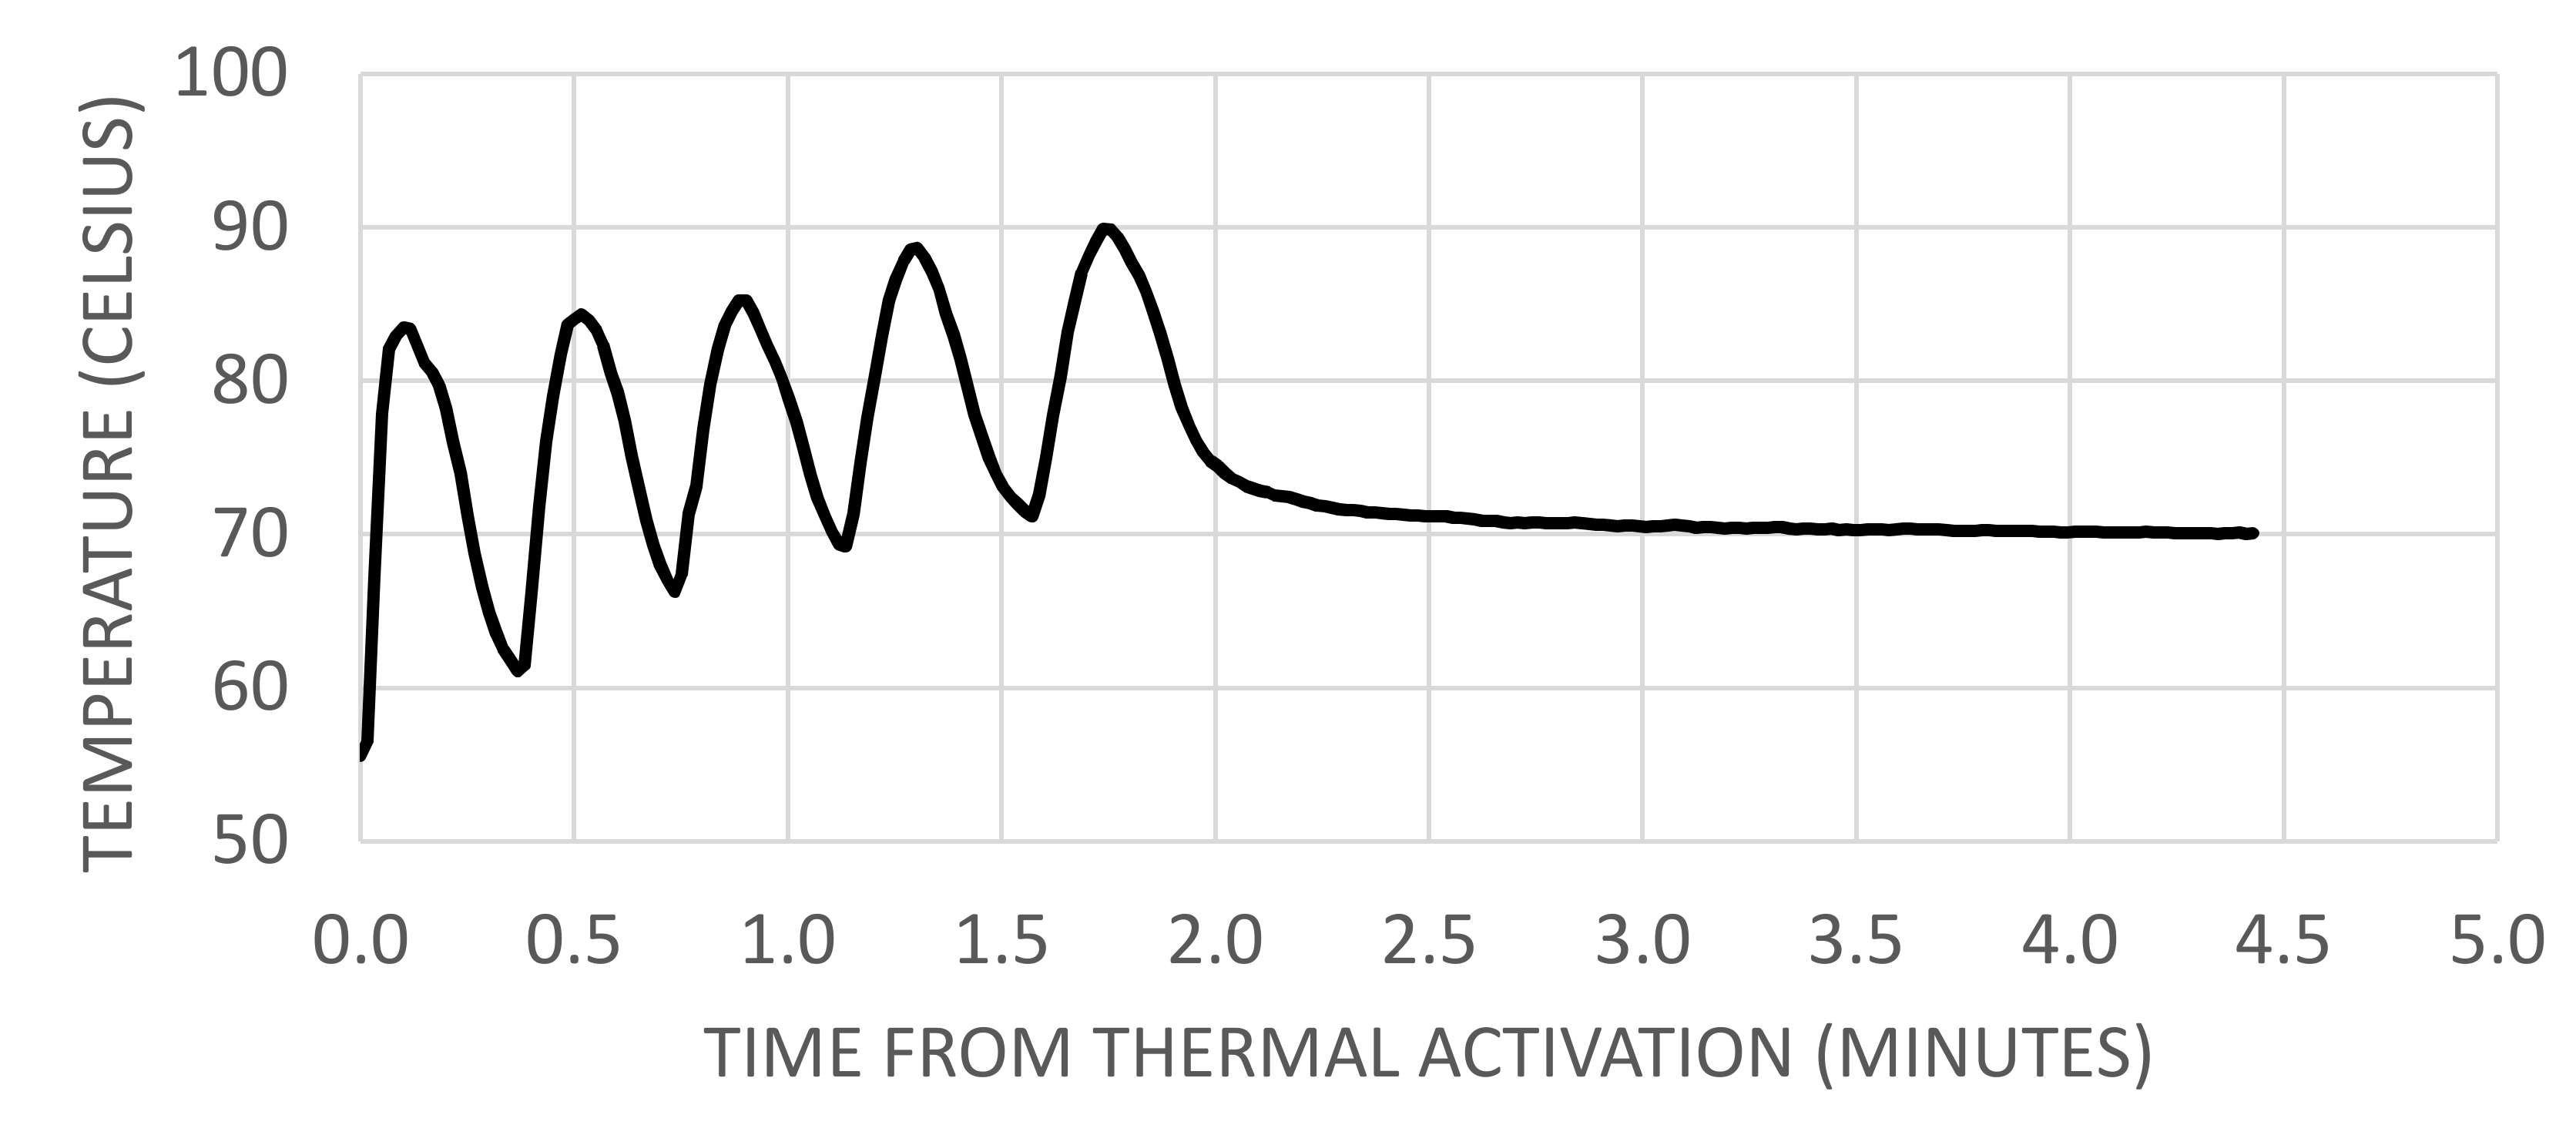
2.1.3. Temperatures at Venting
2.2. Gaseous Species
2.2.1. HF Emissions
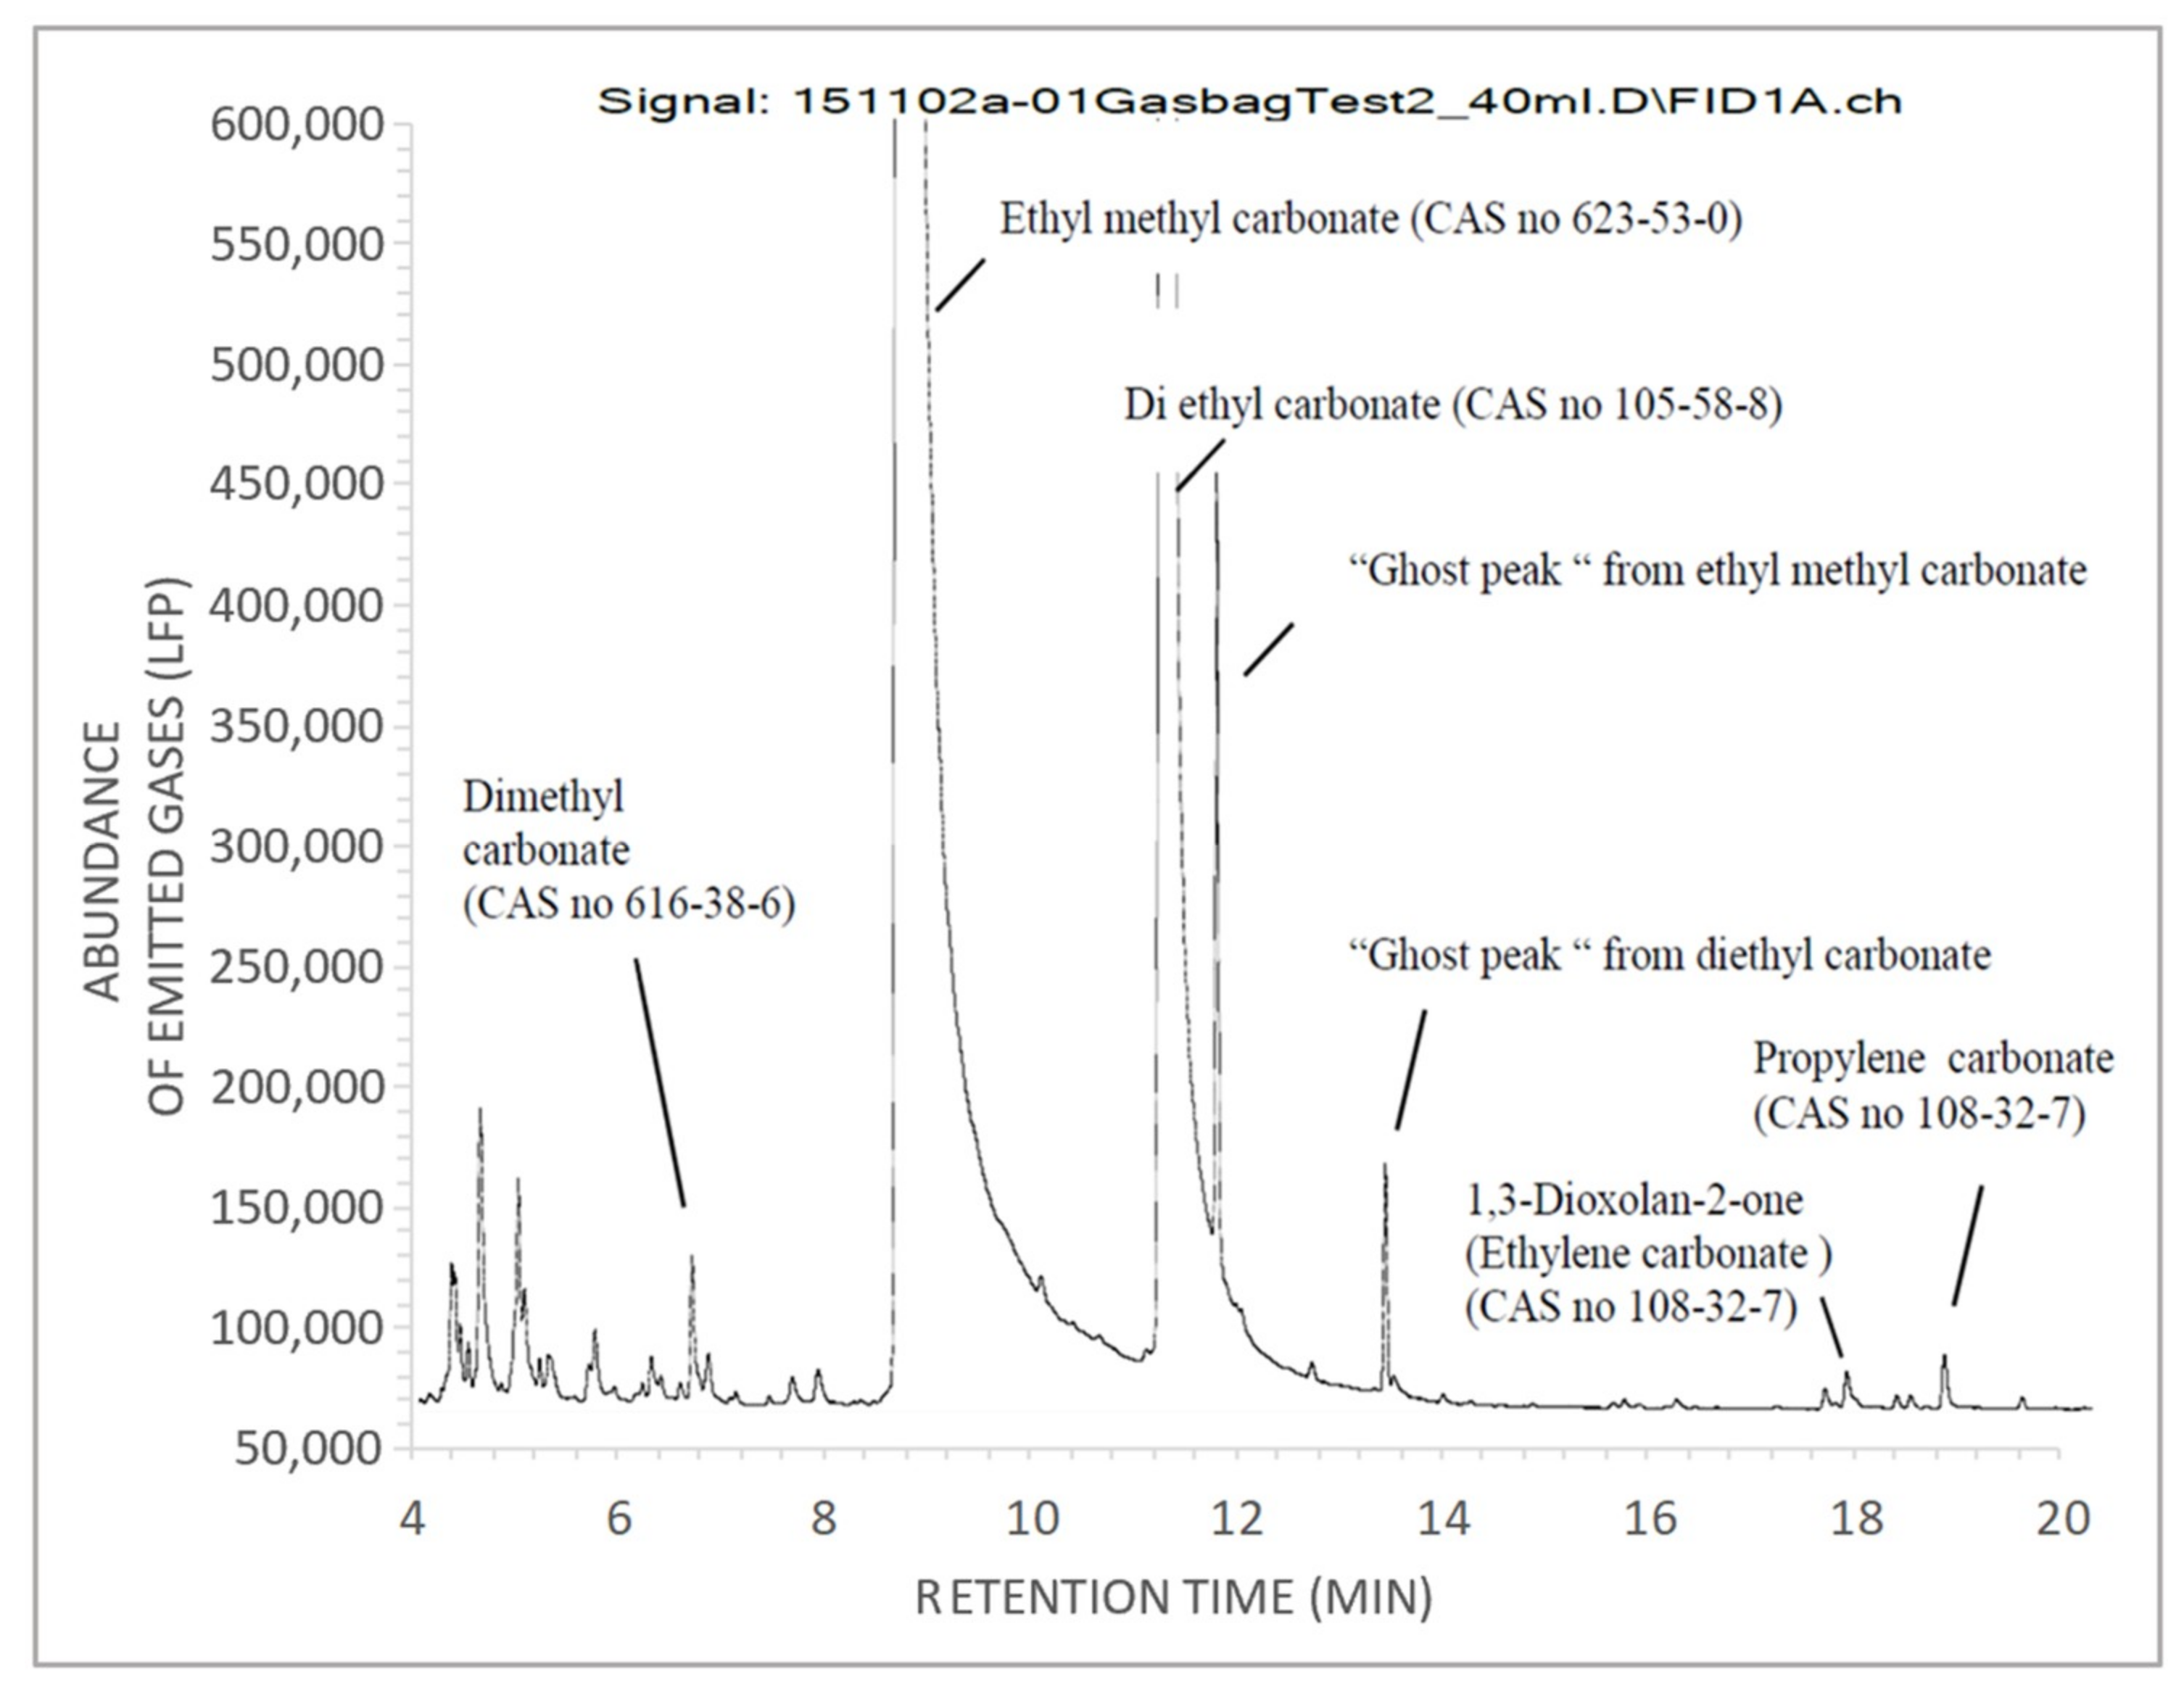
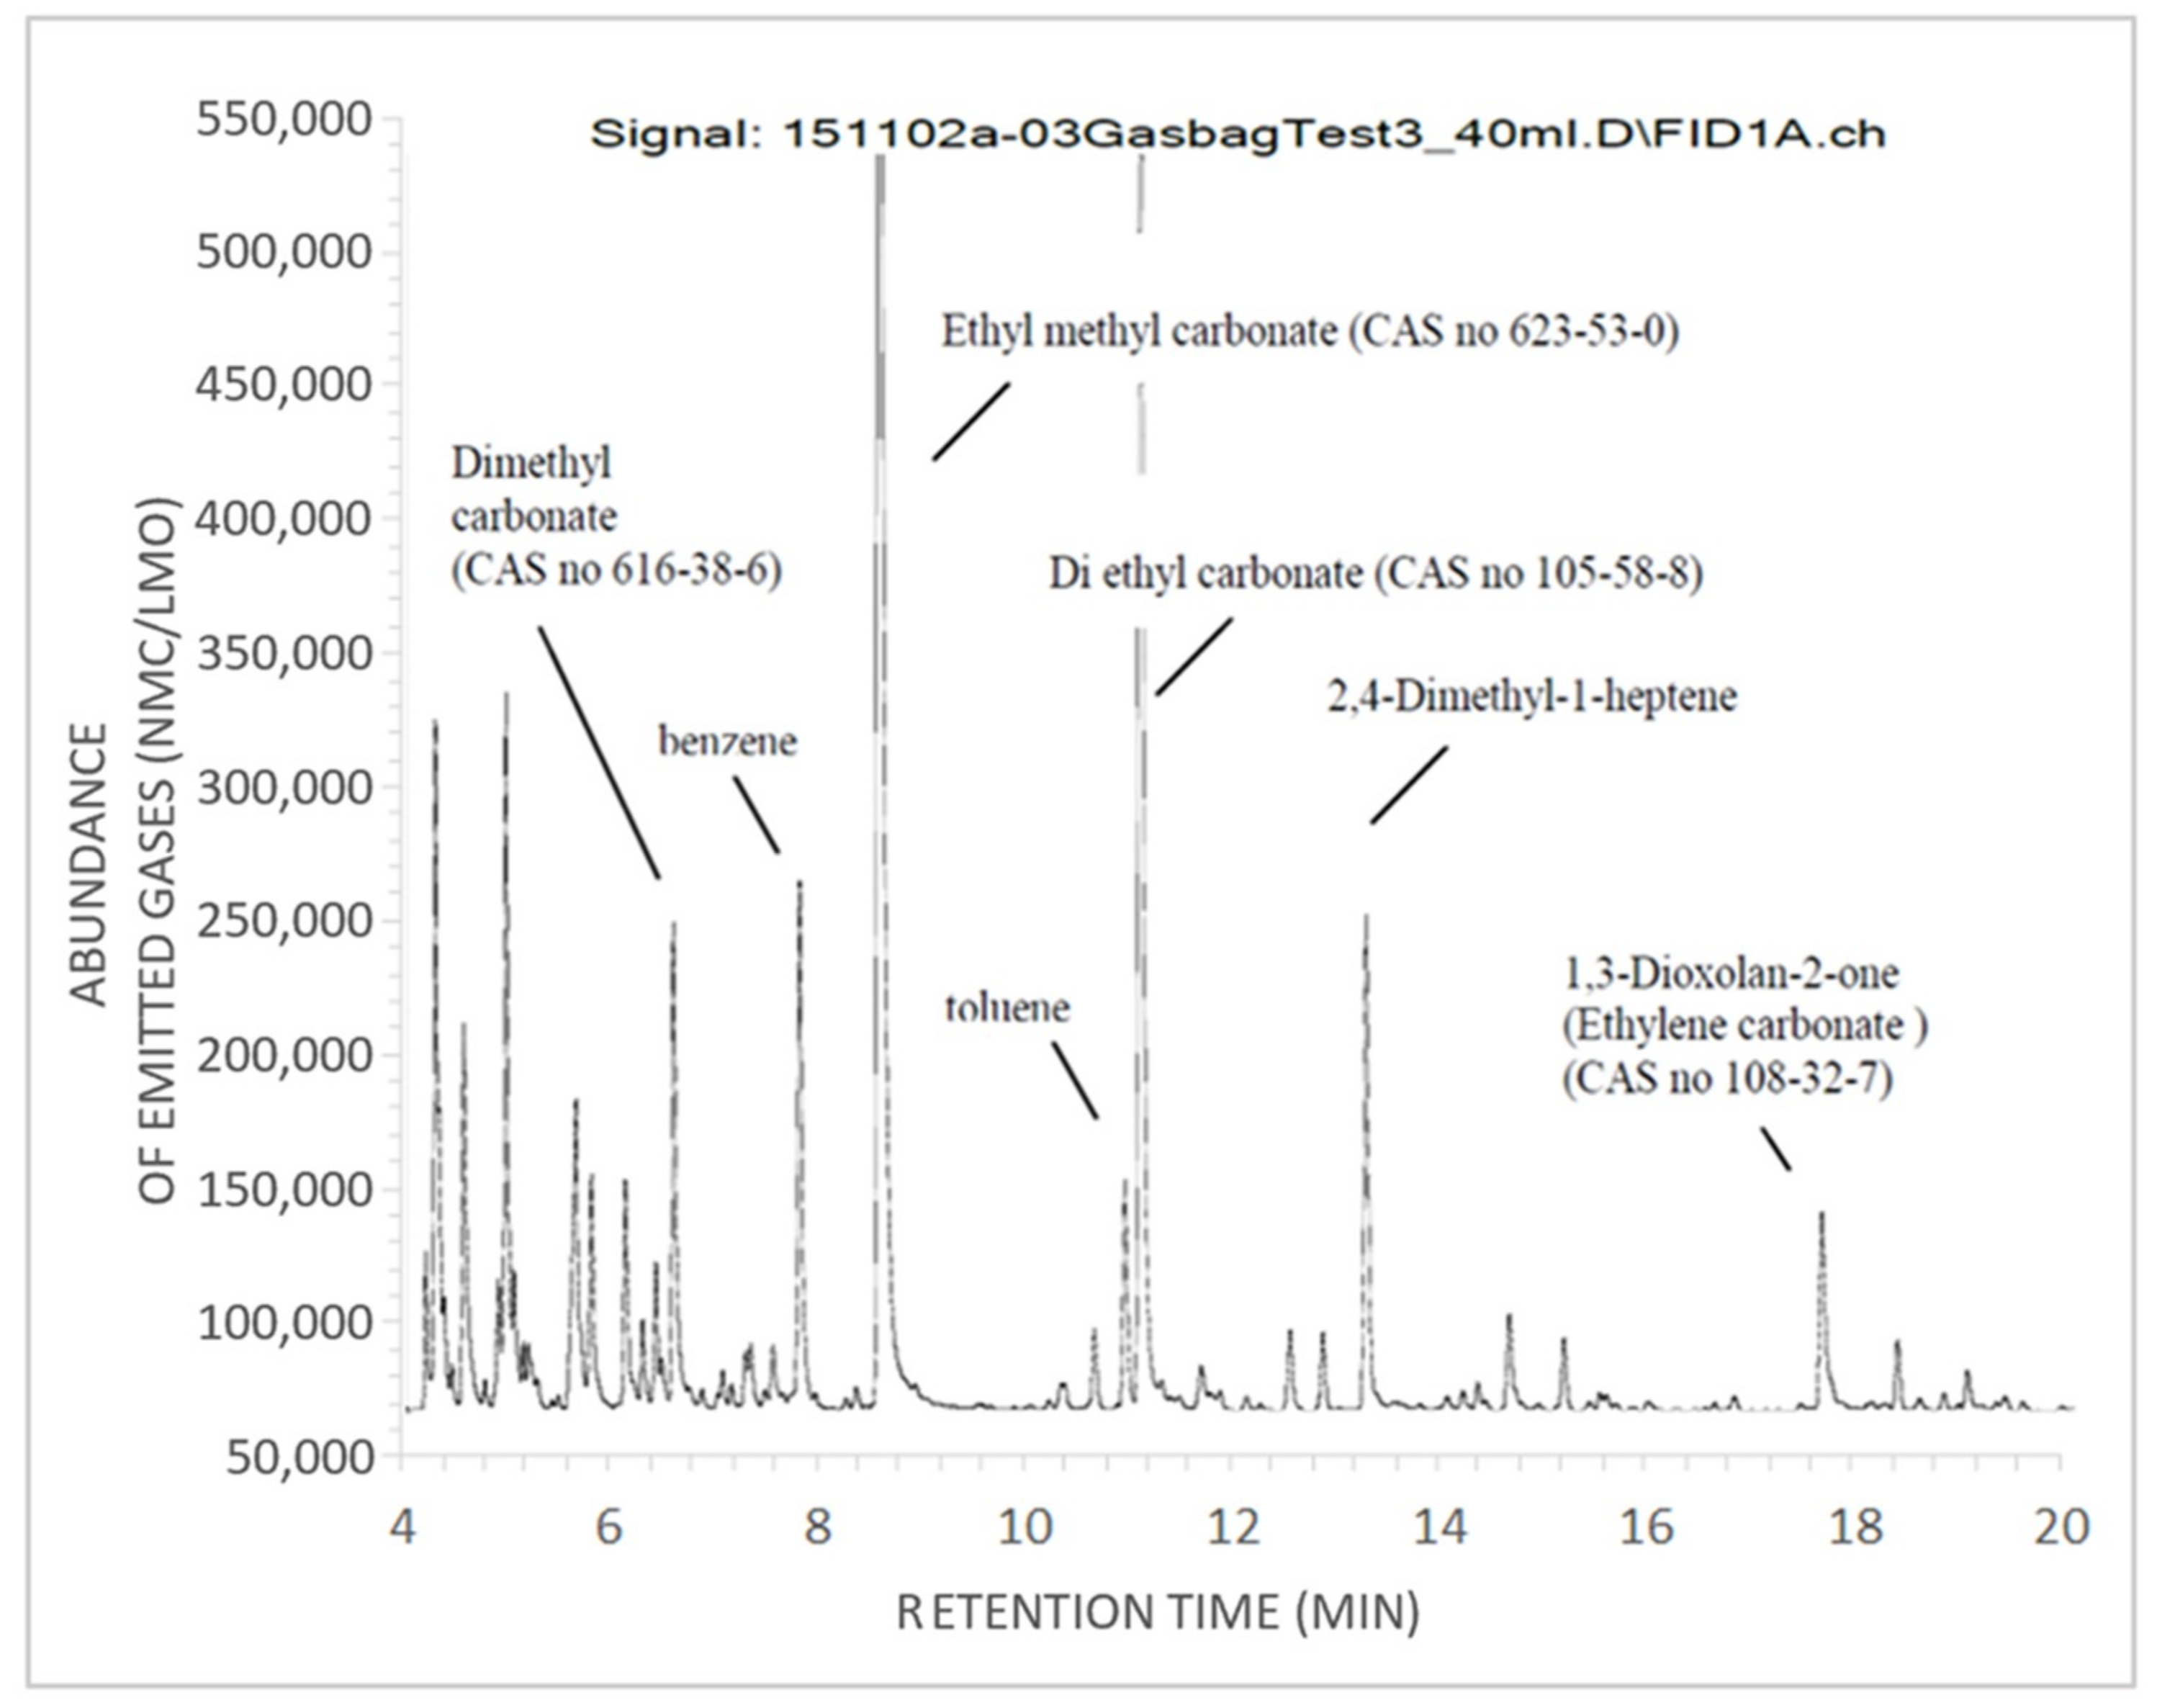
2.2.2. FTIR and Gas Chromatography-Mass Spectrometry (GC-MS) Analysis
3. Discussion
3.1. Gas Volumes and Emission Rates
3.2. Gaseous Spec
3.3. Test Method and System Considerations
3.4. Application Perspectives
4. Materials and Methods
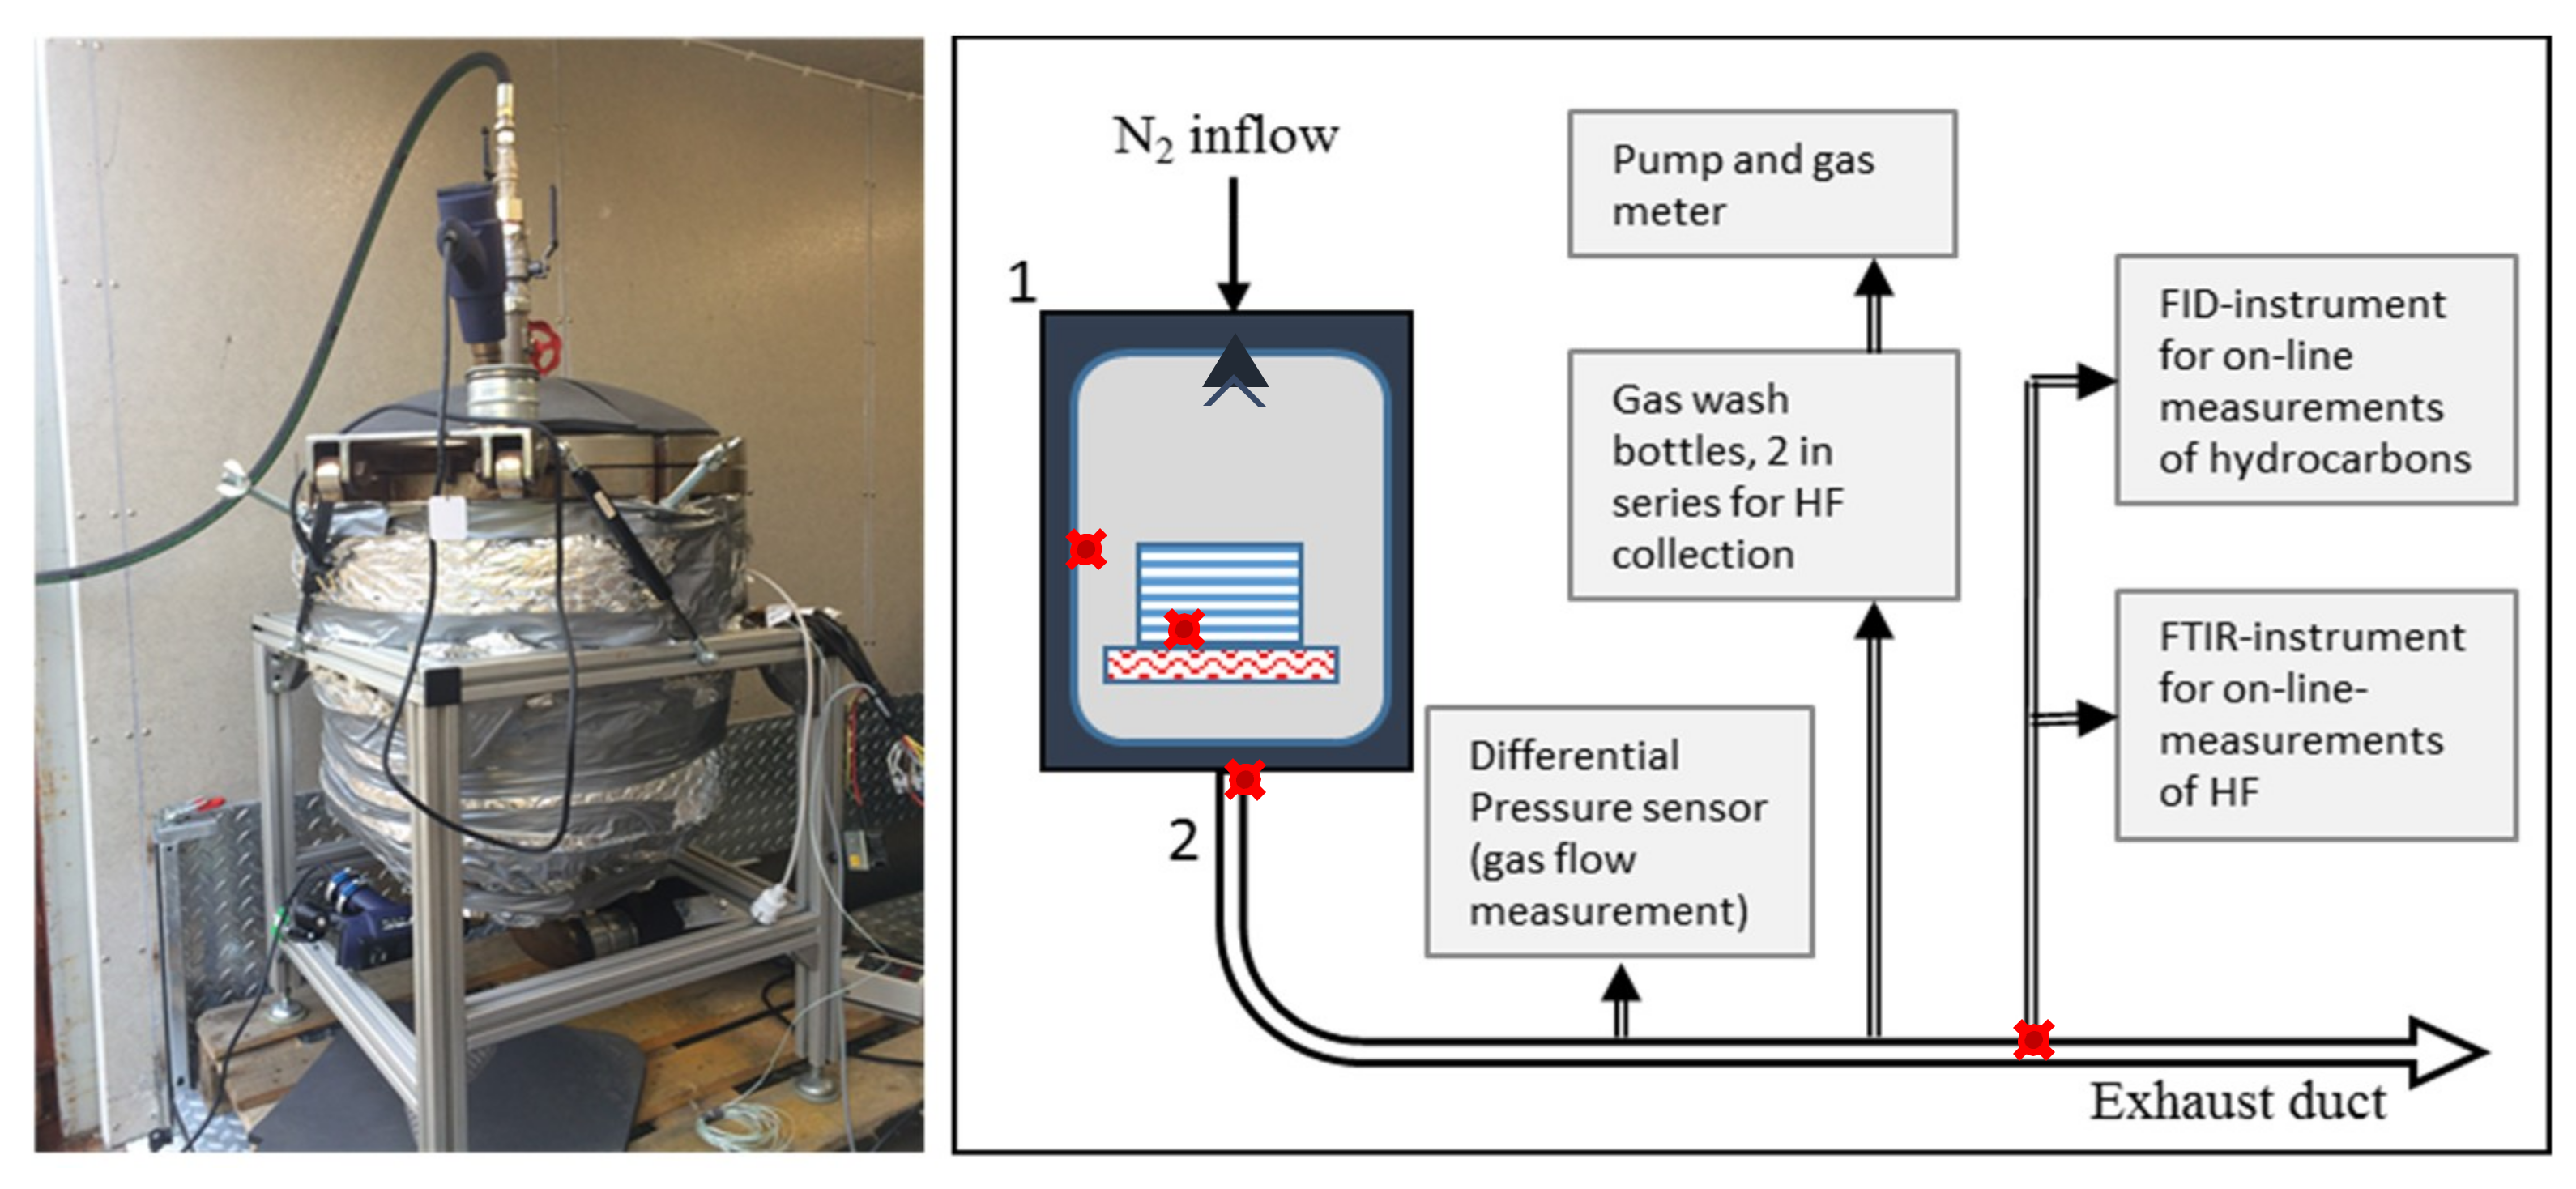
4.1. Test Set-Up
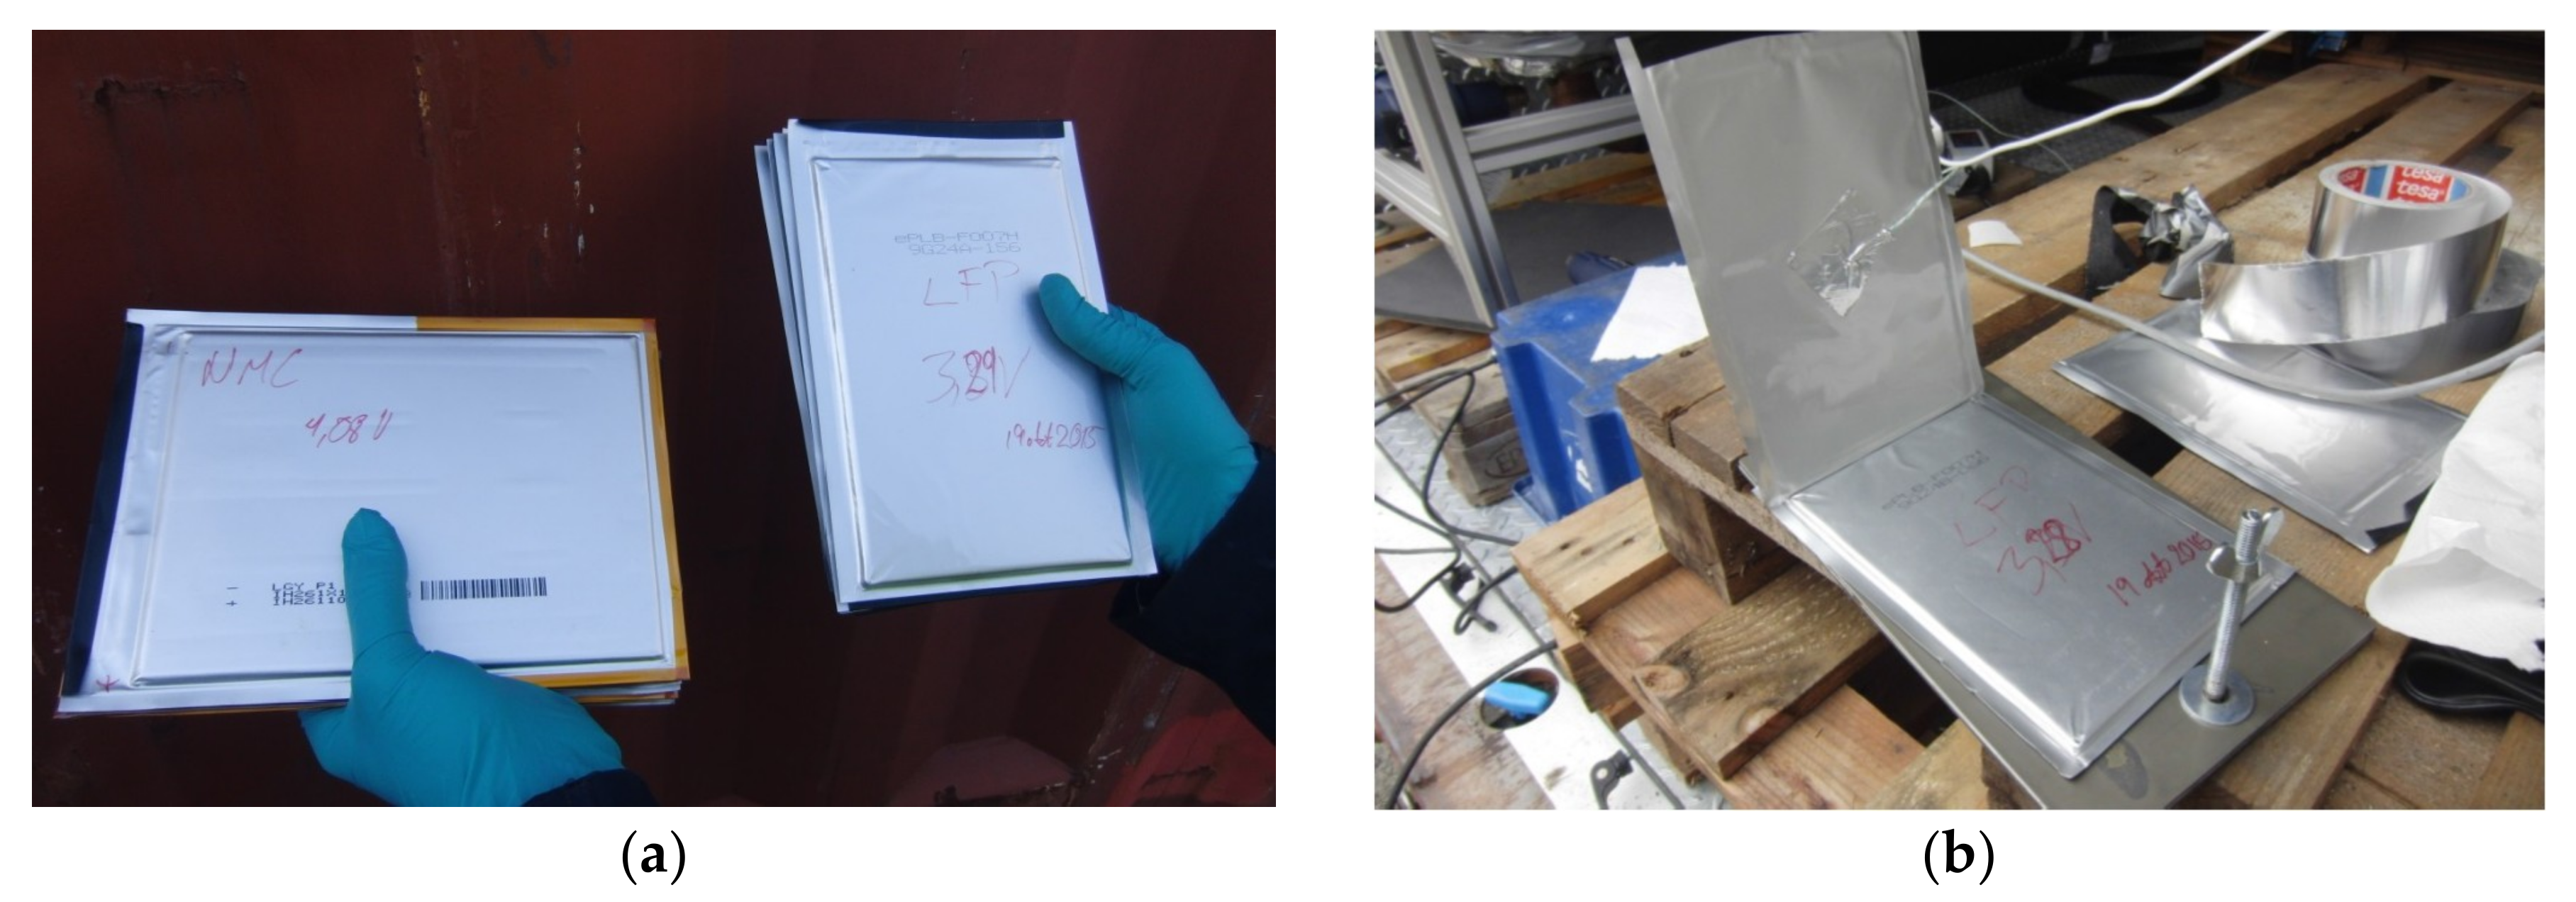
4.2. Test Objects
4.3. Method for Calculating Gas Volume
5. Conclusions
Author Contributions
Funding
Conflicts of Interest
References
- Sturk, D.; Näsman, Y.; Hoffmann, L.; Gustafson, H.; Östrand, L.; Björnstig, U. E-vehicle safe rescue. Investigation of risk factors and rescue tactics in a traffic incident event involving an e-vehicle. In Proceedings of the Third International Conference on Fire in Vehicles – FIVE 2014; Andersson, P., Sundström, U., Eds.; SP Technical Research Institute of Sweden: Berlin, Germany, 2014; pp. 255–265. [Google Scholar]
- Sturk, D.; Hoffmann, L.; Ahlberg Tidblad, A. Fire on e-vehicle battery cells and packs. Traff. Inj. Prev. 2015, 16, S159–S164. [Google Scholar] [CrossRef]
- Barnett, B.; Ofer, D.; Sriramulu, S.; Stringfellow, R. Li-ion batteries, safety. In Batteries for Sustainability. Selected Entries for the Encyclopedia of Sustainability Science and Technology; Brodd, R.J., Ed.; Springer: New York, NY, USA, 2013; pp. 285–318. ISBN 978-1-4614-5790-9. [Google Scholar]
- Roth, E.P.; Orendorff, C.J. How electrolytes influence battery safety. ECS Interface 2012, 21, 45–49. [Google Scholar] [CrossRef]
- Roth, E.P. Abuse response of 18650 Li-Ion cells with different cathodes using EC:EMC/LiPF6 and EC:PC:DMC/LiPF6 Electrolytes. ECS Trans. 2008, 11, 19–41. [Google Scholar] [CrossRef]
- Hollas, J.M. Modern Spectroskopy, 3rd ed.; John Whiley & Sons Ltd.: Chichester, UK, 1996; p. 139. ISBN 0471965235. [Google Scholar]
- Giurgis, G.A.; Zhu, X.; Durig, J.R. Conformational and structural studies of 1-fluoropropane from temperature dependant FT-IR spectra of rare gas solutions and ab initio calculations. Struct. Chem. 1999, 10, 445–461. [Google Scholar] [CrossRef]
- Xiang, H.F.; Wang, H.; Chen, C.H.; Ge, X.W.; Guo, S.; Sun, J.H.; Hu, W.Q. Thermal Stability of LiPF6-based Electrolyte and Effect of Contact with Various Delithiated Cathodes of Li-ion Batteries. J. Power Sources 2009, 191, 575–581. [Google Scholar] [CrossRef]
- Lei, B.; Zhao, W.; Ziebert, C.; Uhlmann, N.; Rohde, M.; Seifert, H.J. Experimental analysis of thermal runaway in 18650 cylindrical Li-Ion cells using an accelerating rate calorimeter. Batteries 2017, 3, 14. [Google Scholar] [CrossRef]
- Barai, A.; Uddin, K.; Chevalier, J.; Chouchelamane, G.H.; McGordon, A.; Low, J.; Jennings, P. Transportation safety of lithium iron phosphate batteries—A feasibility study of storing at very low states of charge. Sci. Rep. 2017, 7, 5128. [Google Scholar] [CrossRef]
- Eshetu, G.G.; Bertrand, J.-P.; Lecocq, A.; Grugeon, S.; Laruelle, S.; Armand, M.; Marlair, G. Fire behavior of carbonates-based electrolytes used in Li-ion rechargeable batteries with a focus on the role of the LiPF6 and LiFSI salts. J. Power Sources 2014, 269, 804–811. [Google Scholar] [CrossRef]
- Lecocq, A.; Eshetu, G.G.; Grugeon, S.; Martin, N.; Laruelle, S.; Marlair, G. Scenario-based prediction of Li-ion batteries fire-induced toxicity. J. Power Sources 2016, 316, 197–206. [Google Scholar] [CrossRef]
- Bergström, U.; Gustafsson, Å.; Hägglund, L.; Lejon, C.; Sturk, D.; Tengel, T. Vented Gases and Aerosol of Automotive Li-ion LFP and NMC Batteries in Humified Nitrogen Under Thermal Load; Försvarets Forskningsinstitut FOI-R--4166—SE; Försvarets Forskningsinstitut: Umeå, Sweden, 2015. [Google Scholar]
- Abert, M. Analysis of gases emitted in safety events. In Electrochemical Powers Sources: Fundamentals, Systems, and Applications. Li-Battery Safety; Garche, J., Brandt, K., Eds.; Elsevier: Amsterdam, The Netherlands, 2019; pp. 196–215. ISBN 978-0-444-63777-2. [Google Scholar]
- Yang, H.; Zhuang, G.V.; Ross, P.N., Jr. Thermal stability of LiPF6 Salt and Li-ion battery electrolytes containing LiPF6. J. Power Sources 2006, 161, 573–579. [Google Scholar] [CrossRef]
- Kawamura, T.; Okada, S.; Yamaki, J.I. Decomposition reaction of LiPF6-based electrolytes for lithium ion cells. J. Power Sources 2006, 156, 547–554. [Google Scholar] [CrossRef]
- Wilken, S.; Treskow, M.; Scheers, J.; Johansson, P.; Jacobsson, P. Initial stages of thermal decomposition of LiPF6-based lithium ion battery electrolytes by detailed Raman and NMR spectroscopy. RSC Adv. 2013, 3, 16359–16364. [Google Scholar] [CrossRef]
- Hammami, A.; Raymond, N.; Armand, M. Lithium-ion batteries: Runaway risk of forming toxic compounds. Nature 2003, 42, 635–636. [Google Scholar] [CrossRef] [PubMed]
- Sun, J.; Li, J.; Zhou, T.; Yang, K.; Wei, S.; Tang, N. Toxicity, a serious concern of thermal runaway from commercial Li-ion battery. Nano Energy 2016, 27, 313–319. [Google Scholar] [CrossRef]
- Sturk, D.; Hägglund, L.; Lejon, C.; Tengel, T.; Gustafsson, Å. Analysis of emitted gases from Li-ion LFP and NMC batteries at elevated temperatures. In Proceedings of the EVS29 Symposium, Montreal, QC, Canada, 19–22 June 2016. [Google Scholar]
- Koch, S.; Birke, K.P.; Kuhn, R. Fast thermal runaway detection for Lithium-ion cells in large scale traction batteries. Batteries 2018, 4, 16. [Google Scholar] [CrossRef]
- Truchot, B.; Fouillen, F.; Collet, S. An experimental evaluation of toxic gas emissions from vehicle fires. Fire Saf. J. 2018, 97, 111–118. [Google Scholar] [CrossRef]
- Larsson, F.; Andersson, P.; Blomqvist, P.; Mellander, B.-E. Toxic fluoride gas emissions from lithium-iion battery fires. Sci. Rep. 2017, 7, 10018. [Google Scholar] [CrossRef] [PubMed]
- Eriksson, T.; International Association of Fire and Rescue Services (CTIF), Karlstad, Sweden. Personal communication, 2019.
- Andersson, P.; Blomqvist, P.; Loren, A.; Larsson, F. Using FTIR to determine toxic gases in fires with Li-ion batterie. Fire Mater. 2016, 40, 999–1015. [Google Scholar] [CrossRef]
- Scanlon, J.T.; Willis, D.E. Calculation of flame ionization detector relative response factors using the effective carbon number concept. J. Chromatogr. Sci. 1985, 23, 333–340. [Google Scholar] [CrossRef]


| Test Number | Cell Type | Total Gas Volume | Normalized Gas Volume |
|---|---|---|---|
| 1 | LFP | 50 L 1 | 42 L/kg |
| 2 | NMC/LMO | 1500 L | 780 L/kg |
| Cell Type | Wash Bottles 1 | FTIR | Normalized Amounts: Wash Bottles | Normalized Amounts: FTIR | ||
|---|---|---|---|---|---|---|
| LFP | 4.2 g | 1.8 g | 3.6 g/kg | 36 g/kWh | 1.5 g/kg | 16 g/kWh |
| NMC/LMO | 6.5 g | 1.7 g | 3.4 g/kg | 23 g/kWh | 0.9 g/kg | 6.0 g/kWh |
| Type of Gases | Gas Species | Absorption Band (cm−1) | LFP | NMC/LMO |
|---|---|---|---|---|
| Combustion gases | CO2 | 2392 | Strong peak | Strong peak |
| CO | 2134 | Not conclusive due to interference | Not conclusive due to interference | |
| Organic carbonates | DEC | 1770 and 1280 | Major peaks | Major peaks |
| DMC | ||||
| EMC | ||||
| PC | 1870 and 1100 | Major peaks | Major peaks | |
| Fluorinated hydrocarbons | 1100 | Major peak but cannot separate from PC | Major peak but cannot separate from PC | |
| Acid gases | HF | 4075 a | 4000–4200 band clearly identified | 4000–4200 band clearly identified |
| POF3 | 1416, 991, and 871 b | Not conclusively identified | Not conclusively identified |
| Cell Type | Cell Weight | Weight of Tested Cell Stack (5 Cells) | Rated Capacity |
|---|---|---|---|
| LFP | 0.236 kg | 1.180 kg | 7 Ah |
| NMC/LMO | 0.385 kg. | 1.925 kg | 14 Ah |
© 2019 by the authors. Licensee MDPI, Basel, Switzerland. This article is an open access article distributed under the terms and conditions of the Creative Commons Attribution (CC BY) license (http://creativecommons.org/licenses/by/4.0/).
Share and Cite
Sturk, D.; Rosell, L.; Blomqvist, P.; Ahlberg Tidblad, A. Analysis of Li-Ion Battery Gases Vented in an Inert Atmosphere Thermal Test Chamber. Batteries 2019, 5, 61. https://doi.org/10.3390/batteries5030061
Sturk D, Rosell L, Blomqvist P, Ahlberg Tidblad A. Analysis of Li-Ion Battery Gases Vented in an Inert Atmosphere Thermal Test Chamber. Batteries. 2019; 5(3):61. https://doi.org/10.3390/batteries5030061
Chicago/Turabian StyleSturk, David, Lars Rosell, Per Blomqvist, and Annika Ahlberg Tidblad. 2019. "Analysis of Li-Ion Battery Gases Vented in an Inert Atmosphere Thermal Test Chamber" Batteries 5, no. 3: 61. https://doi.org/10.3390/batteries5030061
APA StyleSturk, D., Rosell, L., Blomqvist, P., & Ahlberg Tidblad, A. (2019). Analysis of Li-Ion Battery Gases Vented in an Inert Atmosphere Thermal Test Chamber. Batteries, 5(3), 61. https://doi.org/10.3390/batteries5030061